Embed Size (px)
Citation preview
1
Conductance saturation in a series of highly transmitting molecular junctions- Supplementary Information
T. Yelin1, R. Korytar2, N. Sukenik1, R. Vardimon1, B. Kumar3, C. Nuckolls3, F. Evers2, O. Tal1*
1. Chemical Physics, Weizmann Institute of Science, 7610001 Rehovot, Israel, 2. Institut für Theoretische Physik, Universität Regensburg, D-93053 Regensburg, Germany, 3. Department of Chemistry, Columbia University, New York 10027, USA.
Contents
1. Identification of molecular junction formation by inelastic electron spectroscopy 2. The geometry of the Ag/oligoacene molecular junction 3. Determination of the molecular junction conductance 4. The orbital character of the Pt/oligoacene and Ag/oligoacene hybridization 5. Friedel’s sum rule for pedestrians 6. References
12 34–13 9,10,14,151617 set-up18 section19,20 contact20,21 features22 length23 EF4,7,10,24=G0/[(ε/Γ)2+1]25 abilities26. s27–
29 g30,31 s32,33 at ~1.5 G034,35. systems33,36 performed37. The wave-functions are represented in a localized
package38. clusters39 40.
Conductance saturation in a series of highlytransmitting molecular junctions
SUPPLEMENTARY INFORMATIONDOI: 10.1038/NMAT4552
NATURE MATERIALS | www.nature.com/naturematerials 1
© 2016 Macmillan Publishers Limited. All rights reserved.
2
1. Identification of molecular junction formation by inelastic electron spectroscopy
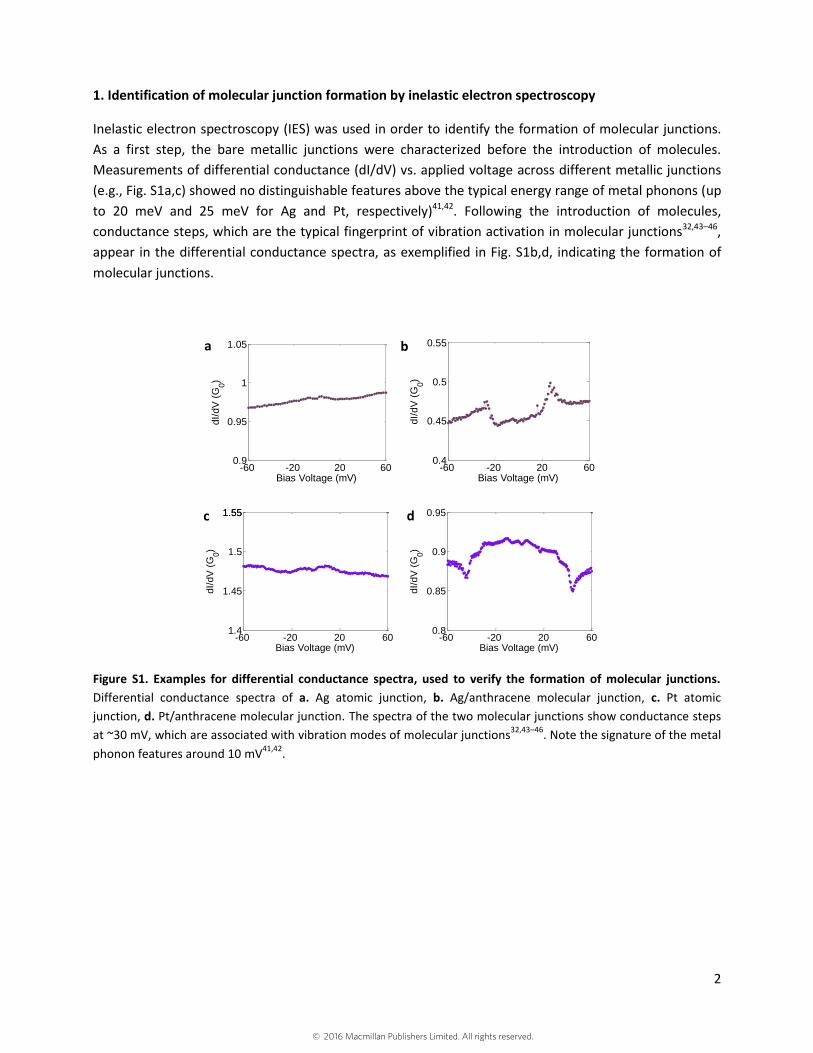
Inelastic electron spectroscopy (IES) was used in order to identify the formation of molecular junctions. As a first step, the bare metallic junctions were characterized before the introduction of molecules. Measurements of differential conductance (dI/dV) vs. applied voltage across different metallic junctions (e.g., Fig. S1a,c) showed no distinguishable features above the typical energy range of metal phonons (up to 20 meV and 25 meV for Ag and Pt, respectively)41,42. Following the introduction of molecules, conductance steps, which are the typical fingerprint of vibration activation in molecular junctions32,43–46, appear in the differential conductance spectra, as exemplified in Fig. S1b,d, indicating the formation of molecular junctions.
Figure S1. Examples for differential conductance spectra, used to verify the formation of molecular junctions. Differential conductance spectra of a. Ag atomic junction, b. Ag/anthracene molecular junction, c. Pt atomic junction, d. Pt/anthracene molecular junction. The spectra of the two molecular junctions show conductance steps at ~30 mV, which are associated with vibration modes of molecular junctions32,43–46. Note the signature of the metal phonon features around 10 mV41,42.
-60 -20 20 600.9
0.95
1
1.05
Bias Voltage (mV)
dI/
dV
(G
0)
-60 -20 20 600.4
0.45
0.5
0.55
Bias Voltage (mV)
dI/
dV
(G
0)
-60 -20 20 601.4
1.45
1.5
1.551.55
Bias Voltage (mV)
dI/
dV
(G
0)
-60 -20 20 600.8
0.85
0.9
0.95
Bias Voltage (mV)
dI/
dV
(G
0)
a b
c d
© 2016 Macmillan Publishers Limited. All rights reserved.
3
2. The geometry of the Ag/oligoacene molecular junction
Different experimental and theoretical observations, which are detailed below, indicate that the Ag/oligoacene junctions are limited to an ensemble of compact configurations, in which the long axis of the molecule is pointing out of the junction, as described for example in the insets of Fig. 3a and Fig. S5a.
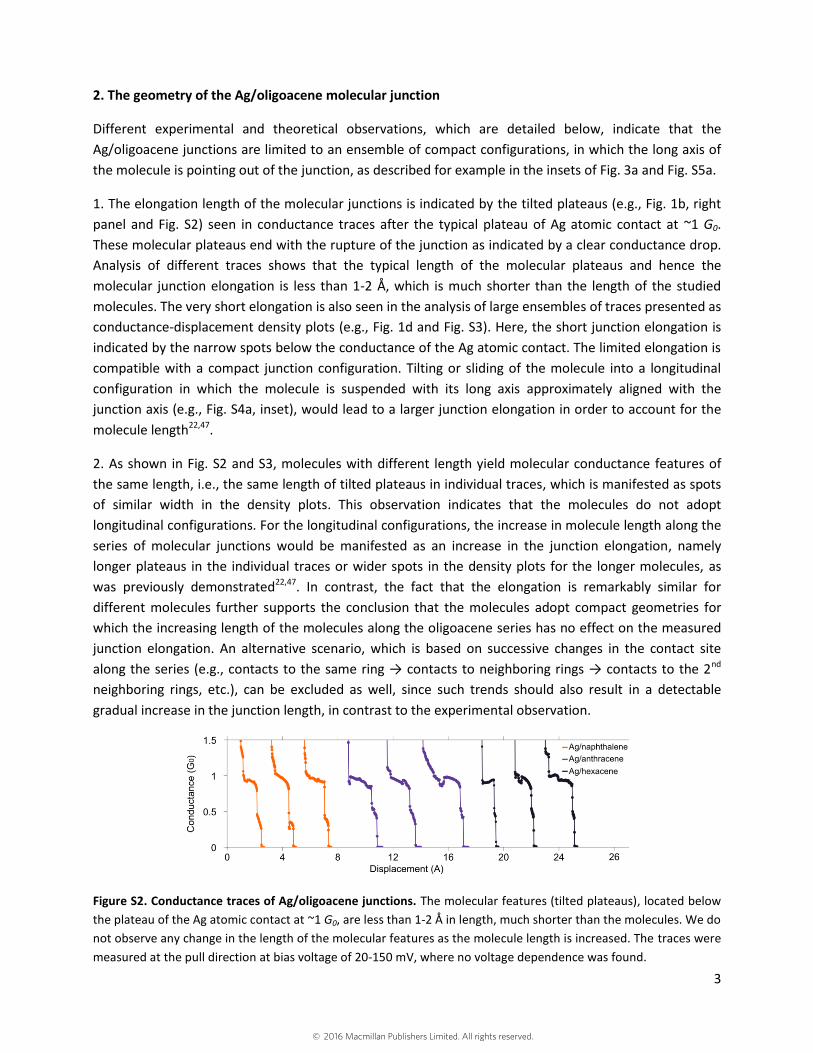
1. The elongation length of the molecular junctions is indicated by the tilted plateaus (e.g., Fig. 1b, right panel and Fig. S2) seen in conductance traces after the typical plateau of Ag atomic contact at ~1 G0. These molecular plateaus end with the rupture of the junction as indicated by a clear conductance drop. Analysis of different traces shows that the typical length of the molecular plateaus and hence the molecular junction elongation is less than 1-2 Å, which is much shorter than the length of the studied molecules. The very short elongation is also seen in the analysis of large ensembles of traces presented as conductance-displacement density plots (e.g., Fig. 1d and Fig. S3). Here, the short junction elongation is indicated by the narrow spots below the conductance of the Ag atomic contact. The limited elongation is compatible with a compact junction configuration. Tilting or sliding of the molecule into a longitudinal configuration in which the molecule is suspended with its long axis approximately aligned with the junction axis (e.g., Fig. S4a, inset), would lead to a larger junction elongation in order to account for the molecule length22,47.
2. As shown in Fig. S2 and S3, molecules with different length yield molecular conductance features of the same length, i.e., the same length of tilted plateaus in individual traces, which is manifested as spots of similar width in the density plots. This observation indicates that the molecules do not adopt longitudinal configurations. For the longitudinal configurations, the increase in molecule length along the series of molecular junctions would be manifested as an increase in the junction elongation, namely longer plateaus in the individual traces or wider spots in the density plots for the longer molecules, as was previously demonstrated22,47. In contrast, the fact that the elongation is remarkably similar for different molecules further supports the conclusion that the molecules adopt compact geometries for which the increasing length of the molecules along the oligoacene series has no effect on the measured junction elongation. An alternative scenario, which is based on successive changes in the contact site along the series (e.g., contacts to the same ring → contacts to neighboring rings → contacts to the 2nd neighboring rings, etc.), can be excluded as well, since such trends should also result in a detectable gradual increase in the junction length, in contrast to the experimental observation.
Figure S2. Conductance traces of Ag/oligoacene junctions. The molecular features (tilted plateaus), located below the plateau of the Ag atomic contact at ~1 G0, are less than 1-2 Å in length, much shorter than the molecules. We do not observe any change in the length of the molecular features as the molecule length is increased. The traces were measured at the pull direction at bias voltage of 20-150 mV, where no voltage dependence was found.
© 2016 Macmillan Publishers Limited. All rights reserved.
4
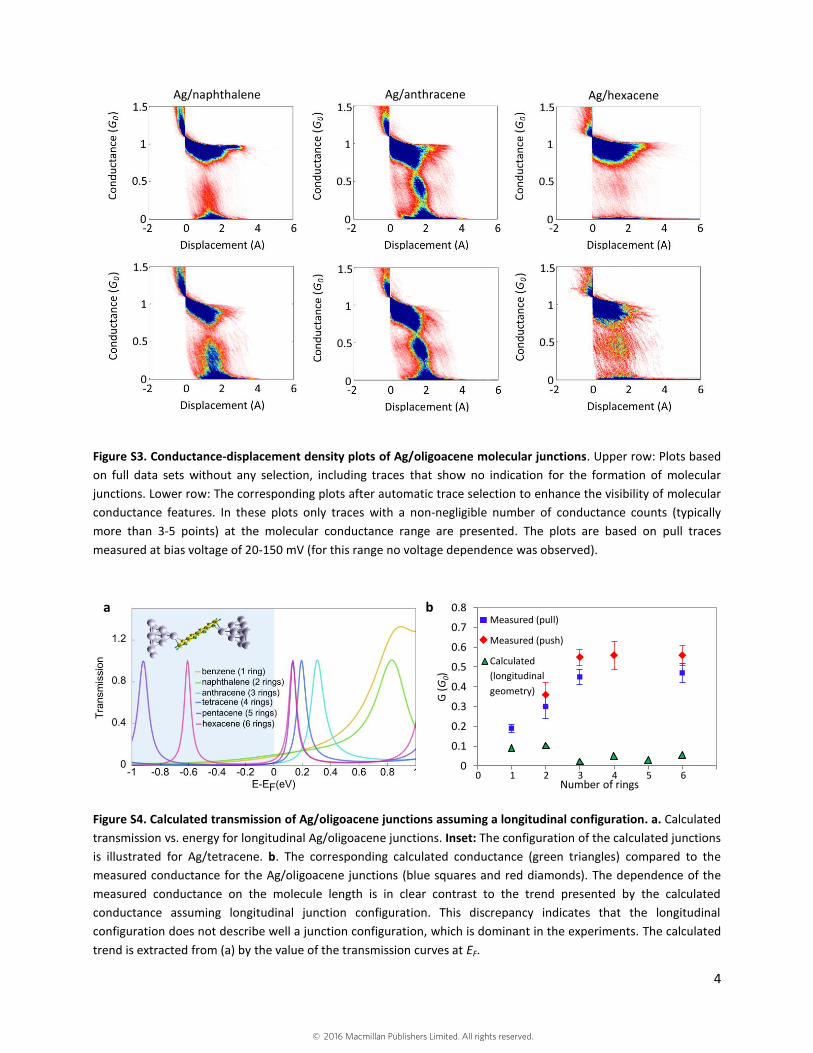
Figure S3. Conductance-displacement density plots of Ag/oligoacene molecular junctions. Upper row: Plots based on full data sets without any selection, including traces that show no indication for the formation of molecular junctions. Lower row: The corresponding plots after automatic trace selection to enhance the visibility of molecular conductance features. In these plots only traces with a non-negligible number of conductance counts (typically more than 3-5 points) at the molecular conductance range are presented. The plots are based on pull traces measured at bias voltage of 20-150 mV (for this range no voltage dependence was observed).
Figure S4. Calculated transmission of Ag/oligoacene junctions assuming a longitudinal configuration. a. Calculated transmission vs. energy for longitudinal Ag/oligoacene junctions. Inset: The configuration of the calculated junctions is illustrated for Ag/tetracene. b. The corresponding calculated conductance (green triangles) compared to the measured conductance for the Ag/oligoacene junctions (blue squares and red diamonds). The dependence of the measured conductance on the molecule length is in clear contrast to the trend presented by the calculated conductance assuming longitudinal junction configuration. This discrepancy indicates that the longitudinal configuration does not describe well a junction configuration, which is dominant in the experiments. The calculated trend is extracted from (a) by the value of the transmission curves at EF.
Ag/naphthalene Ag/anthracene Ag/hexacene
0
0.1
0.2
0.3
0.4
0.5
0.6
0.7
0.8
G (G
0)
Number of rings
b a Measured (pull)
Measured (push)
Calculated (longitudinal geometry)
1 2 3 4 5 6 0
© 2016 Macmillan Publishers Limited. All rights reserved.
5
3. Fig. S4 shows that the calculated transmission for junctions with a longitudinal geometry presents a conductance trend which is in sharp contrast to the measured conductance. This comparison supports the conclusion that longitudinal junction geometry can be excluded.
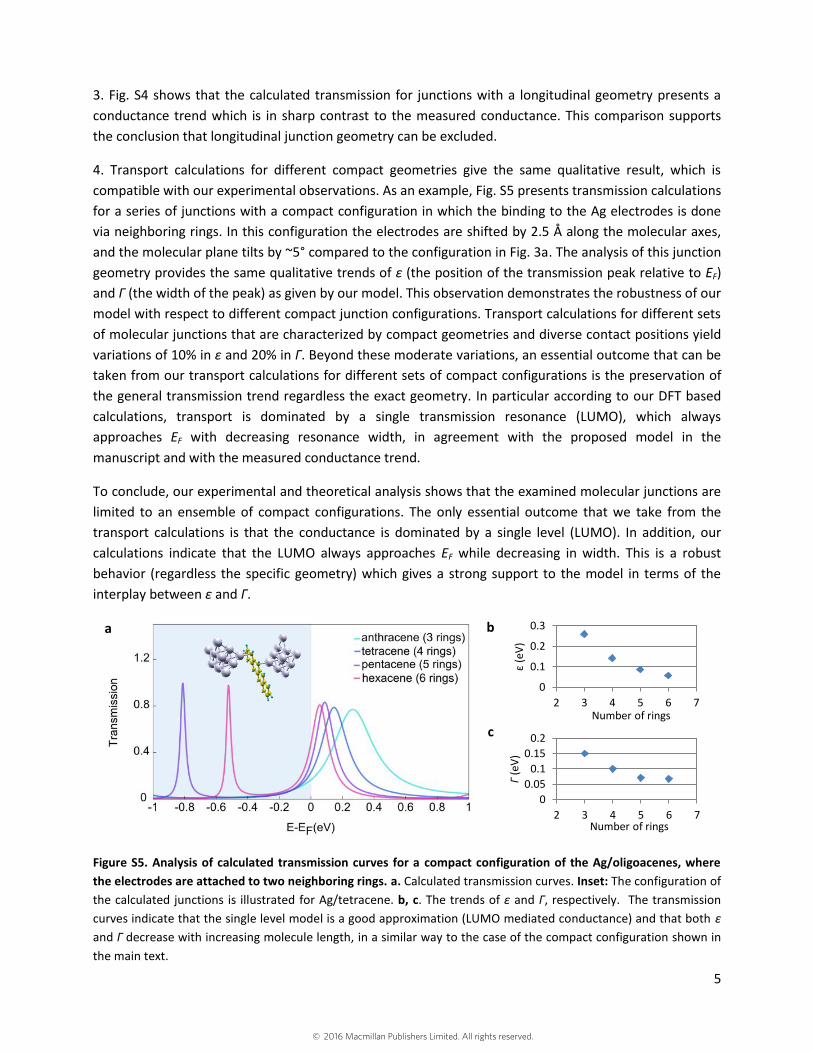
4. Transport calculations for different compact geometries give the same qualitative result, which is compatible with our experimental observations. As an example, Fig. S5 presents transmission calculations for a series of junctions with a compact configuration in which the binding to the Ag electrodes is done via neighboring rings. In this configuration the electrodes are shifted by 2.5 Å along the molecular axes, and the molecular plane tilts by ~5° compared to the configuration in Fig. 3a. The analysis of this junction geometry provides the same qualitative trends of ε (the position of the transmission peak relative to EF) and Г (the width of the peak) as given by our model. This observation demonstrates the robustness of our model with respect to different compact junction configurations. Transport calculations for different sets of molecular junctions that are characterized by compact geometries and diverse contact positions yield variations of 10% in ε and 20% in Г. Beyond these moderate variations, an essential outcome that can be taken from our transport calculations for different sets of compact configurations is the preservation of the general transmission trend regardless the exact geometry. In particular according to our DFT based calculations, transport is dominated by a single transmission resonance (LUMO), which always approaches EF with decreasing resonance width, in agreement with the proposed model in the manuscript and with the measured conductance trend.
To conclude, our experimental and theoretical analysis shows that the examined molecular junctions are limited to an ensemble of compact configurations. The only essential outcome that we take from the transport calculations is that the conductance is dominated by a single level (LUMO). In addition, our calculations indicate that the LUMO always approaches EF while decreasing in width. This is a robust behavior (regardless the specific geometry) which gives a strong support to the model in terms of the interplay between ε and Г.
Figure S5. Analysis of calculated transmission curves for a compact configuration of the Ag/oligoacenes, where the electrodes are attached to two neighboring rings. a. Calculated transmission curves. Inset: The configuration of the calculated junctions is illustrated for Ag/tetracene. b, c. The trends of ε and Г, respectively. The transmission curves indicate that the single level model is a good approximation (LUMO mediated conductance) and that both ε and Г decrease with increasing molecule length, in a similar way to the case of the compact configuration shown in the main text.
c
0
0.1
0.2
0.3
2 3 4 5 6 7
ε (e
V)
Number of rings
00.05
0.10.15
0.2
2 3 4 5 6 7
Г (e
V)
Number of rings
b a
© 2016 Macmillan Publishers Limited. All rights reserved.
6
An example for the effect of molecule tilting on the transmission:
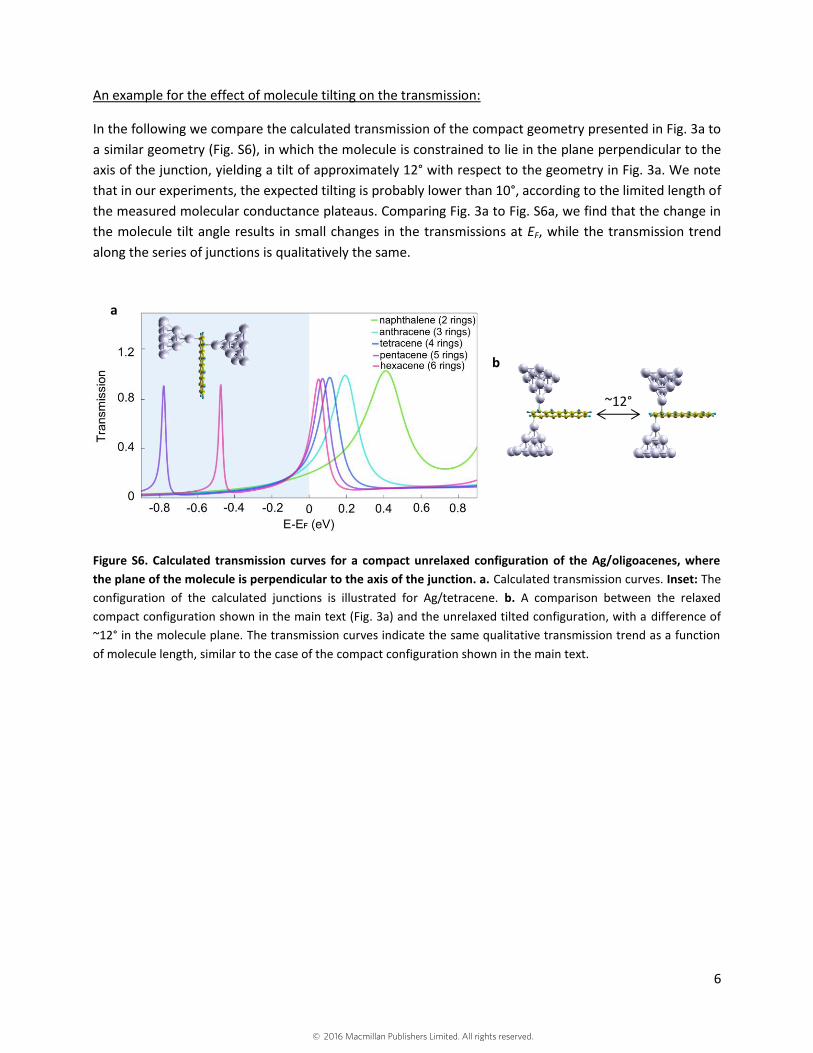
In the following we compare the calculated transmission of the compact geometry presented in Fig. 3a to a similar geometry (Fig. S6), in which the molecule is constrained to lie in the plane perpendicular to the axis of the junction, yielding a tilt of approximately 12° with respect to the geometry in Fig. 3a. We note that in our experiments, the expected tilting is probably lower than 10°, according to the limited length of the measured molecular conductance plateaus. Comparing Fig. 3a to Fig. S6a, we find that the change in the molecule tilt angle results in small changes in the transmissions at EF, while the transmission trend along the series of junctions is qualitatively the same.
Figure S6. Calculated transmission curves for a compact unrelaxed configuration of the Ag/oligoacenes, where the plane of the molecule is perpendicular to the axis of the junction. a. Calculated transmission curves. Inset: The configuration of the calculated junctions is illustrated for Ag/tetracene. b. A comparison between the relaxed compact configuration shown in the main text (Fig. 3a) and the unrelaxed tilted configuration, with a difference of ~12° in the molecule plane. The transmission curves indicate the same qualitative transmission trend as a function of molecule length, similar to the case of the compact configuration shown in the main text.
~12°
a
b
© 2016 Macmillan Publishers Limited. All rights reserved.
7
3. Determination of the molecular junction conductance
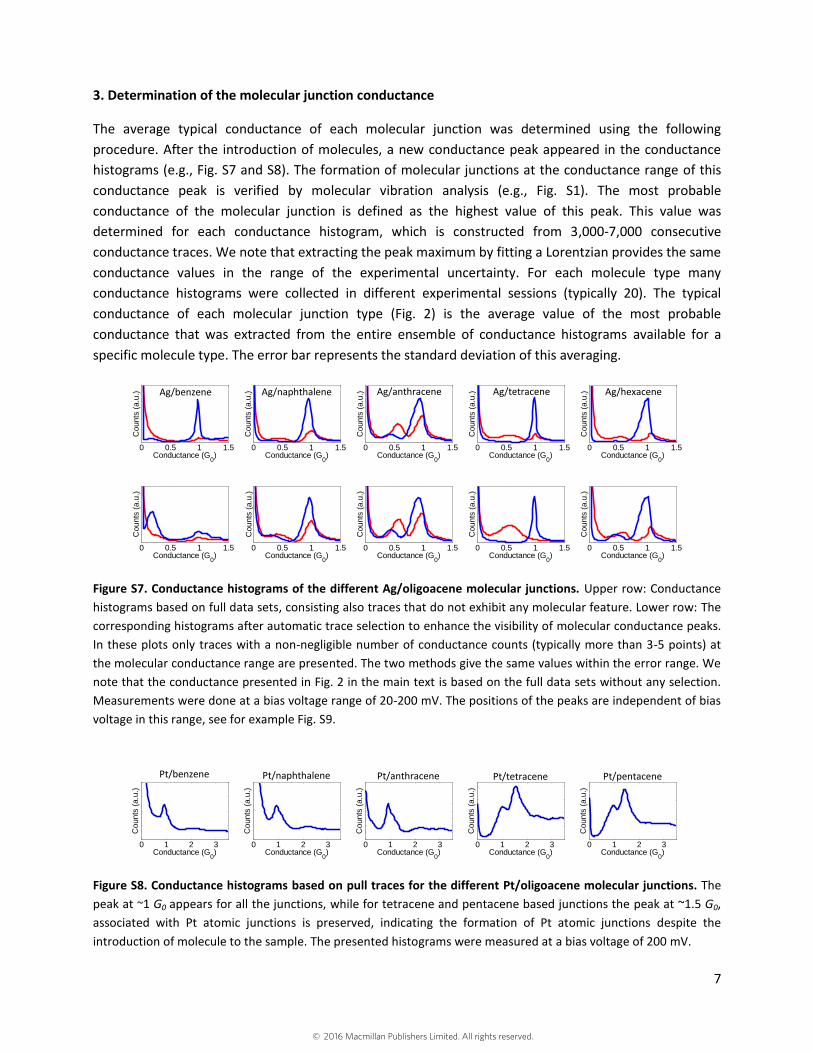
The average typical conductance of each molecular junction was determined using the following procedure. After the introduction of molecules, a new conductance peak appeared in the conductance histograms (e.g., Fig. S7 and S8). The formation of molecular junctions at the conductance range of this conductance peak is verified by molecular vibration analysis (e.g., Fig. S1). The most probable conductance of the molecular junction is defined as the highest value of this peak. This value was determined for each conductance histogram, which is constructed from 3,000-7,000 consecutive conductance traces. We note that extracting the peak maximum by fitting a Lorentzian provides the same conductance values in the range of the experimental uncertainty. For each molecule type many conductance histograms were collected in different experimental sessions (typically 20). The typical conductance of each molecular junction type (Fig. 2) is the average value of the most probable conductance that was extracted from the entire ensemble of conductance histograms available for a specific molecule type. The error bar represents the standard deviation of this averaging.
Figure S7. Conductance histograms of the different Ag/oligoacene molecular junctions. Upper row: Conductance histograms based on full data sets, consisting also traces that do not exhibit any molecular feature. Lower row: The corresponding histograms after automatic trace selection to enhance the visibility of molecular conductance peaks. In these plots only traces with a non-negligible number of conductance counts (typically more than 3-5 points) at the molecular conductance range are presented. The two methods give the same values within the error range. We note that the conductance presented in Fig. 2 in the main text is based on the full data sets without any selection. Measurements were done at a bias voltage range of 20-200 mV. The positions of the peaks are independent of bias voltage in this range, see for example Fig. S9.
Figure S8. Conductance histograms based on pull traces for the different Pt/oligoacene molecular junctions. The peak at ~1 G0 appears for all the junctions, while for tetracene and pentacene based junctions the peak at ~1.5 G0, associated with Pt atomic junctions is preserved, indicating the formation of Pt atomic junctions despite the introduction of molecule to the sample. The presented histograms were measured at a bias voltage of 200 mV.
Conductance (G0)
Counts
(a.u
.)
0 0.5 1 1.5Conductance (G
0)
Counts
(a.u
.)
0 0.5 1 1.5Conductance (G
0)
Counts
(a.u
.)
0 0.5 1 1.5Conductance (G
0)
Counts
(a.u
.)
0 0.5 1 1.5Conductance (G
0)
Counts
(a.u
.)
0 0.5 1 1.5
Conductance (G0)
Counts
(a.u
.)
0 0.5 1 1.5Conductance (G
0)
Counts
(a.u
.)
0 0.5 1 1.5Conductance (G
0)
Counts
(a.u
.)
0 0.5 1 1.5Conductance (G
0)
Counts
(a.u
.)
0 0.5 1 1.5Conductance (G
0)
Counts
(a.u
.)
0 0.5 1 1.5
0 1 2 3Conductance (G
0)
Counts
(a.u
.)
0 1 2 3Conductance (G
0)
Counts
(a.u
.)
0 1 2 3Conductance (G
0)
Counts
(a.u
.)
0 1 2 3Conductance (G
0)
Counts
(a.u
.)
0 1 2 3Conductance (G
0)
Counts
(a.u
.)
Pt/benzene Pt/naphthalene Pt/anthracene Pt/tetracene Pt/pentacene
Ag/benzene Ag/naphthalene Ag/anthracene Ag/tetracene Ag/hexacene
© 2016 Macmillan Publishers Limited. All rights reserved.
8
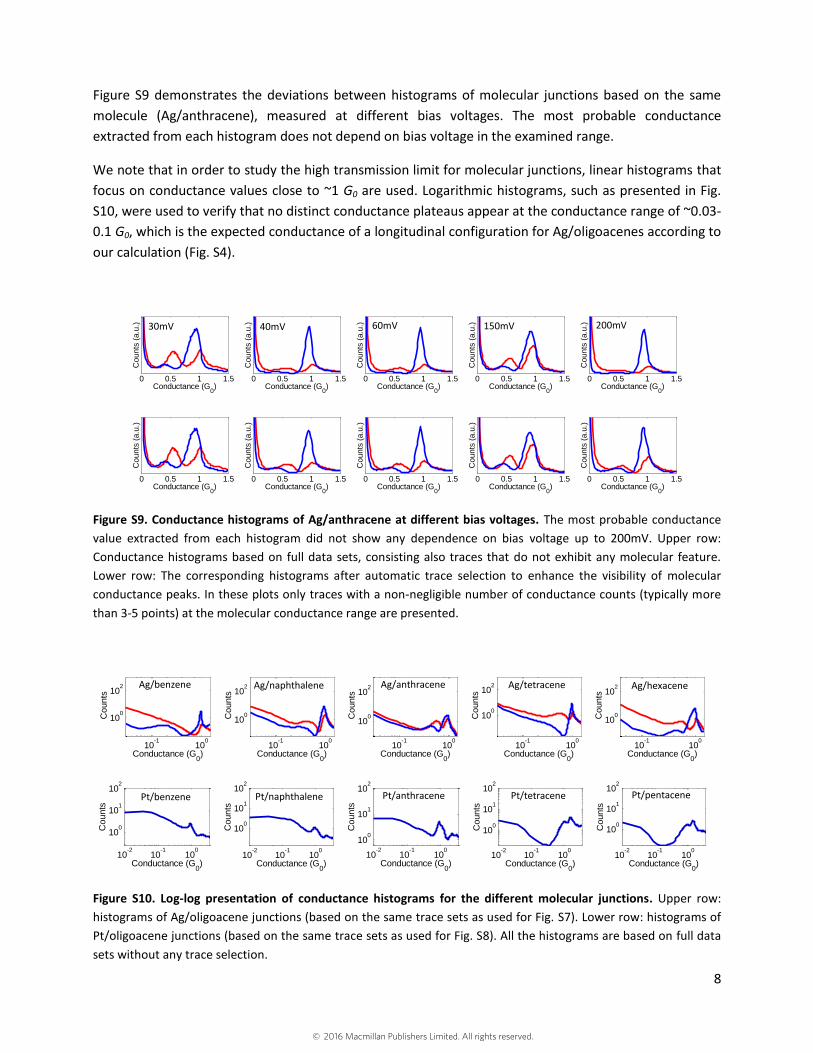
Figure S9 demonstrates the deviations between histograms of molecular junctions based on the same molecule (Ag/anthracene), measured at different bias voltages. The most probable conductance extracted from each histogram does not depend on bias voltage in the examined range.
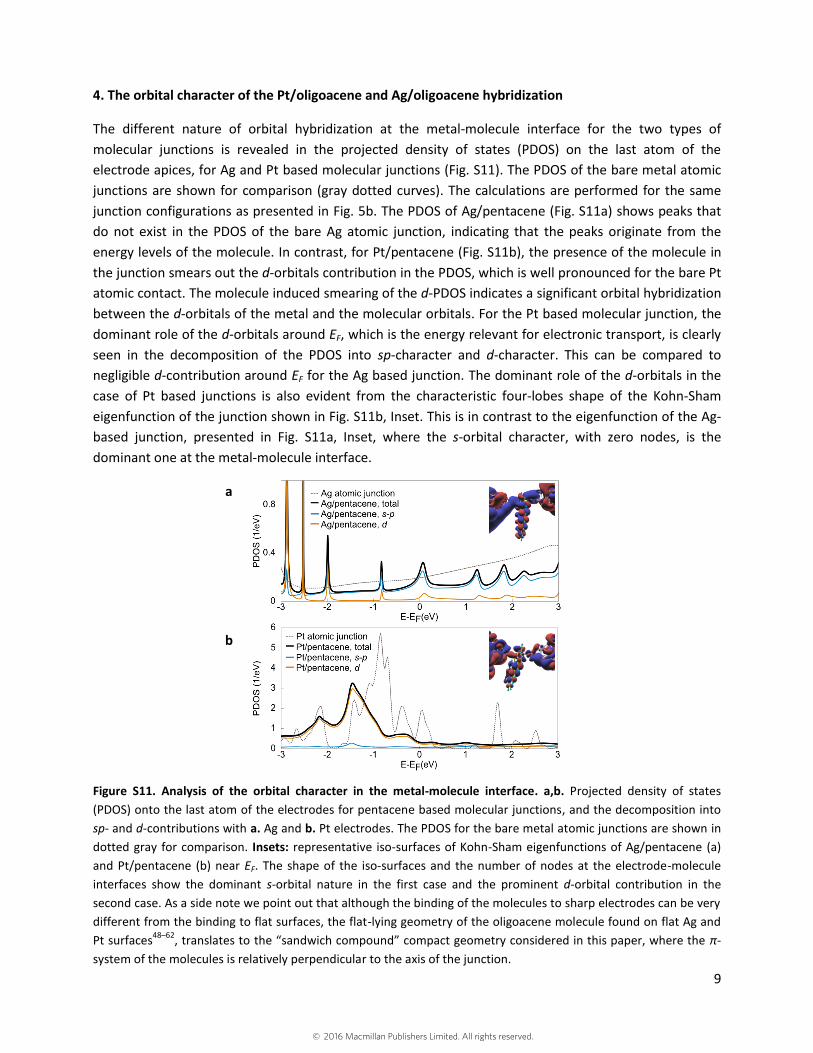
We note that in order to study the high transmission limit for molecular junctions, linear histograms that focus on conductance values close to ~1 G0 are used. Logarithmic histograms, such as presented in Fig. S10, were used to verify that no distinct conductance plateaus appear at the conductance range of ~0.03-0.1 G0, which is the expected conductance of a longitudinal configuration for Ag/oligoacenes according to our calculation (Fig. S4).
Figure S9. Conductance histograms of Ag/anthracene at different bias voltages. The most probable conductance value extracted from each histogram did not show any dependence on bias voltage up to 200mV. Upper row: Conductance histograms based on full data sets, consisting also traces that do not exhibit any molecular feature. Lower row: The corresponding histograms after automatic trace selection to enhance the visibility of molecular conductance peaks. In these plots only traces with a non-negligible number of conductance counts (typically more than 3-5 points) at the molecular conductance range are presented.
Figure S10. Log-log presentation of conductance histograms for the different molecular junctions. Upper row: histograms of Ag/oligoacene junctions (based on the same trace sets as used for Fig. S7). Lower row: histograms of Pt/oligoacene junctions (based on the same trace sets as used for Fig. S8). All the histograms are based on full data sets without any trace selection.
Conductance (G0)
Counts
(a.u
.)
0 0.5 1 1.5Conductance (G
0)
Counts
(a.u
.)
0 0.5 1 1.5Conductance (G
0)
Counts
(a.u
.)
0 0.5 1 1.5Conductance (G
0)
Counts
(a.u
.)
0 0.5 1 1.5Conductance (G
0)
Counts
(a.u
.)
0 0.5 1 1.5
Conductance (G0)
Counts
(a.u
.)
0 0.5 1 1.5Conductance (G
0)
Counts
(a.u
.)
0 0.5 1 1.5Conductance (G
0)
Counts
(a.u
.)
0 0.5 1 1.5Conductance (G
0)
Counts
(a.u
.)
0 0.5 1 1.5Conductance (G
0)
Counts
(a.u
.)
0 0.5 1 1.5
Conductance (G0)
Counts
10-1
100
100
102
Conductance (G0)
Counts
10-1
100
100
102
Conductance (G0)
Counts
10-1
100
100
102
Conductance (G0)
Counts
10-1
100
100
102
Conductance (G0)
Counts
10-1
100
100
102
10-2
10-1
100
100
101
102
Conductance (G0)
Counts
10-2
10-1
100
100
101
102
Conductance (G0)
Counts
10-2
10-1
100
100
101
102
Conductance (G0)
Counts
10-2
10-1
100
100
101
102
Conductance (G0)
Counts
10-2
10-1
100
100
101
102
Conductance (G0)
Counts
40mV 60mV 150mV 200mV 30mV
Ag/benzene Ag/naphthalene Ag/anthracene Ag/tetracene Ag/hexacene
Pt/benzene Pt/naphthalene Pt/anthracene Pt/tetracene Pt/pentacene
© 2016 Macmillan Publishers Limited. All rights reserved.
9
4. The orbital character of the Pt/oligoacene and Ag/oligoacene hybridization
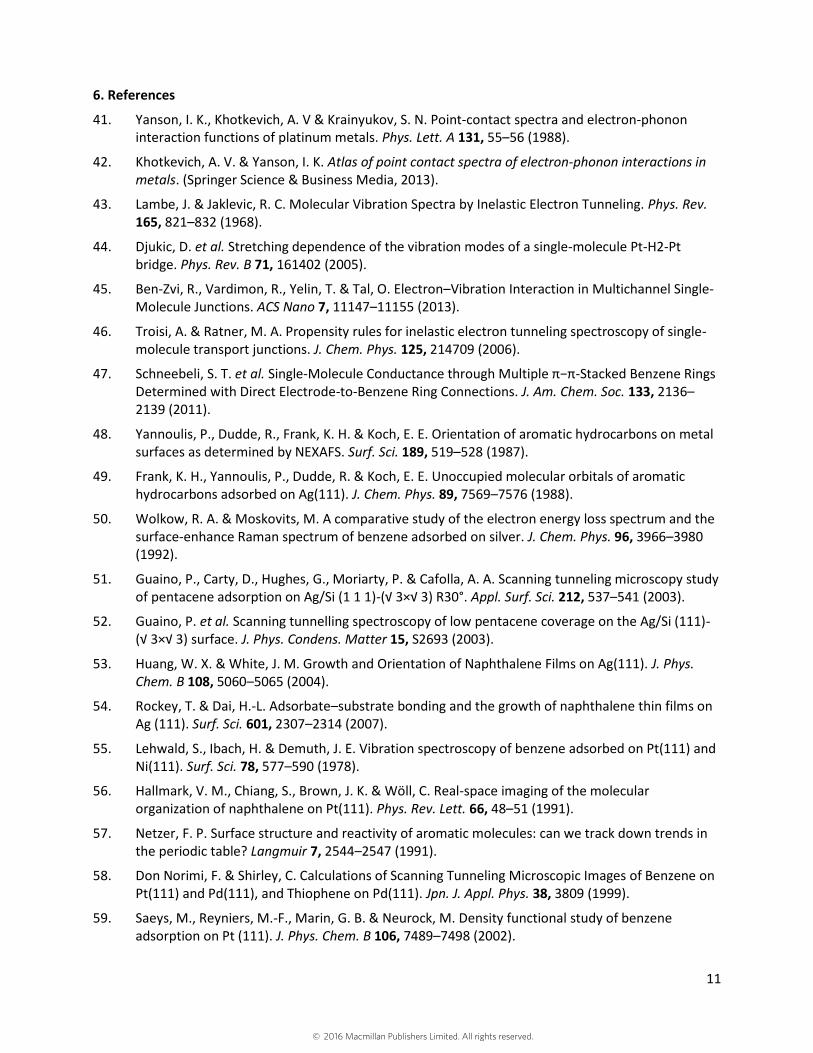
The different nature of orbital hybridization at the metal-molecule interface for the two types of molecular junctions is revealed in the projected density of states (PDOS) on the last atom of the electrode apices, for Ag and Pt based molecular junctions (Fig. S11). The PDOS of the bare metal atomic junctions are shown for comparison (gray dotted curves). The calculations are performed for the same junction configurations as presented in Fig. 5b. The PDOS of Ag/pentacene (Fig. S11a) shows peaks that do not exist in the PDOS of the bare Ag atomic junction, indicating that the peaks originate from the energy levels of the molecule. In contrast, for Pt/pentacene (Fig. S11b), the presence of the molecule in the junction smears out the d-orbitals contribution in the PDOS, which is well pronounced for the bare Pt atomic contact. The molecule induced smearing of the d-PDOS indicates a significant orbital hybridization between the d-orbitals of the metal and the molecular orbitals. For the Pt based molecular junction, the dominant role of the d-orbitals around EF, which is the energy relevant for electronic transport, is clearly seen in the decomposition of the PDOS into sp-character and d-character. This can be compared to negligible d-contribution around EF for the Ag based junction. The dominant role of the d-orbitals in the case of Pt based junctions is also evident from the characteristic four-lobes shape of the Kohn-Sham eigenfunction of the junction shown in Fig. S11b, Inset. This is in contrast to the eigenfunction of the Ag-based junction, presented in Fig. S11a, Inset, where the s-orbital character, with zero nodes, is the dominant one at the metal-molecule interface.
Figure S11. Analysis of the orbital character in the metal-molecule interface. a,b. Projected density of states (PDOS) onto the last atom of the electrodes for pentacene based molecular junctions, and the decomposition into sp- and d-contributions with a. Ag and b. Pt electrodes. The PDOS for the bare metal atomic junctions are shown in dotted gray for comparison. Insets: representative iso-surfaces of Kohn-Sham eigenfunctions of Ag/pentacene (a) and Pt/pentacene (b) near EF. The shape of the iso-surfaces and the number of nodes at the electrode-molecule interfaces show the dominant s-orbital nature in the first case and the prominent d-orbital contribution in the second case. As a side note we point out that although the binding of the molecules to sharp electrodes can be very different from the binding to flat surfaces, the flat-lying geometry of the oligoacene molecule found on flat Ag and Pt surfaces48–62, translates to the “sandwich compound” compact geometry considered in this paper, where the π-system of the molecules is relatively perpendicular to the axis of the junction.
a
b
© 2016 Macmillan Publishers Limited. All rights reserved.

10
5. Friedel’s sum rule for pedestrians
We consider a molecule coupled to left and right metallic electrodes and demonstrate an explicit relation between the zero-bias conductance and the occupancy of the molecular level. We assume that at low temperatures and zero bias, the electronic transport is governed by a single resonant orbital. Oligoacenes (starting from naphthalene) coupled to Ag electrodes fall into this class, as we demonstrate in the main text with the aid of first-principles calculations. The transmission function 𝑇(𝜔) is given by
𝑇(𝜔) =𝛤2
(𝜔−𝜀)2+𝛤2 (S1)
where ε is the resonance center and 2Γ is the full resonance width at half maximum. The finite width of the resonance is induced by the electrodes, and on writing equation (S1) we assume that the resonant state couples equally to both electrodes. The zero-bias conductance is proportional to the value of the transmission at EF
𝐺 =2𝑒2
ℎ𝑇(𝐸𝐹): = 𝐺0𝑇(𝐸𝐹)
Without loss of generality, we set 𝐸𝐹 = 0. In other words, ε is the resonance center with respect to EF. The spectral function 𝐴(𝜔) (density of states) is given by
𝐴(𝜔) =1
𝜋
𝛤
(𝜔−𝜀)2+𝛤2 (S2)
The number of electrons in the resonant state is given by integration up to EF,
𝑞 = 2 ∫ 𝐴(𝜔)𝑑𝜔0
−∞= 1 −
2
𝜋𝑎𝑟𝑐𝑡𝑎𝑛 (
𝜀
𝛤) =
2
𝜋𝑎𝑟𝑐𝑐𝑜𝑡 (
𝜀
𝛤) (S3)
Note the factor of two due to spin degeneracy. We introduce the phase shift
𝑐𝑜𝑡𝑎𝑛(𝜂) ≔𝜀
𝛤 , 𝜂 =
𝜋
2𝑞
which allows expressing the conductance as a function of the electron number only,
𝐺 = 𝐺0
1
1 + (𝜀𝛤
)2 = 𝐺0
1
1 + 𝑐𝑜𝑡𝑎𝑛2(𝜂)= 𝐺0𝑠𝑖𝑛2(𝜂)
𝐺 = 𝐺0𝑠𝑖𝑛2 (𝜋
2𝑞) (S4)
If the transport through the molecule in question is dominated by the LUMO, then 𝑞 represents the number of excess electrons in the LUMO in equilibrium. We note that the total charge transfer may contain components from other orbitals. The relation (S4) is known as Friedel’s sum rule for historic reasons. In various forms, it has proven useful in the study of dilute alloys63, adsorbed molecules64 and transport through quantum dots65.
We note here, that this relation holds also in the presence of electron-electron interactions, provided that certain Fermi-liquid identities apply63,66. In simpler terms, interactions in the Fermi-liquid state preserve the form of the spectral function and transmission resonance, equations (S1) and (S2), hence the same relation applies. This is the case of normal metallic electrodes at sufficiently low temperatures except for superconducting environments, ferromagnetic environments or other cases with interaction-induced broken symmetries. If the molecule develops a magnetic moment, Friedel’s sum rule applies in the low-temperature fully-screened Kondo regime.
© 2016 Macmillan Publishers Limited. All rights reserved.
11
6. References
41. Yanson, I. K., Khotkevich, A. V & Krainyukov, S. N. Point-contact spectra and electron-phonon interaction functions of platinum metals. Phys. Lett. A 131, 55–56 (1988).
42. Khotkevich, A. V. & Yanson, I. K. Atlas of point contact spectra of electron-phonon interactions in metals. (Springer Science & Business Media, 2013).
43. Lambe, J. & Jaklevic, R. C. Molecular Vibration Spectra by Inelastic Electron Tunneling. Phys. Rev. 165, 821–832 (1968).
44. Djukic, D. et al. Stretching dependence of the vibration modes of a single-molecule Pt-H2-Pt bridge. Phys. Rev. B 71, 161402 (2005).
45. Ben-Zvi, R., Vardimon, R., Yelin, T. & Tal, O. Electron–Vibration Interaction in Multichannel Single-Molecule Junctions. ACS Nano 7, 11147–11155 (2013).
46. Troisi, A. & Ratner, M. A. Propensity rules for inelastic electron tunneling spectroscopy of single-molecule transport junctions. J. Chem. Phys. 125, 214709 (2006).
47. Schneebeli, S. T. et al. Single-Molecule Conductance through Multiple π−π-Stacked Benzene Rings Determined with Direct Electrode-to-Benzene Ring Connections. J. Am. Chem. Soc. 133, 2136–2139 (2011).
48. Yannoulis, P., Dudde, R., Frank, K. H. & Koch, E. E. Orientation of aromatic hydrocarbons on metal surfaces as determined by NEXAFS. Surf. Sci. 189, 519–528 (1987).
49. Frank, K. H., Yannoulis, P., Dudde, R. & Koch, E. E. Unoccupied molecular orbitals of aromatic hydrocarbons adsorbed on Ag(111). J. Chem. Phys. 89, 7569–7576 (1988).
50. Wolkow, R. A. & Moskovits, M. A comparative study of the electron energy loss spectrum and the surface‐enhance Raman spectrum of benzene adsorbed on silver. J. Chem. Phys. 96, 3966–3980 (1992).
51. Guaino, P., Carty, D., Hughes, G., Moriarty, P. & Cafolla, A. A. Scanning tunneling microscopy study of pentacene adsorption on Ag/Si (1 1 1)-(√ 3×√ 3) R30°. Appl. Surf. Sci. 212, 537–541 (2003).
52. Guaino, P. et al. Scanning tunnelling spectroscopy of low pentacene coverage on the Ag/Si (111)-(√ 3×√ 3) surface. J. Phys. Condens. Matter 15, S2693 (2003).
53. Huang, W. X. & White, J. M. Growth and Orientation of Naphthalene Films on Ag(111). J. Phys. Chem. B 108, 5060–5065 (2004).
54. Rockey, T. & Dai, H.-L. Adsorbate–substrate bonding and the growth of naphthalene thin films on Ag (111). Surf. Sci. 601, 2307–2314 (2007).
55. Lehwald, S., Ibach, H. & Demuth, J. E. Vibration spectroscopy of benzene adsorbed on Pt(111) and Ni(111). Surf. Sci. 78, 577–590 (1978).
56. Hallmark, V. M., Chiang, S., Brown, J. K. & Wöll, C. Real-space imaging of the molecular organization of naphthalene on Pt(111). Phys. Rev. Lett. 66, 48–51 (1991).
57. Netzer, F. P. Surface structure and reactivity of aromatic molecules: can we track down trends in the periodic table? Langmuir 7, 2544–2547 (1991).
58. Don Norimi, F. & Shirley, C. Calculations of Scanning Tunneling Microscopic Images of Benzene on Pt(111) and Pd(111), and Thiophene on Pd(111). Jpn. J. Appl. Phys. 38, 3809 (1999).
59. Saeys, M., Reyniers, M.-F., Marin, G. B. & Neurock, M. Density functional study of benzene adsorption on Pt (111). J. Phys. Chem. B 106, 7489–7498 (2002).
© 2016 Macmillan Publishers Limited. All rights reserved.
12
60. Morin, C., Simon, D. & Sautet, P. Trends in the chemisorption of aromatic molecules on a Pt (111) surface: benzene, naphthalene, and anthracene from first principles calculations. J. Phys. Chem. B 108, 12084–12091 (2004).
61. Morin, C., Simon, D. & Sautet, P. Chemisorption of Benzene on Pt(111), Pd(111), and Rh(111) Metal Surfaces: A Structural and Vibrational Comparison from First Principles. J. Phys. Chem. B 108, 5653–5665 (2004).
62. Montano, M., Salmeron, M. & Somorjai, G. A. STM studies of cyclohexene hydrogenation/dehydrogenation and its poisoning by carbon monoxide on Pt (111). Surf. Sci. 600, 1809–1816 (2006).
63. Hewson, A. C. The Kondo problem to heavy fermions . (Cambridge university press, 1997).
64. Desjonqueres, M.-C. Concepts in Surface Physics: 2ème édition. 30, (Springer Science & Business Media, 1996).
65. Pustilnik, M. & Glazman, L. Kondo effect in quantum dots. J. Phys. Condens. Matter 16, R513 (2004).
66. Langer, J. S. & Ambegaokar, V. Friedel Sum Rule for a System of Interacting Electrons. Phys. Rev. 121, 1090–1092 (1961).
© 2016 Macmillan Publishers Limited. All rights reserved.