Embed Size (px)
Citation preview
Conducting an Effects Analysis for System-Wide Evaluation of Endangered Species on the Missouri River Craig Fischenich ERDC Environmental Laboratory
Robb Jacobson USGS CERC
Kate Buenau Pacific Northwest Laboratories
CEER - 29 July, 2014
Innovative solutions for a safer, better world BUILDING STRONG®
Acknowledgements Corps ERDC USFWS Aaron Quinn Bobby McComass Carol Aron Carol Huber Christy Foran Carol Smith Christine Cieslik Craig Fischenich Clayton Ridenour Craig Fleming David Smith Dan James Dan Pridal Jack Killgore Jane Ledwin Don Meier Jan Hoover Tom Econopouly Doug Clemetson Rich Fischer Wayne Nelson-Stastny Doug Latka Todd Swannack Emily Nziramasanga USGS Jean Reed HEC Aaron DeLonay Jeff Tripe John Hickey Diana Papoulias Joe Bonneau Stan Gibson Kim Chojnacki John Shelley Mandy Annis Joshua Mellinger PNNL Mark Wildhaber Marian Baker Chris Murray Michael Colvin Michelle Whitney Chris Vernon Michael Parsley Paul Boyd Eric Oldenburg Pat Braaten Tim Welker Kate Buenau Robb Jacobson Todd Gemienhart Mike Anderson Travis Yonts Val Cullinan
Innovative solutions for a safer, better world BUILDING STRONG®
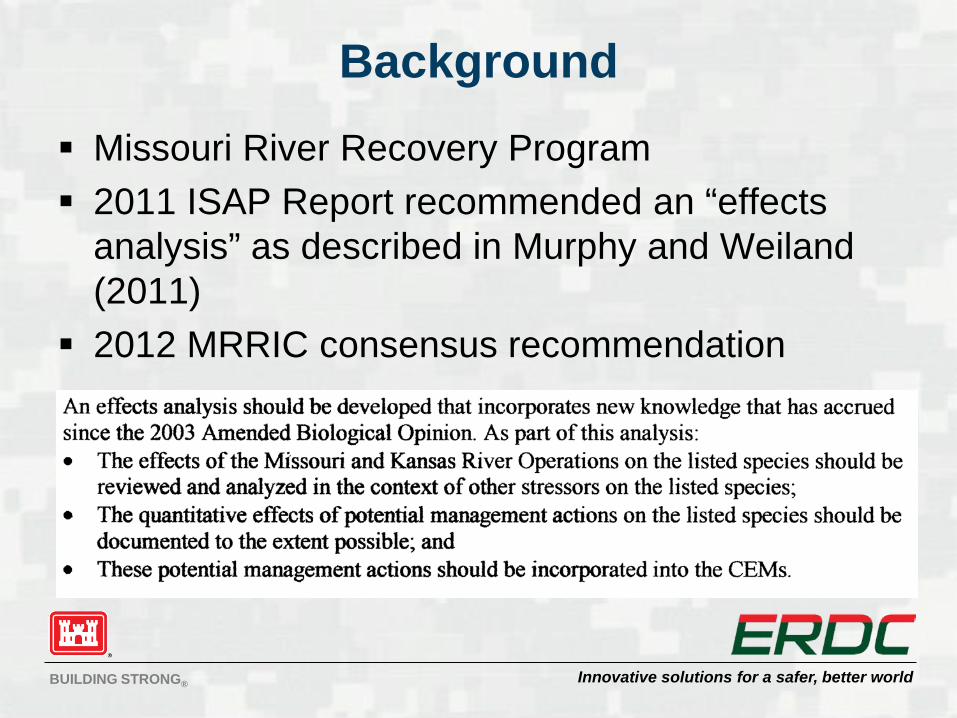
Background Missouri River Recovery Program 2011 ISAP Report recommended an “effects
analysis” as described in Murphy and Weiland (2011)
2012 MRRIC consensus recommendation
Innovative solutions for a safer, better world BUILDING STRONG®
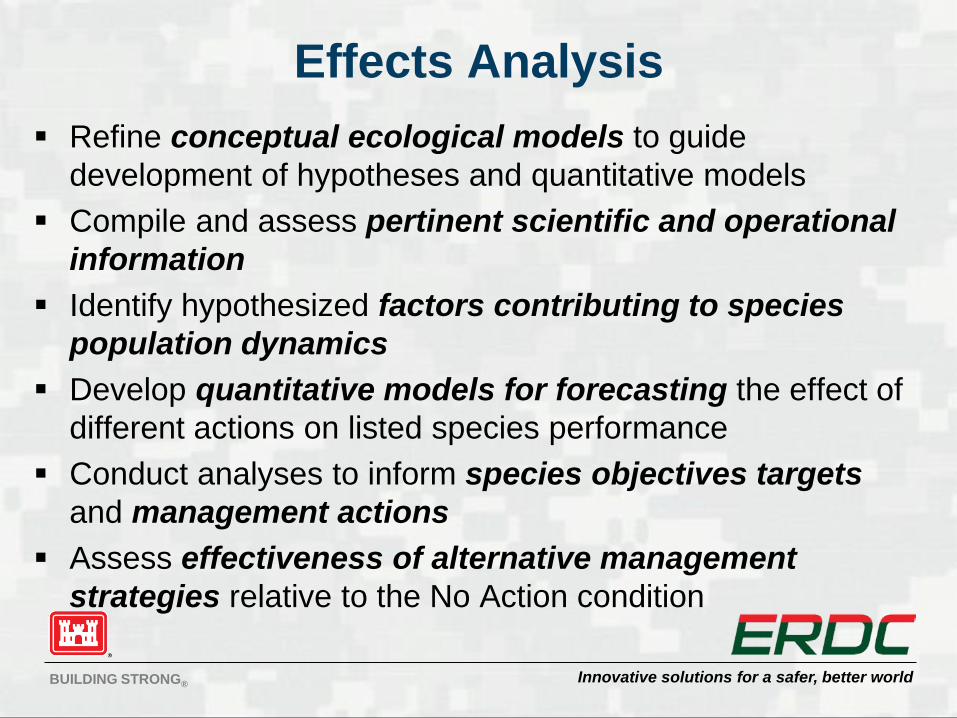
Effects Analysis Refine conceptual ecological models to guide
development of hypotheses and quantitative models Compile and assess pertinent scientific and operational
information Identify hypothesized factors contributing to species
population dynamics Develop quantitative models for forecasting the effect of
different actions on listed species performance Conduct analyses to inform species objectives targets
and management actions Assess effectiveness of alternative management
strategies relative to the No Action condition
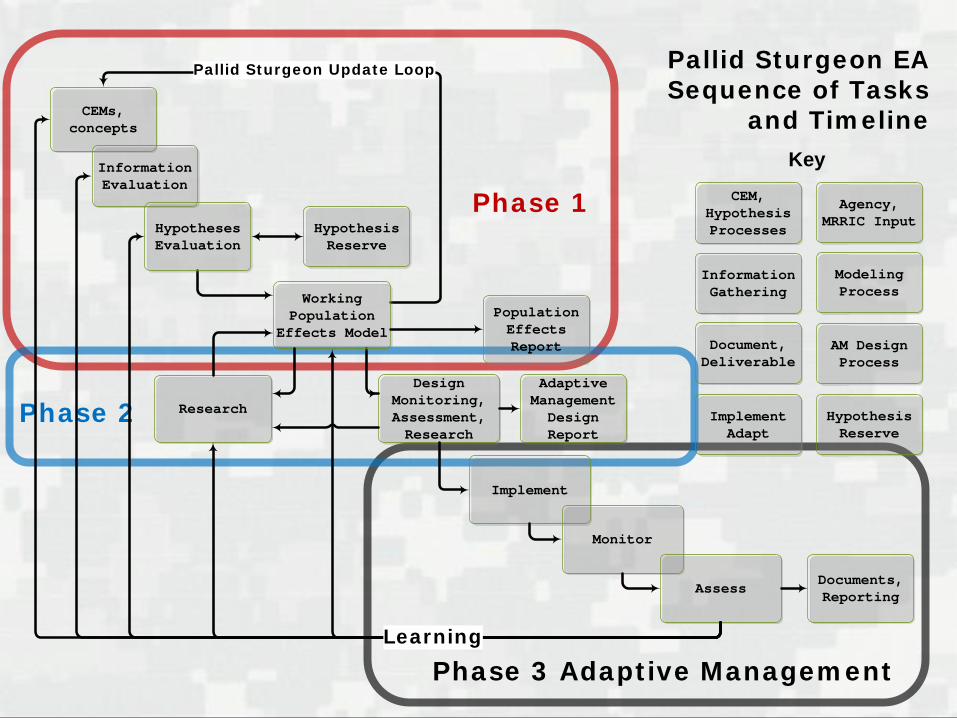
Phase 1
Phase 2
Phase 3 Adaptive Management
CEMs, concepts
Design Monitoring, Assessment, Research
Adaptive Management Design Report
Pallid Sturgeon Update Loop
CEM, Hypothesis Processes
Document, Deliverable
Agency, MRRIC Input
Modeling Process
Information Gathering
AM Design Process
Pallid Sturgeon EA Sequence of Tasks
and TimelineKey
Hypothesis Reserve
Hypothesis Reserve
Working Population
Effects Model
Implement
Monitor
Assess
ImplementAdapt
Documents, Reporting
Information Evaluation
Hypotheses Evaluation
Research
Learning
Population Effects Report
Innovative solutions for a safer, better world BUILDING STRONG®
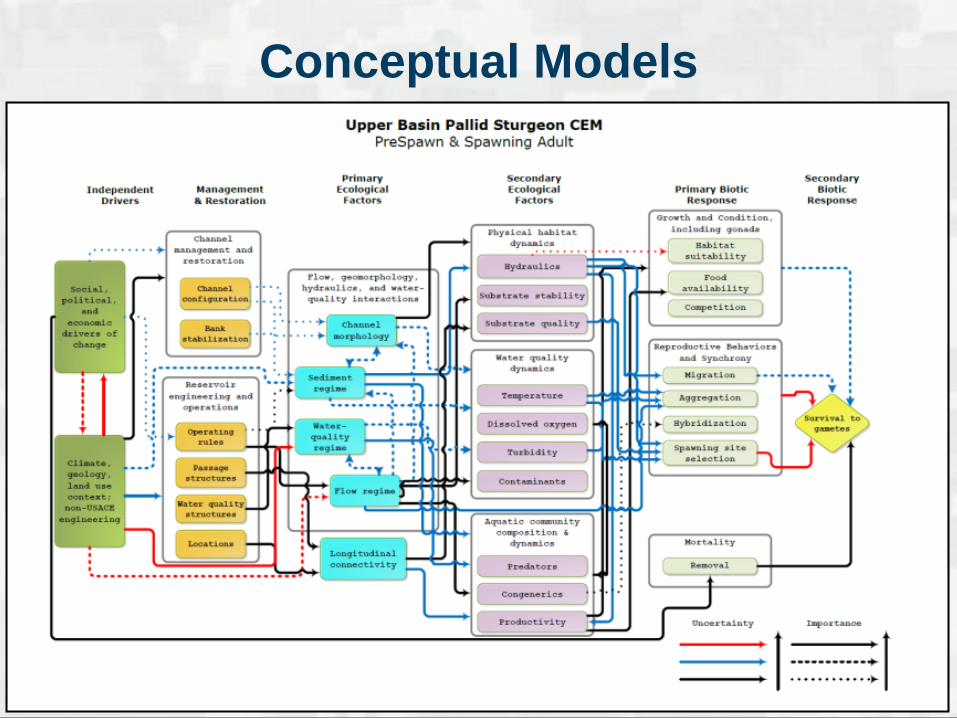
Conceptual Models
Innovative solutions for a safer, better world BUILDING STRONG®
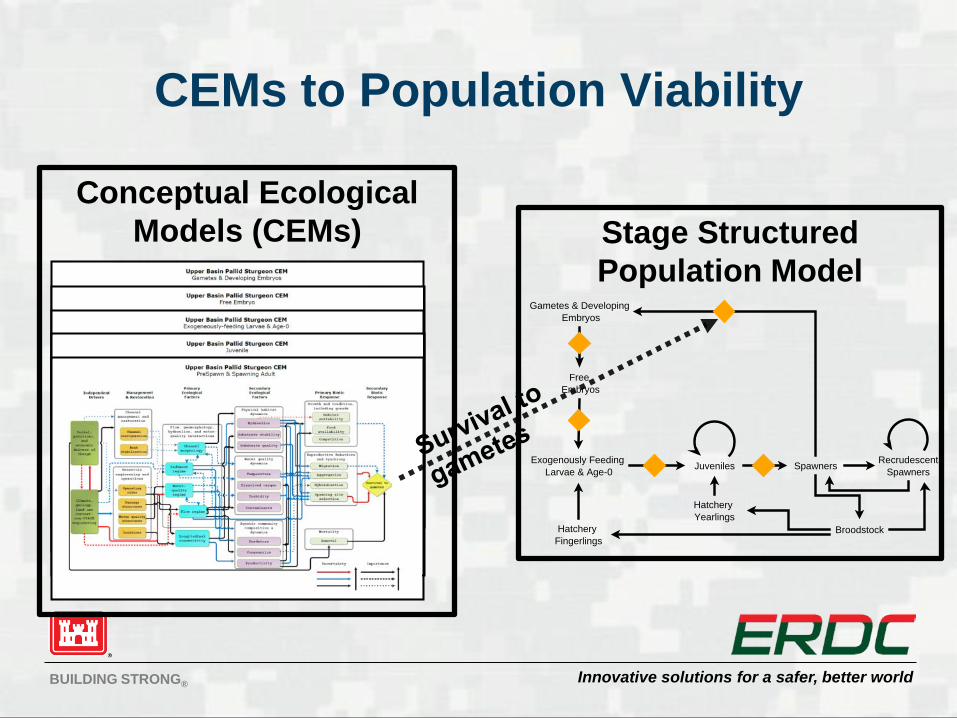
CEMs to Population Viability
Conceptual Ecological Models (CEMs)
Juveniles Spawners RecrudescentSpawners
Broodstock
Gametes & Developing Embryos
Free Embryos
Exogenously Feeding Larvae & Age-0
Hatchery Yearlings
Hatchery Fingerlings
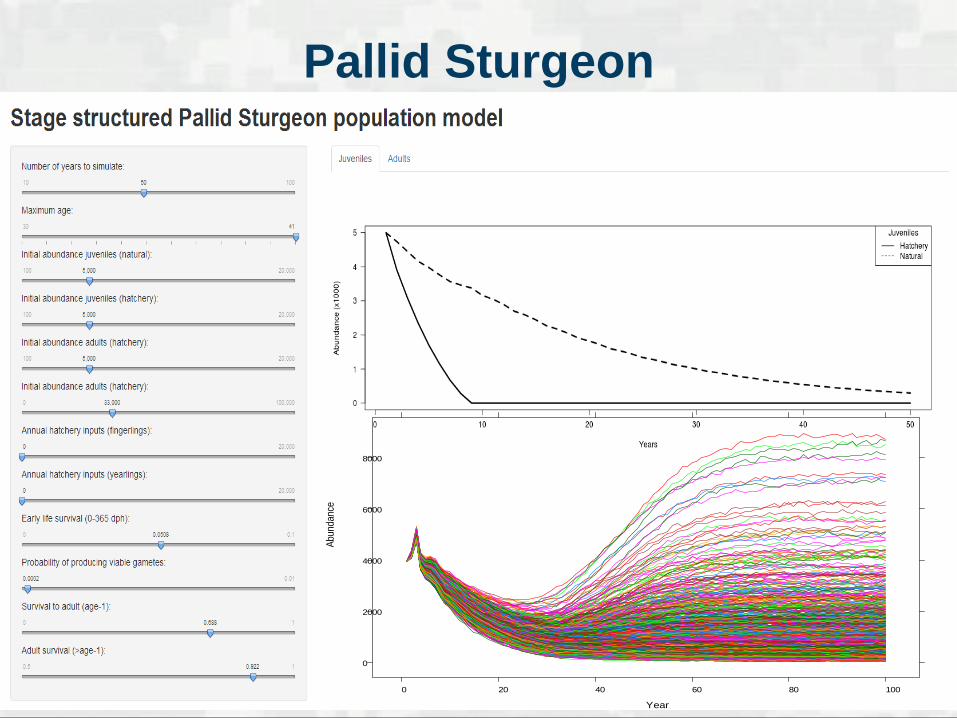
Stage Structured Population Model
Innovative solutions for a safer, better world BUILDING STRONG®
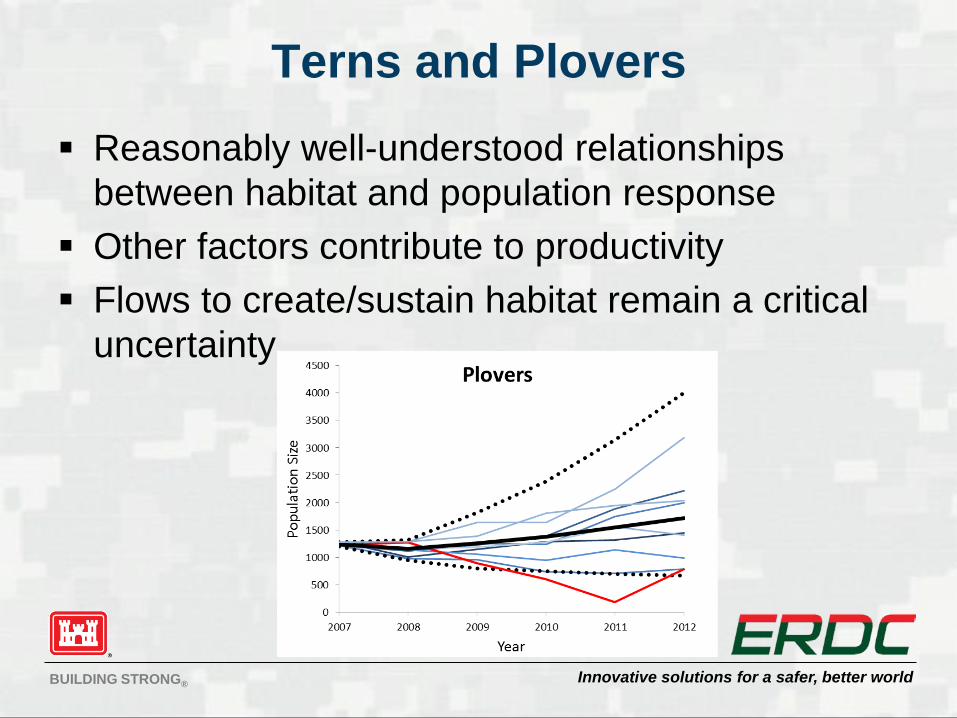
Terns and Plovers Reasonably well-understood relationships
between habitat and population response Other factors contribute to productivity Flows to create/sustain habitat remain a critical
uncertainty
Innovative solutions for a safer, better world BUILDING STRONG®
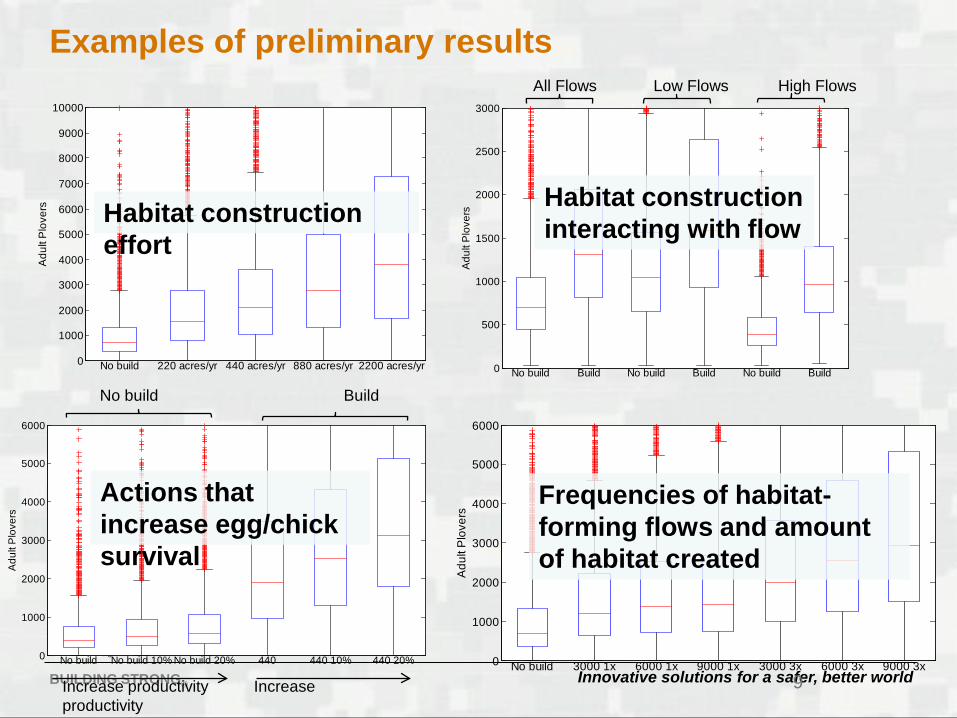
Examples of preliminary results
9
0
1000
2000
3000
4000
5000
6000
7000
8000
9000
10000
No build 220 acres/yr 440 acres/yr 880 acres/yr 2200 acres/yr
Adu
lt P
love
rs
0
500
1000
1500
2000
2500
3000
No build Build No build Build No build Build
Adu
lt P
love
rs
All Flows Low Flows High Flows
0
1000
2000
3000
4000
5000
6000
No build No build 10% No build 20% 440 440 10% 440 20%
Adu
lt P
love
rs
Increase productivity Increase productivity
No build Build
Habitat construction effort
Habitat construction interacting with flow
Actions that increase egg/chick survival
0
1000
2000
3000
4000
5000
6000
No build 3000 1x 6000 1x 9000 1x 3000 3x 6000 3x 9000 3x
Adu
lt P
love
rs
Frequencies of habitat-forming flows and amount of habitat created
Innovative solutions for a safer, better world BUILDING STRONG®
Pallid Sturgeon
Year
Abun
danc
e
0
2000
4000
6000
8000
0 20 40 60 80 100
Innovative solutions for a safer, better world BUILDING STRONG®
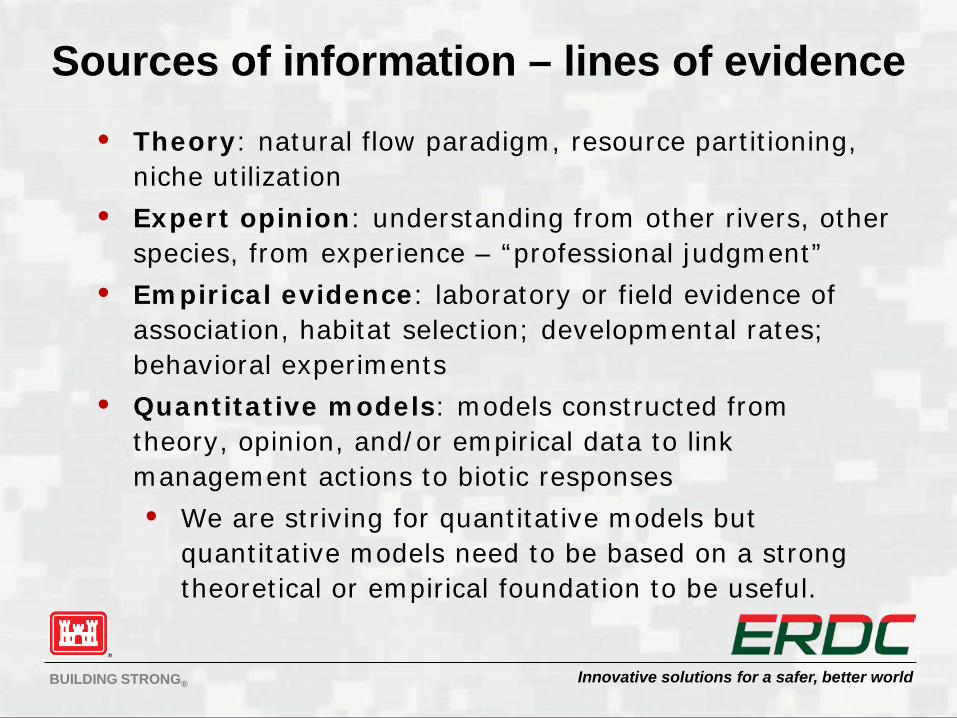
Sources of information – lines of evidence • Theory: natural flow paradigm, resource partitioning,
niche utilization • Expert opinion: understanding from other rivers, other
species, from experience – “professional judgment” • Empirical evidence: laboratory or field evidence of
association, habitat selection; developmental rates; behavioral experiments
• Quantitative models: models constructed from theory, opinion, and/or empirical data to link management actions to biotic responses • We are striving for quantitative models but
quantitative models need to be based on a strong theoretical or empirical foundation to be useful.
Innovative solutions for a safer, better world BUILDING STRONG®
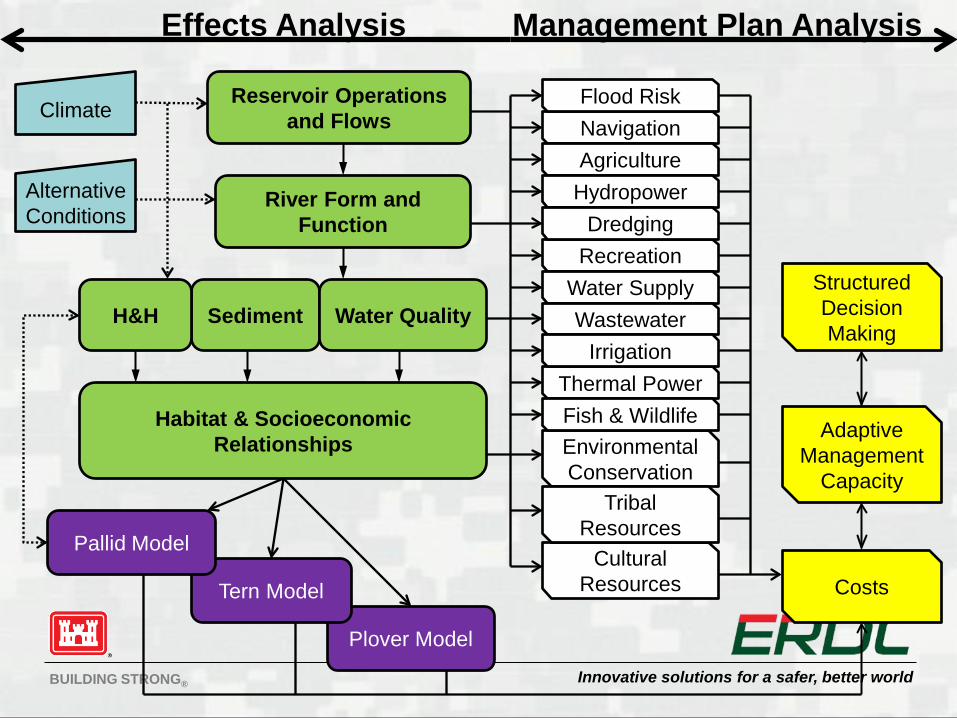
Management Plan Analysis Effects Analysis
Plover Model
Reservoir Operations and Flows
Habitat & Socioeconomic Relationships
Navigation Agriculture
Tern Model
Pallid Model
River Form and Function
Costs
Structured Decision Making
Sediment
Adaptive Management
Capacity Environmental Conservation
Climate
Recreation
Thermal Power
Flood Risk
Alternative Conditions
H&H
Hydropower
Water Quality
Cultural Resources
Dredging
Tribal Resources
Water Supply Wastewater
Irrigation
Fish & Wildlife
Innovative solutions for a safer, better world BUILDING STRONG®
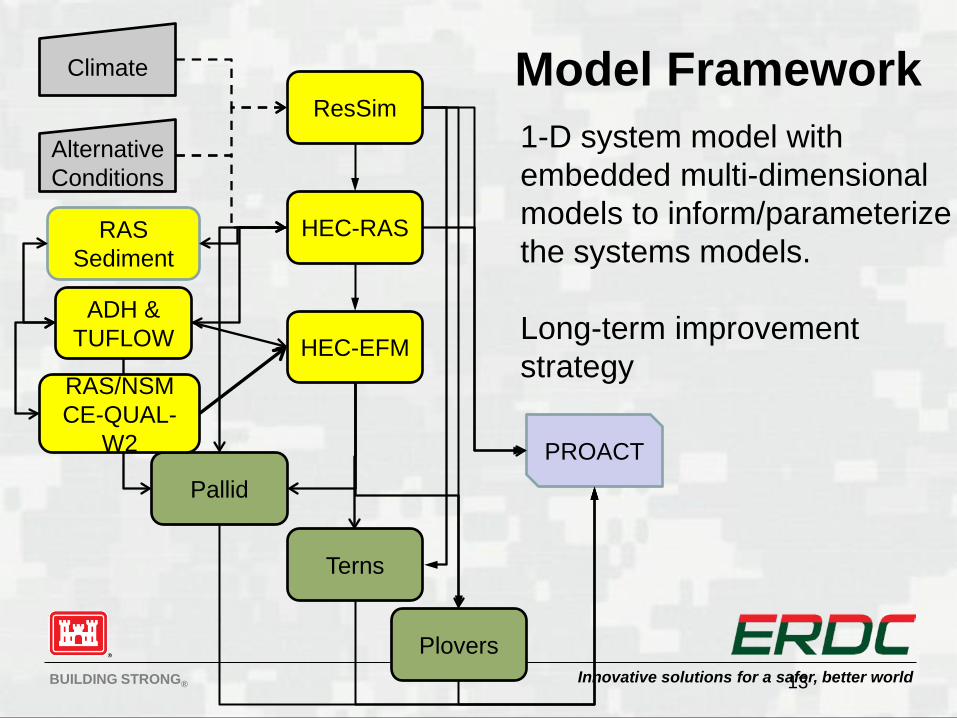
Plovers
ResSim
HEC-EFM
Terns
Pallid
ADH & TUFLOW
HEC-RAS
PROACT
RAS Sediment
13
Climate
Alternative Conditions
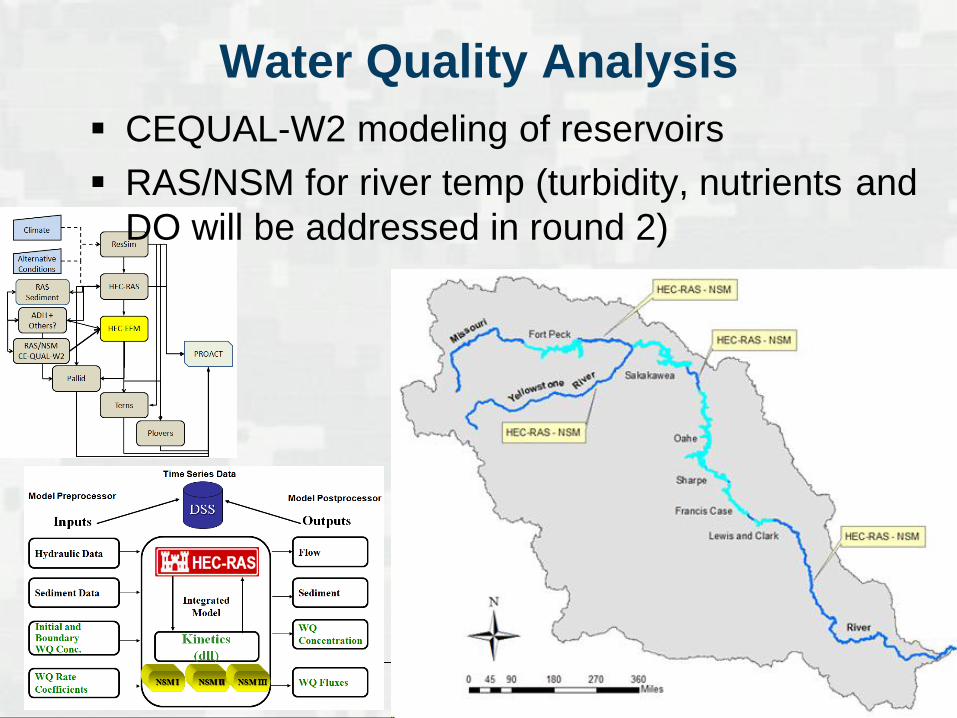
Model Framework 1-D system model with embedded multi-dimensional models to inform/parameterize the systems models. Long-term improvement strategy
RAS/NSM CE-QUAL-
W2
Innovative solutions for a safer, better world BUILDING STRONG®
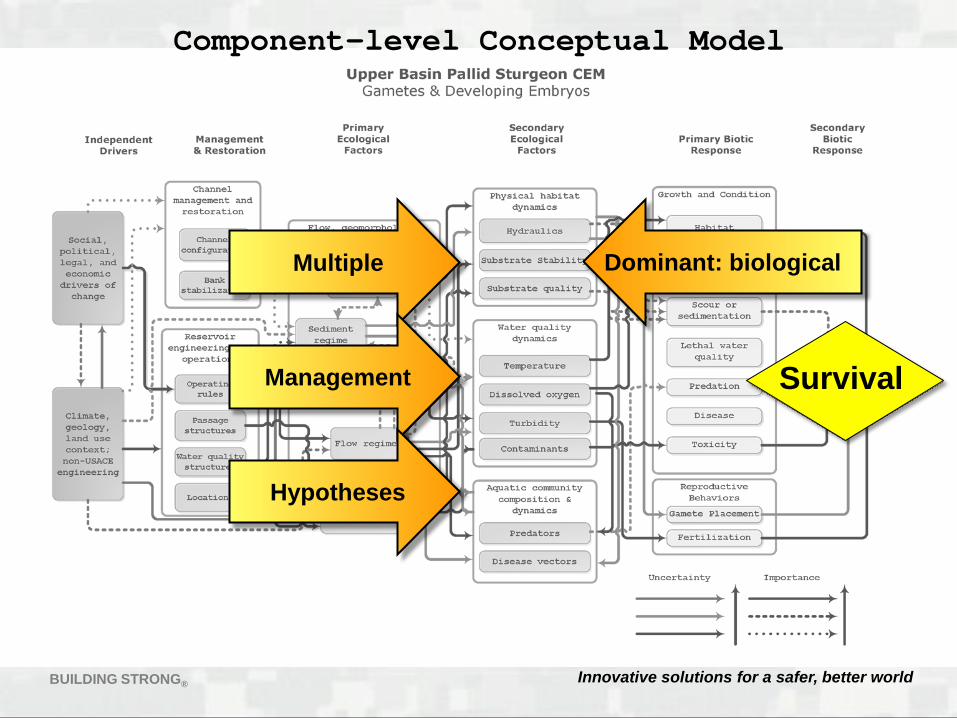
Component-level Conceptual Model
Dominant: biological Multiple
Management
Hypotheses
Survival Survival
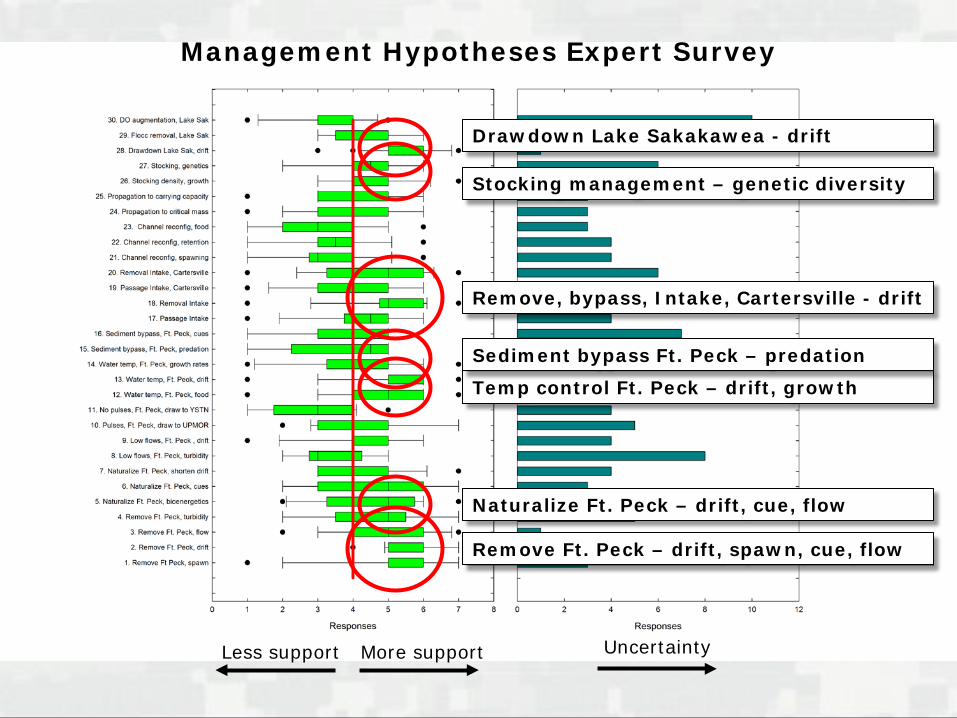
Remove Ft. Peck – drift, spawn, cue, flow
Naturalize Ft. Peck – drift, cue, flow
Temp control Ft. Peck – drift, growth
Sediment bypass Ft. Peck – predation
Remove, bypass, Intake, Cartersville - drift
Stocking management – genetic diversity
Drawdown Lake Sakakawea - drift
Management Hypotheses Expert Survey
More support Less support Uncertainty
Where WhatManagement Hypothesis Model Type
Short Name
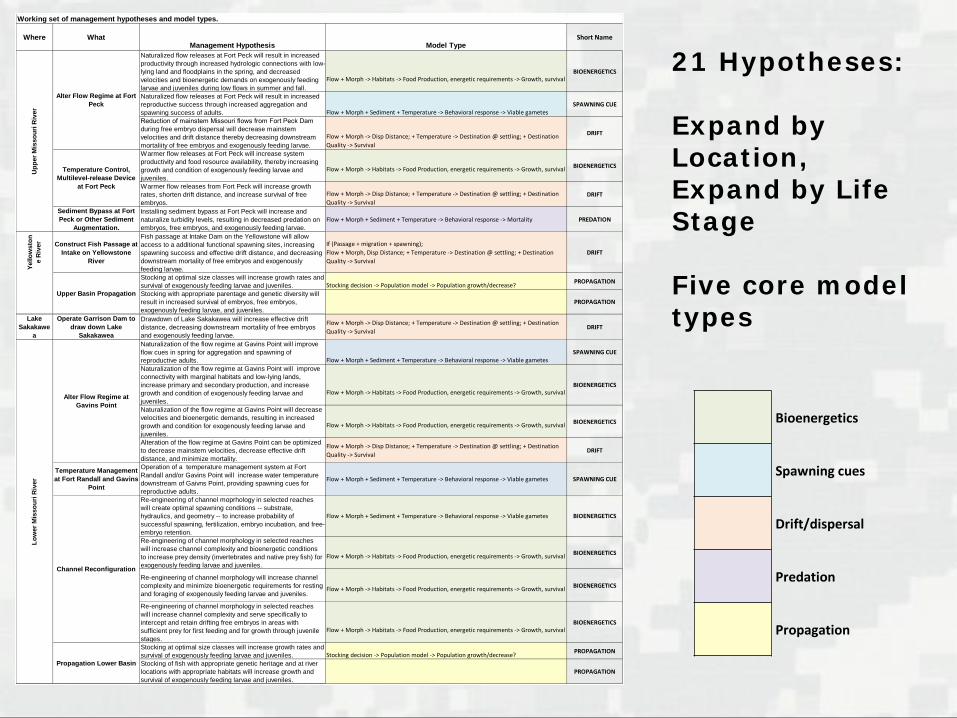
Naturalized flow releases at Fort Peck will result in increased productivity through increased hydrologic connections with low-lying land and floodplains in the spring, and decreased velocities and bioenergetic demands on exogenously feeding larvae and juveniles during low flows in summer and fall.
Flow + Morph -> Habitats -> Food Production, energetic requirements -> Growth, survivalBIOENERGETICS
Naturalized flow releases at Fort Peck will result in increased reproductive success through increased aggregation and spawning success of adults. Flow + Morph + Sediment + Temperature -> Behavioral response -> Viable gametes
SPAWNING CUE
Reduction of mainstem Missouri flows from Fort Peck Dam during free embryo dispersal will decrease mainstem velocities and drift distance thereby decreasing downstream mortaliity of free embryos and exogenously feeding larvae.
Flow + Morph -> Disp Distance; + Temperature -> Destination @ settling; + Destination Quality -> Survival
DRIFT
Warmer flow releases at Fort Peck will increase system productivity and food resource availability, thereby increasing growth and condition of exogenously feeding larvae and juveniles.
Flow + Morph -> Habitats -> Food Production, energetic requirements -> Growth, survival BIOENERGETICS
Warmer flow releases from Fort Peck will increase growth rates, shorten drift distance, and increase survival of free embryos.
Flow + Morph -> Disp Distance; + Temperature -> Destination @ settling; + Destination Quality -> Survival
DRIFT
Sediment Bypass at Fort Peck or Other Sediment
Augmentation.
Installing sediment bypass at Fort Peck will increase and naturalize turbidity levels, resulting in decreased predation on embryos, free embryos, and exogenously feeding larvae.
Flow + Morph + Sediment + Temperature -> Behavioral response -> Mortality PREDATION
Stocking at optimal size classes will increase growth rates and survival of exogenously feeding larvae and juveniles. Stocking decision -> Population model -> Population growth/decrease? PROPAGATION
Stocking with appropriate parentage and genetic diversity will result in increased survival of embryos, free embryos, exogenously feeding larvae, and juveniles.
PROPAGATION
Lake Sakakawe
a
Operate Garrison Dam to draw down Lake
Sakakawea
Drawdown of Lake Sakakawea will increase effective drift distance, decreasing downstream mortaliity of free embryos and exogenously feeding larvae.
Flow + Morph -> Disp Distance; + Temperature -> Destination @ settling; + Destination Quality -> Survival
DRIFT
Naturalization of the flow regime at Gavins Point will improve flow cues in spring for aggregation and spawning of reproductive adults. Flow + Morph + Sediment + Temperature -> Behavioral response -> Viable gametes
SPAWNING CUE
Naturalization of the flow regime at Gavins Point will improve connectivity with marginal habitats and low-lying lands, increase primary and secondary production, and increase growth and condition of exogenously feeding larvae and juveniles.
Flow + Morph -> Habitats -> Food Production, energetic requirements -> Growth, survivalBIOENERGETICS
Naturalization of the flow regime at Gavins Point will decrease velocities and bioenergetic demands, resulting in increased growth and condition for exogenously feeding larvae and juveniles.
Flow + Morph -> Habitats -> Food Production, energetic requirements -> Growth, survival BIOENERGETICS
Alteration of the flow regime at Gavins Point can be optimized to decrease mainstem velocities, decrease effective drift distance, and minimize mortality.
Flow + Morph -> Disp Distance; + Temperature -> Destination @ settling; + Destination Quality -> Survival
DRIFT
Temperature Management at Fort Randall and Gavins
Point
Operation of a temperature management system at Fort Randall and/or Gavins Point will increase water temperature downstream of Gaivns Point, providing spawning cues for reproductive adults.
Flow + Morph + Sediment + Temperature -> Behavioral response -> Viable gametes SPAWNING CUE
Re-engineering of channel moprhology in selected reaches will create optimal spawning conditions -- substrate, hydraulics, and geometry -- to increase probability of successful spawning, fertilization, embryo incubation, and free-embryo retention.
Flow + Morph + Sediment + Temperature -> Behavioral response -> Viable gametes BIOENERGETICS
Re-engineering of channel morphology in selected reaches will increase channel complexity and bioenergetic conditions to increase prey density (invertebrates and native prey fish) for exogenously feeding larvae and juveniles.
Flow + Morph -> Habitats -> Food Production, energetic requirements -> Growth, survival BIOENERGETICS
Re-engineering of channel morphology will increase channel complexity and minimize bioenergetic requirements for resting and foraging of exogenously feeding larvae and juveniles.
Flow + Morph -> Habitats -> Food Production, energetic requirements -> Growth, survival BIOENERGETICS
Re-engineering of channel morphology in selected reaches will increase channel complexity and serve specifically to intercept and retain drifting free embryos in areas with sufficient prey for first feeding and for growth through juvenile stages.
Flow + Morph -> Habitats -> Food Production, energetic requirements -> Growth, survivalBIOENERGETICS
Stocking at optimal size classes will increase growth rates and survival of exogenously feeding larvae and juveniles. Stocking decision -> Population model -> Population growth/decrease? PROPAGATION
Stocking of fish with appropriate genetic heritage and at river locations with appropriate habitats will increase growth and survival of exogenously feeding larvae and juveniles.
PROPAGATION
DRIFT
Working set of management hypotheses and model types.
Temperature Control, Multilevel-release Device
at Fort Peck
Yello
wst
one
Riv
er Construct Fish Passage at Intake on Yellowstone
River
Upp
er M
isso
uri R
iver
Alter Flow Regime at Fort Peck
Low
er M
isso
uri R
iver
Alter Flow Regime at Gavins Point
Channel Reconfiguration
Propagation Lower Basin
If (Passage + migration + spawning);Flow + Morph, Disp Distance; + Temperature -> Destination @ settling; + Destination Quality -> Survival
Upper Basin Propagation
Fish passage at Intake Dam on the Yellowstone will allow access to a additional functional spawning sites, increasing spawning success and effective drift distance, and decreasing downstream mortality of free embryos and exogenously feeding larvae.
Bioenergetics
Spawning cues
Drift/dispersal
Predation
Propagation
21 Hypotheses: Expand by Location, Expand by Life Stage Five core model types
Innovative solutions for a safer, better world BUILDING STRONG®
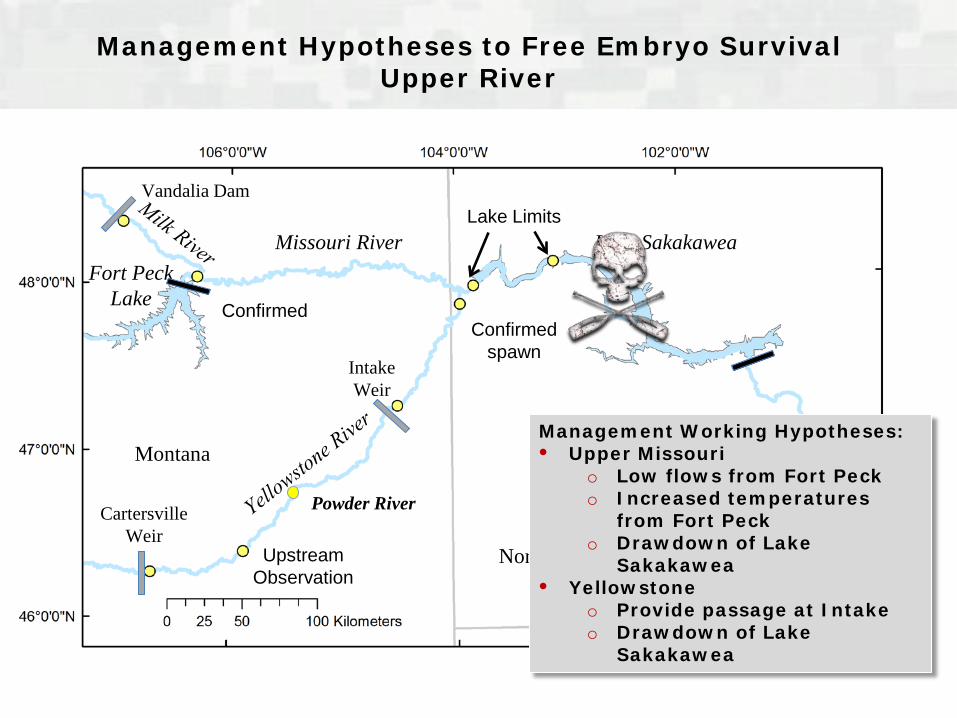
Fort Peck Lake
Lake Sakakawea Missouri River
Lake Oahe
Montana
North Dakota
Intake Weir
Cartersville Weir
Vandalia Dam
Confirmed Confirmed
spawn
Lake Limits
Upstream Observation
Management Hypotheses to Free Embryo Survival Upper River
Management Working Hypotheses: • Upper Missouri
o Low flows from Fort Peck o Increased temperatures
from Fort Peck o Drawdown of Lake
Sakakawea • Yellowstone
o Provide passage at Intake o Drawdown of Lake
Sakakawea
Powder River
Innovative solutions for a safer, better world BUILDING STRONG®
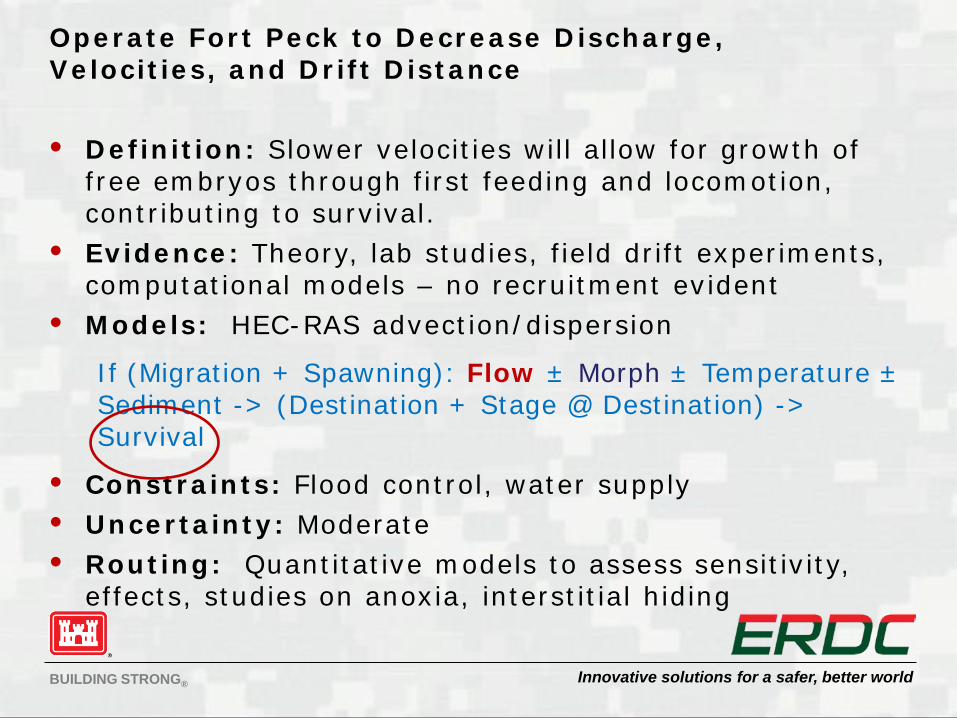
Operate Fort Peck to Decrease Discharge, Velocities, and Drift Distance • Definition: Slower velocities will allow for growth of
free embryos through first feeding and locomotion, contributing to survival.
• Evidence: Theory, lab studies, field drift experiments, computational models – no recruitment evident
• Models: HEC-RAS advection/dispersion
• Constraints: Flood control, water supply • Uncertainty: Moderate • Routing: Quantitative models to assess sensitivity,
effects, studies on anoxia, interstitial hiding
If (Migration + Spawning): Flow ± Morph ± Temperature ± Sediment -> (Destination + Stage @ Destination) -> Survival
Innovative solutions for a safer, better world BUILDING STRONG®
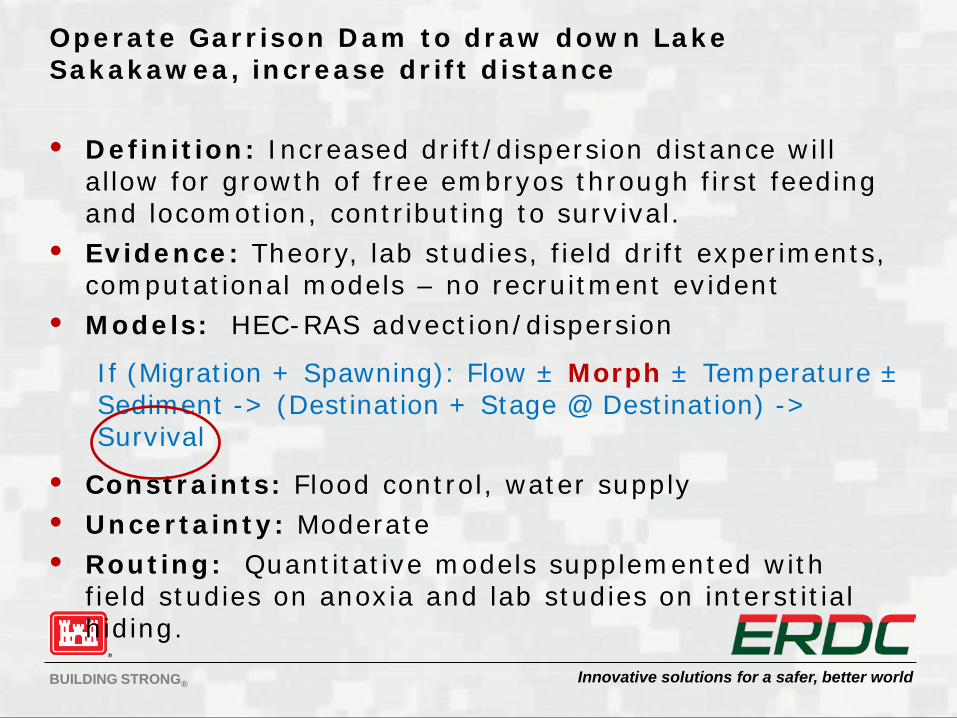
Operate Garrison Dam to draw down Lake Sakakawea, increase drift distance • Definition: Increased drift/dispersion distance will
allow for growth of free embryos through first feeding and locomotion, contributing to survival.
• Evidence: Theory, lab studies, field drift experiments, computational models – no recruitment evident
• Models: HEC-RAS advection/dispersion
• Constraints: Flood control, water supply • Uncertainty: Moderate • Routing: Quantitative models supplemented with
field studies on anoxia and lab studies on interstitial hiding.
If (Migration + Spawning): Flow ± Morph ± Temperature ± Sediment -> (Destination + Stage @ Destination) -> Survival
Innovative solutions for a safer, better world BUILDING STRONG®
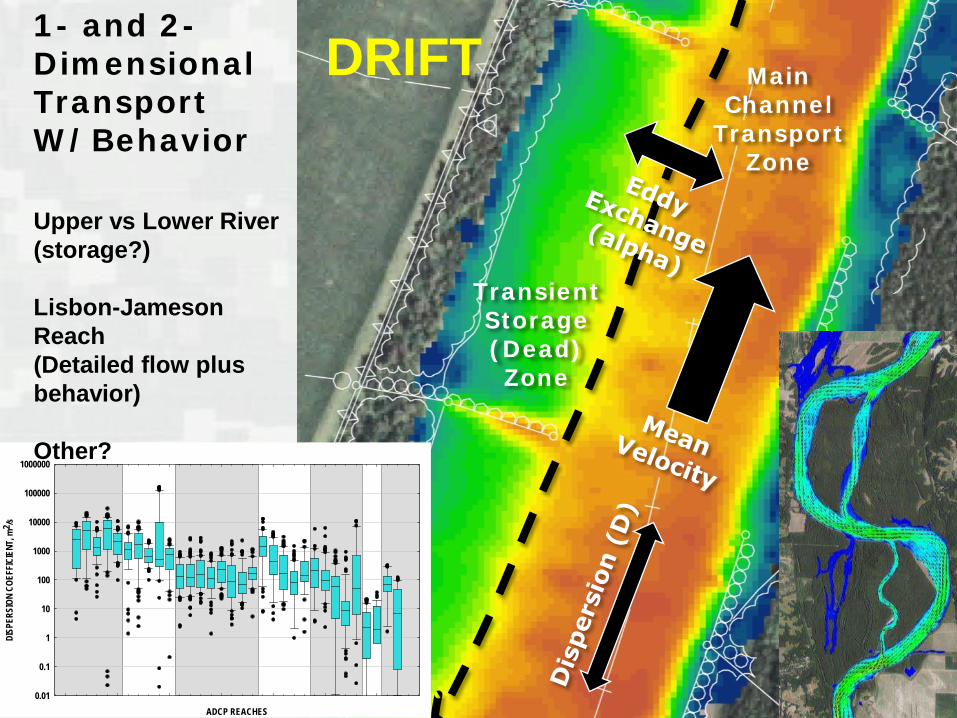
Transient Storage (Dead) Zone
Main Channel
Transport Zone
1- and 2-Dimensional Transport W/Behavior
ADCP REACHES
DISP
ERSI
ON C
OEFF
ICIE
NT, m
2 /s
0.01
0.1
1
10
100
1000
10000
100000
1000000
Upper vs Lower River (storage?) Lisbon-Jameson Reach (Detailed flow plus behavior) Other?
DRIFT
Innovative solutions for a safer, better world BUILDING STRONG®
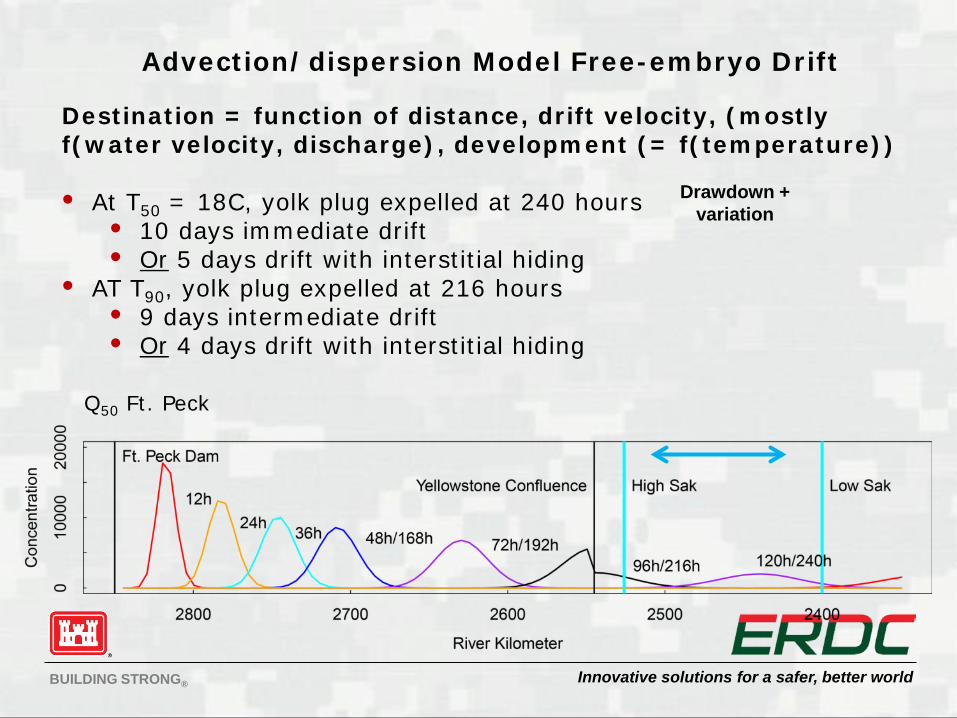
Advection/dispersion Model Free-embryo Drift
Destination = function of distance, drift velocity, (mostly f(water velocity, discharge), development (= f(temperature)) • At T50 = 18C, yolk plug expelled at 240 hours
• 10 days immediate drift • Or 5 days drift with interstitial hiding
• AT T90, yolk plug expelled at 216 hours • 9 days intermediate drift • Or 4 days drift with interstitial hiding
Q50 Ft. Peck
Drawdown + variation
Innovative solutions for a safer, better world BUILDING STRONG®
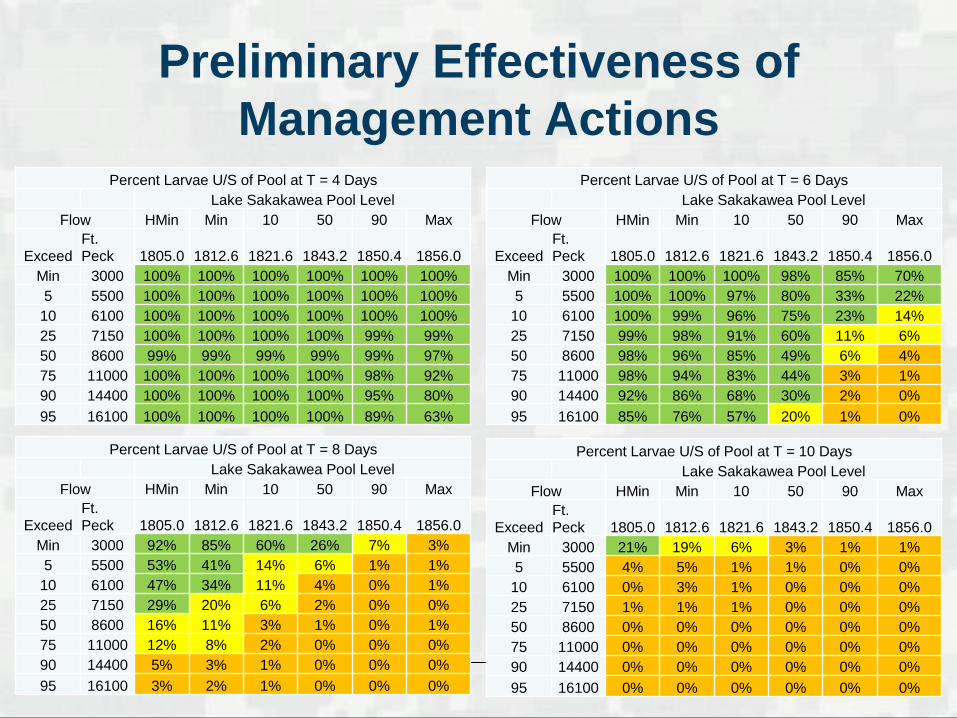
Preliminary Effectiveness of Management Actions
Percent Larvae U/S of Pool at T = 4 Days Lake Sakakawea Pool Level
Flow HMin Min 10 50 90 Max
Exceed Ft. Peck 1805.0 1812.6 1821.6 1843.2 1850.4 1856.0
Min 3000 100% 100% 100% 100% 100% 100% 5 5500 100% 100% 100% 100% 100% 100%
10 6100 100% 100% 100% 100% 100% 100% 25 7150 100% 100% 100% 100% 99% 99% 50 8600 99% 99% 99% 99% 99% 97% 75 11000 100% 100% 100% 100% 98% 92% 90 14400 100% 100% 100% 100% 95% 80% 95 16100 100% 100% 100% 100% 89% 63%
Percent Larvae U/S of Pool at T = 6 Days Lake Sakakawea Pool Level
Flow HMin Min 10 50 90 Max
Exceed Ft. Peck 1805.0 1812.6 1821.6 1843.2 1850.4 1856.0
Min 3000 100% 100% 100% 98% 85% 70% 5 5500 100% 100% 97% 80% 33% 22%
10 6100 100% 99% 96% 75% 23% 14% 25 7150 99% 98% 91% 60% 11% 6% 50 8600 98% 96% 85% 49% 6% 4% 75 11000 98% 94% 83% 44% 3% 1% 90 14400 92% 86% 68% 30% 2% 0% 95 16100 85% 76% 57% 20% 1% 0%
Percent Larvae U/S of Pool at T = 10 Days Lake Sakakawea Pool Level
Flow HMin Min 10 50 90 Max
Exceed Ft. Peck 1805.0 1812.6 1821.6 1843.2 1850.4 1856.0
Min 3000 21% 19% 6% 3% 1% 1% 5 5500 4% 5% 1% 1% 0% 0%
10 6100 0% 3% 1% 0% 0% 0% 25 7150 1% 1% 1% 0% 0% 0% 50 8600 0% 0% 0% 0% 0% 0% 75 11000 0% 0% 0% 0% 0% 0% 90 14400 0% 0% 0% 0% 0% 0% 95 16100 0% 0% 0% 0% 0% 0%
Percent Larvae U/S of Pool at T = 8 Days Lake Sakakawea Pool Level
Flow HMin Min 10 50 90 Max
Exceed Ft. Peck 1805.0 1812.6 1821.6 1843.2 1850.4 1856.0
Min 3000 92% 85% 60% 26% 7% 3% 5 5500 53% 41% 14% 6% 1% 1%
10 6100 47% 34% 11% 4% 0% 1% 25 7150 29% 20% 6% 2% 0% 0% 50 8600 16% 11% 3% 1% 0% 1% 75 11000 12% 8% 2% 0% 0% 0% 90 14400 5% 3% 1% 0% 0% 0% 95 16100 3% 2% 1% 0% 0% 0%
Innovative solutions for a safer, better world BUILDING STRONG®
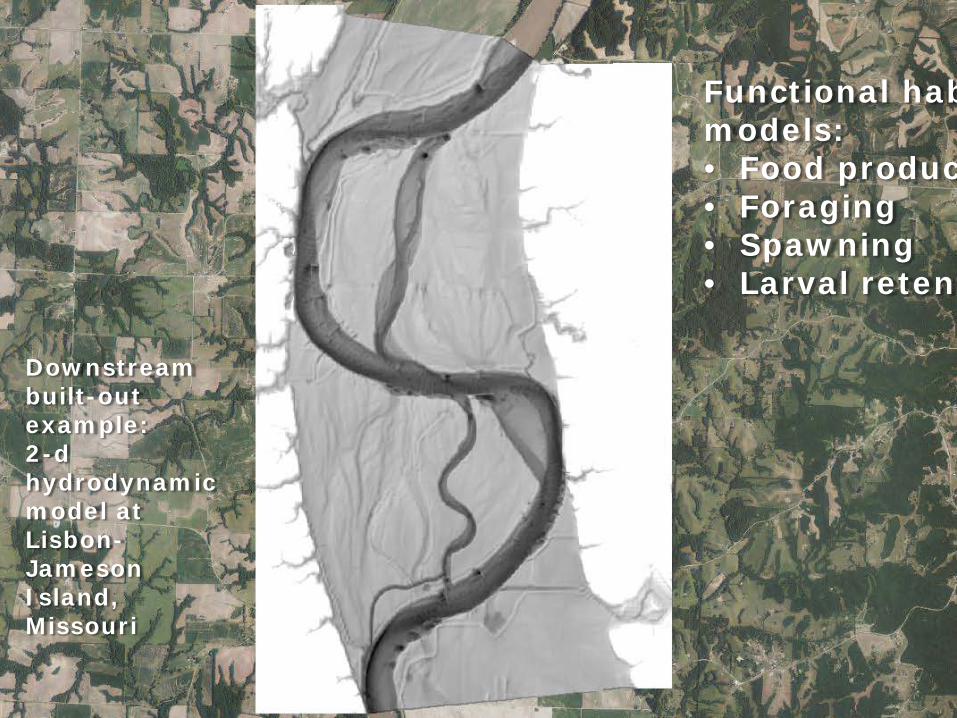
Downstream built-out example: 2-d hydrodynamic model at Lisbon-Jameson Island, Missouri
Functional hab models: • Food produc • Foraging • Spawning • Larval retent
Innovative solutions for a safer, better world BUILDING STRONG®
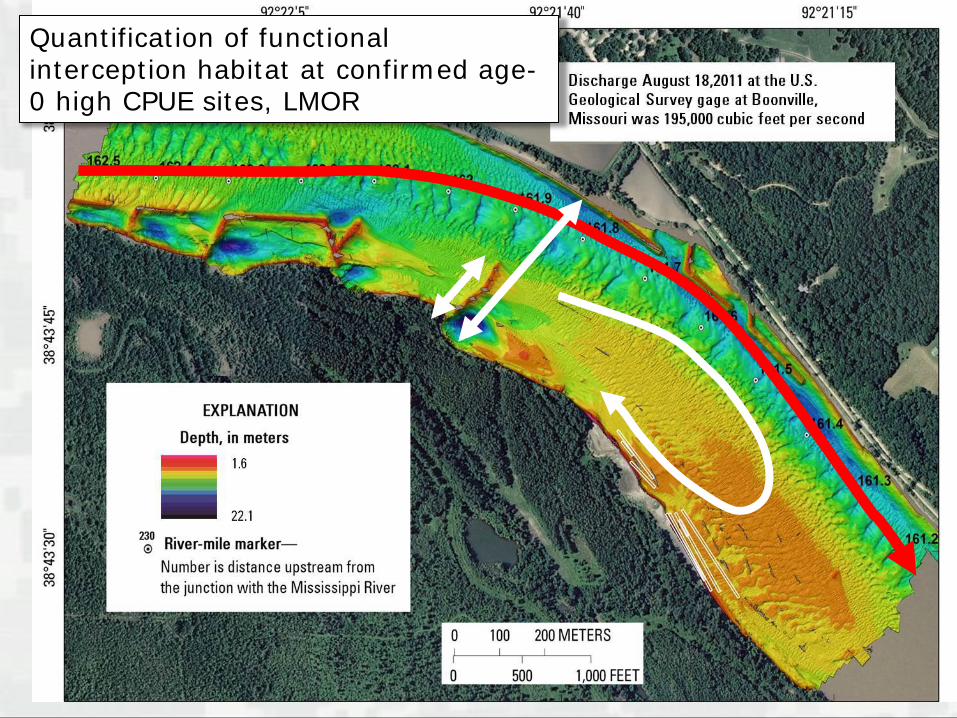
Quantification of functional interception habitat at confirmed age-0 high CPUE sites, LMOR
Innovative solutions for a safer, better world BUILDING STRONG®
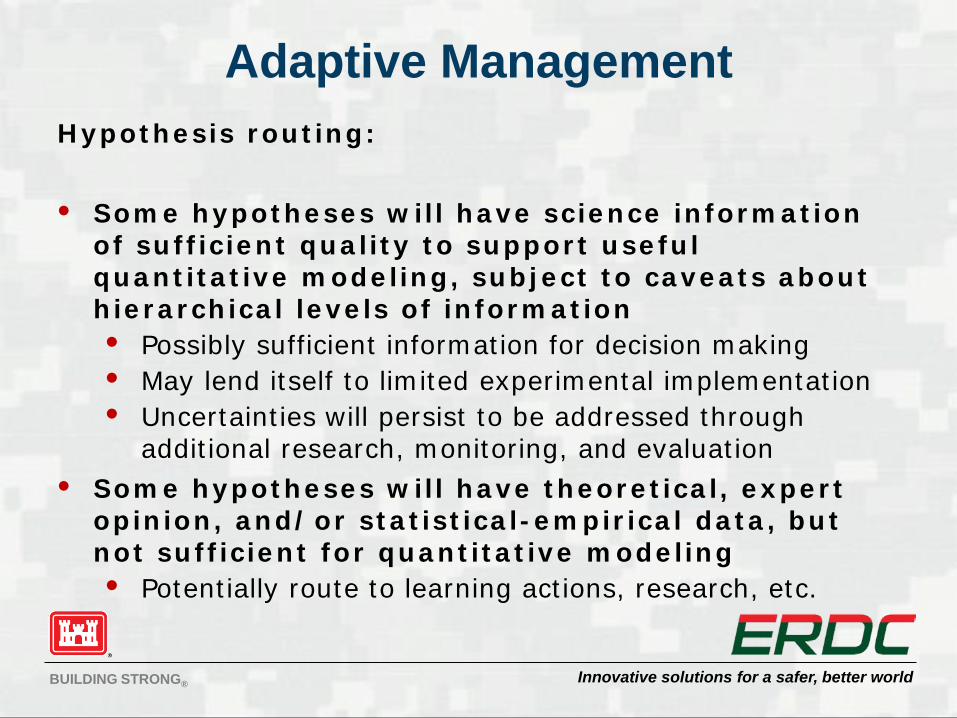
Adaptive Management Hypothesis routing: • Some hypotheses will have science information
of sufficient quality to support useful quantitative modeling, subject to caveats about hierarchical levels of information • Possibly sufficient information for decision making • May lend itself to limited experimental implementation • Uncertainties will persist to be addressed through
additional research, monitoring, and evaluation • Some hypotheses will have theoretical, expert
opinion, and/or statistical-empirical data, but not sufficient for quantitative modeling • Potentially route to learning actions, research, etc.
Innovative solutions for a safer, better world BUILDING STRONG®
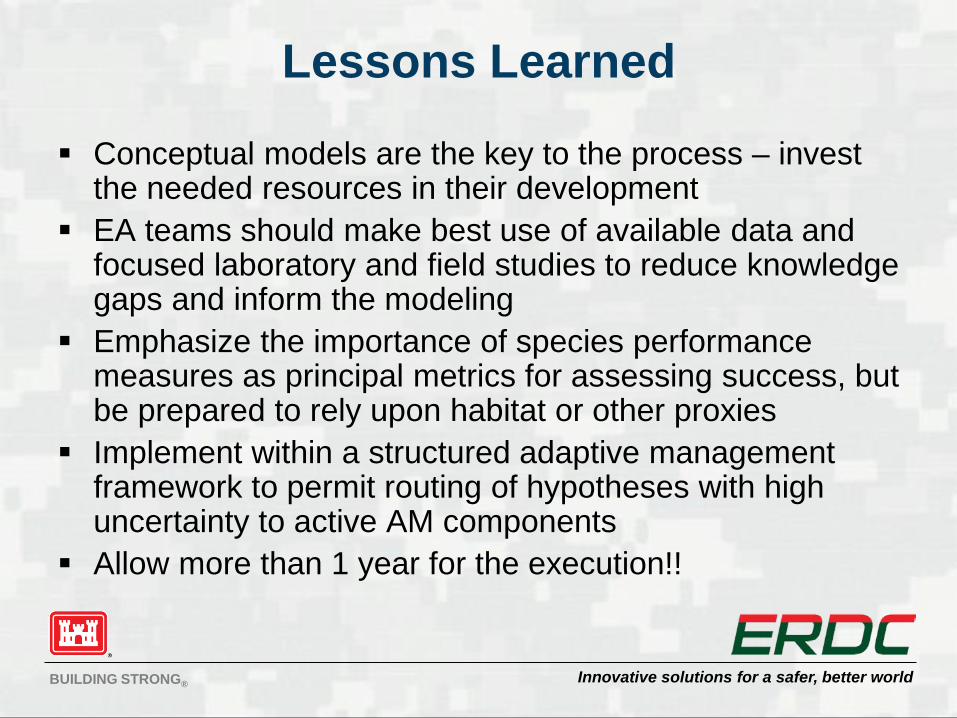
Lessons Learned
Conceptual models are the key to the process – invest the needed resources in their development
EA teams should make best use of available data and focused laboratory and field studies to reduce knowledge gaps and inform the modeling
Emphasize the importance of species performance measures as principal metrics for assessing success, but be prepared to rely upon habitat or other proxies
Implement within a structured adaptive management framework to permit routing of hypotheses with high uncertainty to active AM components
Allow more than 1 year for the execution!!

Innovative solutions for a safer, better world BUILDING STRONG®
Questions?
Remaining slides are as needed for Q&A
Innovative solutions for a safer, better world BUILDING STRONG®
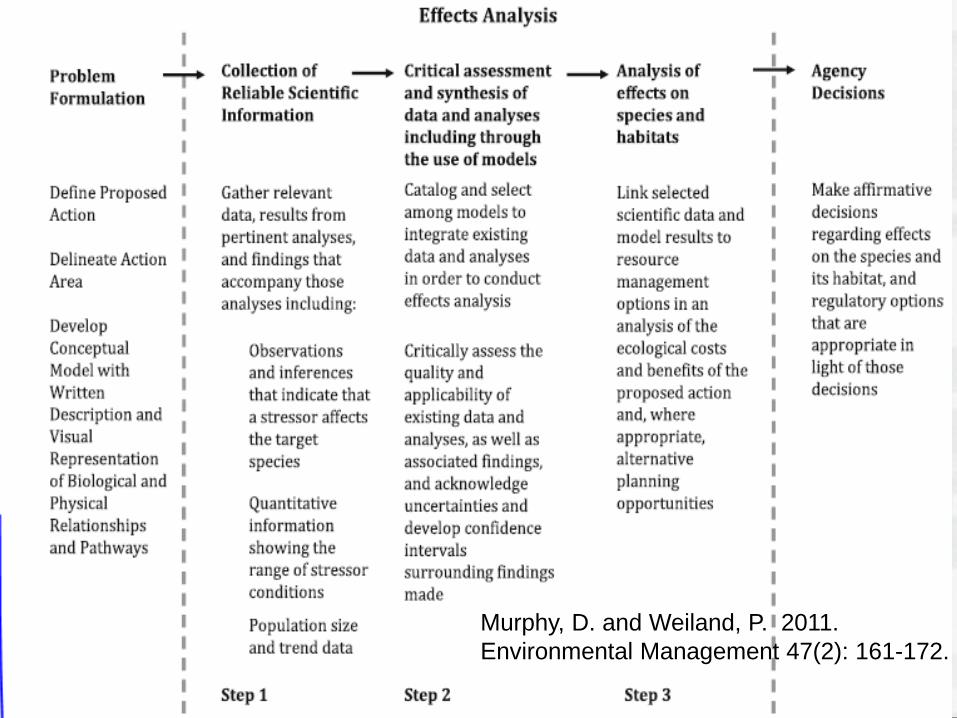
Approach
Murphy, D. and Weiland, P. 2011. Environmental Management 47(2): 161-172.
Innovative solutions for a safer, better world BUILDING STRONG® 29
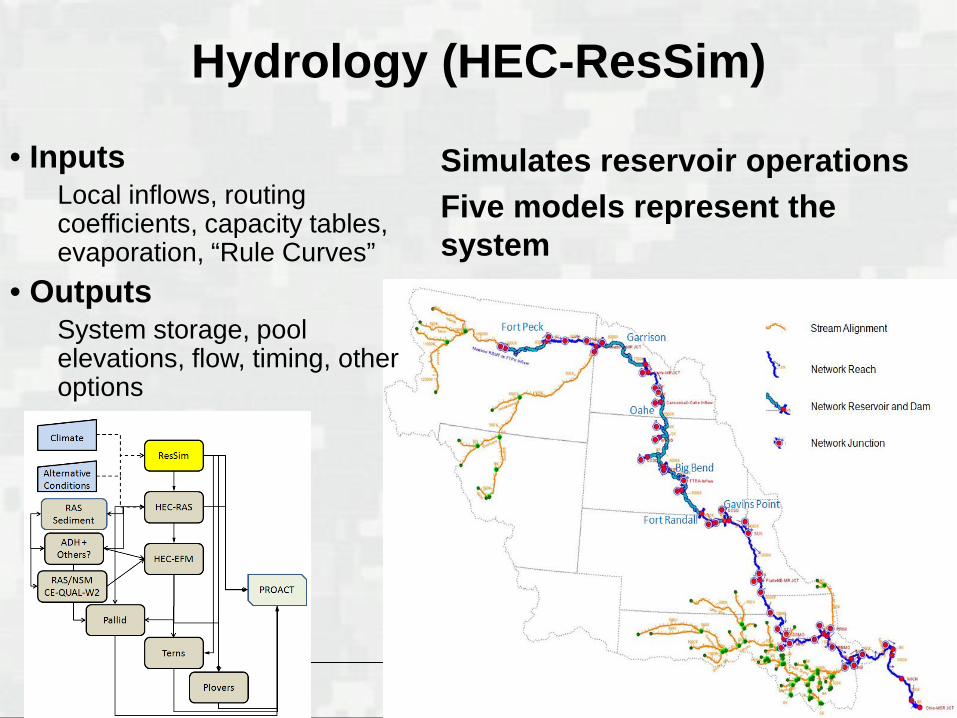
• Inputs Local inflows, routing coefficients, capacity tables, evaporation, “Rule Curves”
• Outputs System storage, pool elevations, flow, timing, other options
Hydrology (HEC-ResSim)
Simulates reservoir operations Five models represent the system
Innovative solutions for a safer, better world BUILDING STRONG®
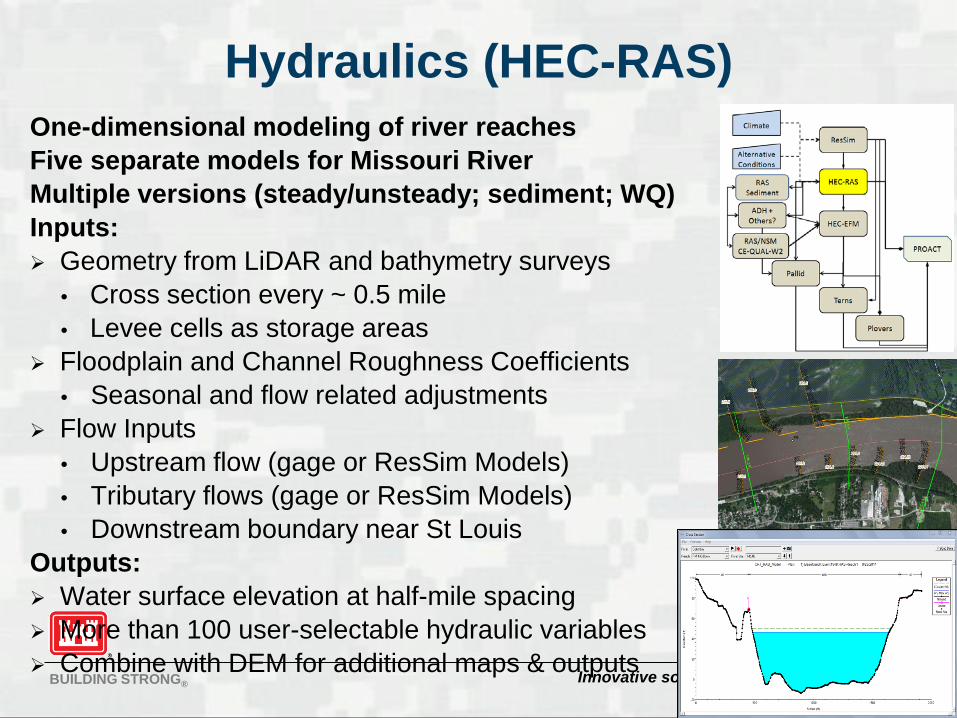
Hydraulics (HEC-RAS) One-dimensional modeling of river reaches Five separate models for Missouri River Multiple versions (steady/unsteady; sediment; WQ) Inputs: Geometry from LiDAR and bathymetry surveys
• Cross section every ~ 0.5 mile • Levee cells as storage areas
Floodplain and Channel Roughness Coefficients • Seasonal and flow related adjustments
Flow Inputs • Upstream flow (gage or ResSim Models) • Tributary flows (gage or ResSim Models) • Downstream boundary near St Louis
Outputs: Water surface elevation at half-mile spacing More than 100 user-selectable hydraulic variables Combine with DEM for additional maps & outputs
Innovative solutions for a safer, better world BUILDING STRONG®
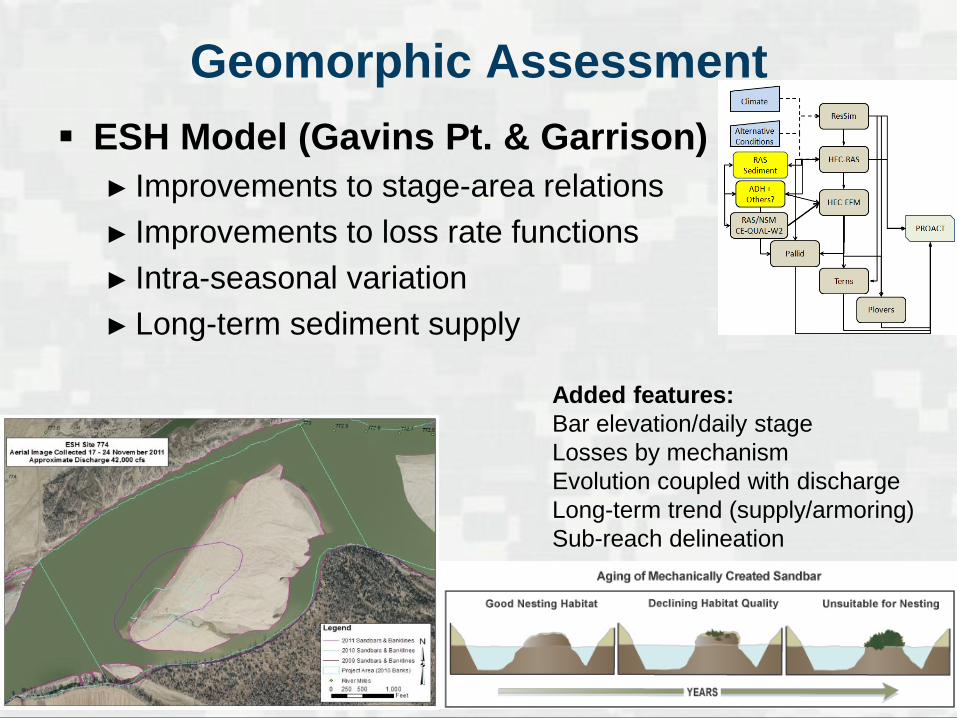
Geomorphic Assessment ESH Model (Gavins Pt. & Garrison)
► Improvements to stage-area relations ► Improvements to loss rate functions ► Intra-seasonal variation ► Long-term sediment supply
Added features: Bar elevation/daily stage Losses by mechanism Evolution coupled with discharge Long-term trend (supply/armoring) Sub-reach delineation
Innovative solutions for a safer, better world BUILDING STRONG®
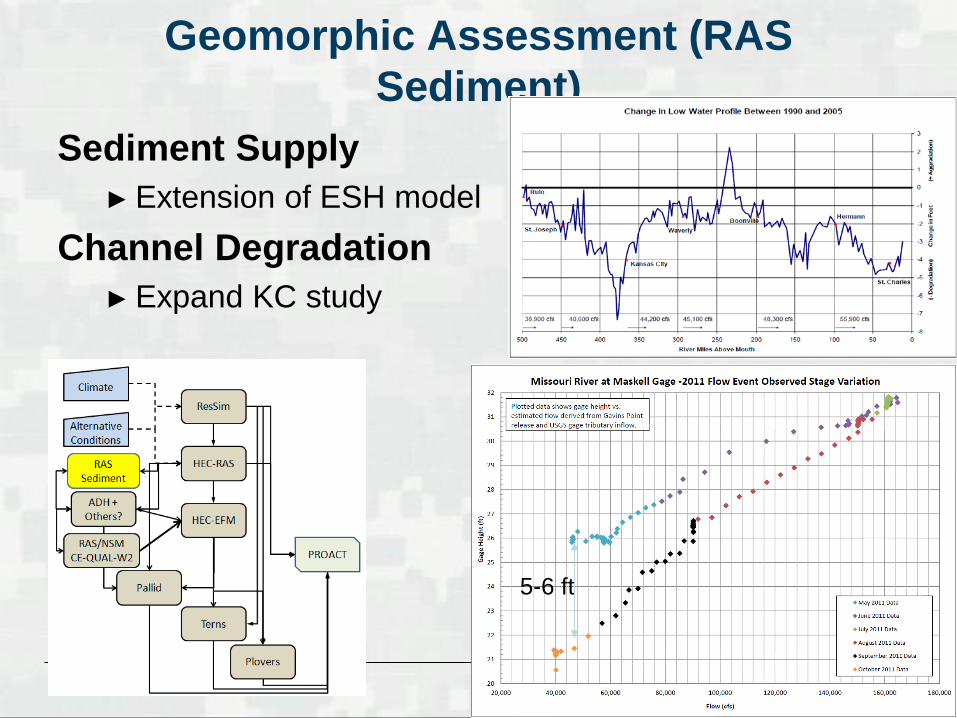
Geomorphic Assessment (RAS Sediment)
Sediment Supply ► Extension of ESH model
Channel Degradation ► Expand KC study
5-6 ft

Innovative solutions for a safer, better world BUILDING STRONG®
Geomorphic Assessment Shallow Water Habitat Evolution
► Primarily a 2-D problem, solved with nested 2-D model analyses within a broader 1-D framework
► Reaches include Deer Island (AdH), Decatur Bend (AdH/Sed), Hamburg Bend (AdH/Sed), and Lisbon-Jameson (TUFLOW)
► See later slides for drift studies
Innovative solutions for a safer, better world BUILDING STRONG® 34
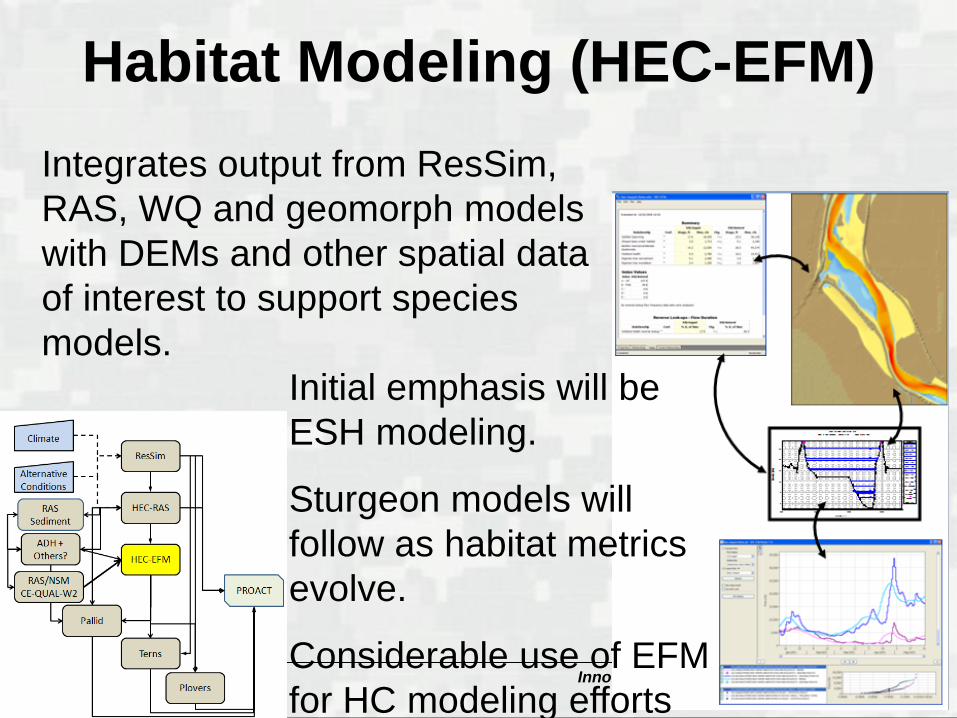
Habitat Modeling (HEC-EFM) Integrates output from ResSim, RAS, WQ and geomorph models with DEMs and other spatial data of interest to support species models.
Initial emphasis will be ESH modeling.
Sturgeon models will follow as habitat metrics evolve.
Considerable use of EFM for HC modeling efforts
Innovative solutions for a safer, better world BUILDING STRONG®
Water Quality Analysis CEQUAL-W2 modeling of reservoirs RAS/NSM for river temp (turbidity, nutrients and
DO will be addressed in round 2)
Innovative solutions for a safer, better world BUILDING STRONG®
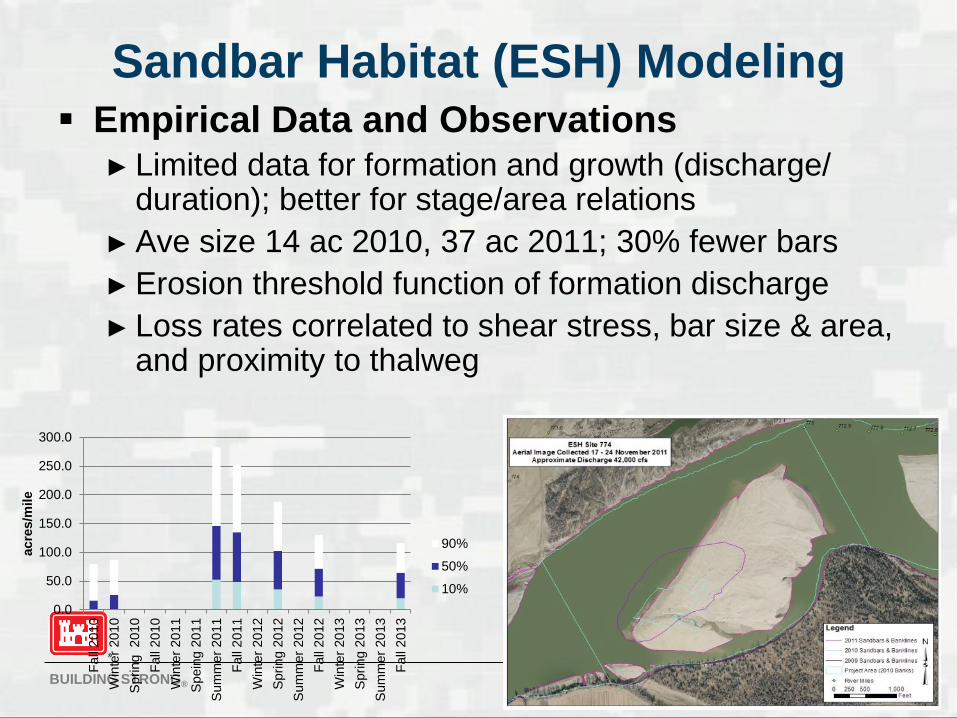
Sandbar Habitat (ESH) Modeling Empirical Data and Observations
► Limited data for formation and growth (discharge/ duration); better for stage/area relations
► Ave size 14 ac 2010, 37 ac 2011; 30% fewer bars ► Erosion threshold function of formation discharge ► Loss rates correlated to shear stress, bar size & area,
and proximity to thalweg
0.0
50.0
100.0
150.0
200.0
250.0
300.0
Fall
2010
Win
ter 2
010
Spr
ing
201
0Fa
ll 20
10W
inte
r 201
1S
pein
g 20
11S
umm
er 2
011
Fall
2011
Win
ter 2
012
Spr
ing
2012
Sum
mer
201
2Fa
ll 20
12W
inte
r 201
3S
prin
g 20
13S
umm
er 2
013
Fall
2013
acre
s/m
ile
90%
50%
10%
Innovative solutions for a safer, better world BUILDING STRONG®
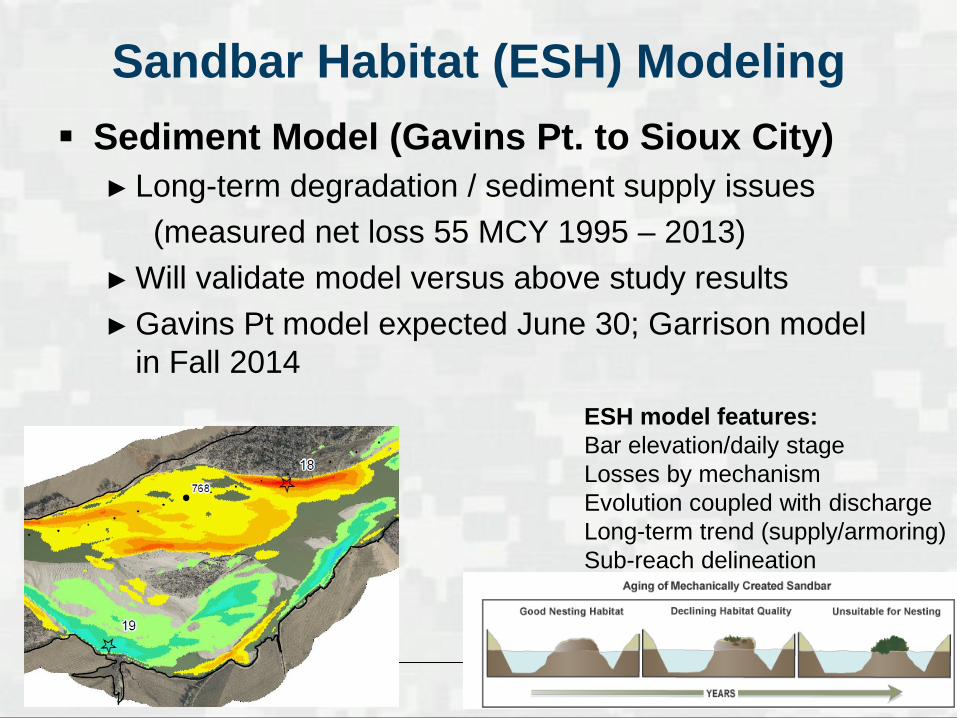
Sandbar Habitat (ESH) Modeling Sediment Model (Gavins Pt. to Sioux City)
► Long-term degradation / sediment supply issues (measured net loss 55 MCY 1995 – 2013) ► Will validate model versus above study results ► Gavins Pt model expected June 30; Garrison model
in Fall 2014 ESH model features: Bar elevation/daily stage Losses by mechanism Evolution coupled with discharge Long-term trend (supply/armoring) Sub-reach delineation