Embed Size (px)
Citation preview
MDRC Working Papers on Research Methodology
Conducting Classroom Observations in First Things First Schools
Angela Estacion Teresa McMahon
Janet Quint
with
Bernice Melamud LaFleur Stephens
June 2004

Principal funding for First Things First comes from the Institute of Education Sciences, U.S. Department of Education. Additional support to supplement the core project comes from the Ford Foundation, the Bill and Melinda Gates Foundation, the William T. Grant Foundation, and the Ewing Marion Kauffman Foundation. A grant from the Pew Charitable Trusts for MDRC’s research methodology initiatives was an important source of funding for the Class-room Observation Study.
Dissemination of MDRC publications is also supported by the following foundations that help fi-nance MDRC’s public policy outreach and expanding efforts to communicate the results and impli-cations of our work to policymakers, practitioners, and others: The Atlantic Philanthropies; the Al-coa, Ambrose Monell, Bristol-Myers Squibb, Fannie Mae, Ford, Grable, and Starr Foundations; and the Open Society Institute.
The findings and conclusions in this report do not necessarily represent the official positions or poli-cies of the funders.
For information about MDRC and copies of our publications, see our Web site: www.mdrc.org.
Copyright © 2004 by MDRC. All rights reserved.
-iii-
Contents List of Tables and Figures v Acknowledgments vii Introduction 1 Elements of Effective Teaching and Learning 4 The Methodology of the Classroom Observation Study 9 Study Findings 17 Implications for Improving Instruction and Research on Instruction 22 Appendix A: Data Collection Instruments 41 Appendix B: Post-Coding the Running Record 53 Appendix C: Supplementary Tables 63 References 89 Publications on Scaling Up First Things First 91

-v-
List of Tables and Figures Table 1 Bloom’s Taxonomy: Cognitive Processes and Types of Knowledge 24
2 Strategies Associated with Teaching for Understanding 27
3 Strategies Associated with Pressing for Understanding 29
4 Classroom Observation Instruments 31
5 Number of Classes Observed, by Site, Implementation Year, and Type of Class Studied 32
6 Teacher’s Classroom Activity Level 33
Findings by Implementation Year and Type of Class Studied
7 Active and Other Learning Opportunities Provided to Students 34
8 Opportunities for Student Interaction in Learning 35
9 Challenging Learning Objectives 36
10 Modeling and Requiring Students to Demonstrate Cognitive and Metacognitive Strategies 37
Findings by Implementation Year, Group, Site, and Type of Class Studied
C.1 The Physical Environment of the Study Classrooms 64
C.2 The Psychological Climate of the Classroom 67
C.3 Teacher’s Classroom Activity Level 70
C.4 Active and Other Learning Opportunities Provided to Students 73
C.5 Opportunities for Student Interaction in Learning 79
C.6 Challenging Learning Objectives 82
C.7 Modeling and Requiring Students to Demonstrate Cognitive and Metacognitive Strategies 85 Figure 1 Average Class Size: Number Enrolled and Number Attending 38
2 Seating Arrangements in the Study Classrooms 39
3 Opportunities for Student Interaction 40

-vii-
Acknowledgments
Principal funding for First Things First comes from the Institute of Education Sci-ences, U.S. Department of Education. Additional support to supplement the core project comes from The Ford Foundation, the Bill and Melinda Gates Foundation, the William T. Grant Foundation, and the Ewing Marion Kauffman Foundation. The Classroom Observation Study was partially funded by the Pew Charitable Trusts, through a grant for MDRC’s re-search methodology initiative.
In addition, the authors wish to thank a number of individuals whose participation and assistance made this effort possible. First and foremost, we would like to thank the dozens of First Things First teachers who made their classroom practice available to us for observation. We are incredibly grateful. We also want to thank our hard-working, thoughtful on-site re-searchers for their diligence and persistence in conducting the observations. Dr. Maria Isabel Leal and Marianne Wilson did much of the heavy lifting, especially during the first year of the study. Dr. C. Hines Cronin, Cactus Calderas, and Thelma Collins also made substantial contri-butions to the effort.
The methodology for this study was informed greatly by Dr. Phyllis Blumenfeld of the University of Michigan, who familiarized us with many of the pedagogical concepts that are central to our study and who helped train our observers in the use of the Running Record methodology. She and Dr. Phyllis Clay participated in numerous teleconferences that helped us develop and then refine our coding strategies. Dr. Clay also designed many of the close-ended instruments. In addition, Dr. William Moore gave important support to the effort at a critical juncture.
Data were entered and checked by MDRC staff under the eagle eye of Shirley James. We owe thanks to Arthur Chachuna for organizing all the bits of data into readable groupings. Vannett Davy assisted in the preparation of the manuscript. Fred Doolittle provided encour-agement throughout.
The Authors

-1-
Introduction The “No Child Left Behind” law is the latest educational initiative to emphasize the im-
portance of providing all students — regardless of socioeconomic status, race, or disabilities — the opportunity to excel. Too often, less is expected of disadvantaged students. In keeping with these lower expectations, drill and practice of basic skills often takes precedence over use of advanced skills. Disadvantaged students are more likely to be asked to practice vocabulary, number facts, and the mechanics of writing than their more advantaged counterparts, whose curricula are more likely to focus on skills such as problem-solving, inquiry, or original com-munication within a context (Means et al., 1993). Yet, if all students are to excel in today’s eco-nomic environment they need to be able to work in teams, think critically and strategically to solve problems, and understand the importance of lifelong learning (Carnevale, Gainer & Schultz, 1990; Eurich, 1990; NCEE, 1989; 1990; SCANS, 1991).
This working paper presents findings from a classroom observation study conducted as part of a larger study of First Things First, a whole-school reform model that was developed by the Institute for Research and Reform in Education (IRRE) and originally mounted in Kansas City, Kansas. With support from the U.S. Department of Education and several foundations, the reform has subsequently been expanded through the Scaling Up First Things First demonstra-tion.1 IRRE provides oversight and technical assistance to the expansion sites, while MDRC is evaluating the initiative’s implementation and effects.
The high schools and middle schools participating in the expansion effort were phased in over a two-year period, in two groups. Eight schools — located in the Riverview Gardens School District in suburban St. Louis County, MO; Greenville and Shaw, MS, in the Mississippi Delta; and Houston, TX — began planning for the initiative in the 2000-2001 school year, began opera-tions in 2001-2002, and continued with a second implementation year in 2002-2003. The two high schools in Greenville subsequently merged, so that there are now seven “Group I” schools. Five “Group II” schools — all located in Houston — began planning in 2001-2002 and started imple-mentation in 2002-2003. At the demonstration’s inception, low levels of academic achievement and large numbers of non-white, low-income students characterized all the schools.
The observational study took place between the spring of 2001 and the spring of 2003 and entailed observations in 427 English/language arts and math classes. 2 The study includes observa-
1For further information about the First Things First model as well as the Scaling Up First Things First Demonstration and its early implementation, see IRRE, 2000a, Quint, 2002, and Quint, Byndloss, and Mela-mud, 2003.
2The decision was made to restrict observations to language arts and math classes because students must acquire reading, writing, and mathematical skills not only to complete high school but to succeed in postsec-
(continued)
-2-
tions from 10 of the 12 schools in Groups I and II.3 Data from the First Things First planning year and two years of program implementation are available for the Group I schools, while data from the planning year and one implementation year are available for the Group II schools.
IRRE has recognized the critical importance of improving instruction in order to in-crease student achievement. The organization has addressed this issue both in a white paper on the topic (IRRE, 2000b) and in the technical assistance it provides to schools participating in the initiative.4 The observational study is grounded in ideas about effective instruction contained in that white paper and elsewhere.5
A major goal of the observational study is to understand whether and how instructional practices changed over time with the schools’ involvement in the First Things First reform. Specifically, the study seeks to determine the extent to which teachers increased their use of instructional strategies that enhance student learning. In our analysis, the First Things First planning year serves as a baseline against which subsequent changes are measured.
Despite certain data limitations, we believe that our principal findings are quite robust. They include the following:
• Consistent with First Things First’s emphasis on reducing student-teacher ra-tios, class size dropped considerably over time. During the planning year, the average number of students enrolled in the classes that were observed was 22
ondary education and in most well-paying jobs. IRRE recognizes the importance of these subjects by calling for added instructional time in these classes. Observations were not conducted in language-arts related classes such as Speech and Theater, where the emphasis is on improving students’ performance skills rather than their cognitive abilities.
3Because only three observations were conducted at Shaw High School, these were excluded from the study. No observations were conducted in Fonville Middle School in Houston, TX. For logistical reasons, the observer there had planned to defer work at this school, which is located some distance from most of the oth-ers, until the end of the study period, but then was unable to complete any observations there.
4Three of the seven “critical features” of First Things First of the program model involve teaching and learning. These critical features call for teachers to adopt high, fair, and clear academic standards; for students to experience enriched and diverse opportunities to learn, perform, and be recognized; and for teachers to be equipped, empowered, and expected to improve instruction.
5In designing the study, MDRC researchers, along with Dr. Phyllis Clay in Kansas City, Missouri, and Dr. Phyllis Blumenfeld of the University of Michigan, worked together to identify operational indicators of the concepts in the IRRE white paper and to devise an appropriate data collection strategy.
IRRE’s thinking about effective instruction has evolved over the course of its work with the First Things First sites. The organization now emphasizes instruction that is aligned with state knowledge standards, per-formance standards that emphasize grade-level or higher expectations, and methods to assess performance that include those used on high-stakes assessments. The methodology of this study was designed before IRRE moved in these new directions.
-3-
and the average number actually present was 19; by the second implementa-tion year, these figures had fallen to 18 and 16, respectively.
• With each successive year, students worked in small groups or pairs in an in-creasing percentage of classes. The use of cooperative learning strategies was a major focus of IRRE’s professional development efforts, and teachers ap-pear to have put these strategies into practice. Concomitantly, the physical set-up of classrooms changed to better accommodate activities involving stu-dent interaction.
• The large majority of teachers were actively involved with their classes dur-ing at least three-quarters of the 50-minute observation period, and most of these were actively involved throughout the period. Only occasionally were teachers uninvolved with their classes (instead, for example, grading papers or reading) for a substantial portion of the time.
• In the large majority of classes, the predominant activity of the class involved learning objectives at the lower levels of Bloom’s Taxonomy (described later in this paper). Students were more likely to be involved in mental activities such as remembering and applying than in evaluating and creating, and much of the knowledge conveyed was factual. IRRE will place more emphasis on the creation of rigorous and challenging instructional activities as the demon-stration moves forward.
• Over time, teachers did more to model cognitive and metacognitive strate-gies, but in only a minority of instances did they ask questions or assign tasks that required students to demonstrate these strategies.
This paper serves a second purpose: to describe the classroom observation methodology used in the study and the lessons learned. While classroom observations are resource-intensive, we argue that they provide valuable information that cannot be obtained in other ways. We also offer some suggestions about how observations can be conducted as effectively and efficiently as possible:
• The presence of researchers who are permanently located at the study sites greatly facilitates the observation process. In our case, it meant that observers had frequent access to classrooms over the course of the school year. More-over, the researchers were familiar figures in the schools and could navigate the physical premises well.
• High rates of turnover among observers appear to be common in studies of this type. Because the cost of training replacements, in terms of both time

-4-
and money, is considerable, it may make sense to hire and train more observ-ers than are strictly necessary and initially assign fewer observations per per-son. In this way, if one observer drops out, the others can fill in the gap by conducting more observations.
• At the same time, hiring additional observers poses the challenge of ensuring inter-rater reliability. Training must be adequate to ensure that all observers respond to both open-ended and close-ended items in the same way.
• Although observers should plan beforehand which class they want to visit in any particular time slot, they should also be prepared to observe a different class if — as is frequently the case — the first one turns out to be unsuitable (for example, because a test is being given or a video is being shown). Indeed, observers are well advised to carry a copy of the master schedule with them.
• Observers should complete and send in their observations as soon as possible after conducting them, to help ensure that the events remain fresh in their minds; conversely, observers must receive feedback as quickly as possible so that they can fill in missing details and steadily improve their observational skills.
• When the study design calls for detailed data from which judgments must be made, it is advisable to have a small number of in-house staff, rather than the observers themselves, make these judgments, in order to ensure greater inter-rater reliability and to allow observers to focus on data collection rather than interpretation.
The next section of the working paper sets the stage for the study by reviewing the re-search on effective teaching and learning. The third section describes the methodology of the First Things First classroom observation study, while the fourth section presents the study’s results. The paper concludes with suggestions for instructional improvement that emerge from the findings.
Elements of Effective Teaching and Learning What researchers have learned about learning has increased dramatically in the past few
decades (See Bransford, Brown, and Cocking, 1999 for an overview of this research literature). Research indicates that successful learners know how to learn: they can define their own learn-ing goals and evaluate their own achievement. In addition, successful learners are able to trans-fer what they have learned to new situations (Jones, Valdez, Nowakowski and Rasmussen, 1994; Means et al., 1993). This challenge requires that they possess not merely procedural
-5-
knowledge but also “higher-order skills”—i.e., an understanding of underlying concepts and principles and the ability to analyze and evaluate problems.6
Recent research emphasizes the importance in the learning process of students’ aware-ness of their own cognitive approaches (Bransford et al., 1999; Anderson and Krathwohl, 2001). The prefix “meta” is added to “cognition” to point out that students are reflecting on their own thinking. Relevant aspects of metacognition include: (1) knowledge about cognition (un-derstanding which general tactics may be used for different tasks under different conditions and the extent to which various approaches are helpful); and (2) control, monitoring, and regulation of one’s cognitive processes.
Research also indicates that students are more likely to interact with subject matter when it is deemed “authentic,” that is, connected to the student’s world beyond the school and relevant to real life. Breaking down tasks into discrete component skills that have no obvious connection to anything students do outside of school has negative effects on motivation and makes it unlikely that students will be able to transfer the learned skills to real-world tasks (Resnick and Klopfer, 1989). Students hold more ownership in the learning process when they are engaged in an activity that is personally meaningful because it relates to problems similar to those they will encounter in the home and workplace.
The new research on learning contains important implications for teaching practices. It suggests that for instruction to be truly effective, good teachers cannot just transmit information. They must also create more mindful learners. Much is known about instructional practices and strategies that keep students involved in what they are doing and help them master and reflect on what they are learning.7 A number of these practices and strategies are discussed below.
Ensuring Adequate Time on Task
Significant learning takes major investments of time. This poses a challenge when at-tempted within the confines of the traditional 50-minute class period. Schools can carve ex-tended blocks of time by reconfiguring class time or encouraging interdisciplinary approaches. All First Things First schools have put block scheduling into effect.
6If students are asked to remember, understand, and apply material presented, they most likely will be able
to retain and recall it—but only in much the same way as it was presented in the original instruction. Without a depth of understanding of the material — gained through extended time engaged in higher-order thinking skills such as analysis, evaluation and creation — students are unable to transfer or use what they have learned to solve new problems (Mayer and Wittrock, 1996; Bransford, Brown, and Cocking, 1999; Detterman and Stern-berg, 1993; McKeough, Lupart, and Marini, 1995; Mayer, 1995).
7These strategies are largely similar in concept to those contained in the IRRE white paper on teaching and learning, although the specific language sometimes differs.
-6-
Effective classroom management strategies are also crucial to ensuring that students spend enough time on the academic content, rather than spending inordinate amounts of time getting settled down, transitioning between various activities, or socializing. Organization, preparation, and procedures can reduce “lost” time. Establishing routines at the beginning of the year helps students work better and remain focused. Students know what to expect and what is expected of them. When teacher or students are in doubt about what to do next, it is easier for students to drift, lose focus and become disruptive. (See Good and Brophy, 2003).
Providing Opportunities for Student Interaction
Teachers can help students learn by creating opportunities for them to interact with each other around the subject matter. A model of learning called “constructivism” provides the theo-retical basis for encouraging communication and collaboration among learners of all ages. Con-structivist theory holds that knowledge and understanding are not gained through the transmis-sion of information, but rather, are socially constructed through a process of active engagement with the subject matter and with others (Bruner, 1990; Vygotsky, 1978). Communication pays a central role in this theory of learning. Vygotsky (1962; 1978) argues that language and commu-nication are central to the two-way transformational process by which knowledge about the world is acquired. Recognizing and addressing the gap between current and greater levels of understanding occurs through what Pea (1991) calls “learning conversations.”
Collaborative learning has many advantages (Lesgold et al., 1992). It can provide moti-vation: If one student is unsure of how to proceed or feels overwhelmed, another’s energy can help move the task forward. Different age and ability levels can work together, learning from each other. Perhaps most important is that when students are working in a group, they must all be required to participate and be accountable for their work — clarifying what they mean, justi-fying their choices, and providing critical feedback to other group members. Toward this end, IRRE has provided teachers in the First Things First schools with training on a set of coopera-tive learning strategies, called “Kagan structures” after Spencer Kagan, their developer.
Establishing Challenging Learning Objectives
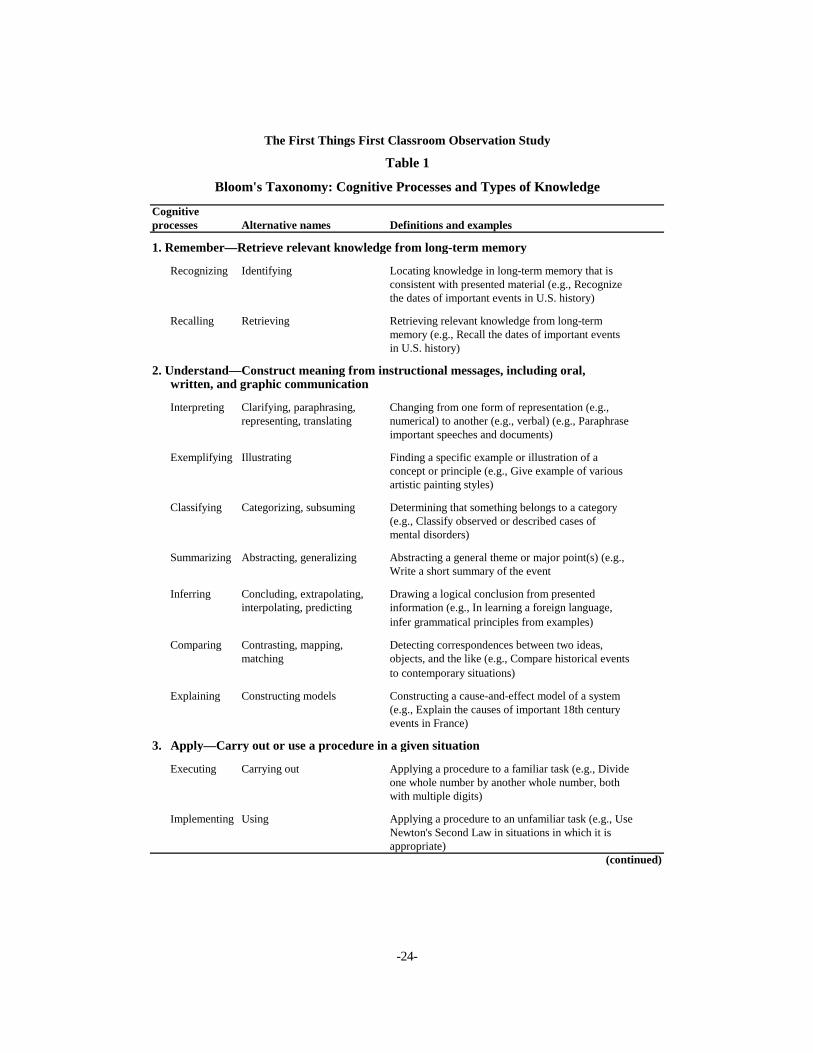
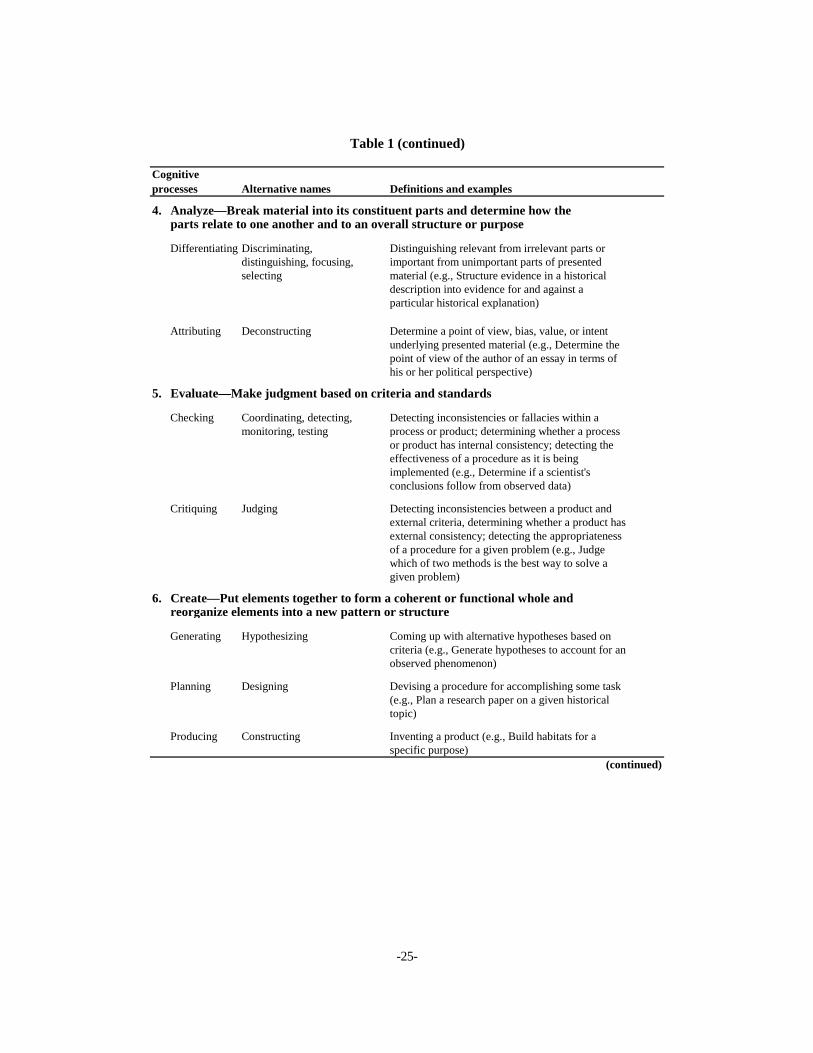
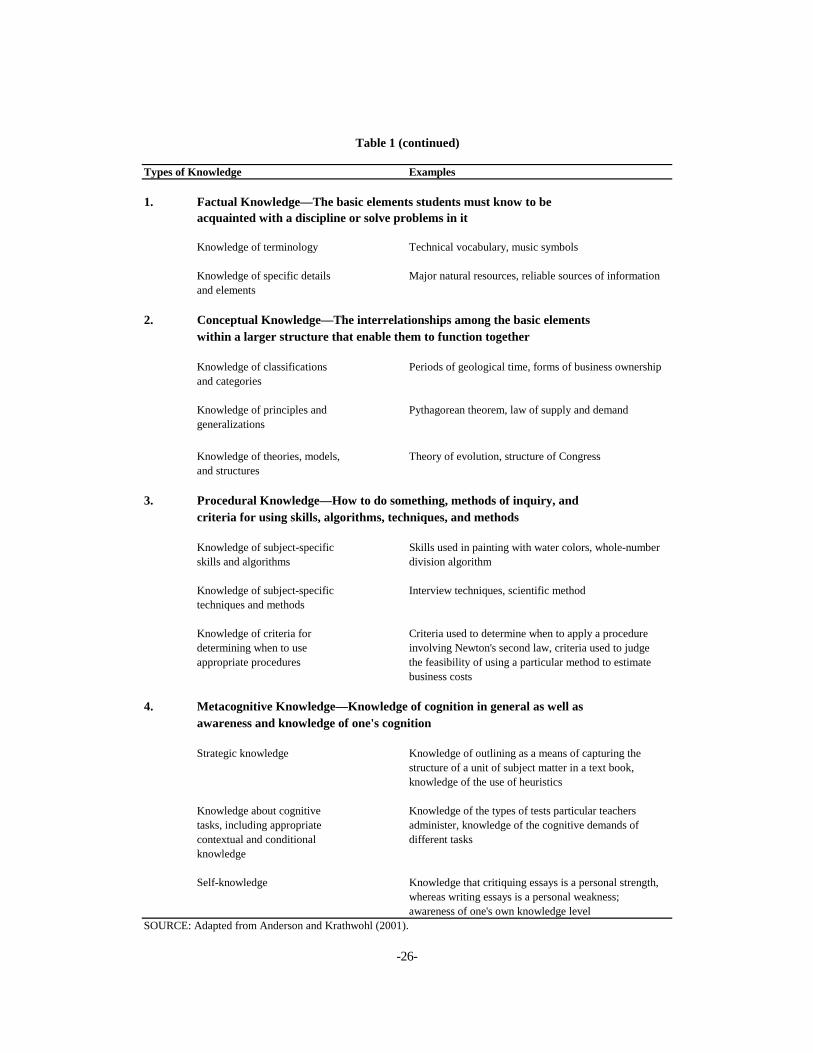
In 1956, Benjamin Bloom led a group of educational psychologists in developing a hi-erarchy of cognitive domains, known as Bloom’s Taxonomy, that is still used widely today. The taxonomy identifies six increasingly complex levels of cognitive engagement: recall, under-standing, application, analysis, evaluation, and creation.
For this study, a modified version of Bloom’s Taxonomy was used as a basis for under-standing the content of the observations. The version used here is based on a revision of the tax-onomy developed by one of the original taxonomy’s framers, David Krathwohl (Anderson and
-7-
Krathwohl, 2001). This newer perspective focuses both on what learners know (knowledge) and how they think about what they know (cognitive processes).
The modified version of Bloom’s Taxonomy used in this report is shown in Table 1. The table indicates that learning objectives can be arrayed along two dimensions: cognitive process and type of knowledge. The taxonomy includes six cognitive processes (remembering, understanding, applying, analyzing, evaluating and creating ) and four types of knowledge (fac-tual, conceptual, procedural and metacognitive). Each of these categories is briefly described in the table.
Modeling Cognitive and Metacognitive Strategies
Think-Alouds and Read-Alouds
A “think-aloud,” just as its name suggests, is a technique of articulating the thought process. Teachers model reading or problem-solving approaches by stating the mental steps they take as they process a text or problem, thereby making “visible” an otherwise invisible process.
In reading, for example, think-alouds can be used by teachers not just to model com-prehension strategies (for example, making predictions, comparing and contrasting, creating images, and making connections to prior knowledge) but to identify when each specific strategy is occurring and why. The think-aloud can be modeled by teachers as an instructional tool or used by students as an assessment tool that helps teachers gauge understanding and problem-solving skills.
A “read-aloud” occurs when the teacher or a student reading a text aloud pauses to con-sider a teacher-directed question about the text. The teacher enhances the process of reading by asking questions that require the students, for example, to summarize, make predictions, or ana-lyze the text. By doing so, the teacher models and supports the students in taking an active ap-proach to reading.
“Teaching for Understanding”
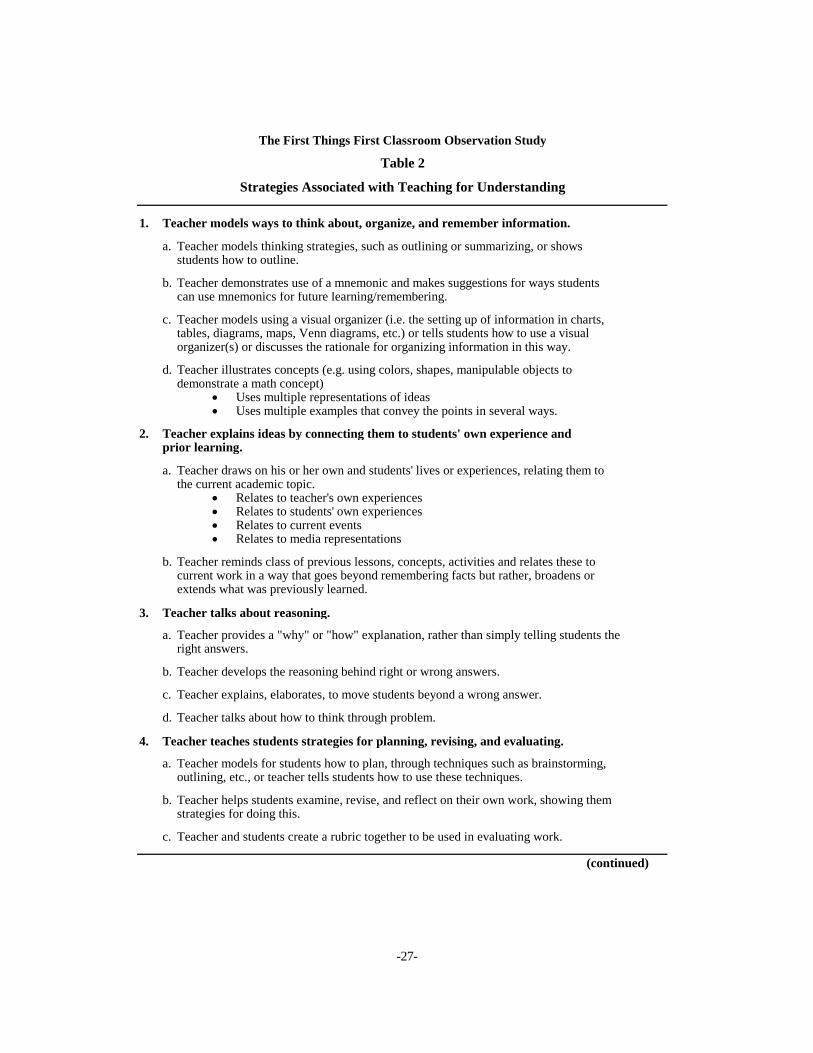
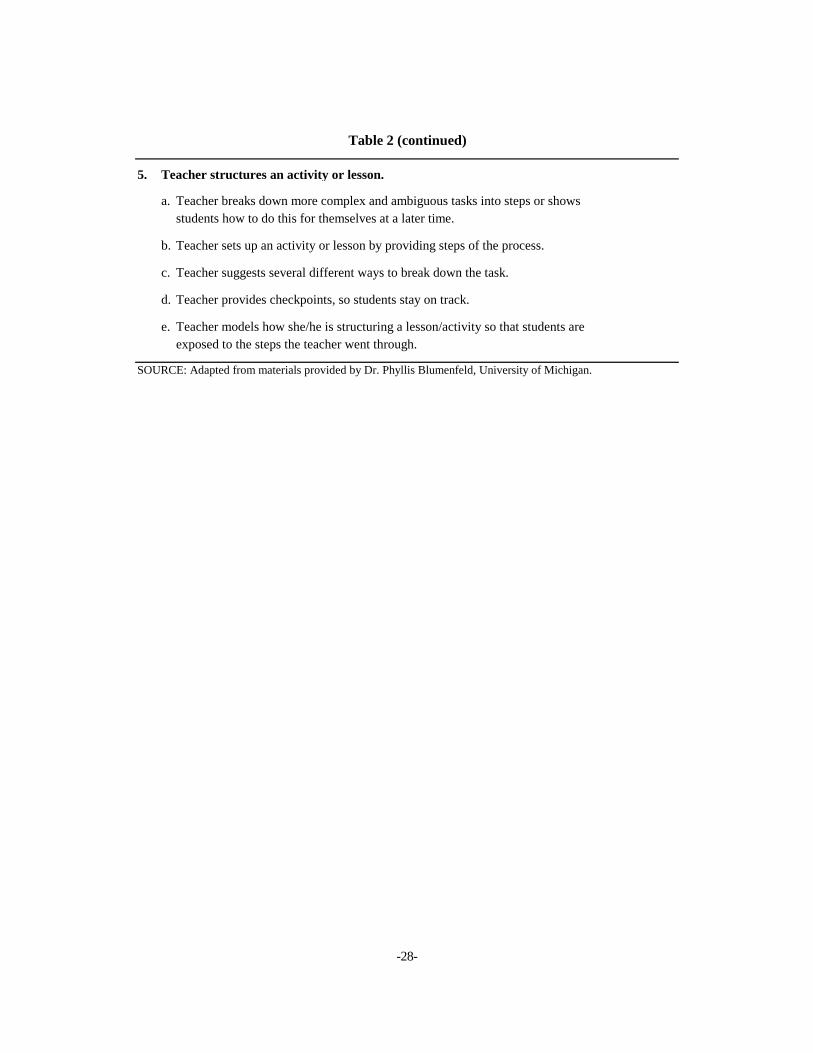
In “teaching for understanding,” the instructor makes explicit his or her own ways of thinking about subject matter, so that students in turn can construct their own understanding of the material. Specific strategies that fall under this rubric appear in Table 2 and are briefly de-scribed below.
The teacher may help students learn by modeling ways to think about, organize, and remember information (for example, through the use of outlines, visual organizers, or mne-
-8-
monics). She may also illustrate a concept in different ways (for example, explaining fractions both with reference to coinage and through the use of manipulables). Because different stu-dents may grasp the concept best in different ways, the teacher needs to have a variety of techniques at her disposal.
Teachers also help students to think more deeply about what they are learning by linking the subject matter to the world beyond the classroom. (This relates back to authentic learning, dis-cussed earlier in this paper.) To ensure that students recognize connections between what they are studying and the world outside the classroom, teachers can use a number of “linking” strategies. They can connect what is being studied to their own experiences or the experiences of their stu-dents, to current events and the media, and to what students already know. They can also use the subject matter to address real-life problems that students view as important.
Teaching for understanding also occurs when the teacher talks about reasoning, helping students to understand, for instance, not just why one answer is correct but why another one is incorrect. The teacher may model how the students can think through a question.
Teaching students how to be planful also fits under the category. The teacher models strategies for planning an undertaking, evaluating it, and then revising it. Teachers show stu-dents how to be thoughtful about their work. This is especially important when the task is part of a larger project and involves complex or ambiguous activities. The teacher shows the learner ways to tackle a complex assignment, break it down, and make it manageable. The teacher also demonstrates methods of keeping on track by monitoring progress against various checkpoints.
Requiring Students to Demonstrate Cognitive Strategies: the “Press for Understanding”
A teacher “presses for understanding” when he or she asks questions or sets up tasks that ensure that students understand what they are learning and doing. For example, the teacher may ask students to come up with ways of organizing concepts, to explain the linkages among various reasons, to provide the “hows” and “whys” behind their answers, or strategize about planning, revising, and evaluating. In short, the press for understanding occurs when students must articulate what they understand.8
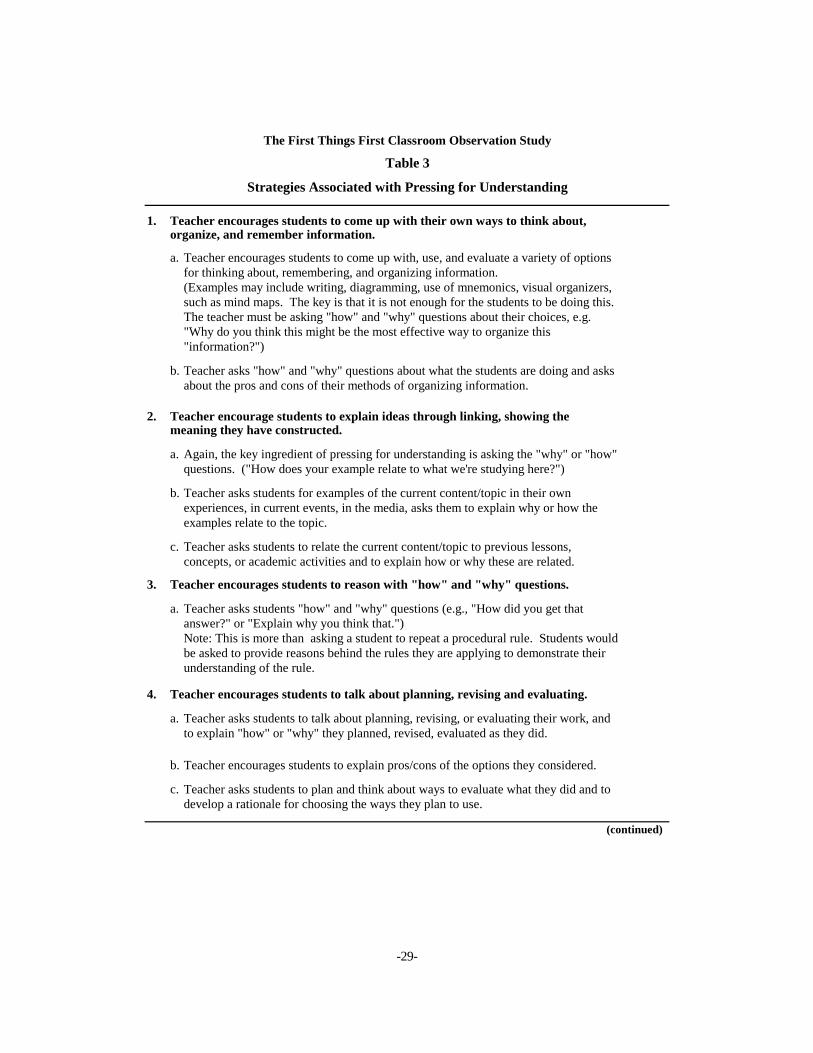
As Table 3 indicates, the strategies associated with the press for understanding are es-sentially the same as those associated with teaching for understanding, except that the teacher, instead of modeling the strategies, asks the students to demonstrate them. In pressing for under-
8Pressing for understanding goes beyond “recitation,” which is characterized by a series of questions asked
by the teacher and answers supplied by the student; in recitation, students’ answers are typically short and factual.

-9-
standing, the teacher ensures that student can prove their grasp of the material by explaining in their own words, comparing answers, or recognizing why something is right or wrong.
The Methodology of the Classroom Observation Study The First Things First classroom observation study was undertaken in order to describe
instruction in schools mounting the initiative, with a focus on determining: a) the extent to which teachers used the strategies described in the preceding section as making for enhanced student learning; and b) how instructional practices changed over time. This section describes: the ration-ale for conducting classroom observations and for our particular approach to observation; the data elements of interest and the instruments used for collecting them; the selection and training of ob-servers; the selection of classes for observation; and the data available for this report. It also dis-cusses some of the operational lessons learned about conducting observations in classrooms.
Why Observations, And Why Our Particular Approach?
Direct observation of classrooms is the best methodology available for studying how teachers teach — the central focus of this inquiry. Good and Brophy (1974) showed clearly that teachers are unaware of some of their behavior. Moreover, teachers may report that they engage in instructional practices thought to be desirable more than they actually do. For both reasons, teacher self-reports (for example, teacher surveys and interviews) are unlikely to represent teacher behavior accurately. Student surveys may capture students’ attitudes toward what teach-ers do but are unlikely to provide a complete and accurate picture of teachers’ actual behavior. Tests and assignments may supply useful information about what teachers think it is important for students to know and whether learning objectives are challenging, but such “artifacts” can-not shed light on the nature of the instruction itself.
At the same time, observational studies are highly resource-intensive. They require that observers be trained and monitored and that reliable procedures for coding data be established. Researchers may spend considerable time scheduling observations (and rescheduling them when need be) as well as actually conducting them. The resource-intensity of the undertaking, and its relatively high cost, will necessarily limit the number of observations that can be con-ducted. Despite these constraints, classroom observations provide the best means of understand-ing the instructional process.
The information collected for this study was recorded on several forms and includes both low-inference and high-inference items. As the name implies, low-inference items are those that do not involve making qualitative judgments; the observer can easily determine whether a condi-tion does or does not exist on the spot. Thus, for example, in describing the physical set-up of the
-10-
classroom, the observer can simply place a checkmark on a form to indicate whether desks are arranged in rows, in small groups, in a semi-circle, or in some other arrangement.
On the other hand, high-inference items involve making judgments. Examples in this study include assessing the extent to which teachers employ metacognitive strategies and de-termining whether learning objectives are challenging. To make sound judgments about these matters, specific and detailed information is needed about what transpires in the classroom, and especially about interactions between teacher and students in the context of instruction. For ex-ample, knowing that a teacher asks students questions — the kind of information that could be collected on a close-ended form — is not enough. It is also important to know just what is asked (whether the question calls for a factual response, an opinion, an inference, etc.) and how the teacher follows up on the student’s response (or non-response). In this study, the observer re-cords this information on the Running Record form, described below, which is a detailed ac-count of the instruction that takes place in the classroom. Other aspects of the classroom (for example, student conduct) are noted only insofar as these have an impact on instruction.
The level of detail required in the Running Record means that the observer must focus intently on capturing the specifics of teacher-student interactions. In part to reduce the pressure on the observers, we did not ask them to make high-inference judgments about the learning ob-jectives of the lesson or about the use of metacognitive strategies. Instead, they submitted their Running Records and other forms to MDRC, where all post-coding of high-inference items took place. Because the Running Records contained such detailed information, it was possible to modify and fine-tune the coding scheme as the study moved forward. A further rationale for handling post-coding centrally and having it performed by only a few coders is that it helps to ensure inter-rater reliability.
Data Elements and Instruments
Each classroom observation was expected to take 50 minutes and involved the comple-tion of six separate instruments, described in Table 4.9 As noted above, one of these, the Run-ning Record, is a detailed description of what happens in the classroom, with a focus on the teacher’s instruction, and is the key source of information on the substantive content of the les-son and the use of strategies that promote cognition and metacognition. Three additional in-
9The package of instruments includes modified versions of two instruments, the Physical Environment
Form (PEF) and the Classroom Checklist (CCL), that were created by Kansas City, Kansas researchers and used during earlier classroom observations in the Kansas City sites. It adds four new instruments: the Running Record, Post Observation Summary, Post Observation Teacher Interview, and Observer Comments. The use of the Running Record departs from the approach previously used in Kansas City, which involved coding up to 270 specific adult-student interactions per observation. This methodology had been found to yield data that were decontextualized and hard to analyze.
-11-
struments contain close-ended, low-inference items: the Physical Environment Form, the Class-room Checklist, and the Post-Observation Summary. Finally, two instruments, the Post-Observation Teacher Interview and the Observer Comments Form, contain a mix of close-ended and open-ended items.
These instruments are discussed below, in the order in which they are completed during the course of the observation; copies of the forms appear in Appendix A.
1. Physical Environment Form
When the observer enters a classroom, he or she first completes the Physical Environ-ment Form, or PEF. This low-inference checklist identifies the physical set-up of the desks (for example, whether they are arranged in rows, in a semi-circle of chairs, etc.) as well as the pres-ence of other physical items and equipment, for example, signs listing behavioral expectations, displays that reflect students’ ethnicities, progress charts, computers, etc.
2. Running Record Form
When the PEF is complete, the observer begins a 50-minute Running Record.10 The re-searcher begins writing down what is observed as it takes place, stopping at 10-minute intervals to complete a Classroom Checklist, or CCL, described in the following section. She or he pays special attention to what the teacher says and does, including the nature of the task and the ques-tions the teacher asks, as well as any discussion that ensues. The narrative is not a verbatim ac-count; instead, the observer records enough detail on certain aspects of the lesson so that a reader can tell what happened during that block of time and can code the observation on certain dimensions, including the level of the lesson and the teacher’s instructional strategies.
While the Running Record is the component that requires the most effort in terms of training, the most energy on the part of the researchers during the observation itself, and the most attention by coders, it has two major advantages. First, it examines the lesson holistically, allowing the reader to understand how the teacher introduces new material and tasks, the role both teacher and students play in getting students to accomplish the task, and the extent to which students construct an understanding of the subject at hand.11 Second, the quality of the data can be improved by providing immediate feedback to the observer; for example, if the
10While observers were asked to record 50 minutes of instruction on the Running Record, about one-third of the Running Records recorded less than 50 minutes of class time (although almost all of these recorded be-tween 40 and 50 minutes), and one ran over 50 minutes. For one thing, Cental Middle School in the Riverview Gardens school district did not adopt block scheduling until the reform was actually implemented; all planning-year classes were only 44 minutes long. For another, classes sometimes ended abruptly (because of a schedule change, a fire drill, and the like), so that it was not possible to capture the full 50 minutes.
11Blumenfeld, 1992.
-12-
Running Record does not contain enough information, the observer can be asked to clarify the write-up and to provide more details.
The Running Record is the only part of the observation that is post-coded, in this case by MDRC staff or consultants; this ensures consistency in coding standards. Because someone else will be reading these Running Records, the observer must transform classroom notes into a clean write-up. The scheme for coding the Running Records is discussed in Appendix B.
3. Classroom Checklist
The Classroom Checklist, or CCL, is completed at 10-minute intervals beginning at 10 minutes into the Running Record; four CCLs are thus completed during a 50-minute block.12 The CCL is a “snapshot” of what is going on at the moment. It records whether the teacher is interacting with one or two students, a small group, a large group, or the class as a whole. It also notes the presence of certain “learning opportunities,” including project-based learning (whether individual or grouped), the use of Read-Alouds and Think-Alouds, group discussion, recitation, and completion of worksheets. It also notes how many students are on-task and off-task and the extent to which the cycle is teacher-centered vs. student-centered (this last through an estimate of the percentage of time the teacher is talking and/or waiting during the 10-minute interval).
4. Post-Observation Teacher Interview
After the observation, the researcher conducts a brief interview with the teacher. The Post-Observation Teacher Interview asks about the number of students enrolled in the class (so that the percentage of students in attendance can be determined), where the lesson falls in rela-tion to a unit or larger project, and how typical that particular class was of how the class gener-ally operates. If the class is not over when the 50-minute observation period concludes, the ob-server usually waits until the end of class to complete the interview.
5. Observer Comments
The Observer Comments form is a place where researchers can express their own thoughts about the observation. Having a specific place for such comments helps to keep sub-jective opinions out of the Running Record.
12A few Checklists were missing; thus, 670 Checklists were available for the 168 planning-year observa-
tions, 543 Checklists were available for the 136 first implementation year observations, and 492 Checklists were available for the 123 second implementation year observations.
-13-
6. Post-Observation Summary
The researcher completes the Post-Observation Summary at the end of the observation and after the Teacher Interview has been conducted. Some observers choose to complete the form outside of the classroom after having transcribed their Running Records notes. The Post-Observation Summary is based on what is observed during the entire period and includes sec-tions about the structure and organization of the classroom, the teacher’s instructional strategies, and the classroom climate.
Selection and Training of Observers
When observations began during the spring of 2001, three on-site researchers had al-ready been hired to study program implementation in Houston, Riverview Gardens, and the Mississippi Delta schools, and conducting classroom observations was one of their job respon-sibilities. Intensive training for these observers took place over a two-and-a-half-day period in February 2001. In the Riverview Gardens and Houston sites, the fact that the on-site researchers were familiar figures to the teachers — and that they themselves were familiar with the physical premises — facilitated their role as observers.
There were soon changes in the complement of observers. The Mississippi researcher’s work was inadequate, and he was replaced after a year.13 The addition of the five new Group II schools in Houston, Texas made it impossible for the sole on-site researcher to continue con-ducting classroom observations along with her other work, so three students at a local university were hired as observers on a part-time, hourly basis. A second round of intensive training for both experienced and new observers was conducted in December 2001, but two of the three new observers in Houston quickly left the project. The new Mississippi field researcher, who had attended the second round of training, was soon forced to resign because of illness, and it was not considered feasible to provide yet another training session for his replacement.
Turnover among observers, especially those who are students, appears to be a common phenomenon, and it is one for which researchers should plan. If it is feasible, hiring and training several observers, and assigning fewer observations per person, may be a better option than hir-ing only one observer on whom the whole process stands or falls.
The Houston training covered all the instruments contained in the data collection pack-age but focused primarily on the Running Record. Trainees received an observation guide that specified those aspects of the classroom and those elements of instruction to which they should pay particular attention. To help ensure inter-rater reliability, the trainees watched videos of ac-
13The observational study was able to make use of data he collected using the close-ended forms, but his Running Records were too sketchy to be analyzed.
-14-
tual classrooms and wrote Running Records of their observations; they then compared write-ups with each other and with the write-up of the trainer. Training on the other forms also involved watching the classroom videos and having trainees compare their responses with those of an experienced observer.14
In-service training continued after observers began going into classrooms. It proved im-portant not only for observers to “clean” their Running Records and send them in as soon as possible after conducting their observations but also for MDRC staff to provide immediate feedback on the submissions. In this way, if necessary, observers could provide fuller and more detailed accounts while the classes remained fresh in their minds and could also fine-tune their observational and recording skills. This lesson was learned in part through negative example: Early on, MDRC personnel responsible for supervising the observers were engaged in develop-ing a final version of the post-coding scheme and had less time available to communicate with the observers. Although the problem was recognized and rectified, the quality of the early ob-servations suffered as a consequence.
Conducting the Observations
As noted above, observations were conducted in English/language arts classes and in math classes. Teachers were assured that the observations were being conducted solely for the purpose of research, that the observers were not there to evaluate them, and that the observa-tions would not be shared with school or district personnel.
Essentially, observers were simply asked to observe as many classes as possible. Al-though initially they were instructed to observe each math and language arts teacher two to three times, the limited time available for observations made this infeasible, and the large majority of teachers were observed only once. No effort was made to observe equal numbers of English and math classes.
Neither was an attempt made to select classes at random for observation. Even if this had been done, it is likely that the researchers would have confronted problems actually con-ducting such observations. Even when they set up advance appointments or sent memos inform-
14In general, there was considerable consistency in the coding of the two Houston observers. Interestingly,
they provided such disparate responses to two questions that the data were dropped from the analysis. In one instance, the second observer, who was hired to conduct observations during the second and third years of the study, found a much greater incidence of behavior problems interfering with instruction than her first-year counterpart. Since it is unlikely that major behavior problems increased dramatically from one year to the next, the analysts concluded that the two observers had different levels of tolerance for misbehavior. In a second instance, the second observer estimated that use of active instructional strategies accounted for a much lower percentage of class time than the first observer. Again, we concluded that this disparity was more likely to rep-resent a difference in the observer’s judgment than in what was actually taking place in the study classrooms.
-15-
ing teachers and principals that observations would be conducted during a certain time frame, some teachers claimed to be unaware that an observation had been scheduled and asked that it be rescheduled. Other times, they found that the teacher was giving a test or showing a video. (Since our focus was on the teacher’s instructional practices, observations of these activities would not have been informative.) Some observers opined that they encountered resistance es-pecially from teachers who were hostile to the First Things First reform. The observers also suspected that teachers did not want them to visit classes in which students often misbehaved or for which lesson plans were poorly prepared.
The observers reported that it became easier to conduct the classroom observations over time. Initially, it was hard for observers to concentrate, since classrooms were active places in which many things were happening simultaneously; gradually they learned to filter out extrane-ous subject matter. Observers also figured out how better to deal with the volume of information to be recorded. One observer found that she was writing so much that she developed hand cramps and ended up buying a laptop computer.
Also, during later rounds of data collection, observers came to school with several classrooms in mind, so that if one class was not suitable, another could be observed. In such circumstances, the observers were likely to choose a nearby classroom, since they had only lim-ited time to get to the next class and prepare for the observation. Thus, their task also became easier as they got to know the physical layout of the schools better.
Anecdotal evidence suggests that the behavior of both students and teachers was some-what altered by the observers’ presence. There were several instances of teachers remarking that students were better behaved because a visitor was there; the observers felt, too, that students sometimes “acted out” more because they were being watched. At least one observer suspected that teachers acted in a friendlier way toward their students than was normally the case. The ob-servers did not believe that their presence significantly altered the nature of instruction, however.
The Data Available for This Report: Characteristics and Caveats
Our analysis is based on 427 observations conducted in ten of the twelve First Things First schools over a three-year period. Table 5 shows the distribution of these observations by implementation year, district, school, and type of class observed.
Turnover among observers made it impossible to collect the same data from all schools at all sites each year. The departure of two of the three observers in Houston meant that only four of the seven First Things First schools could be studied during the 2001-2002 school year. (The next year, the observer spread her observations over six of the seven schools.) Further-more, when illness forced the resignation of the second Mississippi field researcher, no observa-tions were conducted in Mississippi during the 2001-2002 academic year. During the 2002-
-16-
2003 school year, the Mississippi field researcher received training on the close-ended forms and conducted observations using these forms only.
As a consequence, Running Records data were unavailable for classes observed in Greenville. Thus, the parts of the analysis that depend on information from the Running Records are based on 383 observations, all completed in the Houston and Riverview Gardens districts.
Our general analysis strategy is to compare planning-year data with results from the first and (where available) second implementation-years. Table 5 suggests that because of the small number of observations conducted at each school in any given year (ranging between 5 and 46), comparing results across the years at the individual school level could prove misleading.
Instead, in this paper, we have chosen to present the data in two ways. In the body of the report, we include tables and figures that aggregate the results across implementation groups and districts, while maintaining distinctions among the implementation years (planning year, first implementation year, or second implementation year) and between English/language arts and math classes. In Appendix C, we present detailed tables, disaggregating data by district, implementation group (I or II), implementation year, and type of class (language arts or math).15
In analyzing these data, we did not perform chi-square or other tests of statistical sig-nificance. Our automated data files were not set up to support these tests, and hand-tabulations were not possible within the project budget. In view of this fact, as well as the reality of rela-tively small samples, we suggest that readers, in drawing inferences about change over time (in the text and appendix tables) and about differences among the sites (in the appendix tables), pay greatest attention to findings that are sizable and consistent, as these are most likely to be mean-ingful. Small year-to-year disparities are less likely to be indications of true change.
Readers should also be aware of a number of aspects of the data that make it inadvis-able to draw conclusions about small differences.
15We opted to aggregate data from the Group I and Group II schools in the planning and first implementa-
tion year because a preliminary inspection of the data indicated that instructional behaviors were quite similar in the two groups of schools. Data for the second implementation year are available only for the Group I schools.
Although we might expect to see generic differences in the instructional methods used by high school teachers and middle school teachers, the decision to aggregate data collected from the two kinds of schools seems reasonable because, across implementation groups and project years, the percentage of observations occurring in the high schools in Riverview Gardens and Houston (where both middle schools and high schools are present) remained relatively stable, ranging between 53 and 60 percent. Thus, whatever changes occurred would not be confounded by having very different proportions of observations coming from the high schools over the course of the study period.
-17-
• While we expect instructional methods in math and English classes to vary considerably, as noted above, we do not have equal numbers of observations in the two kinds of classes across districts or years.16
• The three districts in the study accounted for very different shares of the ob-servations over the three years.17
• The observers began their observations earlier in the 2001-2002 and 2002-2003 school years than in the 2000-2001 year (when the larger First Things First evaluation got under way). We cannot be sure how the different timing of the observations affected what was reported, but we suspect that these dif-ferences reduce the comparability of the data.18
Study Findings This section presents the study’s findings. These are organized into three broad catego-
ries. First we consider the classroom context — attributes of the physical and psychological en-vironment of the class. Then, we turn to the activities in which teachers and students are en-gaged, looking at the instructional strategies used to present the lesson. Finally, we examine the content of the lesson — the way the teacher presents what is to be learned and the nature of the learning tasks students are asked to perform.
Establishing a Context for Learning
Class Size and Student-Teacher Ratio
The First Things First model places considerable emphasis on reducing student-teacher ratios in English/language arts and mathematics classes, and reducing class size is one way of
16As an example, English classes accounted for 69 percent of all classes observed in Houston during the
planning year (for Groups I and II together), and for 56 percent of the Riverview Gardens planning-year obser-vations. During the first implementation year, English classes accounted for 64 percent of Houston observa-tions but only 46 percent of Riverview Gardens observations.
The analysis did not use statistical procedures to equalize the numbers of observations of different types (e.g., of different classes, or from different districts).
17For example, Greenville observations comprised 13 percent of all the planning year, none of the first im-plementation year, and 18 percent of the second implementation year observations. Houston observations ac-counted for 36 percent of the planning year observations, 66 percent of the first implementation year observa-tions, and 34 percent of the second implementation year observations.
18Classes look different earlier than later in the year, as students and teachers get to know each other; events like vacations, periods of high-stakes testing, and the approaching end of the school year also affect instruction.
-18-
accomplishing this goal. As Figure 1 shows, classes declined in size over the period of the study, from an average enrollment of 22 and average attendance of 19 in the planning year to an average enrollment of 18 and average attendance of 16 during the second implementation year.19 (More detailed data appear in Appendix Table C.1.20)
Another way of reducing the student-teacher ratio is to assign a second instructor (for example, another subject specialist or a special education teacher) to a class. The observational study data suggest that this happened very rarely and, contrary to expectation, no more so in the implementation years than in the planning year. (Two teachers were present in 5 percent of all classes observed in the planning year, 2 percent of all classes observed in the first implementa-tion year, and none of the classes observed during the second implementation year.) Because two teachers were so seldom present in the classroom, this analysis focuses only on the activi-ties of the main teacher.
The Physical Set-Up
As noted above, IRRE’s technical assistance efforts emphasized the importance of stu-dent interaction for learning. The changing physical set-up of the classrooms observed over time — graphed in Figure 2 and shown in more detail in Appendix Table C.1 — may provide one indication of teachers’ efforts to put interactive learning into practice. During the planning year, in 83 percent of the observations at all sites, desks were arranged in rows facing the front of the class. During the first implementation year, in contrast, students were seated in rows in only 58 percent of the observations; in the remaining 42 percent, they were seated in small groups or in other arrangements that permitted greater student interaction (for example, with desks in a horseshoe shape or with students seated in rows facing each other). Seating arrangements in the second implementation year resembled the arrangements of the previous year.
A central principle of First Things First is that academic and behavior standards must be high, fair, and clear. In all three years of the study, signs posting these standards were present in the large majority of classrooms observed (between about 70 percent and 85 percent, as shown in Appendix Table C.1).21
19Average attendance rates in the classes that were observed were generally 85 percent or higher. 20In this, as in the other tables in this report, the “All classes” column presents the weighted average of the
figures for the English and math classes. 21Such signs were more likely to be present in Houston and Riverview Gardens than in Greenville. Ob-
servers noted that inspirational or motivational posters were present in a number of classes, but the observa-tional instrument did not ask them to collect systematic information on such posters.
-19-
The Psychological Environment
Classes present not only a physical but also a psychological climate for students. The observations suggest that if, in general, classes were not especially warm places, neither were they very intimidating. In 37 percent of all observations, teachers used humor to encourage stu-dents or create a lighter mood (see Appendix Table C.2).
Observers were asked to indicate whether or not teachers made comments to students indicating a sympathetic knowledge of the students or their families. Although implementation of First Things First’s Family Advocate System, which requires that teachers meet regularly with a group of students and their families, might suggest that there would be more such com-ments over time, this is not substantiated by the data. In all three years, such comments were heard in only about 10 percent of all classes observed.22
Teacher Activity Level
Table 6 and Appendix Table C.3 make clear that most teachers were actively involved with their classes throughout the observation period. In only a handful of observations were teachers involved for less than three-quarters of the period.
Examining the “classroom snapshots” (Classroom Checklists) associated with each ob-servation, it is clear that while teachers were involved with their classes, they were not always engaged in teaching. On 14 percent of planning-year snapshots and 19 percent of first imple-mentation year snapshots, observers rated the teacher as “on task, but not academically focused” (for example, engaged in managing students or transitioning between activities). Comparable percentages were assessed as off-task and not academically focused (for example, socializing or resting). The second implementation year registered an apparent decline in non-academically focused and off-task behavior.
22Interestingly, behavior problems were evident in 25 percent of all Riverview Gardens planning-year obser-
vations but only 12 percent of classrooms observed during the second implementation year. This difference and the numbers of observations conducted each year are all relatively small, and we cannot conclude with certainty that First Things First was responsible for the decline. Nonetheless, the finding is in keeping with the First Things First hypothesis that small learning communities will create closer bonds between students and teachers and lead to a decrease in misbehavior. Whether behavior problems also declined in Greenville and Houston cannot be de-termined because of uncertainties regarding inter-rater reliability with regard to this data element.
-20-
Student Learning Opportunities
Opportunities for Active Learning
Table 7 and Appendix Table C.4 use data from the Classroom Checklist and the Post-Observation Summary to describe the various learning activities (or “learning opportunities”) in which students participated. (These “learning opportunities” could also be characterized as “teaching strategies.”) Some of these are characterized as “active learning” because they engage students in thinking and creating. Others are termed “other” because they do not clearly involve students in reflection about what they are doing or learning.
Observers were permitted to check all the learning opportunities they observed, not just the predominant one. The tables show that “other” learning opportunities were far more likely to be in evidence than active learning opportunities during all three years examined. Teachers of math classes were less likely than their counterparts in English/language arts classes to employ active learning strategies.
Opportunities for Student Interaction
As noted above, student learning is thought to be especially effective when students have an opportunity to interact with one another. Creating more opportunities for student inter-action was the thrust of the technical assistance and staff development activities that IRRE brought to the sites. In particular, IRRE contracted with Kagan Cooperative Learning, Inc. to provide teachers with instruction in the use of a set of cooperative learning strategies that can be used across various disciplines and that are aimed at increasing student interaction and engage-ment in the task at hand.
Figure 3, along with Tables 8 and Appendix Table C.5, suggests that IRRE’s efforts paid off. Between the planning and second implementation years, there was a marked increase in the percentage of classes in which students worked in small groups or pairs, from 22 percent to 50 percent.23
23When we examine the data for the two cohorts separately, it is clear that schools in both Group I and
Group II registered increases over time in the percentage of classes in which students engaged in small-group or paired interactions.
-21-
Contents of the Lesson
Challenging Learning Objectives
A modified version of Bloom’s taxonomy, discussed above, was used to describe the predominant learning objectives in the lessons observed, as determined by the length of time spent in the part of the lesson embodying those objectives. Lesson descriptions in the Running Record were used to describe learning objectives along two dimensions: Cognitive Process and Knowledge.
Table 9 and Appendix Table C.6 show that by the second implementation year, a small percentage of lessons involved the higher-level cognitive processes of analyzing, evaluating, and creating. But the key finding is that by far the majority of all lessons, irrespective of disci-pline or program year, involved the relatively low-level cognitive processes of remembering, understanding, and applying. The type of knowledge transmitted in most English classes was heavily factual; in math classes, it was heavily procedural.
In summary, there was much room for growth in providing students with challenging learning objectives.
Modeling and Requiring Students to Demonstrate Cognitive and Metacognitive Strategies
Table 10 and Appendix Table C.7 provide evidence on teachers’ use of various meta-cognitive strategies, and on the extent to which teachers asked questions requiring students to examine their own thought processes.
As discussed above, Read-Alouds and Think-Alouds are among the strategies that teachers can employ to show students how to think about a text or a problem. Both strategies were used infrequently in all three implementation years. Unsurprisingly, Read-Alouds were seen more often in English classes than in math classes.
Over time, there was a marked increase in the use of strategies falling under the rubric of “Teaching for Understanding.” (See Table 2 for a list of these strategies.) The strategies were evident in only 13 percent of the planning-year classes that were observed but in fully half of the classes observed during the second implementation year. Teachers also used these strategies in a more thorough and consistent way over the three years of the study period.24
24Appendix Table C.7 makes it clear that the increase in the use of the Teaching for Understanding strate-
gies was largely a Riverview Gardens phenomenon. It is worth noting that a key administrator at one of the (continued)
-22-
A much smaller increase was observed in use of the strategies (listed in Table 3) that are associated with “Pressing for Understanding.” Teachers employed these strategies infre-quently throughout the study period: Their use was evident in 9 percent of the planning-year classes and in 19 percent of the classes studied during the second implementation year. Thus, while over time, teachers were substantially more likely to model for their students approaches to thinking about the subject matter at hand, they were only slightly more likely to ask students questions requiring the use of metacognition.
Finally, “Linking,” a strategy associated with both Teaching for Understanding and Pressing for Understanding but analyzed separately here, also increased considerably during the study period.
Implications for Improving Instruction and Research on Instruction
Instructional improvement is only one element, albeit an important one, of First Things First. The initiative also calls for major changes in school structure, accountability, and govern-ance. Additional field research at the First Things First schools indicates that it has been much easier to put in place structural changes (e.g., the establishment of small learning communities) than instructional ones (Quint, Byndloss, & Melamud, 2003). Thus, this paper should not be used to draw conclusions about the initiative as a whole.
That said, a consensus is emerging that structural changes are, at best, a necessary but not a sufficient condition for improved student outcomes, and that without instructional changes, educational reforms can achieve only modest results. The findings of this paper give some grounds for optimism that instruction has improved in the First Things First schools. Use of small-group and paired learning strategies — a strong focus of IRRE’s professional devel-opment efforts — increased substantially, as did teachers’ modeling of their thought processes to guide students’ own thinking about thinking. Nonetheless, there is room for considerable im-provement on both of these dimensions.
The paper suggests, moreover, that additional professional development efforts should focus on training teachers to ask questions that require students to show their own familiarity with metacognitive strategies. Finally, throughout the study periods, students spent a great deal of time demonstrating their ability to recall facts and apply procedures rather than to analyze problems and create new knowledge. More challenging curricula and assignments that stretch
schools in that district placed major emphasis on instructional improvement, and the figures may partly reflect the success of her efforts.
-23-
students’ intellects and imaginations are called for. IRRE’s more recent technical assistance ef-forts have begun to address these issues.
The authors hope that the paper succeeds in making a strong case for the importance of classroom observation in assessing the quality of instruction. If we were to conduct a similar study in the future, there are certainly procedural changes we would make to provide earlier feedback to observers and to ensure greater inter-observer reliability. At the same time, we maintain that it would be difficult, if not impossible, to study the instructional practices examined here without sending trained researchers into classrooms. While resource-intensive, classroom observations are a critical tool for probing and understanding the core of the educational process.
-24-
Cognitiveprocesses Alternative names Definitions and examples
1. Remember—Retrieve relevant knowledge from long-term memory
Recognizing Identifying Locating knowledge in long-term memory that is consistent with presented material (e.g., Recognize the dates of important events in U.S. history)
Recalling Retrieving Retrieving relevant knowledge from long-termmemory (e.g., Recall the dates of important events in U.S. history)
2. Understand—Construct meaning from instructional messages, including oral, written, and graphic communication
Interpreting Clarifying, paraphrasing, Changing from one form of representation (e.g.,representing, translating numerical) to another (e.g., verbal) (e.g., Paraphrase
important speeches and documents)
Exemplifying Illustrating Finding a specific example or illustration of a concept or principle (e.g., Give example of variousartistic painting styles)
Classifying Categorizing, subsuming Determining that something belongs to a category(e.g., Classify observed or described cases ofmental disorders)
Summarizing Abstracting, generalizing Abstracting a general theme or major point(s) (e.g.,Write a short summary of the event
Inferring Concluding, extrapolating, Drawing a logical conclusion from presented interpolating, predicting information (e.g., In learning a foreign language,
infer grammatical principles from examples)
Comparing Contrasting, mapping, Detecting correspondences between two ideas, matching objects, and the like (e.g., Compare historical events
to contemporary situations)
Explaining Constructing models Constructing a cause-and-effect model of a system(e.g., Explain the causes of important 18th centuryevents in France)
3. Apply—Carry out or use a procedure in a given situation
Executing Carrying out Applying a procedure to a familiar task (e.g., Divideone whole number by another whole number, bothwith multiple digits)
Implementing Using Applying a procedure to an unfamiliar task (e.g., UseNewton's Second Law in situations in which it isappropriate)
(continued)
The First Things First Classroom Observation Study
Table 1
Bloom's Taxonomy: Cognitive Processes and Types of Knowledge
-25-
Cognitiveprocesses Alternative names Definitions and examples
4. Analyze—Break material into its constituent parts and determine how the parts relate to one another and to an overall structure or purpose
Differentiating Discriminating, Distinguishing relevant from irrelevant parts ordistinguishing, focusing, important from unimportant parts of presentedselecting material (e.g., Structure evidence in a historical
description into evidence for and against a particular historical explanation)
Attributing Deconstructing Determine a point of view, bias, value, or intentunderlying presented material (e.g., Determine the point of view of the author of an essay in terms ofhis or her political perspective)
5. Evaluate—Make judgment based on criteria and standards
Checking Coordinating, detecting, Detecting inconsistencies or fallacies within a monitoring, testing process or product; determining whether a process
or product has internal consistency; detecting theeffectiveness of a procedure as it is being implemented (e.g., Determine if a scientist's conclusions follow from observed data)
Critiquing Judging Detecting inconsistencies between a product andexternal criteria, determining whether a product hasexternal consistency; detecting the appropriatenessof a procedure for a given problem (e.g., Judge which of two methods is the best way to solve a given problem)
6. Create—Put elements together to form a coherent or functional whole and reorganize elements into a new pattern or structure
Generating Hypothesizing Coming up with alternative hypotheses based oncriteria (e.g., Generate hypotheses to account for anobserved phenomenon)
Planning Designing Devising a procedure for accomplishing some task(e.g., Plan a research paper on a given historical topic)
Producing Constructing Inventing a product (e.g., Build habitats for a specific purpose)
(continued)
Table 1 (continued)
-26-
Types of Knowledge Examples
1. Factual Knowledge—The basic elements students must know to be acquainted with a discipline or solve problems in it
Knowledge of terminology Technical vocabulary, music symbols
Knowledge of specific details Major natural resources, reliable sources of informationand elements
2. Conceptual Knowledge—The interrelationships among the basic elements within a larger structure that enable them to function together
Knowledge of classifications Periods of geological time, forms of business ownershipand categories
Knowledge of principles and Pythagorean theorem, law of supply and demandgeneralizations
Knowledge of theories, models, Theory of evolution, structure of Congressand structures
3. Procedural Knowledge—How to do something, methods of inquiry, and criteria for using skills, algorithms, techniques, and methods
Knowledge of subject-specific Skills used in painting with water colors, whole-numberskills and algorithms division algorithm
Knowledge of subject-specific Interview techniques, scientific methodtechniques and methods
Knowledge of criteria for Criteria used to determine when to apply a proceduredetermining when to use involving Newton's second law, criteria used to judgeappropriate procedures the feasibility of using a particular method to estimate
business costs
4. Metacognitive Knowledge—Knowledge of cognition in general as well as awareness and knowledge of one's cognition
Strategic knowledge Knowledge of outlining as a means of capturing the structure of a unit of subject matter in a text book,knowledge of the use of heuristics
Knowledge about cognitive Knowledge of the types of tests particular teacherstasks, including appropriate administer, knowledge of the cognitive demands ofcontextual and conditional different tasksknowledge
Self-knowledge Knowledge that critiquing essays is a personal strength,whereas writing essays is a personal weakness;awareness of one's own knowledge level
SOURCE: Adapted from Anderson and Krathwohl (2001).
Table 1 (continued)
-27-
1. Teacher models ways to think about, organize, and remember information.
a. Teacher models thinking strategies, such as outlining or summarizing, or shows students how to outline.
b. Teacher demonstrates use of a mnemonic and makes suggestions for ways students can use mnemonics for future learning/remembering.
c. Teacher models using a visual organizer (i.e. the setting up of information in charts, tables, diagrams, maps, Venn diagrams, etc.) or tells students how to use a visual organizer(s) or discusses the rationale for organizing information in this way.
d. Teacher illustrates concepts (e.g. using colors, shapes, manipulable objects to demonstrate a math concept)
• Uses multiple representations of ideas• Uses multiple examples that convey the points in several ways.
2. Teacher explains ideas by connecting them to students' own experience andprior learning.
a. Teacher draws on his or her own and students' lives or experiences, relating them to the current academic topic.
• Relates to teacher's own experiences• Relates to students' own experiences • Relates to current events• Relates to media representations
b. Teacher reminds class of previous lessons, concepts, activities and relates these to current work in a way that goes beyond remembering facts but rather, broadens or extends what was previously learned.
3. Teacher talks about reasoning.
a. Teacher provides a "why" or "how" explanation, rather than simply telling students the right answers.
b. Teacher develops the reasoning behind right or wrong answers.
c. Teacher explains, elaborates, to move students beyond a wrong answer.
d. Teacher talks about how to think through problem.
4. Teacher teaches students strategies for planning, revising, and evaluating.
a. Teacher models for students how to plan, through techniques such as brainstorming, outlining, etc., or teacher tells students how to use these techniques.
b. Teacher helps students examine, revise, and reflect on their own work, showing them strategies for doing this.
c. Teacher and students create a rubric together to be used in evaluating work.
(continued)
The First Things First Classroom Observation Study
Table 2
Strategies Associated with Teaching for Understanding
-28-
5. Teacher structures an activity or lesson.
a. Teacher breaks down more complex and ambiguous tasks into steps or shows students how to do this for themselves at a later time.
b. Teacher sets up an activity or lesson by providing steps of the process.
c. Teacher suggests several different ways to break down the task.
d. Teacher provides checkpoints, so students stay on track.
e. Teacher models how she/he is structuring a lesson/activity so that students are exposed to the steps the teacher went through.
SOURCE: Adapted from materials provided by Dr. Phyllis Blumenfeld, University of Michigan.
Table 2 (continued)
-29-
1. Teacher encourages students to come up with their own ways to think about,organize, and remember information.
a. Teacher encourages students to come up with, use, and evaluate a variety of options for thinking about, remembering, and organizing information.(Examples may include writing, diagramming, use of mnemonics, visual organizers, such as mind maps. The key is that it is not enough for the students to be doing this.The teacher must be asking "how" and "why" questions about their choices, e.g."Why do you think this might be the most effective way to organize this"information?")
b. Teacher asks "how" and "why" questions about what the students are doing and asksabout the pros and cons of their methods of organizing information.
2. Teacher encourage students to explain ideas through linking, showing the meaning they have constructed.
a. Again, the key ingredient of pressing for understanding is asking the "why" or "how"questions. ("How does your example relate to what we're studying here?")
b. Teacher asks students for examples of the current content/topic in their ownexperiences, in current events, in the media, asks them to explain why or how theexamples relate to the topic.
c. Teacher asks students to relate the current content/topic to previous lessons, concepts, or academic activities and to explain how or why these are related.
3. Teacher encourages students to reason with "how" and "why" questions.
a. Teacher asks students "how" and "why" questions (e.g., "How did you get thatanswer?" or "Explain why you think that.")Note: This is more than asking a student to repeat a procedural rule. Students wouldbe asked to provide reasons behind the rules they are applying to demonstrate their understanding of the rule.
4. Teacher encourages students to talk about planning, revising and evaluating.
a. Teacher asks students to talk about planning, revising, or evaluating their work, andto explain "how" or "why" they planned, revised, evaluated as they did.
b. Teacher encourages students to explain pros/cons of the options they considered.
c. Teacher asks students to plan and think about ways to evaluate what they did and todevelop a rationale for choosing the ways they plan to use.
(continued)
The First Things First Classroom Observation Study
Table 3
Strategies Associated with Pressing for Understanding
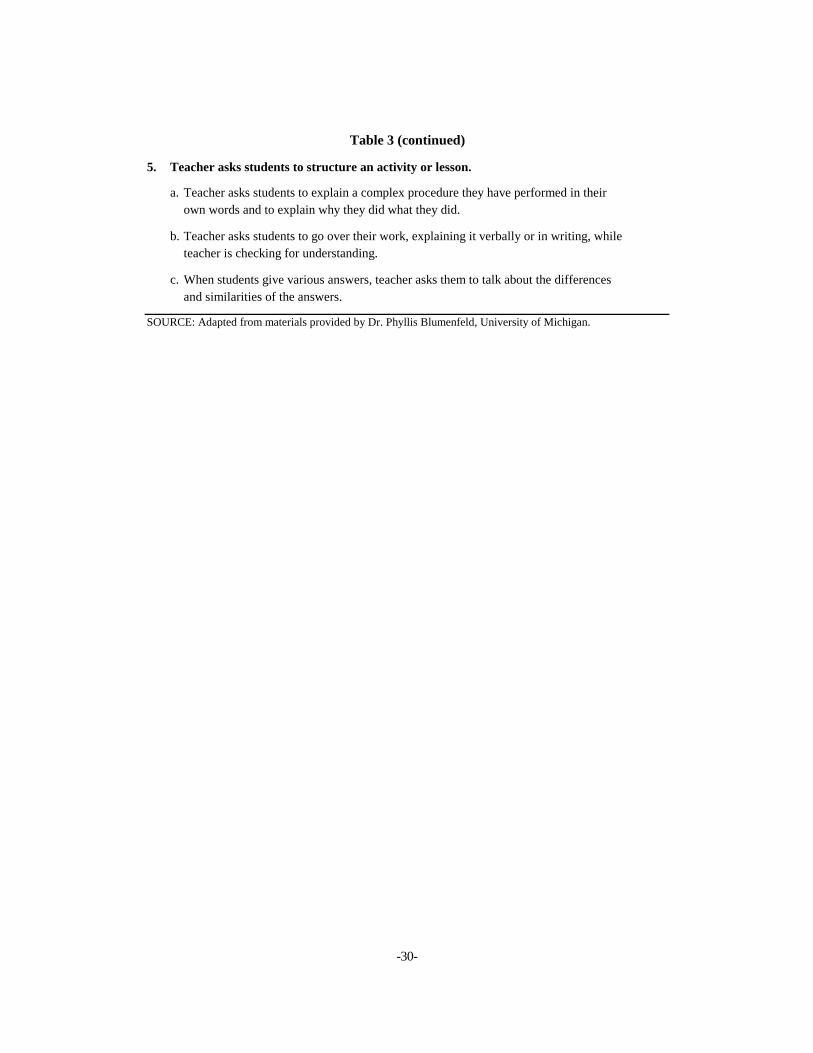
-30-
5. Teacher asks students to structure an activity or lesson.
a. Teacher asks students to explain a complex procedure they have performed in theirown words and to explain why they did what they did.
b. Teacher asks students to go over their work, explaining it verbally or in writing, whileteacher is checking for understanding.
c. When students give various answers, teacher asks them to talk about the differencesand similarities of the answers.
SOURCE: Adapted from materials provided by Dr. Phyllis Blumenfeld, University of Michigan.
Table 3 (continued)
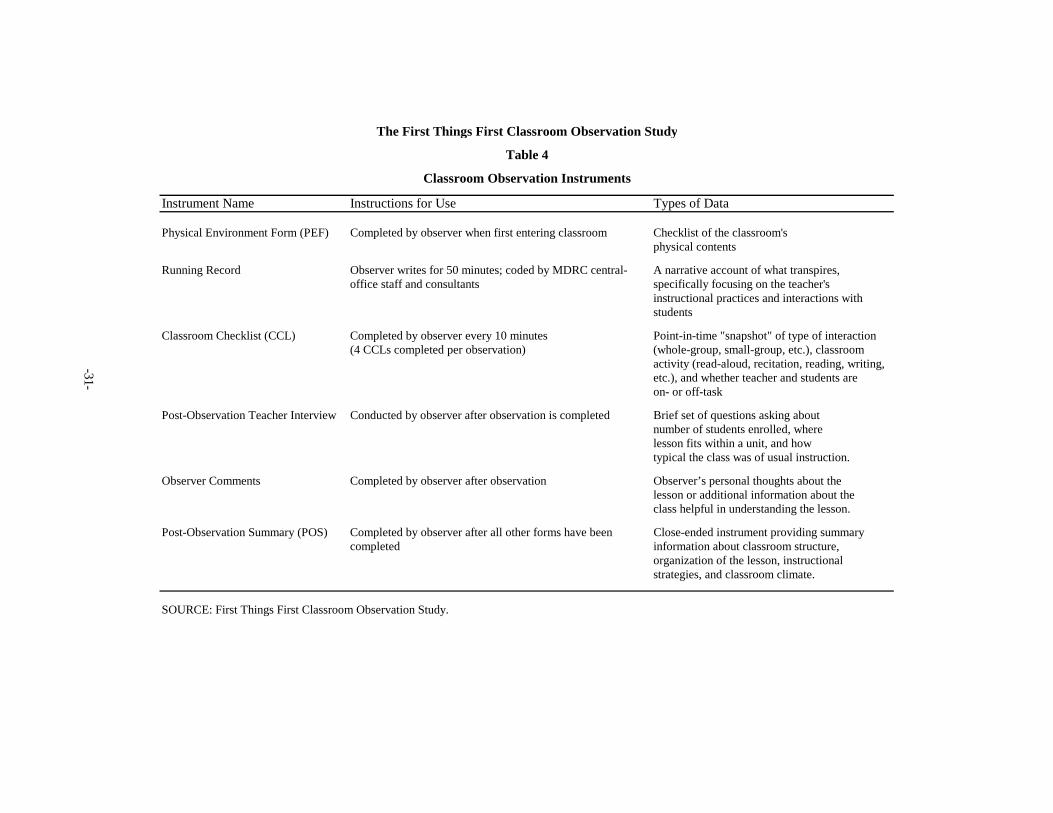
Instrument Name Instructions for Use Types of Data
Physical Environment Form (PEF) Completed by observer when first entering classroom Checklist of the classroom's physical contents
Running Record Observer writes for 50 minutes; coded by MDRC central- A narrative account of what transpires,office staff and consultants specifically focusing on the teacher's
instructional practices and interactions with students
Classroom Checklist (CCL) Completed by observer every 10 minutes Point-in-time "snapshot" of type of interaction(4 CCLs completed per observation) (whole-group, small-group, etc.), classroom
activity (read-aloud, recitation, reading, writing,etc.), and whether teacher and students areon- or off-task
Post-Observation Teacher Interview Conducted by observer after observation is completed Brief set of questions asking about number of students enrolled, wherelesson fits within a unit, and howtypical the class was of usual instruction.
Observer Comments Completed by observer after observation Observer’s personal thoughts about the lesson or additional information about the class helpful in understanding the lesson.
Post-Observation Summary (POS) Completed by observer after all other forms have been Close-ended instrument providing summary completed information about classroom structure,
organization of the lesson, instructional strategies, and classroom climate.
Table 4
Classroom Observation Instruments
The First Things First Classroom Observation Study
SOURCE: First Things First Classroom Observation Study.
-31-
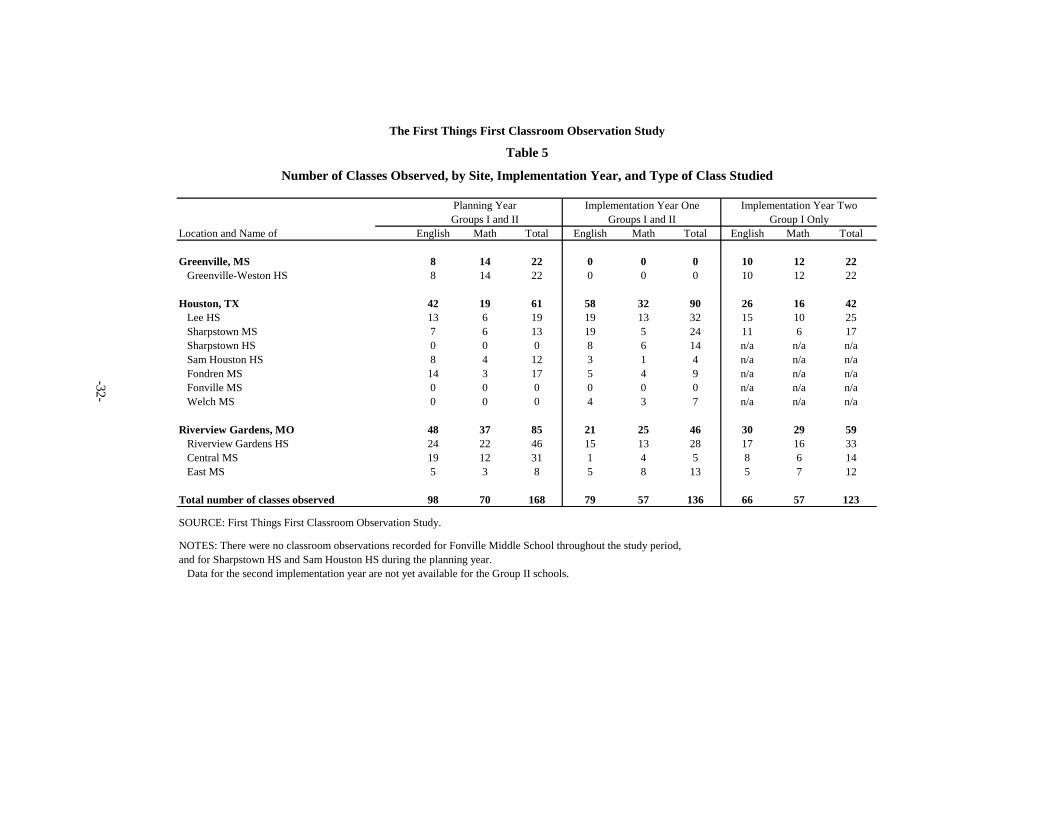
Location and Name of English Math Total English Math Total English Math Total
Greenville, MS 8 14 22 0 0 0 10 12 22 Greenville-Weston HS 8 14 22 0 0 0 10 12 22
Houston, TX 42 19 61 58 32 90 26 16 42 Lee HS 13 6 19 19 13 32 15 10 25 Sharpstown MS 7 6 13 19 5 24 11 6 17 Sharpstown HS 0 0 0 8 6 14 n/a n/a n/a Sam Houston HS 8 4 12 3 1 4 n/a n/a n/a Fondren MS 14 3 17 5 4 9 n/a n/a n/a Fonville MS 0 0 0 0 0 0 n/a n/a n/a Welch MS 0 0 0 4 3 7 n/a n/a n/a
Riverview Gardens, MO 48 37 85 21 25 46 30 29 59 Riverview Gardens HS 24 22 46 15 13 28 17 16 33 Central MS 19 12 31 1 4 5 8 6 14 East MS 5 3 8 5 8 13 5 7 12
Total number of classes observed 98 70 168 79 57 136 66 57 123
SOURCE: First Things First Classroom Observation Study.
NOTES: There were no classroom observations recorded for Fonville Middle School throughout the study period, and for Sharpstown HS and Sam Houston HS during the planning year. Data for the second implementation year are not yet available for the Group II schools.
Implementation Year TwoGroup I Only
The First Things First Classroom Observation Study
Table 5
Number of Classes Observed, by Site, Implementation Year, and Type of Class Studied
Planning YearGroups I and II
Implementation Year OneGroups I and II
-32-
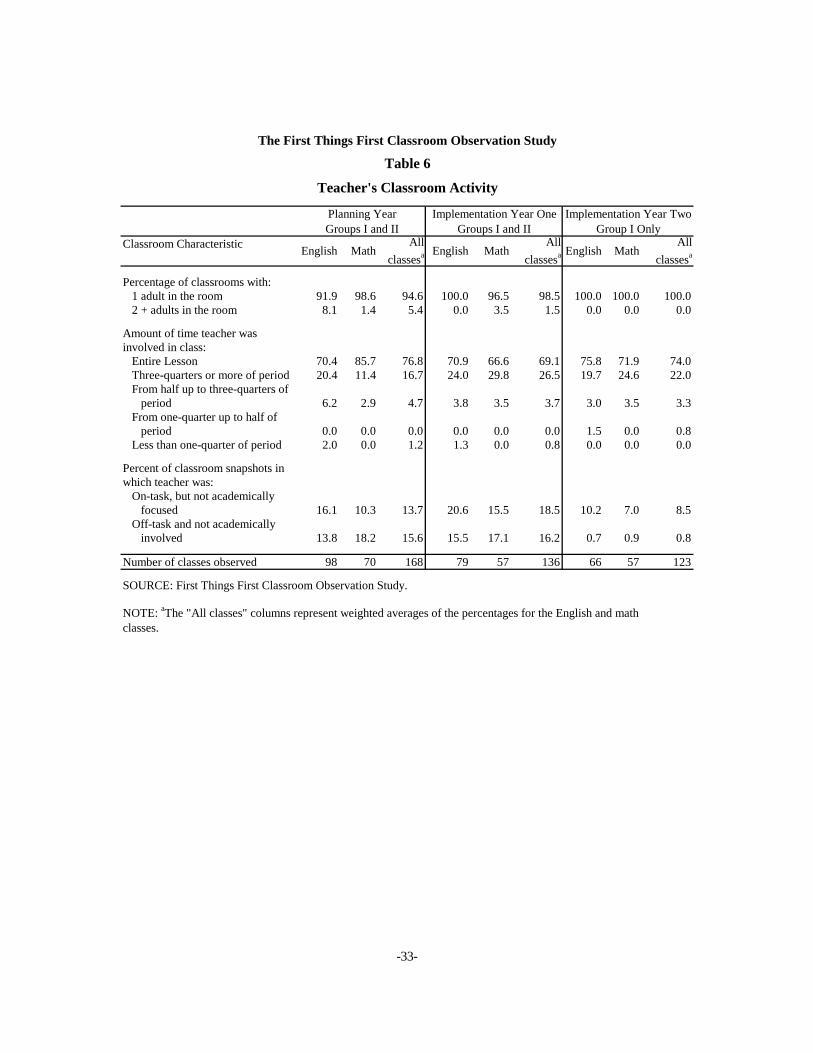
-33-
Classroom Characteristic
Percentage of classrooms with: 1 adult in the room 91.9 98.6 94.6 100.0 96.5 98.5 100.0 100.0 100.0 2 + adults in the room 8.1 1.4 5.4 0.0 3.5 1.5 0.0 0.0 0.0
Amount of time teacher was involved in class: Entire Lesson 70.4 85.7 76.8 70.9 66.6 69.1 75.8 71.9 74.0 Three-quarters or more of period 20.4 11.4 16.7 24.0 29.8 26.5 19.7 24.6 22.0 From half up to three-quarters of period 6.2 2.9 4.7 3.8 3.5 3.7 3.0 3.5 3.3 From one-quarter up to half of period 0.0 0.0 0.0 0.0 0.0 0.0 1.5 0.0 0.8 Less than one-quarter of period 2.0 0.0 1.2 1.3 0.0 0.8 0.0 0.0 0.0
Percent of classroom snapshots inwhich teacher was: On-task, but not academically focused 16.1 10.3 13.7 20.6 15.5 18.5 10.2 7.0 8.5 Off-task and not academically involved 13.8 18.2 15.6 15.5 17.1 16.2 0.7 0.9 0.8
Number of classes observed 98 70 168 79 57 136 66 57 123
SOURCE: First Things First Classroom Observation Study.
NOTE: aThe "All classes" columns represent weighted averages of the percentages for the English and math classes.
All classesaMathEnglish
All classesa
All classesa MathEnglishMathEnglish
The First Things First Classroom Observation Study
Implementation Year TwoImplementation Year OnePlanning Year
Teacher's Classroom Activity
Groups I and II Groups I and II Group I Only
Table 6
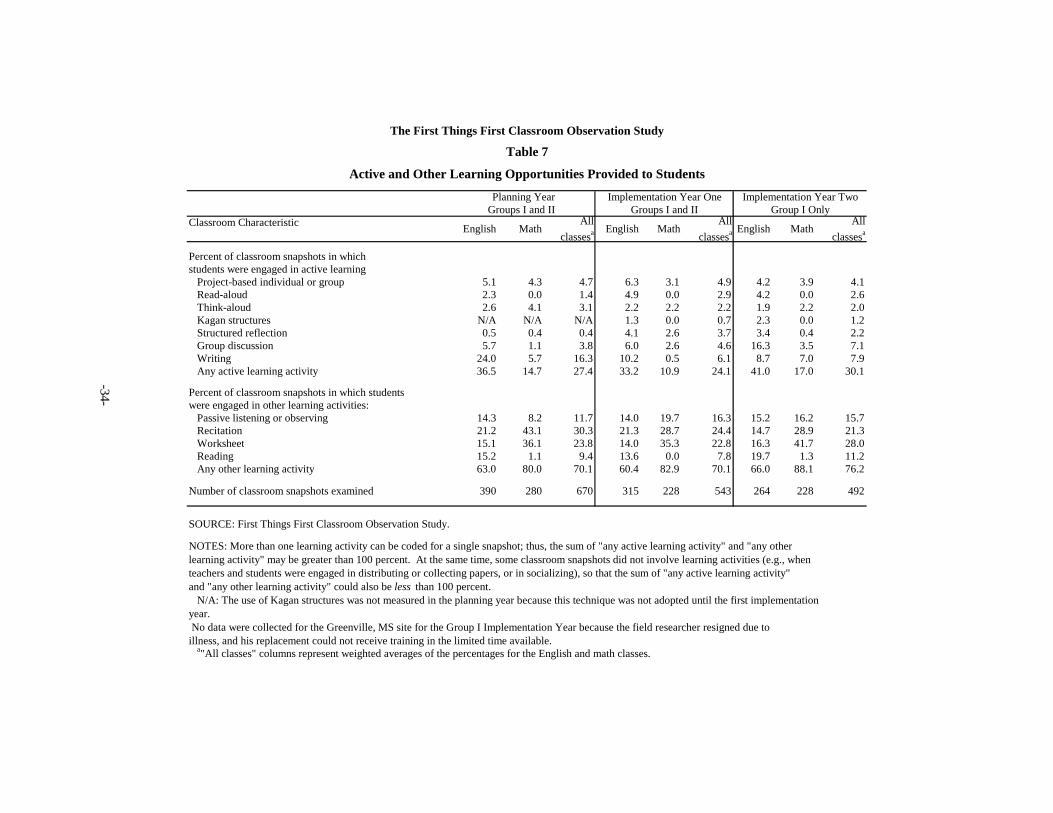
-34-
Groups I and IIClassroom Characteristic
Percent of classroom snapshots in which students were engaged in active learning Project-based individual or group 5.1 4.3 4.7 6.3 3.1 4.9 4.2 3.9 4.1 Read-aloud 2.3 0.0 1.4 4.9 0.0 2.9 4.2 0.0 2.6 Think-aloud 2.6 4.1 3.1 2.2 2.2 2.2 1.9 2.2 2.0 Kagan structures N/A N/A N/A 1.3 0.0 0.7 2.3 0.0 1.2 Structured reflection 0.5 0.4 0.4 4.1 2.6 3.7 3.4 0.4 2.2 Group discussion 5.7 1.1 3.8 6.0 2.6 4.6 16.3 3.5 7.1 Writing 24.0 5.7 16.3 10.2 0.5 6.1 8.7 7.0 7.9 Any active learning activity 36.5 14.7 27.4 33.2 10.9 24.1 41.0 17.0 30.1
Percent of classroom snapshots in which studentswere engaged in other learning activities: Passive listening or observing 14.3 8.2 11.7 14.0 19.7 16.3 15.2 16.2 15.7 Recitation 21.2 43.1 30.3 21.3 28.7 24.4 14.7 28.9 21.3 Worksheet 15.1 36.1 23.8 14.0 35.3 22.8 16.3 41.7 28.0 Reading 15.2 1.1 9.4 13.6 0.0 7.8 19.7 1.3 11.2 Any other learning activity 63.0 80.0 70.1 60.4 82.9 70.1 66.0 88.1 76.2
Number of classroom snapshots examined 390 280 670 315 228 543 264 228 492
SOURCE: First Things First Classroom Observation Study.
NOTES: More than one learning activity can be coded for a single snapshot; thus, the sum of "any active learning activity" and "any other learning activity" may be greater than 100 percent. At the same time, some classroom snapshots did not involve learning activities (e.g., when teachers and students were engaged in distributing or collecting papers, or in socializing), so that the sum of "any active learning activity" and "any other learning activity" could also be less than 100 percent. N/A: The use of Kagan structures was not measured in the planning year because this technique was not adopted until the first implementationyear. No data were collected for the Greenville, MS site for the Group I Implementation Year because the field researcher resigned due to illness, and his replacement could not receive training in the limited time available. a"All classes" columns represent weighted averages of the percentages for the English and math classes.
Math EnglishEnglish
The First Things First Classroom Observation Study
Table 7
Active and Other Learning Opportunities Provided to Students
Planning Year Implementation Year One
EnglishAll
classesaAll
classesaAll
classesaMath
Groups I and II Group I OnlyImplementation Year Two
Math
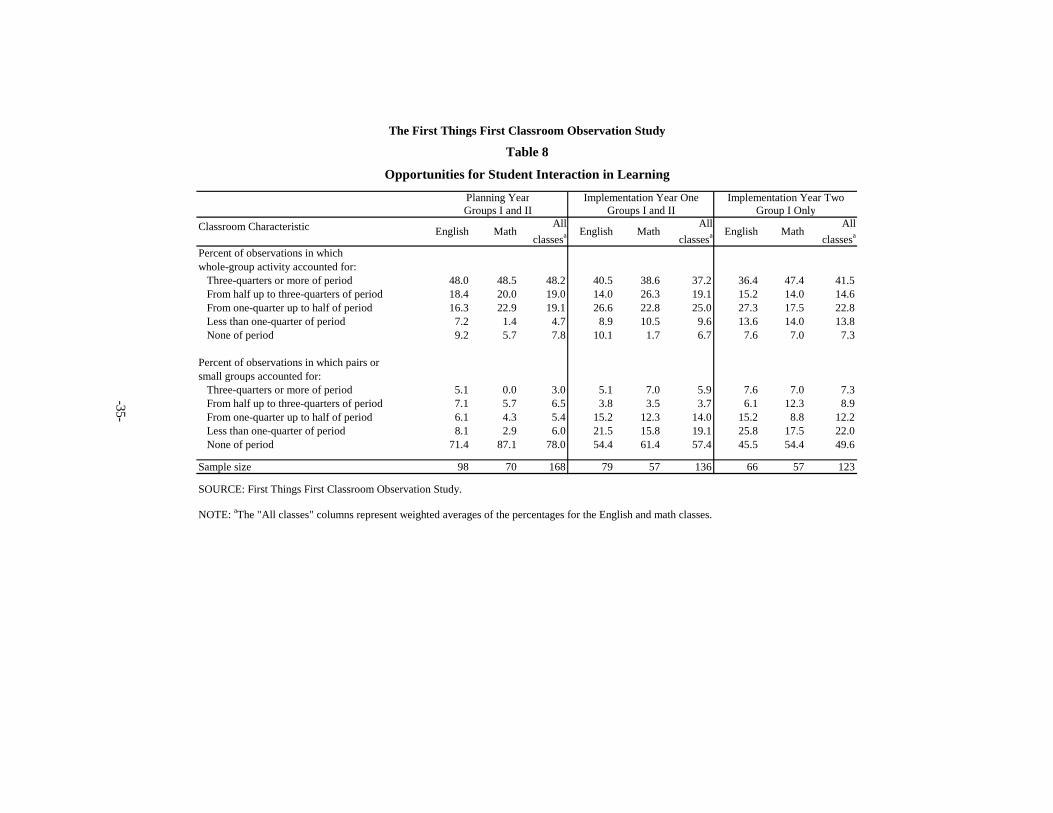
-35-
Classroom Characteristic
Percent of observations in whichwhole-group activity accounted for: Three-quarters or more of period 48.0 48.5 48.2 40.5 38.6 37.2 36.4 47.4 41.5 From half up to three-quarters of period 18.4 20.0 19.0 14.0 26.3 19.1 15.2 14.0 14.6 From one-quarter up to half of period 16.3 22.9 19.1 26.6 22.8 25.0 27.3 17.5 22.8 Less than one-quarter of period 7.2 1.4 4.7 8.9 10.5 9.6 13.6 14.0 13.8 None of period 9.2 5.7 7.8 10.1 1.7 6.7 7.6 7.0 7.3
Percent of observations in which pairs orsmall groups accounted for: Three-quarters or more of period 5.1 0.0 3.0 5.1 7.0 5.9 7.6 7.0 7.3 From half up to three-quarters of period 7.1 5.7 6.5 3.8 3.5 3.7 6.1 12.3 8.9 From one-quarter up to half of period 6.1 4.3 5.4 15.2 12.3 14.0 15.2 8.8 12.2 Less than one-quarter of period 8.1 2.9 6.0 21.5 15.8 19.1 25.8 17.5 22.0 None of period 71.4 87.1 78.0 54.4 61.4 57.4 45.5 54.4 49.6
Sample size 98 70 168 79 57 136 66 57 123
SOURCE: First Things First Classroom Observation Study.
NOTE: aThe "All classes" columns represent weighted averages of the percentages for the English and math classes.
The First Things First Classroom Observation Study
Table 8
Opportunities for Student Interaction in Learning
Group I OnlyGroups I and IIGroups I and IIPlanning Year Implementation Year TwoImplementation Year One
MathEnglish MathEnglish EnglishAll
classesaAll
classesaAll
classesaMath
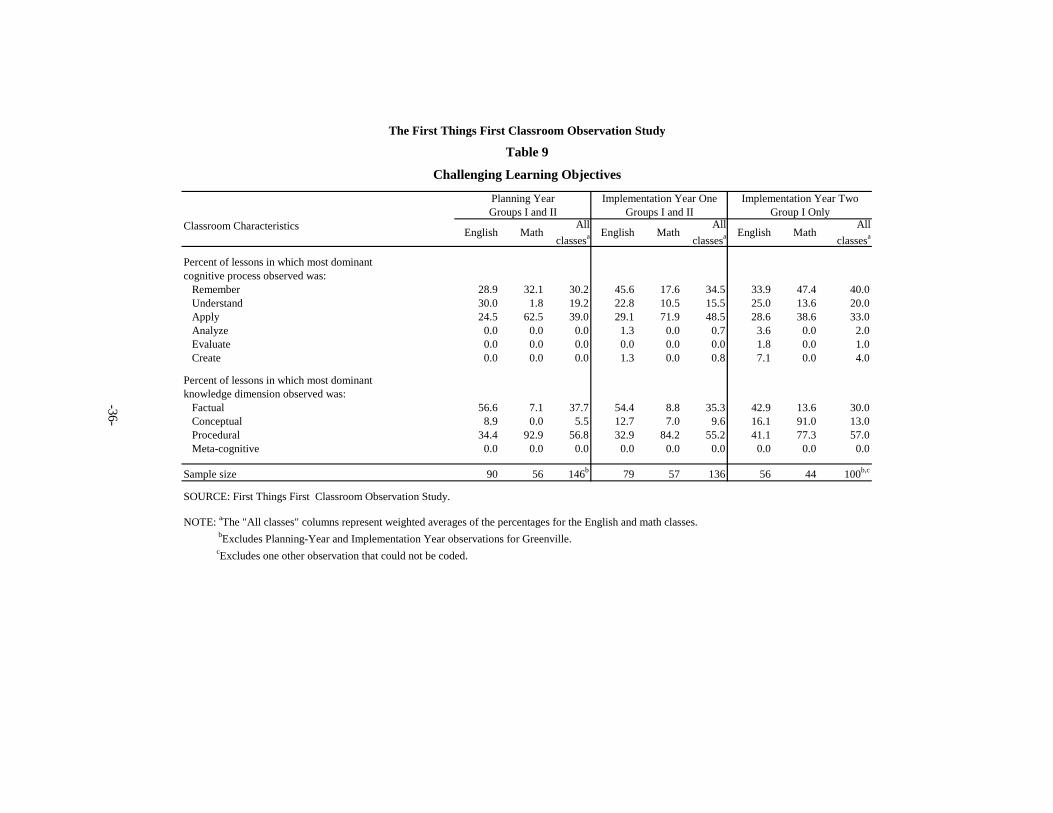
-36-
Classroom Characteristics
Percent of lessons in which most dominantcognitive process observed was: Remember 28.9 32.1 30.2 45.6 17.6 34.5 33.9 47.4 40.0 Understand 30.0 1.8 19.2 22.8 10.5 15.5 25.0 13.6 20.0 Apply 24.5 62.5 39.0 29.1 71.9 48.5 28.6 38.6 33.0 Analyze 0.0 0.0 0.0 1.3 0.0 0.7 3.6 0.0 2.0 Evaluate 0.0 0.0 0.0 0.0 0.0 0.0 1.8 0.0 1.0 Create 0.0 0.0 0.0 1.3 0.0 0.8 7.1 0.0 4.0
Percent of lessons in which most dominantknowledge dimension observed was: Factual 56.6 7.1 37.7 54.4 8.8 35.3 42.9 13.6 30.0 Conceptual 8.9 0.0 5.5 12.7 7.0 9.6 16.1 91.0 13.0 Procedural 34.4 92.9 56.8 32.9 84.2 55.2 41.1 77.3 57.0 Meta-cognitive 0.0 0.0 0.0 0.0 0.0 0.0 0.0 0.0 0.0
Sample size 90 56 146b 79 57 136 56 44 100b,c
SOURCE: First Things First Classroom Observation Study.
NOTE: aThe "All classes" columns represent weighted averages of the percentages for the English and math classes. bExcludes Planning-Year and Implementation Year observations for Greenville. cExcludes one other observation that could not be coded.
The First Things First Classroom Observation Study
Implementation Year TwoGroup I Only
Challenging Learning Objectives
Table 9
Planning YearGroups I and II
Implementation Year OneGroups I and II
English MathAll
classesa EnglishAll
classesaMath English MathAll
classesa
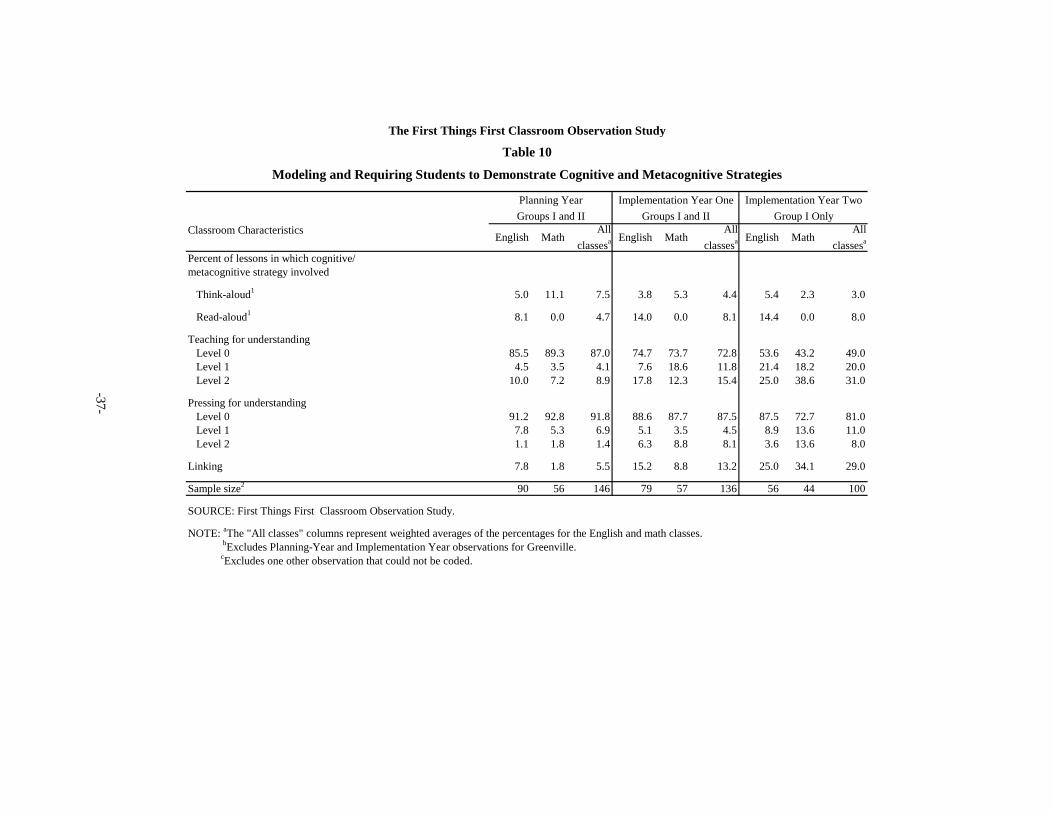
-37-
Classroom Characteristics
Percent of lessons in which cognitive/metacognitive strategy involved
Think-aloud1 5.0 11.1 7.5 3.8 5.3 4.4 5.4 2.3 3.0
Read-aloud1 8.1 0.0 4.7 14.0 0.0 8.1 14.4 0.0 8.0
Teaching for understanding Level 0 85.5 89.3 87.0 74.7 73.7 72.8 53.6 43.2 49.0 Level 1 4.5 3.5 4.1 7.6 18.6 11.8 21.4 18.2 20.0 Level 2 10.0 7.2 8.9 17.8 12.3 15.4 25.0 38.6 31.0
Pressing for understanding Level 0 91.2 92.8 91.8 88.6 87.7 87.5 87.5 72.7 81.0 Level 1 7.8 5.3 6.9 5.1 3.5 4.5 8.9 13.6 11.0 Level 2 1.1 1.8 1.4 6.3 8.8 8.1 3.6 13.6 8.0
Linking 7.8 1.8 5.5 15.2 8.8 13.2 25.0 34.1 29.0
Sample size2 90 56 146 79 57 136 56 44 100
SOURCE: First Things First Classroom Observation Study.
NOTE: aThe "All classes" columns represent weighted averages of the percentages for the English and math classes. bExcludes Planning-Year and Implementation Year observations for Greenville. cExcludes one other observation that could not be coded.
Implementation Year TwoGroup I Only
The First Things First Classroom Observation Study
Table 10
Modeling and Requiring Students to Demonstrate Cognitive and Metacognitive Strategies
Planning YearGroups I and II
Implementation Year OneGroups I and II
English MathAll
classesaAll
classesaEnglishAll
classesaMathMath English
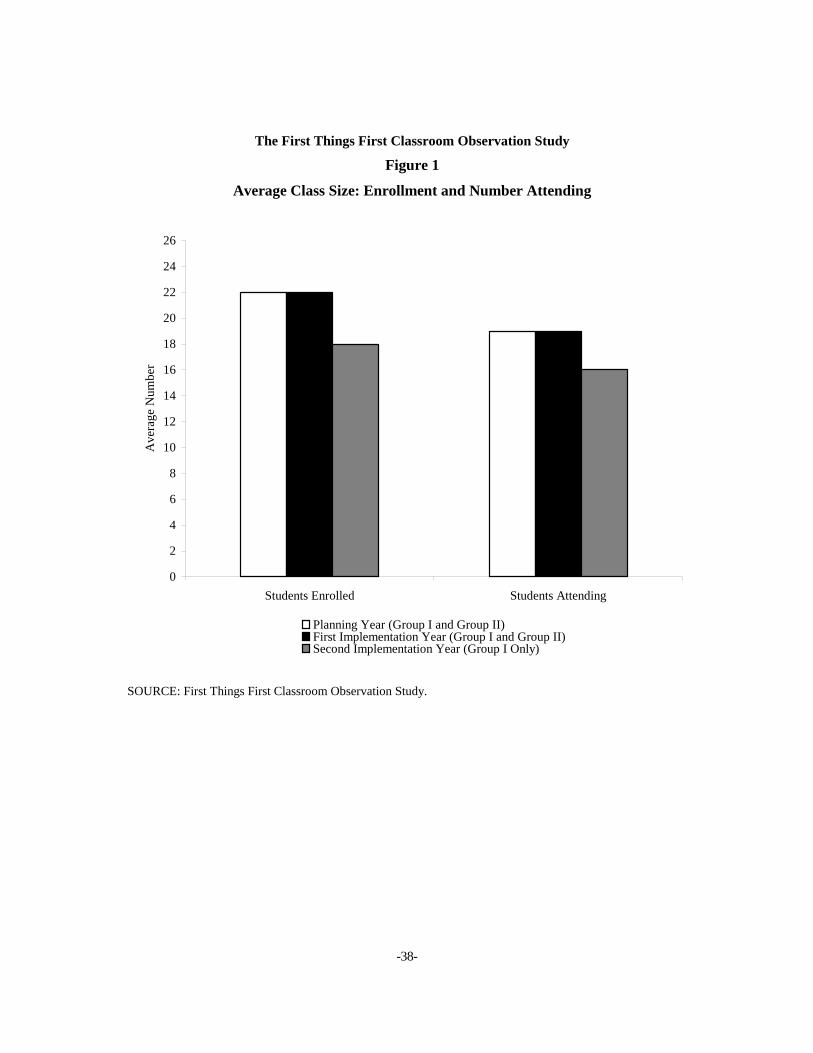
-38-
SOURCE: First Things First Classroom Observation Study.
The First Things First Classroom Observation Study
Figure 1
Average Class Size: Enrollment and Number Attending
0
2
4
6
8
10
12
14
16
18
20
22
24
26
Students Enrolled Students Attending
Ave
rage
Num
ber
Planning Year (Group I and Group II)First Implementation Year (Group I and Group II)Second Implementation Year (Group I Only)
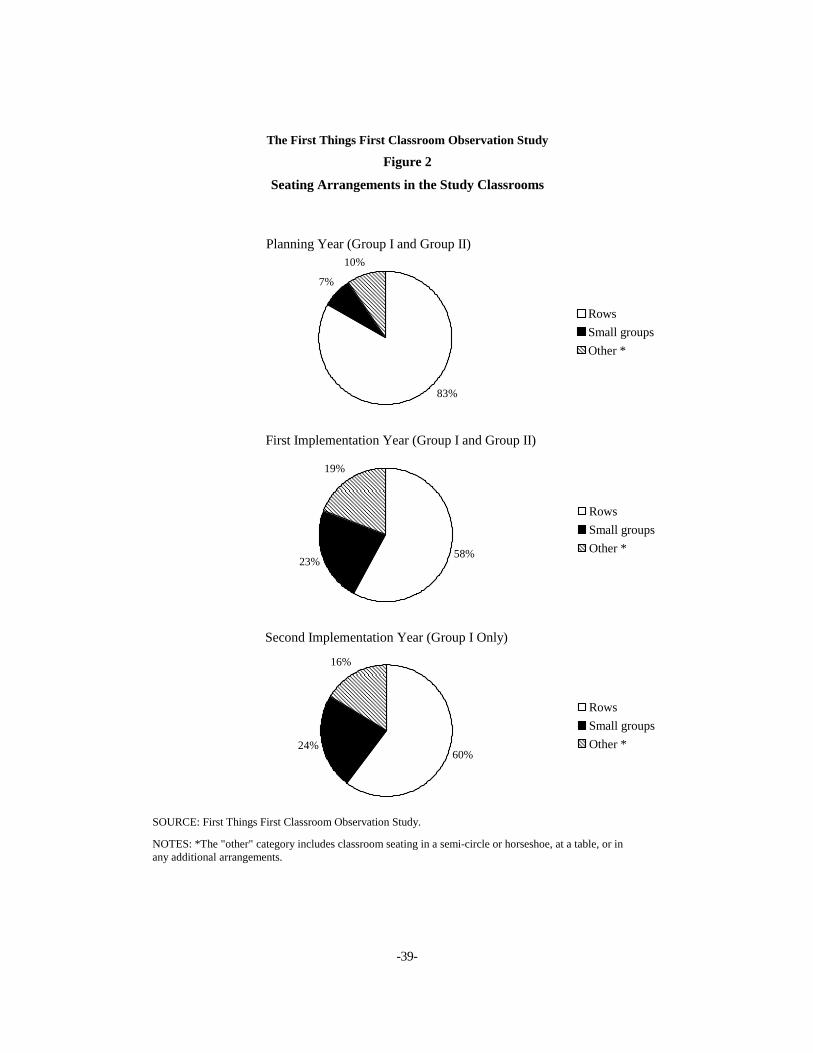
-39-
SOURCE: First Things First Classroom Observation Study.
NOTES: *The "other" category includes classroom seating in a semi-circle or horseshoe, at a table, or in any additional arrangements.
The First Things First Classroom Observation Study
Figure 2
Seating Arrangements in the Study Classrooms
Planning Year (Group I and Group II)
7%
10%
83%
RowsSmall groupsOther *
First Implementation Year (Group I and Group II)
58%23%
19%
RowsSmall groupsOther *
Second Implementation Year (Group I Only)
60%24%
16%
RowsSmall groupsOther *
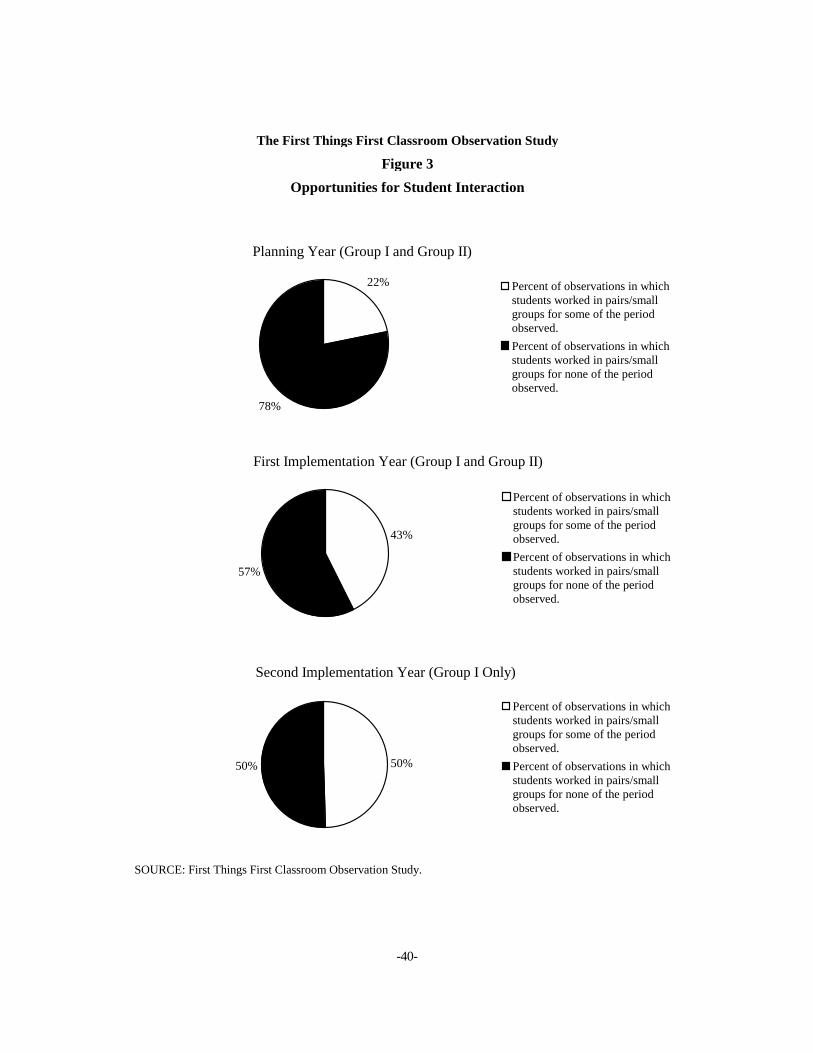
-40-
SOURCE: First Things First Classroom Observation Study.
The First Things First Classroom Observation Study
Opportunities for Student InteractionFigure 3
Planning Year (Group I and Group II)
22%
78%
Percent of observations in whichstudents worked in pairs/smallgroups for some of the periodobserved.Percent of observations in whichstudents worked in pairs/smallgroups for none of the periodobserved.
First Implementation Year (Group I and Group II)
43%
57%
Percent of observations in whichstudents worked in pairs/smallgroups for some of the periodobserved.Percent of observations in whichstudents worked in pairs/smallgroups for none of the periodobserved.
Second Implementation Year (Group I Only)
50%50%
Percent of observations in whichstudents worked in pairs/smallgroups for some of the periodobserved.Percent of observations in whichstudents worked in pairs/smallgroups for none of the periodobserved.
Appendix A
Data Collection Instruments
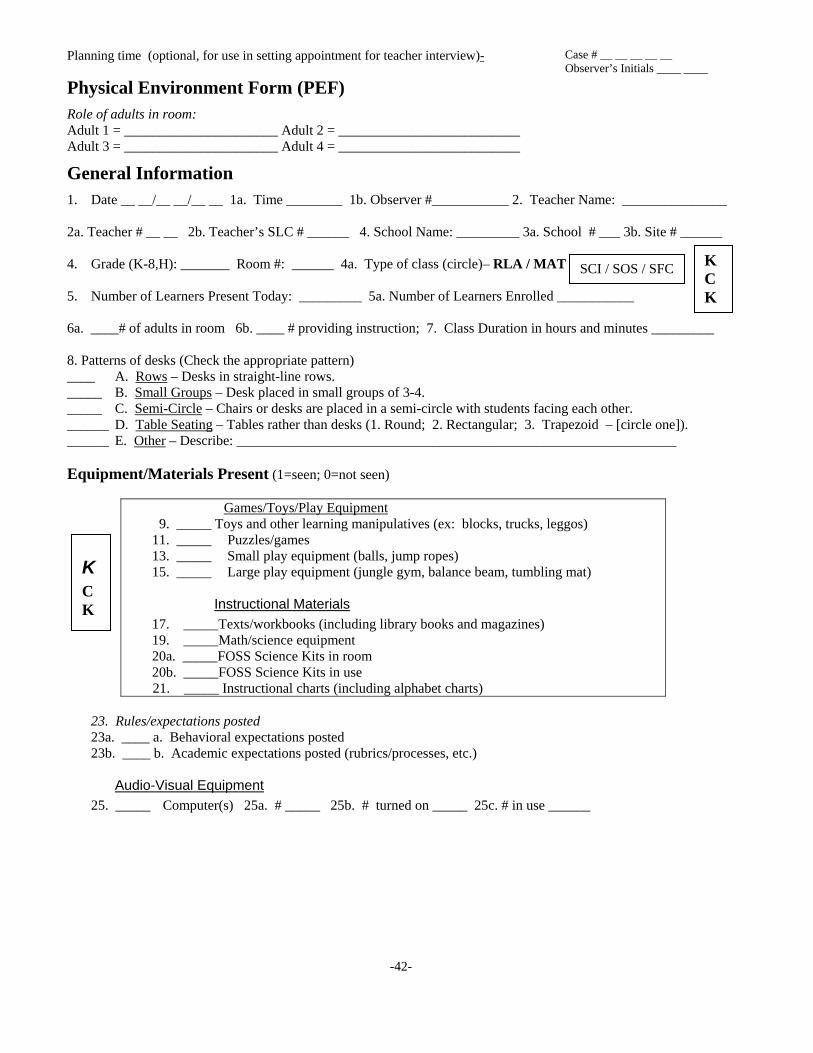
-42-
Planning time (optional, for use in setting appointment for teacher interview)-
Physical Environment Form (PEF) Role of adults in room: Adult 1 = ______________________ Adult 2 = __________________________ Adult 3 = ______________________ Adult 4 = __________________________
Case # __ __ __ __ __ Observer’s Initials ____ ____
General Information 1. Date __ __/__ __/__ __ 1a. Time ________ 1b. Observer #___________ 2. Teacher Name: _______________ 2a. Teacher # __ __ 2b. Teacher’s SLC # ______ 4. School Name: _________ 3a. School # ___ 3b. Site # ______ 4. Grade (K-8,H): _______ Room #: ______ 4a. Type of class (circle)– RLA / MAT 5. Number of Learners Present Today: _________ 5a. Number of Learners Enrolled ___________ 6a. ____# of adults in room 6b. ____ # providing instruction; 7. Class Duration in hours and minutes _________ 8. Patterns of desks (Check the appropriate pattern) ____ A. Rows – Desks in straight-line rows. _____ B. Small Groups – Desk placed in small groups of 3-4. _____ C. Semi-Circle – Chairs or desks are placed in a semi-circle with students facing each other. ______ D. Table Seating – Tables rather than desks (1. Round; 2. Rectangular; 3. Trapezoid – [circle one]). ______ E. Other – Describe: _______________________________________________________________ Equipment/Materials Present (1=seen; 0=not seen)
Games/Toys/Play Equipment 9. _____ Toys and other learning manipulatives (ex: blocks, trucks, leggos) 11. _____ Puzzles/games 13. _____ Small play equipment (balls, jump ropes) 15. _____ Large play equipment (jungle gym, balance beam, tumbling mat)
Instructional Materials 17. _____Texts/workbooks (including library books and magazines) 19. _____Math/science equipment 20a. _____FOSS Science Kits in room 20b. _____FOSS Science Kits in use
21. _____ Instructional charts (including alphabet charts) 23. Rules/expectations posted 23a. ____ a. Behavioral expectations posted 23b. ____ b. Academic expectations posted (rubrics/processes, etc.)
Audio-Visual Equipment 25. _____ Computer(s) 25a. # _____ 25b. # turned on _____ 25c. # in use ______
K C K
KC K
SCI / SOS / SFC

-43-
General Equipment/Materials
34. Learner’s own products on display 34a. ____ Worksheets (ex.___________________________________________) 34b. ____ Original and identical (ex. __________________________________) 34c. ____ Original and varied (ex.____________________________________)
36. _____ Displays reflecting student’s ethnicity 38. _____ Achievement/progress charts 44. _____ Arts and crafts materials/musical instruments 45. _____ Other, not reflected above: _______________________________________________________
KCK

-44-
Running Record Form
Date of Observation: __ __/__ __/__ __ Teacher Number: ___ ___ ___ Site Number: _____ Case Number: ___ ___ ___ ___ ___ School Number: _____ Observer’s Initials: ____ ____
Cycle #1: (time: _____ to _____) Cycle #2: (time: _____ to _____)
-45-
Cycle #3: (time: _____ to _____) Cycle #4: (time: _____ to _____) Cycle #5: (time: _____ to _____)
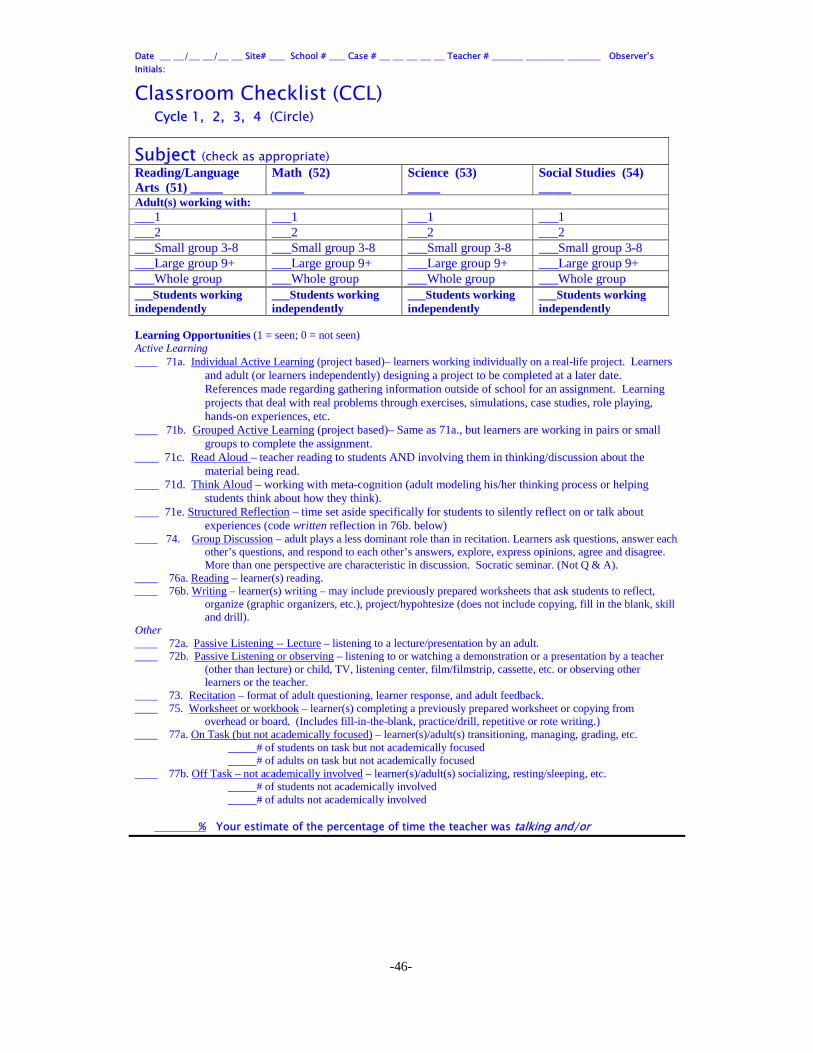
-46-
Date / / Site# School # Case # Teacher # Observer’s Initials:
Classroom Checklist (CCL)
Cycle 1, 2, 3, 4 (Circle)
Subject (check as appropriate) Reading/Language Arts (51) _____
Math (52) _____
Science (53) _____
Social Studies (54) _____
Adult(s) working with: ___1 ___1 ___1 ___1 ___2 ___2 ___2 ___2 ___Small group 3-8 ___Small group 3-8 ___Small group 3-8 ___Small group 3-8 ___Large group 9+ ___Large group 9+ ___Large group 9+ ___Large group 9+ ___Whole group ___Whole group ___Whole group ___Whole group ___Students working independently
___Students working independently
___Students working independently
___Students working independently
Learning Opportunities (1 = seen; 0 = not seen) Active Learning ____ 71a. Individual Active Learning (project based)– learners working individually on a real-life project. Learners
and adult (or learners independently) designing a project to be completed at a later date. References made regarding gathering information outside of school for an assignment. Learning projects that deal with real problems through exercises, simulations, case studies, role playing, hands-on experiences, etc.
____ 71b. Grouped Active Learning (project based)– Same as 71a., but learners are working in pairs or small groups to complete the assignment.
____ 71c. Read Aloud – teacher reading to students AND involving them in thinking/discussion about the material being read.
____ 71d. Think Aloud – working with meta-cognition (adult modeling his/her thinking process or helping students think about how they think).
____ 71e. Structured Reflection – time set aside specifically for students to silently reflect on or talk about experiences (code written reflection in 76b. below)
____ 74. Group Discussion – adult plays a less dominant role than in recitation. Learners ask questions, answer each other’s questions, and respond to each other’s answers, explore, express opinions, agree and disagree. More than one perspective are characteristic in discussion. Socratic seminar. (Not Q & A).
____ 76a. Reading – learner(s) reading. ____ 76b. Writing – learner(s) writing – may include previously prepared worksheets that ask students to reflect,
organize (graphic organizers, etc.), project/hypohtesize (does not include copying, fill in the blank, skill and drill).
Other ____ 72a. Passive Listening -- Lecture – listening to a lecture/presentation by an adult. ____ 72b. Passive Listening or observing – listening to or watching a demonstration or a presentation by a teacher
(other than lecture) or child, TV, listening center, film/filmstrip, cassette, etc. or observing other learners or the teacher.
____ 73. Recitation – format of adult questioning, learner response, and adult feedback. ____ 75. Worksheet or workbook – learner(s) completing a previously prepared worksheet or copying from
overhead or board. (Includes fill-in-the-blank, practice/drill, repetitive or rote writing.) ____ 77a. On Task (but not academically focused) – learner(s)/adult(s) transitioning, managing, grading, etc.
_____# of students on task but not academically focused _____# of adults on task but not academically focused
____ 77b. Off Task – not academically involved – learner(s)/adult(s) socializing, resting/sleeping, etc. _____# of students not academically involved _____# of adults not academically involved
% Your estimate of the percentage of time the teacher was talking and/or
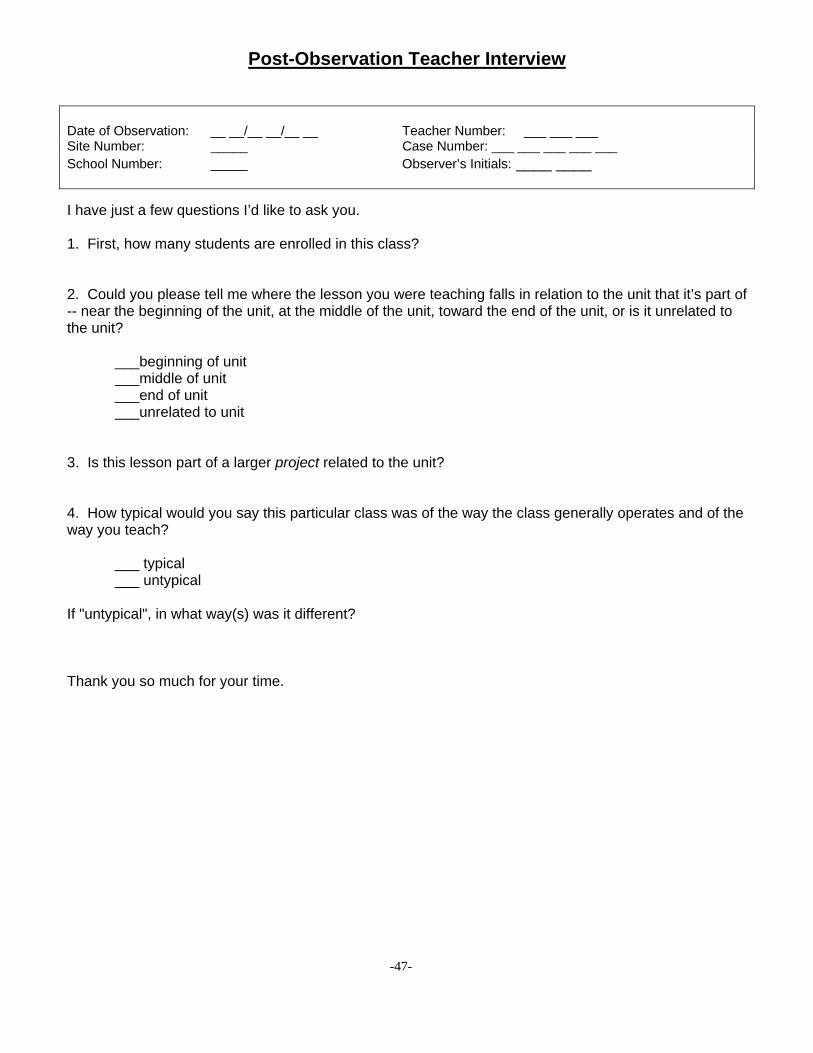
-47-
Post-Observation Teacher Interview
Date of Observation: __ __/__ __/__ __ Teacher Number: ___ ___ ___ Site Number: _____ Case Number: ___ ___ ___ ___ ___ School Number: _____ Observer’s Initials: ____ ____
I have just a few questions I’d like to ask you. 1. First, how many students are enrolled in this class? 2. Could you please tell me where the lesson you were teaching falls in relation to the unit that it’s part of -- near the beginning of the unit, at the middle of the unit, toward the end of the unit, or is it unrelated to the unit? ___beginning of unit ___middle of unit ___end of unit ___unrelated to unit 3. Is this lesson part of a larger project related to the unit? 4. How typical would you say this particular class was of the way the class generally operates and of the way you teach?
___ typical
___ untypical If "untypical", in what way(s) was it different? Thank you so much for your time.
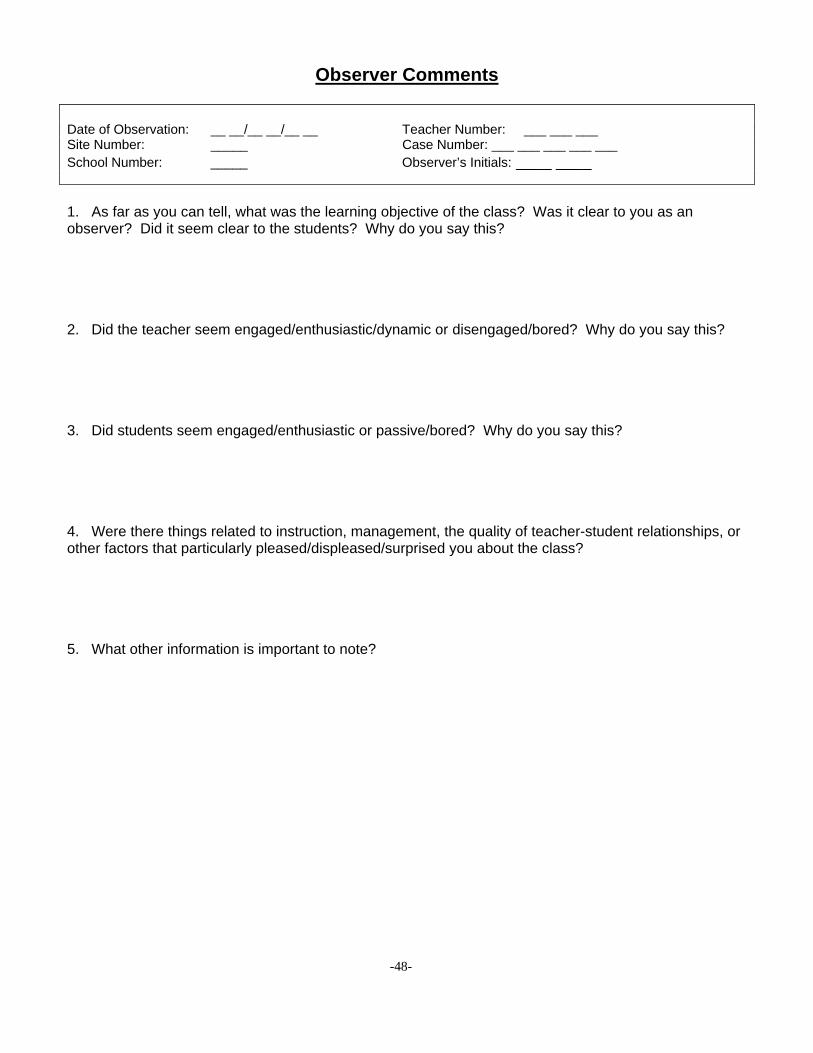
-48-
Observer Comments Date of Observation: __ __/__ __/__ __ Teacher Number: ___ ___ ___ Site Number: _____ Case Number: ___ ___ ___ ___ ___ School Number: _____ Observer’s Initials: ____ ____
1. As far as you can tell, what was the learning objective of the class? Was it clear to you as an observer? Did it seem clear to the students? Why do you say this? 2. Did the teacher seem engaged/enthusiastic/dynamic or disengaged/bored? Why do you say this? 3. Did students seem engaged/enthusiastic or passive/bored? Why do you say this? 4. Were there things related to instruction, management, the quality of teacher-student relationships, or other factors that particularly pleased/displeased/surprised you about the class? 5. What other information is important to note?
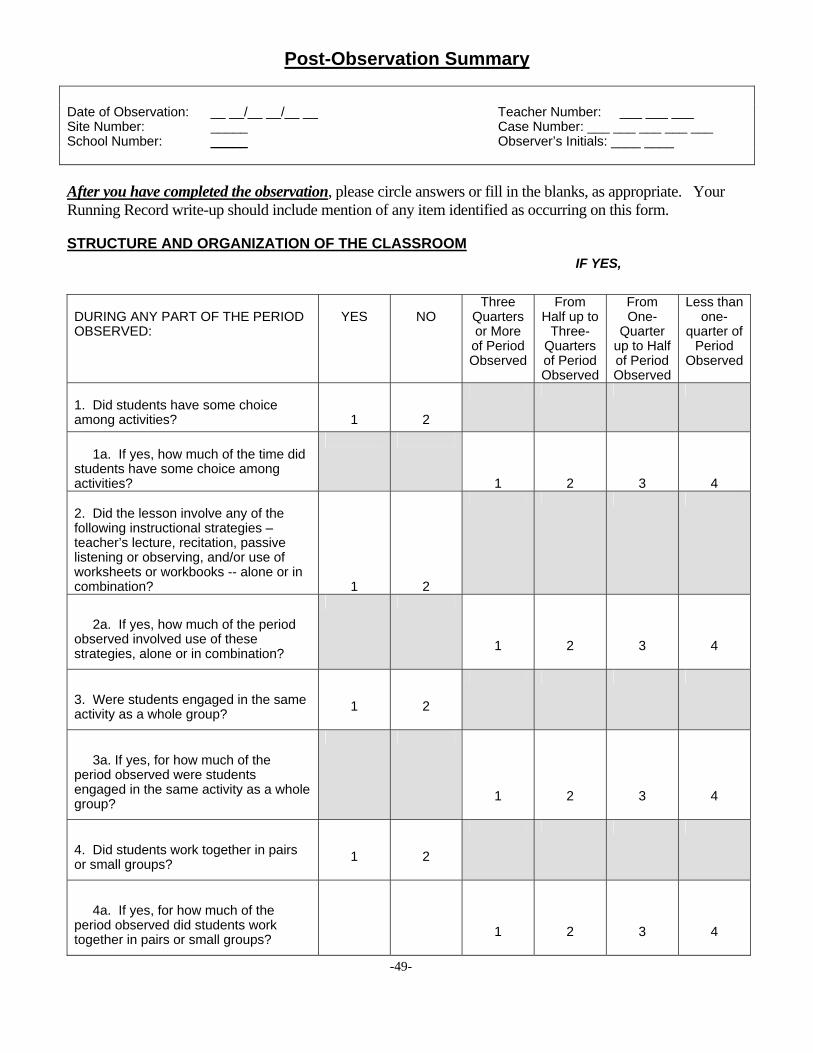
-49-
Post-Observation Summary
Date of Observation: __ __/__ __/__ __ Teacher Number: ___ ___ ___ Site Number: _____ Case Number: ___ ___ ___ ___ ___ School Number: _____ Observer’s Initials: ____ ____ After you have completed the observation, please circle answers or fill in the blanks, as appropriate. Your Running Record write-up should include mention of any item identified as occurring on this form.
STRUCTURE AND ORGANIZATION OF THE CLASSROOM IF YES,
DURING ANY PART OF THE PERIOD OBSERVED:
YES
NO
Three Quarters or More
of Period Observed
From Half up to
Three-Quarters of Period Observed
From One-
Quarter up to Half of Period Observed
Less than one-
quarter of Period
Observed
1. Did students have some choice among activities?
1
2
1a. If yes, how much of the time did students have some choice among activities?
1
2
3
4
2. Did the lesson involve any of the following instructional strategies – teacher’s lecture, recitation, passive listening or observing, and/or use of worksheets or workbooks -- alone or in combination?
1
2
2a. If yes, how much of the period observed involved use of these strategies, alone or in combination?
1
2
3
4
3. Were students engaged in the same activity as a whole group?
1
2
3a. If yes, for how much of the period observed were students engaged in the same activity as a whole group?
1
2
3
4
4. Did students work together in pairs or small groups?
1
2
4a. If yes, for how much of the period observed did students work together in pairs or small groups?
1
2
3
4
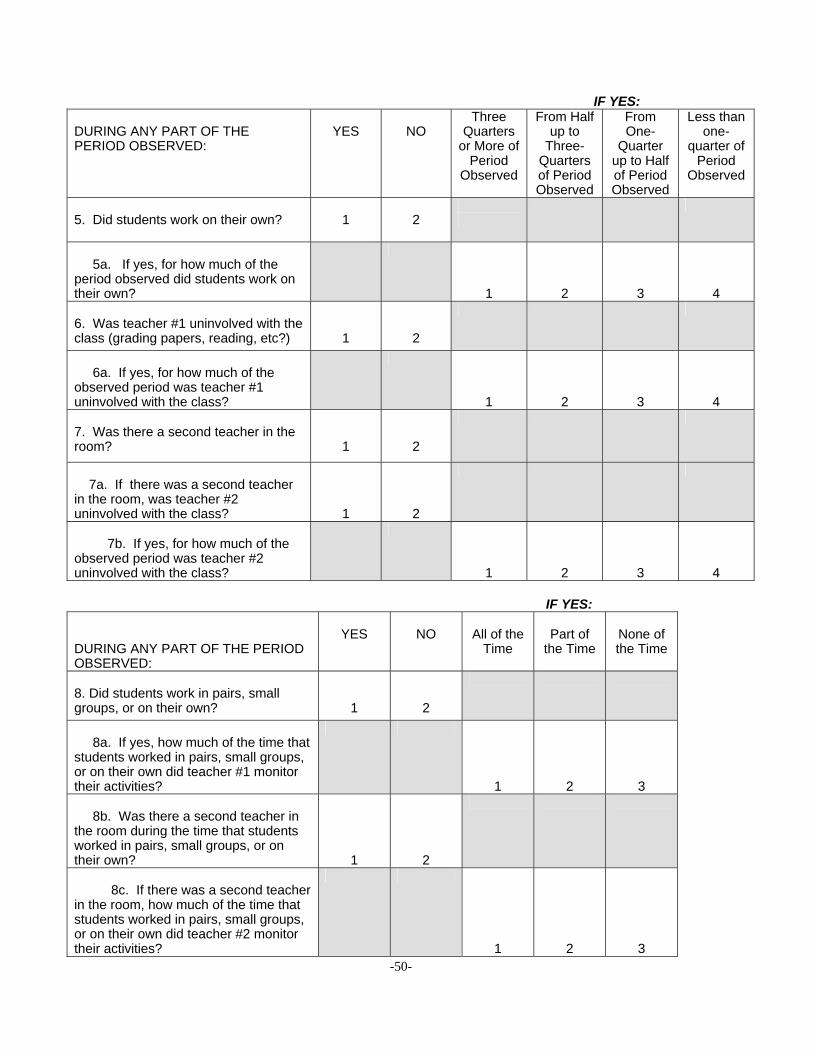
-50-
IF YES:
DURING ANY PART OF THE PERIOD OBSERVED:
YES
NO
Three Quarters
or More of Period
Observed
From Half up to
Three-Quarters of Period Observed
From One-
Quarter up to Half of Period Observed
Less than one-
quarter of Period
Observed
5. Did students work on their own?
1
2
5a. If yes, for how much of the period observed did students work on their own?
1
2
3
4
6. Was teacher #1 uninvolved with the class (grading papers, reading, etc?)
1
2
6a. If yes, for how much of the observed period was teacher #1 uninvolved with the class?
1
2
3
4
7. Was there a second teacher in the room?
1
2
7a. If there was a second teacher in the room, was teacher #2 uninvolved with the class?
1
2
7b. If yes, for how much of the observed period was teacher #2 uninvolved with the class?
1
2
3
4
IF YES: DURING ANY PART OF THE PERIOD OBSERVED:
YES
NO
All of the
Time
Part of
the Time
None of the Time
8. Did students work in pairs, small groups, or on their own?
1
2
8a. If yes, how much of the time that students worked in pairs, small groups, or on their own did teacher #1 monitor their activities?
1
2
3 8b. Was there a second teacher in the room during the time that students worked in pairs, small groups, or on their own?
1
2
8c. If there was a second teacher in the room, how much of the time that students worked in pairs, small groups, or on their own did teacher #2 monitor their activities?
1
2
3

-51-
TEACHER’S INSTRUCTIONAL STRATEGIES
9. The teacher stated the purpose of the lesson.
1. Yes 2. No
10. The teacher made an effort to connect lesson to what students had learned previously.
1. Yes 2. No
11. The teacher made an effort to connect the lesson to current events/ students’ experiences/what students might know.
1. Yes 2. No
12. Did the teacher ask questions? 1. Yes 2. No 12a. If yes, did the teacher employ a “wait time” strategy?
1. Yes 2. No
12b. If yes to #12a, how consistently did the teacher employ a “wait time” strategy?
1. Always or almost always 2. Sometimes, not consistently 3. Rarely or Never
CLASSROOM CLIMATE 13. Estimated number of times (including zero) students laughed at/ridiculed another student for his/her question, mistake, idea, or suggestion and were reprimanded by teacher. ______ Times 14. Estimated number of times (including zero) students laughed at/ridiculed another student for his/her question, mistake, idea, or suggestion and were not reprimanded by teacher. ______ Times 15. Estimated number of times (including zero) teacher laughed at/ridiculed a student for his/her question, mistake, idea, or suggestion. ______ Times 16. Estimated number of times (including zero) teacher made comments to students indicating sympathetic knowledge of students or their families. _______ Times 17. The teacher used humor to encourage students or create a lighter tone.
1. Yes 2. No
18. Behavior/discipline was an issue in the class –students frequently whispered, talked out loud, called out, passed notes, moved around, in ways that detracted from their own or other students’ opportunities to learn.
1. Yes 2. No
Curriculum Unit (Please retrieve this information from the Post Observation Interview) 19. Relationship of this lesson to curriculum unit.
1. Beginning of unit 2. Middle of unit 3. End of unit 4. Unrelated to unit

Appendix B
Post-Coding the Running Record
-54-
Here we describe the process of coding the Running Record, which takes place after the observer completes the entire observation and submits it to the coder. Over the two waves of data collection discussed here, two coders, one an MDRC employee and the other a consultant to MDRC, performed the post-coding. The coder uses the Running Record as the basis of the coding, but can also use assignments collected during the observation in order to inform the coding process. (The coding form itself appears at the end of this appendix.)
Deciding Whether the Running Record Can be Coded The first step is for the coder to decide if the Running Record can be coded. Two condi-
tions must be met in order to proceed with coding: both enough information and an academic focus must be present.
Enough Information
In order to code the running record, there must be sufficient information in the running record to meet the coding criteria. There must be enough examples of specific activities and teacher-student interactions to provide evidence that the behaviors of interest either did or did not occur during a particular cycle. Words and phrases such as “monitors students” or “ques-tions students,” or “helps students with problems” do not provide sufficient information about the nature of the interaction to make determinations.
The running record covers four or five cycles, each 10 minutes in length. Coding takes place if either two out of four cycles or three out of five cycles contains sufficient information to make judgments about the criteria. If there is not sufficient information in the required number of cycles, coding is discontinued at this point.
Academic Focus
In order to code the Running Record, there must be an academic focus within the ob-servation. If there is no academic focus during any of the cycles, Academic Focus is coded as 0, and coding is discontinued. If there is a consistent academic focus throughout the period, Aca-demic Focus is coded as 2.
An academic focus may be present for only part of the period observed, while much of the rest of the period is occupied by non-academic activities; in this case, Academic Focus is coded as 1, or “mixed.” Non-academic activities that would lead to such a code include:
• Extended transition times in which teacher and students are involved in tak-ing the roll, moving desks around, or moving from group to group. The em-phasis is on “extended”; brief transitions and brief periods at the beginning of
-55-
class that do not take up most of the cycle do not rate a “mixed” coding if they flow quickly into activities with an academic focus.
• An extended amount of time spent on reading announcements or listening to announcements being read over the loudspeaker.
• Socializing for an extended amount of time that represents a shift of focus for the entire class. (If the teacher is socializing with one student — e.g., asking about an extracurricular activity or a family member — and the remainder of the class continues to be focused on academic work, academic focus is con-sidered to be continuous during this time.
• Activities that appear to lack any connection to the academic content of the class — e.g.., making valentines in an English class, but without any atten-tion to the text. (If, however, the teacher links the non-academic activity ex-plicitly to the academic content or the coder can see the connection, the activ-ity is considered to have an academic focus.)
If no Academic Focus at all can be discerned for the entire observation (i.e., the obser-vation is coded 0), further coding of the Running Record ceases. If Academic Focus is coded as 1 or 2, the coder continues on to the other categories.
Coding for Active Teaching During this part of the coding, the coder looks for the teacher’s active engagement in
the teaching and learning process during the time when there is an academic focus in the classroom.
To be considered “active teaching,” the teacher must be engaged in instructional inter-action with students. This instructional interaction may include quite different kinds of activi-ties. The teacher and other students may listen to a single student, or a group of students, give a presentation. Students may work independently while the teacher moves from student to student (or group to group), checking in with them, offering suggestions, asking questions, etc. (Also coded as “active teaching” are times when the teacher stands or circulates among students who are working independently, watching them but not interacting with them.) Teachers may join students in independent reading in periods that the school or the district has set aside expressly for that purpose.
Engaging in extended social interactions with students, however, is considered to be a break in active teaching, if this occurs when the class is academically focused.
-56-
Active Teaching, like Academic Focus, is coded on a three-point scale, where 0 indi-cates that no active teaching was present, 2 indicates that active teaching was present throughout the period, and 1 indicates a mixed picture.
It is important to note that active teaching may or may not involve Teaching for Under-standing or Pressing for Understanding.
Coding for Teaching for Understanding Teaching for Understanding is coded on a three-point scale where 0 means that no
Teaching for Understanding took place, 1 means that it was present at a low level, and 2 means that it was present at a high level.
In order to be coded a 1, clear evidence of at least one of the teaching strategies shown below (as well as in Table 2) must be present in the Running Record. For the Running Record to be coded as 2, Teaching for Understanding must take place in a sustained way. That is, the teacher must: a) use multiple strategies, or b) use one strategy that is developed over a period of time (most of a cycle or approximately half of two adjacent cycles), or 3) use one strategy more than once throughout the running record.
Teacher provides ways to think, ways to organize information, ways to remember
1. Teacher models thinking strategies, such as outlining or summarizing or tells the students how to execute the strategies (e.g., models outlining or shows students how to outline).
2. Teacher demonstrates use of a mnemonic and makes suggestions for ways students may use the strategy for future learning/remembering.
3. Teacher models using a visual organizer (sets up information in charts, ta-bles, diagrams, mind maps, Venn diagrams, etc.) or tells students how to use the visual organizer(s) or discusses the rationale for using a graphic organizer (why you do it this way, or what happens if you don’t do it this way).
4. Teacher demonstrates an idea/illustrates concepts (example: using colors and shapes, manipulating objects to demonstrate a math concept)
• Uses multiple representations of ideas
• Uses multiple examples that represent the points in numerous ways
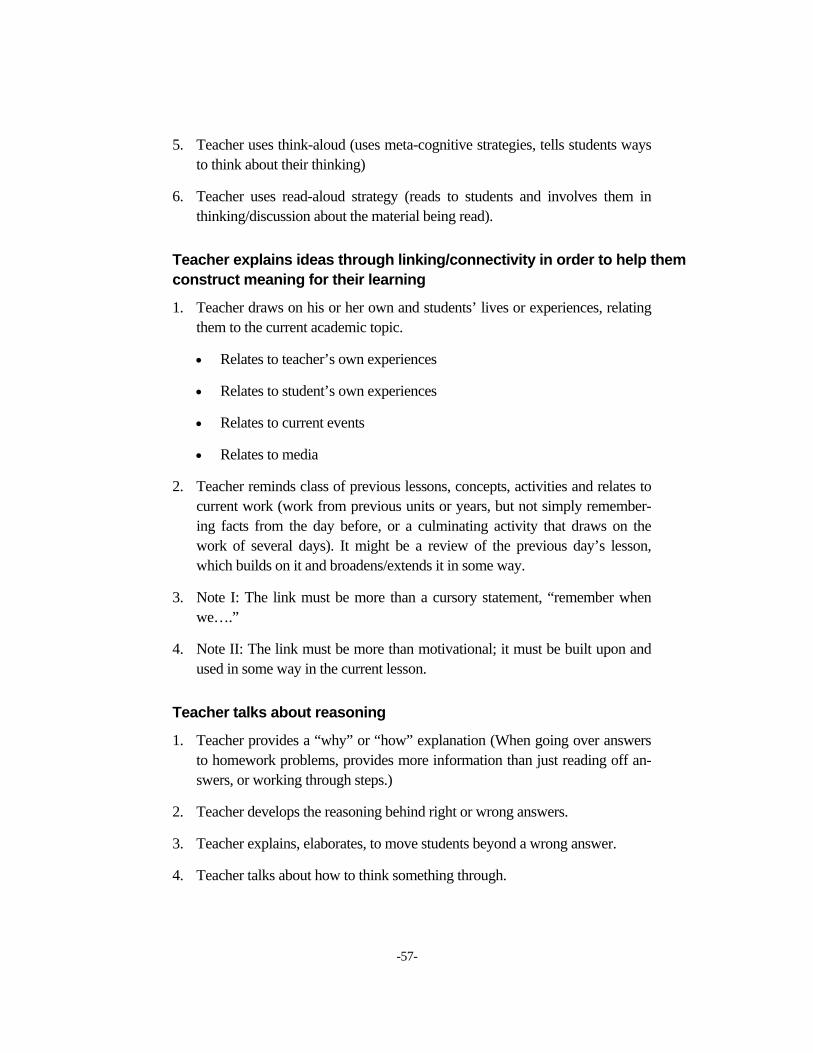
-57-
5. Teacher uses think-aloud (uses meta-cognitive strategies, tells students ways to think about their thinking)
6. Teacher uses read-aloud strategy (reads to students and involves them in thinking/discussion about the material being read).
Teacher explains ideas through linking/connectivity in order to help them construct meaning for their learning
1. Teacher draws on his or her own and students’ lives or experiences, relating them to the current academic topic.
• Relates to teacher’s own experiences
• Relates to student’s own experiences
• Relates to current events
• Relates to media
2. Teacher reminds class of previous lessons, concepts, activities and relates to current work (work from previous units or years, but not simply remember-ing facts from the day before, or a culminating activity that draws on the work of several days). It might be a review of the previous day’s lesson, which builds on it and broadens/extends it in some way.
3. Note I: The link must be more than a cursory statement, “remember when we….”
4. Note II: The link must be more than motivational; it must be built upon and used in some way in the current lesson.
Teacher talks about reasoning
1. Teacher provides a “why” or “how” explanation (When going over answers to homework problems, provides more information than just reading off an-swers, or working through steps.)
2. Teacher develops the reasoning behind right or wrong answers.
3. Teacher explains, elaborates, to move students beyond a wrong answer.
4. Teacher talks about how to think something through.
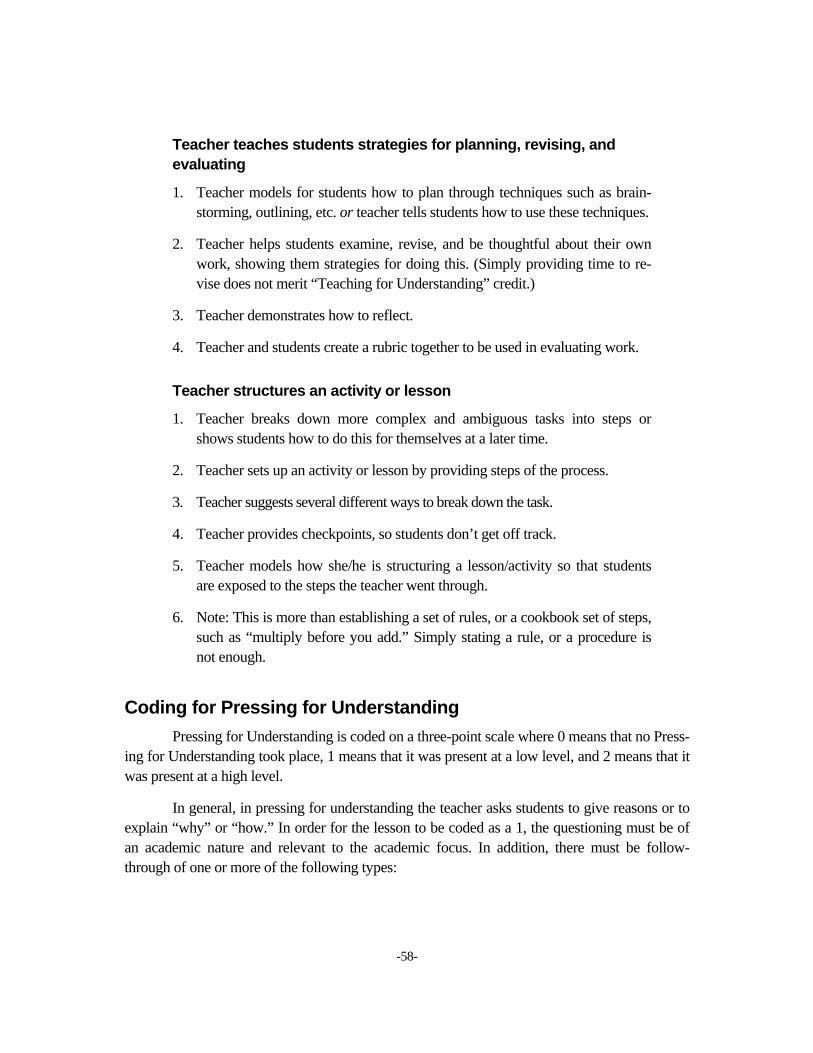
-58-
Teacher teaches students strategies for planning, revising, and evaluating
1. Teacher models for students how to plan through techniques such as brain-storming, outlining, etc. or teacher tells students how to use these techniques.
2. Teacher helps students examine, revise, and be thoughtful about their own work, showing them strategies for doing this. (Simply providing time to re-vise does not merit “Teaching for Understanding” credit.)
3. Teacher demonstrates how to reflect.
4. Teacher and students create a rubric together to be used in evaluating work.
Teacher structures an activity or lesson
1. Teacher breaks down more complex and ambiguous tasks into steps or shows students how to do this for themselves at a later time.
2. Teacher sets up an activity or lesson by providing steps of the process.
3. Teacher suggests several different ways to break down the task.
4. Teacher provides checkpoints, so students don’t get off track.
5. Teacher models how she/he is structuring a lesson/activity so that students are exposed to the steps the teacher went through.
6. Note: This is more than establishing a set of rules, or a cookbook set of steps, such as “multiply before you add.” Simply stating a rule, or a procedure is not enough.
Coding for Pressing for Understanding Pressing for Understanding is coded on a three-point scale where 0 means that no Press-
ing for Understanding took place, 1 means that it was present at a low level, and 2 means that it was present at a high level.
In general, in pressing for understanding the teacher asks students to give reasons or to explain “why” or “how.” In order for the lesson to be coded as a 1, the questioning must be of an academic nature and relevant to the academic focus. In addition, there must be follow- through of one or more of the following types:
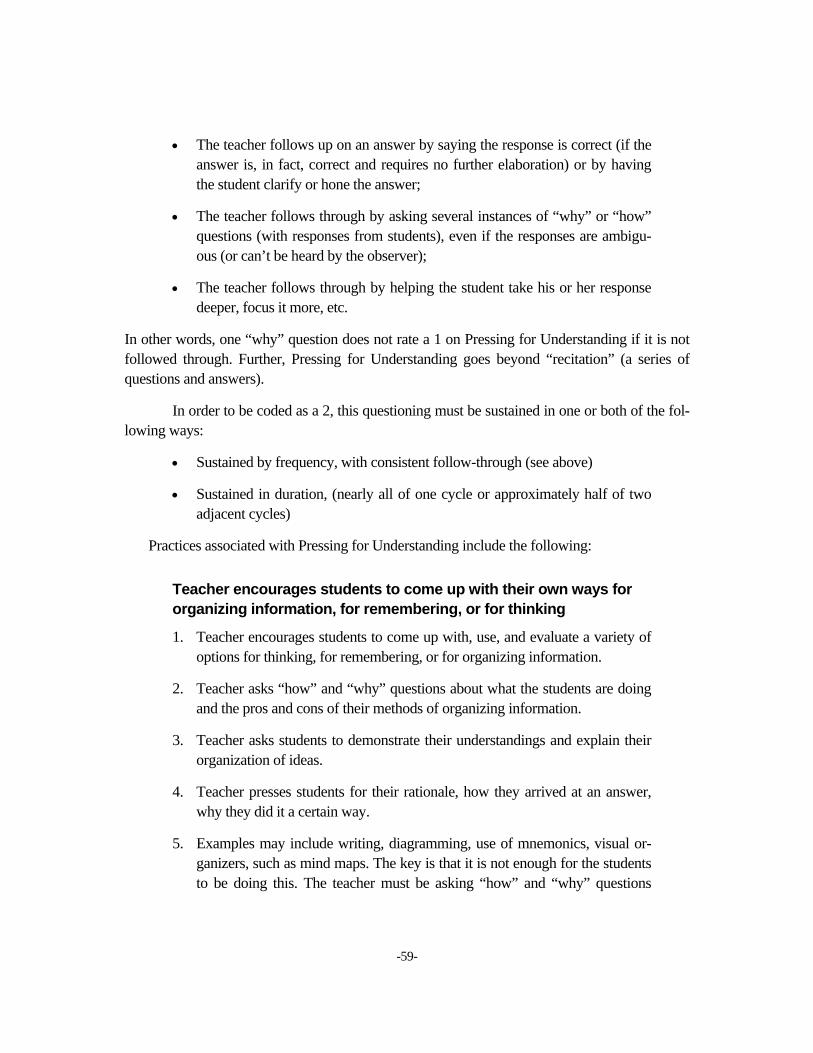
-59-
• The teacher follows up on an answer by saying the response is correct (if the answer is, in fact, correct and requires no further elaboration) or by having the student clarify or hone the answer;
• The teacher follows through by asking several instances of “why” or “how” questions (with responses from students), even if the responses are ambigu-ous (or can’t be heard by the observer);
• The teacher follows through by helping the student take his or her response deeper, focus it more, etc.
In other words, one “why” question does not rate a 1 on Pressing for Understanding if it is not followed through. Further, Pressing for Understanding goes beyond “recitation” (a series of questions and answers).
In order to be coded as a 2, this questioning must be sustained in one or both of the fol-lowing ways:
• Sustained by frequency, with consistent follow-through (see above)
• Sustained in duration, (nearly all of one cycle or approximately half of two adjacent cycles)
Practices associated with Pressing for Understanding include the following:
Teacher encourages students to come up with their own ways for organizing information, for remembering, or for thinking
1. Teacher encourages students to come up with, use, and evaluate a variety of options for thinking, for remembering, or for organizing information.
2. Teacher asks “how” and “why” questions about what the students are doing and the pros and cons of their methods of organizing information.
3. Teacher asks students to demonstrate their understandings and explain their organization of ideas.
4. Teacher presses students for their rationale, how they arrived at an answer, why they did it a certain way.
5. Examples may include writing, diagramming, use of mnemonics, visual or-ganizers, such as mind maps. The key is that it is not enough for the students to be doing this. The teacher must be asking “how” and “why” questions
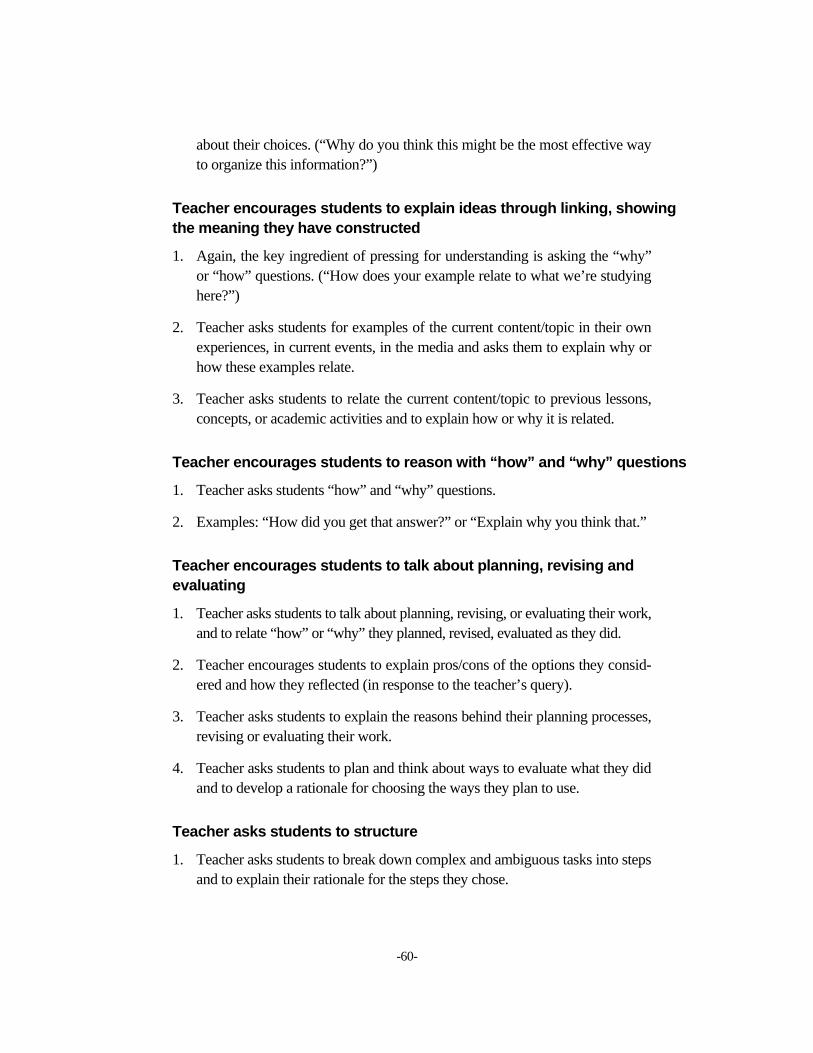
-60-
about their choices. (“Why do you think this might be the most effective way to organize this information?”)
Teacher encourages students to explain ideas through linking, showing the meaning they have constructed
1. Again, the key ingredient of pressing for understanding is asking the “why” or “how” questions. (“How does your example relate to what we’re studying here?”)
2. Teacher asks students for examples of the current content/topic in their own experiences, in current events, in the media and asks them to explain why or how these examples relate.
3. Teacher asks students to relate the current content/topic to previous lessons, concepts, or academic activities and to explain how or why it is related.
Teacher encourages students to reason with “how” and “why” questions
1. Teacher asks students “how” and “why” questions.
2. Examples: “How did you get that answer?” or “Explain why you think that.”
Teacher encourages students to talk about planning, revising and evaluating
1. Teacher asks students to talk about planning, revising, or evaluating their work, and to relate “how” or “why” they planned, revised, evaluated as they did.
2. Teacher encourages students to explain pros/cons of the options they consid-ered and how they reflected (in response to the teacher’s query).
3. Teacher asks students to explain the reasons behind their planning processes, revising or evaluating their work.
4. Teacher asks students to plan and think about ways to evaluate what they did and to develop a rationale for choosing the ways they plan to use.
Teacher asks students to structure
1. Teacher asks students to break down complex and ambiguous tasks into steps and to explain their rationale for the steps they chose.
-61-
2. Teacher checks with students about the steps they are using for their process, asking them to talk about the reasons they are proceeding in the manner they are.
3. NOTE: This is more than asking a student to repeat a procedural rule. Stu-dents would be asked to provide reasons behind the rules they are applying to demonstrate their understanding of the rule.
Teacher encourages students to verbalize what they understand.
1. Teacher asks students to explain a complex procedure they have done in their own words (why they did what they did).
2. Students go over their work (explaining it verbally or in writing) and teacher is checking for understanding.
3. Students give various answers and teacher asks them to talk about the differ-ences and similarities of the answers and how they might overlap.
Coding the Cognitive Process and Knowledge Dimensions The predominant Cognitive Process and Knowledge dimensions (key elements of
Bloom’s Taxonomy) are determined by the amount of time these dimensions occupy during the instructional period. To be coded the most predominant set of dimensions, these must take at least 15 minutes of time during the observation period (all of one cycle and part of another cy-cle, or over half of two cycles). The second most predominant set of dimensions is coded in the 2 column (with the same 15 minute guideline). If each of two sets of dimensions occupies at least 15 minutes, then it is the coder’s judgment call as to which is predominant; however, if two sets seem evenly balanced, then each is rated as a “1.5.” If a higher-order cognitive process (analyzing, evaluating, creating) is in evidence in the classroom for at least 10 minutes (all of one cycle or parts of two cycles), then it is placed in the third column on the coding form.
Coding for these dimensions is based on the evidence contained in the Running Record in its entirety. Thus, although the teacher may announce the objectives of the lesson, if the Run-ning Record does not reflect that these objectives were carried out, the coding will reflect what is in the Running Record, not what the teacher says. Similarly, the coder is not permitted to code an observation based on the coder’s inference about what the teacher was trying to achieve, if that objective is not clearly evident within the Running Record itself.

Appendix C
Supplementary Tables
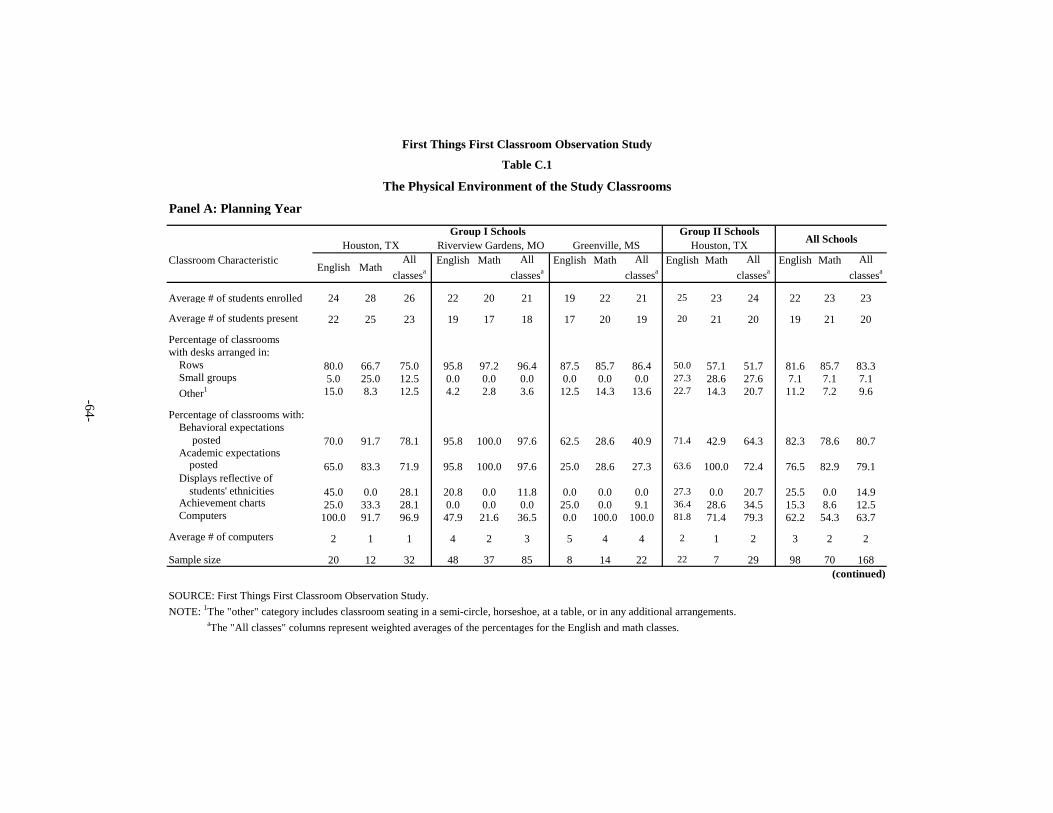
Classroom Characteristic English Math English Math English Math English Math
Average # of students enrolled 24 28 26 22 20 21 19 22 21 25 23 24 22 23 23
Average # of students present 22 25 23 19 17 18 17 20 19 20 21 20 19 21 20
Percentage of classrooms with desks arranged in:
Rows 80.0 66.7 75.0 95.8 97.2 96.4 87.5 85.7 86.4 50.0 57.1 51.7 81.6 85.7 83.3Small groups 5.0 25.0 12.5 0.0 0.0 0.0 0.0 0.0 0.0 27.3 28.6 27.6 7.1 7.1 7.1Other1 15.0 8.3 12.5 4.2 2.8 3.6 12.5 14.3 13.6 22.7 14.3 20.7 11.2 7.2 9.6
Percentage of classrooms with:Behavioral expectations
posted 70.0 91.7 78.1 95.8 100.0 97.6 62.5 28.6 40.9 71.4 42.9 64.3 82.3 78.6 80.7Academic expectations
posted 65.0 83.3 71.9 95.8 100.0 97.6 25.0 28.6 27.3 63.6 100.0 72.4 76.5 82.9 79.1Displays reflective of
students' ethnicities 45.0 0.0 28.1 20.8 0.0 11.8 0.0 0.0 0.0 27.3 0.0 20.7 25.5 0.0 14.9Achievement charts 25.0 33.3 28.1 0.0 0.0 0.0 25.0 0.0 9.1 36.4 28.6 34.5 15.3 8.6 12.5Computers 100.0 91.7 96.9 47.9 21.6 36.5 0.0 100.0 100.0 81.8 71.4 79.3 62.2 54.3 63.7
Average # of computers 2 1 1 4 2 3 5 4 4 2 1 2 3 2 2
Sample size 20 12 32 48 37 85 8 14 22 22 7 29 98 70 168(continued)
All classesa
All classesa
Group I Schools Group II SchoolsHouston, TX
English MathAll
classesa
All Schools
All classesa
First Things First Classroom Observation Study
The Physical Environment of the Study Classrooms
Table C.1
Houston, TX Riverview Gardens, MO Greenville, MS
Panel A: Planning Year
All classesa
SOURCE: First Things First Classroom Observation Study.NOTE: 1The "other" category includes classroom seating in a semi-circle, horseshoe, at a table, or in any additional arrangements. aThe "All classes" columns represent weighted averages of the percentages for the English and math classes.
-64-
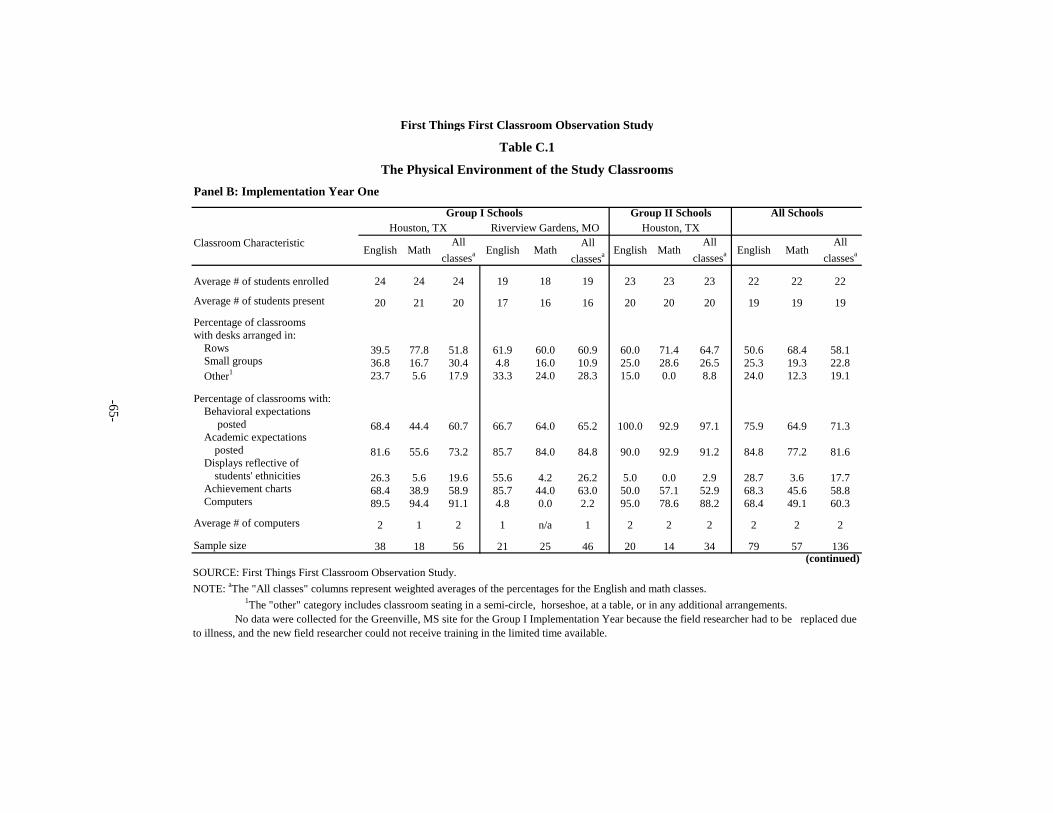
-65-
Classroom Characteristic
Average # of students enrolled 24 24 24 19 18 19 23 23 23 22 22 22
Average # of students present 20 21 20 17 16 16 20 20 20 19 19 19
Percentage of classrooms with desks arranged in:
Rows 39.5 77.8 51.8 61.9 60.0 60.9 60.0 71.4 64.7 50.6 68.4 58.1Small groups 36.8 16.7 30.4 4.8 16.0 10.9 25.0 28.6 26.5 25.3 19.3 22.8Other1 23.7 5.6 17.9 33.3 24.0 28.3 15.0 0.0 8.8 24.0 12.3 19.1
Percentage of classrooms with:Behavioral expectations
posted 68.4 44.4 60.7 66.7 64.0 65.2 100.0 92.9 97.1 75.9 64.9 71.3Academic expectations
posted 81.6 55.6 73.2 85.7 84.0 84.8 90.0 92.9 91.2 84.8 77.2 81.6Displays reflective of
students' ethnicities 26.3 5.6 19.6 55.6 4.2 26.2 5.0 0.0 2.9 28.7 3.6 17.7Achievement charts 68.4 38.9 58.9 85.7 44.0 63.0 50.0 57.1 52.9 68.3 45.6 58.8Computers 89.5 94.4 91.1 4.8 0.0 2.2 95.0 78.6 88.2 68.4 49.1 60.3
Average # of computers 2 1 2 1 n/a 1 2 2 2 2 2 2
Sample size 38 18 56 21 25 46 20 14 34 79 57 136(continued)
All classesa
All classesaMathEnglishMathEnglish
All classesa
The Physical Environment of the Study Classrooms
All Schools
MathEnglish English MathAll
classesa
Table C.1
First Things First Classroom Observation Study
Houston, TX Riverview Gardens, MO
Panel B: Implementation Year One
Houston, TXGroup I Schools Group II Schools
SOURCE: First Things First Classroom Observation Study.NOTE: aThe "All classes" columns represent weighted averages of the percentages for the English and math classes. 1The "other" category includes classroom seating in a semi-circle, horseshoe, at a table, or in any additional arrangements. No data were collected for the Greenville, MS site for the Group I Implementation Year because the field researcher had to be replaced due to illness, and the new field researcher could not receive training in the limited time available.
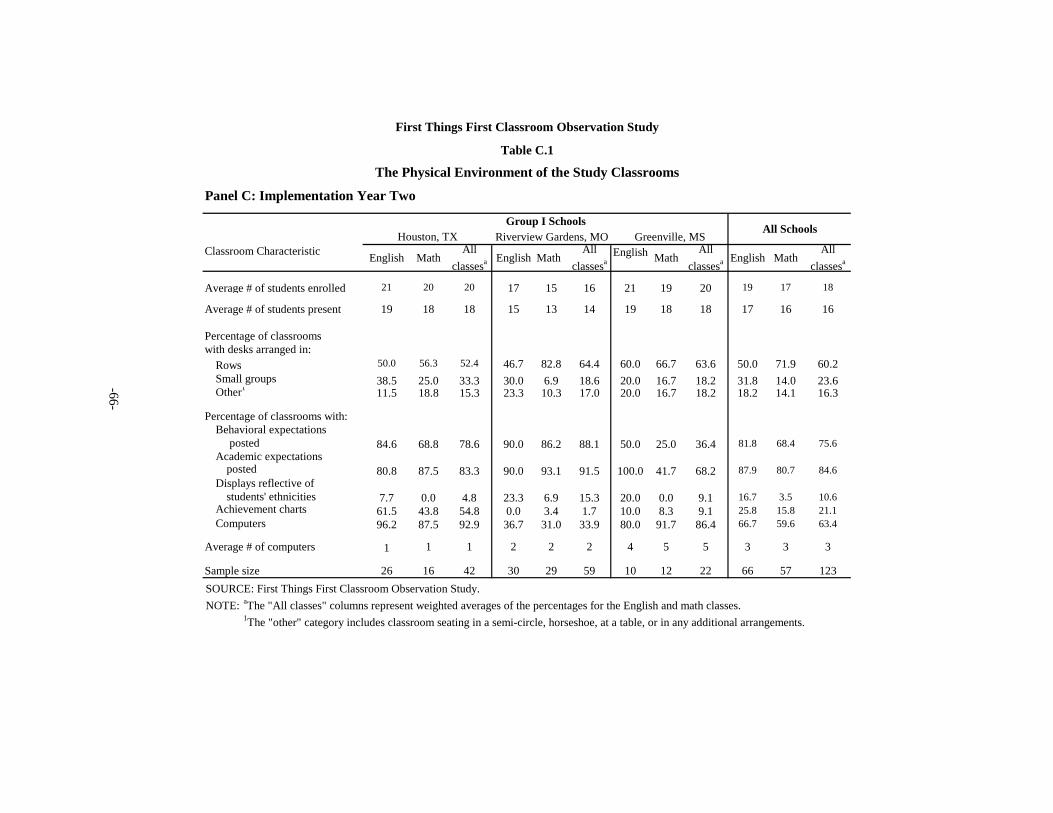
Panel C: Implementation Year Two
Classroom Characteristic
Average # of students enrolled 21 20 20 17 15 16 21 19 20 19 17 18
Average # of students present 19 18 18 15 13 14 19 18 18 17 16 16
Percentage of classrooms with desks arranged in:
Rows 50.0 56.3 52.4 46.7 82.8 64.4 60.0 66.7 63.6 50.0 71.9 60.2Small groups 38.5 25.0 33.3 30.0 6.9 18.6 20.0 16.7 18.2 31.8 14.0 23.6Other1 11.5 18.8 15.3 23.3 10.3 17.0 20.0 16.7 18.2 18.2 14.1 16.3
Percentage of classrooms with:Behavioral expectations
posted 84.6 68.8 78.6 90.0 86.2 88.1 50.0 25.0 36.4 81.8 68.4 75.6Academic expectations
posted 80.8 87.5 83.3 90.0 93.1 91.5 100.0 41.7 68.2 87.9 80.7 84.6Displays reflective of
students' ethnicities 7.7 0.0 4.8 23.3 6.9 15.3 20.0 0.0 9.1 16.7 3.5 10.6Achievement charts 61.5 43.8 54.8 0.0 3.4 1.7 10.0 8.3 9.1 25.8 15.8 21.1Computers 96.2 87.5 92.9 36.7 31.0 33.9 80.0 91.7 86.4 66.7 59.6 63.4
Average # of computers 1 1 1 2 2 2 4 5 5 3 3 3
Sample size 26 16 42 30 29 59 10 12 22 66 57 123
English Math
All Schools
English MathAll
classesa
Houston, TX Riverview Gardens, MO Greenville, MS
English MathAll
classesa All
classesaAll
classesaEnglish Math
First Things First Classroom Observation Study
Table C.1
The Physical Environment of the Study Classrooms
Group I Schools
SOURCE: First Things First Classroom Observation Study.NOTE: aThe "All classes" columns represent weighted averages of the percentages for the English and math classes. 1The "other" category includes classroom seating in a semi-circle, horseshoe, at a table, or in any additional arrangements.
-66-
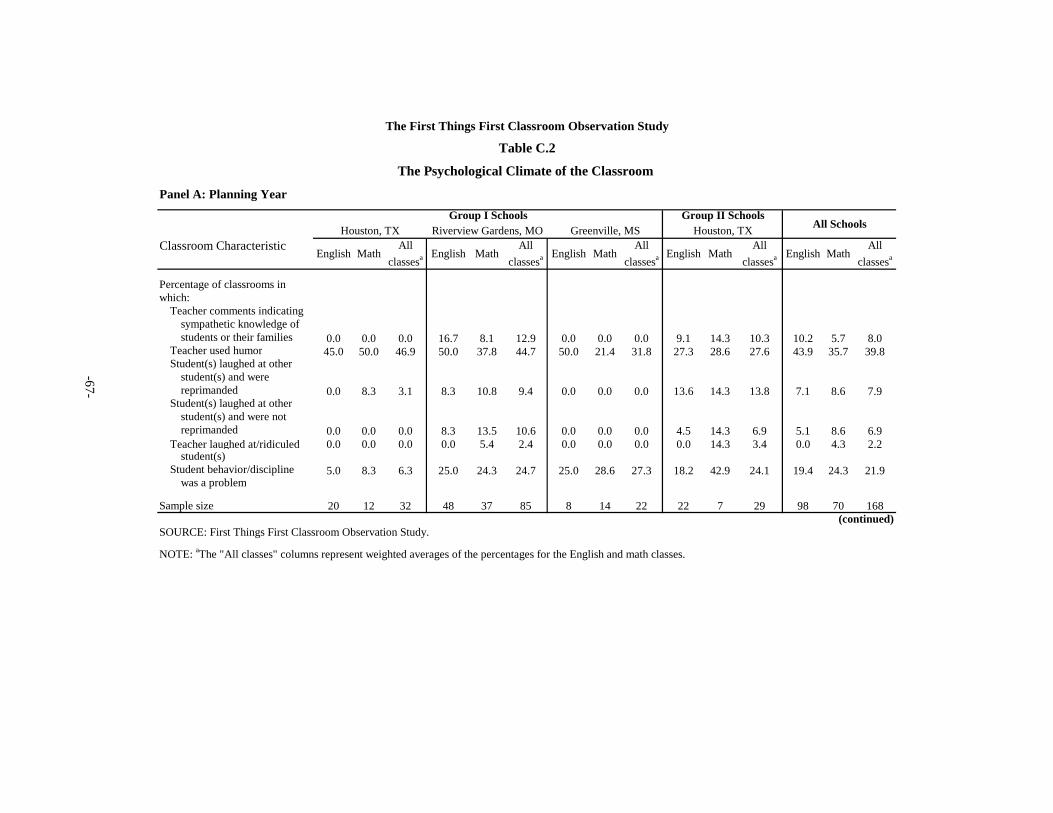
Classroom Characteristic
Percentage of classrooms in which:
Teacher comments indicatingsympathetic knowledge of students or their families 0.0 0.0 0.0 16.7 8.1 12.9 0.0 0.0 0.0 9.1 14.3 10.3 10.2 5.7 8.0
Teacher used humor 45.0 50.0 46.9 50.0 37.8 44.7 50.0 21.4 31.8 27.3 28.6 27.6 43.9 35.7 39.8Student(s) laughed at other
student(s) and werereprimanded 0.0 8.3 3.1 8.3 10.8 9.4 0.0 0.0 0.0 13.6 14.3 13.8 7.1 8.6 7.9
Student(s) laughed at other student(s) and were not reprimanded 0.0 0.0 0.0 8.3 13.5 10.6 0.0 0.0 0.0 4.5 14.3 6.9 5.1 8.6 6.9
Teacher laughed at/ridiculed 0.0 0.0 0.0 0.0 5.4 2.4 0.0 0.0 0.0 0.0 14.3 3.4 0.0 4.3 2.2student(s)
Student behavior/discipline 5.0 8.3 6.3 25.0 24.3 24.7 25.0 28.6 27.3 18.2 42.9 24.1 19.4 24.3 21.9was a problem
Sample size 20 12 32 48 37 85 8 14 22 22 7 29 98 70 168
SOURCE: First Things First Classroom Observation Study.
NOTE: aThe "All classes" columns represent weighted averages of the percentages for the English and math classes.
(continued)
All Schools
The First Things First Classroom Observation Study
Table C.2
Houston, TX Riverview Gardens, MO Greenville, MS
Panel A: Planning Year
The Psychological Climate of the Classroom
Houston, TXGroup II SchoolsGroup I Schools
MathEnglishAll
classesa English MathAll
classesa English Math English MathAll
classesaAll
classesa English MathAll
classesa
-67-
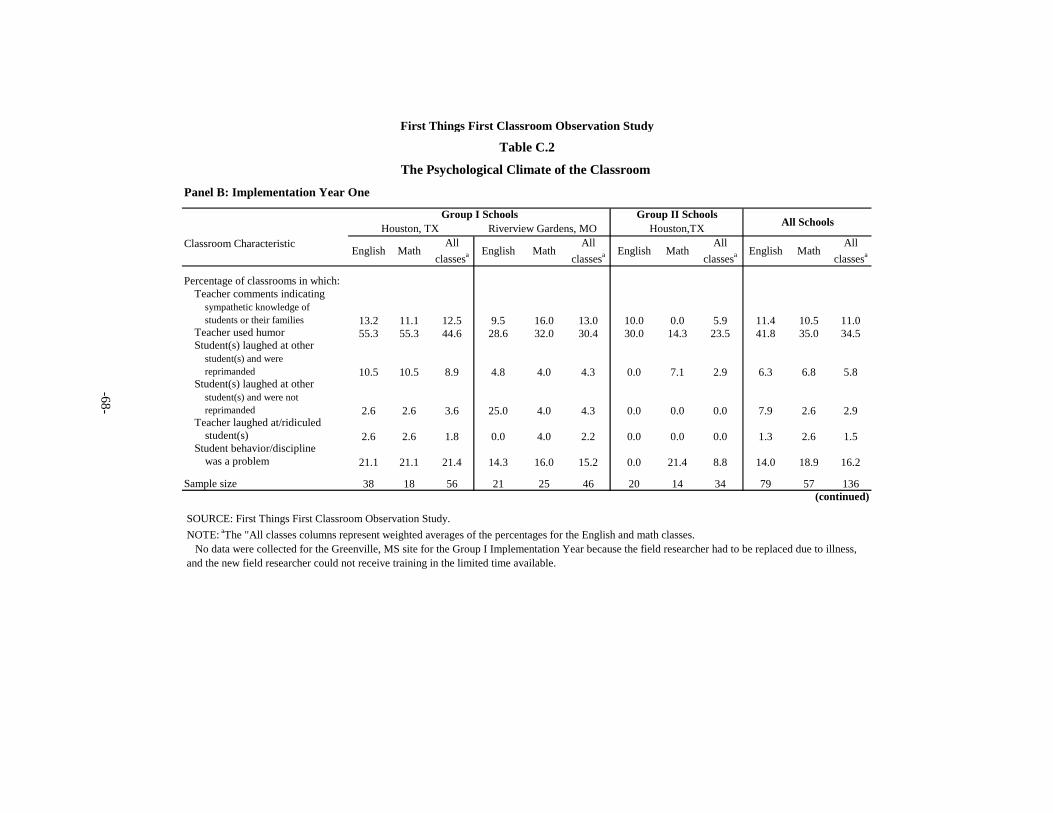
Classroom Characteristic
Percentage of classrooms in which:Teacher comments indicating
sympathetic knowledge of students or their families 13.2 11.1 12.5 9.5 16.0 13.0 10.0 0.0 5.9 11.4 10.5 11.0
Teacher used humor 55.3 55.3 44.6 28.6 32.0 30.4 30.0 14.3 23.5 41.8 35.0 34.5Student(s) laughed at other
student(s) and were reprimanded 10.5 10.5 8.9 4.8 4.0 4.3 0.0 7.1 2.9 6.3 6.8 5.8
Student(s) laughed at other student(s) and were not reprimanded 2.6 2.6 3.6 25.0 4.0 4.3 0.0 0.0 0.0 7.9 2.6 2.9
Teacher laughed at/ridiculedstudent(s) 2.6 2.6 1.8 0.0 4.0 2.2 0.0 0.0 0.0 1.3 2.6 1.5
Student behavior/disciplinewas a problem 21.1 21.1 21.4 14.3 16.0 15.2 0.0 21.4 8.8 14.0 18.9 16.2
Sample size 38 18 56 21 25 46 20 14 34 79 57 136
MathAll
classesa
Houston,TXAll
classesa EnglishMathAll
classesa MathEnglishEnglish MathAll
classesa English
(continued)
All Schools
First Things First Classroom Observation Study
Houston, TX Riverview Gardens, MO
The Psychological Climate of the Classroom
Table C.2
Panel B: Implementation Year One
Group I Schools Group II Schools
SOURCE: First Things First Classroom Observation Study.NOTE: aThe "All classes columns represent weighted averages of the percentages for the English and math classes. No data were collected for the Greenville, MS site for the Group I Implementation Year because the field researcher had to be replaced due to illness, and the new field researcher could not receive training in the limited time available.
-68-
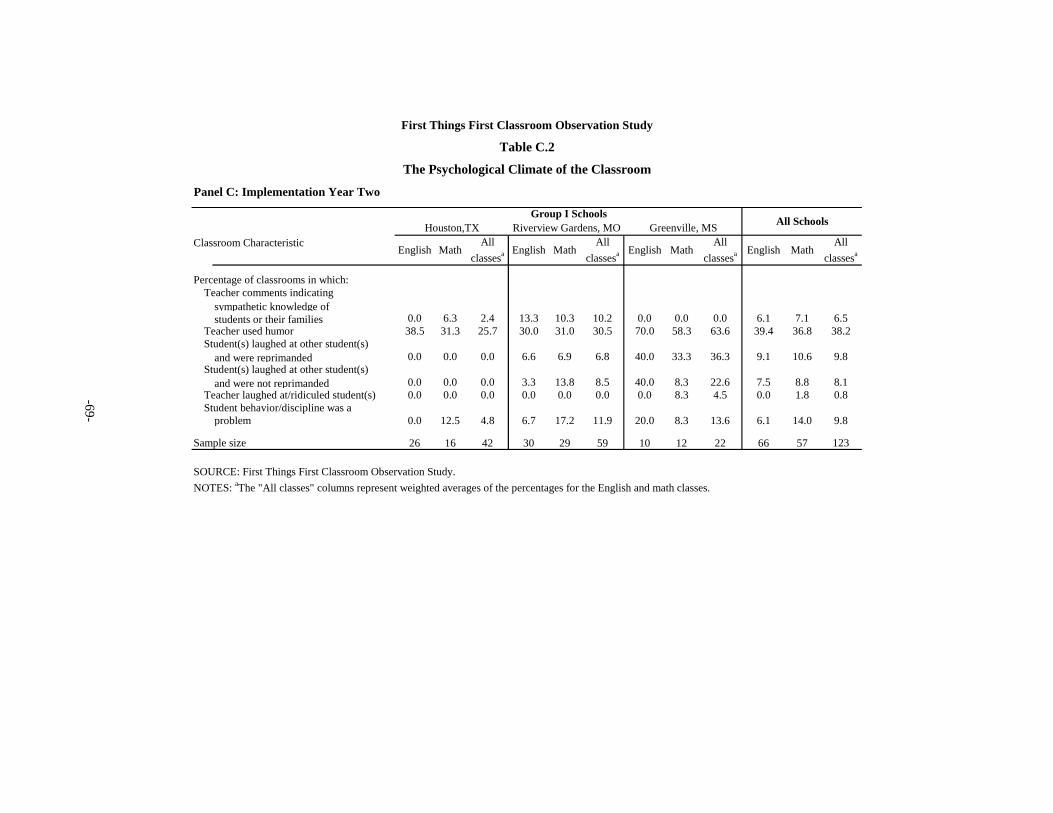
Classroom Characteristic
Percentage of classrooms in which:Teacher comments indicating
sympathetic knowledge of students or their families 0.0 6.3 2.4 13.3 10.3 10.2 0.0 0.0 0.0 6.1 7.1 6.5
Teacher used humor 38.5 31.3 25.7 30.0 31.0 30.5 70.0 58.3 63.6 39.4 36.8 38.2Student(s) laughed at other student(s)
and were reprimanded 0.0 0.0 0.0 6.6 6.9 6.8 40.0 33.3 36.3 9.1 10.6 9.8Student(s) laughed at other student(s)
and were not reprimanded 0.0 0.0 0.0 3.3 13.8 8.5 40.0 8.3 22.6 7.5 8.8 8.1Teacher laughed at/ridiculed student(s) 0.0 0.0 0.0 0.0 0.0 0.0 0.0 8.3 4.5 0.0 1.8 0.8Student behavior/discipline was a
problem 0.0 12.5 4.8 6.7 17.2 11.9 20.0 8.3 13.6 6.1 14.0 9.8
Sample size 26 16 42 30 29 59 10 12 22 66 57 123
All Schools
First Things First Classroom Observation Study
The Psychological Climate of the Classroom
Table C.2
Panel C: Implementation Year Two
All classesa
Riverview Gardens, MO
English MathAll
classesa
Houston,TX
English MathAll
classesa
Group I Schools
English MathAll
classesa
Greenville, MS
English Math
SOURCE: First Things First Classroom Observation Study.NOTES: aThe "All classes" columns represent weighted averages of the percentages for the English and math classes.
-69-
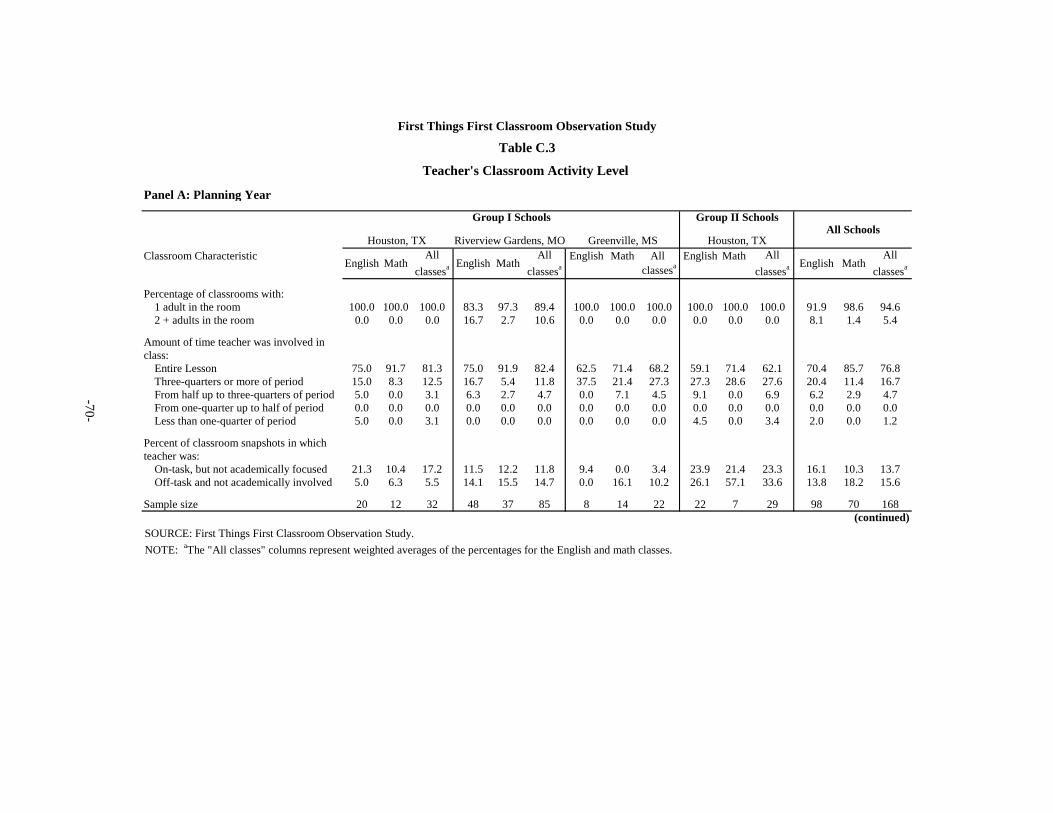
Panel A: Planning Year
Classroom Characteristic English Math All English Math classesa
Percentage of classrooms with:1 adult in the room 100.0 100.0 100.0 83.3 97.3 89.4 100.0 100.0 100.0 100.0 100.0 100.0 91.9 98.6 94.62 + adults in the room 0.0 0.0 0.0 16.7 2.7 10.6 0.0 0.0 0.0 0.0 0.0 0.0 8.1 1.4 5.4
Amount of time teacher was involved inclass:
Entire Lesson 75.0 91.7 81.3 75.0 91.9 82.4 62.5 71.4 68.2 59.1 71.4 62.1 70.4 85.7 76.8Three-quarters or more of period 15.0 8.3 12.5 16.7 5.4 11.8 37.5 21.4 27.3 27.3 28.6 27.6 20.4 11.4 16.7From half up to three-quarters of period 5.0 0.0 3.1 6.3 2.7 4.7 0.0 7.1 4.5 9.1 0.0 6.9 6.2 2.9 4.7From one-quarter up to half of period 0.0 0.0 0.0 0.0 0.0 0.0 0.0 0.0 0.0 0.0 0.0 0.0 0.0 0.0 0.0Less than one-quarter of period 5.0 0.0 3.1 0.0 0.0 0.0 0.0 0.0 0.0 4.5 0.0 3.4 2.0 0.0 1.2
Percent of classroom snapshots in which teacher was:
On-task, but not academically focused 21.3 10.4 17.2 11.5 12.2 11.8 9.4 0.0 3.4 23.9 21.4 23.3 16.1 10.3 13.7Off-task and not academically involved 5.0 6.3 5.5 14.1 15.5 14.7 0.0 16.1 10.2 26.1 57.1 33.6 13.8 18.2 15.6
Sample size 20 12 32 48 37 85 8 14 22 22 7 29 98 70 168
First Things First Classroom Observation Study
Table C.3
English English Math
All Schools
MathAll
classesa
Group I Schools Group II Schools
Houston, TXAll
classesa
Teacher's Classroom Activity Level
(continued)
Greenville, MSHouston, TX Riverview Gardens, MOAll
classesaMathEnglishAll
classesa
SOURCE: First Things First Classroom Observation Study.NOTE: aThe "All classes" columns represent weighted averages of the percentages for the English and math classes.
-70-
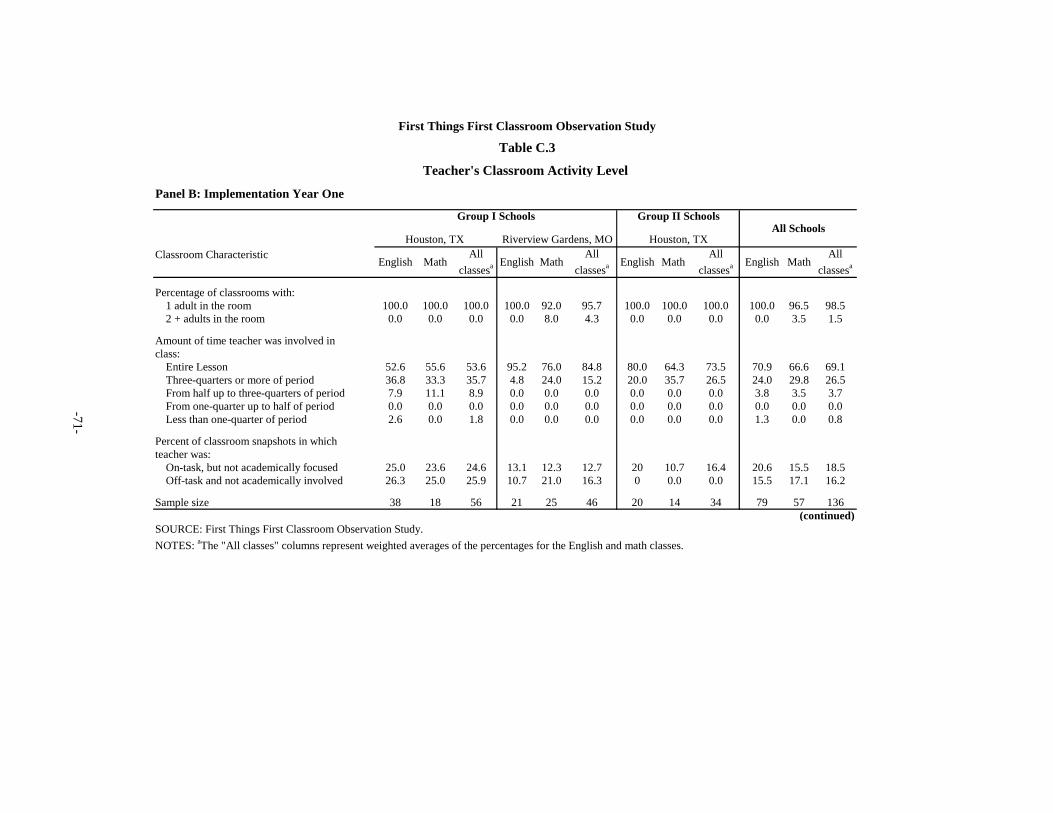
Panel B: Implementation Year One
Classroom Characteristic
Percentage of classrooms with:1 adult in the room 100.0 100.0 100.0 100.0 92.0 95.7 100.0 100.0 100.0 100.0 96.5 98.52 + adults in the room 0.0 0.0 0.0 0.0 8.0 4.3 0.0 0.0 0.0 0.0 3.5 1.5
Amount of time teacher was involved inclass:
Entire Lesson 52.6 55.6 53.6 95.2 76.0 84.8 80.0 64.3 73.5 70.9 66.6 69.1Three-quarters or more of period 36.8 33.3 35.7 4.8 24.0 15.2 20.0 35.7 26.5 24.0 29.8 26.5From half up to three-quarters of period 7.9 11.1 8.9 0.0 0.0 0.0 0.0 0.0 0.0 3.8 3.5 3.7From one-quarter up to half of period 0.0 0.0 0.0 0.0 0.0 0.0 0.0 0.0 0.0 0.0 0.0 0.0Less than one-quarter of period 2.6 0.0 1.8 0.0 0.0 0.0 0.0 0.0 0.0 1.3 0.0 0.8
Percent of classroom snapshots in which teacher was:
On-task, but not academically focused 25.0 23.6 24.6 13.1 12.3 12.7 20 10.7 16.4 20.6 15.5 18.5Off-task and not academically involved 26.3 25.0 25.9 10.7 21.0 16.3 0 0.0 0.0 15.5 17.1 16.2
Sample size 38 18 56 21 25 46 20 14 34 79 57 136
All classesaEnglish
First Things First Classroom Observation Study
English Math
Teacher's Classroom Activity Level
Table C.3
All classesa
Group I Schools
All classesaMathEnglish
(continued)
Houston, TX Riverview Gardens, MOAll Schools
Math English Math All
classesa
Group II Schools
Houston, TX
SOURCE: First Things First Classroom Observation Study.NOTES: aThe "All classes" columns represent weighted averages of the percentages for the English and math classes.
-71-
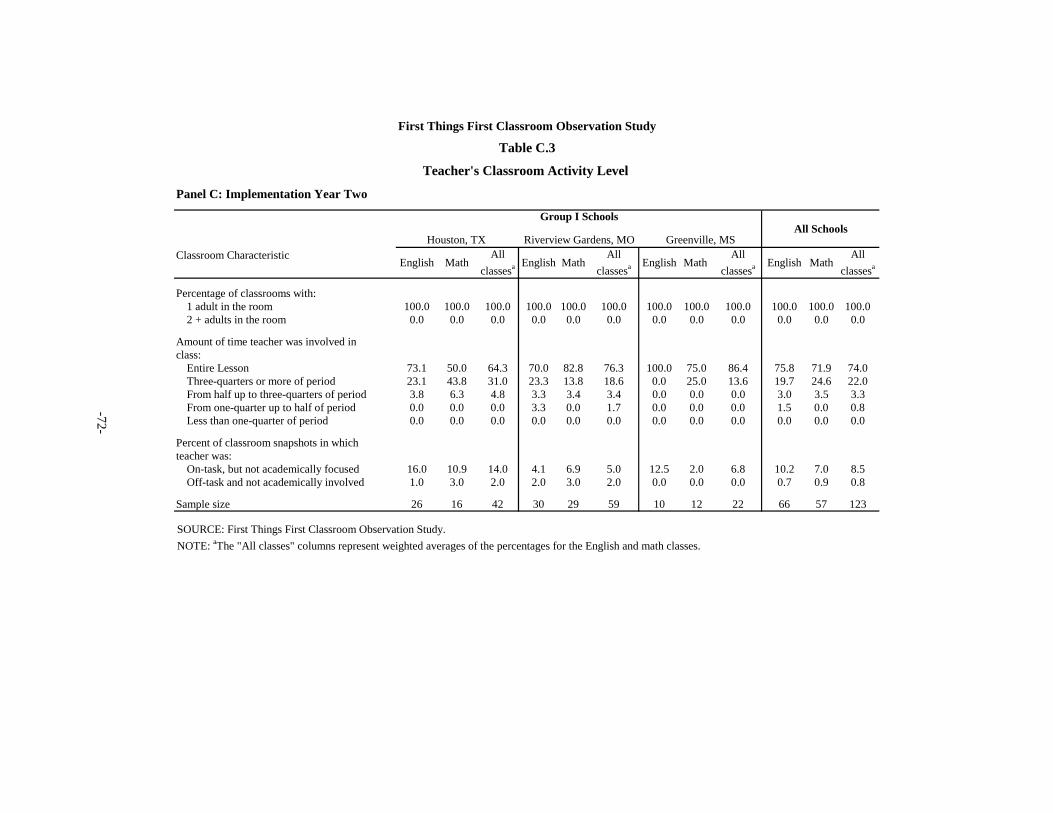
Panel C: Implementation Year Two
Classroom Characteristic
Percentage of classrooms with:1 adult in the room 100.0 100.0 100.0 100.0 100.0 100.0 100.0 100.0 100.0 100.0 100.0 100.02 + adults in the room 0.0 0.0 0.0 0.0 0.0 0.0 0.0 0.0 0.0 0.0 0.0 0.0
Amount of time teacher was involved inclass:
Entire Lesson 73.1 50.0 64.3 70.0 82.8 76.3 100.0 75.0 86.4 75.8 71.9 74.0Three-quarters or more of period 23.1 43.8 31.0 23.3 13.8 18.6 0.0 25.0 13.6 19.7 24.6 22.0From half up to three-quarters of period 3.8 6.3 4.8 3.3 3.4 3.4 0.0 0.0 0.0 3.0 3.5 3.3From one-quarter up to half of period 0.0 0.0 0.0 3.3 0.0 1.7 0.0 0.0 0.0 1.5 0.0 0.8Less than one-quarter of period 0.0 0.0 0.0 0.0 0.0 0.0 0.0 0.0 0.0 0.0 0.0 0.0
Percent of classroom snapshots in which teacher was:
On-task, but not academically focused 16.0 10.9 14.0 4.1 6.9 5.0 12.5 2.0 6.8 10.2 7.0 8.5Off-task and not academically involved 1.0 3.0 2.0 2.0 3.0 2.0 0.0 0.0 0.0 0.7 0.9 0.8
Sample size 26 16 42 30 29 59 10 12 22 66 57 123
English English EnglishAll
classesaMath Math
All Schools
MathAll
classesaAll
classesa
Greenville, MS
English Math All
classesa
Group I Schools
First Things First Classroom Observation Study
Table C.3
Teacher's Classroom Activity Level
Houston, TX Riverview Gardens, MO
SOURCE: First Things First Classroom Observation Study.NOTE: aThe "All classes" columns represent weighted averages of the percentages for the English and math classes.
-72-
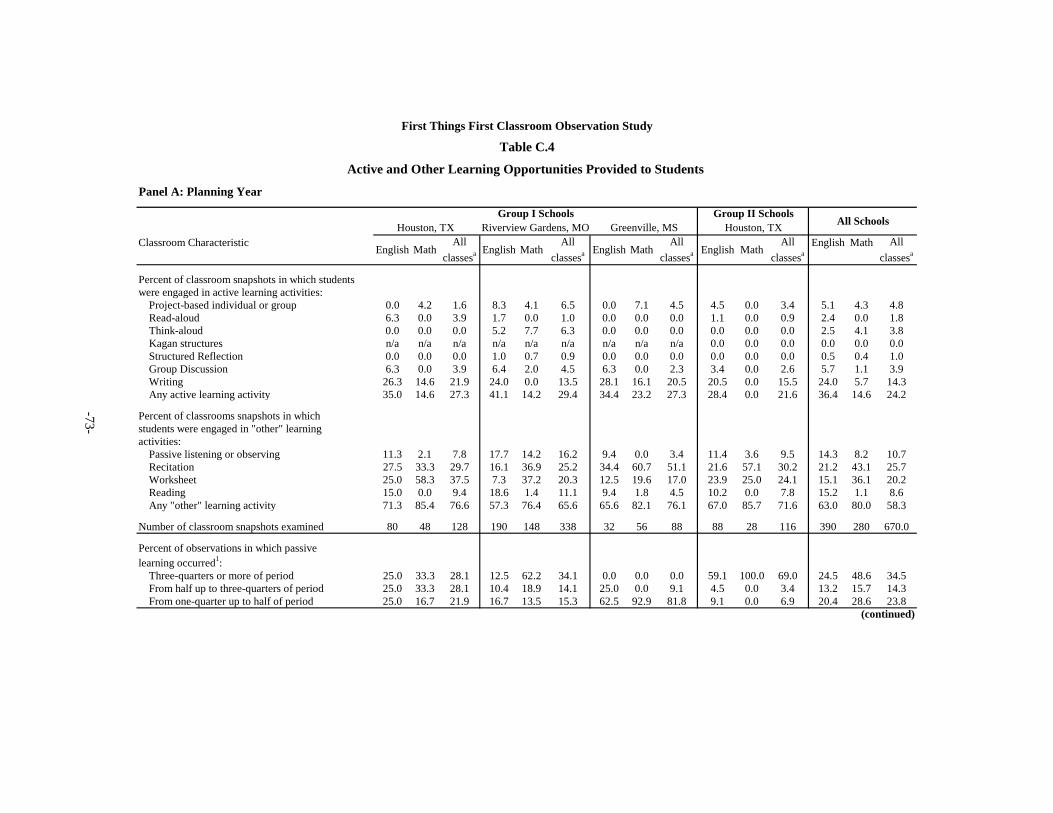
Panel A: Planning Year
Classroom Characteristic English Math
Percent of classroom snapshots in which students were engaged in active learning activities:
Project-based individual or group 0.0 4.2 1.6 8.3 4.1 6.5 0.0 7.1 4.5 4.5 0.0 3.4 5.1 4.3 4.8Read-aloud 6.3 0.0 3.9 1.7 0.0 1.0 0.0 0.0 0.0 1.1 0.0 0.9 2.4 0.0 1.8Think-aloud 0.0 0.0 0.0 5.2 7.7 6.3 0.0 0.0 0.0 0.0 0.0 0.0 2.5 4.1 3.8Kagan structures n/a n/a n/a n/a n/a n/a n/a n/a n/a 0.0 0.0 0.0 0.0 0.0 0.0Structured Reflection 0.0 0.0 0.0 1.0 0.7 0.9 0.0 0.0 0.0 0.0 0.0 0.0 0.5 0.4 1.0Group Discussion 6.3 0.0 3.9 6.4 2.0 4.5 6.3 0.0 2.3 3.4 0.0 2.6 5.7 1.1 3.9Writing 26.3 14.6 21.9 24.0 0.0 13.5 28.1 16.1 20.5 20.5 0.0 15.5 24.0 5.7 14.3Any active learning activity 35.0 14.6 27.3 41.1 14.2 29.4 34.4 23.2 27.3 28.4 0.0 21.6 36.4 14.6 24.2
Percent of classrooms snapshots in which students were engaged in "other" learning activities:
Passive listening or observing 11.3 2.1 7.8 17.7 14.2 16.2 9.4 0.0 3.4 11.4 3.6 9.5 14.3 8.2 10.7Recitation 27.5 33.3 29.7 16.1 36.9 25.2 34.4 60.7 51.1 21.6 57.1 30.2 21.2 43.1 25.7Worksheet 25.0 58.3 37.5 7.3 37.2 20.3 12.5 19.6 17.0 23.9 25.0 24.1 15.1 36.1 20.2Reading 15.0 0.0 9.4 18.6 1.4 11.1 9.4 1.8 4.5 10.2 0.0 7.8 15.2 1.1 8.6Any "other" learning activity 71.3 85.4 76.6 57.3 76.4 65.6 65.6 82.1 76.1 67.0 85.7 71.6 63.0 80.0 58.3
Number of classroom snapshots examined 80 48 128 190 148 338 32 56 88 88 28 116 390 280 670.0
Percent of observations in which passive learning occurred1:
Three-quarters or more of period 25.0 33.3 28.1 12.5 62.2 34.1 0.0 0.0 0.0 59.1 100.0 69.0 24.5 48.6 34.5From half up to three-quarters of period 25.0 33.3 28.1 10.4 18.9 14.1 25.0 0.0 9.1 4.5 0.0 3.4 13.2 15.7 14.3From one-quarter up to half of period 25.0 16.7 21.9 16.7 13.5 15.3 62.5 92.9 81.8 9.1 0.0 6.9 20.4 28.6 23.8
MathAll
classesaAll
classesaEnglish MathAll
classesa
(continued)
English MathAll
classesa English
Group II SchoolsAll Schools
MathAll
classesa English
Table C.4First Things First Classroom Observation Study
Houston, TX Riverview Gardens, MO Greenville, MS
Active and Other Learning Opportunities Provided to Students
Group I SchoolsHouston, TX
-73-
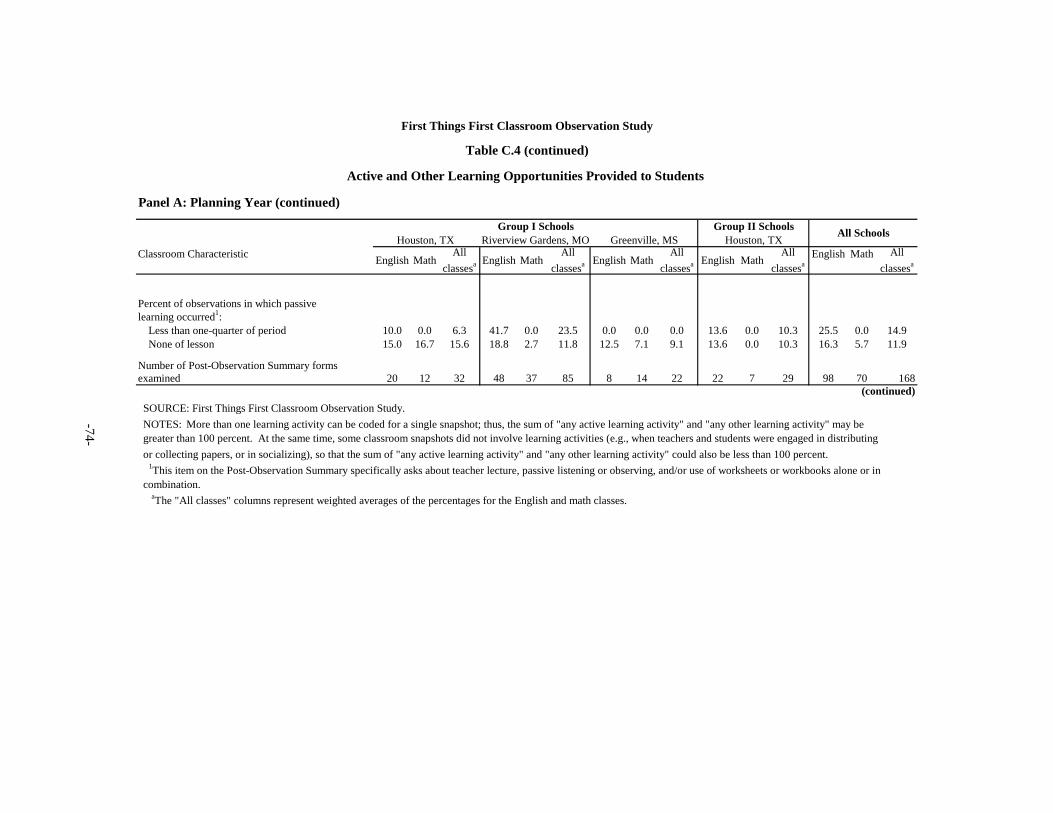
-74-
Panel A: Planning Year (continued)
Classroom Characteristic English Math
Percent of observations in which passive learning occurred1:
Less than one-quarter of period 10.0 0.0 6.3 41.7 0.0 23.5 0.0 0.0 0.0 13.6 0.0 10.3 25.5 0.0 14.9None of lesson 15.0 16.7 15.6 18.8 2.7 11.8 12.5 7.1 9.1 13.6 0.0 10.3 16.3 5.7 11.9
Number of Post-Observation Summary forms examined 20 12 32 48 37 85 8 14 22 22 7 29 98 70 168
Active and Other Learning Opportunities Provided to Students
First Things First Classroom Observation Study
Table C.4 (continued)
English Math
(continued)
All classesa English Math
All classesa
All classesa English Math
All classesa
All classesa
All SchoolsHouston, TX Riverview Gardens, MO Greenville, MS Houston, TXGroup I Schools Group II Schools
English Math
SOURCE: First Things First Classroom Observation Study.NOTES: More than one learning activity can be coded for a single snapshot; thus, the sum of "any active learning activity" and "any other learning activity" may be greater than 100 percent. At the same time, some classroom snapshots did not involve learning activities (e.g., when teachers and students were engaged in distributing or collecting papers, or in socializing), so that the sum of "any active learning activity" and "any other learning activity" could also be less than 100 percent. 1This item on the Post-Observation Summary specifically asks about teacher lecture, passive listening or observing, and/or use of worksheets or workbooks alone or in combination. aThe "All classes" columns represent weighted averages of the percentages for the English and math classes.
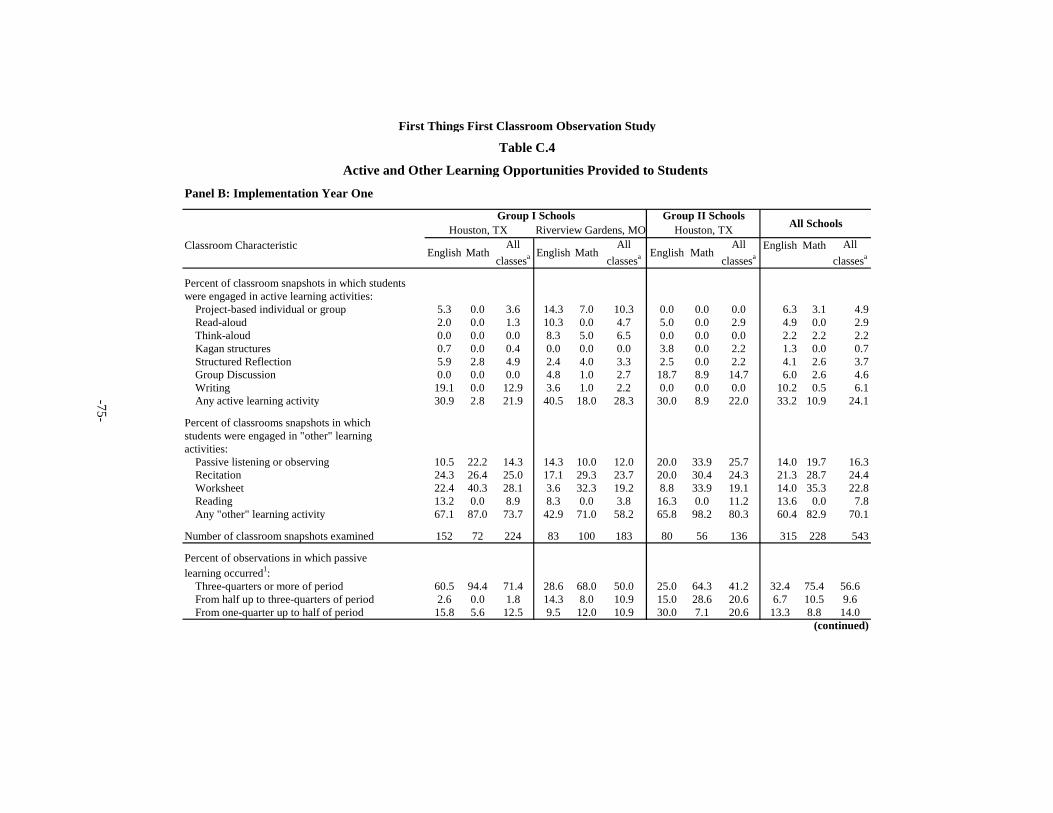
Panel B: Implementation Year One
Classroom Characteristic English Math
Percent of classroom snapshots in which students were engaged in active learning activities:
Project-based individual or group 5.3 0.0 3.6 14.3 7.0 10.3 0.0 0.0 0.0 6.3 3.1 4.9Read-aloud 2.0 0.0 1.3 10.3 0.0 4.7 5.0 0.0 2.9 4.9 0.0 2.9Think-aloud 0.0 0.0 0.0 8.3 5.0 6.5 0.0 0.0 0.0 2.2 2.2 2.2Kagan structures 0.7 0.0 0.4 0.0 0.0 0.0 3.8 0.0 2.2 1.3 0.0 0.7Structured Reflection 5.9 2.8 4.9 2.4 4.0 3.3 2.5 0.0 2.2 4.1 2.6 3.7Group Discussion 0.0 0.0 0.0 4.8 1.0 2.7 18.7 8.9 14.7 6.0 2.6 4.6Writing 19.1 0.0 12.9 3.6 1.0 2.2 0.0 0.0 0.0 10.2 0.5 6.1Any active learning activity 30.9 2.8 21.9 40.5 18.0 28.3 30.0 8.9 22.0 33.2 10.9 24.1
Percent of classrooms snapshots in which students were engaged in "other" learning activities:
Passive listening or observing 10.5 22.2 14.3 14.3 10.0 12.0 20.0 33.9 25.7 14.0 19.7 16.3Recitation 24.3 26.4 25.0 17.1 29.3 23.7 20.0 30.4 24.3 21.3 28.7 24.4Worksheet 22.4 40.3 28.1 3.6 32.3 19.2 8.8 33.9 19.1 14.0 35.3 22.8Reading 13.2 0.0 8.9 8.3 0.0 3.8 16.3 0.0 11.2 13.6 0.0 7.8Any "other" learning activity 67.1 87.0 73.7 42.9 71.0 58.2 65.8 98.2 80.3 60.4 82.9 70.1
Number of classroom snapshots examined 152 72 224 83 100 183 80 56 136 315 228 543
Percent of observations in which passive learning occurred1:
Three-quarters or more of period 60.5 94.4 71.4 28.6 68.0 50.0 25.0 64.3 41.2 32.4 75.4 56.6From half up to three-quarters of period 2.6 0.0 1.8 14.3 8.0 10.9 15.0 28.6 20.6 6.7 10.5 9.6From one-quarter up to half of period 15.8 5.6 12.5 9.5 12.0 10.9 30.0 7.1 20.6 13.3 8.8 14.0
(continued)
All classesa
Group I SchoolsHouston, TX
Group II SchoolsAll Schools
EnglishMathAll
classesa MathAll
classesaEnglish MathAll
classesa English
Table C.4First Things First Classroom Observation Study
Houston, TX Riverview Gardens, MO
Active and Other Learning Opportunities Provided to Students
-75-
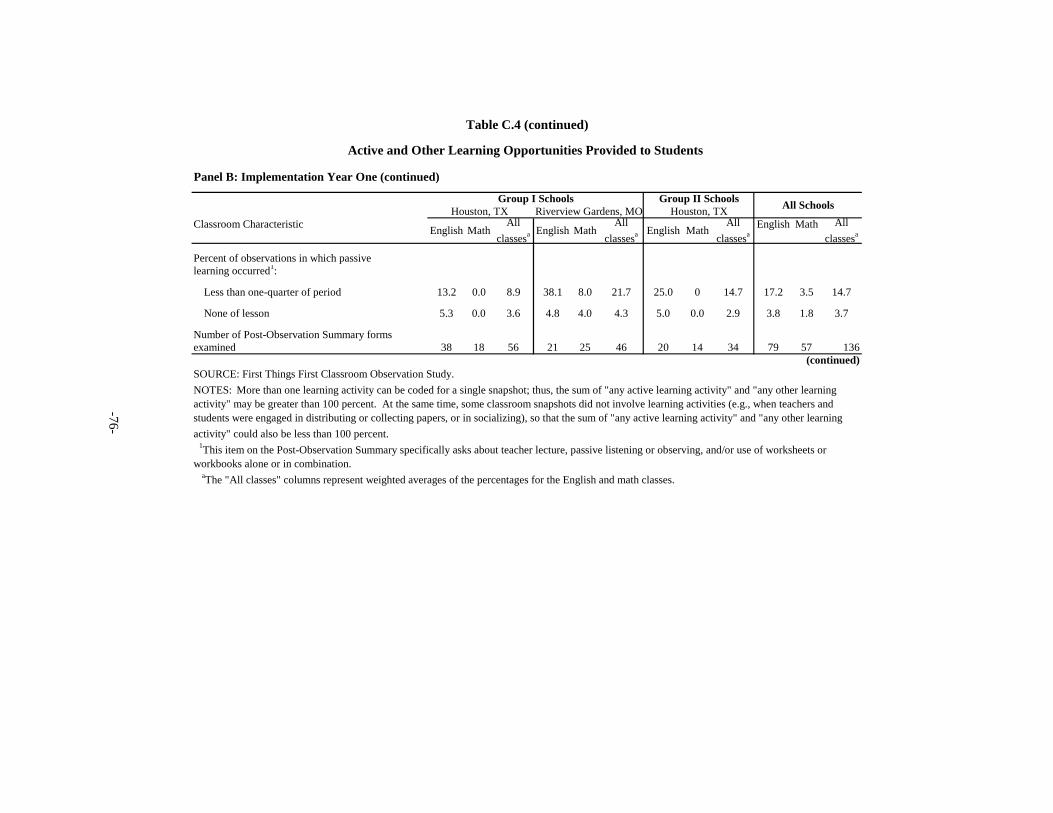
Panel B: Implementation Year One (continued)
Classroom Characteristic English Math
Percent of observations in which passive learning occurred1:
Less than one-quarter of period 13.2 0.0 8.9 38.1 8.0 21.7 25.0 0 14.7 17.2 3.5 14.7
None of lesson 5.3 0.0 3.6 4.8 4.0 4.3 5.0 0.0 2.9 3.8 1.8 3.7
Number of Post-Observation Summary forms examined 38 18 56 21 25 46 20 14 34 79 57 136
All classesa
All classesa
(continued)
MathAll
classesa English MathEnglish MathAll
classesa English
Group I Schools Group II Schools All SchoolsHouston, TX Riverview Gardens, MO Houston, TX
Table C.4 (continued)
Active and Other Learning Opportunities Provided to Students
SOURCE: First Things First Classroom Observation Study.NOTES: More than one learning activity can be coded for a single snapshot; thus, the sum of "any active learning activity" and "any other learning activity" may be greater than 100 percent. At the same time, some classroom snapshots did not involve learning activities (e.g., when teachers and students were engaged in distributing or collecting papers, or in socializing), so that the sum of "any active learning activity" and "any other learning activity" could also be less than 100 percent. 1This item on the Post-Observation Summary specifically asks about teacher lecture, passive listening or observing, and/or use of worksheets or workbooks alone or in combination. aThe "All classes" columns represent weighted averages of the percentages for the English and math classes.
-76-
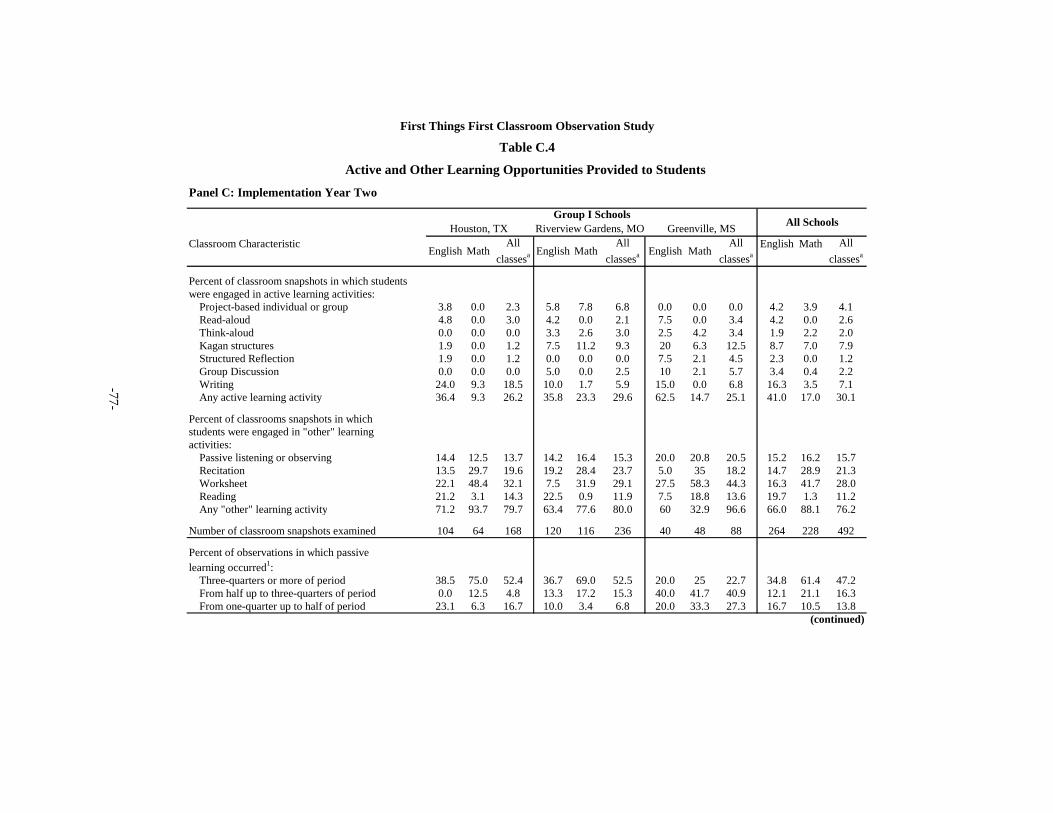
Panel C: Implementation Year Two
Classroom Characteristic English Math
Percent of classroom snapshots in which students were engaged in active learning activities:
Project-based individual or group 3.8 0.0 2.3 5.8 7.8 6.8 0.0 0.0 0.0 4.2 3.9 4.1Read-aloud 4.8 0.0 3.0 4.2 0.0 2.1 7.5 0.0 3.4 4.2 0.0 2.6Think-aloud 0.0 0.0 0.0 3.3 2.6 3.0 2.5 4.2 3.4 1.9 2.2 2.0Kagan structures 1.9 0.0 1.2 7.5 11.2 9.3 20 6.3 12.5 8.7 7.0 7.9Structured Reflection 1.9 0.0 1.2 0.0 0.0 0.0 7.5 2.1 4.5 2.3 0.0 1.2Group Discussion 0.0 0.0 0.0 5.0 0.0 2.5 10 2.1 5.7 3.4 0.4 2.2Writing 24.0 9.3 18.5 10.0 1.7 5.9 15.0 0.0 6.8 16.3 3.5 7.1Any active learning activity 36.4 9.3 26.2 35.8 23.3 29.6 62.5 14.7 25.1 41.0 17.0 30.1
Percent of classrooms snapshots in which students were engaged in "other" learning activities:
Passive listening or observing 14.4 12.5 13.7 14.2 16.4 15.3 20.0 20.8 20.5 15.2 16.2 15.7Recitation 13.5 29.7 19.6 19.2 28.4 23.7 5.0 35 18.2 14.7 28.9 21.3Worksheet 22.1 48.4 32.1 7.5 31.9 29.1 27.5 58.3 44.3 16.3 41.7 28.0Reading 21.2 3.1 14.3 22.5 0.9 11.9 7.5 18.8 13.6 19.7 1.3 11.2Any "other" learning activity 71.2 93.7 79.7 63.4 77.6 80.0 60 32.9 96.6 66.0 88.1 76.2
Number of classroom snapshots examined 104 64 168 120 116 236 40 48 88 264 228 492
Percent of observations in which passive learning occurred1:
Three-quarters or more of period 38.5 75.0 52.4 36.7 69.0 52.5 20.0 25 22.7 34.8 61.4 47.2From half up to three-quarters of period 0.0 12.5 4.8 13.3 17.2 15.3 40.0 41.7 40.9 12.1 21.1 16.3From one-quarter up to half of period 23.1 6.3 16.7 10.0 3.4 6.8 20.0 33.3 27.3 16.7 10.5 13.8
First Things First Classroom Observation Study
Houston, TX Riverview Gardens, MO
Active and Other Learning Opportunities Provided to Students
Table C.4
Greenville, MS All SchoolsGroup I Schools
EnglishMathAll
classesa MathAll
classesaEnglish MathAll
classesa EnglishAll
classesa
(continued)
-77-
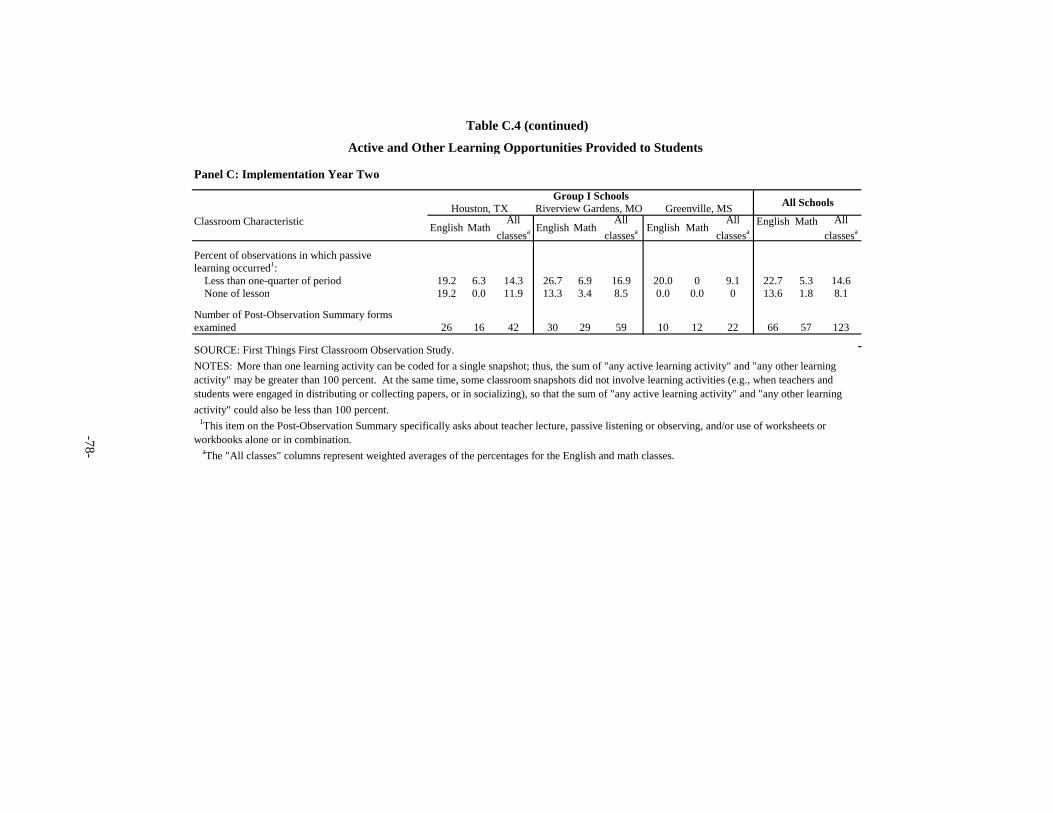
Panel C: Implementation Year Two
Classroom Characteristic English Math
Percent of observations in which passive learning occurred1:
Less than one-quarter of period 19.2 6.3 14.3 26.7 6.9 16.9 20.0 0 9.1 22.7 5.3 14.6None of lesson 19.2 0.0 11.9 13.3 3.4 8.5 0.0 0.0 0 13.6 1.8 8.1
Number of Post-Observation Summary forms examined 26 16 42 30 29 59 10 12 22 66 57 123
Math
Active and Other Learning Opportunities Provided to Students
English MathAll
classesa EnglishAll
classesaAll
classesaMathAll
classesa English
Group I Schools All SchoolsHouston, TX Riverview Gardens, MO Greenville, MS
Table C.4 (continued)
SOURCE: First Things First Classroom Observation Study.NOTES: More than one learning activity can be coded for a single snapshot; thus, the sum of "any active learning activity" and "any other learning activity" may be greater than 100 percent. At the same time, some classroom snapshots did not involve learning activities (e.g., when teachers and students were engaged in distributing or collecting papers, or in socializing), so that the sum of "any active learning activity" and "any other learning activity" could also be less than 100 percent. 1This item on the Post-Observation Summary specifically asks about teacher lecture, passive listening or observing, and/or use of worksheets or workbooks alone or in combination. aThe "All classes" columns represent weighted averages of the percentages for the English and math classes.
-78-
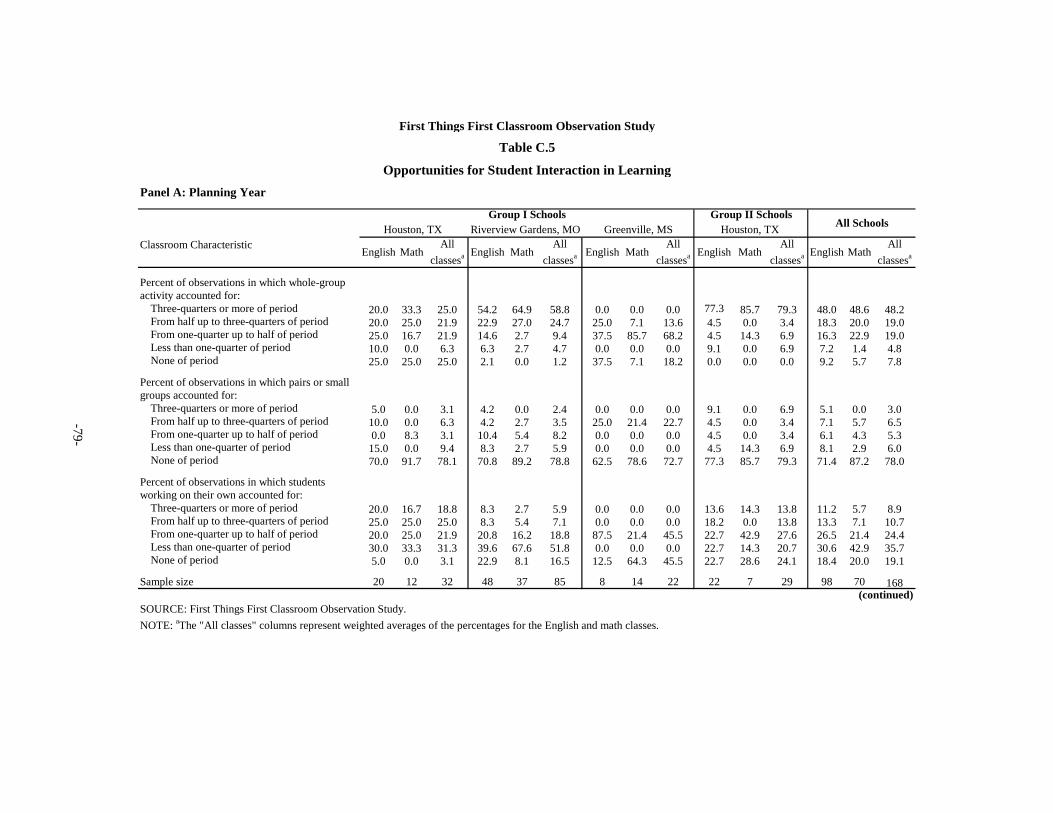
Panel A: Planning Year
Classroom Characteristic
Percent of observations in which whole-group activity accounted for:
Three-quarters or more of period 20.0 33.3 25.0 54.2 64.9 58.8 0.0 0.0 0.0 77.3 85.7 79.3 48.0 48.6 48.2From half up to three-quarters of period 20.0 25.0 21.9 22.9 27.0 24.7 25.0 7.1 13.6 4.5 0.0 3.4 18.3 20.0 19.0From one-quarter up to half of period 25.0 16.7 21.9 14.6 2.7 9.4 37.5 85.7 68.2 4.5 14.3 6.9 16.3 22.9 19.0Less than one-quarter of period 10.0 0.0 6.3 6.3 2.7 4.7 0.0 0.0 0.0 9.1 0.0 6.9 7.2 1.4 4.8None of period 25.0 25.0 25.0 2.1 0.0 1.2 37.5 7.1 18.2 0.0 0.0 0.0 9.2 5.7 7.8
Percent of observations in which pairs or small groups accounted for:
Three-quarters or more of period 5.0 0.0 3.1 4.2 0.0 2.4 0.0 0.0 0.0 9.1 0.0 6.9 5.1 0.0 3.0From half up to three-quarters of period 10.0 0.0 6.3 4.2 2.7 3.5 25.0 21.4 22.7 4.5 0.0 3.4 7.1 5.7 6.5From one-quarter up to half of period 0.0 8.3 3.1 10.4 5.4 8.2 0.0 0.0 0.0 4.5 0.0 3.4 6.1 4.3 5.3Less than one-quarter of period 15.0 0.0 9.4 8.3 2.7 5.9 0.0 0.0 0.0 4.5 14.3 6.9 8.1 2.9 6.0None of period 70.0 91.7 78.1 70.8 89.2 78.8 62.5 78.6 72.7 77.3 85.7 79.3 71.4 87.2 78.0
Percent of observations in which students working on their own accounted for:
Three-quarters or more of period 20.0 16.7 18.8 8.3 2.7 5.9 0.0 0.0 0.0 13.6 14.3 13.8 11.2 5.7 8.9From half up to three-quarters of period 25.0 25.0 25.0 8.3 5.4 7.1 0.0 0.0 0.0 18.2 0.0 13.8 13.3 7.1 10.7From one-quarter up to half of period 20.0 25.0 21.9 20.8 16.2 18.8 87.5 21.4 45.5 22.7 42.9 27.6 26.5 21.4 24.4Less than one-quarter of period 30.0 33.3 31.3 39.6 67.6 51.8 0.0 0.0 0.0 22.7 14.3 20.7 30.6 42.9 35.7None of period 5.0 0.0 3.1 22.9 8.1 16.5 12.5 64.3 45.5 22.7 28.6 24.1 18.4 20.0 19.1
Sample size 20 12 32 48 37 85 8 14 22 22 7 29 98 70 168
First Things First Classroom Observation Study
Greenville, MS Houston, TX
Table C.5
Opportunities for Student Interaction in Learning
Houston, TX Riverview Gardens, MOGroup II Schools
English MathAll
classesa English MathAll
classesa English Math
(continued)
All classesa
All Schools
English MathAll
classesaEnglish MathAll
classesa
Group I Schools
SOURCE: First Things First Classroom Observation Study.NOTE: aThe "All classes" columns represent weighted averages of the percentages for the English and math classes.
-79-
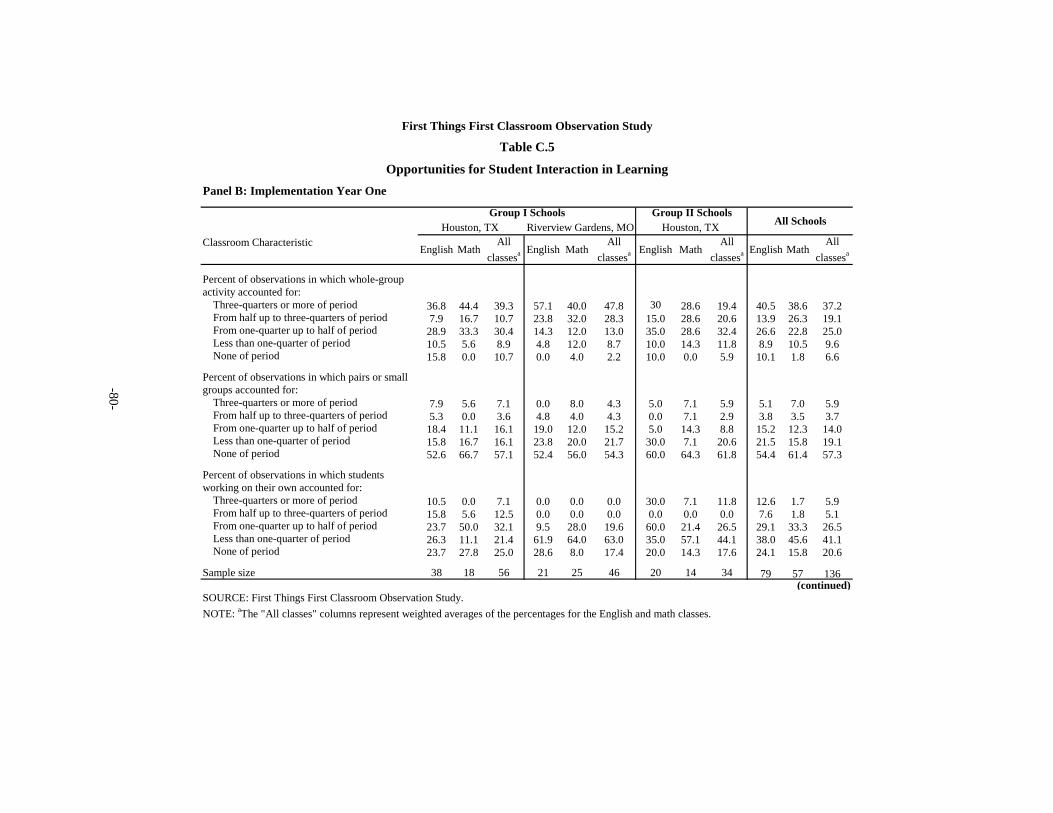
Panel B: Implementation Year One
Classroom Characteristic
Percent of observations in which whole-group activity accounted for:
Three-quarters or more of period 36.8 44.4 39.3 57.1 40.0 47.8 30 28.6 19.4 40.5 38.6 37.2From half up to three-quarters of period 7.9 16.7 10.7 23.8 32.0 28.3 15.0 28.6 20.6 13.9 26.3 19.1From one-quarter up to half of period 28.9 33.3 30.4 14.3 12.0 13.0 35.0 28.6 32.4 26.6 22.8 25.0Less than one-quarter of period 10.5 5.6 8.9 4.8 12.0 8.7 10.0 14.3 11.8 8.9 10.5 9.6None of period 15.8 0.0 10.7 0.0 4.0 2.2 10.0 0.0 5.9 10.1 1.8 6.6
Percent of observations in which pairs or small groups accounted for:
Three-quarters or more of period 7.9 5.6 7.1 0.0 8.0 4.3 5.0 7.1 5.9 5.1 7.0 5.9From half up to three-quarters of period 5.3 0.0 3.6 4.8 4.0 4.3 0.0 7.1 2.9 3.8 3.5 3.7From one-quarter up to half of period 18.4 11.1 16.1 19.0 12.0 15.2 5.0 14.3 8.8 15.2 12.3 14.0Less than one-quarter of period 15.8 16.7 16.1 23.8 20.0 21.7 30.0 7.1 20.6 21.5 15.8 19.1None of period 52.6 66.7 57.1 52.4 56.0 54.3 60.0 64.3 61.8 54.4 61.4 57.3
Percent of observations in which students working on their own accounted for:
Three-quarters or more of period 10.5 0.0 7.1 0.0 0.0 0.0 30.0 7.1 11.8 12.6 1.7 5.9From half up to three-quarters of period 15.8 5.6 12.5 0.0 0.0 0.0 0.0 0.0 0.0 7.6 1.8 5.1From one-quarter up to half of period 23.7 50.0 32.1 9.5 28.0 19.6 60.0 21.4 26.5 29.1 33.3 26.5Less than one-quarter of period 26.3 11.1 21.4 61.9 64.0 63.0 35.0 57.1 44.1 38.0 45.6 41.1None of period 23.7 27.8 25.0 28.6 8.0 17.4 20.0 14.3 17.6 24.1 15.8 20.6
Sample size 38 18 56 21 25 46 20 14 34 79 57 136
All Schools
English MathAll
classesaEnglish MathAll
classesa
Group II Schools
English MathAll
classesa English
(continued)
First Things First Classroom Observation Study
Houston, TX
Table C.5
Opportunities for Student Interaction in Learning
Houston, TX Riverview Gardens, MOGroup I Schools
MathAll
classesa
SOURCE: First Things First Classroom Observation Study.NOTE: aThe "All classes" columns represent weighted averages of the percentages for the English and math classes.
-80-
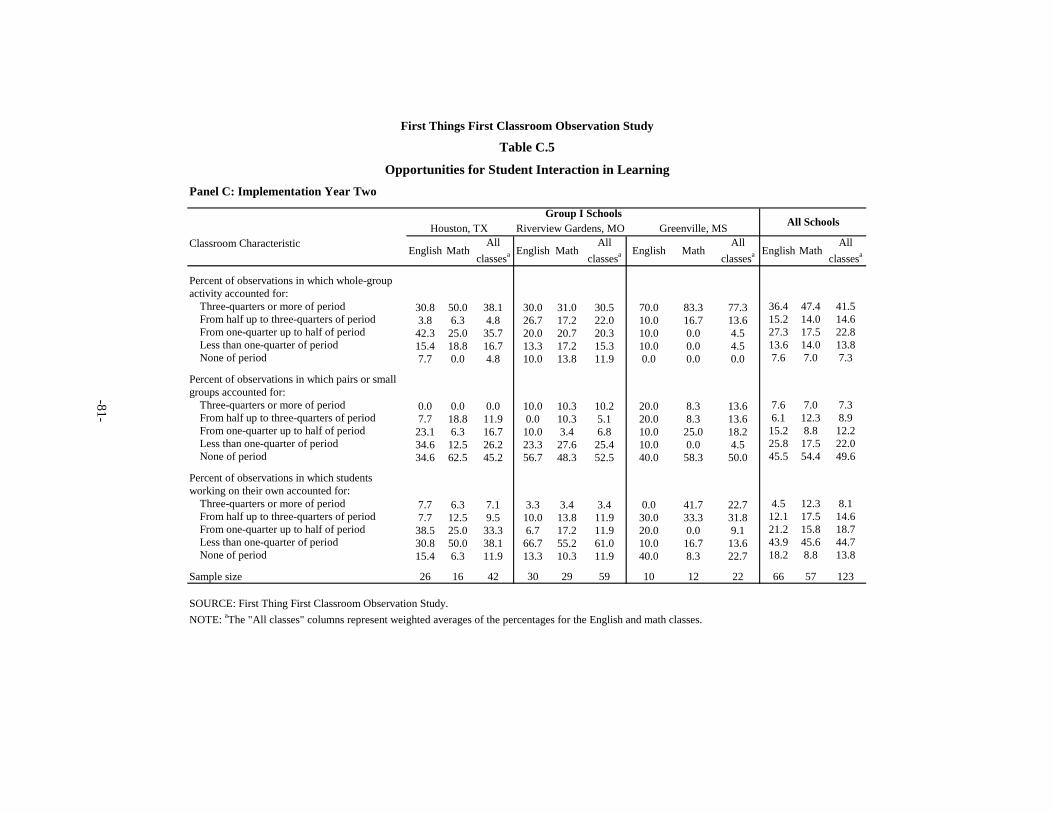
Panel C: Implementation Year Two
Classroom Characteristic
Percent of observations in which whole-group activity accounted for:
Three-quarters or more of period 30.8 50.0 38.1 30.0 31.0 30.5 70.0 83.3 77.3 36.4 47.4 41.5From half up to three-quarters of period 3.8 6.3 4.8 26.7 17.2 22.0 10.0 16.7 13.6 15.2 14.0 14.6From one-quarter up to half of period 42.3 25.0 35.7 20.0 20.7 20.3 10.0 0.0 4.5 27.3 17.5 22.8Less than one-quarter of period 15.4 18.8 16.7 13.3 17.2 15.3 10.0 0.0 4.5 13.6 14.0 13.8None of period 7.7 0.0 4.8 10.0 13.8 11.9 0.0 0.0 0.0 7.6 7.0 7.3
Percent of observations in which pairs or small groups accounted for:
Three-quarters or more of period 0.0 0.0 0.0 10.0 10.3 10.2 20.0 8.3 13.6 7.6 7.0 7.3From half up to three-quarters of period 7.7 18.8 11.9 0.0 10.3 5.1 20.0 8.3 13.6 6.1 12.3 8.9From one-quarter up to half of period 23.1 6.3 16.7 10.0 3.4 6.8 10.0 25.0 18.2 15.2 8.8 12.2Less than one-quarter of period 34.6 12.5 26.2 23.3 27.6 25.4 10.0 0.0 4.5 25.8 17.5 22.0None of period 34.6 62.5 45.2 56.7 48.3 52.5 40.0 58.3 50.0 45.5 54.4 49.6
Percent of observations in which students working on their own accounted for:
Three-quarters or more of period 7.7 6.3 7.1 3.3 3.4 3.4 0.0 41.7 22.7 4.5 12.3 8.1From half up to three-quarters of period 7.7 12.5 9.5 10.0 13.8 11.9 30.0 33.3 31.8 12.1 17.5 14.6From one-quarter up to half of period 38.5 25.0 33.3 6.7 17.2 11.9 20.0 0.0 9.1 21.2 15.8 18.7Less than one-quarter of period 30.8 50.0 38.1 66.7 55.2 61.0 10.0 16.7 13.6 43.9 45.6 44.7None of period 15.4 6.3 11.9 13.3 10.3 11.9 40.0 8.3 22.7 18.2 8.8 13.8
Sample size 26 16 42 30 29 59 10 12 22 66 57 123
First Things First Classroom Observation Study
Greenville, MS
Table C.5
Opportunities for Student Interaction in Learning
Houston, TX Riverview Gardens, MO All SchoolsGroup I Schools
MathAll
classesaEnglish MathAll
classesa English English MathAll
classesaEnglish MathAll
classesa
SOURCE: First Thing First Classroom Observation Study.NOTE: aThe "All classes" columns represent weighted averages of the percentages for the English and math classes.
-81-
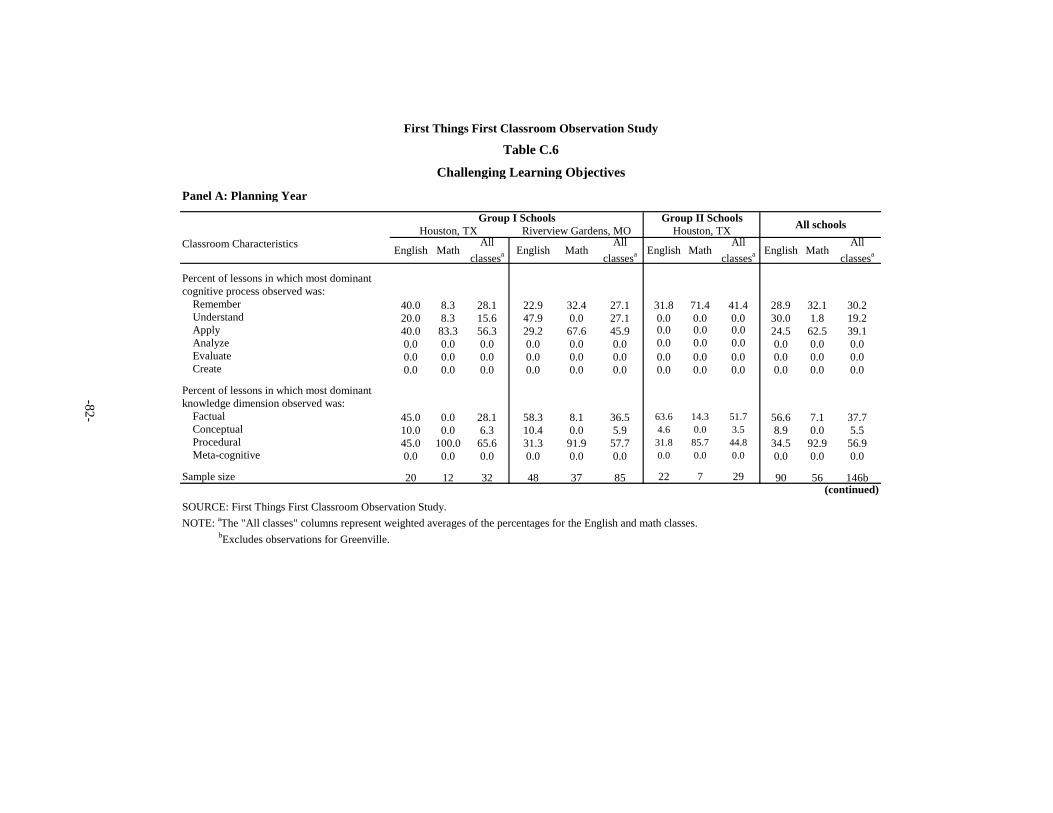
Panel A: Planning Year
Classroom Characteristics
Percent of lessons in which most dominant cognitive process observed was:
Remember 40.0 8.3 28.1 22.9 32.4 27.1 31.8 71.4 41.4 28.9 32.1 30.2Understand 20.0 8.3 15.6 47.9 0.0 27.1 0.0 0.0 0.0 30.0 1.8 19.2Apply 40.0 83.3 56.3 29.2 67.6 45.9 0.0 0.0 0.0 24.5 62.5 39.1Analyze 0.0 0.0 0.0 0.0 0.0 0.0 0.0 0.0 0.0 0.0 0.0 0.0Evaluate 0.0 0.0 0.0 0.0 0.0 0.0 0.0 0.0 0.0 0.0 0.0 0.0Create 0.0 0.0 0.0 0.0 0.0 0.0 0.0 0.0 0.0 0.0 0.0 0.0
Percent of lessons in which most dominant knowledge dimension observed was:
Factual 45.0 0.0 28.1 58.3 8.1 36.5 63.6 14.3 51.7 56.6 7.1 37.7Conceptual 10.0 0.0 6.3 10.4 0.0 5.9 4.6 0.0 3.5 8.9 0.0 5.5Procedural 45.0 100.0 65.6 31.3 91.9 57.7 31.8 85.7 44.8 34.5 92.9 56.9Meta-cognitive 0.0 0.0 0.0 0.0 0.0 0.0 0.0 0.0 0.0 0.0 0.0 0.0
Sample size 20 12 32 48 37 85 22 7 29 90 56 146b
English MathAll
classesa English
(continued)
All classesaEnglishMath
All classesa English Math
All classesa Math
First Things First Classroom Observation Study
Challenging Learning Objectives
Table C.6
Houston, TX Riverview Gardens, MOGroup I Schools
Houston, TX All schoolsGroup II Schools
SOURCE: First Things First Classroom Observation Study.NOTE: aThe "All classes" columns represent weighted averages of the percentages for the English and math classes. bExcludes observations for Greenville.
-82-
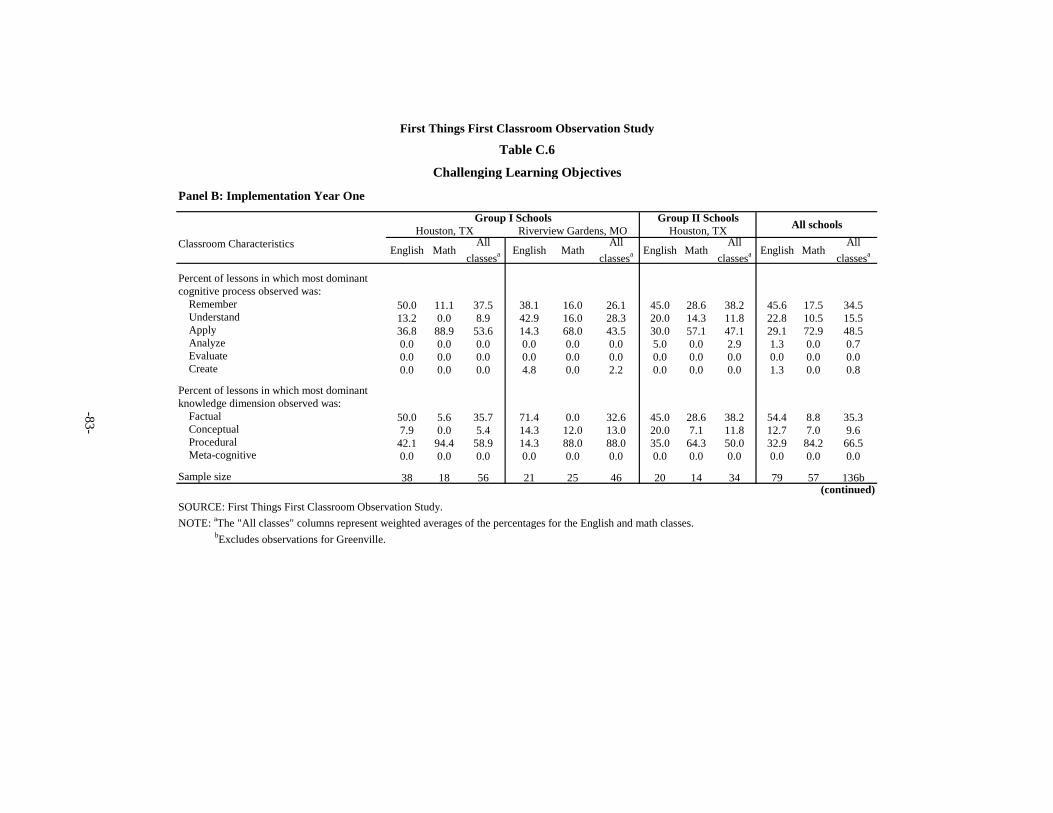
Panel B: Implementation Year One
Classroom Characteristics
Percent of lessons in which most dominant cognitive process observed was:
Remember 50.0 11.1 37.5 38.1 16.0 26.1 45.0 28.6 38.2 45.6 17.5 34.5Understand 13.2 0.0 8.9 42.9 16.0 28.3 20.0 14.3 11.8 22.8 10.5 15.5Apply 36.8 88.9 53.6 14.3 68.0 43.5 30.0 57.1 47.1 29.1 72.9 48.5Analyze 0.0 0.0 0.0 0.0 0.0 0.0 5.0 0.0 2.9 1.3 0.0 0.7Evaluate 0.0 0.0 0.0 0.0 0.0 0.0 0.0 0.0 0.0 0.0 0.0 0.0Create 0.0 0.0 0.0 4.8 0.0 2.2 0.0 0.0 0.0 1.3 0.0 0.8
Percent of lessons in which most dominant knowledge dimension observed was:
Factual 50.0 5.6 35.7 71.4 0.0 32.6 45.0 28.6 38.2 54.4 8.8 35.3Conceptual 7.9 0.0 5.4 14.3 12.0 13.0 20.0 7.1 11.8 12.7 7.0 9.6Procedural 42.1 94.4 58.9 14.3 88.0 88.0 35.0 64.3 50.0 32.9 84.2 66.5Meta-cognitive 0.0 0.0 0.0 0.0 0.0 0.0 0.0 0.0 0.0 0.0 0.0 0.0
Sample size 38 18 56 21 25 46 20 14 34 79 57 136b
First Things First Classroom Observation Study
Challenging Learning Objectives
Table C.6
Houston, TX Riverview Gardens, MOGroup I Schools
Houston, TX All schoolsGroup II Schools
(continued)
All classesaEnglishMath
All classesa English Math
All classesa MathEnglish Math
All classesa English
SOURCE: First Things First Classroom Observation Study.NOTE: aThe "All classes" columns represent weighted averages of the percentages for the English and math classes. bExcludes observations for Greenville.
-83-

-84-
Panel C: Implementation Year Two
Classroom Characteristics
Percent of lessons in which most dominant cognitive process observed was:
Remember 46.2 73.3 56.1 23.3 34.5 28.8 33.9 47.4 40.0Understand 19.2 6.7 14.6 30.0 17.2 23.7 25.0 13.6 20.0Apply 26.9 20.0 24.4 30.0 48.3 39.0 28.6 38.6 33.0Analyze 3.8 0.0 2.4 3.3 0.0 1.7 3.6 0.0 2.0Evaluate 0.0 0.0 0.0 3.3 0.0 1.7 1.8 0.0 1.0Create 3.8 0.0 2.4 10.0 0.0 5.1 7.1 0.0 4.0
Percent of lessons in which most dominant knowledge dimension observed was:
Factual 50.0 20.0 39.0 36.7 10.3 23.7 42.9 13.6 30.0Conceptual 11.5 6.7 9.8 20.0 10.3 15.3 16.1 91.0 13.0Procedural 38.5 73.3 51.2 43.3 79.3 61.0 41.1 77.3 57.0Meta-cognitive 0.0 0.0 0.0 0.0 0.0 0.0 0.0 0.0 0.0
Sample size 26 15 41 30 29 59 56 44 100b
English
First Things First Classroom Observation Study
Challenging Learning Objectives
Table C.6
Houston, TX Riverview Gardens, MOAll
classesa
All schoolsGroup I Schools
English MathMathAll
classesaEnglish MathAll
classesa
SOURCE: First Things First Classroom Observation Study.NOTE: aThe "All classes" columns represent weighted averages of the percentages for the English and math classes. bExcludes observations for Greenville and one other observation that could not be cited.
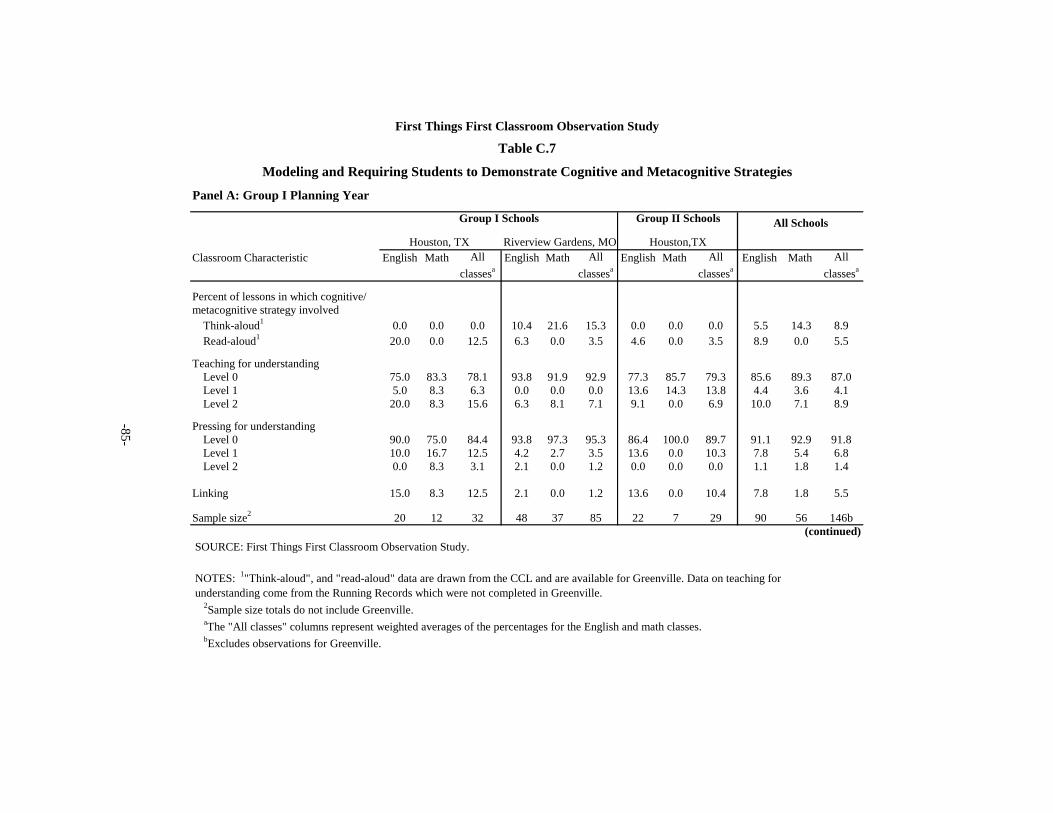
-85-
Panel A: Group I Planning Year
Classroom Characteristic English Math English Math English Math English Math
Percent of lessons in which cognitive/metacognitive strategy involved
Think-aloud1 0.0 0.0 0.0 10.4 21.6 15.3 0.0 0.0 0.0 5.5 14.3 8.9Read-aloud1 20.0 0.0 12.5 6.3 0.0 3.5 4.6 0.0 3.5 8.9 0.0 5.5
Teaching for understandingLevel 0 75.0 83.3 78.1 93.8 91.9 92.9 77.3 85.7 79.3 85.6 89.3 87.0Level 1 5.0 8.3 6.3 0.0 0.0 0.0 13.6 14.3 13.8 4.4 3.6 4.1Level 2 20.0 8.3 15.6 6.3 8.1 7.1 9.1 0.0 6.9 10.0 7.1 8.9
Pressing for understandingLevel 0 90.0 75.0 84.4 93.8 97.3 95.3 86.4 100.0 89.7 91.1 92.9 91.8Level 1 10.0 16.7 12.5 4.2 2.7 3.5 13.6 0.0 10.3 7.8 5.4 6.8Level 2 0.0 8.3 3.1 2.1 0.0 1.2 0.0 0.0 0.0 1.1 1.8 1.4
Linking 15.0 8.3 12.5 2.1 0.0 1.2 13.6 0.0 10.4 7.8 1.8 5.5
Sample size2 20 12 32 48 37 85 22 7 29 90 56 146b
All classesa
Houston,TX
Group II Schools All Schools
(continued)
First Things First Classroom Observation Study
Table C.7
Modeling and Requiring Students to Demonstrate Cognitive and Metacognitive Strategies
Riverview Gardens, MOHouston, TX All
classesa
Group I Schools
All classesa
All classesa
SOURCE: First Things First Classroom Observation Study.
NOTES: 1"Think-aloud", and "read-aloud" data are drawn from the CCL and are available for Greenville. Data on teaching for understanding come from the Running Records which were not completed in Greenville. 2Sample size totals do not include Greenville. aThe "All classes" columns represent weighted averages of the percentages for the English and math classes. bExcludes observations for Greenville.
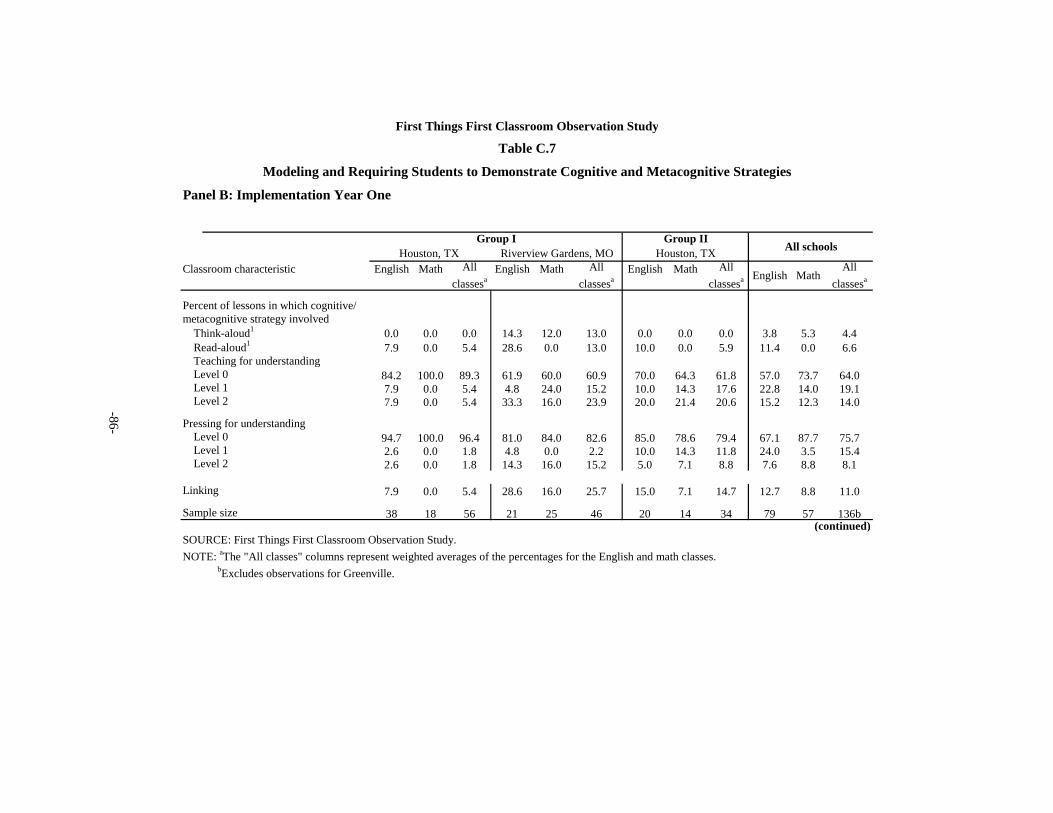
-86-
Panel B: Implementation Year One
Classroom characteristic English Math English Math English Math
Percent of lessons in which cognitive/metacognitive strategy involved
Think-aloud1 0.0 0.0 0.0 14.3 12.0 13.0 0.0 0.0 0.0 3.8 5.3 4.4Read-aloud1 7.9 0.0 5.4 28.6 0.0 13.0 10.0 0.0 5.9 11.4 0.0 6.6Teaching for understandingLevel 0 84.2 100.0 89.3 61.9 60.0 60.9 70.0 64.3 61.8 57.0 73.7 64.0Level 1 7.9 0.0 5.4 4.8 24.0 15.2 10.0 14.3 17.6 22.8 14.0 19.1Level 2 7.9 0.0 5.4 33.3 16.0 23.9 20.0 21.4 20.6 15.2 12.3 14.0
Pressing for understandingLevel 0 94.7 100.0 96.4 81.0 84.0 82.6 85.0 78.6 79.4 67.1 87.7 75.7Level 1 2.6 0.0 1.8 4.8 0.0 2.2 10.0 14.3 11.8 24.0 3.5 15.4Level 2 2.6 0.0 1.8 14.3 16.0 15.2 5.0 7.1 8.8 7.6 8.8 8.1
Linking 7.9 0.0 5.4 28.6 16.0 25.7 15.0 7.1 14.7 12.7 8.8 11.0
Sample size 38 18 56 21 25 46 20 14 34 79 57 136b(continued)
First Things First Classroom Observation Study
Table C.7
Modeling and Requiring Students to Demonstrate Cognitive and Metacognitive Strategies
Houston, TX Riverview Gardens, MO Houston, TXGroup IIGroup I
All schools
All classesa
All classesa
All classesa
All classesa English Math
SOURCE: First Things First Classroom Observation Study.NOTE: aThe "All classes" columns represent weighted averages of the percentages for the English and math classes. bExcludes observations for Greenville.
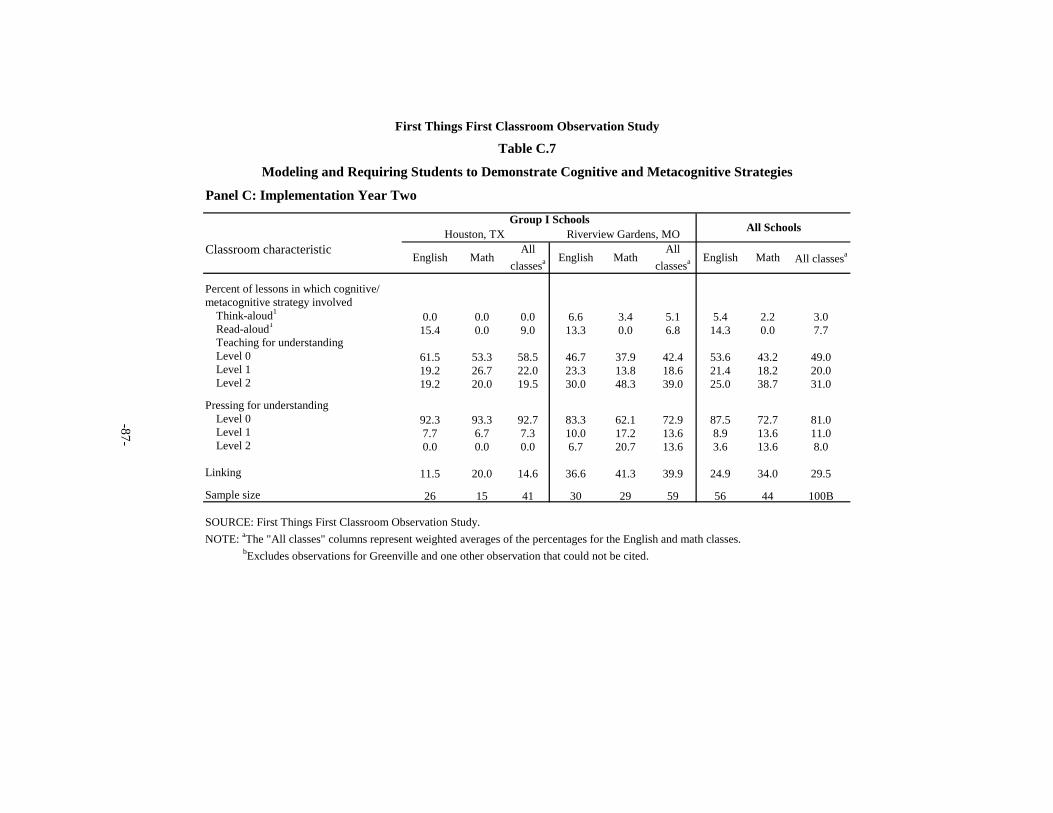
-87-
Panel C: Implementation Year Two
Classroom characteristic
Percent of lessons in which cognitive/metacognitive strategy involved
Think-aloud1 0.0 0.0 0.0 6.6 3.4 5.1 5.4 2.2 3.0Read-aloud1 15.4 0.0 9.0 13.3 0.0 6.8 14.3 0.0 7.7Teaching for understandingLevel 0 61.5 53.3 58.5 46.7 37.9 42.4 53.6 43.2 49.0Level 1 19.2 26.7 22.0 23.3 13.8 18.6 21.4 18.2 20.0Level 2 19.2 20.0 19.5 30.0 48.3 39.0 25.0 38.7 31.0
Pressing for understandingLevel 0 92.3 93.3 92.7 83.3 62.1 72.9 87.5 72.7 81.0Level 1 7.7 6.7 7.3 10.0 17.2 13.6 8.9 13.6 11.0Level 2 0.0 0.0 0.0 6.7 20.7 13.6 3.6 13.6 8.0
Linking 11.5 20.0 14.6 36.6 41.3 39.9 24.9 34.0 29.5
Sample size 26 15 41 30 29 59 56 44 100B
English
First Things First Classroom Observation Study
Table C.7
Modeling and Requiring Students to Demonstrate Cognitive and Metacognitive Strategies
Riverview Gardens, MOHouston, TX
All classesa
All SchoolsGroup I Schools
Math MathAll
classesa EnglishEnglish MathAll
classesa
SOURCE: First Things First Classroom Observation Study.NOTE: aThe "All classes" columns represent weighted averages of the percentages for the English and math classes. bExcludes observations for Greenville and one other observation that could not be cited.

-89-
References
Anderson, L. & Krathwohl, D. 2001 (Eds). A Taxonomy for Learning, Teaching and Assessing: A Revision of Bloom’s Taxonomy of Educational Objectives. New York: Addison Wesley Longman, Inc.
Bereiter, C., & Scardamalia, M. 1998. “Beyond Bloom’s Taxonomy: Rethinking Knowledge for the Knowledge Age.” In A. Hargreaves, A. Lieberman, M. Fullan & D. Hopkins (Eds.), International Handbook of Educational Change (pp. 675-692). London: Kluwer Academic Publishers.
Bloom, B. S. (Ed.), Engelhart, M.D., Furst, E.J., Hill, W.H., & Krathwohl, D.R. 1956. Taxonomy of Educational Objectives: Handbook I: Cognitive Domain. New York: David McKay.
Blumenfeld, Phyllis C. 1992. “The Task and the Teacher: Enhancing Student Thoughtfulness in Science.” Advances in Research on Teaching, (Volume 3, pp. 81-114). Greenwich, CT: JAI Press
Bransford, J. D., Brown, A.L., & Cocking, R. R. 1999. How People Learn: Brain, Mind, Experience and School. Washington, DC: National Academy Press.
Bruner, J. 1990. Acts of Meaning. Cambridge, MA: Harvard University Press.
Carnevale, A. P., Gainer, L. J., & Schultz, E. 1990. Training the Technical Work Force. San Francisco: Jossey-Bass.
Detterman, D.K., & Sternberg, R. J. 1993. Transfer on Trail: Intelligence, Cognition, and Instruction. Norwood, NJ: ABLEX.
Eurich, N. P. 1990. The Learning Industry: Education for Adult Workers. Princeton, NJ: The Carnegie Foundation for the Advancement of Teaching, Princeton University Press.
Good, T. L., and Brophy, J. E. 1974. Changing Teacher and Student Behavior: An Empirical Investigation. Journal of Educational Psychology, 66, 390-405.
Good, T. L., and Brophy, J.E. 2003. Looking in Classrooms. Boston: Allyn and Bacon. Ninth edition.
IRRE. 2000a. First Things First: An Introduction. Philadelphia: IRRE.
IRRE. 2000b. First Things First’s Approach to Improving Instruction. Philadelphia: IRRE.
Jones, B. F., Valdez, G., Nowakowski, J., & Rasmussen, C. 1994. Designing Learning and Technology For Educational Reform. Oak Brook, IL: North Central Regional Educational Laboratory.
Jones, F. V., & Jones, L. S. 1990. Comprehensive Classroom Management: Motivating and Managing Students (3rd ed.). Boston: Allyn and Bacon.
-90-
Lesgold, Alan, Susanne Lajoie, Marilyn Bunzo, & Gary Eggan 1992. SHERLOCK: A Coached Practice Environment for an Electronics Troubleshooting Job. In J. H. Larkin & R. W. Chabay (Eds.), Computer-Assisted Instruction and Intelligent Tutoring Systems. Hillsdale, N.J.: Lawrence Erlbaum Assoc.
Mayer, R. E. 1995. Teaching and Testing For Problem Solving. In L.W. Anderson (Ed.), International Encyclopedia of Teaching And Teacher Education, 2nd ed. (pp. 4728-4731). Oxford, UK: Pergamon.
Mayer, R.E. & Wittrock, M.C. 1996. Problem-Solving Transfer. In D.C. Berliner & R. C. Calfee (Eds.), Handbook of Educational Psychology (pp. 47-62). New York: Macmillan.
McKeough, A., Lupart, J., & Marini, A. (Eds). 1995. Teaching for Transfer. Mahwah, NJ: Erlbaum.
Means, B., Blando, J., Olson, K., Middleton, T., Morocco, C. C., Remz, A. R., & Zorfass, J. 1993. Using Technology to Support Education Reform, Washington, DC: U.S. Government Printing Office.
NCEE [National Center on Education and the Economy]. 1989. To Secure Our Future: The Federal Role in Education. Rochester, NY: Author.
NCEE [National Center on Education and the Economy]. 1990. America’s Choice: High Skills or Low Wages! The Report of the Commission on the Skills of the American Workforce. Rochester, NY: Author.
Pea, R. D. 1991. Augmenting the Discourse Of Learning With Computer-Based Learning Environments. In E. D. Corte, M. C. Linn, H. Mandl, & L. Verschaffel (Eds.), Computer-Based Learning Environments and Problem Solving, (pp. 313-344). New York: Springer-Verlag.
Quint, J. C. 2002. Scaling Up First Things First: Site Selection and the Planning Year. New York: MDRC.
Quint, J.C., Byndloss, D.C., & Melamud, B. 2003. Scaling Up First Things First: Findings from the First Implementation Year. New York: MDRC.
Resnick, L. B., & Klopfer, L. E. 1989. “Toward the Thinking Curriculum: An Overview.” In L. B. Resnick & L. E. Klopfer (Eds.), Toward the Thinking Curriculum: Current Cognitive Research, (pp. 1-18). Alexandria, VA: Association for Supervision and Curriculum Development.
SCANS [The Secretary’s Commission on Necessary Skills] 1991. Skills and Tasks For Jobs: A SCANS Report for American 2000 . Washington, DC: Department of Labor.
Vygotsky, L. S. 1962. Thought and Language. Cambridge, MA: MIT Press.
Vygotsky, L. S. 1978. Mind in Society: The Development of the Higher Psychological Processes. Cambridge, MA: Harvard University Press.
-91-
PUBLICATIONS ON SCALING UP FIRST THINGS FIRST First Things First Findings from the First Implementation Year 2003. Janet C. Quint, D. Crystal Byndloss Scaling Up First Things First Site Selection and the Planning Year 2002. Janet Quint First Things First Creating the Conditions and Capacity for Community-Wide Reform in an Urban School District 2002. Prepared by Gambone & Associates

About MDRC
MDRC is a nonprofit, nonpartisan social policy research organization. We are dedicated to learning what works to improve the well-being of low-income people. Through our research and the active communication of our findings, we seek to enhance the effectiveness of social policies and programs. MDRC was founded in 1974 and is located in New York City and Oakland, California.
MDRC’s current projects focus on welfare and economic security, education, and employment and community initiatives. Complementing our evaluations of a wide range of welfare reforms are new studies of supports for the working poor and emerging analyses of how programs affect children’s development and their families’ well-being. In the field of education, we are testing reforms aimed at improving the performance of public schools, especially in urban areas. Finally, our community projects are using innovative approaches to increase employment in low-income neighborhoods.
Our projects are a mix of demonstrations ― field tests of promising program models ― and evaluations of government and community initiatives, and we employ a wide range of methods to determine a program’s effects, including large-scale studies, surveys, case studies, and ethnographies of individuals and families. We share the findings and lessons from our work ― including best practices for program operators ― with a broad audience within the policy and practitioner community, as well as the general public and the media.
Over the past quarter century, MDRC has worked in almost every state, all of the nation’s largest cities, and Canada. We conduct our projects in partnership with state and local governments, the federal government, public school systems, community organizations, and numerous private philanthropies.