Embed Size (px)
Citation preview

Conducting Research to understand the Voice of the Customer
Conducting Research to understand the Voice of the Customer
Presented by:Prof Adré SchreuderPresented by:Prof Adré Schreuder
In partnership with:
Prof Adré SchreuderCEO: Consulta ResearchProf Adré SchreuderCEO: Consulta Research

Measures will never achieve their metaphysical potential when they
are considered only as “controls” — which is how the subject is
taught in most business schools [and applied in most modern
businesses]. Their real power lies in their ability to inspire and
focus learning.
Slide 2
It is only through measures that organizations can learn,…
only through learning that they can create value in an ever-changing
world, …
and only through creating value that they can survive and prosper.
Peter Senge
Science or Opinion?Science or Opinion?
Extract from a popular Customer Experience Blog –source available on request
Slide 3

Customer Experience – A “deep ecological paradigm” shift(Fritjof Capra – The Web of Life, 1996)
Slide 4

Different Metrics used in Organizations
Vision & goals
Customer relationshipmanagement strategy
Balanced
Vision & goals
Customer relationshipmanagement strategy
Vision & goals
Customer relationshipmanagement strategy
Vision & goals
Customer relationshipmanagement strategy
METRICS• Brand Image• Market Position
• Customer acquisition• Value (share of wallet & loyalty)• Retention• Strength of relationship
• Brand experience dimensions
Slide 5
Adapted from: J Kirkby, J. Wecksell, W. Janowski, T. Berg – March 2003 - The Value of Customer Experience Management
Operational customerexperience management
Contact with thecustomer
Balanced Scorecard
Customer valueproposition metrics
Number of Metrics / Volume of Data
Effectivenessreporting
Actionreporting
Operational customerexperience management
Contact with thecustomer
Operational customerexperience management
• Brand experience dimensions• Key attributes of brand image• Key attributes of product & service• Key service levels• Satisfaction• Complaints
• Individual service levels• Resolution of problems

Gilbert A. Churchill (Professor of Marketing, Unive rsity of Wisconsin-Madison) wrote:
“More stupefying than the sheer number of our measures is
the ease with which they are proposed and the uncriticalthe ease with which they are proposed and the uncritical
manner in which they are accepted. In point of fact, most of
our measures are only measures because someone says they
are, not because they have been shown to satisfy standard
measurement criteria (validity, reliability, and sensitivity).
Slide 6

The Service-Profit Chain
Slide 7
Adapted from : Heskett, Jones, Loveman, Sasser &
Schlesinger (Harvard Business Review, March-April 1994)

Terminology Confusion
Source: Created by Adré Schreuder – reference: < http://www.wordle.net/show/wrdl/1954142/Customer_experience >
Slide 8

CUSTOMER SATISFACTIONCUSTOMER SATISFACTION
A Historic OverviewA Historic Overview
• TQM of Edwards
RelationshipRelationshipQuality EraQuality Era
(1995)(1995)
CRM
CustomerCustomerExperience EraExperience Era
(2003)(2003)
CEM
Service QualityService QualityEra (1984)Era (1984)
SERVQUAL
Product QualityProduct QualityEra (1950’s)Era (1950’s)
TQM
• The Nordic contribution (Grönroos 1984: Technical/Functional • TQM of Edwards Deming - Zero Defect, Six Sigma
• The Nordic contribution (Grönroos 1984: Technical/Functional Model, Lethinen & Lethinen 1988 : Technical, Corporate, Interactive)
• The North American Debate (PZB 1985: SERVQUAL (Gap-based measure, Familiar five quality dimensions, Cronin & Taylor 1992: SERVPERF - Performance only measure, Brown Churchill & Peter 1993: Better/worse than expected scale, Teas 1993: Evaluated Performance Model = gap between perceived performance & ideal amount of feature)• Jagdish Sheth introduced Relationship Management in mid 90’s
• Growth of CRM-systems and popularity• NPS introduced by Reichheld in 2003 – CEM era is born
Slide 9

Customer Experience Customer Experience –– the new “Customer the new “Customer Satisfaction”?Satisfaction”?
• “Yet despite the recognition of the importance of customer
experience by practitioners, the academic marketing literature
investigating this topic has been limited.
• Publications on customer experience are mainly found in
practitioner-oriented journals or management books … tend to
focus more on managerial actions and outcomes…
• The literature in marketing, retailing and service management • The literature in marketing, retailing and service management
historically has NOT considered customer experience as a separate construct. Instead researchers have focused on
measuring customer satisfaction and service quality.”
Source: Verhoef, Peter C., Katherine N. Lemon, A. Parasuraman, Anne Roggeveen, Michael Tsiros and Leonard A. Schlesinger (2009), “Customer Experience Creation: Determinants, Dynamics and Management Strategies,” Journal of Retailing, 85 (1), 31–41.
Slide 10

Customer Experience Customer Experience –– the new “Customer the new “Customer Satisfaction”?Satisfaction”?
• One reason for the apparently weak observed link between satisfaction and future behaviour may lie in the role of emotions
• Previously studies emphasised cognitive aspects of satisfaction –growing body of evidence that affective measures of satisfaction (which incorporate emotions) may be a better predictor of behaviour
• As a cognitive measure, satisfaction is more likely to be distorted • As a cognitive measure, satisfaction is more likely to be distorted over time than a measure that incorporates an affective component (emotions are more deep-seated & more stable over time)
• Satisfaction should thus include a combination of an evaluative (cognitive) and emotion-based (affective) response to a service encounter
Source: Koenig-Lewis, N. and Palmer, A. "Experiential values over time – a comparison of measures of satisfaction and emotion," Journal of Marketing Management (24:1-2), 2008, pp. 69-85.
Slide 11

Putting Customer Experience in Perspective
Slide 12

Putting Putting Customer Experience Customer Experience into into PerspectivePerspective• The term Customer Experience Management is used within the broader context of Customer Relationship Management (CRM) –clearly seen in the view of Kirkby, Wecksell & Janowski (2003) when they say: “CEM is part
of customer relationship management (CRM)
and the natural extension of building brand and the natural extension of building brand
awareness.
• Where brand gives the promise, CEM is the
physical delivery of that promise and is vital
in an economy where a brand is increasingly
built on value delivered rather than product
features”.
Illustration Copyright – Consulta 2010
Slide 13

Construct definition of “Customer Construct definition of “Customer Experience”Experience”
• The customer experience construct is holistic in nature andinvolves the customer’s cognitive, affective, emotional, social andphysical responses to the retailer.
• This experience is created by:
– controllable elements - service interface, retail atmosphere,assortment, price,
– uncontrollable elements - influence of others, purpose of shopping– uncontrollable elements - influence of others, purpose of shopping
• Customer experience encompasses the total experience, includingthe search, purchase, consumption, and after-sale phases of theexperience, and may involve multiple retail channels.
Source: Verhoef, Peter C., Katherine N. Lemon, A. Parasuraman, Anne Roggeveen, Michael Tsiros and Leonard A. Schlesinger (2009), “Customer Experience Creation: Determinants, Dynamics and Management Strategies,” Journal of
Retailing, 85 (1), 31–41.
Slide 14

Customer Experience Management
Your Company (Pty) Ltd
Slide 15

Key Drivers of Loyalty
Slide 16

Outcomes of Improved Customer Experience
Outcomes of Customer Experience
Customer-Related Outcomes
Efficiency-Related Outcomes
Employee-Related Outcomes
Overall Performance-Related Outcomes
Behavioral Intentions
Slide 17
Customer Behaviours
Customer Commitment
Repurchase Intentions
Price Perceptions & Willingness to pay
Customer Loyalty & Repurchase Behaviour
Word-of-Mouth & Complaining Behaviour
Financial Performance
Nonfinancial Performance
Source: Luo, X & Homburg, C. April 2007 Neglected Outcomes of Customer Satisfaction. Journal of Marketing, Vol 71, Apr 2007 (0 133-149)
Behavioral Intentions are determined by how the drivers of Customer Satisfaction are managed <by implication measured>
– this is the essence of Customer Experience Management
Customer Defection

Index = 1
Relative Search Index Jan 2004 – Aug 2010
High interest up to 2005, stabilising trend since 2008 & still growing in South Africa (4th in regional index)!
Normalised Trend data (average of period = 1), Trend line = Polynomial
Slide 18
Index = 1
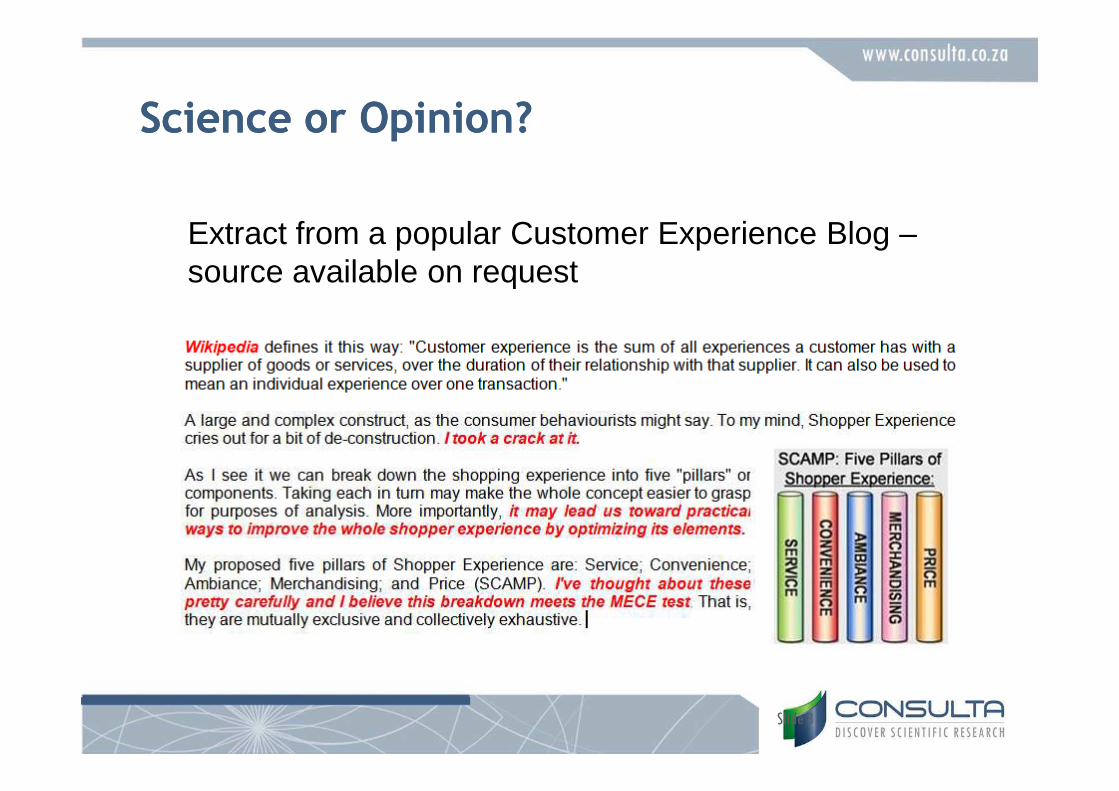
Relative Search Index Jan 2004 – Aug 2010
Sharp growth since 2004 & still growing & South Africa shows high interest (4th in regional index)!
Normalised Trend data (average of period = 1), Trend line = Polynomial
Slide 19
Index = 1
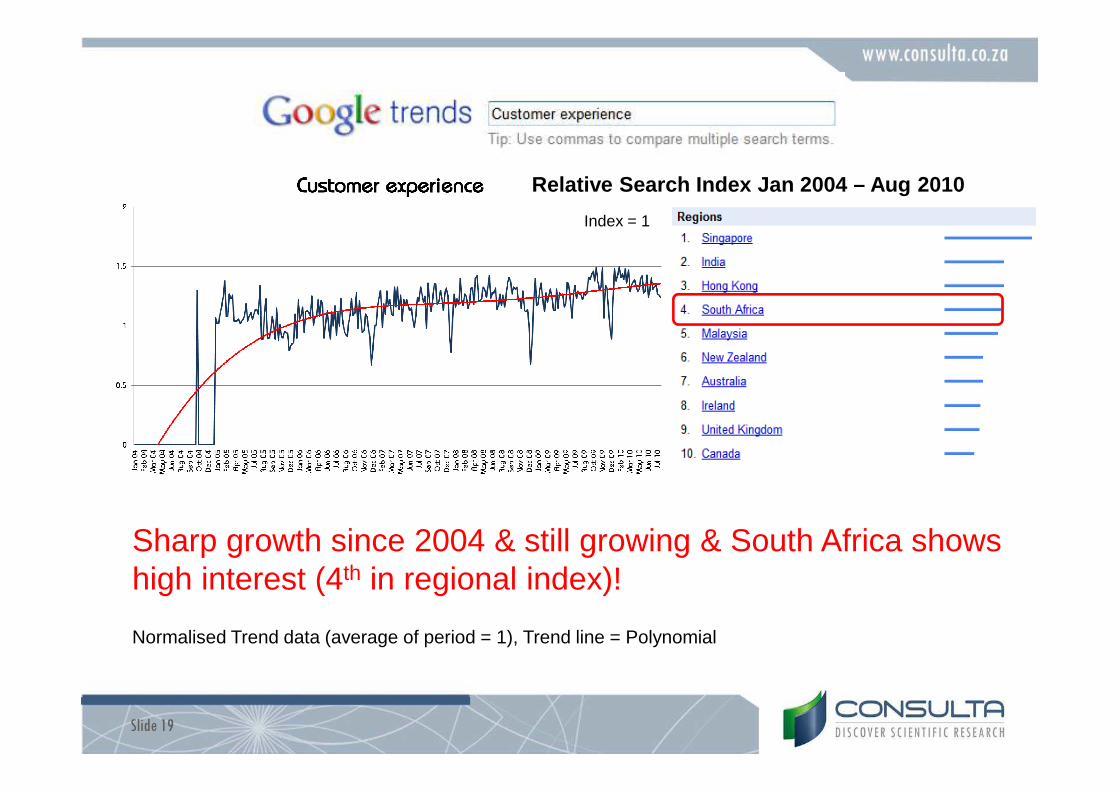
Relative Search Index Jan 2004 – Aug 2010
Normalised Trend data (average of period = 1), Trend line = Polynomial
Steady decline till 2007, since then stabilising trend! South Africa still shows high interst (6th in regional index)
Slide 20

Index = 1
Relative Search Index Jan 2004 – Aug 2010
Normalised Trend data (average of period = 1), Trend line = Polynomial
Steady interest since 2004, but little interest in South Africa!
Slide 21

The NPS ControversyThe NPS Controversy
• Net Promoter Score Question: Likelihood to recommend on scale 0 to 10 likelihood
• “How likely would you be to recommend ‘Company X’ to friends, colleagues and associates?”
0 1 2 3 4 5 6 7 8 9 10
Not likely at all Extremely likely
Detractor PromoterPassively
Satisfied
Net Promoter Score (NPS) = Promoters - Detractors
Slide 22

Net Promoter Score Net Promoter Score –– single net measuresingle net measure
� NPS adopted by executives:� Swift to survey� Simple to understand and communicate� Top-of-house dashboard metric
� Reichheld (2003): NPS is a more
PositiveNegative
� Little scientific research linkingrecommend intentions to actualintentions2
� Morgan and Rego (2006) assessed sixdifferent metrics over a seven yearReichheld (2003): NPS is a more
accurate predictor of sales growththan the elaborate AmericanConsumer Satisfaction Index1
� General Electrics CEO: “This is the
best customer satisfaction metric I’ve
seen”
1Reichheld, F. (2003). The One Number You Need to Grow. Harvard Business Review, Dec 20032Keiningham, T. et al. (2007). The value of different customer satisfaction and loyalty metrics in predicting customer retention, recommendation, and share-of-wallet,
Managing Service Quality 17(4), 361-384.3Morgan, N. & Rego, L. (2006). The Value of Different Customer Satisfaction and Loyalty Metrics in Predicting Business Performance. Marketing Science 25(5), Sep –
Oct.
different metrics over a seven yearperiod and found: “…recentprescriptions to focus customerfeedback systems & metrics solely oncustomers’ recommendation intentionsand behaviours are misguided”3
Slide 23

Adoption of NPSAdoption of NPS
46%
Source : Temkin Group May 2010 Survey (142 US companies with $500+ million annual revenue)
Slide 24

Popularity of Terms Popularity of Terms –– Trends since 2004Trends since 2004
Polynomial Trend – Normalised Trend data (average of period = 1)
Slide 25

Relative Popularity of TermsRelative Popularity of Terms
NPS = 8.1x
Customer Satisfaction= 5xSatisfaction= 5x
Service Quality = 4.8x
Customer Experience = 1
Customer Loyalty = 1.2
Slide 26

Relative Popularity of Relative Popularity of Terms Terms (last 12 months)(last 12 months)
NPS = 6.1xCustomer Customer
Satisfaction= 2.8x
Service Quality = 2.8x
Customer Experience = 1
Customer Loyalty = 0.75x
Slide 27

Intangible experience = Not measurable?Intangible experience = Not measurable?
Photo by Flickr user Memotions, licensed under Creative Commons, Attribution 2.0 Generic
Copyright – Consulta 2010
Slide 28

The GAP never mentioned …The GAP never mentioned …
Slide 29

Effort Score Effort Score –– worth the effort?worth the effort?P
redi
ctiv
eP
ower
* of
Rep
urch
ase
High
Research conducted by Customer Contact Council of t he Corporate Executive Board
NPS®Council Conclusion“Inadequate measure” in theservice channel:• Question inherently positive
(only likelihood to recommend –not criticize)
EffortEffortCouncil Conclusion
Better suited for service channel. Better financial predictor & best indicator of loyalty
Comments :• Directly contrasting scientific
proof of ACSI (American), SCSI (Sweden)
• No scientific foundation• Irresponsible to “recommend”
members against• Effort-score purely developed in
Pre
dict
ive
Pow
er*
ofR
epur
chas
e
Low
Low HighPredictive Power* for Increased Spend
Power* - Linear regression coefficients regressed ag ainst Likelihood to Repurchase & Increase Spend
not criticize)• Captures company-level
sentiment (incl brand, product, pricing)
CSAT Council ConclusionPopular, widely used BUT “notsufficient in predicting financialoutcomes … de-emphasize itsuse in strategic decisions”
• Effort-score purely developed in Contact centre environment
• No published proof of scientific reliability & validity
• Scale is reverse scored – South African research shows low reliability & poor predictive properties to the contrary
Slide 30
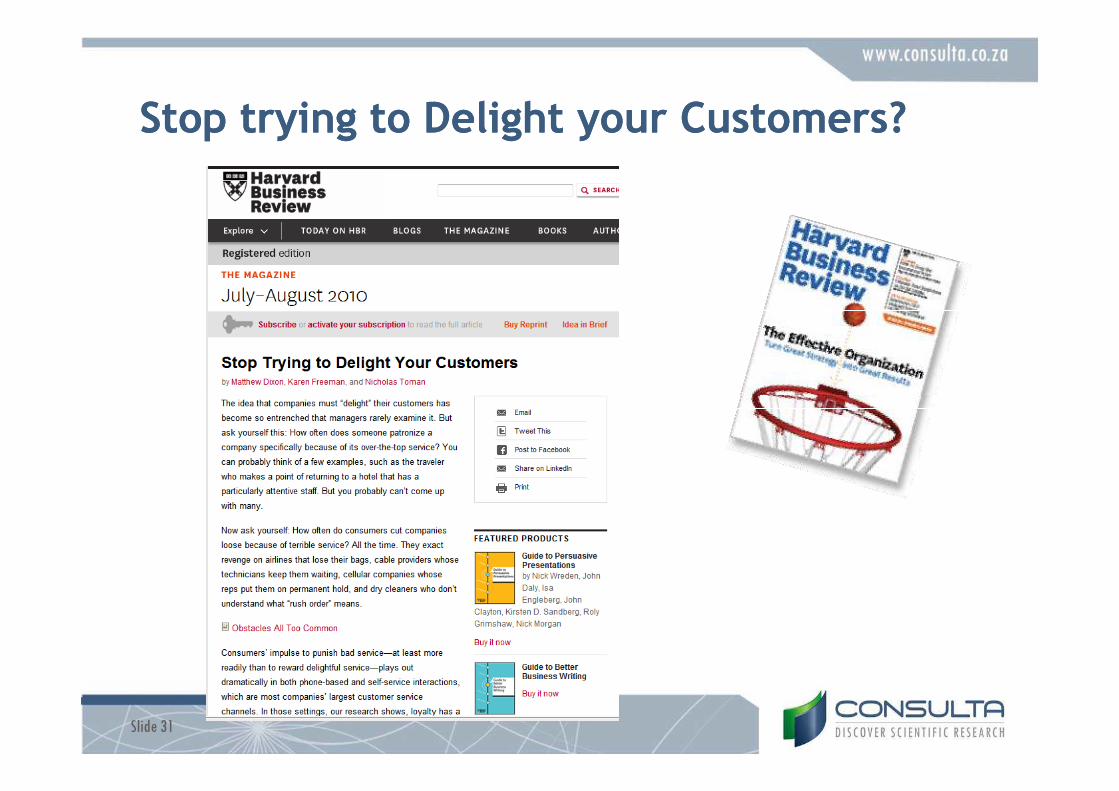
Stop trying to Delight your Customers?Stop trying to Delight your Customers?
Slide 31

ERICERIC™™ –– Empathy Rating IndexEmpathy Rating Index
• The ERIC instrument consists of 29 empathy questions measuredon a 10-point rating scale and 11 call process questions that arerelated to how the calls are processed
• The trained researchers (mystery callers) then make 40unscripted(?) calls over three weeks to each company andcomplete an online questionnaire
• The study sample was limited to 28 companies in which ROCE and
Source : Lywood, J., Stone, M. and Ekinci, Y. "Customer experience and profitability: An application of the empathy rating index (ERIC) in UK call centres," Journal of Database Marketing & Customer Strategy Management (16), 2009, pp. 207-214. & Lywood, J., Stone, M. and Hackett, D. Eric Methodology Whitepaper 2005 < http://www.empathy.co.uk/ >
• The study sample was limited to 28 companies in which ROCE and ERIC ratings were both available.
Slide 32

ERIC ERIC –– Testing the claimsTesting the claims
Comments : • No proven scientific grounding• Non rated Journal, 6 rated references
used• Questionable statistics & sample• No longitudinal data or reference to time• Methodology basically mystery caller• Psychometric properties of scale – no
scientific grounding
Claimed at 2008 CS Conference:“At Last –a proven link between a service
related measure and profitability”
scientific grounding• Mixed construct in scale (15 constructs
across 33 statements• Of 5 attributes only one (Empathy) is
an interval scale, all other “Yes/no” or numerical (number of calls)
• Claimed at 2008 CS Conference = False claim
Source : Lywood, J., Stone, M. and Ekinci, Y. "Customer experience and profitability: An application of the empathy rating index (ERIC) in UK call centres," Journal of Database Marketing & Customer Strategy Management (16), 2009, pp. 207-214. & Lywood, J., Stone, M. and Hackett, D. Eric Methodology Whitepaper 2005 < http://www.empathy.co.uk/ >
Slide 33
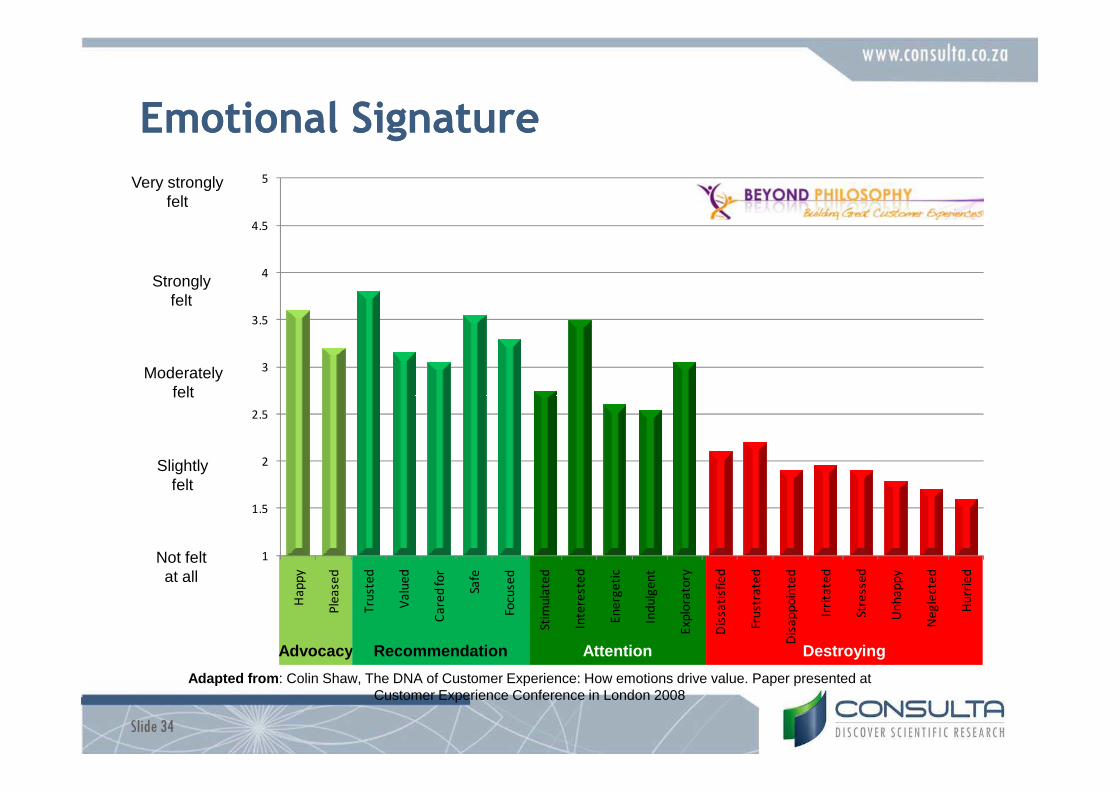
Emotional SignatureEmotional Signature
3
3.5
4
4.5
5Very stronglyfelt
Stronglyfelt
Moderatelyfelt
Advocacy Recommendation Attention Destroying
Adapted from : Colin Shaw, The DNA of Customer Experience: How emotions drive value. Paper presented at Customer Experience Conference in London 2008
1
1.5
2
2.5
Ha
pp
y
Ple
ase
d
Tru
ste
d
Va
lue
d
Ca
red
for
Safe
Focu
sed
Stim
ula
ted
Inte
rest
ed
En
erg
eti
c
Ind
ulg
en
t
Exp
lora
tory
Dis
sati
sfie
d
Fru
stra
ted
Dis
ap
po
inte
d
Irri
tate
d
Stre
sse
d
Un
ha
pp
y
Ne
gle
cte
d
Hu
rrie
d
felt
Slightlyfelt
Not feltat all
Slide 34

GG--CEM Emotion CurveCEM Emotion Curve
PositiveFeeling
Gratify
Satisfy
1
3
4
6
7
8
9
1013
14
20
Peak-end Analysis
Neutral
Bad
Horrible
NegativeFeeling
2
511
12
15
16
17
18
19
Pleasure-Pain GapAnchoring
Adapted from : Sampson Lee – G-CEM, Effective Experience Framework 2.0, 2010 Whitepaper
Slide 35

Using the PeakUsing the Peak--end rule in CEend rule in CE--measurementmeasurement
• Subjects' retrospective evaluations (remembering self) of both pleasant and unpleasant experiences were well-explained by a peak/end rule. A simple average of the quality of the experience at its most extreme moment and at its end predicted retrospective evaluations with substantial accuracy.substantial accuracy.
• IMPLICATION: Minimize the difference between the Point of Best Experience (PoBx) & the Point of End Experience (PoEx)
Source : Daniel Kahneman and Richard H. Thaler, “Anomalies: Utility Maximization and Experienced Utility”, The Journal of Economic Perspectives, Vol. 20, No. 1 (Winter, 2006), pp. 221-234
Slide 36
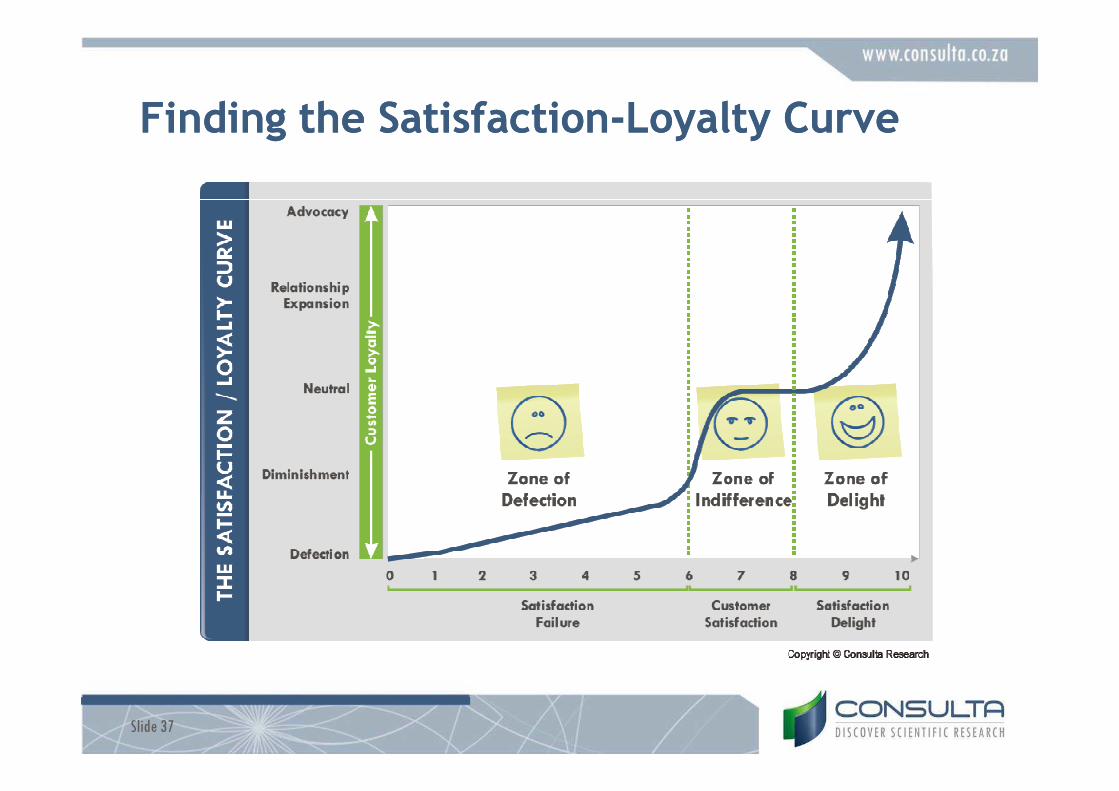
Finding the SatisfactionFinding the Satisfaction--Loyalty CurveLoyalty Curve
Slide 37

The The Zone of Delight Zone of Delight ––the the “impossible”“impossible”--zone?zone?
40.0%
50.0%
60.0%
70.0%
Zone ofDelight
Zone ofIndifference
Zone ofDefection
Perc
enta
ge o
f Pro
mote
rs (9/1
0 recom
mend)
0.0%
10.0%
20.0%
30.0%
0 10 20 30 40 50 60 70 80 90 100
Very Poor Excellent
Perc
enta
ge o
f Pro
mote
rs (9/1
0 recom
mend)
Satisfaction scores
Slide 38

Finding the SatisfactionFinding the Satisfaction--Loyalty CurveLoyalty Curve
50.0%
60.0%
70.0%
80.0%
90.0%
0.0%
10.0%
20.0%
30.0%
40.0%
50.0%
0 10 20 30 40 50 60 70 80 90 100
Very Poor Excellent
Slide 39

The Consulta Customer Experience Measurement Solution
Slide 40
Solution
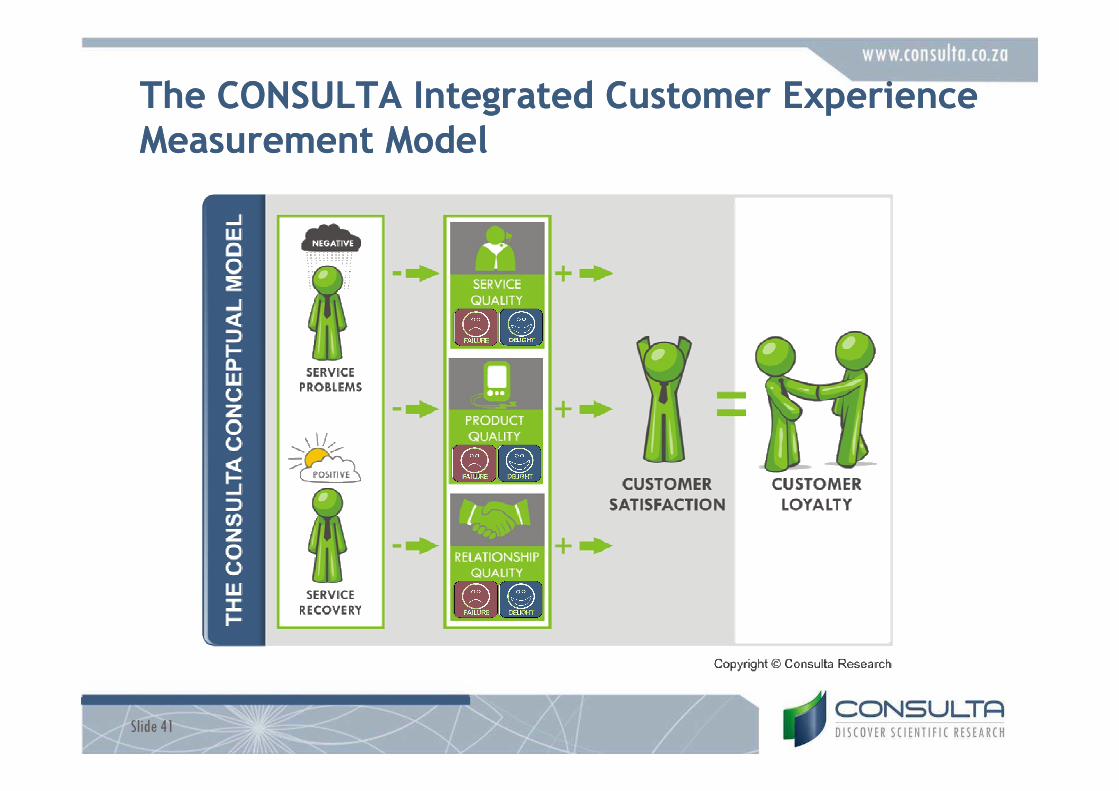
The CONSULTA The CONSULTA Integrated Customer Experience Integrated Customer Experience Measurement ModelMeasurement Model
Slide 41

The Conceptual Model FlowThe Conceptual Model Flow
Copyright © Consulta Research - 2010
Slide 42

Principle Calculation of Principle Calculation of Modeled Modeled ScoresScores
FAILUREFAILUREDELIGHTDELIGHT
Slide 43

The Disconfirmation Scale used by Consulta Research
To measure attributes of Customer Satisfaction:
vs
0 1 2 3 4 5 6 7 8 9 10
Much worse than expected
Much better than expected
Slide 44
vs
ServiceFailure
ServiceDelight
0 1 2 3 4 5 6 7 8 9 10
Very Poor Excellent

Use an EnterpriseUse an Enterprise--wide Model wide Model –– A Retail Banking A Retail Banking exampleexample
Slide 45

Standardised Customization through A Common Architecture
Slide 46

Example of Findings
Buzz Barometer: Recommend Channel 26.6%Service Problems
16.6%
National for 2008 2009Sample(n) = 367
Failure
Delight
51.2%
48.8%
Delight
SERVICE QUALITY MEASURE
SERVICE QUALITY INDEX
VOICE-OF-CUSTOMER INDEX
Slide 47Slide 47
77.345
Buzz Barometer: Recommend ABC based on Channel
16.3%
Buzz Barometer: Recommend ABC 8.9%
56.3
5616.6%
13.8%
Problem Recovery
5.9%
Failure
Failure
Delight
6.1%
47.5%
7.1%
Failure
RELATIONSHIP QUALITY INDEX

Slide 48

Implementation
Slide 49

Slide 50

Customer Experience Management
Then & Now…
The Future …
Copyright Consulta - 2010Slide 51

Slide 52

CEMJM Level Explanations
•Customer experience is part of the DNA of the company, and maintained throughout
•Customer experience is one of the core tenets of strategy & integrated across all levels
•Customer experience is critical and executives become actively involvedbecome actively involved
•Customer experience is very important and formalised programs are developed/implemented
•Customer experience is seen as important early levels of buy-in are achieved
•Basic level of interest & awareness but understanding of customer experience is weak
Slide 53

Unconvinced but
interested
Formalised& converted
Dedicated& reinventing
Entrenched& Empowered
Engaged & Sustained
Getting involved & buy-in
Change the CE-Horizon to a Journey
Copyright © Consulta - 2010
Slide 54

CEMJM US BenchmarkCEMJM US Benchmark
Source:• 2007: Forrester’s Q4 2007 Customer Experience Peer Research Panel Survey (287 CE decision-makers
from US firms with annual revenues of $500+ million) • 2009: Temkin Group May 2010 Survey (142 US companies with $500+ million annual revenue)
Slide 55

The South African CE Benchmark 2010Benchmark
Figures: May
2010
Consulta
Conference:
August 2010
Score Intervals Level Classification 161
50 and less Level 1 Level 1: Unconvinced but interested 33% 71%
Between 51 and 60 Level 2 Level 2: Getting involved and buy-in 25% 19%
Between 61 and 70 Level 3 Level 3: Formalised and converted 16% 7%
Between 71 and 80 Level 4 Level 4: Dedicated and reinventing 11% 2%
Between 81 and 90 Level 5 Level 5: Entrenched and empowered 13% 1%
Slide 56
Between 81 and 90 Level 5 Level 5: Entrenched and empowered 13% 1%
Between 91 and 100 Level 6 Level 6: Engaged and sustained 3% 0%

The South African CE Benchmark 2010
Slide 57

+ -
Experience-Design Ave
Implementation-Planning St
Concept & Pilot St
Launch St
Map the Implementation Journey
Mobilizing-the-Effort St
Customer-Insight Rd
Desired-State Ave
Design Ave
Slide 58
Copyright Consulta - 2010

ExecutiveStakeholders
ExecutiveSponsor
ProjectTeam
SupportFunctions
Movingbeyond
platitude
Movingbeyond
platitude
Knowing where to
start
Knowing where to
start
Coming to terms with the “Truth”
Coming to terms with the “Truth”
Painting the
“Surface” vs
“Changing-the-Core”
Painting the
“Surface” vs
“Changing-the-Core”
Difficult structuraltradeoffs
Difficult structuraltradeoffs
Prematurely declaring victory
Prematurely declaring victory
Establishing ongoing
Customer Experience
Measurement & Management
Establishing ongoing
Customer Experience
Measurement & Management
Prioritizing experience moments
Prioritizing experience moments
Ideal experience-we-can’t
implement
Ideal experience-we-can’t
implement
Moving from Good to Great designs
Moving from Good to Great designs
Differentiation vs “More-of-the-
same”
Differentiation vs “More-of-the-
same”
Customer vsCompany
Orientation
Customer vsCompany
Orientation
Understanding the journey
Understanding the journey
Structuring & planning the
effort
Structuring & planning the
effort
The experiencemapping swampThe experiencemapping swamp
Searching forSearching for
Be careful of “Roadblocks” & “Potholes”
SupportFunctions(Mktg, Fin, IT, HR)
Regional/LineManagement
FrontlineStaff
Mobilizing-the-
Effort
Customer-Insight
Desired-State
Experience-Design
(Strategy)
Implemen-tation-
Planning
Concept & Pilot
Launch
startstart to Great designsto Great designs
Avoiding non-economic
improvements
Avoiding non-economic
improvements
Changing partner expectations & relationships
Changing partner expectations & relationships
Defining staff experience
changes
Defining staff experience
changesShifting
organizationalbehaviour
Shifting organizational
behaviour
Surfacing unwritten rule
barriers
Surfacing unwritten rule
barriers
We know what the customer
wants
We know what the customer
wants
Surfacing deeper
customer understanding
Surfacing deeper
customer understanding
Searching for“quick fixes”Searching for“quick fixes”
Productively engaging the BU & Partners
Productively engaging the BU & Partners
Slide 59Adapted from: Frank Capek – Overcoming Customer Experience Program Stress Points –http://customerinnovations.wordpress.com/ Posted on August 4, 2009 by Frank Capek
The not-so-far future …?
Slide 60