Embed Size (px)
Citation preview

Int. J. Electrochem. Sci., 13 (2018) 3185 – 3199, doi: 10.20964/2018.04.25
International Journal of
ELECTROCHEMICAL SCIENCE
www.electrochemsci.org
Conductivity and Electrical Properties of Chitosan -
Methylcellulose Blend Biopolymer Electrolyte Incorporated
with Lithium Tetrafluoroborate
Yahya A.K. Salman
1, Omed Gh. Abdullah
2,3,*, Rawad R. Hanna
1, Shujahadeen B. Aziz
2,3
1 Department of Physics, College of Science, University of Mosul, 41002, Mosul, Iraq.
2 Advanced Polymeric Materials Research Lab., Department of Physics, College of Science,
University of Sulaimani, 46001, Kurdistan Region, Iraq. 3 Komar Research Center, Komar University of Science and Technology, 46001, Sulaimani, Kurdistan
Region, Iraq. *E-mail: [email protected]
Received: 29 November 2017 / Accepted: 28 January 2018 / Published: 6 March 2018
This work focuses on the structural and electrical properties of solid biopolymer blend electrolytes
based on chitosan and methylcellulose incorporated with lithium tetrafluoroborate (LiBF4). The
polymer electrolyte films were prepared by solution casting technique. The polymer blend comprised
of 75 wt.% chitosan and 25 wt.% methylcellulose, the most amorphous blend composition are used as
the host matrix. Fourier transform infrared (FT-IR) spectroscopy analysis demonstrated the
interactions between biopolymer blend and LiBF4. The highest value of electrical conductivity at
ambient temperature 3.74×10⁻⁶
S cm−1
was obtained for the sample containing 40 wt.% LiBF4. All
electrolyte samples were found to obey the Arrhenius rule. The magnitude of activation energy
decreases with increasing electrical conductivity and vice-versa. Rice and Roth model was applied to
analyze the electrical conductivity enhancement. The temperature dependence of the frequency
exponent (s) shows that the conduction mechanism depends on the salt concentration, the appropriate
model for low concentration was found to be correlated barrier hopping (CBH) model, while for high
salt concentration samples follow the non-overlapping small polaron tunneling (NSPT) model.
Keywords: polymer electrolyte; lithium tetrafluoroborate; conductivity; FTIR; conduction mechanism
1. INTRODUCTION
Different solid polymer electrolyte systems have been intensively studied owing to their
potential application in electrical energy-storage devices that require flexible thin-film with high
performance, such as solar cells, solid-state rechargeable batteries, fuel cells and electrochemical
double-layer capacitors [1,2]. In contrast to conventional organic liquid electrolytes, solid polymer
Int. J. Electrochem. Sci., Vol. 13, 2018
3186
electrolytes possess particular essential properties such as ease and low-cost fabrication, excellent
electrochemical stability, safety, cyclability, good shelf life and processability [3].
Natural biopolymers such as chitosan and methylcellulose have attracted significant
consideration in recent works due to their advantages, such as water-soluble, biodegradable,
biocompatible, non-toxic, abundance and excellent film-forming properties [4,5].
Much effort has been harnessed to produce solid polymer electrolyte films based on chitosan,
methylcellulose and their blend [6,7]. Chitosan is a linear polysaccharide composed of randomly
distributed β-(1→4)-linked D-glucosamine and N-acetyl-D-glucosamine units which can be prepared
by deacetylation of chitin [8,9]. Chitosan has a large number of functional groups including hydroxyl
group, acetamido group, and amino group that can act as electron donors [10]. Methylcellulose is a
polysaccharide that consists of β-(1→4) glucosidic units with methyl substituent in linear chains. It can
be prepared from the reaction of alkali-cellulose with dimethyl sulfate or methyl chloride [11].
The combination of salt and polymers is an important technique to provide ions as the charge
carriers. Different lithium salts such as lithium perchlorate (LiClO4) [12], lithium hexafluorophosphate
(LiPF6) [13], and lithium triflate (LiCF3SO3) [14] are commonly used to prepare solid polymer
electrolytes due to the fact that lithium-ion is the lightest of all metals, has the greatest electrochemical
potential, and could provide the largest energy content [15]. Ulaganathan and Rajendran [16] used
different lithium salts (LiBF4, LiClO4, and LiCF3SO3) to prepare polymer electrolyte based on
poly(vinyl acetate) (PVAc), and poly(vinylidene fluorideco-hexafluoropropylene) (PVdF-co-HFP) as a
host matrix. They reported that the LiBF4 salt exhibits higher conductivity due to the lowest lattice
energy compared to other lithium salts. Sudhakar and Selvakumar [12] reported the high room-
temperature electrical conductivity of 1.20×10⁻⁷
S cm−1
for a starch-chitosan blend biopolymer
electrolyte films incorporated with lithium perchlorate (LiClO4). A plasticized biopolymer electrolyte
based on a methylcellulose-chitosan blend incorporated with NH4NO3-EC gives the highest electrical
conductivity of 2.16×10⁻⁴
S cm−1
at ambient temperature, as reported by Zazuli and Khiar [17].
To the best of the author's knowledge, there are no systematic studies on lithium solid
biopolymer electrolytes based on a chitosan-methylcellulose blend. In our previous work [18] it has
been shown that the blend comprising 75 wt.% chitosan and 25 wt.% methylcellulose served as a
perfect host matrix for conduction due to its more amorphous nature compared to other compositions.
This work aimed to develop lithium ion conducting biopolymer electrolyte films based on chitosan-
methylcellulose blend incorporated with different amounts of lithium tetrafluoroborate (LiBF4). The
samples will then be characterized by X-ray diffraction (XRD), Fourier transform infrared (FTIR)
spectroscopy, Scanning electron microscopy (SEM), and impedance spectroscopy (EIS) to study the
impact of salt concentration on the ionic conductivity, as well as the conduction mechanism.
2. EXPERIMENTAL METHODS
2.1 Preparation of pure chitosan-methylcellulose blend film
The pure polymer blend sample based on chitosan-methylcellulose in the ratio of 75:25 was
prepared by dissolving 1.5 gm of chitosan powder in 150 ml of 2% acetic acid, and 0.5 gm of
methylcellulose in 20 ml distilled water separately, at ambient temperature. The two solutions were
Int. J. Electrochem. Sci., Vol. 13, 2018
3187
stirred continuously using a magnetic stirrer for two days, until the powders are completely dissolved,
to obtain clear viscose solutions. Then, these two solutions were mixed under continuous stirring until
homogeneous viscous solution was obtained, the obtained solution was cast onto plastic Petri dish and
allowed to dry at room temperature. The film was kept in a desiccator with silica-gel desiccant for the
further drying process.
2.2. Preparation of solid polymer electrolyte films
Polymer blend electrolyte films were prepared by adding different amounts of LiBF4 (5, to 50
wt.% with step of 5 wt.%) into the solution of chitosan-methylcellulose in the ratio 75:25. The solution
was stirred until it became homogeneous. The obtained homogeneous solutions were cast onto
different plastic Petri dishes and left for drying process at room temperature to form a film. The dried
films were peeled and kept in a desiccator filled with silica gel desiccants for further drying. The
average thicknesses of the prepared films were between 135 and 237 μm.
2.3. Solid polymer electrolytes characterization
X-ray diffraction (XRD) measurements of the solid polymer blend electrolytes were performed
using X-ray diffractometer (X'PERT-PRO) where Cu Kα source generated X-rays with wavelengths,
λ=1.5406 Å. The glancing angle (2θ) was varied from 10° to 70° with a step size of 0.1°.
The FTIR studies were carried out using Frontier Perkin-Elmer spectrometer in the
wavenumber range of 4000-400 cm−1
with the minimum resolution of 1 cm−1
. The objective of FTIR
was to confirm complex formation between the blend polymer and the lithium salt.
The surface morphology of the solid polymer electrolyte films was examined by scanning
electron microscope (Tescan Vega 3) at 5000× magnification. The polymer sample was sputtered with
gold using a sputter-coater unite (Emitech K550X) for 3 min at 25 mA.
The electrical conductivity of the samples was measured using the Precision LCR Meter
(Agilent/HP 4284 A) at a frequency range of 100 Hz - 1 MHz, and over the temperature range from
295K to 363 K. The polymer electrolyte films were sandwiched between two aluminium electrodes
with a diameter of 250 mm, and the measurements were carried out in the conduction mode. The
sample temperature has been monitored using a T-type thermocouple with an accuracy of ±1 °C. The
ac conductivity )( ac was calculated from the measured value of conductivity )(G using:
AGdac /)( , where d is the thickness of the prepared film, and A is the electrode-specimen
contact cross-sectional area.
3. RESULTS AND DISCUSSION
3.1. XRD analysis
From the X-ray diffraction pattern of the chitosan-methylcellulose blend film in figure 1-a, a
semicrystalline diffraction peak appears at 2θ = 21.1°, which is comparable with the chitosan peak (2θ
= 20.0°) obtained by Hasegawa et al. [19]. This semicrystalline peak results from the strong
Int. J. Electrochem. Sci., Vol. 13, 2018
3188
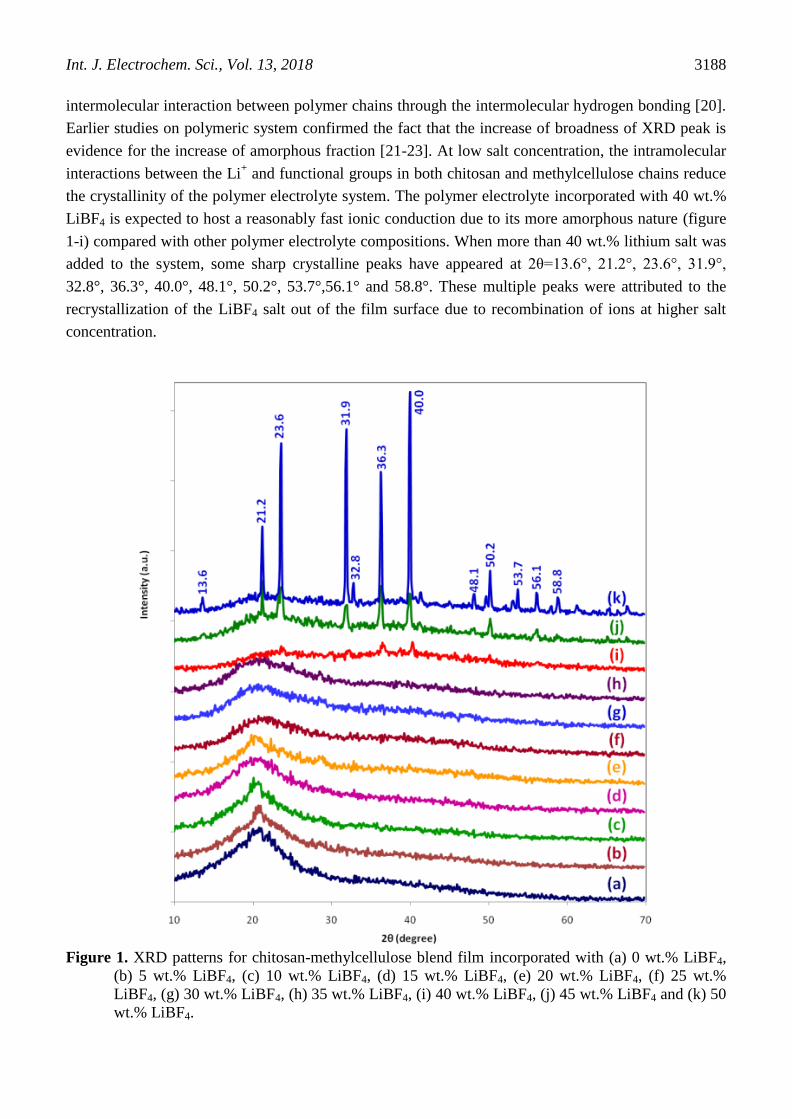
intermolecular interaction between polymer chains through the intermolecular hydrogen bonding [20].
Earlier studies on polymeric system confirmed the fact that the increase of broadness of XRD peak is
evidence for the increase of amorphous fraction [21-23]. At low salt concentration, the intramolecular
interactions between the Li+ and functional groups in both chitosan and methylcellulose chains reduce
the crystallinity of the polymer electrolyte system. The polymer electrolyte incorporated with 40 wt.%
LiBF4 is expected to host a reasonably fast ionic conduction due to its more amorphous nature (figure
1-i) compared with other polymer electrolyte compositions. When more than 40 wt.% lithium salt was
added to the system, some sharp crystalline peaks have appeared at 2θ=13.6°, 21.2°, 23.6°, 31.9°,
32.8°, 36.3°, 40.0°, 48.1°, 50.2°, 53.7°,56.1° and 58.8°. These multiple peaks were attributed to the
recrystallization of the LiBF4 salt out of the film surface due to recombination of ions at higher salt
concentration.
Figure 1. XRD patterns for chitosan-methylcellulose blend film incorporated with (a) 0 wt.% LiBF4,
(b) 5 wt.% LiBF4, (c) 10 wt.% LiBF4, (d) 15 wt.% LiBF4, (e) 20 wt.% LiBF4, (f) 25 wt.%
LiBF4, (g) 30 wt.% LiBF4, (h) 35 wt.% LiBF4, (i) 40 wt.% LiBF4, (j) 45 wt.% LiBF4 and (k) 50
wt.% LiBF4.
Int. J. Electrochem. Sci., Vol. 13, 2018
3189
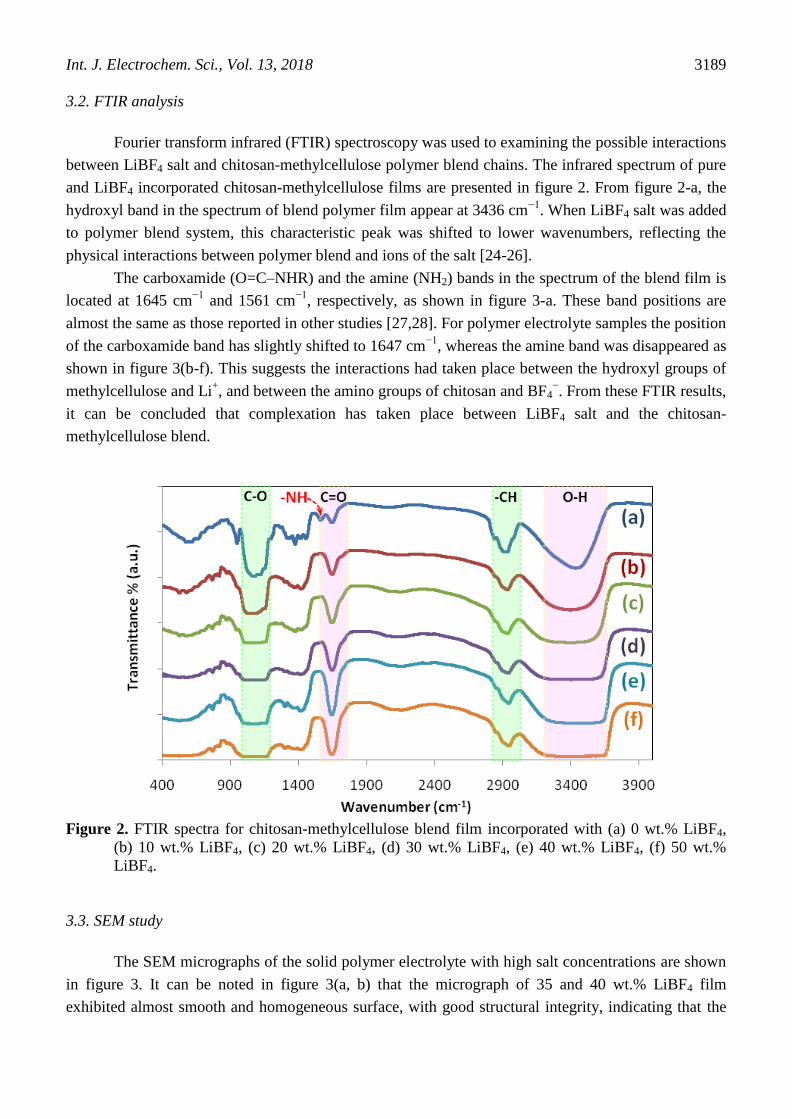
3.2. FTIR analysis
Fourier transform infrared (FTIR) spectroscopy was used to examining the possible interactions
between LiBF4 salt and chitosan-methylcellulose polymer blend chains. The infrared spectrum of pure
and LiBF4 incorporated chitosan-methylcellulose films are presented in figure 2. From figure 2-a, the
hydroxyl band in the spectrum of blend polymer film appear at 3436 cm−1
. When LiBF4 salt was added
to polymer blend system, this characteristic peak was shifted to lower wavenumbers, reflecting the
physical interactions between polymer blend and ions of the salt [24-26].
The carboxamide (O=C–NHR) and the amine (NH2) bands in the spectrum of the blend film is
located at 1645 cm−1
and 1561 cm−1
, respectively, as shown in figure 3-a. These band positions are
almost the same as those reported in other studies [27,28]. For polymer electrolyte samples the position
of the carboxamide band has slightly shifted to 1647 cm−1
, whereas the amine band was disappeared as
shown in figure 3(b-f). This suggests the interactions had taken place between the hydroxyl groups of
methylcellulose and Li+, and between the amino groups of chitosan and BF4
−. From these FTIR results,
it can be concluded that complexation has taken place between LiBF4 salt and the chitosan-
methylcellulose blend.
Figure 2. FTIR spectra for chitosan-methylcellulose blend film incorporated with (a) 0 wt.% LiBF4,
(b) 10 wt.% LiBF4, (c) 20 wt.% LiBF4, (d) 30 wt.% LiBF4, (e) 40 wt.% LiBF4, (f) 50 wt.%
LiBF4.
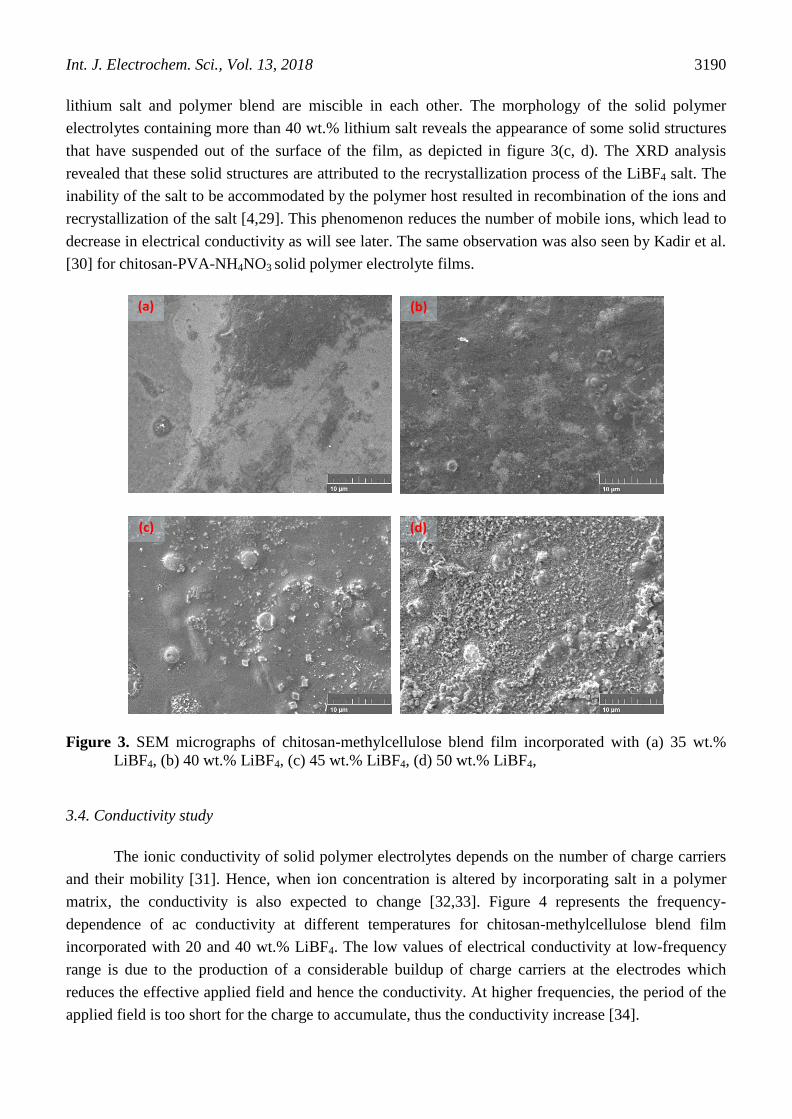
3.3. SEM study
The SEM micrographs of the solid polymer electrolyte with high salt concentrations are shown
in figure 3. It can be noted in figure 3(a, b) that the micrograph of 35 and 40 wt.% LiBF4 film
exhibited almost smooth and homogeneous surface, with good structural integrity, indicating that the
Int. J. Electrochem. Sci., Vol. 13, 2018
3190
lithium salt and polymer blend are miscible in each other. The morphology of the solid polymer
electrolytes containing more than 40 wt.% lithium salt reveals the appearance of some solid structures
that have suspended out of the surface of the film, as depicted in figure 3(c, d). The XRD analysis
revealed that these solid structures are attributed to the recrystallization process of the LiBF4 salt. The
inability of the salt to be accommodated by the polymer host resulted in recombination of the ions and
recrystallization of the salt [4,29]. This phenomenon reduces the number of mobile ions, which lead to
decrease in electrical conductivity as will see later. The same observation was also seen by Kadir et al.
[30] for chitosan-PVA-NH4NO3 solid polymer electrolyte films.
Figure 3. SEM micrographs of chitosan-methylcellulose blend film incorporated with (a) 35 wt.%
LiBF4, (b) 40 wt.% LiBF4, (c) 45 wt.% LiBF4, (d) 50 wt.% LiBF4,
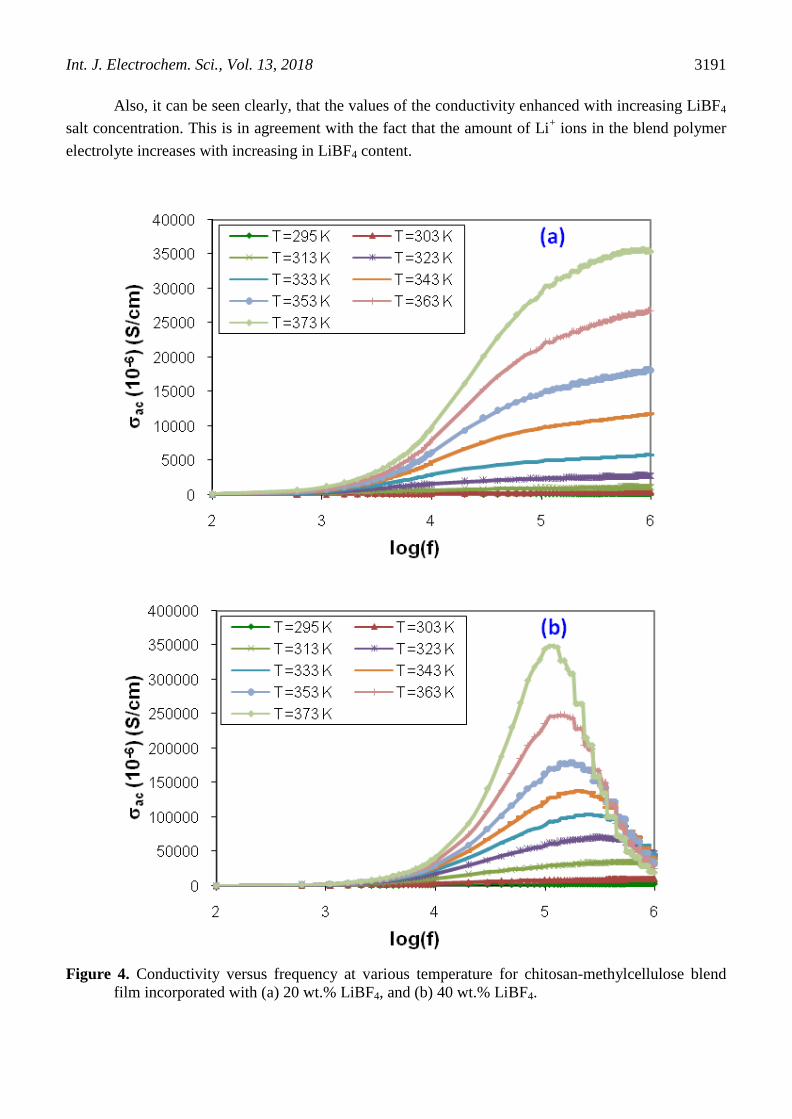
3.4. Conductivity study
The ionic conductivity of solid polymer electrolytes depends on the number of charge carriers
and their mobility [31]. Hence, when ion concentration is altered by incorporating salt in a polymer
matrix, the conductivity is also expected to change [32,33]. Figure 4 represents the frequency-
dependence of ac conductivity at different temperatures for chitosan-methylcellulose blend film
incorporated with 20 and 40 wt.% LiBF4. The low values of electrical conductivity at low-frequency
range is due to the production of a considerable buildup of charge carriers at the electrodes which
reduces the effective applied field and hence the conductivity. At higher frequencies, the period of the
applied field is too short for the charge to accumulate, thus the conductivity increase [34].
(d)
(c)
(b)
(a)
Int. J. Electrochem. Sci., Vol. 13, 2018
3191
Also, it can be seen clearly, that the values of the conductivity enhanced with increasing LiBF4
salt concentration. This is in agreement with the fact that the amount of Li+ ions in the blend polymer
electrolyte increases with increasing in LiBF4 content.
Figure 4. Conductivity versus frequency at various temperature for chitosan-methylcellulose blend
film incorporated with (a) 20 wt.% LiBF4, and (b) 40 wt.% LiBF4.
Int. J. Electrochem. Sci., Vol. 13, 2018
3192
The increase in conductivity with increasing temperature can be ascribed to the increase in both
number and mobility of charge carriers in polymer electrolytes [35]. As temperature increases, the
polymer chain acquires faster internal modes in which facilitate interchain and intrachain ion hopping
movements and, causing, the increase in the conductivity of the polymer electrolyte films [36].
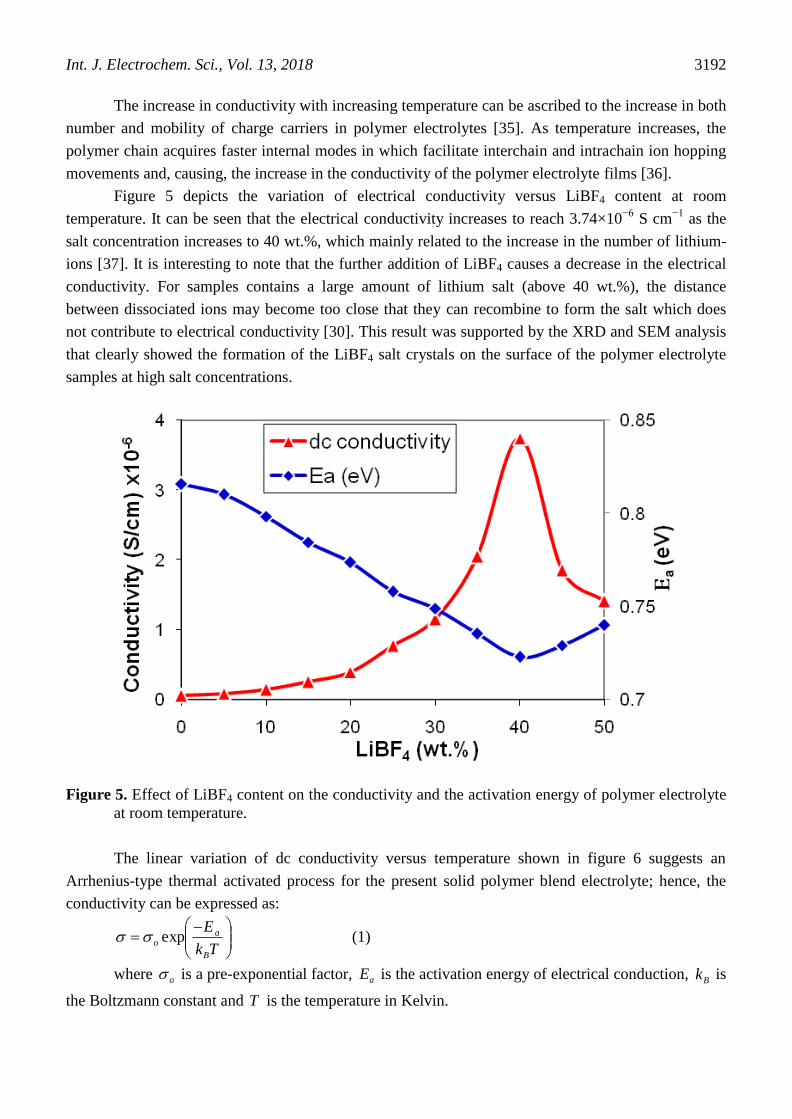
Figure 5 depicts the variation of electrical conductivity versus LiBF4 content at room
temperature. It can be seen that the electrical conductivity increases to reach 3.74×10⁻⁶
S cm−1
as the
salt concentration increases to 40 wt.%, which mainly related to the increase in the number of lithium-
ions [37]. It is interesting to note that the further addition of LiBF4 causes a decrease in the electrical
conductivity. For samples contains a large amount of lithium salt (above 40 wt.%), the distance
between dissociated ions may become too close that they can recombine to form the salt which does
not contribute to electrical conductivity [30]. This result was supported by the XRD and SEM analysis
that clearly showed the formation of the LiBF4 salt crystals on the surface of the polymer electrolyte
samples at high salt concentrations.
Figure 5. Effect of LiBF4 content on the conductivity and the activation energy of polymer electrolyte
at room temperature.
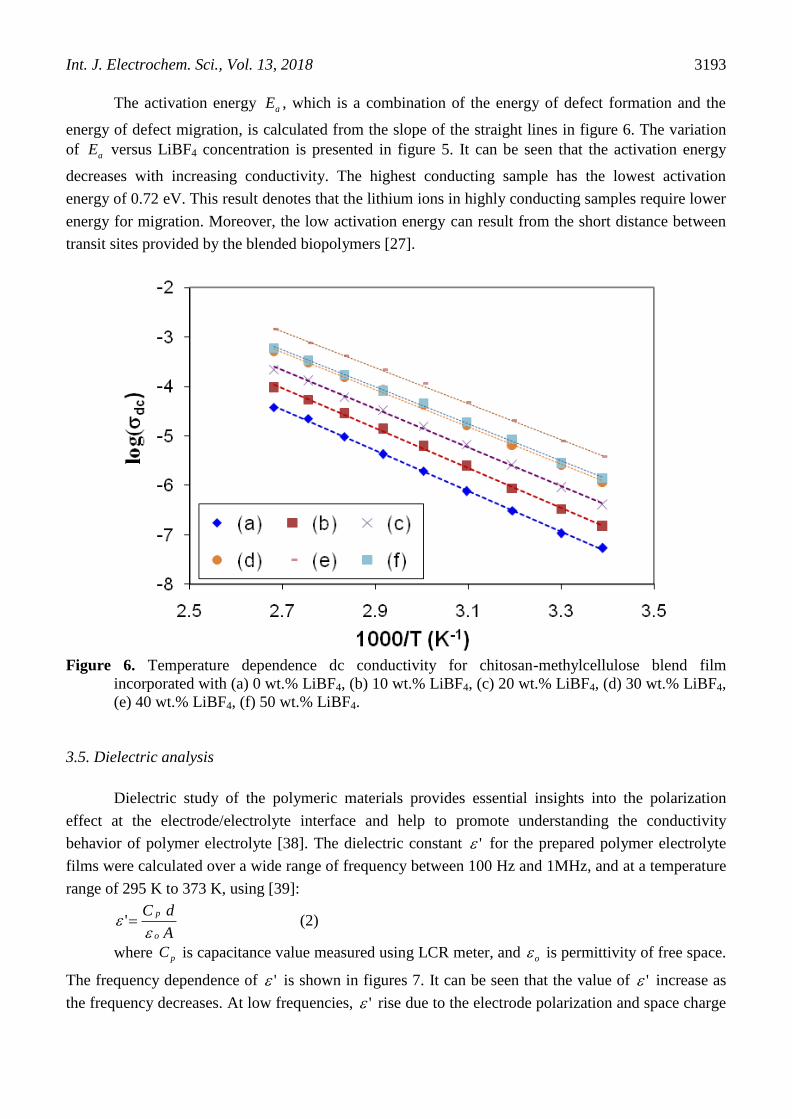
The linear variation of dc conductivity versus temperature shown in figure 6 suggests an
Arrhenius-type thermal activated process for the present solid polymer blend electrolyte; hence, the
conductivity can be expressed as:
Tk
E
B
ao exp (1)
where o is a pre-exponential factor, aE is the activation energy of electrical conduction, Bk is
the Boltzmann constant and T is the temperature in Kelvin.
Int. J. Electrochem. Sci., Vol. 13, 2018
3193
The activation energy aE , which is a combination of the energy of defect formation and the
energy of defect migration, is calculated from the slope of the straight lines in figure 6. The variation
of aE versus LiBF4 concentration is presented in figure 5. It can be seen that the activation energy
decreases with increasing conductivity. The highest conducting sample has the lowest activation
energy of 0.72 eV. This result denotes that the lithium ions in highly conducting samples require lower
energy for migration. Moreover, the low activation energy can result from the short distance between
transit sites provided by the blended biopolymers [27].
Figure 6. Temperature dependence dc conductivity for chitosan-methylcellulose blend film
incorporated with (a) 0 wt.% LiBF4, (b) 10 wt.% LiBF4, (c) 20 wt.% LiBF4, (d) 30 wt.% LiBF4,
(e) 40 wt.% LiBF4, (f) 50 wt.% LiBF4.
3.5. Dielectric analysis
Dielectric study of the polymeric materials provides essential insights into the polarization
effect at the electrode/electrolyte interface and help to promote understanding the conductivity
behavior of polymer electrolyte [38]. The dielectric constant ' for the prepared polymer electrolyte
films were calculated over a wide range of frequency between 100 Hz and 1MHz, and at a temperature
range of 295 K to 373 K, using [39]:
A
dC
o
p
' (2)
where pC is capacitance value measured using LCR meter, and o is permittivity of free space.
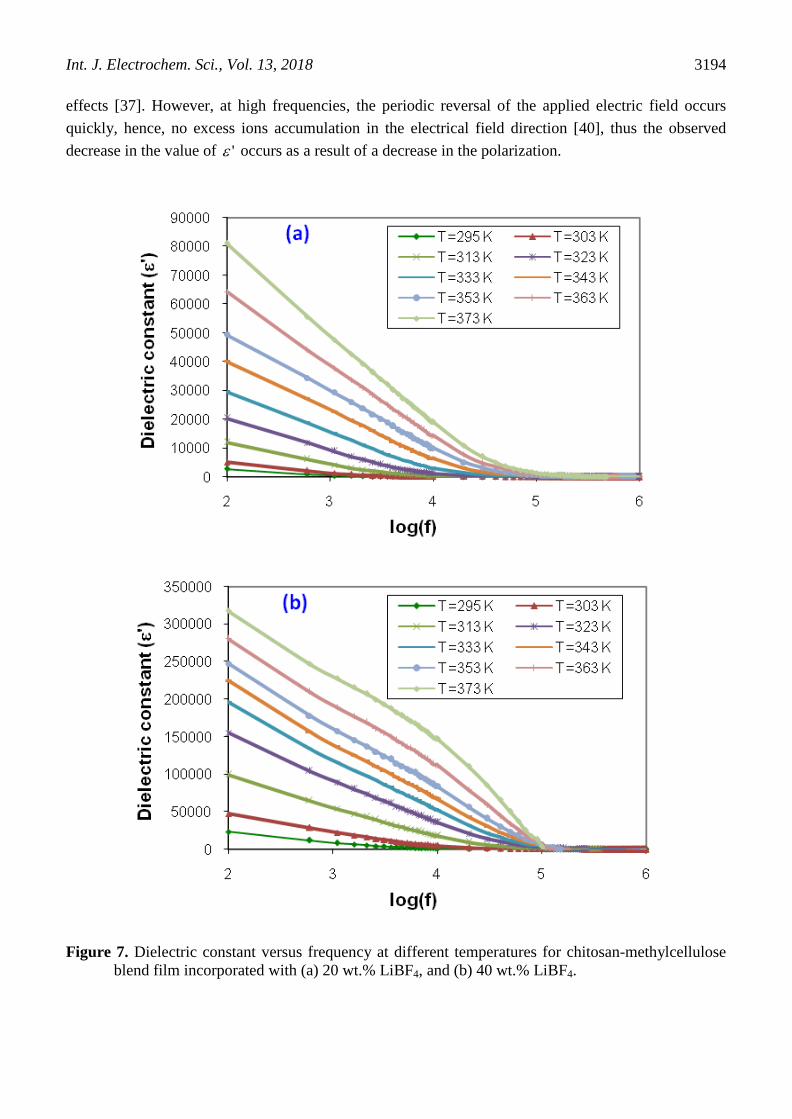
The frequency dependence of ' is shown in figures 7. It can be seen that the value of ' increase as
the frequency decreases. At low frequencies, ' rise due to the electrode polarization and space charge
Int. J. Electrochem. Sci., Vol. 13, 2018
3194
effects [37]. However, at high frequencies, the periodic reversal of the applied electric field occurs
quickly, hence, no excess ions accumulation in the electrical field direction [40], thus the observed
decrease in the value of ' occurs as a result of a decrease in the polarization.
Figure 7. Dielectric constant versus frequency at different temperatures for chitosan-methylcellulose
blend film incorporated with (a) 20 wt.% LiBF4, and (b) 40 wt.% LiBF4.

Int. J. Electrochem. Sci., Vol. 13, 2018
3195
Moreover, the decrease in ' with increasing frequency can be associated to the inability of
dipoles to follow the applied field in order to rotate rapidly, leading to a lag between the frequency of
oscillating dipole and that of the electrical field [1]. It is well established in the literature that the sharp
increase of the low frequencies ' , is due to the impact of electrode/electrolyte interface [41,42].
By comparison results in figures 4 and 7, it is observed that the highest electrical conducting
sample has the highest value of ' . Such high dielectric constant ' values demonstrate that the high
ionic conductivity mainly due to the enhanced charge carrier density at the space charge accumulation
region due to electrode/electrolyte interface. The variation of dielectric constant ' for PVA-chitosan-
NH4Br system reported by Yusof et al. [43] also follows the same trend as their conductivity result.
3.6. Transport parameters
Rice and Roth [44] proposed an attractive model for fast ionic conductors, based on the
hypothesis that in an ionic conductor, the conducting ions of mass m belonging to the conducting
spaces can be thermally excited from localized ionic states to free ion-like states, and the ion
propagates throughout the spaces with a velocity v and energy 2
21 mvE . Recently this model was
extensively used to provide an estimation of the number density of mobile ions that assist the electrical
conduction in the polymer electrolyte systems [45]. According to this model, electrical conductivity
can be expressed as:
Tk
EnE
Tmk
Ze
B
aa
B
exp3
22
(3)
where Z is the valency of conducting species, e is the electron charge, m is the mass of the
ions, n is the number density of ions, aE is the activation energy, and is the traveling time of the
ions which can be calculated using the equation:
v
l (4)
where l is a distance between two coordinating sites across which the ions may hop. According
to Shukur et al. [46], l can be considered as the jump distance between two complexation sites and
taken to be around 10.4 Å, which is used in this study. From the number density of ions )(n calculated
from equation 3, the ionic mobility can be calculated using this equation [34]:
ne
(5)
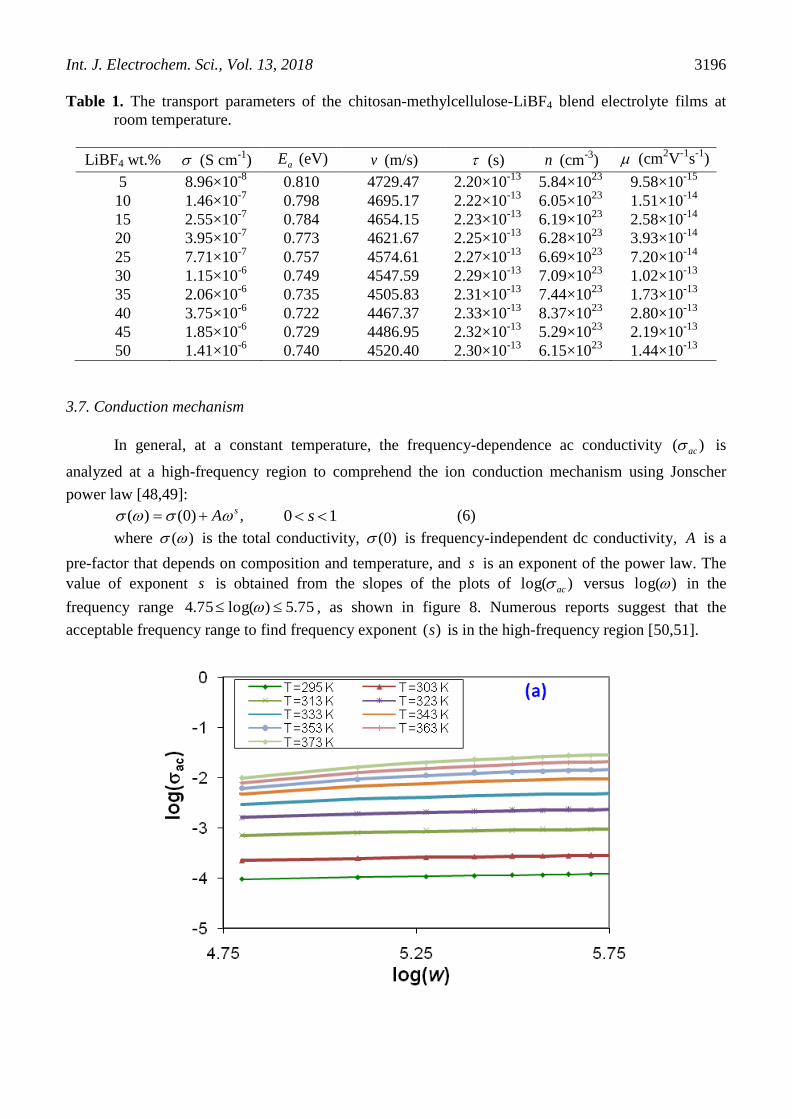
The calculated transport parameters as a function of lithium salt concentration are listed in
Table 1. The n values are in the range 5.84×10²³
to 8.37×10²³
cm−3
, and values lies between
9.58×10⁻¹⁵
and 2.80×10⁻¹³
cm2 V
−1 s
−1. In general, the electrical conductivity is dependent on the
mobile ion concentration and their mobility )( en [47]. It can be seen from Table 1 that the
increasing conductivity value with increasing lithium salt is influenced by the increasing number
density and mobility of Li+ ions. The highest conducting sample with the addition of 40 wt% LiBF4
has the highest n and values of 8.37×10²³
cm−3
and 2.80×10⁻¹³
cm2 V
−1 s
−1, respectively. As more
salt added, the values of n and decreases, leading to a drop in electrical conductivity.
Int. J. Electrochem. Sci., Vol. 13, 2018
3196
Table 1. The transport parameters of the chitosan-methylcellulose-LiBF4 blend electrolyte films at
room temperature.
LiBF4 wt.% (S cm-1
) aE (eV) v (m/s) (s) n (cm-3
) (cm2V
-1s
-1)
5 8.96×10⁻⁸
0.810 4729.47 2.20×10⁻¹³
5.84×10²³
9.58×10⁻¹⁵
10 1.46×10⁻⁷
0.798 4695.17 2.22×10⁻¹³
6.05×10²³
1.51×10⁻¹⁴
15 2.55×10⁻⁷
0.784 4654.15 2.23×10⁻¹³
6.19×10²³
2.58×10⁻¹⁴
20 3.95×10⁻⁷
0.773 4621.67 2.25×10⁻¹³
6.28×10²³
3.93×10⁻¹⁴
25 7.71×10⁻⁷
0.757 4574.61 2.27×10⁻¹³
6.69×10²³
7.20×10⁻¹⁴
30 1.15×10⁻⁶
0.749 4547.59 2.29×10⁻¹³
7.09×10²³
1.02×10⁻¹³
35 2.06×10⁻⁶
0.735 4505.83 2.31×10⁻¹³
7.44×10²³
1.73×10⁻¹³
40 3.75×10⁻⁶
0.722 4467.37 2.33×10⁻¹³
8.37×10²³
2.80×10⁻¹³
45 1.85×10⁻⁶
0.729 4486.95 2.32×10⁻¹³
5.29×10²³
2.19×10⁻¹³
50 1.41×10⁻⁶
0.740 4520.40 2.30×10⁻¹³
6.15×10²³
1.44×10⁻¹³
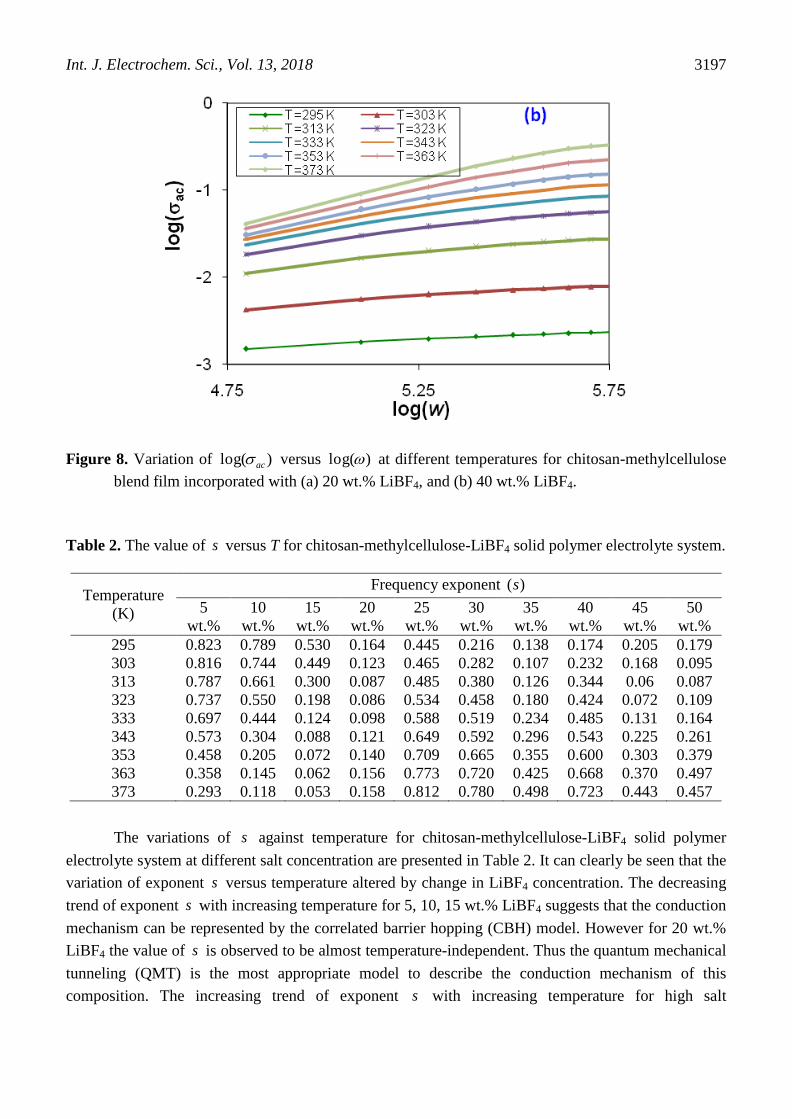
3.7. Conduction mechanism
In general, at a constant temperature, the frequency-dependence ac conductivity )( ac is
analyzed at a high-frequency region to comprehend the ion conduction mechanism using Jonscher
power law [48,49]:
,)0()( sA 10 s (6)
where )( is the total conductivity, )0( is frequency-independent dc conductivity, A is a
pre-factor that depends on composition and temperature, and s is an exponent of the power law. The
value of exponent s is obtained from the slopes of the plots of )log( ac versus )log( in the
frequency range 75.5)log(75.4 , as shown in figure 8. Numerous reports suggest that the
acceptable frequency range to find frequency exponent )(s is in the high-frequency region [50,51].
Int. J. Electrochem. Sci., Vol. 13, 2018
3197
Figure 8. Variation of )log( ac versus )log( at different temperatures for chitosan-methylcellulose
blend film incorporated with (a) 20 wt.% LiBF4, and (b) 40 wt.% LiBF4.
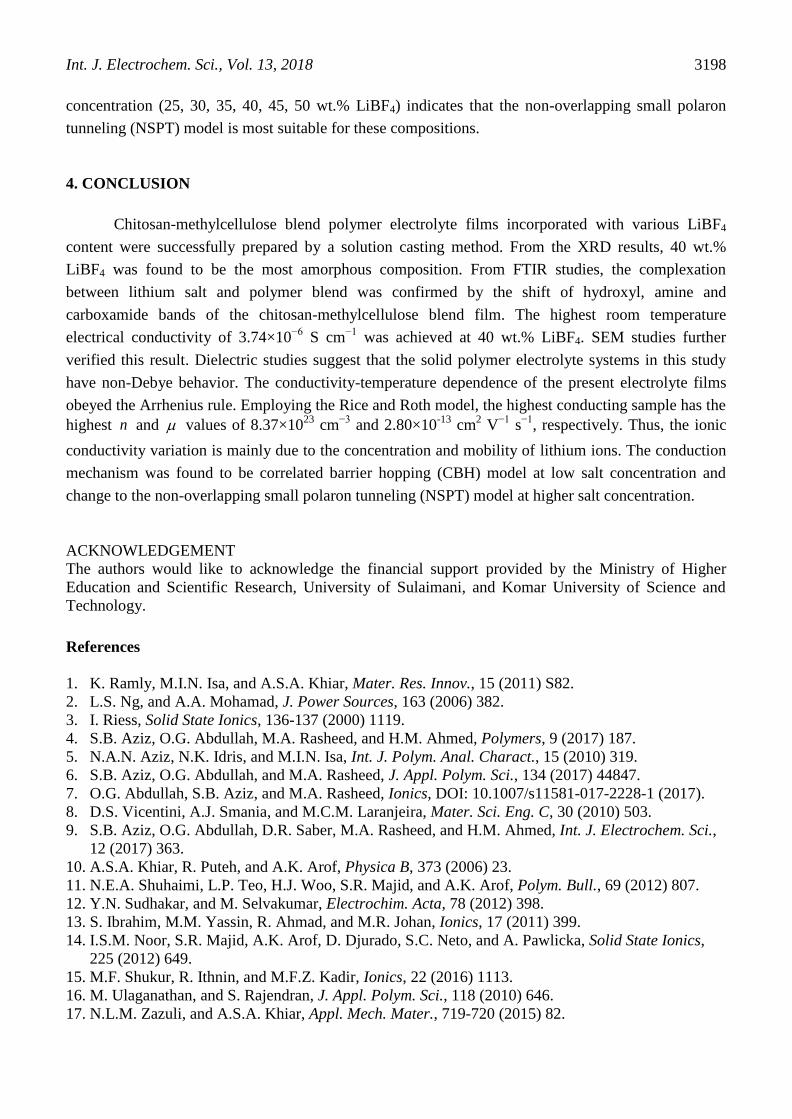
Table 2. The value of s versus T for chitosan-methylcellulose-LiBF4 solid polymer electrolyte system.
Temperature
(K)
Frequency exponent )(s
5
wt.%
10
wt.%
15
wt.%
20
wt.%
25
wt.%
30
wt.%
35
wt.%
40
wt.%
45
wt.%
50
wt.%
295 0.823 0.789 0.530 0.164 0.445 0.216 0.138 0.174 0.205 0.179
303 0.816 0.744 0.449 0.123 0.465 0.282 0.107 0.232 0.168 0.095
313 0.787 0.661 0.300 0.087 0.485 0.380 0.126 0.344 0.06 0.087
323 0.737 0.550 0.198 0.086 0.534 0.458 0.180 0.424 0.072 0.109
333 0.697 0.444 0.124 0.098 0.588 0.519 0.234 0.485 0.131 0.164
343 0.573 0.304 0.088 0.121 0.649 0.592 0.296 0.543 0.225 0.261
353 0.458 0.205 0.072 0.140 0.709 0.665 0.355 0.600 0.303 0.379
363 0.358 0.145 0.062 0.156 0.773 0.720 0.425 0.668 0.370 0.497
373 0.293 0.118 0.053 0.158 0.812 0.780 0.498 0.723 0.443 0.457
The variations of s against temperature for chitosan-methylcellulose-LiBF4 solid polymer
electrolyte system at different salt concentration are presented in Table 2. It can clearly be seen that the
variation of exponent s versus temperature altered by change in LiBF4 concentration. The decreasing
trend of exponent s with increasing temperature for 5, 10, 15 wt.% LiBF4 suggests that the conduction
mechanism can be represented by the correlated barrier hopping (CBH) model. However for 20 wt.%
LiBF4 the value of s is observed to be almost temperature-independent. Thus the quantum mechanical
tunneling (QMT) is the most appropriate model to describe the conduction mechanism of this
composition. The increasing trend of exponent s with increasing temperature for high salt
Int. J. Electrochem. Sci., Vol. 13, 2018
3198
concentration (25, 30, 35, 40, 45, 50 wt.% LiBF4) indicates that the non-overlapping small polaron
tunneling (NSPT) model is most suitable for these compositions.
4. CONCLUSION
Chitosan-methylcellulose blend polymer electrolyte films incorporated with various LiBF4
content were successfully prepared by a solution casting method. From the XRD results, 40 wt.%
LiBF4 was found to be the most amorphous composition. From FTIR studies, the complexation
between lithium salt and polymer blend was confirmed by the shift of hydroxyl, amine and
carboxamide bands of the chitosan-methylcellulose blend film. The highest room temperature
electrical conductivity of 3.74×10⁻⁶
S cm−1
was achieved at 40 wt.% LiBF4. SEM studies further
verified this result. Dielectric studies suggest that the solid polymer electrolyte systems in this study
have non-Debye behavior. The conductivity-temperature dependence of the present electrolyte films
obeyed the Arrhenius rule. Employing the Rice and Roth model, the highest conducting sample has the
highest n and values of 8.37×10²³
cm−3
and 2.80×10⁻¹³
cm2 V
−1 s
−1, respectively. Thus, the ionic
conductivity variation is mainly due to the concentration and mobility of lithium ions. The conduction
mechanism was found to be correlated barrier hopping (CBH) model at low salt concentration and
change to the non-overlapping small polaron tunneling (NSPT) model at higher salt concentration.
ACKNOWLEDGEMENT
The authors would like to acknowledge the financial support provided by the Ministry of Higher
Education and Scientific Research, University of Sulaimani, and Komar University of Science and
Technology.
References
1. K. Ramly, M.I.N. Isa, and A.S.A. Khiar, Mater. Res. Innov., 15 (2011) S82.
2. L.S. Ng, and A.A. Mohamad, J. Power Sources, 163 (2006) 382.
3. I. Riess, Solid State Ionics, 136-137 (2000) 1119.
4. S.B. Aziz, O.G. Abdullah, M.A. Rasheed, and H.M. Ahmed, Polymers, 9 (2017) 187.
5. N.A.N. Aziz, N.K. Idris, and M.I.N. Isa, Int. J. Polym. Anal. Charact., 15 (2010) 319.
6. S.B. Aziz, O.G. Abdullah, and M.A. Rasheed, J. Appl. Polym. Sci., 134 (2017) 44847.
7. O.G. Abdullah, S.B. Aziz, and M.A. Rasheed, Ionics, DOI: 10.1007/s11581-017-2228-1 (2017).
8. D.S. Vicentini, A.J. Smania, and M.C.M. Laranjeira, Mater. Sci. Eng. C, 30 (2010) 503.
9. S.B. Aziz, O.G. Abdullah, D.R. Saber, M.A. Rasheed, and H.M. Ahmed, Int. J. Electrochem. Sci.,
12 (2017) 363.
10. A.S.A. Khiar, R. Puteh, and A.K. Arof, Physica B, 373 (2006) 23.
11. N.E.A. Shuhaimi, L.P. Teo, H.J. Woo, S.R. Majid, and A.K. Arof, Polym. Bull., 69 (2012) 807.
12. Y.N. Sudhakar, and M. Selvakumar, Electrochim. Acta, 78 (2012) 398.
13. S. Ibrahim, M.M. Yassin, R. Ahmad, and M.R. Johan, Ionics, 17 (2011) 399.
14. I.S.M. Noor, S.R. Majid, A.K. Arof, D. Djurado, S.C. Neto, and A. Pawlicka, Solid State Ionics,
225 (2012) 649.
15. M.F. Shukur, R. Ithnin, and M.F.Z. Kadir, Ionics, 22 (2016) 1113.
16. M. Ulaganathan, and S. Rajendran, J. Appl. Polym. Sci., 118 (2010) 646.
17. N.L.M. Zazuli, and A.S.A. Khiar, Appl. Mech. Mater., 719-720 (2015) 82.

Int. J. Electrochem. Sci., Vol. 13, 2018
3199
18. O.G. Abdullah, R.R. Hanna, and Y.A.K. Salman, J. Mater. Sci. Mater. Electron., 28 (2017) 10283.
19. M. Hasegawa, A. Isogai, F. Onabe, M. Usuda, and R.H. Atalla, J. Appl. Polym. Sci., 45 (1992)
1873.
20. O.G. Abdullah, Y.A.K. Salman, and S.A. Saleem, Phys. Mater. Chem., 3 (2015) 18.
21. S.B. Aziz, M.A. Rasheed, S.R. Saeed, and O.G. Abdullah, Int. J. Electrochem. Sci., 12 (2017)
3263.
22. O.G. Abdullah, J. Mater. Sci. Mater. Electron., 27 (2016) 12106.
23. S.F. Bdewi, O.G. Abdullah, B.K. Aziz, and A.A.R. Mutar, J. Inorg. Organomet. Polym. Mater., 26
(2016) 326.
24. O.G. Abdullah, S.B. Aziz, D.R. Saber, R.M. Abdullah, R.R. Hanna, and S.R. Saeed, J. Mater. Sci.
Mater. Electron., 28 (2017) 8928.
25. Y.J. Yin, K.D. Yao, G.X. Cheng, and J.B. Ma, Polym. Int., 48 (1999) 429.
26. O.G. Abdullah, Y.A.K. Salman, and S.A. Saleem, J. Mater. Sci. Mater. Electron., 27 (2016) 3591.
27. M.H. Buraidah, and A.K. Arof, J. Non-Cryst. Solids, 357 (2011) 3261.
28. M.F.Z. Kadir, Z. Aspanut, S.R. Majid, and A.K. Arof, Spectrochim. Acta A, 78 (2011) 1068.
29. M.F. Shukur, and M.F.Z. Kadir, Electrochim. Acta, 158 (2015) 152.
30. M.F.Z. Kadir, S.R. Majid, and A.K. Arof, Electrochim. Acta, 55 (2010) 1475.
31. S.B. Aziz, O.G. Abdullah, and M.A. Rasheed, J. Mater. Sci. Mater. Electron., 28 (2017) 12873.
32. O.G. Abdullah, S.B. Aziz, and M.A. Rasheed, Results in Physics, 6 (2016) 1103.
33. M. Kumar, T. Tiwari, and N. Srivastava, Carbohydr. Polym., 88 (2012) 54.
34. C.S. Ramya, S. Selvasekarapandian, T. Savitha, G. Hirankumar, R. Baskaran, M.S. Bhuvaneswari
and P.C. Angelo, Eur. Polym. J., 42 (2006) 2672.
35. S.B. Aziz, O.G. Abdullah, S.A. Hussein, and H.M. Ahmed, Polymers, 9 (2017) 622.
36. R. Baskaran, S. Selvasekarapandian, G. Hirankumar, and M.S. Bhuvaneswari, Ionics, 10 (2004)
129.
37. A.S.A. Khiar, and A.K. Arof, Ionics, 16 (2010) 123.
38. Y.M. Yusof, M.F. Shukur, H.A. Illias, and M.F.Z. Kadir, Phys. Scr., 89 (2014) 035701.
39. O.G. Abdullah, and S.A. Saleem, J. Electron. Mater., 45 (2016) 5910.
40. S. Ramesh, and A.K. Arof, Mater. Sci. Eng. B, 85 (2001) 11.
41. M.L. Verma, and H.D. Sahu, Ionics, 21 (2015) 3223.
42. M. Ravi, Y. Pavani, K.K. Kumar, S. Bhavani, A.K. Sharma, and V.V.R.N. Rao, Mater. Chem.
Phys., 130 (2011) 442.
43. Y.M. Yusof, H.A. Illias, and M.F.Z. Kadir, Ionics, 20 (2014) 1235.
44. M.J. Rice, and W.L. Roth, J. Solid State Chem., 4 (1972) 294.
45. N.E.A. Shuhaimi, L.P. Teo, S.R. Majid, and A.K. Arof, Synt. Met., 160 (2010) 1040.
46. M.F. Shukur, R. Ithnin, H.A. Illias, and M.F.Z. Kadir, Opt. Mater., 35 (2013) 1834.
47. S.R. Majid, and A.K. Arof, Physica B, 355 (2005) 78.
48. R. Murugaraj, G. Govindaraj, and D. George, Mater. Lett., 57 (2003) 1656.
49. G.C. Psarras, E. Manolakaki, and G.M. Tsangaris, Composites A, 34 (2003) 1187.
50. M.H. Buraidah, L.P. Teo, S.R. Majid, and A.K. Arof, Physica B, 404 (2009) 1373.
51. M.F.Z.A. Kadir, L.P. Teo, S.R. Majid, and A.K. Arof, Mater. Res. Innov., 13 (2009) 259.
© 2018 The Authors. Published by ESG (www.electrochemsci.org). This article is an open access
article distributed under the terms and conditions of the Creative Commons Attribution license
(http://creativecommons.org/licenses/by/4.0/).