Embed Size (px)
Citation preview
Iodopropyl-branched polysiloxane gel electrolytes with improved ionic conductivity upon cross-linking
Gian Luca De Gregorio, Roberto Giannuzzi, Maria Pia Cipolla, Rita Agosta, Roberto Grisorio, Agostina Capodilupo, Gian Paolo Suranna, Giuseppe Gigli and Michele Manca
Materials. 3-chloropropylmethyldimethoxysilane, hexamethyldisiloxane and sodium iodide were purchased
from ABCR. Dimethyldiethoxysilane, p-toluenesulfonic acid monohydrate, poly(dimethylsiloxane) bis(3-
aminopropyl) terminated Mn≈2500, 1-methylimidazole, lithium iodide and 3-methoxypropionitrile were
purchased from Sigma Aldrich. All the reagents were used as received. MilliQ water (resistivity 18 MΩ) was
obtained by a Millipore filtering system unit.
Spectroscopic characterization. The effective compositions of polymers were confirmed by nuclear
magnetic resonance (1H-NMR) spectroscopy. 1H-NMR spectra of final products and intermediates were
recorded at room temperature on a Brucker 400 MHz spectrophotometer. Synthesized iodopropyl
polysiloxanes were analyzed in deuterated chloroform (CDCl3) whereas quaternized homologues were
analyzed in deuterated methanol (CD3OD) as solvents.
Molecular weight distribution. The molecular weight distribution of the here referred polymers has measured
through an Agilent 1100 HPLC system equipped with two PolyPore columns connected in series and a
G1362 detector. Toluene or tetrahydrofuran (THF) have been employed as mobile phase employed at a 1
ml*min-1 flow rate. Sample concentration was 3 g*l-1 and butylhydroxytoluene (BHT, Sigma Aldrich) was
used as internal standard. The system was calibrated with eight PMMA standards (Sigma-Aldrich) with peak
molecular weights ranging from 800 to 103000 Da and Poly Dispersion Index (PDI) ranging from 1.03 to
1.13. All the GPC analyses have been carried out at 30°C.
The universal calibration curve was built up following the Benoit’s method. [1] The Mark-Houwink-
Sakurada parameters for PMMA and PDMS in toluene at 30°C have been found in literature. [2-3]
Choice of the polarity mode and mobile phase employed during GPC analyses depends on the refractive
index of the analyzed specimen: although PDMS is highly soluble in THF, it is isorefractive with THF and
for this motivation Mark-Houwink-Sakurada constants have never been calculated for that polymer in such
solvent. On the other hands, because of the large amount of iodopropyl pendant moieties, GL11 polymer
became isorefractive with toluene and no detection could be possible while employing this solvent as mobile
phase. Therefore polymer GL14 was analyzed with negative polarity mode and toluene as solvent; polymer
GL11 was analyzed with positive polarity mode, THF as solvent and PMMA calibration curve in THF was
employed to calculate its molecular weights distribution.
1
Electronic Supplementary Material (ESI) for ChemComm.This journal is © The Royal Society of Chemistry 2014
Synthesis of 3-iodopropylmethyldimethoxysilane. In a 500 ml round shaped flask equipped with an Allinh
reflux condenser and immersed in an oil bath, 3-chloropropylmethyldimethoxysilane 17.56 ml (98 mmol)
and sodium iodide 22.15 g (147 mmol) were dissolved in 100 ml of acetone and refluxed at 60°C for 36
hours. After the mixture had cooled to room temperature, acetone was removed under vacuum. The organic
phase was recovered with methylene chloride and centrifuged at 3000 rpm for 10 minutes to precipitate
sodium iodide excess and sodium chloride formed by the anion exchange reaction. Supernatant was then
recovered and the solvent distilled off, leaving 25g of brown-yellowish oil as product.
1H NMR (400 MHz, CDCl3): δ = 0.13 (s, 3H, SiCH3), 0.72-0.74 (mc, 2H, SiCH2), 1.88-1.92 (mc, 2H,
CH2CH2), 3.20-3.22 (t, 2H, CH2I), 3.52 (s, 6H, OCH3).
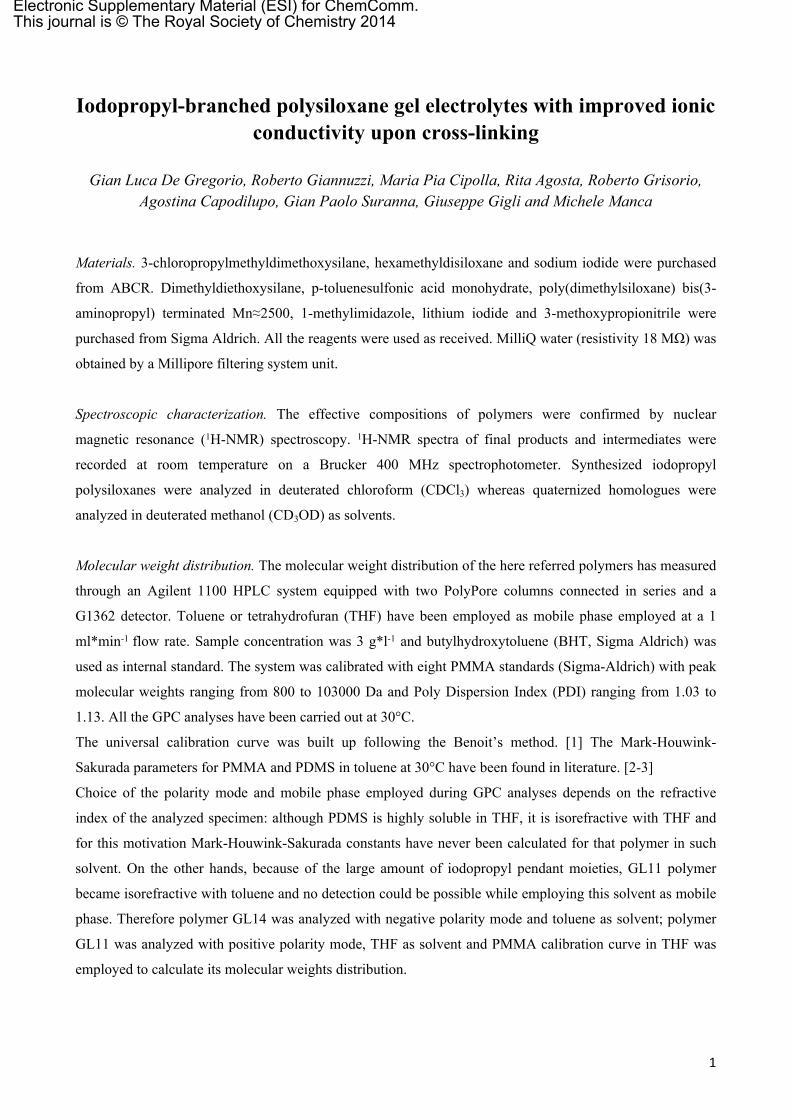
The comparison between spectra of 3-chloropropyldimethoxymethylsilane and t3-
iodopropyldimethoxymethylsilane is reported in Figure S1. The anionic exchange reaction is confirmed by
the shift from 3.53 ppm to 3.19 ppm of 3-halogenopropylic hydrogens. The shift to lower frequencies clearly
indicates that electron density of halo-methylene group has risen as a consequence of the anionic exchange
with the less electron negative iodine. Dimerization of alkoxysilanes by hydrolysis/condensation mechanism
also occurs, but its extent is very limited, moreover, the following polymerization and equilibration processes
reshuffle/recombine the structure of the polymer.
Figure S1. 1H-NMR spectra of: (a) starting 3-ClPrDMeOMeSi monomer; (b) obtained 3-IPrDMeOMeSi monomer upon ionic exchange reaction
Polymerization procedure. Polymerizations were performed on a Radleys RR98072 parallel synthesizer. The
apparatus consists of 12 glass reaction tubes, 40 ml each, equipped with heating plate, cooling mantle and a
thermocouple connected to it for temperature control. 3-iodopropylmethyldimethoxysilane and
dimethyldiethoxysilane were poured under stirring in the reactions tubes. The ratio between the two
monomers was set as reported in table S1. A 1.25 molar excess, respect the sum of alkoxy groups of
monomers, of MilliQ water was added with a catalytic amount of p-toluenesulfonic acid monohydrate.
Reaction tubes were capped and heated at 80°C for 24 hours under vigorous stirring. Temperature was then
raised to 100°C and kept for additional 24 hours. At this point, stirring was stopped and the solution allowed
separating: the hydro-alcoholic phase was removed and additional p-toluenesulfonic acid was added. The
2
a
b
mixture was finally heated for 2 days at 120°C under vigorous stirring. Raw polymers were previously
washed with MilliQ water until the washings have neutral reaction and finally dried at 70°C under vacuum.
Table S1. Chemical composition, molecular weights and cross-linking ratio for synthesized GL11 and GL14
Feed (molar ratio) Polymer (molar ratio) Molecular Weight
Polymer IPrDMOMeSi DMeDEtOSi IPrDMOMeSi DMeDEtOSi Mn Mw PDI X-LINKING (%)
GL11 1 1 1 0,90 12500 22900 1,83 20 35 45
GL14 1 4 1 3,88 10800 18900 1,74 15 25 35 45
Such obtained polymers are however characterized by a too much high molecular weights (in the order of
105 Da) and needed to be subjected to and equilibration reaction in order set the molecular weights to an
approximate valued of 20 kDa. In a typical equilibration 10 g of silicone polymer were taken up in 20 ml of
toluene, 150 mg of p-toluenesulfonic acid and 30 µl of hexamethyldisiloxane are added to the very viscous
solution, with stirring until the high molecular weight material has disappeared. 50 µl of water are then
added and stirring is continued for two hours. The solution is finally washed with water in a separating
funnel and toluene distilled off, leaving a low molecular weight silicone oil. Obtained polymers are finally
washed with warm methanol to remove cyclic oligomers and dried in oven at 60°C.
Quaternization procedure. The prepared poly(3-iodopropylmethylsiloxane-co-dimethylsiloxane)s were
mixed with four parts of acetonitrile in a flask connected with a reflux condenser and purged with argon for
15 minutes. In order to partially quaternarize pending iodopropyl unities, a molar defect of 1-
methylimidazole was then added via a syringe while continuing purging. The solution was refluxed for 15
hours in dark conditions, provided by an aluminum foil covering the whole reactor. Products are finally
recovered by precipitation in diethylether from concentrated solution in acetonitrile and dried at 70°C under
reduced pressure. To avoid hydration of imidazolium moieties, polymers were stored under controlled
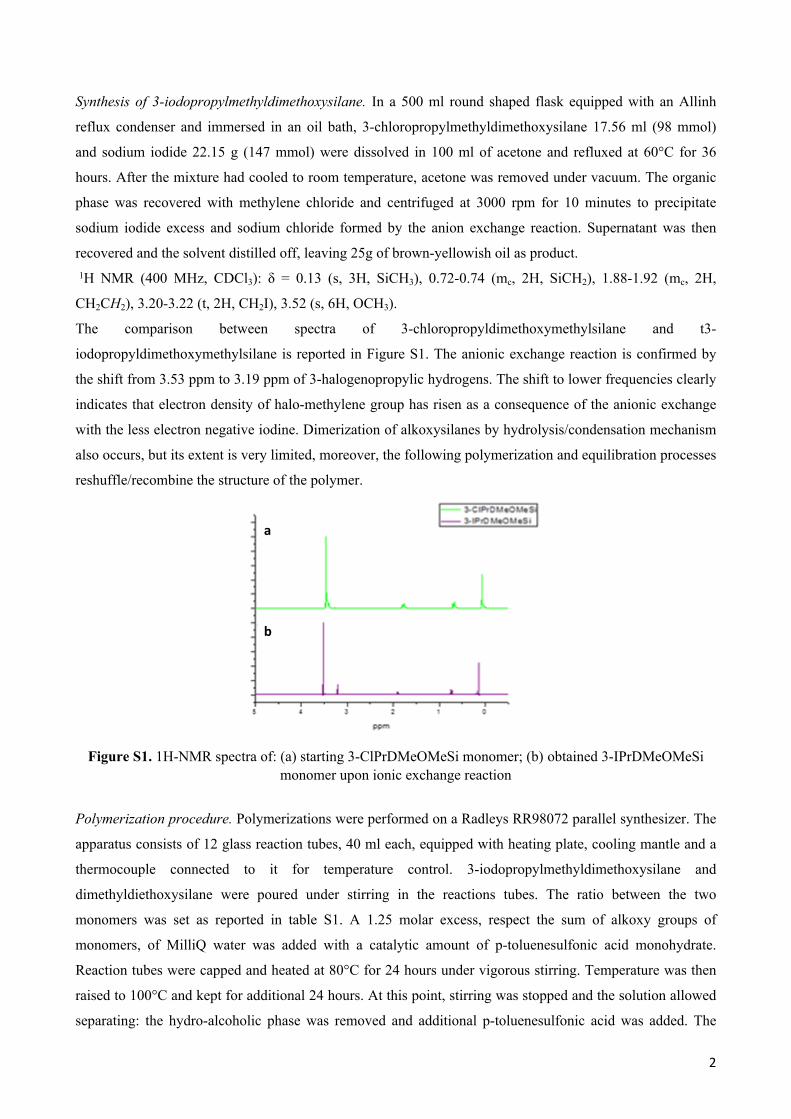
atmosphere prior the use. 1H NMR spectra of unquaternized GL11 and GL14 polymers are reported in Fig. S2a while 55%-quaternized
products (namely GL11Q55 and GL14Q55) are reported in Fig. S2b.
Imidazolium signals are detected in the frequency range 7-9 ppm, at 4.32 ppm and 4.14 ppm are observed
signals of propyl and methyl hydrogens bonded to imidazolium nitrogens. In the lower frequencies range (2
ppm-0.1 ppm) signals of alkyl chains connected to silicon are detected. Copolymerization is verified by the
disappearance of alkoxy groups signal (3.46-3.48 ppm) and by the absence of silanol (Si-OH) signal.
Quaternization is finally confirmed by the shift of 3-iodopropyl moiety from 3.19 ppm to 4.30 ppm. Electron
density on the 3-propylic hydrogens has lowered due to the formation of the bond with the more
electronegative nitrogen of imidazole; the ionic character of the C-N bond is furthermore confirmed by the
fact that the observed chemical shift is detected at higher frequencies than in uncharged alkyl-imidazoles. [4]
3
Figure S2. 1H NMR spectra of a) GL11 and GL14 and b) of the same polymers upon partial quaternization process with 1-methylimidazole.
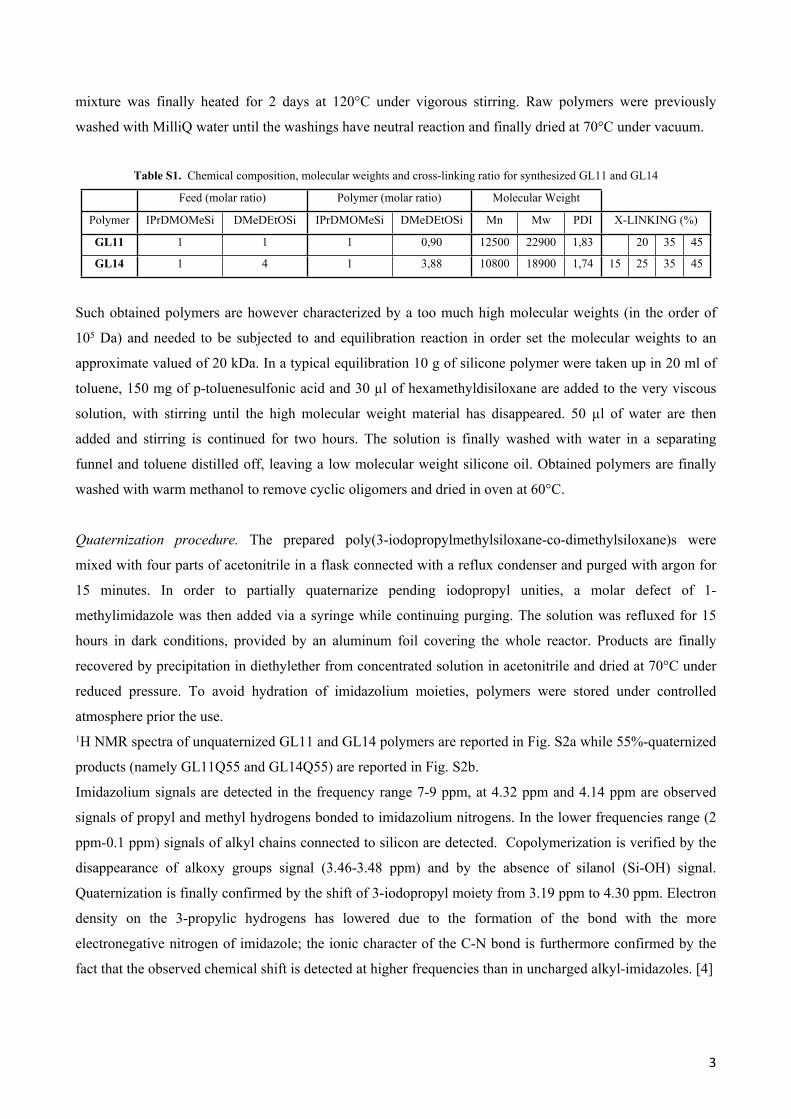
Molecular weight distributions of GL11 and GL14 are reported respectively in Fig. S3a) and S3b). After the
polymerization step, obtained products presented as mixtures of high molecular weight polymer and low
molecular weight compounds (Figure S3, black squares) which can be indeed identified as cyclic oligomers.
Their amount seems to be dependent on the quantity of 3-iodopropyldimethoxymethylsilane employed in the
initial mixture of reactants: we have in fact experimentally found that the increasing concentration of 3-
halogenopropyl monomer resulted in a higher amount of cyclic intermediates, which were subsequently
removed through a series of washing cycles in warm methanol. The equilibration procedure allowed us to
tailor the molecular weight of synthesized polymers to a 20 kDa value (Figure S3, red circles).
4
a b
a b
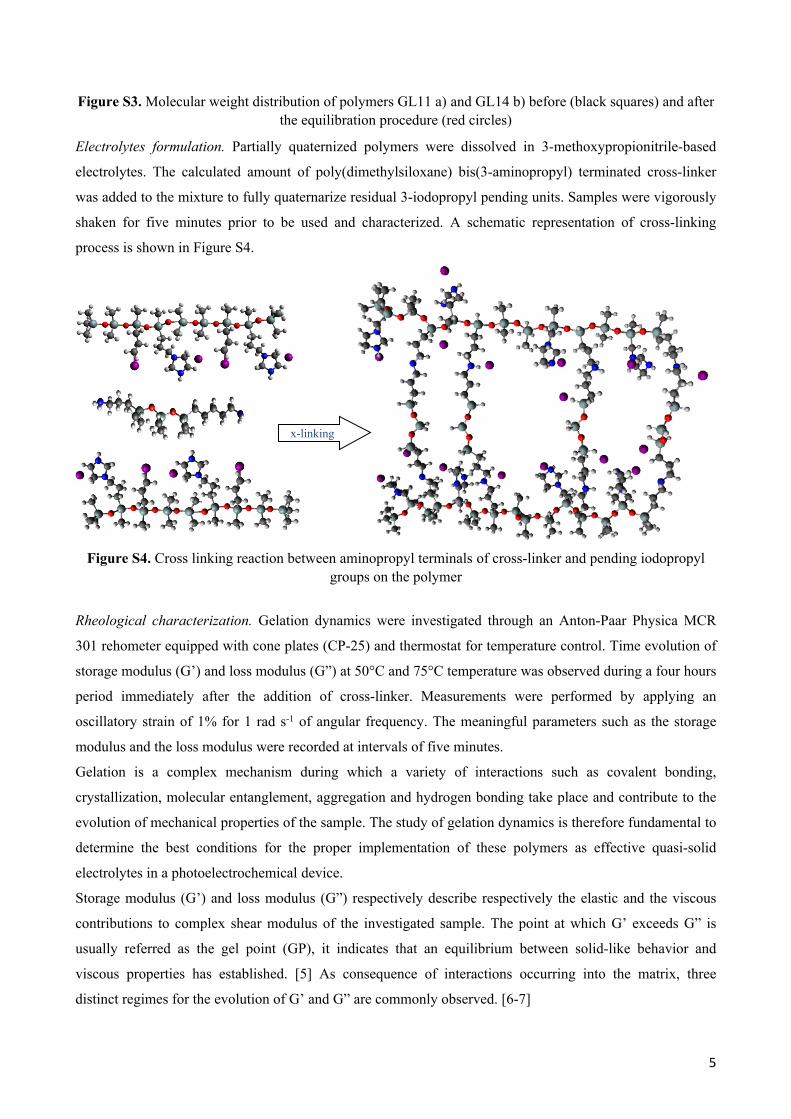
Figure S3. Molecular weight distribution of polymers GL11 a) and GL14 b) before (black squares) and after the equilibration procedure (red circles)
Electrolytes formulation. Partially quaternized polymers were dissolved in 3-methoxypropionitrile-based
electrolytes. The calculated amount of poly(dimethylsiloxane) bis(3-aminopropyl) terminated cross-linker
was added to the mixture to fully quaternarize residual 3-iodopropyl pending units. Samples were vigorously
shaken for five minutes prior to be used and characterized. A schematic representation of cross-linking
process is shown in Figure S4.
Figure S4. Cross linking reaction between aminopropyl terminals of cross-linker and pending iodopropyl groups on the polymer
Rheological characterization. Gelation dynamics were investigated through an Anton-Paar Physica MCR
301 rehometer equipped with cone plates (CP-25) and thermostat for temperature control. Time evolution of
storage modulus (G’) and loss modulus (G”) at 50°C and 75°C temperature was observed during a four hours
period immediately after the addition of cross-linker. Measurements were performed by applying an
oscillatory strain of 1% for 1 rad s-1 of angular frequency. The meaningful parameters such as the storage
modulus and the loss modulus were recorded at intervals of five minutes.
Gelation is a complex mechanism during which a variety of interactions such as covalent bonding,
crystallization, molecular entanglement, aggregation and hydrogen bonding take place and contribute to the
evolution of mechanical properties of the sample. The study of gelation dynamics is therefore fundamental to
determine the best conditions for the proper implementation of these polymers as effective quasi-solid
electrolytes in a photoelectrochemical device.
Storage modulus (G’) and loss modulus (G”) respectively describe respectively the elastic and the viscous
contributions to complex shear modulus of the investigated sample. The point at which G’ exceeds G” is
usually referred as the gel point (GP), it indicates that an equilibrium between solid-like behavior and
viscous properties has established. [5] As consequence of interactions occurring into the matrix, three
distinct regimes for the evolution of G’ and G” are commonly observed. [6-7]
5
x-linking
First stage is characterized by a transient plateau region, where G” is higher than G’ and both the moduli are
very low. During this step only a minimal increment has been detected for both G’ and G”, therefore, sample
behaves as a fluid. As gelation proceeds, both moduli grow up: G’ increase faster than G” and the differential
on rates leads to a crossover of G’ and G”. The growth of storage modulus is indicating the formation of a
three dimensional network as a solid phase whereas the growth of loss modulus is due to the formation of
non-interacting systems such as low molecular weight aggregates, stray chains, dangling segments, etc.
which behavior is mainly viscous. In the final stage both G’ and G” level off and are nearly invariant,
suggesting the formation of a cross-linked network.
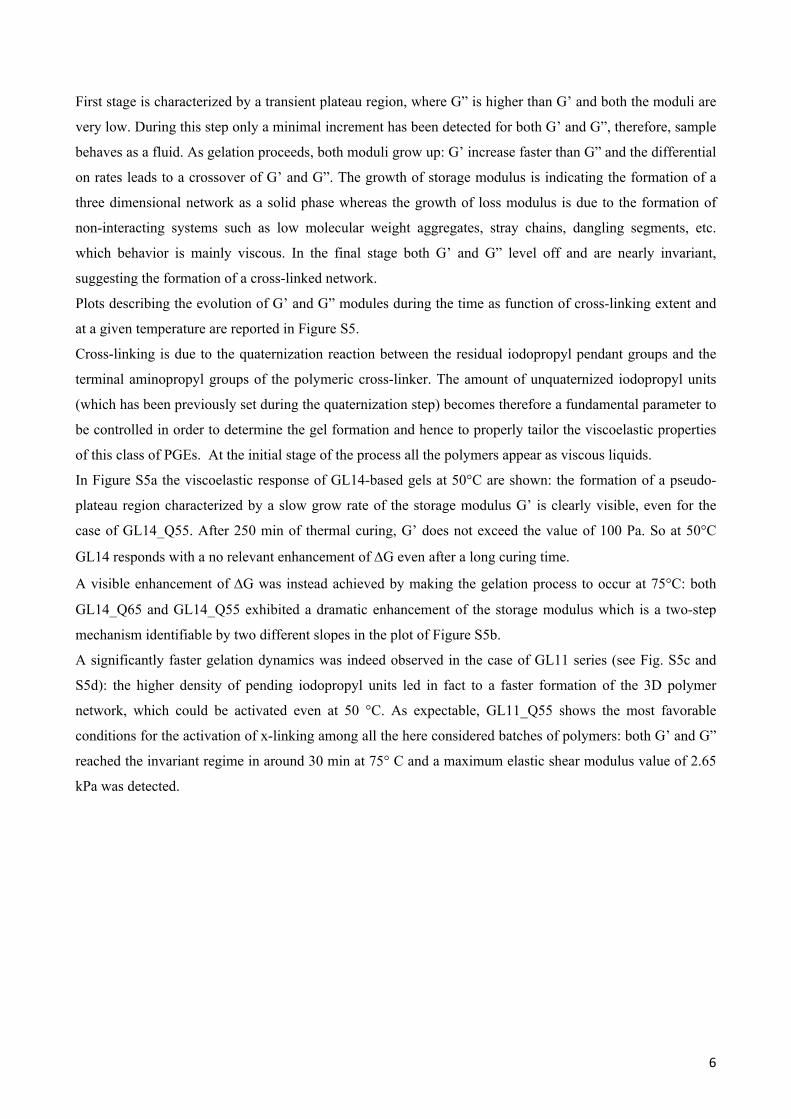
Plots describing the evolution of G’ and G” modules during the time as function of cross-linking extent and
at a given temperature are reported in Figure S5.
Cross-linking is due to the quaternization reaction between the residual iodopropyl pendant groups and the
terminal aminopropyl groups of the polymeric cross-linker. The amount of unquaternized iodopropyl units
(which has been previously set during the quaternization step) becomes therefore a fundamental parameter to
be controlled in order to determine the gel formation and hence to properly tailor the viscoelastic properties
of this class of PGEs. At the initial stage of the process all the polymers appear as viscous liquids.
In Figure S5a the viscoelastic response of GL14-based gels at 50°C are shown: the formation of a pseudo-
plateau region characterized by a slow grow rate of the storage modulus G’ is clearly visible, even for the
case of GL14_Q55. After 250 min of thermal curing, G’ does not exceed the value of 100 Pa. So at 50°C
GL14 responds with a no relevant enhancement of G even after a long curing time.
A visible enhancement of G was instead achieved by making the gelation process to occur at 75°C: both
GL14_Q65 and GL14_Q55 exhibited a dramatic enhancement of the storage modulus which is a two-step
mechanism identifiable by two different slopes in the plot of Figure S5b.
A significantly faster gelation dynamics was indeed observed in the case of GL11 series (see Fig. S5c and
S5d): the higher density of pending iodopropyl units led in fact to a faster formation of the 3D polymer
network, which could be activated even at 50 °C. As expectable, GL11_Q55 shows the most favorable
conditions for the activation of x-linking among all the here considered batches of polymers: both G’ and G”
reached the invariant regime in around 30 min at 75° C and a maximum elastic shear modulus value of 2.65
kPa was detected.
6
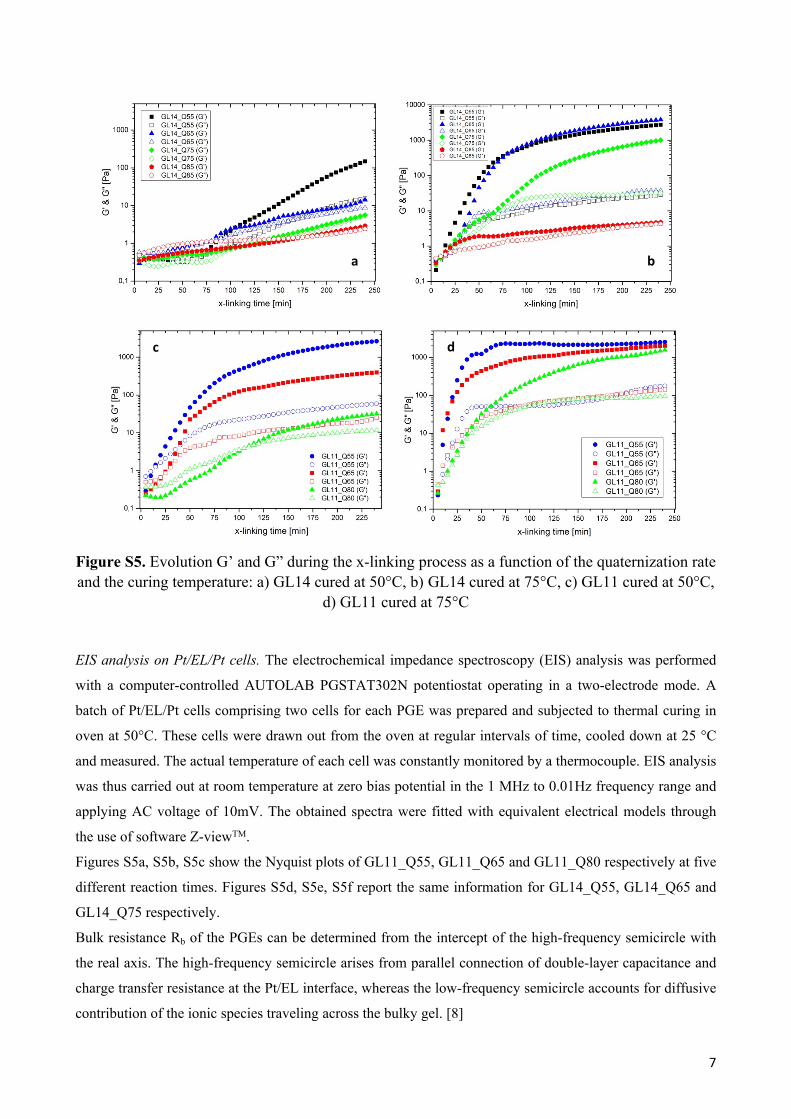
Figure S5. Evolution G’ and G” during the x-linking process as a function of the quaternization rate and the curing temperature: a) GL14 cured at 50°C, b) GL14 cured at 75°C, c) GL11 cured at 50°C,
d) GL11 cured at 75°C
EIS analysis on Pt/EL/Pt cells. The electrochemical impedance spectroscopy (EIS) analysis was performed
with a computer-controlled AUTOLAB PGSTAT302N potentiostat operating in a two-electrode mode. A
batch of Pt/EL/Pt cells comprising two cells for each PGE was prepared and subjected to thermal curing in
oven at 50°C. These cells were drawn out from the oven at regular intervals of time, cooled down at 25 °C
and measured. The actual temperature of each cell was constantly monitored by a thermocouple. EIS analysis
was thus carried out at room temperature at zero bias potential in the 1 MHz to 0.01Hz frequency range and
applying AC voltage of 10mV. The obtained spectra were fitted with equivalent electrical models through
the use of software Z-viewTM.
Figures S5a, S5b, S5c show the Nyquist plots of GL11_Q55, GL11_Q65 and GL11_Q80 respectively at five
different reaction times. Figures S5d, S5e, S5f report the same information for GL14_Q55, GL14_Q65 and
GL14_Q75 respectively.
Bulk resistance Rb of the PGEs can be determined from the intercept of the high-frequency semicircle with
the real axis. The high-frequency semicircle arises from parallel connection of double-layer capacitance and
charge transfer resistance at the Pt/EL interface, whereas the low-frequency semicircle accounts for diffusive
contribution of the ionic species traveling across the bulky gel. [8]
7
a b
c d
As noticeable, in the case of GL11-based electrolytes, the high-frequencies semicircle is only detectable, this
indicating the major contribution to the overall impedance of the system comes from the parallel connection
of charge transfer resistance and double-layer capacitance, whereas the low–frequencies signal is not clearly
visible at any cross-linking stage. What is indeed clearly visible is the dramatic reduction of the high-
frequencies semicircle size upon the cross-linking. Nyquist plots of GL14 series also exhibit a similar trend,
but in this case the diffusive component became clearly detectable since from the early stages of the thermal
curing as a consequence of the relatively lower viscosity of these electrolytes.
Figure S6. Nyquist plots of GL11_Q55 (a), GL11_Q65 (b), GL11_Q80 (c), GL14_Q55 (d), GL14_Q65 (e), GL14_Q75 (f) measured after different curing times at 50°C
Effect of temperature on the ionic conductivity of the x-linked gels. EIS spectra of GL11_Q55 and
GL11_Q80 were also measured upon the completion of the curing process. An additional batch of Pt/EL/Pt
cells was also prepared and subjected to thermal curing at 60°C for 72h. These cells were then stored at room
temperature for 24 and then subjected to a controlled heating treatment in oven in the range 25°C-60°C. The
actual temperature of the electrolyte was constantly monitored by a thermocouple. EIS measurements (open
circuit potential, 100 kHz to 0.01Hz, AC voltage 10mV) were performed during the heating process at step
of 5°C. Data were then fitted with the equivalent electrical model [8] through the software Z-viewTM to
extrapolate values of the ionic conductivity at every temperature: the Arrhenius plots for these two batches of
ELs are shown in Fig. S7.
8
a b c
d e f

Figure S7. Arrhenius plots of GL11_Q55 and GL11_Q80 measured in the range between 25°C and 60°C upon the completion of the x-linking process
Fabrication of dye-sensitized solar cells. A layer of commercial TiO2–nanocrystals-based paste (Dyesol
18NRT) was deposited onto an FTO-coated glass (TCO-XY10 provided by XIN-YAN LTD) through a semi-
automatic screen-printing machine (AUREL 900) and then dried at 180°C on hot-plate for 20min. This
procedure was repeated several times till the desired film thickness was obtained. Then an additional layer
made by coarser TiO2 nanoparticles was deposited by the use of a Dyesol 18NR-AO colloidal paste, which
thus acted as scattering layer. The overall thickness of the TiO2-mesoporous electrodes utilized in this work
was kept around 15um.
The electrodes were gradually heated under an air flow in oven and sintered at 480 °C for 30 min. They were
then sensitized with a recently disclosed organic dye, which has been referred as G2 [9]: TiO2 films were
immersed into a 0.2 mM solution THF which also contained a proper amount of chenodeoxycholic acid
(CDCA, 80 mM) as co-adsorbent which reduces/prevents the detrimental aggregation effects between
neighboring dye molecules. A batch of reference electrodes was also provided by using a solution 0.5 mM of
bis(tetrabutylammonium)-cis-di(thiocyanato)-N,N′-bis(4-carboxylato-4′-carboxylic acid-2,2-bipyridine)
ruthenium(II) (N719) in a mixture of acetonitrile and tert-butyl alcohol (v/v, 1:1). In both of the cases, dye
loading was performed by keeping the electrodes immersed into the dye solution for 14h. DSSCs were
finally assembled by using a Platinum-coated glass (counter electrode) and sealed with a 60μm-thick Surlyn
gasket. Electrolytes were introduced into the cell through a hole, which had been predrilled on the back of
the counter electrode and was connected to a vacuum pump. Two batches of reference cells have been
provided by filling both of G2- and N719-sensitized cells with a liquid electrolyte having the following
composition: 0.1 M LiI, 0.05 M I2, 0.6 M 1,2-dimethyl-3-propylimidazolium iodide and 0.5 M tert-
butylpyridine in 3-methoxypropionitrile. The holes were then sealed up with a Surlyn hot-melt film attached
to a glass-based cap.
J-V (current density−voltage) curves detected from the measurement of the here referred dye solar cells
under 1 sun illumination are shown in Figure S8 and their performances are summarized in Table S2.
Table S2. Photovoltaic performances of GL11-based dye solar cells compared with two reference cells filled with liquid electrolyte
9
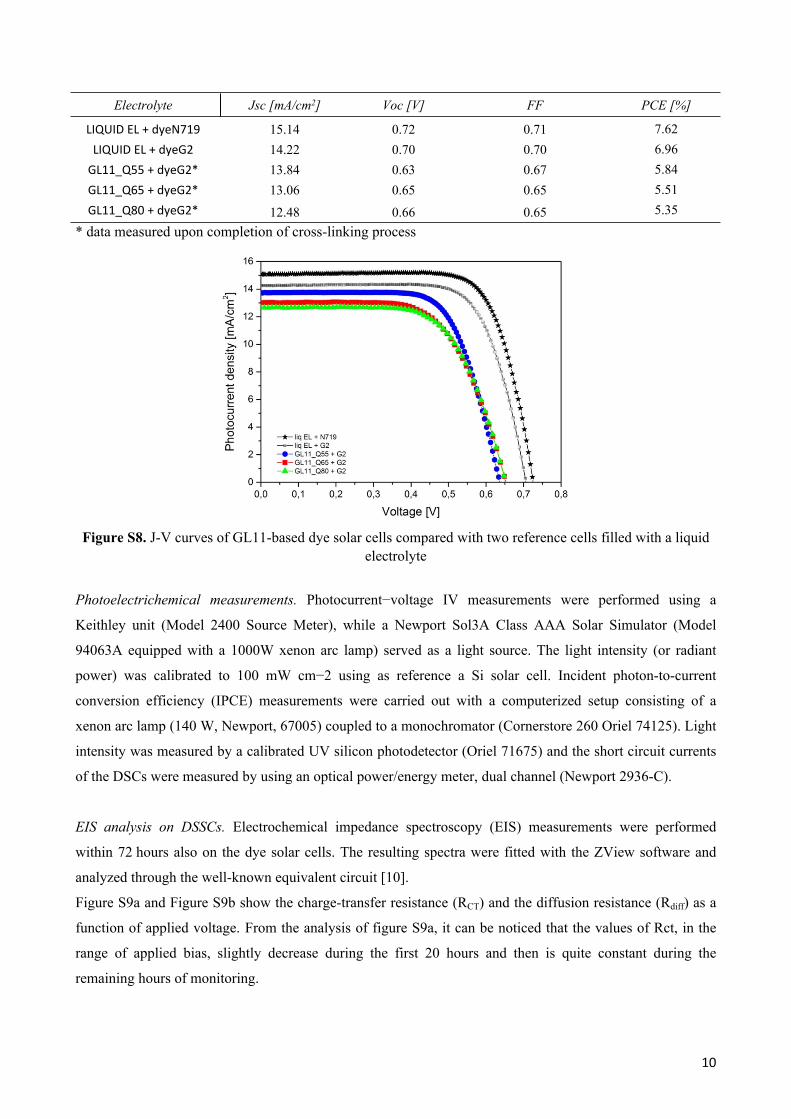
Electrolyte Jsc [mA/cm2] Voc [V] FF PCE [%]
LIQUID EL + dyeN719 15.14 0.72 0.71 7.62LIQUID EL + dyeG2 14.22 0.70 0.70 6.96
GL11_Q55 + dyeG2* 13.84 0.63 0.67 5.84GL11_Q65 + dyeG2* 13.06 0.65 0.65 5.51GL11_Q80 + dyeG2* 12.48 0.66 0.65 5.35
* data measured upon completion of cross-linking process
Figure S8. J-V curves of GL11-based dye solar cells compared with two reference cells filled with a liquid electrolyte
Photoelectrichemical measurements. Photocurrent−voltage IV measurements were performed using a
Keithley unit (Model 2400 Source Meter), while a Newport Sol3A Class AAA Solar Simulator (Model
94063A equipped with a 1000W xenon arc lamp) served as a light source. The light intensity (or radiant
power) was calibrated to 100 mW cm−2 using as reference a Si solar cell. Incident photon-to-current
conversion efficiency (IPCE) measurements were carried out with a computerized setup consisting of a
xenon arc lamp (140 W, Newport, 67005) coupled to a monochromator (Cornerstore 260 Oriel 74125). Light
intensity was measured by a calibrated UV silicon photodetector (Oriel 71675) and the short circuit currents
of the DSCs were measured by using an optical power/energy meter, dual channel (Newport 2936-C).
EIS analysis on DSSCs. Electrochemical impedance spectroscopy (EIS) measurements were performed
within 72 hours also on the dye solar cells. The resulting spectra were fitted with the ZView software and
analyzed through the well-known equivalent circuit [10].
Figure S9a and Figure S9b show the charge-transfer resistance (RCT) and the diffusion resistance (Rdiff) as a
function of applied voltage. From the analysis of figure S9a, it can be noticed that the values of Rct, in the
range of applied bias, slightly decrease during the first 20 hours and then is quite constant during the
remaining hours of monitoring.
10
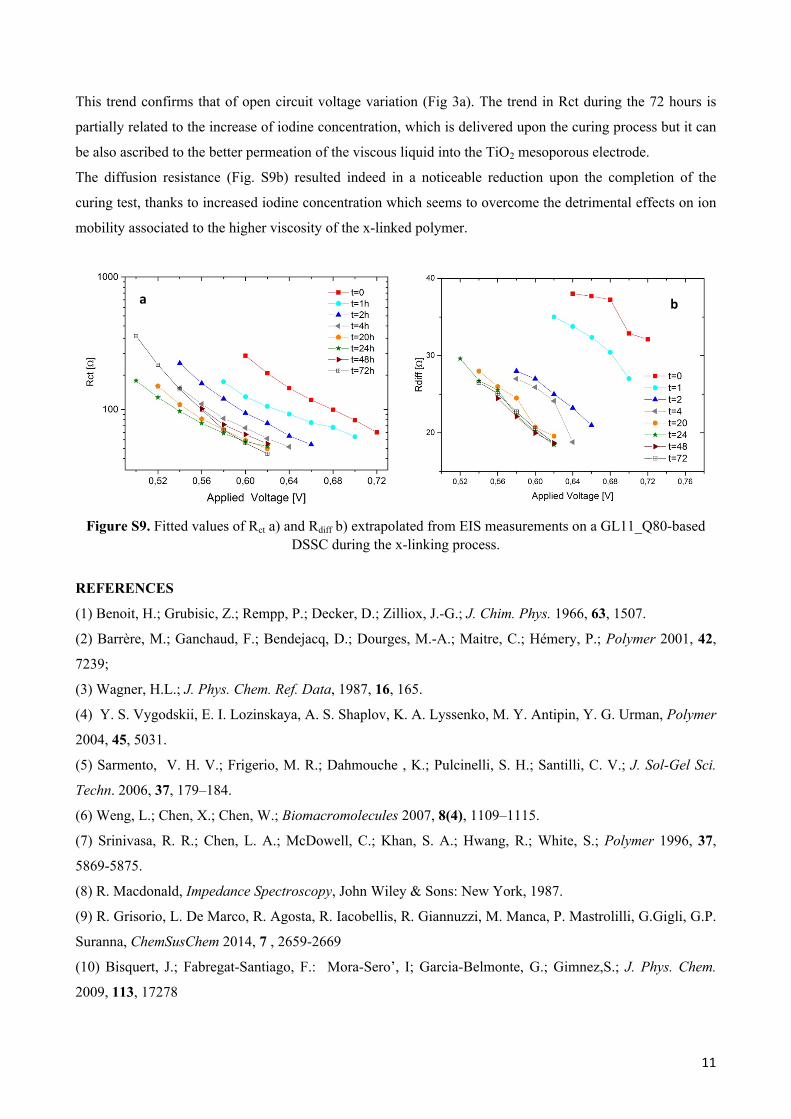
This trend confirms that of open circuit voltage variation (Fig 3a). The trend in Rct during the 72 hours is
partially related to the increase of iodine concentration, which is delivered upon the curing process but it can
be also ascribed to the better permeation of the viscous liquid into the TiO2 mesoporous electrode.
The diffusion resistance (Fig. S9b) resulted indeed in a noticeable reduction upon the completion of the
curing test, thanks to increased iodine concentration which seems to overcome the detrimental effects on ion
mobility associated to the higher viscosity of the x-linked polymer.
Figure S9. Fitted values of Rct a) and Rdiff b) extrapolated from EIS measurements on a GL11_Q80-based DSSC during the x-linking process.
REFERENCES
(1) Benoit, H.; Grubisic, Z.; Rempp, P.; Decker, D.; Zilliox, J.-G.; J. Chim. Phys. 1966, 63, 1507.
(2) Barrère, M.; Ganchaud, F.; Bendejacq, D.; Dourges, M.-A.; Maitre, C.; Hémery, P.; Polymer 2001, 42,
7239;
(3) Wagner, H.L.; J. Phys. Chem. Ref. Data, 1987, 16, 165.
(4) Y. S. Vygodskii, E. I. Lozinskaya, A. S. Shaplov, K. A. Lyssenko, M. Y. Antipin, Y. G. Urman, Polymer
2004, 45, 5031.
(5) Sarmento, V. H. V.; Frigerio, M. R.; Dahmouche , K.; Pulcinelli, S. H.; Santilli, C. V.; J. Sol-Gel Sci.
Techn. 2006, 37, 179–184.
(6) Weng, L.; Chen, X.; Chen, W.; Biomacromolecules 2007, 8(4), 1109–1115.
(7) Srinivasa, R. R.; Chen, L. A.; McDowell, C.; Khan, S. A.; Hwang, R.; White, S.; Polymer 1996, 37,
5869-5875.
(8) R. Macdonald, Impedance Spectroscopy, John Wiley & Sons: New York, 1987.
(9) R. Grisorio, L. De Marco, R. Agosta, R. Iacobellis, R. Giannuzzi, M. Manca, P. Mastrolilli, G.Gigli, G.P.
Suranna, ChemSusChem 2014, 7 , 2659-2669
(10) Bisquert, J.; Fabregat-Santiago, F.: Mora-Sero’, I; Garcia-Belmonte, G.; Gimnez,S.; J. Phys. Chem.
2009, 113, 17278
11
a b