Embed Size (px)
Citation preview

Annual Report • 2009 21
CONEXUS CREDIT UNION
Consolidated Financial StatementsDecember 31, 2009
La Bodega: Business Member
Annual Report • 2009 21
Annual Report • 2009 22
Management’s Responsibility for Financial Reporting
To the Members ofConexus Credit Union
The accompanying Consolidated Financial Statements of Conexus Credit Union were prepared by management, which is responsible for the integrity and fairness of the information presented, including the many accounts that must of necessity be based on estimates and judgments. These Consolidated Financial Statements were prepared in accordance with the financial reporting requirements prescribed by The Credit Union Act, 1998 of the Province of Saskatchewan, Credit Union Deposit Guarantee Corporation, and by statute. The accounting policies followed in the preparation of these financial statements conform to Canadian generally accepted accounting principles (GAAP). Financial and operating data elsewhere in the annual report are consistent with the information contained in the Consolidated Financial Statements.
In discharging our responsibility for the integrity and fairness of the Consolidated Financial Statements and for the accounting systems from which they are derived, we maintain the necessary system of internal controls designed to ensure that transactions are authorized, assets are safeguarded and proper records are maintained. These controls include quality standards in hiring and training of employees, policy and procedure manuals, a corporate code of conduct and accountability for performance within appropriate and well-defined areas of responsibility.
The system of internal controls is further supported by a compliance function, which is designed to ensure that we and our employees comply with the appropriate legislation and conflict of interest rules, and by an internal audit staff, which conducts periodic audits of all aspects of our operations.
Ian ReaChief Executive Officer
Ken ShawExecutive Vice PresidentFinance
The board of directors oversees management’s responsibilities for financial reporting through an Audit and Risk Committee, which is composed entirely of independent directors. This committee reviews our Consolidated Financial Statements and recommends them to the board for approval. Other key responsibilities of the Audit and Risk Committee include reviewing our existing internal control procedures and planned revisions to those procedures, and advising the directors on auditing matters and financial reporting issues. Our Chief Internal Auditor has full and unrestricted access to the Audit Committee.
Further monitoring of financial performance and reporting is carried out by the Credit Union Deposit Guarantee Corporation. It is given its responsibilities and powers by provincial statute through the Credit Union Act. Its purpose is to guarantee members’ funds on deposit with Saskatchewan credit unions and provide preventative services. Preventative services include ongoing financial monitoring, regular reporting and consultation.
Deloitte & Touche, LLP Chartered Accountants appointed by the members of Conexus Credit Union upon the recommendation of the Audit and Risk Committee and board, have performed an independent audit of the Consolidated Financial Statements and their report follows. The auditors have full and unrestricted access to the Audit and Risk Committee to discuss their related findings.
Annual Report • 2009 23
statements. An audit also includes assessing the accounting principles used and significant estimates made by management, as well as evaluating the overall financial statement presentation.
In our opinion, these consolidated financial statements present fairly, in all material respects, the financial position of the Credit Union as at December 31, 2009 and the results of its operations and its cash flows for the year then ended in accordance with Canadian generally accepted accounting principles.
Chartered AccountantsRegina, SaskatchewanJanuary 29, 2010
Auditors’ Report
To the Members ofConexus Credit Union 2006
We have audited the consolidated statement of financial position of Conexus Credit Union 2006 as at December 31, 2009 and the consolidated statements of income, comprehensive income, members’ equity and cash flows for the year then ended. These financial statements are the responsibility of the Credit Union’s management. Our responsibility is to express an opinion on these financial statements based on our audit.
We conducted our audit in accordance with Canadian generally accepted auditing standards. Those standards require that we plan and perform an audit to obtain reasonable assurance whether the financial statements are free of material misstatement. An audit includes examining, on a test basis, evidence supporting the amounts and disclosures in the financial
Annual Report • 2009 24
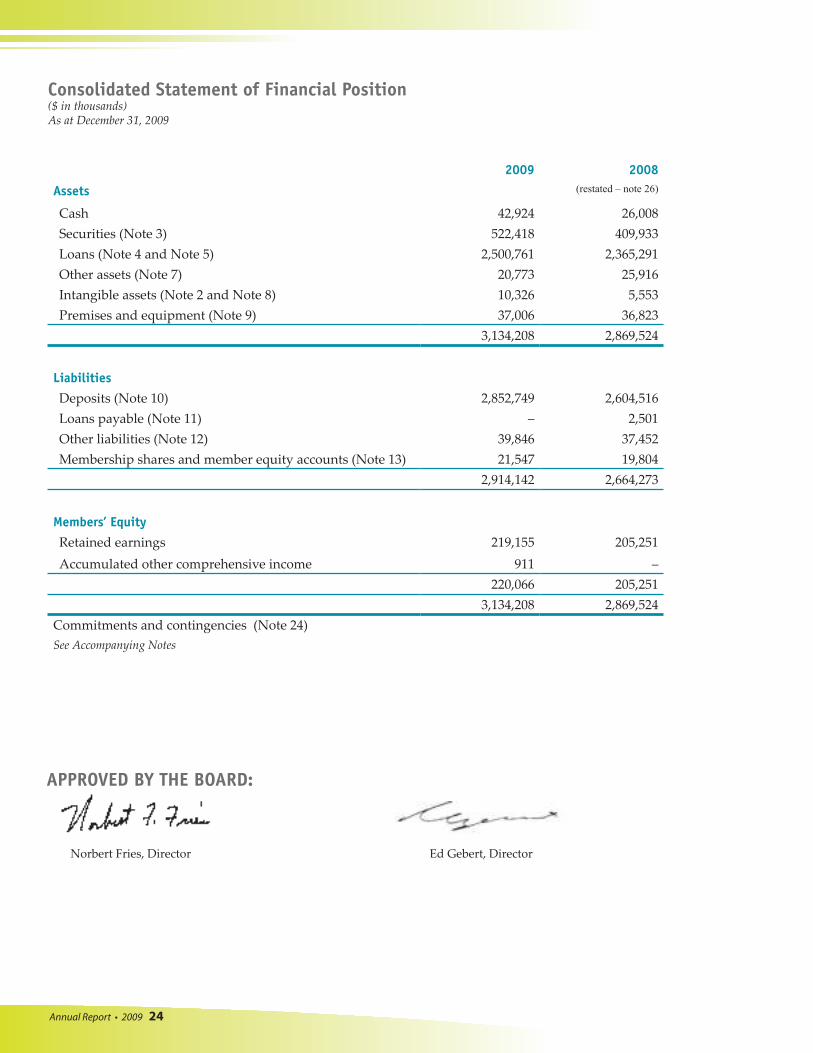
APPROVED BY THE BOARD:
Norbert Fries, Director Ed Gebert, Director
Consolidated Statement of Financial Position($ in thousands)As at December 31, 2009
2009 2008
Assets (restated – note 26)
Cash 42,924 26,008Securities (Note 3) 522,418 409,933Loans (Note 4 and Note 5) 2,500,761 2,365,291Other assets (Note 7) 20,773 25,916Intangible assets (Note 2 and Note 8) 10,326 5,553Premises and equipment (Note 9) 37,006 36,823
3,134,208 2,869,524
Liabilities
Deposits (Note 10) 2,852,749 2,604,516Loans payable (Note 11) – 2,501Other liabilities (Note 12) 39,846 37,452Membership shares and member equity accounts (Note 13) 21,547 19,804
2,914,142 2,664,273
Members’ Equity
Retained earnings 219,155 205,251Accumulated other comprehensive income 911 –
220,066 205,251 3,134,208 2,869,524
Commitments and contingencies (Note 24)See Accompanying Notes
Annual Report • 2009 25
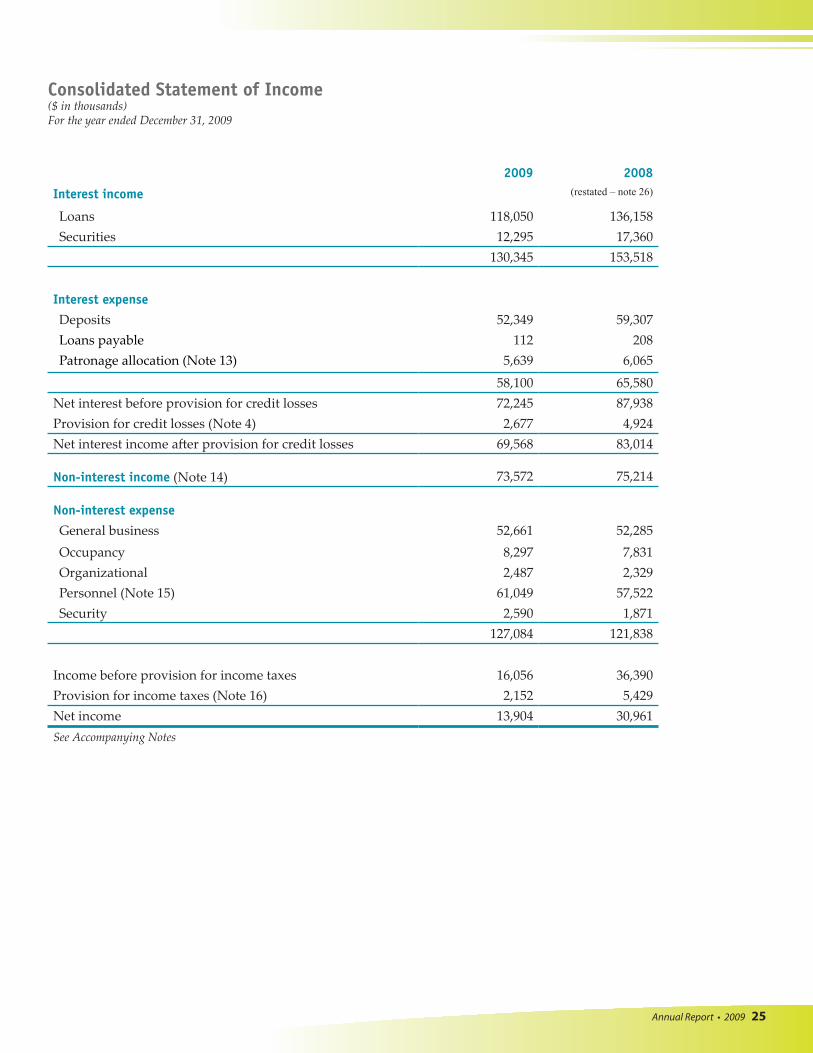
2009 2008
Interest income (restated – note 26)
Loans 118,050 136,158Securities 12,295 17,360
130,345 153,518
Interest expense
Deposits 52,349 59,307Loans payable 112 208Patronage allocation (Note 13) 5,639 6,065
58,100 65,580Net interest before provision for credit losses 72,245 87,938Provision for credit losses (Note 4) 2,677 4,924Net interest income after provision for credit losses 69,568 83,014
Non-interest income (Note 14) 73,572 75,214
Non-interest expense
General business 52,661 52,285Occupancy 8,297 7,831Organizational 2,487 2,329Personnel (Note 15) 61,049 57,522Security 2,590 1,871
127,084 121,838
Income before provision for income taxes 16,056 36,390Provision for income taxes (Note 16) 2,152 5,429Net income 13,904 30,961See Accompanying Notes
Consolidated Statement of Income ($ in thousands)For the year ended December 31, 2009
Annual Report • 2009 26
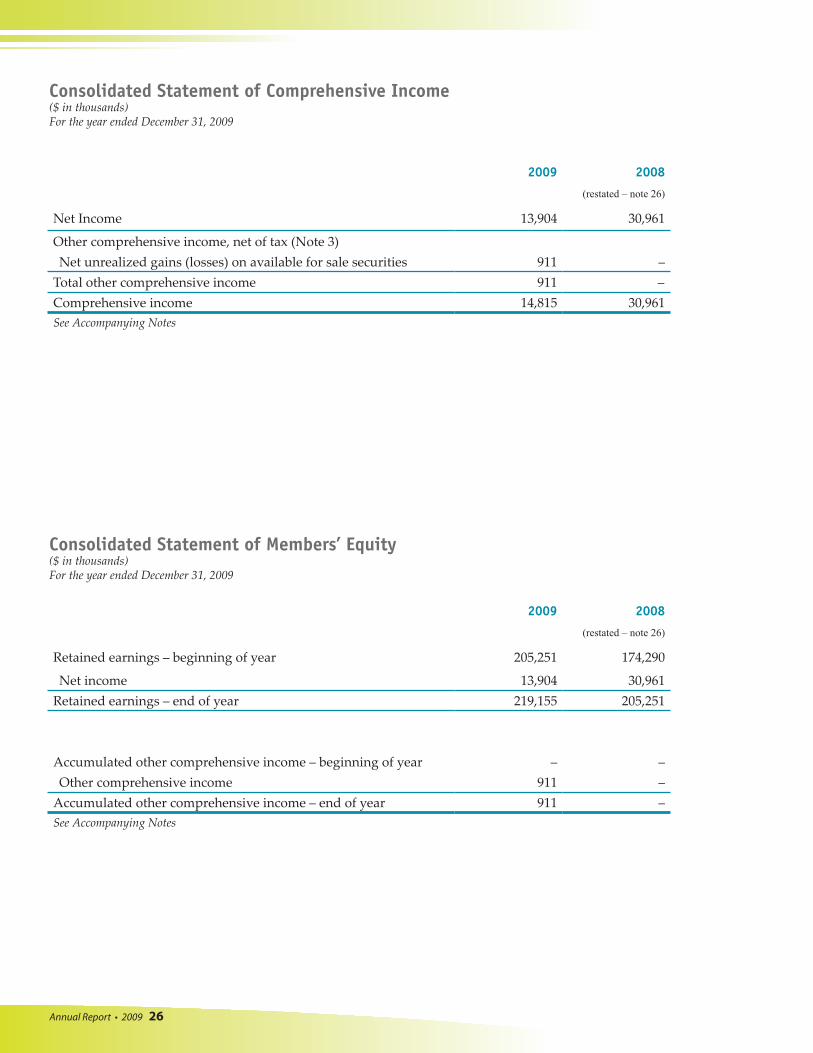
2009 2008
(restated – note 26)
Net Income 13,904 30,961
Other comprehensive income, net of tax (Note 3)Net unrealized gains (losses) on available for sale securities 911 –
Total other comprehensive income 911 –Comprehensive income 14,815 30,961See Accompanying Notes
Consolidated Statement of Comprehensive Income($ in thousands)For the year ended December 31, 2009
2009 2008
(restated – note 26)
Retained earnings – beginning of year 205,251 174,290
Net income 13,904 30,961Retained earnings – end of year 219,155 205,251
Accumulated other comprehensive income – beginning of year – –Other comprehensive income 911 –
Accumulated other comprehensive income – end of year 911 –See Accompanying Notes
Consolidated Statement of Members’ Equity($ in thousands)For the year ended December 31, 2009
Annual Report • 2009 27
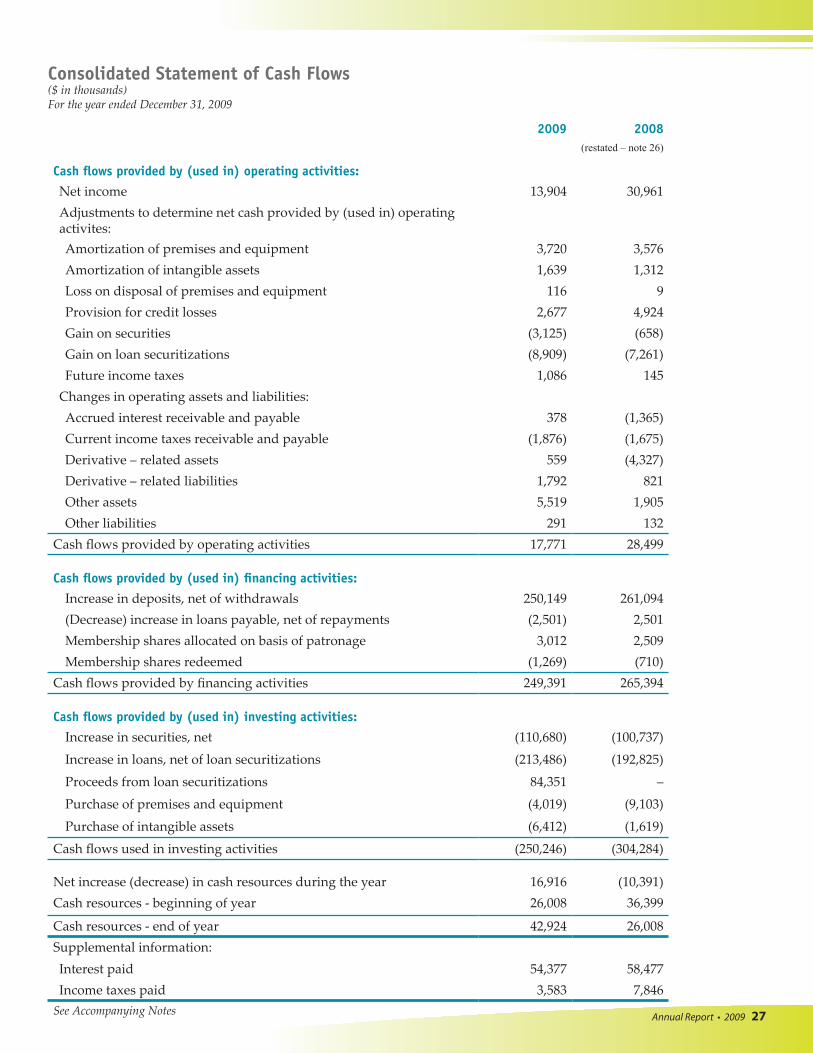
2009 2008(restated – note 26)
Cash flows provided by (used in) operating activities:
Net income 13,904 30,961Adjustments to determine net cash provided by (used in) operating activites:Amortization of premises and equipment 3,720 3,576Amortization of intangible assets 1,639 1,312Loss on disposal of premises and equipment 116 9Provision for credit losses 2,677 4,924Gain on securities (3,125) (658)Gain on loan securitizations (8,909) (7,261)Future income taxes 1,086 145
Changes in operating assets and liabilities:Accrued interest receivable and payable 378 (1,365)Current income taxes receivable and payable (1,876) (1,675)Derivative – related assets 559 (4,327)Derivative – related liabilities 1,792 821Other assets 5,519 1,905Other liabilities 291 132
Cash flows provided by operating activities 17,771 28,499
Cash flows provided by (used in) financing activities:
Increase in deposits, net of withdrawals 250,149 261,094(Decrease) increase in loans payable, net of repayments (2,501) 2,501Membership shares allocated on basis of patronage 3,012 2,509Membership shares redeemed (1,269) (710)
Cash flows provided by financing activities 249,391 265,394
Cash flows provided by (used in) investing activities:
Increase in securities, net (110,680) (100,737)
Increase in loans, net of loan securitizations (213,486) (192,825)
Proceeds from loan securitizations 84,351 –
Purchase of premises and equipment (4,019) (9,103)
Purchase of intangible assets (6,412) (1,619)
Cash flows used in investing activities (250,246) (304,284)
Net increase (decrease) in cash resources during the year 16,916 (10,391)Cash resources - beginning of year 26,008 36,399
Cash resources - end of year 42,924 26,008Supplemental information:Interest paid 54,377 58,477Income taxes paid 3,583 7,846
See Accompanying Notes
Consolidated Statement of Cash Flows($ in thousands)For the year ended December 31, 2009
Annual Report • 2009 28
Notes to Consolidated Financial Statements($ in thousands)For the year ended December 31, 2009
1. INCORPORATION AND GOVERNING LEGISLATION
Conexus Credit Union (the Credit Union), was established and continued pursuant to The Credit Union Act, 1998 of the Province of Saskatchewan. The Credit Union serves members and non-members in the Province of Saskatchewan with the Head Office located in Regina. Credit Union Deposit Guarantee Corporation (CUDGC), a corporation established in provincial legislation, guarantees the full repayment of all deposits held with Saskatchewan credit unions. The Credit Union Act, 1998, provides the deposit guarantee and the authority for CUDGC to regulate Saskatchewan credit unions.
2. SUMMARY OF SIGNIFICANT ACCOUNTING POLICIES
These consolidated financial statements have been prepared in accordance with the applicable governing legislation for each entity, which conform in all material respects to Canadian generally accepted accounting principles (GAAP). The preparation of financial statements requires management to make estimates and assumptions that affect the reported amounts of assets, liabilities, income and expenses. Actual results could differ from those estimates. The significant accounting policies adopted by the Credit Union include:
Basis of consolidation The consolidated financial statements contain the assets, liabilities, income and expenses of subsidiaries after
eliminating inter-company transactions and balances. Securities, in which the Credit Union does not control, but exercises significant influence, are accounted for using the equity method. Under this method, the Credit Union records its initial investment at cost and then records its equity share of any net income or loss. Dividends received are recorded as a reduction of the investment, which is included in securities in the Consolidated Statement of Financial Position.
Included in the consolidated financial statements are the following entities:
Subsidiaries The Credit Union has 100% interest in CENTURY 21 Conexus Realty Ltd., CENTUM Canada Mortgage Direct Ltd.,
Conexus Insurance Ltd. and Protexus Holdings Corp.
Significant influence investments The Credit Union has a 40% ownership in CU Dealer Finance Corp and a 33.33% ownership in APEX Investment Group.
Significant accounting changes Goodwill and intangible assets
In 2009, the Credit Union adopted Canadian Institute of Chartered Accountants (CICA) Handbook Section 3064, Goodwill and Intangible Assets which replaces Section 3062, Goodwill and Other Intangible Assets and resulted in the withdrawal of Section 3450, Research and Development Costs. Section 3064, provides guidance on the criteria that must be satisfied in order for an intangible asset to be recognized, including internally developed intangible assets. As a result of adopting Section 3064, the Credit Union has reclassified software from premises and equipment to intangible assets on the Consolidated Statement of Financial Position. The adoption of Section 3064 did not impact the corresponding amortization recorded in general business on the Consolidated Statement of Income.
Credit risk and the fair value of financial assets and financial liabilities In January 2009, the CICA issued Abstract No. 173, Credit Risk and the Fair Value of Financial Assets and Financial Liabilities (EIC-173). EIC-173 requires an entity to take into account its own credit risk and the credit risk of counterparties when determining the fair value of financial assets and financial liabilities, including derivative instruments, and is required to be applied retrospectively without restatement. The application of EIC-173 did not have an impact on the Credit Union’s financial position or results of operations.
Financial instruments - disclosures In June 2009, the CICA amended Handbook Section 3862, Financial Instruments – Disclosures, to enhance disclosures
about fair value measurements and about the liquidity risk for financial instruments. The Credit Union is required to classify and disclose fair value measurements using a three-tier fair value hierarchy based on the lowest level input that is significant to that fair value measurement. As a result of adopting this amendment new disclosure is provided in Note 21.
Annual Report • 2009 29
Notes to Consolidated Financial Statements($ in thousands)For the year ended December 31, 2009
2. SUMMARY OF SIGNIFICANT ACCOUNTING POLICIES (continued) The Credit Union is required to disclose maturity analysis for derivative and non-derivative financial liabilities based on
how the Credit Union manages its liquidity risk. As a result of adopting this amendment new disclosure is provided in Note 23.
The adoption of these amendments did not have a material impact on the Credit Union’s consolidated financial statements.
Financial instruments - recognition and measurement
In August 2009, the CICA issued various amendments to Section 3855 which eliminated the distinction between debt securities and other debt instruments and changed the categories to which debt instruments are required or are permitted to be classified. As a result of these amendments non-derivative financial assets with fixed payments that are not quoted in an active market may be classified as loans and receivable; loans and receivables for which the holder may not recover substantially all of its initial investment, other than because of credit deterioration, must be classified as available for sale; and loans and receivables, on origination, that an entity intends to sell immediately or in the near term must be classified as held for trading.
The adoption of these amendments did not have a material impact on the Credit Union’s consolidated financial statements.
Classification and measurement of financial instruments The accounting standards for financial instruments require that all financial assets and liabilities be classified according
to their characteristics, management intentions, or the choice of category in certain circumstances. Financial assets can be classified as held for trading, held to maturity, available for sale, or as loans and receivables. Financial liabilities must be classified as other or held for trading. Upon initial recognition, all financial assets and liabilities are recorded at fair value on the Consolidated Statement of Financial Position. In subsequent periods, financial assets and liabilities held for trading are measured at fair value with gains and losses recognized in non-interest income. Financial assets held to maturity, loans and receivables, and financial liabilities, other than those held for trading, are measured at amortized cost. Available for sale instruments are measured at fair value with unrealized gains and losses recognized in other comprehensive income.
Although the standard allows any financial instrument to be irrevocably designated as held for trading, CUDGC, the
Credit Union’s regulator, has issued guidelines limiting the circumstances under which this option may be used. The Credit Union may use this option providing that: management of these financial instruments is in accordance with a documented risk management strategy; and if the fair values are reliable.
The Credit Union classifies fair value measurements recognized in the balance sheet using a three-tier fair value
hierarchy, which prioritizes the inputs used in measuring fair value as follows:
• Level 1: Valuation based on quoted prices (unadjusted) in active markets for identical assets or liabilities; • Level 2: Valuations based on inputs other than quoted prices in active markets that are observable for the asset or liability, either directly or indirectly; or • Level 3: Valuations based on unobservable inputs in which there is little or no market data, which require the
Credit Union to develop its own assumptions.
Fair value measurements are classified in the fair value hierarchy based on the lowest level input that is significant to thatfair value measurement. This assessment requires judgment, considering factors specific to an asset or a liability andmay affect placement within the fair value hierarchy.
Cash Cash consists of cash and cash equivalents maturing in one business day. Cash is classified as held for trading. Due to its
short-term nature, the recorded amount of cash and cash equivalents is considered to be the fair value.
Annual Report • 2009 30
Notes to Consolidated Financial Statements($ in thousands)For the year ended December 31, 2009
2. SUMMARY OF SIGNIFICANT ACCOUNTING POLICIES (continued) Securities Securities held for trading purposes are classified as held for trading (HFT) and recorded at fair value.
Securities held to maturity are financial assets the Credit Union has the intention and ability to hold to maturity. These securities are classified as held to maturity (HTM) and are measured at amortized cost, unless there is a permanent decline in value, in which case they would be measured at net realizable value.
Securities that are not classified as held for trading, or held to maturity, are classified as available for sale (AFS) and measured at fair value. The Credit Union reviews AFS securities for impairment and when declines in fair value are deemed to be other than temporary they would be measured at net realizable value. If the security is an equity instrument with no quoted market price, or if fair value cannot reliably be determined, the security is recorded at cost.
Loans Loans the Credit Union has no intention to sell immediately or in the near future are classified as loans and receivables, and are
recorded initially at fair value. Subsequently, they are measured at amortized cost, less any allowances for credit losses plus accrued interest. Loans the Credit Union, on origination, has the intention to sell immediately or in the near future are classified as held for trading (HFT) and recorded at fair value.
Loans are classified as impaired and the accrual of interest is discontinued when, in management’s judgment, there is no longer reasonable assurance that the principal and interest will be collected in full. The allowance for impaired loans is increased by the provision for credit losses, which is charged to income, and reduced by write-offs, net of recoveries.
The allowance is comprised of two components: specific allowances and general allowances, calculated as follows: (i) The Credit Union records specific allowances based on management’s regular review of individual loans. The estimated realizable amount represents management’s best estimate of the value of future payments it will
receive on each loan, discounted at the loan’s effective contractual interest rate. When management cannot reasonably determine the loan’s future cash flows, it bases its estimates on the current market value of the loan’s security net of expected selling costs.
(ii) The Credit Union records general allowances for certain groups of loans with similar characteristics, which are exposed to common impairment factors. A general allowance is determined based upon management’s judgment considering business and economic conditions, portfolio composition, historical credit performance, and other relevant indicators. The change in the net realizable value of these assets is recorded as a charge or credit to the provision for credit losses.
Foreclosed assets held for resale are initially recorded at the lower of the investment recorded in the impaired loan and its estimated net realizable value. Foreclosed assets held for resale are subsequently recorded at the lower of carrying value or fair value. Foreclosed assets are considered to be assets held in the course of realization of impaired loans.
Asset securitization The Credit Union securitizes groups of assets by selling them to an independent special purpose or qualifying special purpose entity
or trust. Such transactions create liquidity for the Credit Union and release capital for future needs. Securitization transactions are recognized as a sale and the assets are removed from the Consolidated Statement of Financial Position when the Credit Union has surrendered control over the assets and has received, in exchange, consideration other than beneficial interests in the transferred assets. For the surrender of control to occur, the transferred loans must be isolated from the Credit Union, the Credit Union does not maintain effective control over the transferred assets, and the purchaser must have a legal right to sell or pledge the transferred loans.
The Credit Union generally retains an interest in the securitized assets such as servicing rights, and various forms of recourse including over-collateralization, rights to excess spread and cash reserve accounts. Retained interests in securitized assets are classified as available for sale (AFS) and held as securities on the Consolidated Statement of Financial Position. Gains and losses on retained interests are recognized in non-interest income on the date of the transaction. The amount of the gain or loss recognized depends on the previous carrying value of the receivables involved in the transfer, allocated between the assets sold and retained interests based on their relative fair values at the date of the transfer. As market quotes are usually not available, gains and losses are recorded at fair value as determined by estimating the present value of future expected cash flows using estimates of key assumptions on yield, credit losses, prepayment rates, discount rates, and cost of funds. Any estimate adjustments to the key assumptions will result in changes to the fair value of gains and losses. Changes in fair value of gains and losses deemed to be temporary are recorded in other comprehensive income and those deemed to be other than temporary are recorded in non-interest income.
Annual Report • 2009 31
Notes to Consolidated Financial Statements($ in thousands)For the year ended December 31, 2009
2. SUMMARY OF SIGNIFICANT ACCOUNTING POLICIES (continued)
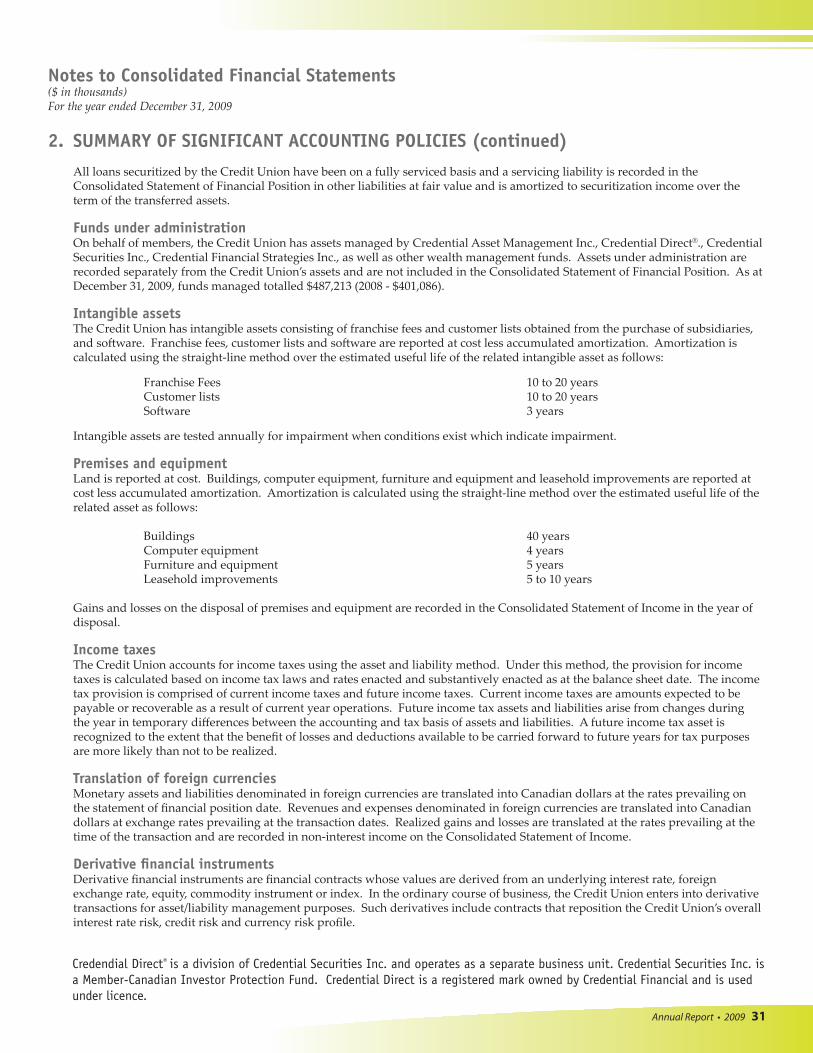
All loans securitized by the Credit Union have been on a fully serviced basis and a servicing liability is recorded in the Consolidated Statement of Financial Position in other liabilities at fair value and is amortized to securitization income over the term of the transferred assets.
Funds under administration On behalf of members, the Credit Union has assets managed by Credential Asset Management Inc., Credential Direct®., Credential
Securities Inc., Credential Financial Strategies Inc., as well as other wealth management funds. Assets under administration are recorded separately from the Credit Union’s assets and are not included in the Consolidated Statement of Financial Position. As at December 31, 2009, funds managed totalled $487,213 (2008 - $401,086).
Intangible assets The Credit Union has intangible assets consisting of franchise fees and customer lists obtained from the purchase of subsidiaries,
and software. Franchise fees, customer lists and software are reported at cost less accumulated amortization. Amortization is calculated using the straight-line method over the estimated useful life of the related intangible asset as follows:
Franchise Fees 10 to 20 years Customer lists 10 to 20 years Software 3 years
Intangible assets are tested annually for impairment when conditions exist which indicate impairment.
Premises and equipment Land is reported at cost. Buildings, computer equipment, furniture and equipment and leasehold improvements are reported at
cost less accumulated amortization. Amortization is calculated using the straight-line method over the estimated useful life of the related asset as follows:
Buildings 40 years Computer equipment 4 years Furniture and equipment 5 years Leasehold improvements 5 to 10 years
Gains and losses on the disposal of premises and equipment are recorded in the Consolidated Statement of Income in the year of disposal.
Income taxes The Credit Union accounts for income taxes using the asset and liability method. Under this method, the provision for income
taxes is calculated based on income tax laws and rates enacted and substantively enacted as at the balance sheet date. The income tax provision is comprised of current income taxes and future income taxes. Current income taxes are amounts expected to be payable or recoverable as a result of current year operations. Future income tax assets and liabilities arise from changes during the year in temporary differences between the accounting and tax basis of assets and liabilities. A future income tax asset is recognized to the extent that the benefit of losses and deductions available to be carried forward to future years for tax purposes are more likely than not to be realized.
Translation of foreign currencies Monetary assets and liabilities denominated in foreign currencies are translated into Canadian dollars at the rates prevailing on
the statement of financial position date. Revenues and expenses denominated in foreign currencies are translated into Canadian dollars at exchange rates prevailing at the transaction dates. Realized gains and losses are translated at the rates prevailing at the time of the transaction and are recorded in non-interest income on the Consolidated Statement of Income.
Derivative financial instruments Derivative financial instruments are financial contracts whose values are derived from an underlying interest rate, foreign
exchange rate, equity, commodity instrument or index. In the ordinary course of business, the Credit Union enters into derivative transactions for asset/liability management purposes. Such derivatives include contracts that reposition the Credit Union’s overall interest rate risk, credit risk and currency risk profile.
CredendialDirect®isadivisionofCredentialSecuritiesInc.andoperatesasaseparatebusinessunit.CredentialSecuritiesInc.isaMember-CanadianInvestorProtectionFund.CredentialDirectisaregisteredmarkownedbyCredentialFinancialandisusedunderlicence.
Annual Report • 2009 32
Notes to Consolidated Financial Statements($ in thousands)For the year ended December 31, 2009
2. SUMMARY OF SIGNIFICANT ACCOUNTING POLICIES (continued)
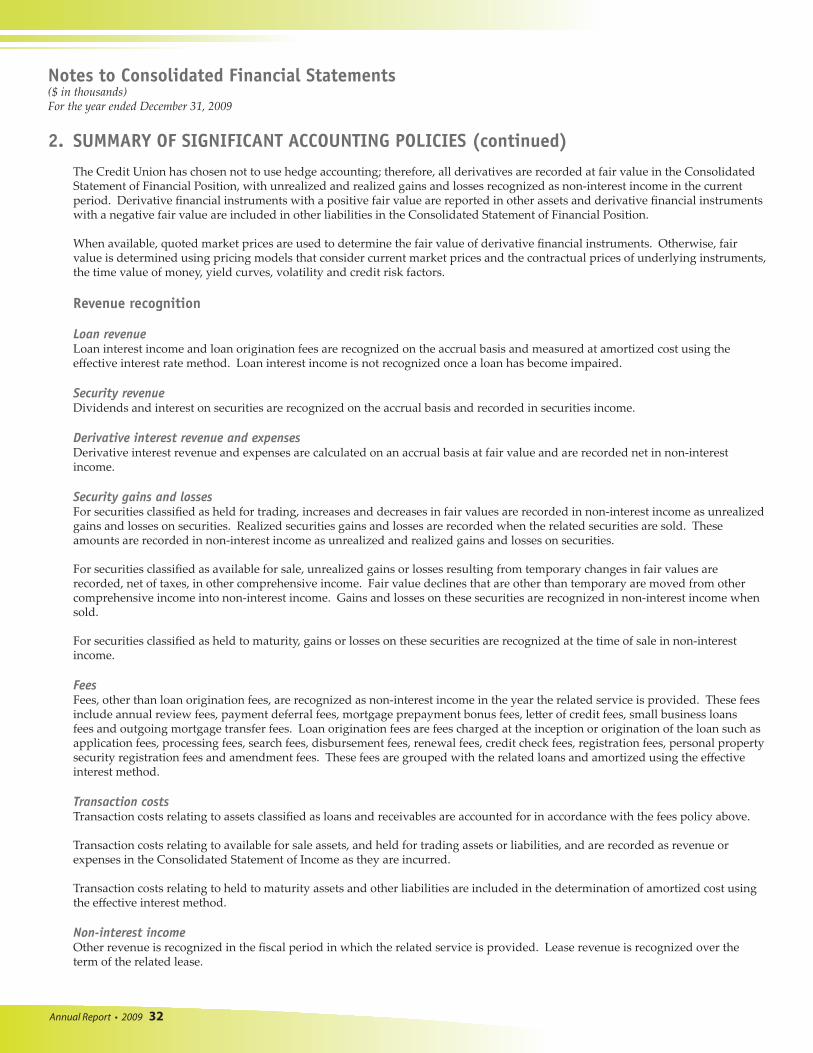
The Credit Union has chosen not to use hedge accounting; therefore, all derivatives are recorded at fair value in the Consolidated Statement of Financial Position, with unrealized and realized gains and losses recognized as non-interest income in the current period. Derivative financial instruments with a positive fair value are reported in other assets and derivative financial instruments with a negative fair value are included in other liabilities in the Consolidated Statement of Financial Position.
When available, quoted market prices are used to determine the fair value of derivative financial instruments. Otherwise, fair value is determined using pricing models that consider current market prices and the contractual prices of underlying instruments, the time value of money, yield curves, volatility and credit risk factors.
Revenue recognition Loan revenue Loan interest income and loan origination fees are recognized on the accrual basis and measured at amortized cost using the
effective interest rate method. Loan interest income is not recognized once a loan has become impaired. Security revenue Dividends and interest on securities are recognized on the accrual basis and recorded in securities income. Derivative interest revenue and expenses Derivative interest revenue and expenses are calculated on an accrual basis at fair value and are recorded net in non-interest
income.
Security gains and losses For securities classified as held for trading, increases and decreases in fair values are recorded in non-interest income as unrealized
gains and losses on securities. Realized securities gains and losses are recorded when the related securities are sold. These amounts are recorded in non-interest income as unrealized and realized gains and losses on securities.
For securities classified as available for sale, unrealized gains or losses resulting from temporary changes in fair values are recorded, net of taxes, in other comprehensive income. Fair value declines that are other than temporary are moved from other comprehensive income into non-interest income. Gains and losses on these securities are recognized in non-interest income when sold.
For securities classified as held to maturity, gains or losses on these securities are recognized at the time of sale in non-interest income.
Fees Fees, other than loan origination fees, are recognized as non-interest income in the year the related service is provided. These fees
include annual review fees, payment deferral fees, mortgage prepayment bonus fees, letter of credit fees, small business loans fees and outgoing mortgage transfer fees. Loan origination fees are fees charged at the inception or origination of the loan such as application fees, processing fees, search fees, disbursement fees, renewal fees, credit check fees, registration fees, personal property security registration fees and amendment fees. These fees are grouped with the related loans and amortized using the effective interest method.
Transaction costs Transaction costs relating to assets classified as loans and receivables are accounted for in accordance with the fees policy above. Transaction costs relating to available for sale assets, and held for trading assets or liabilities, and are recorded as revenue or
expenses in the Consolidated Statement of Income as they are incurred. Transaction costs relating to held to maturity assets and other liabilities are included in the determination of amortized cost using
the effective interest method.
Non-interest income Other revenue is recognized in the fiscal period in which the related service is provided. Lease revenue is recognized over the
term of the related lease.
Annual Report • 2009 33
Notes to Consolidated Financial Statements($ in thousands)For the year ended December 31, 2009
3. SECURITIES
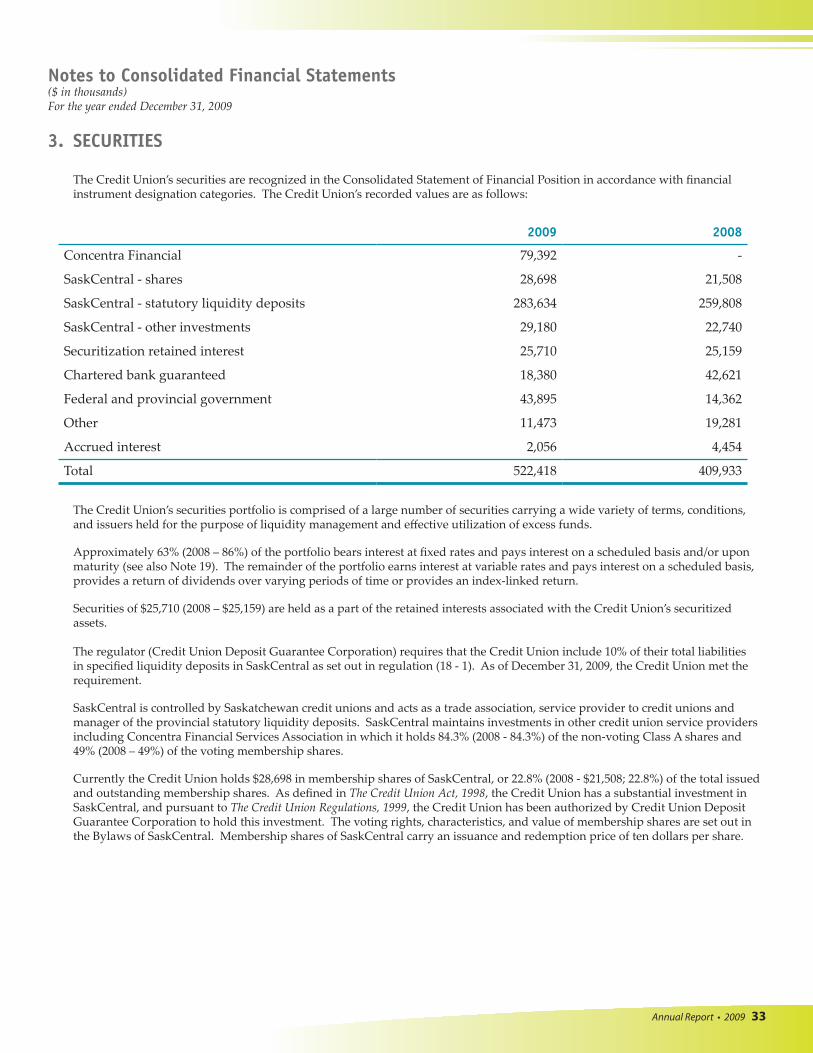
The Credit Union’s securities are recognized in the Consolidated Statement of Financial Position in accordance with financial instrument designation categories. The Credit Union’s recorded values are as follows:
The Credit Union’s securities portfolio is comprised of a large number of securities carrying a wide variety of terms, conditions, and issuers held for the purpose of liquidity management and effective utilization of excess funds.
Approximately 63% (2008 – 86%) of the portfolio bears interest at fixed rates and pays interest on a scheduled basis and/or upon maturity (see also Note 19). The remainder of the portfolio earns interest at variable rates and pays interest on a scheduled basis, provides a return of dividends over varying periods of time or provides an index-linked return.
Securities of $25,710 (2008 – $25,159) are held as a part of the retained interests associated with the Credit Union’s securitized assets.
The regulator (Credit Union Deposit Guarantee Corporation) requires that the Credit Union include 10% of their total liabilities in specified liquidity deposits in SaskCentral as set out in regulation (18 - 1). As of December 31, 2009, the Credit Union met the requirement.
SaskCentral is controlled by Saskatchewan credit unions and acts as a trade association, service provider to credit unions and manager of the provincial statutory liquidity deposits. SaskCentral maintains investments in other credit union service providers including Concentra Financial Services Association in which it holds 84.3% (2008 - 84.3%) of the non-voting Class A shares and 49% (2008 – 49%) of the voting membership shares.
Currently the Credit Union holds $28,698 in membership shares of SaskCentral, or 22.8% (2008 - $21,508; 22.8%) of the total issued and outstanding membership shares. As defined in The Credit Union Act, 1998, the Credit Union has a substantial investment in SaskCentral, and pursuant to The Credit Union Regulations, 1999, the Credit Union has been authorized by Credit Union Deposit Guarantee Corporation to hold this investment. The voting rights, characteristics, and value of membership shares are set out in the Bylaws of SaskCentral. Membership shares of SaskCentral carry an issuance and redemption price of ten dollars per share.
2009 2008
Concentra Financial 79,392 -
SaskCentral - shares 28,698 21,508
SaskCentral - statutory liquidity deposits 283,634 259,808
SaskCentral - other investments 29,180 22,740
Securitization retained interest 25,710 25,159
Chartered bank guaranteed 18,380 42,621
Federal and provincial government 43,895 14,362
Other 11,473 19,281
Accrued interest 2,056 4,454
Total 522,418 409,933
Annual Report • 2009 34
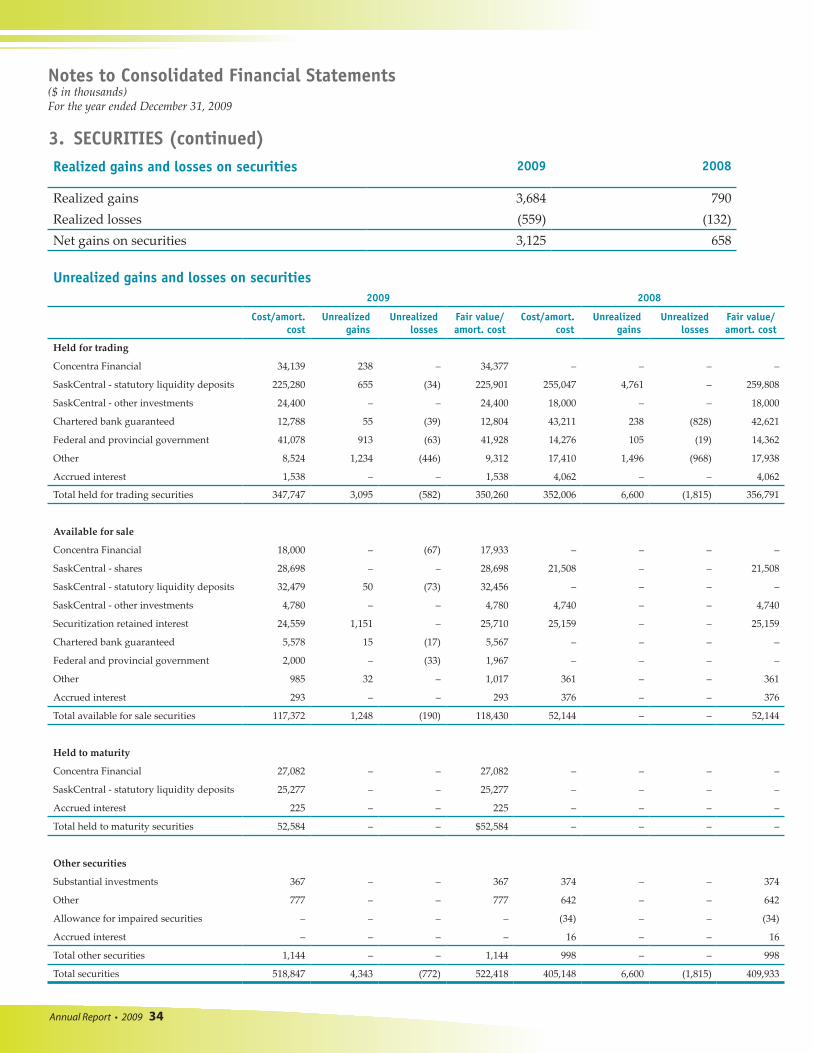
Unrealized gains and losses on securities 2009 2008
Cost/amort. cost
Unrealized gains
Unrealizedlosses
Fair value/ amort. cost
Cost/amort. cost
Unrealized gains
Unrealizedlosses
Fair value/ amort. cost
Held for trading
Concentra Financial 34,139 238 – 34,377 – – – –
SaskCentral - statutory liquidity deposits 225,280 655 (34) 225,901 255,047 4,761 – 259,808
SaskCentral - other investments 24,400 – – 24,400 18,000 – – 18,000
Chartered bank guaranteed 12,788 55 (39) 12,804 43,211 238 (828) 42,621
Federal and provincial government 41,078 913 (63) 41,928 14,276 105 (19) 14,362
Other 8,524 1,234 (446) 9,312 17,410 1,496 (968) 17,938
Accrued interest 1,538 – – 1,538 4,062 – – 4,062
Total held for trading securities 347,747 3,095 (582) 350,260 352,006 6,600 (1,815) 356,791
Available for sale
Concentra Financial 18,000 – (67) 17,933 – – – –
SaskCentral - shares 28,698 – – 28,698 21,508 – – 21,508
SaskCentral - statutory liquidity deposits 32,479 50 (73) 32,456 – – – –
SaskCentral - other investments 4,780 – – 4,780 4,740 – – 4,740
Securitization retained interest 24,559 1,151 – 25,710 25,159 – – 25,159
Chartered bank guaranteed 5,578 15 (17) 5,567 – – – –
Federal and provincial government 2,000 – (33) 1,967 – – – –
Other 985 32 – 1,017 361 – – 361
Accrued interest 293 – – 293 376 – – 376
Total available for sale securities 117,372 1,248 (190) 118,430 52,144 – – 52,144
Held to maturity
Concentra Financial 27,082 – – 27,082 – – – –
SaskCentral - statutory liquidity deposits 25,277 – – 25,277 – – – –
Accrued interest 225 – – 225 – – – –
Total held to maturity securities 52,584 – – $52,584 – – – –
Other securities
Substantial investments 367 – – 367 374 – – 374
Other 777 – – 777 642 – – 642
Allowance for impaired securities – – – – (34) – – (34)
Accrued interest – – – – 16 – – 16
Total other securities 1,144 – – 1,144 998 – – 998
Total securities 518,847 4,343 (772) 522,418 405,148 6,600 (1,815) 409,933
Realized gains and losses on securities 2009 2008
Realized gains 3,684 790Realized losses (559) (132)Net gains on securities 3,125 658
Notes to Consolidated Financial Statements($ in thousands)For the year ended December 31, 2009
3. SECURITIES (continued)
Annual Report • 2009 35
Notes to Consolidated Financial Statements($ in thousands)For the year ended December 31, 2009
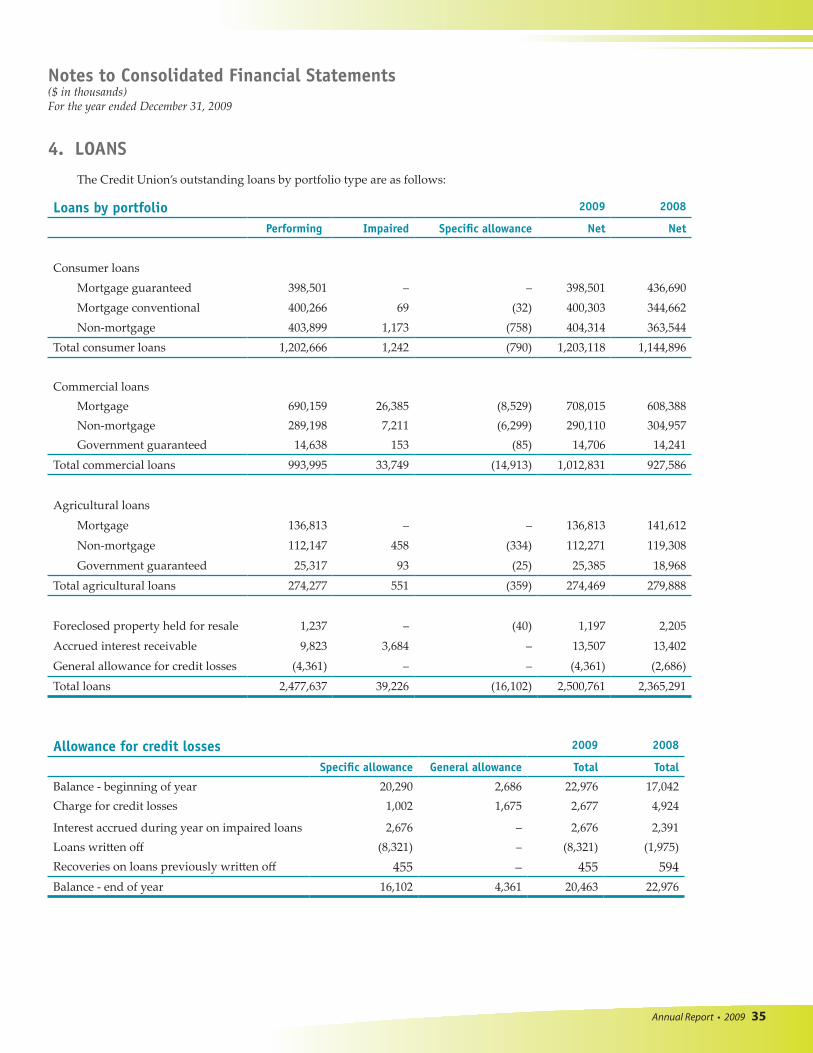
4. LOANS
The Credit Union’s outstanding loans by portfolio type are as follows:
Loans by portfolio 2009 2008
Performing Impaired Specific allowance Net Net
Consumer loansMortgage guaranteed 398,501 – – 398,501 436,690Mortgage conventional 400,266 69 (32) 400,303 344,662Non-mortgage 403,899 1,173 (758) 404,314 363,544
Total consumer loans 1,202,666 1,242 (790) 1,203,118 1,144,896
Commercial loansMortgage 690,159 26,385 (8,529) 708,015 608,388Non-mortgage 289,198 7,211 (6,299) 290,110 304,957Government guaranteed 14,638 153 (85) 14,706 14,241
Total commercial loans 993,995 33,749 (14,913) 1,012,831 927,586
Agricultural loans
Mortgage 136,813 – – 136,813 141,612
Non-mortgage 112,147 458 (334) 112,271 119,308
Government guaranteed 25,317 93 (25) 25,385 18,968
Total agricultural loans 274,277 551 (359) 274,469 279,888
Foreclosed property held for resale 1,237 – (40) 1,197 2,205
Accrued interest receivable 9,823 3,684 – 13,507 13,402
General allowance for credit losses (4,361) – – (4,361) (2,686)
Total loans 2,477,637 39,226 (16,102) 2,500,761 2,365,291
Allowance for credit losses 2009 2008
Specific allowance General allowance Total Total
Balance - beginning of year 20,290 2,686 22,976 17,042Charge for credit losses 1,002 1,675 2,677 4,924
Interest accrued during year on impaired loans 2,676 – 2,676 2,391Loans written off (8,321) – (8,321) (1,975)Recoveries on loans previously written off 455 – 455 594Balance - end of year 16,102 4,361 20,463 22,976
Annual Report • 2009 36
Notes to Consolidated Financial Statements($ in thousands)For the year ended December 31, 2009
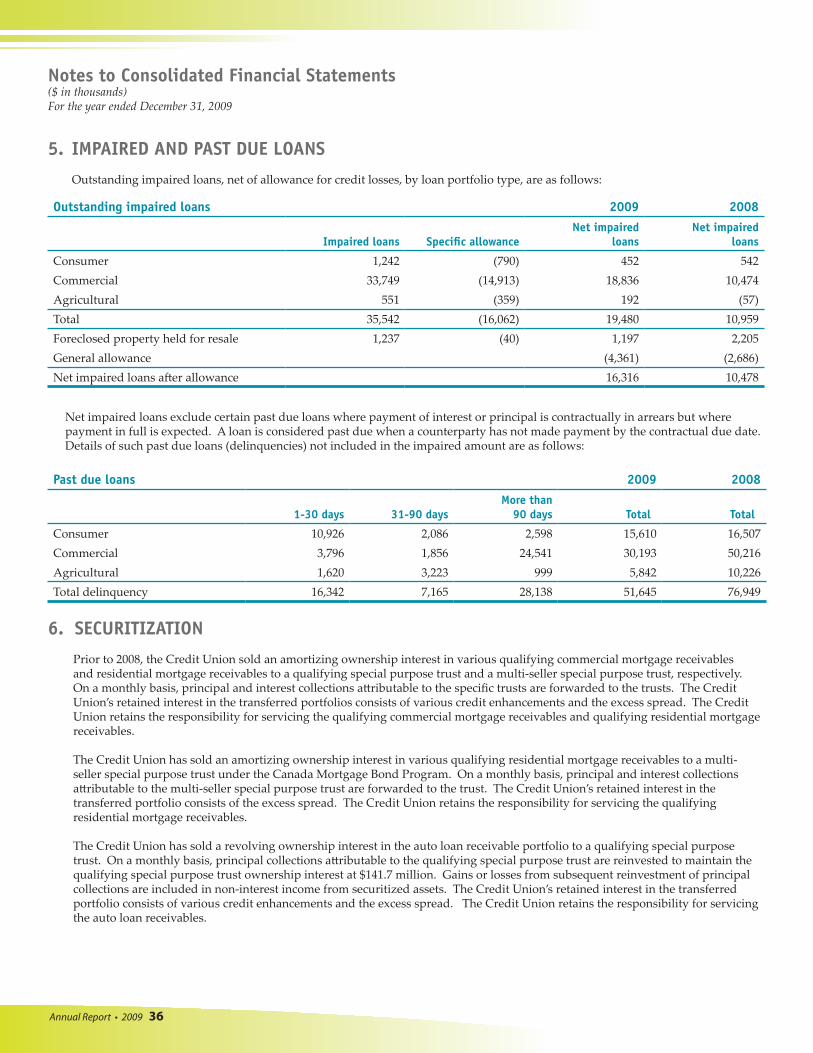
5. IMPAIRED AND PAST DUE LOANS
Outstanding impaired loans, net of allowance for credit losses, by loan portfolio type, are as follows:
Net impaired loans exclude certain past due loans where payment of interest or principal is contractually in arrears but where payment in full is expected. A loan is considered past due when a counterparty has not made payment by the contractual due date. Details of such past due loans (delinquencies) not included in the impaired amount are as follows:
Outstanding impaired loans 2009 2008
Impaired loans Specific allowanceNet impaired
loansNet impaired
loans
Consumer 1,242 (790) 452 542Commercial 33,749 (14,913) 18,836 10,474Agricultural 551 (359) 192 (57)Total 35,542 (16,062) 19,480 10,959Foreclosed property held for resale 1,237 (40) 1,197 2,205General allowance (4,361) (2,686)Net impaired loans after allowance 16,316 10,478
Past due loans 2009 2008
1-30 days 31-90 daysMore than
90 days Total Total
Consumer 10,926 2,086 2,598 15,610 16,507Commercial 3,796 1,856 24,541 30,193 50,216Agricultural 1,620 3,223 999 5,842 10,226Total delinquency 16,342 7,165 28,138 51,645 76,949
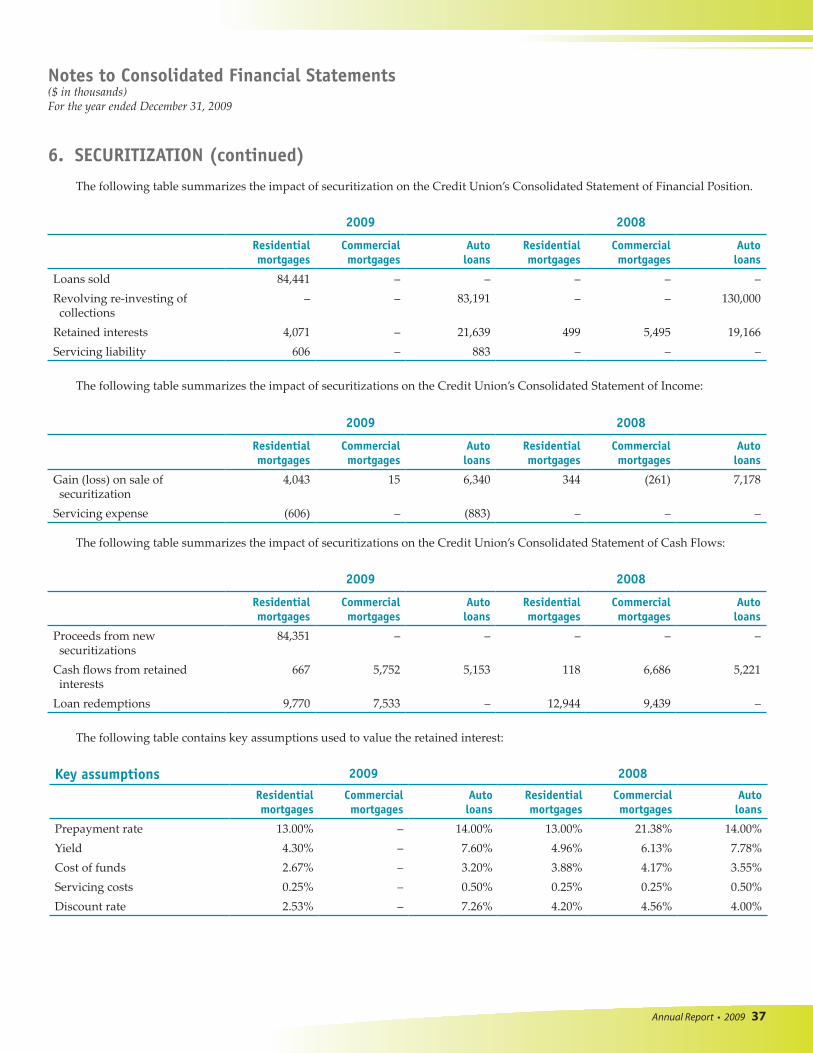
6. SECURITIZATION Prior to 2008, the Credit Union sold an amortizing ownership interest in various qualifying commercial mortgage receivables
and residential mortgage receivables to a qualifying special purpose trust and a multi-seller special purpose trust, respectively. On a monthly basis, principal and interest collections attributable to the specific trusts are forwarded to the trusts. The Credit Union’s retained interest in the transferred portfolios consists of various credit enhancements and the excess spread. The Credit Union retains the responsibility for servicing the qualifying commercial mortgage receivables and qualifying residential mortgage receivables.
The Credit Union has sold an amortizing ownership interest in various qualifying residential mortgage receivables to a multi-seller special purpose trust under the Canada Mortgage Bond Program. On a monthly basis, principal and interest collections attributable to the multi-seller special purpose trust are forwarded to the trust. The Credit Union’s retained interest in the transferred portfolio consists of the excess spread. The Credit Union retains the responsibility for servicing the qualifying residential mortgage receivables.
The Credit Union has sold a revolving ownership interest in the auto loan receivable portfolio to a qualifying special purpose trust. On a monthly basis, principal collections attributable to the qualifying special purpose trust are reinvested to maintain the qualifying special purpose trust ownership interest at $141.7 million. Gains or losses from subsequent reinvestment of principal collections are included in non-interest income from securitized assets. The Credit Union’s retained interest in the transferred portfolio consists of various credit enhancements and the excess spread. The Credit Union retains the responsibility for servicing the auto loan receivables.
Annual Report • 2009 37
2009 2008
Residential mortgages
Commercial mortgages
Autoloans
Residential mortgages
Commercial mortgages
Autoloans
Loans sold 84,441 – – – – –Revolving re-investing of collections
– – 83,191 – – 130,000
Retained interests 4,071 – 21,639 499 5,495 19,166Servicing liability 606 – 883 – – –
The following table summarizes the impact of securitizations on the Credit Union’s Consolidated Statement of Income:
Key assumptions 2009 2008
Residential mortgages
Commercial mortgages
Autoloans
Residential mortgages
Commercial mortgages
Autoloans
Prepayment rate 13.00% – 14.00% 13.00% 21.38% 14.00%Yield 4.30% – 7.60% 4.96% 6.13% 7.78%Cost of funds 2.67% – 3.20% 3.88% 4.17% 3.55%Servicing costs 0.25% – 0.50% 0.25% 0.25% 0.50%Discount rate 2.53% – 7.26% 4.20% 4.56% 4.00%
2009 2008
Residential mortgages
Commercial mortgages
Autoloans
Residential mortgages
Commercial mortgages
Autoloans
Gain (loss) on sale of securitization
4,043 15 6,340 344 (261) 7,178
Servicing expense (606) – (883) – – –
The following table summarizes the impact of securitizations on the Credit Union’s Consolidated Statement of Cash Flows:
2009 2008
Residential mortgages
Commercial mortgages
Autoloans
Residential mortgages
Commercial mortgages
Autoloans
Proceeds from newsecuritizations
84,351 – – – – –
Cash flows from retainedinterests
667 5,752 5,153 118 6,686 5,221
Loan redemptions 9,770 7,533 – 12,944 9,439 –
The following table contains key assumptions used to value the retained interest:
Notes to Consolidated Financial Statements($ in thousands)For the year ended December 31, 2009
6. SECURITIZATION (continued)
The following table summarizes the impact of securitization on the Credit Union’s Consolidated Statement of Financial Position.
Annual Report • 2009 38
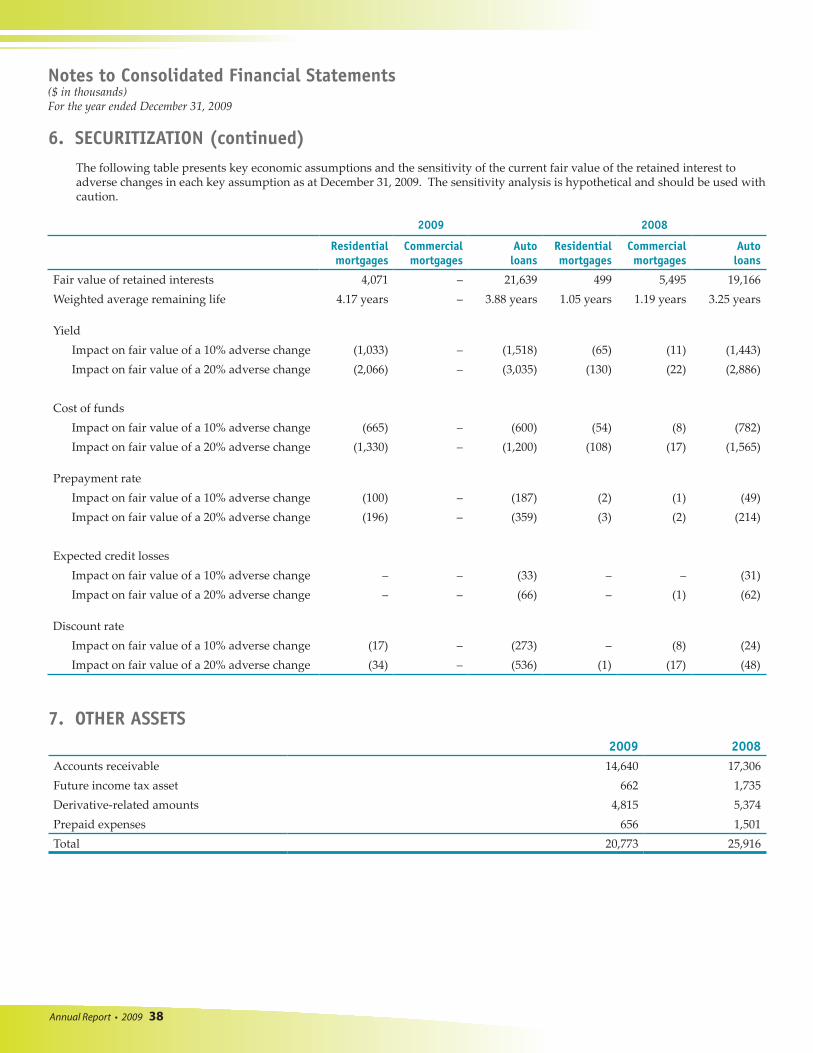
2009 2008
Residential mortgages
Commercial mortgages
Autoloans
Residential mortgages
Commercial mortgages
Autoloans
Fair value of retained interests 4,071 – 21,639 499 5,495 19,166Weighted average remaining life 4.17 years – 3.88 years 1.05 years 1.19 years 3.25 years
YieldImpact on fair value of a 10% adverse change (1,033) – (1,518) (65) (11) (1,443)Impact on fair value of a 20% adverse change (2,066) – (3,035) (130) (22) (2,886)
Cost of fundsImpact on fair value of a 10% adverse change (665) – (600) (54) (8) (782)Impact on fair value of a 20% adverse change (1,330) – (1,200) (108) (17) (1,565)
Prepayment rate Impact on fair value of a 10% adverse change (100) – (187) (2) (1) (49)Impact on fair value of a 20% adverse change (196) – (359) (3) (2) (214)
Expected credit lossesImpact on fair value of a 10% adverse change – – (33) – – (31)Impact on fair value of a 20% adverse change – – (66) – (1) (62)
Discount rate Impact on fair value of a 10% adverse change (17) – (273) – (8) (24)Impact on fair value of a 20% adverse change (34) – (536) (1) (17) (48)
7. OTHER ASSETS2009 2008
Accounts receivable 14,640 17,306Future income tax asset 662 1,735Derivative-related amounts 4,815 5,374Prepaid expenses 656 1,501Total 20,773 25,916
6. SECURITIZATION (continued)The following table presents key economic assumptions and the sensitivity of the current fair value of the retained interest to adverse changes in each key assumption as at December 31, 2009. The sensitivity analysis is hypothetical and should be used with caution.
Notes to Consolidated Financial Statements($ in thousands)For the year ended December 31, 2009
Annual Report • 2009 39
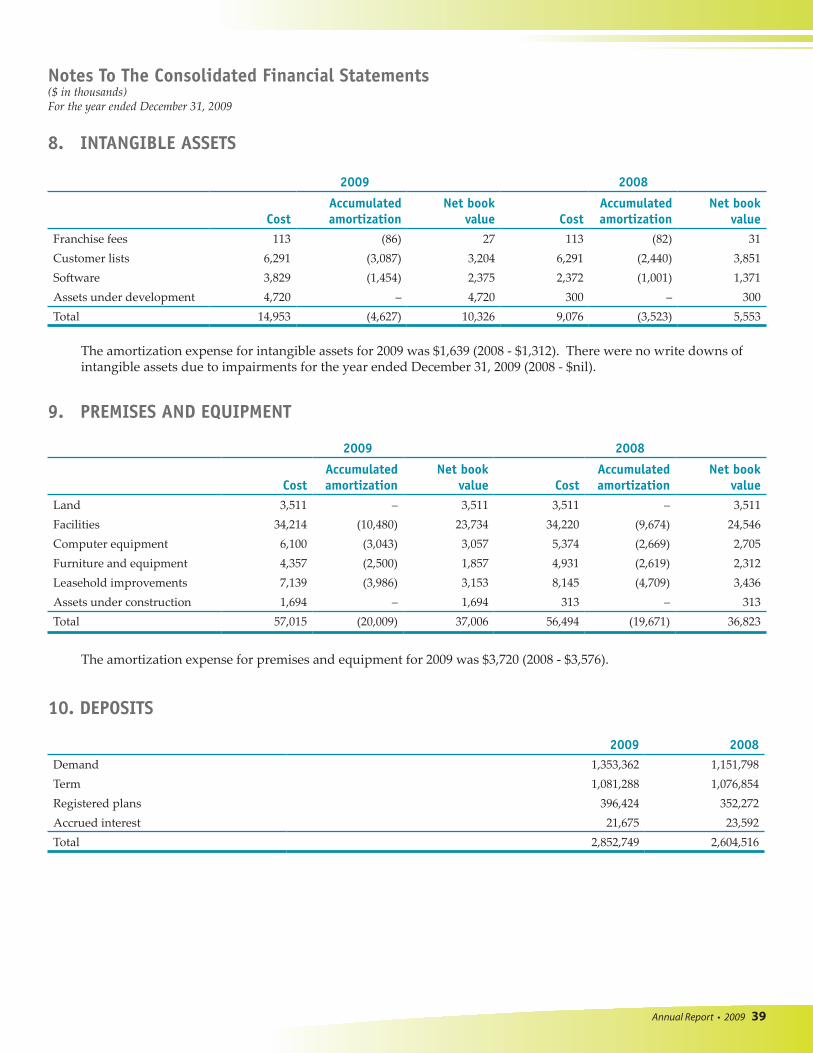
10. DEPOSITS
2009 2008Demand 1,353,362 1,151,798Term 1,081,288 1,076,854Registered plans 396,424 352,272Accrued interest 21,675 23,592Total 2,852,749 2,604,516
Notes To The Consolidated Financial Statements($ in thousands)For the year ended December 31, 2009
2009 2008
CostAccumulatedamortization
Net bookvalue Cost
Accumulatedamortization
Net bookvalue
Land 3,511 – 3,511 3,511 – 3,511Facilities 34,214 (10,480) 23,734 34,220 (9,674) 24,546Computer equipment 6,100 (3,043) 3,057 5,374 (2,669) 2,705Furniture and equipment 4,357 (2,500) 1,857 4,931 (2,619) 2,312Leasehold improvements 7,139 (3,986) 3,153 8,145 (4,709) 3,436Assets under construction 1,694 – 1,694 313 – 313Total 57,015 (20,009) 37,006 56,494 (19,671) 36,823
The amortization expense for premises and equipment for 2009 was $3,720 (2008 - $3,576).
8. INTANGIBLE ASSETS
2009 2008
CostAccumulatedamortization
Net bookvalue Cost
Accumulatedamortization
Net bookvalue
Franchise fees 113 (86) 27 113 (82) 31Customer lists 6,291 (3,087) 3,204 6,291 (2,440) 3,851Software 3,829 (1,454) 2,375 2,372 (1,001) 1,371Assets under development 4,720 – 4,720 300 – 300Total 14,953 (4,627) 10,326 9,076 (3,523) 5,553
The amortization expense for intangible assets for 2009 was $1,639 (2008 - $1,312). There were no write downs of intangible assets due to impairments for the year ended December 31, 2009 (2008 - $nil).
9. PREMISES AND EQUIPMENT
Annual Report • 2009 40
Notes to Consolidated Financial Statements($ in thousands)For the year ended December 31, 2009
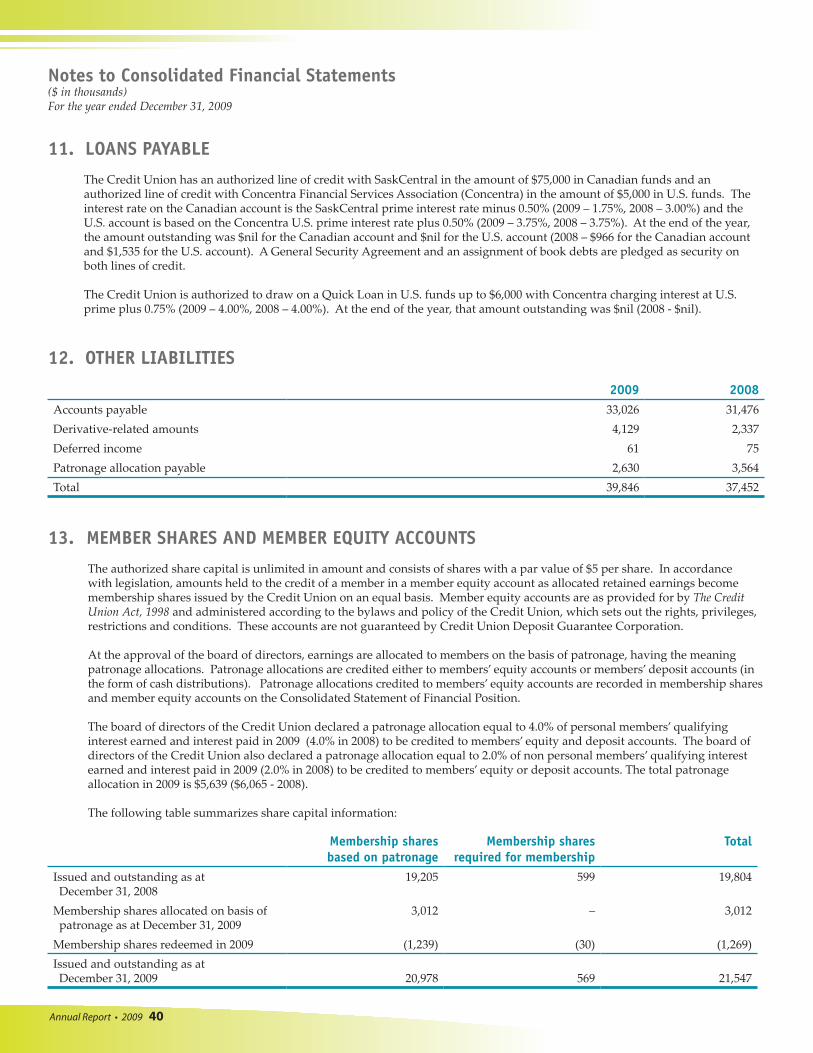
11. LOANS PAYABLE
The Credit Union has an authorized line of credit with SaskCentral in the amount of $75,000 in Canadian funds and an authorized line of credit with Concentra Financial Services Association (Concentra) in the amount of $5,000 in U.S. funds. The interest rate on the Canadian account is the SaskCentral prime interest rate minus 0.50% (2009 – 1.75%, 2008 – 3.00%) and the U.S. account is based on the Concentra U.S. prime interest rate plus 0.50% (2009 – 3.75%, 2008 – 3.75%). At the end of the year, the amount outstanding was $nil for the Canadian account and $nil for the U.S. account (2008 – $966 for the Canadian account and $1,535 for the U.S. account). A General Security Agreement and an assignment of book debts are pledged as security on both lines of credit.
The Credit Union is authorized to draw on a Quick Loan in U.S. funds up to $6,000 with Concentra charging interest at U.S. prime plus 0.75% (2009 – 4.00%, 2008 – 4.00%). At the end of the year, that amount outstanding was $nil (2008 - $nil).
12. OTHER LIABILITIES
2009 2008Accounts payable 33,026 31,476Derivative-related amounts 4,129 2,337Deferred income 61 75Patronage allocation payable 2,630 3,564Total 39,846 37,452
13. MEMBER SHARES AND MEMBER EQUITY ACCOUNTS
The authorized share capital is unlimited in amount and consists of shares with a par value of $5 per share. In accordance with legislation, amounts held to the credit of a member in a member equity account as allocated retained earnings become membership shares issued by the Credit Union on an equal basis. Member equity accounts are as provided for by The Credit Union Act, 1998 and administered according to the bylaws and policy of the Credit Union, which sets out the rights, privileges, restrictions and conditions. These accounts are not guaranteed by Credit Union Deposit Guarantee Corporation.
At the approval of the board of directors, earnings are allocated to members on the basis of patronage, having the meaning patronage allocations. Patronage allocations are credited either to members’ equity accounts or members’ deposit accounts (in the form of cash distributions). Patronage allocations credited to members’ equity accounts are recorded in membership shares and member equity accounts on the Consolidated Statement of Financial Position. The board of directors of the Credit Union declared a patronage allocation equal to 4.0% of personal members’ qualifying interest earned and interest paid in 2009 (4.0% in 2008) to be credited to members’ equity and deposit accounts. The board of directors of the Credit Union also declared a patronage allocation equal to 2.0% of non personal members’ qualifying interest earned and interest paid in 2009 (2.0% in 2008) to be credited to members’ equity or deposit accounts. The total patronage allocation in 2009 is $5,639 ($6,065 - 2008).
The following table summarizes share capital information:
Membership shares based on patronage
Membership shares required for membership
Total
Issued and outstanding as at December 31, 2008
19,205 599 19,804
Membership shares allocated on basis ofpatronage as at December 31, 2009
3,012 – 3,012
Membership shares redeemed in 2009 (1,239) (30) (1,269)Issued and outstanding as atDecember 31, 2009
20,978
569
21,547
Annual Report • 2009 41
Notes to Consolidated Financial Statements($ in thousands)For the year ended December 31, 2009
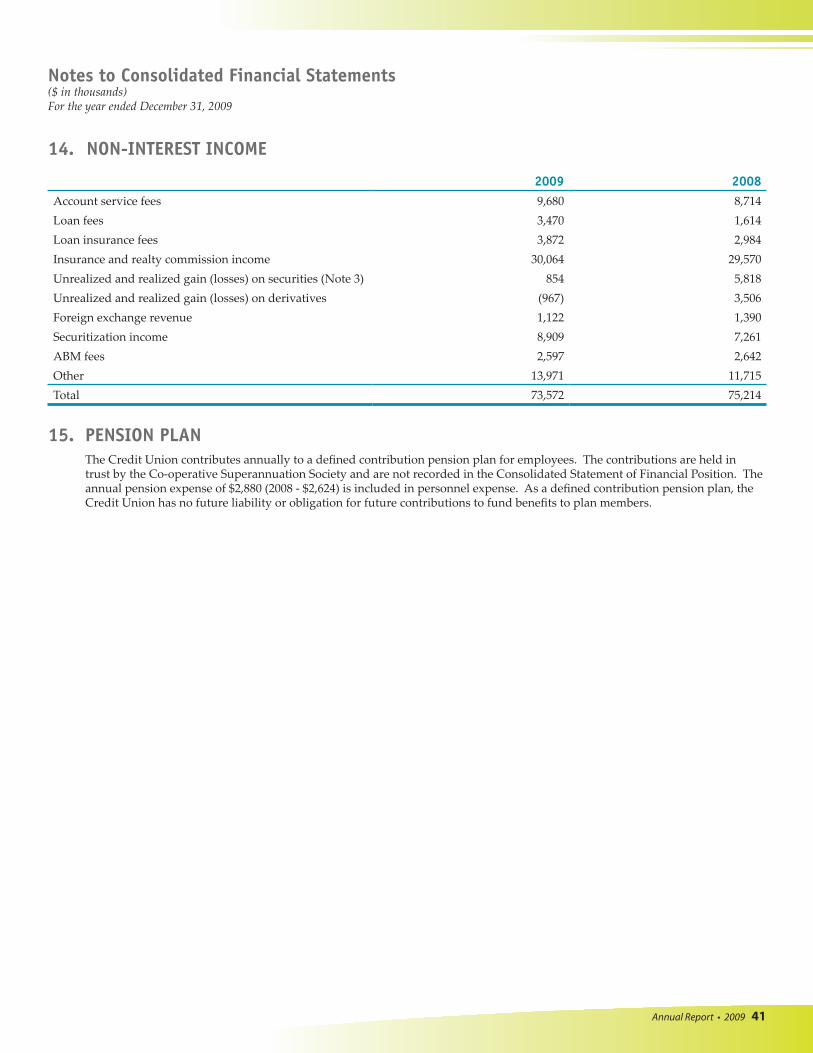
14. NON-INTEREST INCOME
2009 2008Account service fees 9,680 8,714Loan fees 3,470 1,614Loan insurance fees 3,872 2,984Insurance and realty commission income 30,064 29,570Unrealized and realized gain (losses) on securities (Note 3) 854 5,818Unrealized and realized gain (losses) on derivatives (967) 3,506Foreign exchange revenue 1,122 1,390Securitization income 8,909 7,261ABM fees 2,597 2,642Other 13,971 11,715Total 73,572 75,214
15. PENSION PLAN The Credit Union contributes annually to a defined contribution pension plan for employees. The contributions are held in trust by the Co-operative Superannuation Society and are not recorded in the Consolidated Statement of Financial Position. The annual pension expense of $2,880 (2008 - $2,624) is included in personnel expense. As a defined contribution pension plan, the Credit Union has no future liability or obligation for future contributions to fund benefits to plan members.
Annual Report • 2009 42
Notes to Consolidated Financial Statements($ in thousands)For the year ended December 31, 2009
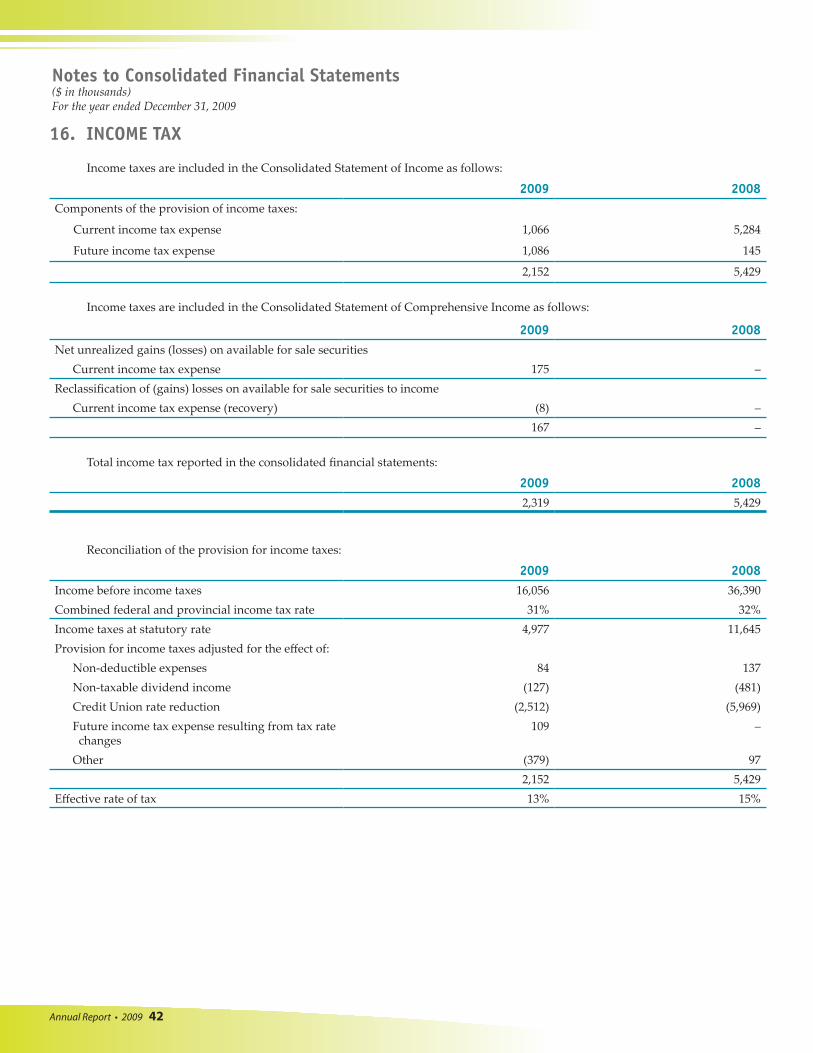
Income taxes are included in the Consolidated Statement of Income as follows:
2009 2008Components of the provision of income taxes:
Current income tax expense 1,066 5,284
Future income tax expense 1,086 145
2,152 5,429
Income taxes are included in the Consolidated Statement of Comprehensive Income as follows:
2009 2008Net unrealized gains (losses) on available for sale securities
Current income tax expense 175 –Reclassification of (gains) losses on available for sale securities to income
Current income tax expense (recovery) (8) – 167 –
Total income tax reported in the consolidated financial statements:
2009 2008 2,319 5,429
Reconciliation of the provision for income taxes:
2009 2008Income before income taxes 16,056 36,390Combined federal and provincial income tax rate 31% 32%Income taxes at statutory rate 4,977 11,645Provision for income taxes adjusted for the effect of:
Non-deductible expenses 84 137Non-taxable dividend income (127) (481)Credit Union rate reduction (2,512) (5,969)Future income tax expense resulting from tax ratechanges
109 –
Other (379) 97 2,152 5,429
Effective rate of tax 13% 15%
16. INCOME TAX
Annual Report • 2009 43
Notes to Consolidated Financial Statements($ in thousands)For the year ended December 31, 2009
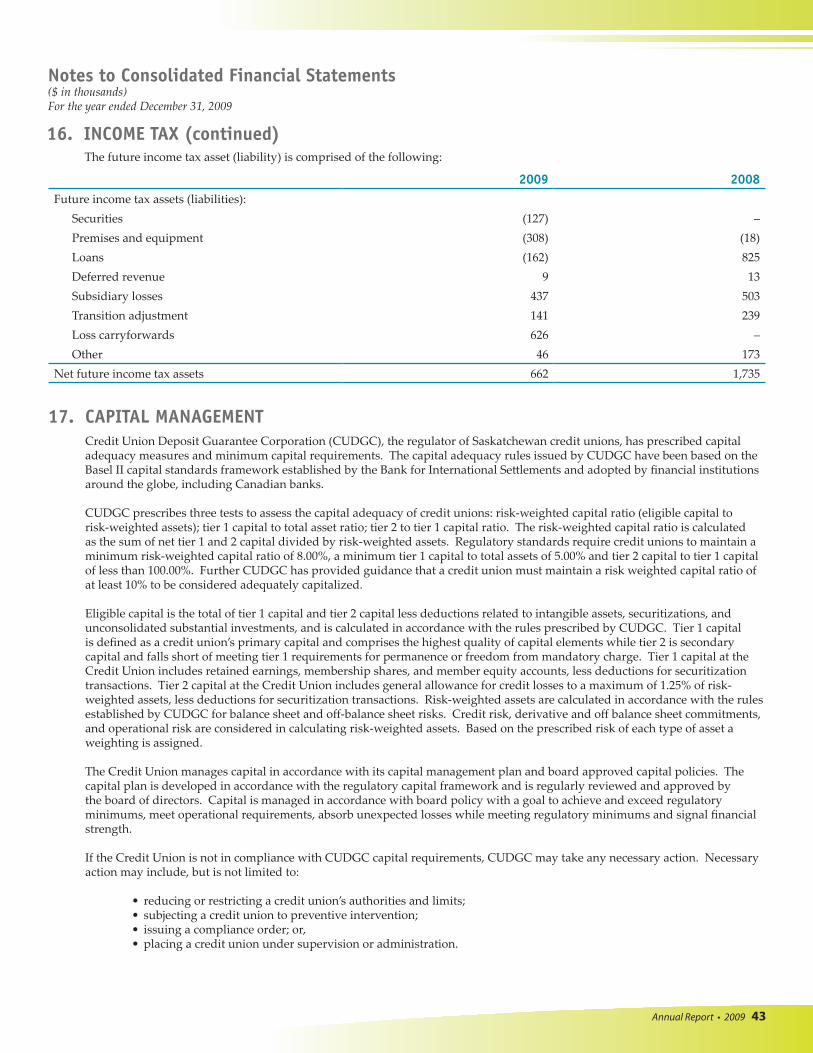
17. CAPITAL MANAGEMENT Credit Union Deposit Guarantee Corporation (CUDGC), the regulator of Saskatchewan credit unions, has prescribed capital adequacy measures and minimum capital requirements. The capital adequacy rules issued by CUDGC have been based on the Basel II capital standards framework established by the Bank for International Settlements and adopted by financial institutions around the globe, including Canadian banks.
CUDGC prescribes three tests to assess the capital adequacy of credit unions: risk-weighted capital ratio (eligible capital to risk-weighted assets); tier 1 capital to total asset ratio; tier 2 to tier 1 capital ratio. The risk-weighted capital ratio is calculated as the sum of net tier 1 and 2 capital divided by risk-weighted assets. Regulatory standards require credit unions to maintain a minimum risk-weighted capital ratio of 8.00%, a minimum tier 1 capital to total assets of 5.00% and tier 2 capital to tier 1 capital of less than 100.00%. Further CUDGC has provided guidance that a credit union must maintain a risk weighted capital ratio of at least 10% to be considered adequately capitalized.
Eligible capital is the total of tier 1 capital and tier 2 capital less deductions related to intangible assets, securitizations, and unconsolidated substantial investments, and is calculated in accordance with the rules prescribed by CUDGC. Tier 1 capital is defined as a credit union’s primary capital and comprises the highest quality of capital elements while tier 2 is secondary capital and falls short of meeting tier 1 requirements for permanence or freedom from mandatory charge. Tier 1 capital at the Credit Union includes retained earnings, membership shares, and member equity accounts, less deductions for securitization transactions. Tier 2 capital at the Credit Union includes general allowance for credit losses to a maximum of 1.25% of risk-weighted assets, less deductions for securitization transactions. Risk-weighted assets are calculated in accordance with the rules established by CUDGC for balance sheet and off-balance sheet risks. Credit risk, derivative and off balance sheet commitments, and operational risk are considered in calculating risk-weighted assets. Based on the prescribed risk of each type of asset a weighting is assigned.
The Credit Union manages capital in accordance with its capital management plan and board approved capital policies. The capital plan is developed in accordance with the regulatory capital framework and is regularly reviewed and approved by the board of directors. Capital is managed in accordance with board policy with a goal to achieve and exceed regulatory minimums, meet operational requirements, absorb unexpected losses while meeting regulatory minimums and signal financial strength.
If the Credit Union is not in compliance with CUDGC capital requirements, CUDGC may take any necessary action. Necessary action may include, but is not limited to:
• reducing or restricting a credit union’s authorities and limits; • subjecting a credit union to preventive intervention; • issuing a compliance order; or, • placing a credit union under supervision or administration.
The future income tax asset (liability) is comprised of the following:
2009 2008Future income tax assets (liabilities):
Securities (127) –Premises and equipment (308) (18)Loans (162) 825Deferred revenue 9 13Subsidiary losses 437 503Transition adjustment 141 239Loss carryforwards 626 –Other 46 173
Net future income tax assets 662 1,735
16. INCOME TAX (continued)
Annual Report • 2009 44
Notes to Consolidated Financial Statements($ in thousands)For the year ended December 31, 2009
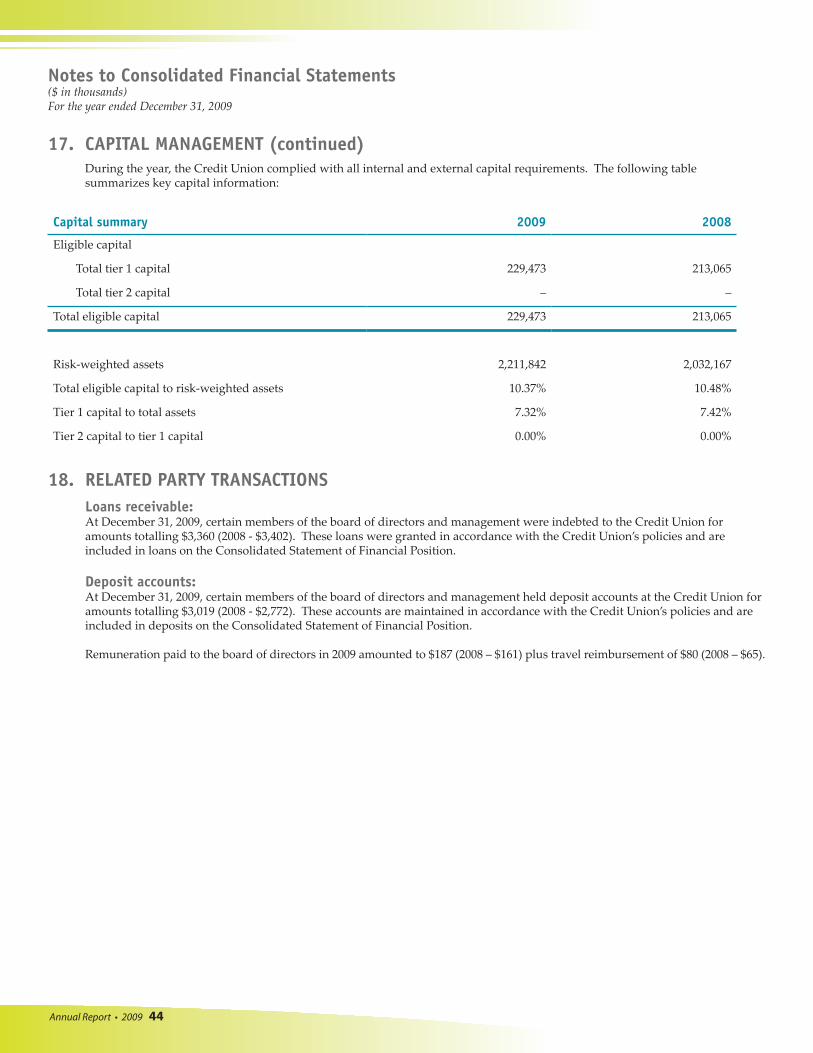
18. RELATED PARTY TRANSACTIONS Loans receivable:At December 31, 2009, certain members of the board of directors and management were indebted to the Credit Union for amounts totalling $3,360 (2008 - $3,402). These loans were granted in accordance with the Credit Union’s policies and are included in loans on the Consolidated Statement of Financial Position. Deposit accounts:At December 31, 2009, certain members of the board of directors and management held deposit accounts at the Credit Union for amounts totalling $3,019 (2008 - $2,772). These accounts are maintained in accordance with the Credit Union’s policies and are included in deposits on the Consolidated Statement of Financial Position.
Remuneration paid to the board of directors in 2009 amounted to $187 (2008 – $161) plus travel reimbursement of $80 (2008 – $65).
Capital summary 2009 2008
Eligible capital
Total tier 1 capital 229,473 213,065
Total tier 2 capital – –
Total eligible capital 229,473 213,065
Risk-weighted assets 2,211,842 2,032,167
Total eligible capital to risk-weighted assets 10.37% 10.48%
Tier 1 capital to total assets 7.32% 7.42%
Tier 2 capital to tier 1 capital 0.00% 0.00%
17. CAPITAL MANAGEMENT (continued)During the year, the Credit Union complied with all internal and external capital requirements. The following table summarizes key capital information:
Annual Report • 2009 45
Notes to Consolidated Financial Statements($ in thousands)For the year ended December 31, 2009
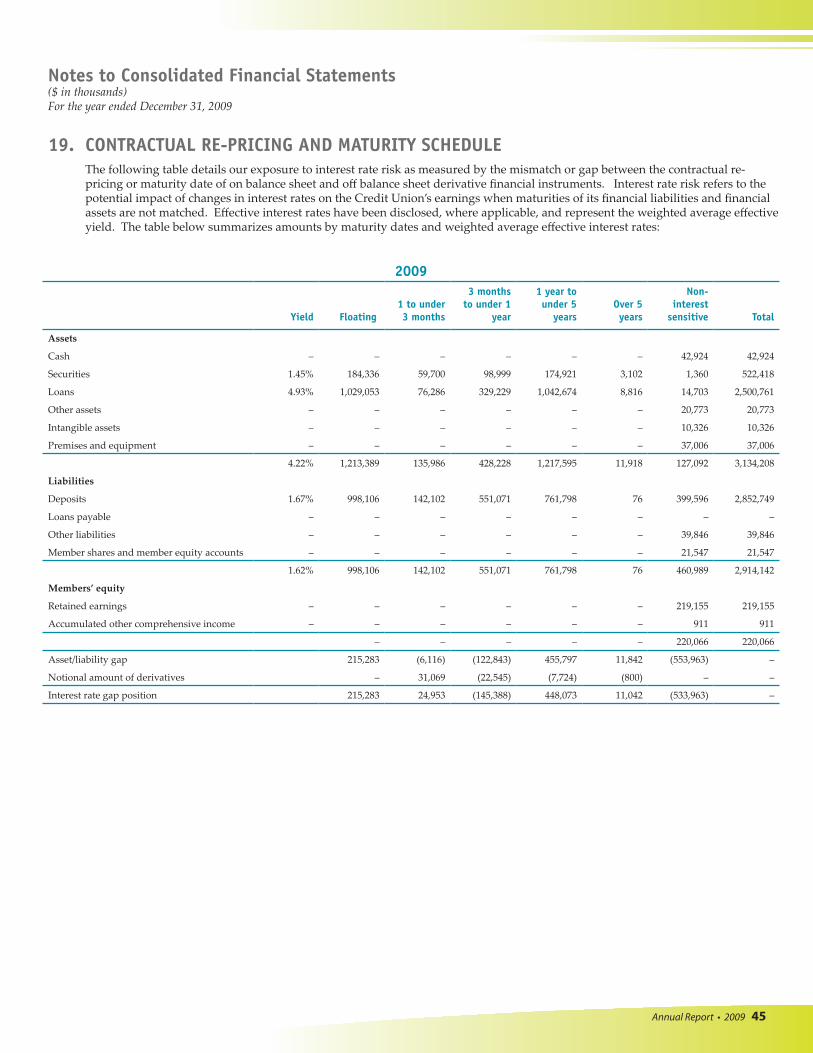
2009
Yield Floating1 to under 3 months
3 months to under 1
year
1 year to under 5
yearsOver 5 years
Non-interest
sensitive Total
Assets
Cash – – – – – – 42,924 42,924
Securities 1.45% 184,336 59,700 98,999 174,921 3,102 1,360 522,418
Loans 4.93% 1,029,053 76,286 329,229 1,042,674 8,816 14,703 2,500,761
Other assets – – – – – – 20,773 20,773
Intangible assets – – – – – – 10,326 10,326
Premises and equipment – – – – – – 37,006 37,006
4.22% 1,213,389 135,986 428,228 1,217,595 11,918 127,092 3,134,208
Liabilities
Deposits 1.67% 998,106 142,102 551,071 761,798 76 399,596 2,852,749
Loans payable – – – – – – – –
Other liabilities – – – – – – 39,846 39,846
Member shares and member equity accounts – – – – – – 21,547 21,547
1.62% 998,106 142,102 551,071 761,798 76 460,989 2,914,142
Members’ equity
Retained earnings – – – – – – 219,155 219,155
Accumulated other comprehensive income – – – – – – 911 911
– – – – – 220,066 220,066
Asset/liability gap 215,283 (6,116) (122,843) 455,797 11,842 (553,963) –
Notional amount of derivatives – 31,069 (22,545) (7,724) (800) – –
Interest rate gap position 215,283 24,953 (145,388) 448,073 11,042 (533,963) –
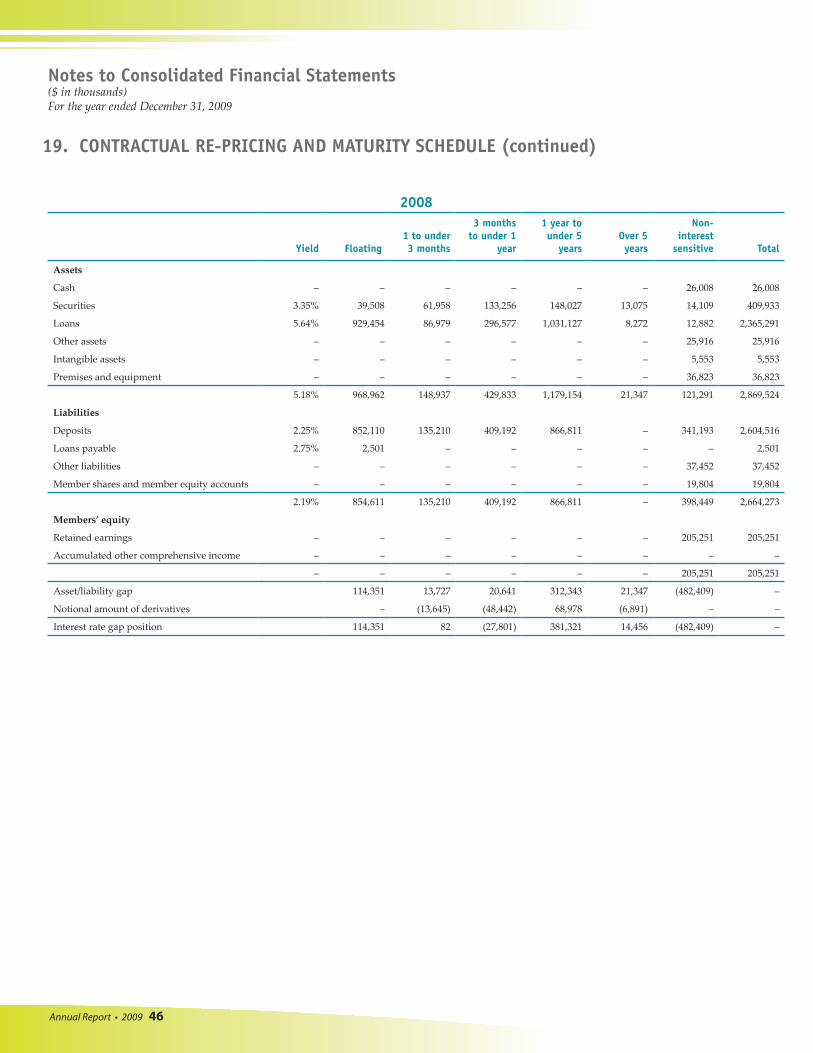
19. CONTRACTUAL RE-PRICING AND MATURITY SCHEDULE The following table details our exposure to interest rate risk as measured by the mismatch or gap between the contractual re-pricing or maturity date of on balance sheet and off balance sheet derivative financial instruments. Interest rate risk refers to the potential impact of changes in interest rates on the Credit Union’s earnings when maturities of its financial liabilities and financial assets are not matched. Effective interest rates have been disclosed, where applicable, and represent the weighted average effective yield. The table below summarizes amounts by maturity dates and weighted average effective interest rates:
Annual Report • 2009 46
Notes to Consolidated Financial Statements($ in thousands)For the year ended December 31, 2009
2008
Yield Floating1 to under 3 months
3 months to under 1
year
1 year to under 5
yearsOver 5 years
Non-interest
sensitive Total
Assets
Cash – – – – – – 26,008 26,008
Securities 3.35% 39,508 61,958 133,256 148,027 13,075 14,109 409,933
Loans 5.64% 929,454 86,979 296,577 1,031,127 8,272 12,882 2,365,291
Other assets – – – – – – 25,916 25,916
Intangible assets – – – – – – 5,553 5,553
Premises and equipment – – – – – – 36,823 36,823
5.18% 968,962 148,937 429,833 1,179,154 21,347 121,291 2,869,524
Liabilities
Deposits 2.25% 852,110 135,210 409,192 866,811 – 341,193 2,604,516
Loans payable 2.75% 2,501 – – – – – 2,501
Other liabilities – – – – – – 37,452 37,452
Member shares and member equity accounts – – – – – – 19,804 19,804
2.19% 854,611 135,210 409,192 866,811 – 398,449 2,664,273
Members’ equity
Retained earnings – – – – – – 205,251 205,251
Accumulated other comprehensive income – – – – – – – –
– – – – – – 205,251 205,251
Asset/liability gap 114,351 13,727 20,641 312,343 21,347 (482,409) –
Notional amount of derivatives – (13,645) (48,442) 68,978 (6,891) – –
Interest rate gap position 114,351 82 (27,801) 381,321 14,456 (482,409) –
19. CONTRACTUAL RE-PRICING AND MATURITY SCHEDULE (continued)
Annual Report • 2009 47
Notes to Consolidated Financial Statements($ in thousands)For the year ended December 31, 2009
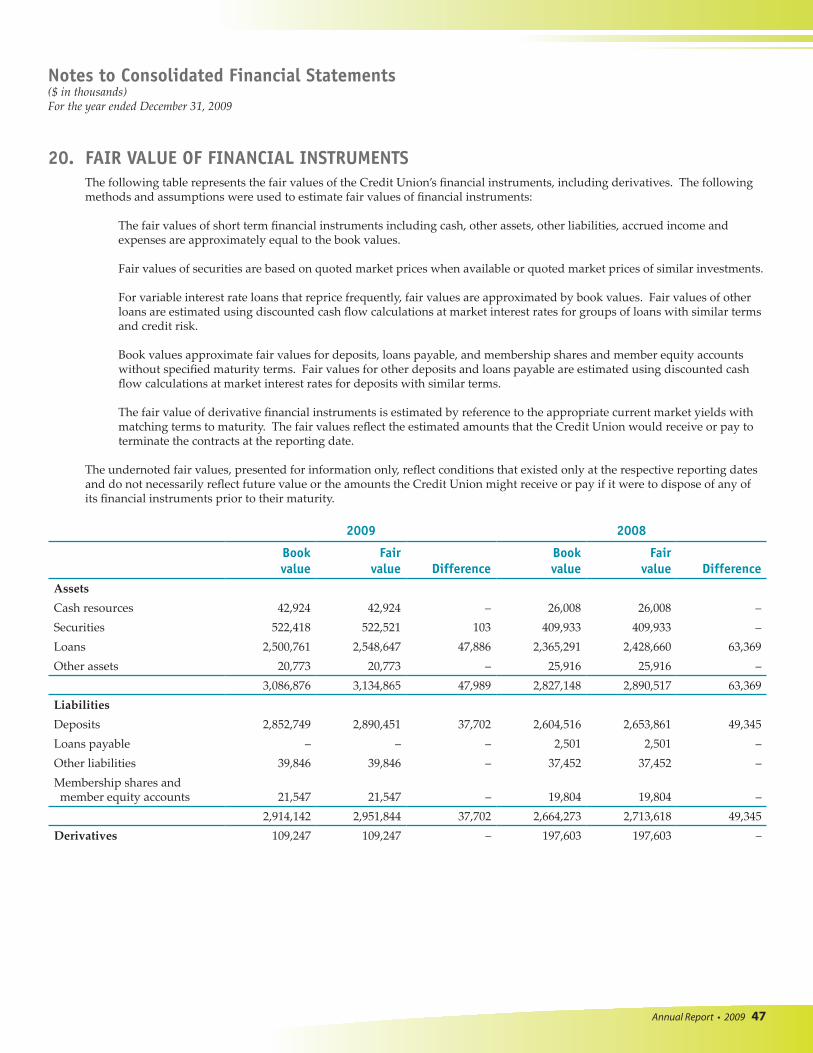
2009 2008
Bookvalue
Fairvalue Difference
Bookvalue
Fairvalue Difference
AssetsCash resources 42,924 42,924 – 26,008 26,008 –Securities 522,418 522,521 103 409,933 409,933 –Loans 2,500,761 2,548,647 47,886 2,365,291 2,428,660 63,369Other assets 20,773 20,773 – 25,916 25,916 –
3,086,876 3,134,865 47,989 2,827,148 2,890,517 63,369LiabilitiesDeposits 2,852,749 2,890,451 37,702 2,604,516 2,653,861 49,345Loans payable – – – 2,501 2,501 –Other liabilities 39,846 39,846 – 37,452 37,452 –Membership shares andmember equity accounts 21,547 21,547 – 19,804 19,804 –
2,914,142 2,951,844 37,702 2,664,273 2,713,618 49,345Derivatives 109,247 109,247 – 197,603 197,603 –
20. FAIR VALUE OF FINANCIAL INSTRUMENTSThe following table represents the fair values of the Credit Union’s financial instruments, including derivatives. The following methods and assumptions were used to estimate fair values of financial instruments:
The fair values of short term financial instruments including cash, other assets, other liabilities, accrued income and expenses are approximately equal to the book values.
Fair values of securities are based on quoted market prices when available or quoted market prices of similar investments.
For variable interest rate loans that reprice frequently, fair values are approximated by book values. Fair values of other loans are estimated using discounted cash flow calculations at market interest rates for groups of loans with similar terms and credit risk.
Book values approximate fair values for deposits, loans payable, and membership shares and member equity accounts without specified maturity terms. Fair values for other deposits and loans payable are estimated using discounted cash flow calculations at market interest rates for deposits with similar terms.
The fair value of derivative financial instruments is estimated by reference to the appropriate current market yields with matching terms to maturity. The fair values reflect the estimated amounts that the Credit Union would receive or pay to terminate the contracts at the reporting date.
The undernoted fair values, presented for information only, reflect conditions that existed only at the respective reporting dates and do not necessarily reflect future value or the amounts the Credit Union might receive or pay if it were to dispose of any of its financial instruments prior to their maturity.
Annual Report • 2009 48
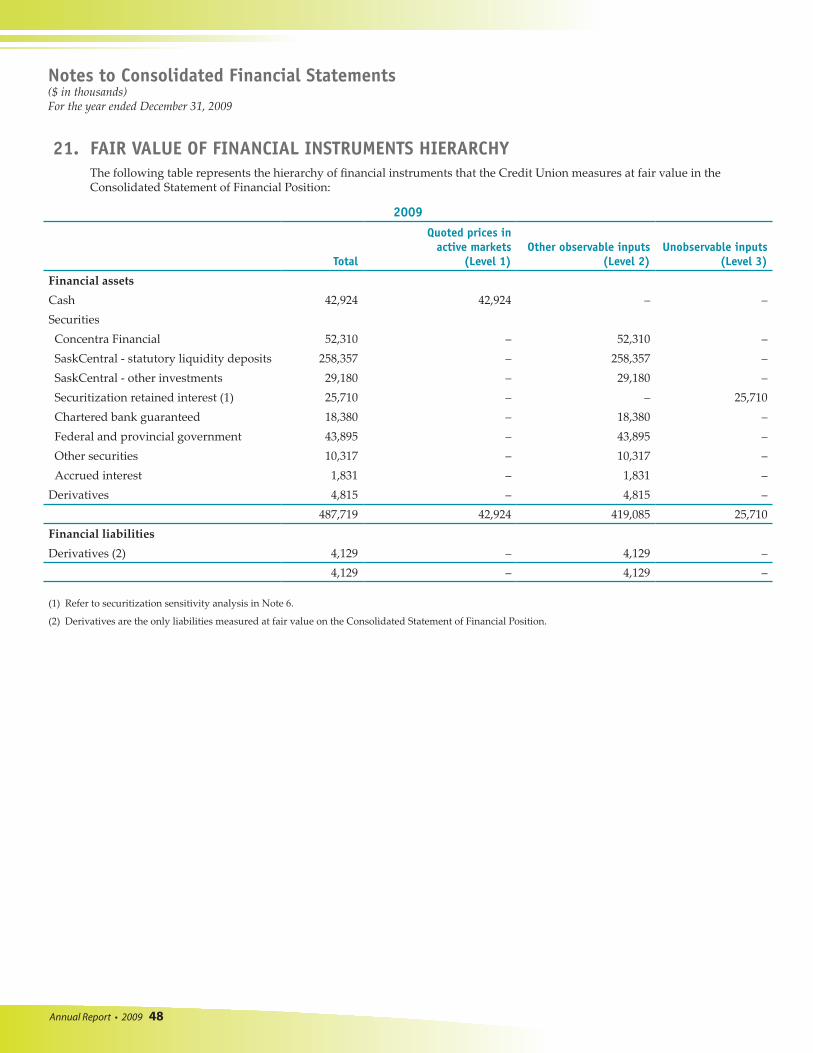
2009
Total
Quoted prices in active markets
(Level 1)Other observable inputs
(Level 2)Unobservable inputs
(Level 3)
Financial assetsCash 42,924 42,924 – –SecuritiesConcentra Financial 52,310 – 52,310 –SaskCentral - statutory liquidity deposits 258,357 – 258,357 –SaskCentral - other investments 29,180 – 29,180 –Securitization retained interest (1) 25,710 – – 25,710Chartered bank guaranteed 18,380 – 18,380 –Federal and provincial government 43,895 – 43,895 –Other securities 10,317 – 10,317 –Accrued interest 1,831 – 1,831 –
Derivatives 4,815 – 4,815 – 487,719 42,924 419,085 25,710
Financial liabilitiesDerivatives (2) 4,129 – 4,129 –
4,129 – 4,129 –
(1) Refer to securitization sensitivity analysis in Note 6.
(2) Derivatives are the only liabilities measured at fair value on the Consolidated Statement of Financial Position.
21. FAIR VALUE OF FINANCIAL INSTRUMENTS HIERARCHY The following table represents the hierarchy of financial instruments that the Credit Union measures at fair value in the Consolidated Statement of Financial Position:
Notes to Consolidated Financial Statements($ in thousands)For the year ended December 31, 2009
Annual Report • 2009 49
Notes to Consolidated Financial Statements($ in thousands)For the year ended December 31, 2009
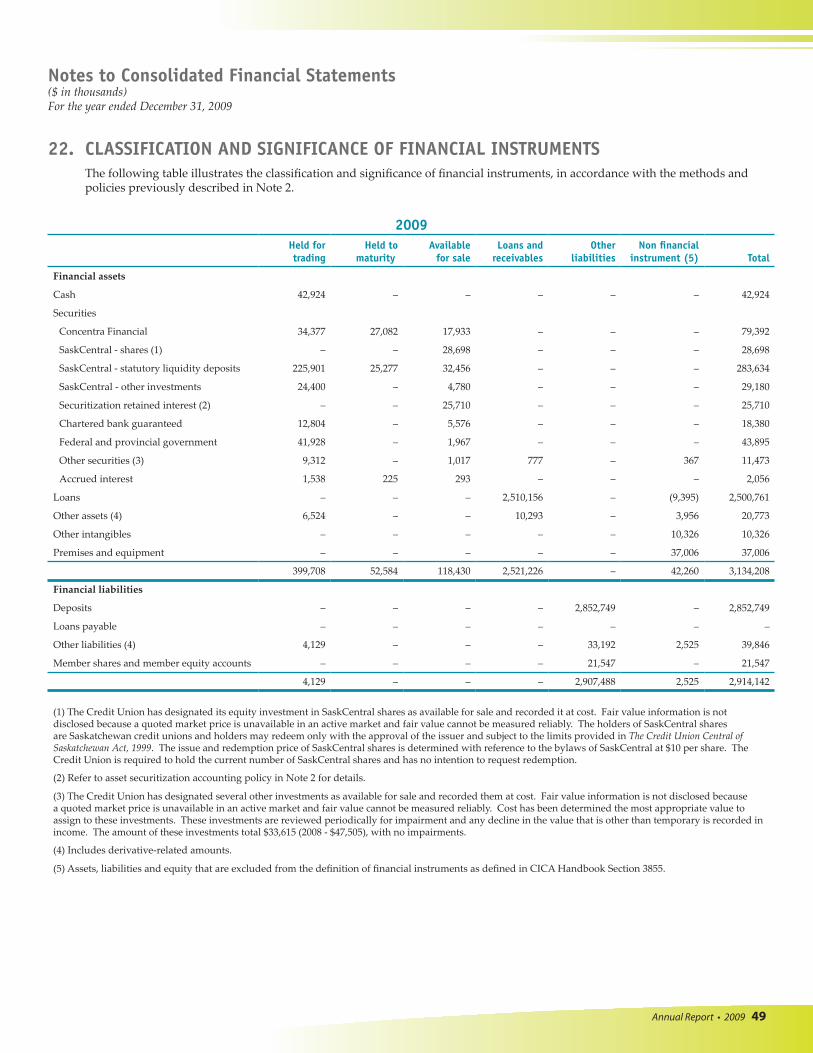
22. CLASSIFICATION AND SIGNIFICANCE OF FINANCIAL INSTRUMENTS The following table illustrates the classification and significance of financial instruments, in accordance with the methods and policies previously described in Note 2.
2009Held for trading
Held to maturity
Available for sale
Loans and receivables
Other liabilities
Non financial instrument (5) Total
Financial assets
Cash 42,924 – – – – – 42,924
Securities
Concentra Financial 34,377 27,082 17,933 – – – 79,392
SaskCentral - shares (1) – – 28,698 – – – 28,698
SaskCentral - statutory liquidity deposits 225,901 25,277 32,456 – – – 283,634
SaskCentral - other investments 24,400 – 4,780 – – – 29,180
Securitization retained interest (2) – – 25,710 – – – 25,710
Chartered bank guaranteed 12,804 – 5,576 – – – 18,380
Federal and provincial government 41,928 – 1,967 – – – 43,895
Other securities (3) 9,312 – 1,017 777 – 367 11,473
Accrued interest 1,538 225 293 – – – 2,056
Loans – – – 2,510,156 – (9,395) 2,500,761
Other assets (4) 6,524 – – 10,293 – 3,956 20,773
Other intangibles – – – – – 10,326 10,326
Premises and equipment – – – – – 37,006 37,006
399,708 52,584 118,430 2,521,226 – 42,260 3,134,208
Financial liabilities
Deposits – – – – 2,852,749 – 2,852,749
Loans payable – – – – – – –
Other liabilities (4) 4,129 – – – 33,192 2,525 39,846
Member shares and member equity accounts – – – – 21,547 – 21,547
4,129 – – – 2,907,488 2,525 2,914,142
(1) The Credit Union has designated its equity investment in SaskCentral shares as available for sale and recorded it at cost. Fair value information is not disclosed because a quoted market price is unavailable in an active market and fair value cannot be measured reliably. The holders of SaskCentral shares are Saskatchewan credit unions and holders may redeem only with the approval of the issuer and subject to the limits provided in The Credit Union Central of Saskatchewan Act, 1999. The issue and redemption price of SaskCentral shares is determined with reference to the bylaws of SaskCentral at $10 per share. The Credit Union is required to hold the current number of SaskCentral shares and has no intention to request redemption.
(2) Refer to asset securitization accounting policy in Note 2 for details.
(3) The Credit Union has designated several other investments as available for sale and recorded them at cost. Fair value information is not disclosed because a quoted market price is unavailable in an active market and fair value cannot be measured reliably. Cost has been determined the most appropriate value to assign to these investments. These investments are reviewed periodically for impairment and any decline in the value that is other than temporary is recorded in income. The amount of these investments total $33,615 (2008 - $47,505), with no impairments.
(4) Includes derivative-related amounts.
(5) Assets, liabilities and equity that are excluded from the definition of financial instruments as defined in CICA Handbook Section 3855.
Annual Report • 2009 50
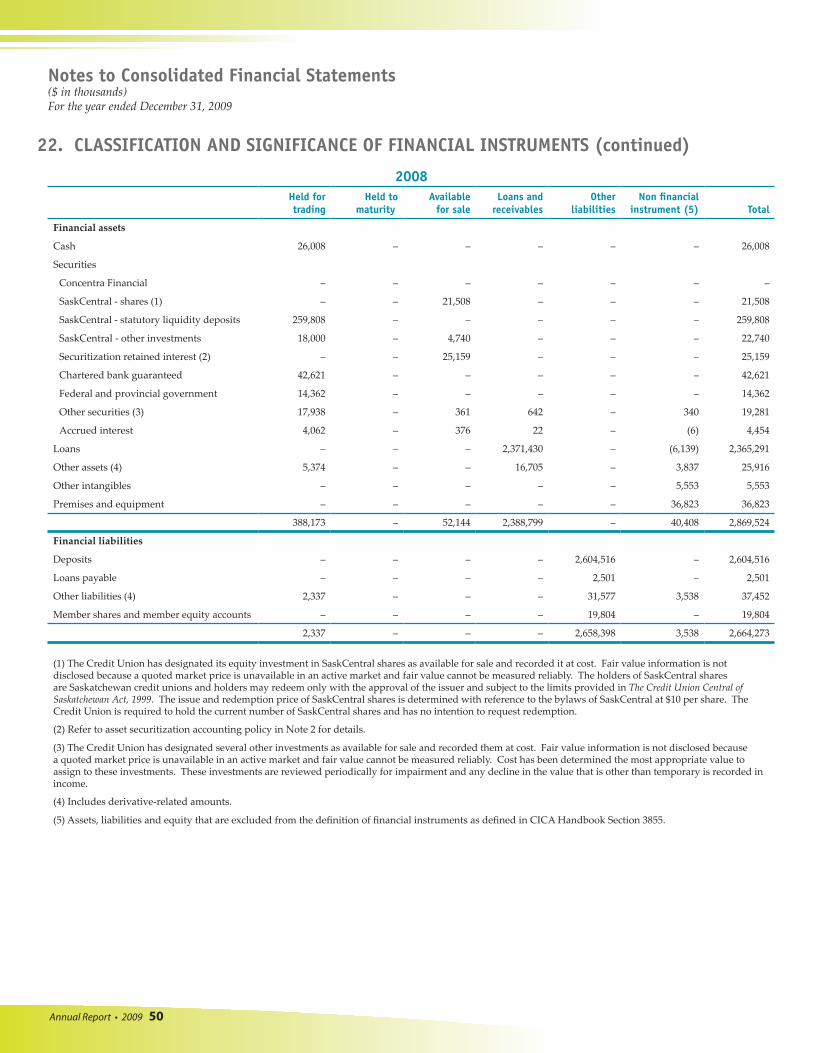
2008Held for trading
Held to maturity
Available for sale
Loans and receivables
Other liabilities
Non financial instrument (5) Total
Financial assets
Cash 26,008 – – – – – 26,008
Securities
Concentra Financial – – – – – – –
SaskCentral - shares (1) – – 21,508 – – – 21,508
SaskCentral - statutory liquidity deposits 259,808 – – – – – 259,808
SaskCentral - other investments 18,000 – 4,740 – – – 22,740
Securitization retained interest (2) – – 25,159 – – – 25,159
Chartered bank guaranteed 42,621 – – – – – 42,621
Federal and provincial government 14,362 – – – – – 14,362
Other securities (3) 17,938 – 361 642 – 340 19,281
Accrued interest 4,062 – 376 22 – (6) 4,454
Loans – – – 2,371,430 – (6,139) 2,365,291
Other assets (4) 5,374 – – 16,705 – 3,837 25,916
Other intangibles – – – – – 5,553 5,553
Premises and equipment – – – – – 36,823 36,823
388,173 – 52,144 2,388,799 – 40,408 2,869,524
Financial liabilities
Deposits – – – – 2,604,516 – 2,604,516
Loans payable – – – – 2,501 – 2,501
Other liabilities (4) 2,337 – – – 31,577 3,538 37,452
Member shares and member equity accounts – – – – 19,804 – 19,804
2,337 – – – 2,658,398 3,538 2,664,273
(1) The Credit Union has designated its equity investment in SaskCentral shares as available for sale and recorded it at cost. Fair value information is not disclosed because a quoted market price is unavailable in an active market and fair value cannot be measured reliably. The holders of SaskCentral shares are Saskatchewan credit unions and holders may redeem only with the approval of the issuer and subject to the limits provided in The Credit Union Central of Saskatchewan Act, 1999. The issue and redemption price of SaskCentral shares is determined with reference to the bylaws of SaskCentral at $10 per share. The Credit Union is required to hold the current number of SaskCentral shares and has no intention to request redemption.
(2) Refer to asset securitization accounting policy in Note 2 for details.
(3) The Credit Union has designated several other investments as available for sale and recorded them at cost. Fair value information is not disclosed because a quoted market price is unavailable in an active market and fair value cannot be measured reliably. Cost has been determined the most appropriate value to assign to these investments. These investments are reviewed periodically for impairment and any decline in the value that is other than temporary is recorded in income.
(4) Includes derivative-related amounts.
(5) Assets, liabilities and equity that are excluded from the definition of financial instruments as defined in CICA Handbook Section 3855.
Notes to Consolidated Financial Statements($ in thousands)For the year ended December 31, 2009
22. CLASSIFICATION AND SIGNIFICANCE OF FINANCIAL INSTRUMENTS (continued)
Annual Report • 2009 51
Notes to Consolidated Financial Statements($ in thousands)For the year ended December 31, 2009
23. NATURE AND EXTENT OF RISKS ARISING FROM FINANCIAL INSTRUMENTS The Credit Union is exposed to the following risks as a result of holding financial instruments: credit risk; market risk; and liquidity risk. The following is a description of those risks and how they are managed.
Credit riskCredit risk is the risk of financial loss resulting from a borrower or counterparty failing to meet its obligations. Credit risk primarily arises from the Credit Union’s direct lending activities, and the possibility that members will be unable or unwilling to repay some or all of the principal amount and interest they have borrowed. The Credit Union’s estimate of its exposure to credit risk with respect to loans is reported in Note 4 and Note 5. For securities and derivative instruments, the credit risk the Credit Union is exposed to is the risk of default by the counterparty. Credit risk management processes and controls for loansThe credit granting process is controlled by board-approved policies, as well as detailed loan policy manuals for each credit portfolio type: commercial, agricultural and consumer. These detailed loan policy manuals are developed, maintained and approved by the lending operations department. Each credit application is assessed in accordance with these policies. The assessment of commercial and agricultural credit includes the assignment of a credit score in accordance with internal credit rating criteria.
The Credit Union’s credit risk processes and controls relating to lending activities are managed through a centralized department – lending operations. The function of the lending operations department includes development of lending policies, monitoring of organizational credit risk and oversight approval of lending where the amount exceeds the authorization levels for retail management, or where the underwriting is outside of the operational lending policies. Lending decision-making authority is determined in compliance with the delegation of authority set out in the credit risk management policies. The lending operations department also provides approval and underwriting support to lenders for loans that are considered to be complex, unusual, higher risk or problematic. The detailed lending policies set out criteria to determine annual review requirements for all loan types to ensure adequate monitoring of the Credit Union’s credit exposure. Accounts that are deemed to be higher than average risk are subject to more frequent monitoring. These accounts are brought to the attention of the lending operations department to provide direction on specific monitoring requirements. Credit risk limits for loansThe Credit Union has implemented certain credit limits through board policy. These limits are in place to manage the overall credit risk of the loan portfolio and to establish parameters for credit diversification. The Credit Union has established limits for each loan portfolio type (agricultural, consumer mortgage, consumer non-mortgage and commercial loans), as well as maximum borrowing limits for individual borrowers. For all types of mortgages (consumer, commercial and agricultural), the maximum credit exposure limit is 15% of capital and for non-mortgage loans the maximum limit is 5% of capital. As at December 31, 2009, the Credit Union was in compliance with all internal and external credit limits.
The Credit Union also controls credit risk using various risk mitigation techniques. The most common method used to mitigate credit risk is to obtain quality security from counterparties in guarantee of the Credit Union’s commitments. A second common risk mitigation method is to syndicate or securitize loans as a means of transferring to a third party a portion of the credit risk.
Annual Report • 2009 52
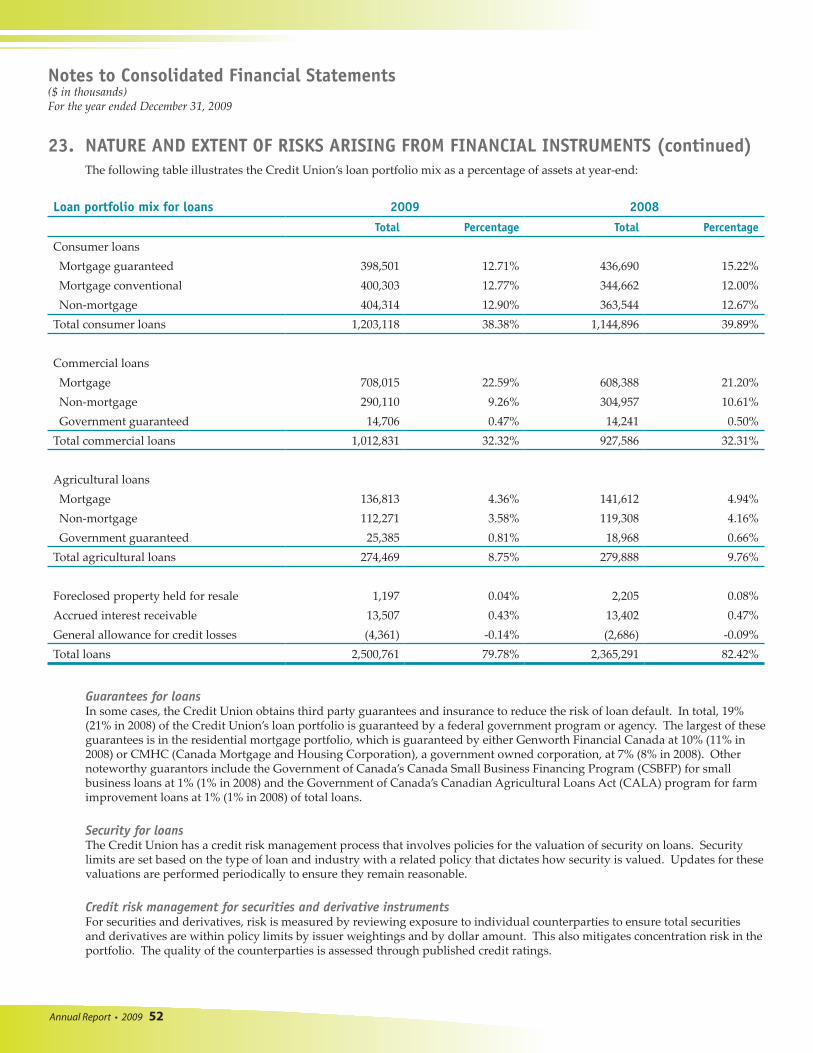
Loan portfolio mix for loans 2009 2008Total Percentage Total Percentage
Consumer loansMortgage guaranteed 398,501 12.71% 436,690 15.22%Mortgage conventional 400,303 12.77% 344,662 12.00%Non-mortgage 404,314 12.90% 363,544 12.67%
Total consumer loans 1,203,118 38.38% 1,144,896 39.89%
Commercial loansMortgage 708,015 22.59% 608,388 21.20%Non-mortgage 290,110 9.26% 304,957 10.61%Government guaranteed 14,706 0.47% 14,241 0.50%
Total commercial loans 1,012,831 32.32% 927,586 32.31%
Agricultural loansMortgage 136,813 4.36% 141,612 4.94%Non-mortgage 112,271 3.58% 119,308 4.16%Government guaranteed 25,385 0.81% 18,968 0.66%
Total agricultural loans 274,469 8.75% 279,888 9.76%
Foreclosed property held for resale 1,197 0.04% 2,205 0.08%Accrued interest receivable 13,507 0.43% 13,402 0.47%General allowance for credit losses (4,361) -0.14% (2,686) -0.09%Total loans 2,500,761 79.78% 2,365,291 82.42%
Guarantees for loans In some cases, the Credit Union obtains third party guarantees and insurance to reduce the risk of loan default. In total, 19% (21% in 2008) of the Credit Union’s loan portfolio is guaranteed by a federal government program or agency. The largest of these guarantees is in the residential mortgage portfolio, which is guaranteed by either Genworth Financial Canada at 10% (11% in 2008) or CMHC (Canada Mortgage and Housing Corporation), a government owned corporation, at 7% (8% in 2008). Other noteworthy guarantors include the Government of Canada’s Canada Small Business Financing Program (CSBFP) for small business loans at 1% (1% in 2008) and the Government of Canada’s Canadian Agricultural Loans Act (CALA) program for farm improvement loans at 1% (1% in 2008) of total loans. Security for loansThe Credit Union has a credit risk management process that involves policies for the valuation of security on loans. Security limits are set based on the type of loan and industry with a related policy that dictates how security is valued. Updates for these valuations are performed periodically to ensure they remain reasonable. Credit risk management for securities and derivative instrumentsFor securities and derivatives, risk is measured by reviewing exposure to individual counterparties to ensure total securities and derivatives are within policy limits by issuer weightings and by dollar amount. This also mitigates concentration risk in the portfolio. The quality of the counterparties is assessed through published credit ratings.
Notes to Consolidated Financial Statements($ in thousands)For the year ended December 31, 2009
23. NATURE AND EXTENT OF RISKS ARISING FROM FINANCIAL INSTRUMENTS (continued) The following table illustrates the Credit Union’s loan portfolio mix as a percentage of assets at year-end:
Annual Report • 2009 53
Notes to Consolidated Financial Statements($ in thousands)For the year ended December 31, 2009
23. NATURE AND EXTENT OF RISKS ARISING FROM FINANCIAL INSTRUMENTS (continued) Market risk
Market risk is the risk that the fair value or future cash flows of a financial instrument will fluctuate because of changes in market prices. Market risk comprises two types of risk: interest rate risk and currency risk. The primary market risk exposure of the Credit Union is interest rate risk, specifically, from timing differences in the re-pricing of assets and liabilities, both on and off balance sheet. Interest rate movements can cause changes in interest income and interest expense and, although these changes move in the same direction, their relative magnitude will have a favourable or unfavourable impact on annual net interest income and the economic value (present value of estimated cash flows) of members’ equity. The extent of that impact depends on several factors, including asset and liability matching and interest rate curves. Regular simulation modelling is performed to assess the impact of various risk scenarios on net interest income and the economic value of shareholders’ equity and to guide the management of interest rate risk.
Processes and controlsInterest rate risk is managed in accordance with specific operating and board policies. The policies set risk limits based on the impact of a change in interest rates on the following: annual net interest income, market value of assets, and economic value of members’ equity.
The Credit Union uses dynamic simulation modelling to measure and manage the interest rate risk in its financial position. Using rate sensitivity analysis with probable rate scenarios, interest rate risk is managed to comply with the Credit Union’s policy requirement. For 2009, the Credit Union’s interest rate risk was within acceptable levels, as measured by board approved parameters. Interest rate risk is reported to the Asset Liability Management Committee (ALCO). One of the committee’s primary responsibilities is to provide oversight and direction for the management of interest rate risk. ALCO establishes and approves targets and strategies related to interest rate risk management and liquidity management. The ALCO is comprised of the CEO, all executive management and other selected senior management from the areas of finance, risk management, marketing, lending and retail operations. The ALCO frequently reviews historical and forward looking performance and risk measurements as part of a standardized reporting package. These reports include simulation results on interest margin with stress testing and scenario analysis.
Stress testing and scenario analysisStress testing and scenario analysis is performed and measured in relation to policy limits as part of the monthly interest rate risk simulation process. These tests include the effects of most likely and stressed movements in interest rates on the financial position of the Credit Union and its current and projected net earnings. Interest rate risk stress testing includes illustrating the impact of the most likely scenario (based on the Credit Union’s rate forecast), a flat rate scenario, declining rate scenario (3% decline in prime rate over one year), rising rate scenario (3% increase in prime rate over one year), a shock down of 100 basis points and a shock up of 100 basis points (100 basis points is equal to 1 percent). The following table illustrates the potential impact of an immediate and sustained 100 basis point change in interest rates on net income and other comprehensive income and economic value of equity. These measures are based upon assumptions made by management.
2009 2008100-basis-point increase in interest rate:
Impact on net income 5,524 1,950Impact on other comprehensive income (471) –
25-basis-point (100-basis-point in 2008) decrease in interest rateImpact on net income (1,370) (1,812)Impact on other comprehensive income 120 –
Annual Report • 2009 54
Notes to Consolidated Financial Statements($ in thousands)For the year ended December 31, 2009
23. NATURE AND EXTENT OF RISKS ARISING FROM FINANCIAL INSTRUMENTS (continued)
The impact of movements in interest rates on the financial position and earnings of the Credit Union is measured through a number of sophisticated tests, namely: income simulation, static gap analysis, stochastic analysis (earnings at risk), value at risk (economic value of equity) and duration analysis. Currency risk is the risk that the fair value or future cash flows of a financial instrument will fluctuate because of changes in foreign exchange rates. The Credit Union is exposed to currency risk because of members’ U.S. dollar deposits. The Credit Union mitigates currency risk by investing in offsetting foreign denominated financial instruments of similar terms. Currency risk is managed in accordance with prescribed regulatory requirements and internal board policy, including limits with respect to the maximum holdings of unhedged foreign currency.
The Credit Union measures currency risk based on the percentage of foreign denominated financial assets against similar foreign denominated financial liabilities on a daily basis. As at December 31, 2009, the percentage of foreign denominated financial assets is 99% (2008 - 103%) of foreign denominated financial liabilities.
Liquidity risk Liquidity risk arises from having insufficient funds to meet financial obligations without having to raise funds at unfavourable rates or selling assets on a forced basis. Liquidity risk stems from mismatched cash flows between assets and liabilities as well as certain product characteristics, including commitments to extend credit and redemption features on deposits. One of the Credit Union’s primary objectives as a financial institution is to prudently manage liquidity to ensure that the Credit Union is able to generate or obtain sufficient cash or cash equivalents in a timely manner, at a reasonable price, to meet commitments as they become due, even under stressed conditions. Liquidity management ensures variations in cash flows are managed on a daily and seasonal basis.
Liquidity risk is managed through a three tiered structure: local credit union level; the Saskatchewan provincial credit union system tier; and the national Canadian credit union system tier. At the local level, the Credit Union liquidity risk is managed according to an established framework which includes: established strategies and policies for managing liquidity risk; maintaining a portfolio of liquid assets; measuring and monitoring funding requirements; managing market access to funds; contingency plans; and, internal controls over management practices and processes. At the provincial level, SaskCentral manages a provincial statutory liquidity pool on behalf of Saskatchewan credit unions. At the national level, Credit Union Central of Canada maintains required levels of marketable securities to support national system liquidity needs.
Liquidity management frameworkThe Credit Union’s liquidity management framework and liquidity targets and strategies are reviewed and documented in a Liquidity Management Plan. The plan also identifies the long-term liquidity requirements of the Credit Union and describes the strategies to meet any funding needs. The plan is periodically reviewed by management and approved by the board of directors. Liquidity risk is managed in accordance to specific operating and board policies. Board policies set out the level of acceptable liquidity risk and the Credit Union’s processes and controls for managing liquidity. As required by policy, the Credit Union has established limits and requirements with respect to: level of liquid assets; quality of liquid assets; concentration limits, cash flow mismatch limits and procedural control requirements with respect to measuring and monitoring liquidity risk. Fundamental to the Credit Union’s liquidity management framework is the assessment of the adequacy of liquidity under both normal operating conditions and under stress conditions. Stress conditions may include a liquidity event or crisis. The Credit Union maintains appropriate contingency plans to handle such an event.
Deposit liabilities are the Credit Union’s primary funding source. Accordingly, diversification of deposits by product type, counterparty and term structure is an important element of the liquidity management framework. The Credit Union maintains access to borrowings facilities as detailed in Note 11 to augment and diversify liquidity requirements. The Credit Union also uses securitization, loan sales and syndications to manage funding requirements. The primary measurement of the adequacy of the liquidity at the Credit Union is the operating liquidity ratio. This ratio is calculated as available liquidity and cash inflows divided by cash outflows. The Credit Union seeks to maintain this ratio at greater than or equal to 150%.
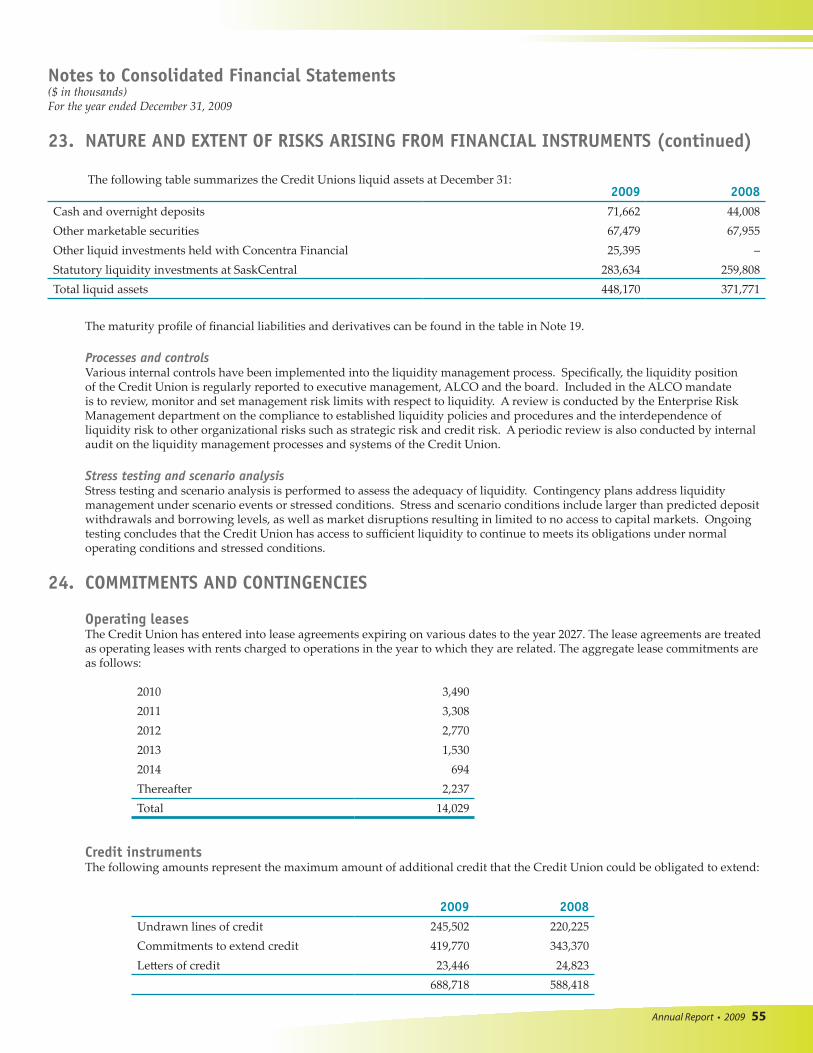
Annual Report • 2009 55
Notes to Consolidated Financial Statements($ in thousands)For the year ended December 31, 2009
23. NATURE AND EXTENT OF RISKS ARISING FROM FINANCIAL INSTRUMENTS (continued)
The following table summarizes the Credit Unions liquid assets at December 31: 2009 2008
Cash and overnight deposits 71,662 44,008Other marketable securities 67,479 67,955Other liquid investments held with Concentra Financial 25,395 –Statutory liquidity investments at SaskCentral 283,634 259,808Total liquid assets 448,170 371,771
The maturity profile of financial liabilities and derivatives can be found in the table in Note 19. Processes and controlsVarious internal controls have been implemented into the liquidity management process. Specifically, the liquidity position of the Credit Union is regularly reported to executive management, ALCO and the board. Included in the ALCO mandate is to review, monitor and set management risk limits with respect to liquidity. A review is conducted by the Enterprise Risk Management department on the compliance to established liquidity policies and procedures and the interdependence of liquidity risk to other organizational risks such as strategic risk and credit risk. A periodic review is also conducted by internal audit on the liquidity management processes and systems of the Credit Union.
Stress testing and scenario analysis Stress testing and scenario analysis is performed to assess the adequacy of liquidity. Contingency plans address liquidity management under scenario events or stressed conditions. Stress and scenario conditions include larger than predicted deposit withdrawals and borrowing levels, as well as market disruptions resulting in limited to no access to capital markets. Ongoing testing concludes that the Credit Union has access to sufficient liquidity to continue to meets its obligations under normal operating conditions and stressed conditions.
24. COMMITMENTS AND CONTINGENCIES
Operating leases The Credit Union has entered into lease agreements expiring on various dates to the year 2027. The lease agreements are treated as operating leases with rents charged to operations in the year to which they are related. The aggregate lease commitments are as follows:
Credit instrumentsThe following amounts represent the maximum amount of additional credit that the Credit Union could be obligated to extend:
2010 3,4902011 3,3082012 2,7702013 1,5302014 694Thereafter 2,237Total 14,029
2009 2008Undrawn lines of credit 245,502 220,225Commitments to extend credit 419,770 343,370Letters of credit 23,446 24,823
688,718 588,418
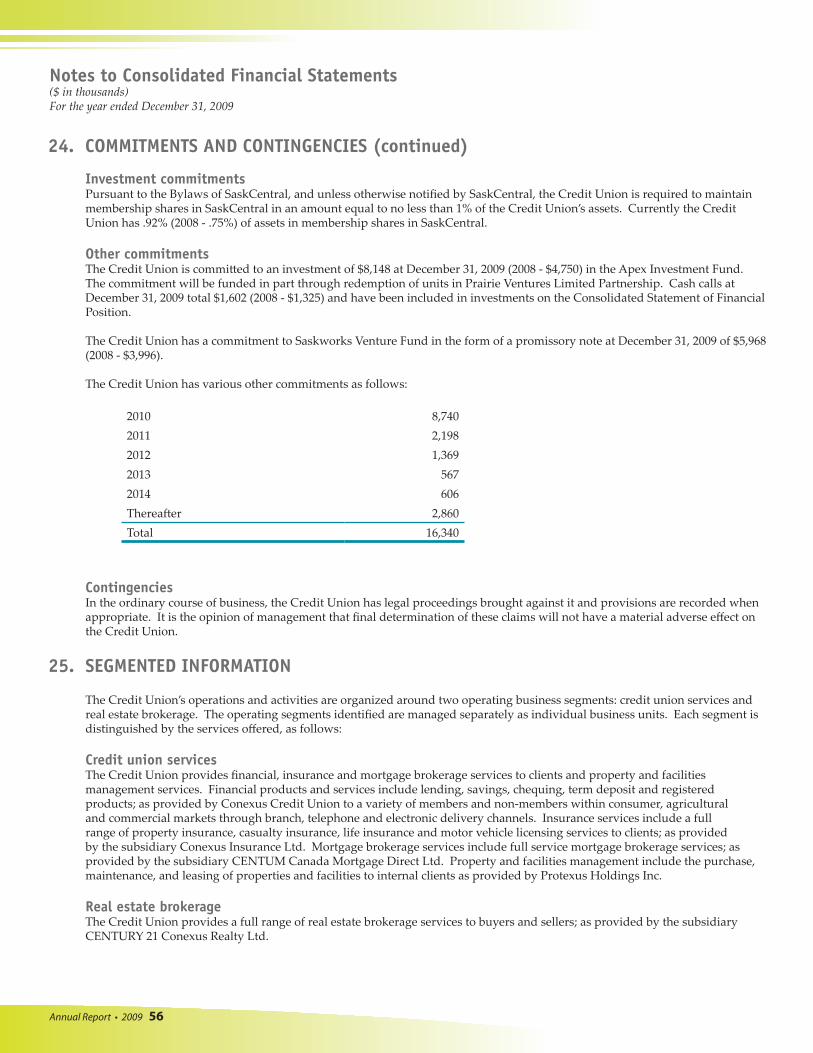
Annual Report • 2009 56
Investment commitmentsPursuant to the Bylaws of SaskCentral, and unless otherwise notified by SaskCentral, the Credit Union is required to maintain membership shares in SaskCentral in an amount equal to no less than 1% of the Credit Union’s assets. Currently the Credit Union has .92% (2008 - .75%) of assets in membership shares in SaskCentral.
Other commitmentsThe Credit Union is committed to an investment of $8,148 at December 31, 2009 (2008 - $4,750) in the Apex Investment Fund. The commitment will be funded in part through redemption of units in Prairie Ventures Limited Partnership. Cash calls at December 31, 2009 total $1,602 (2008 - $1,325) and have been included in investments on the Consolidated Statement of Financial Position.
The Credit Union has a commitment to Saskworks Venture Fund in the form of a promissory note at December 31, 2009 of $5,968 (2008 - $3,996).
The Credit Union has various other commitments as follows:
ContingenciesIn the ordinary course of business, the Credit Union has legal proceedings brought against it and provisions are recorded when appropriate. It is the opinion of management that final determination of these claims will not have a material adverse effect on the Credit Union.
25. SEGMENTED INFORMATION
The Credit Union’s operations and activities are organized around two operating business segments: credit union services and real estate brokerage. The operating segments identified are managed separately as individual business units. Each segment is distinguished by the services offered, as follows:
Credit union services The Credit Union provides financial, insurance and mortgage brokerage services to clients and property and facilities management services. Financial products and services include lending, savings, chequing, term deposit and registered products; as provided by Conexus Credit Union to a variety of members and non-members within consumer, agricultural and commercial markets through branch, telephone and electronic delivery channels. Insurance services include a full range of property insurance, casualty insurance, life insurance and motor vehicle licensing services to clients; as provided by the subsidiary Conexus Insurance Ltd. Mortgage brokerage services include full service mortgage brokerage services; as provided by the subsidiary CENTUM Canada Mortgage Direct Ltd. Property and facilities management include the purchase, maintenance, and leasing of properties and facilities to internal clients as provided by Protexus Holdings Inc. Real estate brokerage The Credit Union provides a full range of real estate brokerage services to buyers and sellers; as provided by the subsidiary CENTURY 21 Conexus Realty Ltd.
2010 8,7402011 2,1982012 1,3692013 5672014 606Thereafter 2,860Total 16,340
24. COMMITMENTS AND CONTINGENCIES (continued)
Notes to Consolidated Financial Statements($ in thousands)For the year ended December 31, 2009
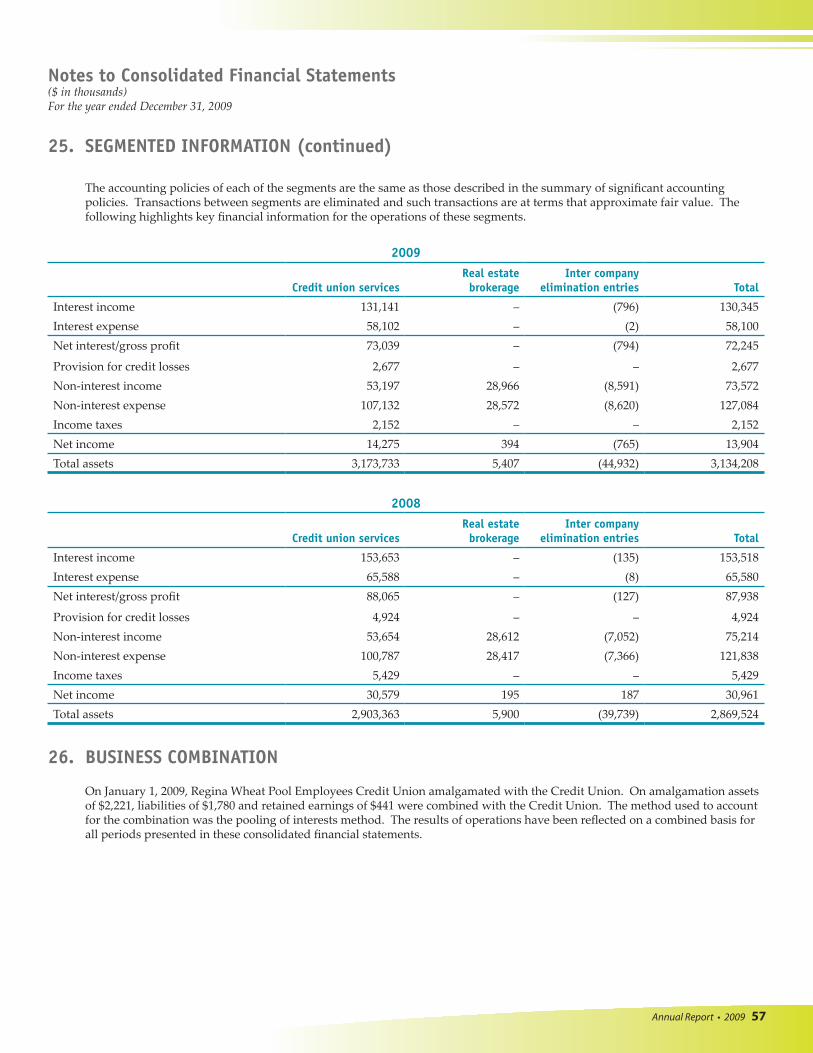
Annual Report • 2009 57
The accounting policies of each of the segments are the same as those described in the summary of significant accounting policies. Transactions between segments are eliminated and such transactions are at terms that approximate fair value. The following highlights key financial information for the operations of these segments.
26. BUSINESS COMBINATION
On January 1, 2009, Regina Wheat Pool Employees Credit Union amalgamated with the Credit Union. On amalgamation assets of $2,221, liabilities of $1,780 and retained earnings of $441 were combined with the Credit Union. The method used to account for the combination was the pooling of interests method. The results of operations have been reflected on a combined basis for all periods presented in these consolidated financial statements.
2009
Credit union servicesReal estate brokerage
Inter company elimination entries Total
Interest income 131,141 – (796) 130,345Interest expense 58,102 – (2) 58,100Net interest/gross profit 73,039 – (794) 72,245
Provision for credit losses 2,677 – – 2,677Non-interest income 53,197 28,966 (8,591) 73,572Non-interest expense 107,132 28,572 (8,620) 127,084Income taxes 2,152 – – 2,152Net income 14,275 394 (765) 13,904Total assets 3,173,733 5,407 (44,932) 3,134,208
2008
Credit union servicesReal estate brokerage
Inter company elimination entries Total
Interest income 153,653 – (135) 153,518Interest expense 65,588 – (8) 65,580Net interest/gross profit 88,065 – (127) 87,938
Provision for credit losses 4,924 – – 4,924Non-interest income 53,654 28,612 (7,052) 75,214Non-interest expense 100,787 28,417 (7,366) 121,838Income taxes 5,429 – – 5,429Net income 30,579 195 187 30,961Total assets 2,903,363 5,900 (39,739) 2,869,524
25. SEGMENTED INFORMATION (continued)
Notes to Consolidated Financial Statements($ in thousands)For the year ended December 31, 2009
Annual Report • 2009 58
Notes to Consolidated Financial Statements($ in thousands)For the year ended December 31, 2009
27. COMPARATIVE FIGURES
The comparative figures and financial statements as at December 31, 2008 and for the year then ended were reported on by other auditors who expressed an opinion without reservation on those statements in their report dated January 30, 2009.
Certain of these comparative figures have been reclassified to conform to the presentation adopted in the current year.
28. FUTURE ACCOUNTING CHANGES
In February 2008, the Canadian Accounting Standards Board announced that Canadian generally accepted accounting principles (GAAP) for publicly accountable enterprises will be replaced by International Financial Reporting Standards (IFRS) for fiscal years beginning on or after January 1, 2011. The Credit Union is specifically scoped into the definition of a publicly accountable enterprise. As such, the Credit Union will be required to prepare its December 31, 2011 consolidated financial statements including comparative information in compliance with IFRS. Due to the requirement for comparative information, the transition date to IFRS will be January 1, 2010, with both Canadian GAAP and IFRS accounting being tracked in 2010. The impact of the transition to IFRS on the Credit Union’s consolidated financial statements has not yet been determined. Management of the transition processIn the prior year, the Credit Union established an IFRS team from within the Corporate Finance department with assistance from various other functional areas as needed. This IFRS team reports to the Audit and Risk Committee of the board of directors on a regular basis. The IFRS team has developed a detailed workflow plan for all IFRS areas of transition to ensure that each phase of the transition project is completed on schedule and to ensure a smooth implementation. The Credit Union will monitor ongoing changes to IFRS through the IFRS transition process. The Credit Union is also participating in the National IFRS Readiness Project for Credit Unions sponsored by Credit Union Central of Canada.
The Credit Union’s transition process consists of 3 phases as follows:
Planning phaseThis phase involved setting out the timetable for transition and identifying differences in key accounting policies between Canadian GAAP and IFRS. It also involved an assessment of complex areas and a basic stocktaking of resources available to implement the process.
The planning phase was essentially completed by June 30, 2009.
Diagnosis phaseThe diagnosis phase involves a more detailed analysis of IFRS impacts on the Credit Union. Decisions will be made on exemptions and options provided under IFRS 1 First-time Adoption of IFRS. Impairment testing will be performed on opening balance sheet carrying values of assets at January 1, 2010. Detailed position papers will be prepared for key differences between Canadian GAAP and IFRS with assistance from the National IFRS Project mentioned above.
This phase has commenced and is due for completion March 31, 2010.
Conversion phaseDuring the first part of this phase, changes required to accounting and reporting systems will be finalized and tested. All transition adjustments will be calculated and recorded resulting in an opening balance sheet on transition as at January 1, 2010. Training will be undertaken to ensure that all stakeholders understand the amended financial statements of the Credit Union. The second part of this phase will involve gathering information for the significant increase in disclosures required under IFRS. All disclosures will require comparative numbers for 2010.
The first part of this phase is expected to be completed by December 31, 2010, with the second part being completed by December 31, 2011.

Annual Report • 2009 60