Embed Size (px)
Citation preview

Björn Gustafsson
Katarina Katz
Torun Österberg
Paper presented at the
Conference Dynamics of Low Wage, Low Pay and Transfer Receipt, Nuremberg, November 15-1 2013
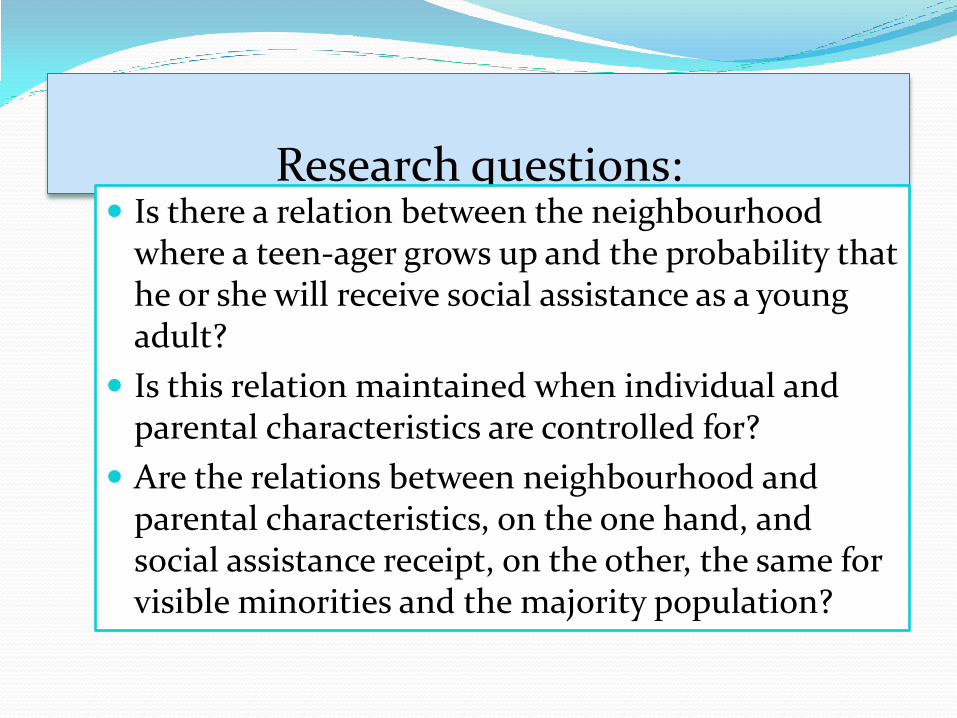
Research questions: Is there a relation between the neighbourhood
where a teen-ager grows up and the probability that he or she will receive social assistance as a young adult?
Is this relation maintained when individual and parental characteristics are controlled for?
Are the relations between neighbourhood and parental characteristics, on the one hand, and social assistance receipt, on the other, the same for visible minorities and the majority population?

Cautionary remark: A correlation between neighbourhood characteristics
is not necessarily causal.
Compare the large literature on intergenerational correlations in receipt.
But finding the characteristics associated with an elevated risk of needing social assistance has worthwhile policy implications.

Background: Poverty in Sweden
Increased income and earnings dispersion since
the 1980s.
Poverty very much linked to entry into the labour
market:
Young adults.
This poverty is often transitory (as is SA receipt).
Recent immigrants, many with a non European
origin.

Background:
The more difficult transition from youth to
adulthood
Youth unemployment has become a major problem.
Most young adults are not eligible for UI.
In Sweden many young adults have left the parental home,
parents are not legally responsible for their maintenance.
Johansson and Palmer (2010) show that while equivalent
disposable income increased substantially for most in
Sweden between 1991 and 2007, this was not the case for
those 20 to 25.
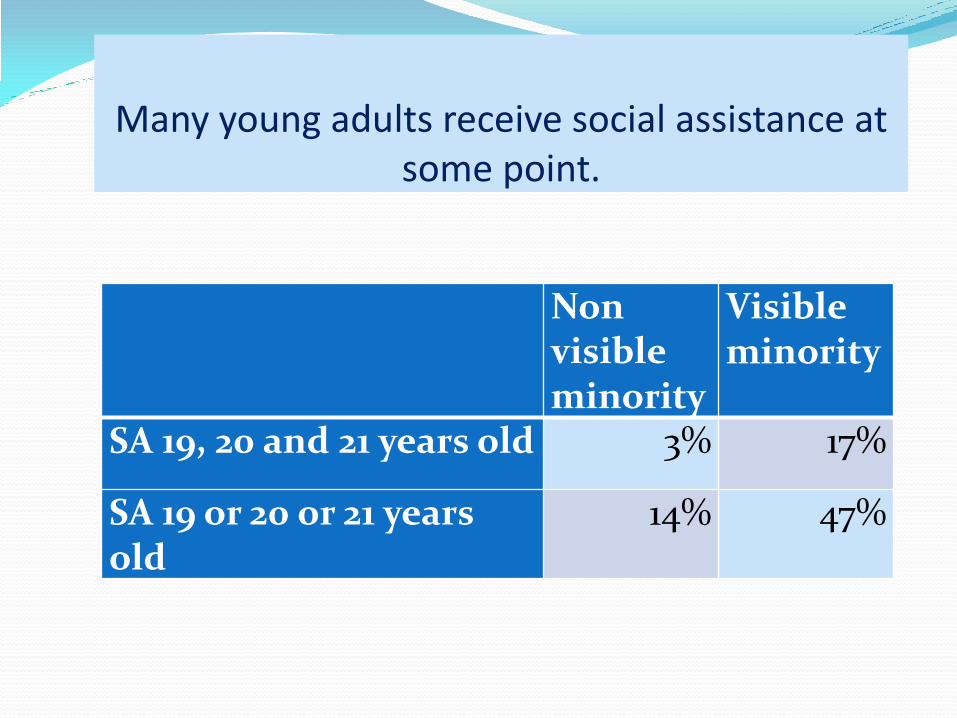
Many young adults receive social assistance at some point.
Non visible minority
Visible minority
SA 19, 20 and 21 years old 3% 17%
SA 19 or 20 or 21 years old
14% 47%
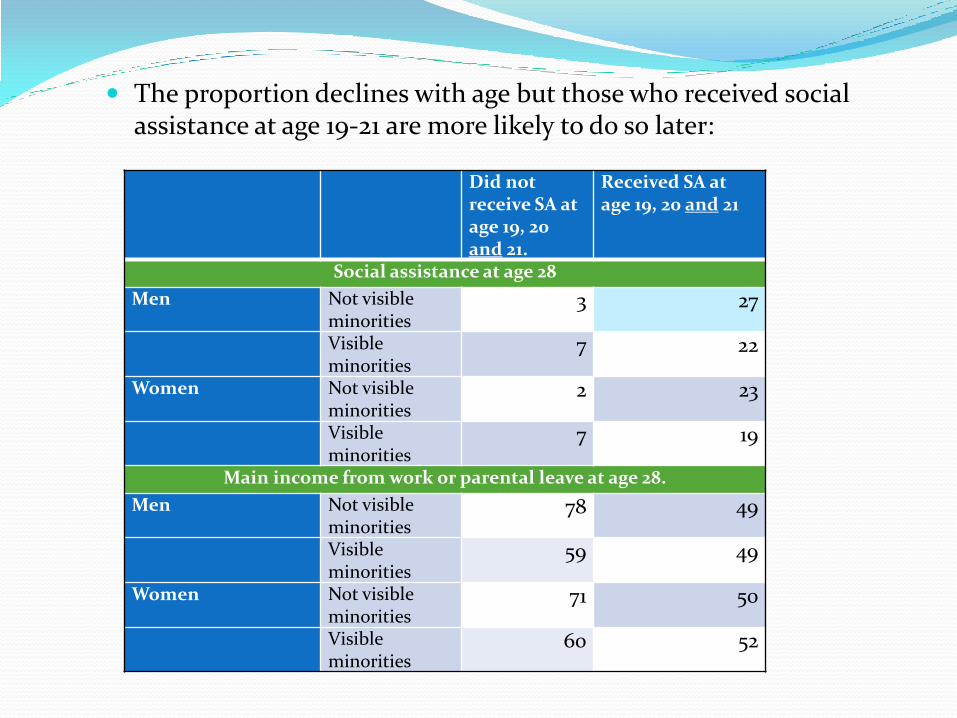
The proportion declines with age but those who received social assistance at age 19-21 are more likely to do so later:
Did not receive SA at age 19, 20 and 21.
Received SA at age 19, 20 and 21
Social assistance at age 28
Men Not visible minorities
3 27
Visible minorities
7 22
Women Not visible minorities
2 23
Visible minorities
7 19
Main income from work or parental leave at age 28.
Men Not visible minorities
78 49
Visible minorities
59 49
Women Not visible minorities
71 50
Visible minorities
60 52

Visible minorities Term used for lack of a better. ”Visible minorities”: includes persons with both parents born in
Asia Africa Latin America South-East Europe
”Not visible minorities” (aka ”majority population”, ”others”):
includes persons with at least one parent born in Sweden other European countries except South-East Europe Anglo-America Oceania

Previous Swedish studies Brännström (2004) studying persons born 1953 and
living in Stockholm find now effect of disadvantaged neighbourhood on SA receipt when aged 16 to 19. In contrast Mood (2004) and Brännström (2011) using other data find positive relations.
We use the same database as Brännström (2011), but differ in a number of respects.
Stenberg (2000) and Ringbäck Weitoft et al. (2008) have found intergenerational links in SA receipt. According to Edmark and Hanspers (2011) using siblings approach is the link not causal.

Research areas and populations studied
Of Sweden’s nine million inhabitants 39 per cent live in the three metropolitan regions of:
Stockholm: 24 municipalities.
Gothenburg: 8 municipalities.
Malmö: 9 municipalities.

Samples
All persons born 1985 living in one of the three metropolitan regions in 2001.
Parental information relates to 2001.
Majority sample: 24 582 persons
Minority sample: 5 930 persons.
We follow individuals also after they have moved out of Metropolitan Sweden.
Very little attrition (emigrated and deceased persons).
Neighbourhoods
A classification created for research. Population size of typically 4 000 to 10 000 inhabitants.
In some analyses we classify neighbourhoods according to economic type and ethnic type into seven categories.
From our data we derive a number of social indicators of the neighbourhood. Of particular interest is the rate of SA receipt in the neighbourhood. It varies between 1 and 60 per cent.

Three example of neighbourhoods and their
characteristics
Per cent SA receivers
Per cent immigrated since 1980
Swedish back-ground
Per cent visible minorities
Per cent with at most basic education
Djupadal 0.3 0.6 94 1.2 12
Jungfru-platsen
3 7 87 6 23
Hammar-kullen
41 55 31 60 31
S. Rosengård
59 77 12 81 32


Neighbourhood type 2001 for birth-cohort 1985
0%
10%
20%
30%
40%
50%
60%
70%
80%
90%
100%
Non "visible minorities" Visible minorities
Neighbourhood type for cohort 1985
Poor- concentration of visible minorities
Poor- ethnically integrated
Medium poor - ethically integrated toconcentration of visible minorities
Medium poor- mainly Swedish background
Rich - ethnically integrated
Medium rich - mainly Swedish background
Rich mainly Swedish background

Not visible
minority
Visible
minority
Quartile 1 15% 61%
Quartile 2 19% 21%
Quartile 3 26% 12%
Quartile 4 41% 7%
Social assistance 4% 35%
Educational level in the HH
Lt than 9 years of elementary schooling 1% 13%
Elementary schooling 9 years 7% 15%
Upper secondary 2 years 26% 23%
Upper secondary 3 years 13% 16%
Post-secondary lt 3 years 18% 11%
Post-secondary 3 years or more 30% 15%
Post graduate studies 3% 2%
Education info missing 0% 5%
Individual completed upper secondary when 19 years old 75% 61%
Individual completed upper secondary when 21 years old 86% 76%
Individual woman child 0-3 years 2% 4%
Individual man child 0-3 years 1% 2%
Two adult person HH 68% 66%
No adult woman in the HH 6% 5%
No adult man in the HH 26% 29%

Majority Visible minorities
Background country for HH
Sweden 92%
Other Nordic countries 4%
Other western Europe 1%
Other north eastern Europe 3%
Southern Europe 20%
Middle East and North Africa 49%
South America 9%
Other Africa 10%
Other Asia 10%
Immigration year of the family
Before 1980 18%
1980-1986 26%
1987-1990 18%
1991-1994 25%
1995-1998 11%
1999-2001 3%
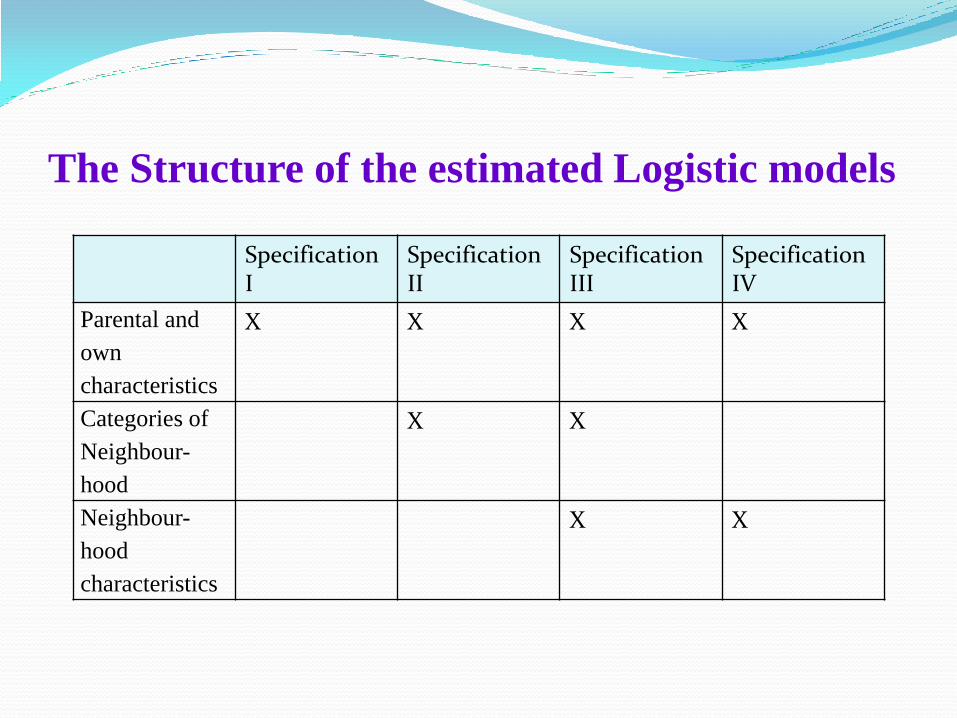
The Structure of the estimated Logistic models
Specification I
Specification II
Specification III
Specification IV
Parental and
own
characteristics
X X X X
Categories of
Neighbour-
hood
X X
Neighbour-
hood
characteristics
X X

Variables in models Model 1: Parents’ region of birth, highest educational level
in BHH, quartile for BHH disposable income, BHH receives social assistance, two adults in BHH, gender, resp. has completed upper-secondary school at age 19, having a child*gender
Model 2 adds (dummies for) neighbourhood type
Model 3 adds neighbourhood characteristics: share children, share with at least upper-secondary school, share without known level of education, share receiving social assistance (splined), share HHs with two adults.
Model 4: Parental and neighbourhood characteristics

Results from model estimates I
Type of neighbourhood matters, but hardly at all when characteristics of neighbourhood are included. In this case the rate of SA receipt in the neighbourhood matters.
Own secondary education has a negative effect on SA receipt and having become a young parent has a positive effect.
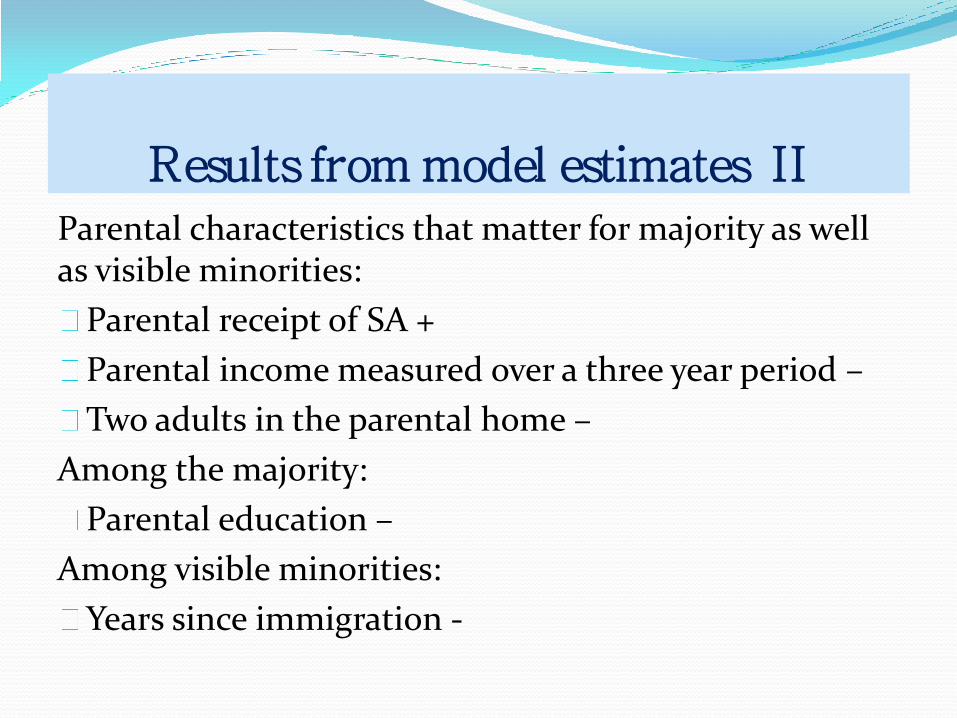
Results from model estimates II Parental characteristics that matter for majority as well as visible minorities:
Parental receipt of SA +
Parental income measured over a three year period –
Two adults in the parental home –
Among the majority:
Parental education –
Among visible minorities:
Years since immigration -

Results from model estimates II Parental Characteristics that matter for majority as well as visible minorities:
Parental receipt of SA +
Parental income measured over a three year period –
Two adults in the parental home –
Among the majority:
Parental education –
Among visible minorities:
Years since immigration -
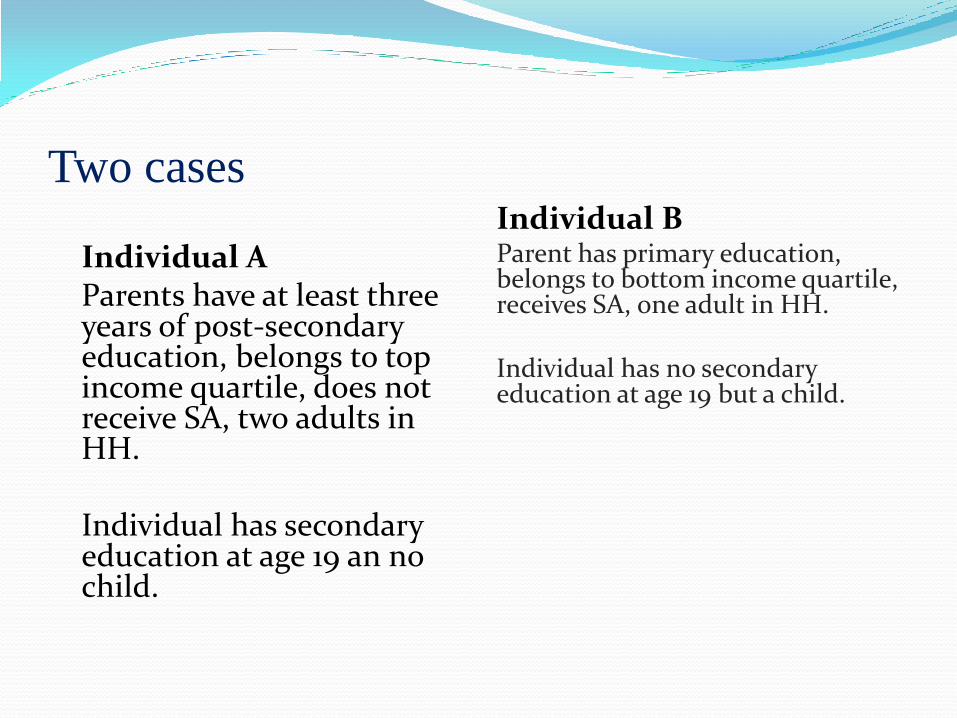
Two cases
Individual A Parents have at least three years of post-secondary education, belongs to top income quartile, does not receive SA, two adults in HH. Individual has secondary education at age 19 an no child.
Individual B Parent has primary education, belongs to bottom income quartile, receives SA, one adult in HH. Individual has no secondary education at age 19 but a child.
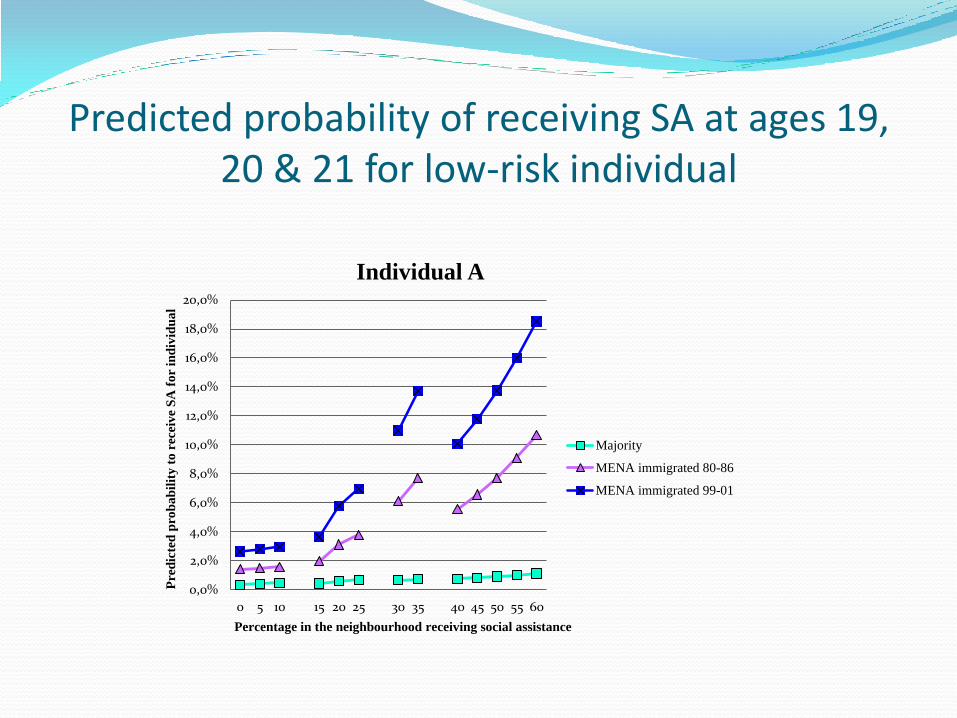
Predicted probability of receiving SA at ages 19, 20 & 21 for low-risk individual
0,0%
2,0%
4,0%
6,0%
8,0%
10,0%
12,0%
14,0%
16,0%
18,0%
20,0%
0 5 10 15 20 25 30 35 40 45 50 55 60
Pre
dic
ted
pro
ba
bil
ity
to
rec
eiv
e S
A f
or
ind
ivid
ua
l
Percentage in the neighbourhood receiving social assistance
Individual A
Majority
MENA immigrated 80-86
MENA immigrated 99-01
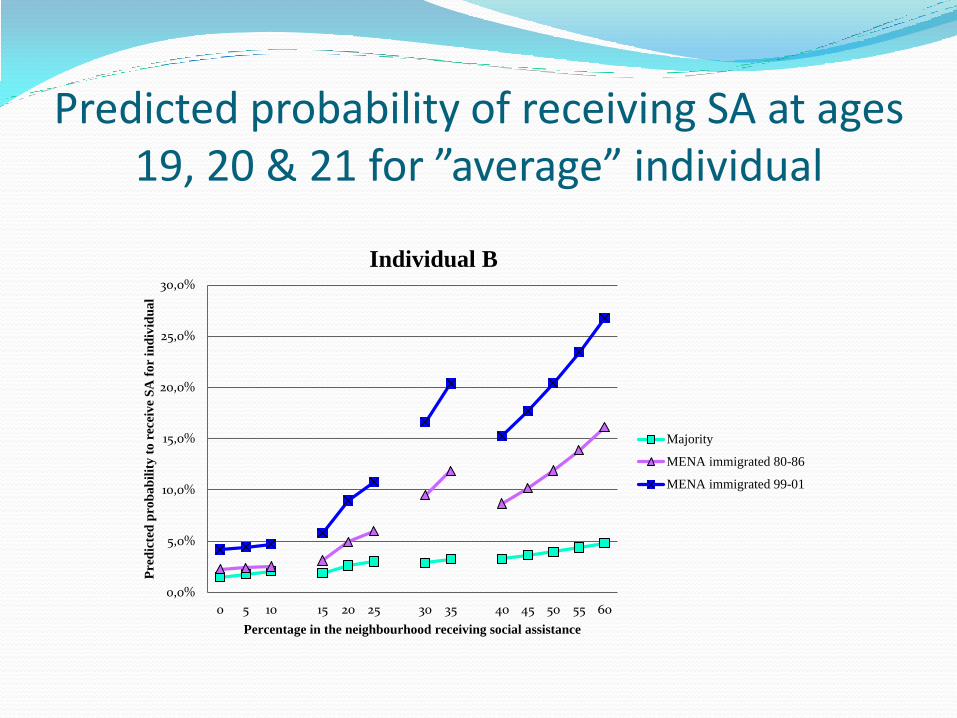
Predicted probability of receiving SA at ages 19, 20 & 21 for ”average” individual
0,0%
5,0%
10,0%
15,0%
20,0%
25,0%
30,0%
0 5 10 15 20 25 30 35 40 45 50 55 60
Pre
dic
ted
pro
ba
bil
ity
to
rece
ive
SA
fo
r in
div
idu
al
Percentage in the neighbourhood receiving social assistance
Individual B
Majority
MENA immigrated 80-86
MENA immigrated 99-01

Predicted probability of receiving SA at ages 19, 20 & 21 for low-risk individual
0,0%
10,0%
20,0%
30,0%
40,0%
50,0%
60,0%
70,0%
80,0%
90,0%
100,0%
0 5 10 15 20 25 30 35 40 45 50 55 60
Pre
dic
ted
pro
ab
ilit
y t
o r
ece
ive
SA
fo
r in
div
idu
al
Percentage in the neighbourhood receiving social assistance
Individual C
Majority
MENA immigrated 80-86
MENA immigrated 99-01
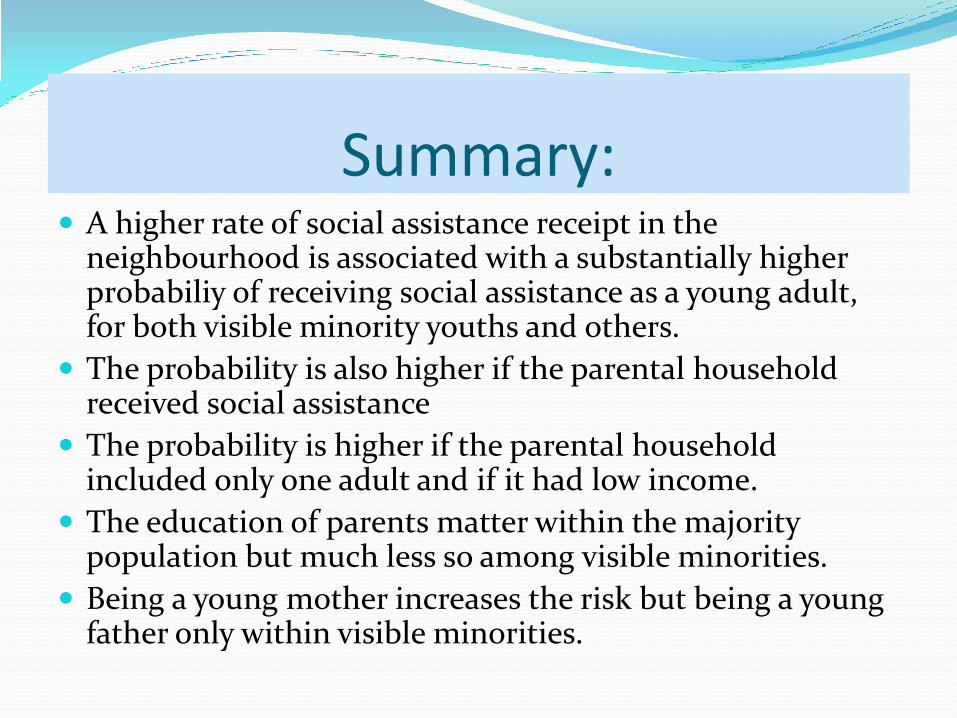
Summary: A higher rate of social assistance receipt in the
neighbourhood is associated with a substantially higher probabiliy of receiving social assistance as a young adult, for both visible minority youths and others.
The probability is also higher if the parental household received social assistance
The probability is higher if the parental household included only one adult and if it had low income.
The education of parents matter within the majority population but much less so among visible minorities.
Being a young mother increases the risk but being a young father only within visible minorities.

Why could there be a correlation with s. a. receipt in the neighbourhood?
Different social welfare offices/officers may interpret rules differently.
In neighbourhoods where few people recieve social assistance, those eligible may not know how to apply. If many do this knowledge is better disseminated.
There may be less of a stigma or embarrassment if many in the neighbourhood receive it.
There may be selection effects in who comes to live in neighbourhoods with high receipt of social assistance.
Where many people are in need of social assistance, it may be harder to help friends, relations and neighbours in a crisis. (Analogously if parents receive social assistance).
High rate of s. a. receipt is correlated with low employment rate – hence fewer useful contacts to facilitate labour market entry.
Thank you for your attention!

Estimates Majority sample 1 Model 1 Model 2
Model 3 Model 4
OR (95% Wald conf
limits)
OR (95% Wald
conf limits)
OR (95% Wald
conf limits)
OR (95% Wald
conf limits)
Man 0,83 0,71 0,98 0,83 0,7 0,97 0,82 0,70 0,96 0,82 0,70 0,96
Background country for HH Ref: Sweden
Other Nordic countries 1,05 0,78 1,43 0,93 0,68 1,26 0,93 0,69 1,27 0,92 0,68 1,26
Other western Europe 1,23 0,75 2,02 1,11 0,67 1,83 1,10 0,66 1,82 1,09 0,65 1,80
Other northeast Europe 1,55 1,12 2,15 1,32 0,95 1,84 1,28 0,92 1,79 1,29 0,92 1,80
Highest educational level in HH, Ref: Gymnasium 2 years
Graduate program 0,36 0,13 0,98 0,43 0,16 1,17 0,37 0,13 1,01 0,37 0,13 1,02
Post-secondary ≥ 3 yrs 0,52 0,39 0,67 0,59 0,45 0,77 0,55 0,42 0,73 0,55 0,42 0,73
Post-secondary < 3 years 0,53 0,4 0,7 0,57 0,43 0,76 0,56 0,42 0,75 0,56 0,42 0,74
Upper-secondary 3 years 0,85 0,67 1,08 0,87 0,68 1,11 0,87 0,68 1,11 0,87 0,68 1,11
Elementary schooling 1,15 0,93 1,43 1,09 0,88 1,35 1,07 0,87 1,33 1,08 0,87 1,34
Lt elementary schooling 1,69 1,12 2,55 1,53 1,01 2,31 1,55 1,02 2,36 1,52 1,00 2,31
No information 1,83 1,07 3,15 1,8 1,04 3,13 1,69 0,97 2,95 1,69 0,97 2,95
Income quartile of HH. Ref. Q1
Quartile 2 0,76 0,63 0,93 0,77 0,64 0,94 0,78 0,64 0,95 0,78 0,65 0,95
Quartile 3 0,55 0,45 0,68 0,58 0,47 0,72 0,58 0,47 0,72 0,59 0,47 0,73
Quartile 4 0,28 0,21 0,36 0,31 0,24 0,41 0,31 0,24 0,41 0,32 0,24 0,41

Model 1 Model 2
Model 3 Model 4
OR (95% Wald
conf limits)
OR (95% Wald conf
limits)
OR (95%
Wald conf
limits)
OR (95% Wald
conf limits)
BHH receives SA 6,79 5,67 8,1
3
6,31 5,26 7,57 6,07 5,06 7,29 6,07 5,06 7,28
BHH adults 0,52 0,44 0,6
2
0,54 0,46 0,64 0,58 0,49 0,69 0,58 0,49 0,69
At least upper-secondary school age 19 0,23 0,20 0,2
7
0,24 0,21 0,28 0,24 0,21 0,28 0,24 0,21 0,28
Man and child 0-3 years 1,7 0,91 3,1
9
1,65 0,88 3,06 1,62 0,87 3,03 1,59 0,85 2,96
Women have child 0-3 years 3,39 2,55 4,5 3,12 2,34 4,15 3,14 2,35 4,19 3,10 2,32 4,13
Neighbourhood type Ref: ekoetngr7
EKOETNGR1 0,31 0,22 0,44 1,23 0,62 2,43
EKOETNGR2 0,42 0,32 0,55 1,32 0,77 2,28
EKOETNGR3 0,51 0,35 0,74 1,30 0,74 2,29
EKOETNGR4 0,54 0,39 0,74 1,22 0,73 2,04
EKOETNGR5 0,73 0,56 0,95 1,46 0,95 2,25
EKOETNGR6 0,73 0,52 1,03 1,06 0,70 1,60
Percentages in the neighbourhood
Children 1,22 0,42 3,61 1,31 0,47 3,64
Post-secondary education 0,98 0,95 1,00 0,98 0,96 1,00
Upper-secondary education 0,96 0,92 1,00 0,97 0,93 1,01
No educational information 0,96 0,92 1,00 0,96 0,93 1,00
Less then 10 percent recives SA 1,03 0,98 1,08 1,04 0,99 1,08
10-15 percent receives SA 1,02 0,98 1,06 1,02 0,98 1,05
15-25 percent receives SA 1,04 1,01 1,07 1,03 1,01 1,05
25-35 percent recevies SA 1,03 1,00 1,06 1,02 1,00 1,05
More than 35 percent receives SA 1,03 1,01 1,05 1,02 1,00 1,04

Estimates: Visible minority sample
Model 1 Model 2
Model 3 Model 4
OR (95% Wald
conf limits)
OR (95% Wald
conf limits)
OR (95% Wald
conf limits)
OR (95% Wald
conf limits)
Man 1,2 1,02 1,41 1,19 1,01 1,4 1,19 1,01 1,40 1,19 1,00 1,40
Background country for HH Ref: Southern Europé
MENA 1,23 0,98 1,55 1,26 1,00 1,59 1,43 1,13 1,82 1,43 1,13 1,81
South America 1,21 0,86 1,7 1,24 0,88 1,74 1,46 1,03 2,07 1,44 1,02 2,05
Other Africa 1,37 1,03 1,82 1,39 1,04 1,84 1,53 1,14 2,06 1,52 1,13 2,04
Other Asia 0,76 0,55 1,06 0,78 0,56 1,09 0,82 0,58 1,15 0,82 0,58 1,15
Year of immigration for BHH Ref: 4 years or less in the country
Before 1980 0,34 0,23 0,49 0,34 0,23 0,49 0,36 0,25 0,53 0,36 0,25 0,53
1980-1986 0,5 0,37 0,67 0,5 0,37 0,67 0,53 0,39 0,71 0,53 0,39 0,71
1987-1990 0,68 0,52 0,9 0,68 0,51 0,89 0,67 0,51 0,89 0,68 0,51 0,90
1991-1994 0,81 0,64 1,04 0,81 0,63 1,03 0,81 0,63 1,04 0,81 0,64 1,04
199-1998 0,73 0,56 0,96 0,73 0,56 0,96 0,77 0,59 1,01 0,77 0,59 1,01
Highest educational level in HH, Ref: Gymnasium 2 years
Graduate program 0,75 0,32 1,74 0,76 0,33 1,78 0,79 0,33 1,86 0,78 0,33 1,85
Post-secondary ≥ 3 yrs 0,85 0,63 1,13 0,86 0,64 1,15 0,87 0,65 1,17 0,87 0,65 1,17
Post-secondary < 3 years 0,85 0,62 1,17 0,86 0,63 1,19 0,85 0,62 1,17 0,85 0,62 1,17
Upper-secondary 3 years 1,02 0,78 1,34 1,02 0,78 1,34 1,04 0,79 1,36 1,04 0,79 1,36
Lt elementary schooling 1,18 0,91 1,54 1,17 0,9 1,52 1,21 0,92 1,57 1,20 0,92 1,57
No information 1,55 1,12 2,15 1,55 1,12 2,15 1,63 1,17 2,28 1,63 1,17 2,27

Model 1 Model 2
Model 3 Model 4
OR (95% Wald
conf limits)
OR (95% Wald
conf limits)
OR (95% Wald
conf limits)
OR (95% Wald
conf limits)
Quartile for disposable income Ref: Quartile 1
Quartile 2 0,72 0,58 0,91 0,73 0,58 0,92 0,73 0,58 0,92 0,73 0,58 0,92
Quartile 3 0,47 0,33 0,67 0,49 0,34 0,70 0,51 0,35 0,73 0,51 0,36 0,73
Quartile 4 0,49 0,29 0,83 0,51 0,30 0,87 0,52 0,31 0,88 0,52 0,31 0,88
BHH receives SA 5,69 4,75 6,81 5,59 4,67 6,70 5,35 4,46 6,43 5,36 4,47 6,44
BHH adults 0,61 0,51 0,73 0,61 0,51 0,73 0,63 0,53 0,75 0,63 0,53 0,75
At least upper-secondary school age 19 0,56 0,48 0,65 0,56 0,48 0,65 0,55 0,47 0,64 0,55 0,47 0,65
Man and child 0-3 years 2,74 1,69 4,46 2,71 1,66 4,4 2,76 1,69 4,51 2,72 1,67 4,44
Women have child 0-3 years 2,72 1,99 3,72 2,67 1,95 3,65 2,71 1,98 3,73 2,72 1,98 3,73
Neighbourhood type Ref: ekoetngr7
EKOETNGR1 0,68 0,37 1,26 1,25 0,51 3,05
EKOETNGR2 0,86 0,64 1,15 1,22 0,71 2,10
EKOETNGR3 0,78 0,55 1,12 1,27 0,73 2,20
EKOETNGR4 1 0,65 1,53 1,30 0,75 2,23
EKOETNGR5 0,92 0,76 1,12 1,28 0,91 1,79
EKOETNGR6 1,18 0,92 1,5 1,11 0,81 1,51
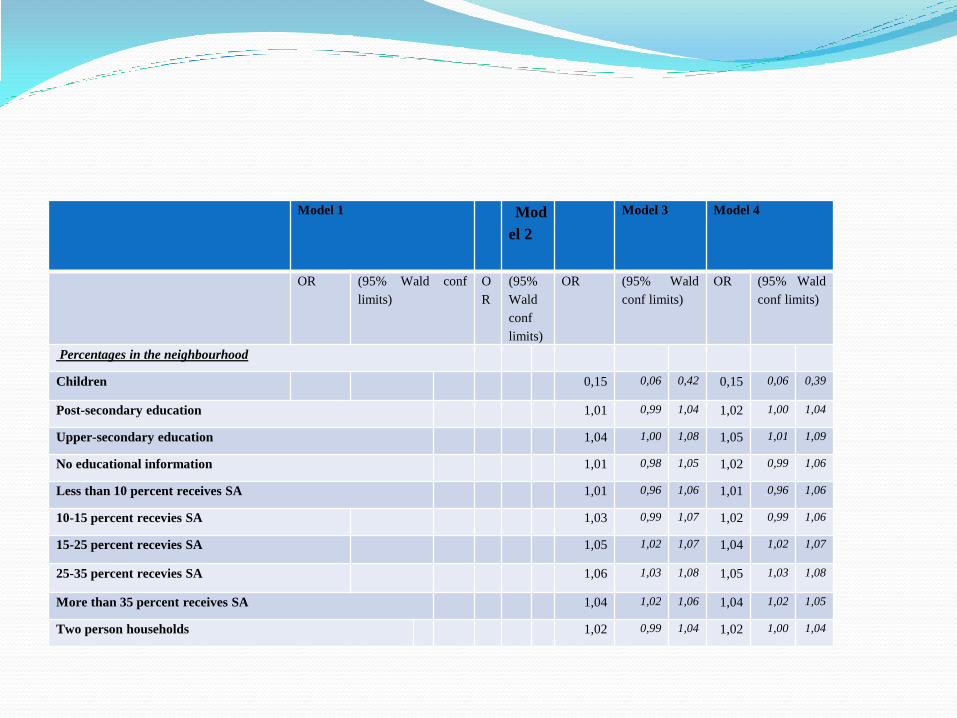
Model 1 Mod
el 2
Model 3 Model 4
OR (95% Wald conf
limits)
O
R
(95%
Wald
conf
limits)
OR (95% Wald
conf limits)
OR (95% Wald
conf limits)
Percentages in the neighbourhood
Children 0,15 0,06 0,42 0,15 0,06 0,39
Post-secondary education 1,01 0,99 1,04 1,02 1,00 1,04
Upper-secondary education 1,04 1,00 1,08 1,05 1,01 1,09
No educational information 1,01 0,98 1,05 1,02 0,99 1,06
Less than 10 percent receives SA 1,01 0,96 1,06 1,01 0,96 1,06
10-15 percent recevies SA 1,03 0,99 1,07 1,02 0,99 1,06
15-25 percent recevies SA 1,05 1,02 1,07 1,04 1,02 1,07
25-35 percent recevies SA 1,06 1,03 1,08 1,05 1,03 1,08
More than 35 percent receives SA 1,04 1,02 1,06 1,04 1,02 1,05
Two person households 1,02 0,99 1,04 1,02 1,00 1,04