Embed Size (px)
Citation preview

CONFIDENTIAL
WSHA CQIP Peer Review and Quality Improvement Information.
Protected from disclosure or discovery under RCW 43.70.510

22
Elliott Main, MDCMQCC Principal Investigatormain@ .org
Chair, Dept OB GYNCalifornia Pacific Medical CenterSan Francisco
Reducing Cesarean Section Rates in the Nulliparous Term Singleton Vertex Populations

: Transforming Maternity Care
Topics:
What are the drivers of the rise in Cesareans? What are the risks to Cesareans? (new data) Marked Variation in CS rates--Public Release NTSV as the focus for Cesarean QI Importance of L&D culture & Labor practices The Joint Commission Measures

: Transforming Maternity Care

: Transforming Maternity Care
Cesarean Births Have Risen by Over 50% in the Last 10 years

: Transforming Maternity Care
Why Have Cesarean Rates Risen?
CesareanRate
PtDesire
MDTime
Sched-ule
MDWorry
Fear ofLabor
Per-fection
MDPride
PeerPressure Safety
Long LOS
What happens if no one cares about the rate?

Cesareans are not Risk-free
New Data

: Transforming Maternity Care
Is There a New Risk/Benefit Calculus for Cesarean Birth?
Old Calculus: “There may be some risks to CS but they are
very small…” With today’s level of care (anesthesia and medical
support) When done on “low risk” women
Therefore, the theoretical “benefits of preserved perineums and less neonatal trauma” (both highly controversial) “outweigh these concerns”.
: Transforming Maternity Care
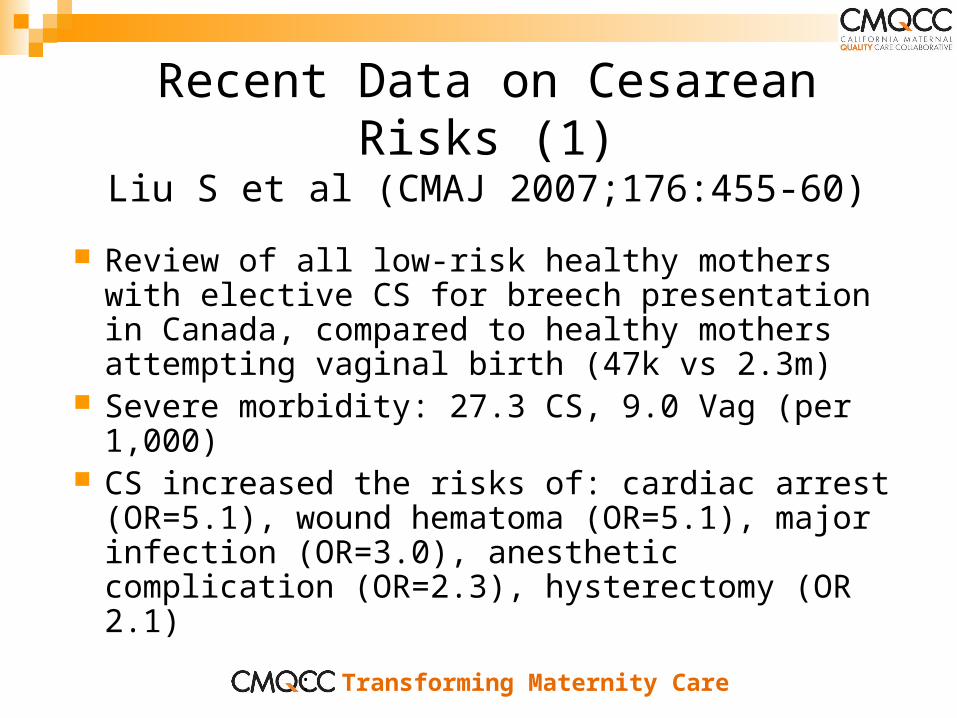
Recent Data on Cesarean Risks (1)Liu S et al (CMAJ 2007;176:455-60)
Review of all low-risk healthy mothers with elective CS for breech presentation in Canada, compared to healthy mothers attempting vaginal birth (47k vs 2.3m)
Severe morbidity: 27.3 CS, 9.0 Vag (per 1,000) CS increased the risks of: cardiac arrest
(OR=5.1), wound hematoma (OR=5.1), major infection (OR=3.0), anesthetic complication (OR=2.3), hysterectomy (OR 2.1)

: Transforming Maternity Care
Recent Data on Cesarean Risks (2)Schutte JM et al
(Acta Obstet Gynecol Scand 2007;86:240-3)
Review of all elective CS (>8,500) for breech presentation in the Netherlands, 2000-2002
4 maternal mortalities (2 VTE, 2 sepsis)for a rate of 1 per 2,127 elective cesareans

: Transforming Maternity Care
Recent Data on Cesarean Risks (3) Spong CY et al (Obstet Gynecol 2007; 110:801-7)
MFM Network Study comparing:Elective Repeat CS (no indication, no labor), N=14,983 (no previas or accretas)Trial of Labor, N=15,323University Medical Centers with 24/7 coverage
Neonatal Deaths
Maternal Deaths
TOL 12 1
Elec Rpt CS 6 5
Elective Rpt CS: 5 maternal deaths were direct: 3 AFE, 1 hemorrhage, 1 anesthetic related

: Transforming Maternity Care
Recent Data on Cesarean Risks (4)Wen SW et al (AJOG 2004; 110:801-7)
Canadian Network Study comparing:1) Elective Repeat CS (low risk) N=179k2) Trial of Labor (low risk), N=129k
TOL: 2 maternal deaths (1.6/100k) Elec Rpt CS: 10 maternal deaths
(5.6/100k) Risk ratio =3.6

: Transforming Maternity Care
Recent Data on Cesarean Risks (5)Knight et al (Ob Gyn 111:97-105, 2008)
Review of all UK peripartum hysterectomies, rate = 1/2,500 births
Prior CS is a major risk:1 prior CS OR=2.12+ prior CS OR=18.6controlled for maternal age, parity, twins, indication for CS

: Transforming Maternity Care
Data courtesy of David Lagrew, MD
Long Beach Memorial Peripartum Hysterectomy Trends

: Transforming Maternity Care
Risks of Being a Prior Cesarean…
Decisions around VBAC-TOL vs. Rpt CB Risk of Uterine Rupture Risk of Hemorrhage/Transfusions Epidemic of Placenta Previas Epidemic of Placenta Accretas Marked Increase of Peripartum
Hysterectomies

: Transforming Maternity Care
But are neonatal outcomes better with higher CS rates?
Cerebral Palsy rates have been stable for the last 25 years
Term neonatal outcomes (neonatal seizures, NICU LOS, ventilator requirement) have not improved over the last 15 years (with the exception of the reduction of postdates babies)
Surman G, etal. Children with cerebral palsy: severity and trends over time. Paediatr Perinat Epidemiol. 2009 Nov;23(6):513-21.
Strauss D, etal. Survival in cerebral palsy in the last 20 years: signs of improvement? Dev Med Child Neurol. 2007 Feb;49(2):86-92.

: Transforming Maternity Care
Neonatal Outcomes Worsen when the Cesarean Rate is Higher than Predicted (I)
Bailit JL, etal. Hospital primary cesarean delivery rates and the risk of poor neonatal outcomes. Am J Obstet Gynecol. 2002;187:721-7.
Data from Washington State birth linked data set, 1995-1996Cesarean Predictive model from maternal demographics and medical complications resulting in an U-Shape curve for baby outcomes

: Transforming Maternity Care
Neonatal Outcomes Worsen when the Cesarean Rate is Higher than Predicted (II)
Gould JB, etal. Cesarean delivery rates and neonatal morbidity in a low-risk population. Obstet Gynecol. 2004;104:11-9.
Data from California birth linked data set, 1998-2000Cesarean Predictive model for low-risk singletons from maternal demographics and medical complications resulting in an U-Shape curve for baby outcomes. Approximately 40% worse outcomes in either direction.
: Transforming Maternity Care
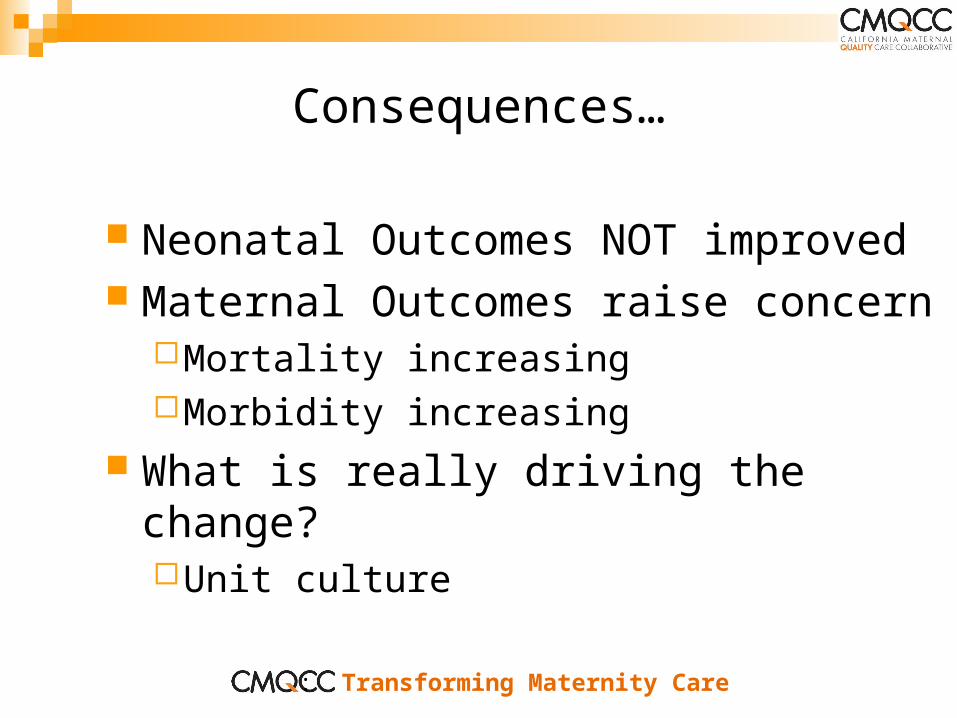
Consequences…
Neonatal Outcomes NOT improved Maternal Outcomes raise concern
Mortality increasingMorbidity increasing
What is really driving the change?Unit culture

Marked Variation
Public Release of Cesarean Data

: Transforming Maternity Care

: Transforming Maternity Care
NY Public Citizen: Web reports of Hospital CS 2007 Data (released 4/21/10)
: Transforming Maternity Care

: Transforming Maternity Care

: Transforming Maternity Care

Issues: Primary CS rate-
right measure?Any other adjusters?“My patients are high risk…”
Attribution?Midwives, FP
Statistical analysis?
36%48%
37%
52%
16%
16%
5%
Physician Level Reporting of
CS Rates

: Transforming Maternity Care
California Maternity Outcomes Show Large Variation (3 to 20-fold)
County Level Data Maternal Mortality Risk-adjusted Cesarean Birth Infant Mortality
Hospital Level Data Obstetric Hemorrhage (0.5 to 14.2%) Maternal Infection (0.2% to 5.1%) Risk-adjusted Cesarean Birth
(Nuliparous, Term, Singleton, Vertex, age-adjusted) Exclusive Breast-feeding at Discharge 3rd/4th Lacerations (fully risk-adjusted)
: Transforming Maternity Care

: Transforming Maternity Care
Low-Risk Primary Cesarean Section Defined:
Number of Cesarean births per 100 births among women who have not previously had a Cesarean section and excludes abnormal presentations, preterm gestations, fetal deaths, multiple gestations, and breech presentations (all strong reasons to perform a cesarean section and are relatively common: 2-8%);
Primary C/S rates are age-adjusted.
OSHPD Data 2006

: Transforming Maternity Care
Age-Adjusted Low-Risk Primary C/S Rates distributed to quintiles and
applied to regions:
Quintile 1 (0-20%): CS rate: 5-13.9% Quintile 2 (20-40%): CS rate: 14-15.9% Quintile 3 (40-60%): CS rate: 16.1-16.9% Quintile 4 (60-80%): CS rate: 17-19% Quintile 5 (80-100%): CS rate: >19%
Low
High

: Transforming Maternity Care
Top and Bottom two Quintiles (40%) of Age-adjustedLow-Risk Primary C/S Rates: Northern CA
HIGH: Hospitals with rates > 17%
n = 32/124 (25%)
LOW: Hospitals with rates < 16%
n=74/124 (60%)
60%25%

: Transforming Maternity Care
Top and Bottom two Quintiles(40%) of Age-AdjustedTop and Bottom two Quintiles(40%) of Age-AdjustedLow Risk Primary C/S Rates: Southern CALow Risk Primary C/S Rates: Southern CA
Hoag memorial
Scripps La Jolla
HIGH: Hospitals with rates >17%
n=34/80 (43%)
LOW: Hospitals with rates < 16%
n=40/80 (50%)
50%43%

: Transforming Maternity Care
Top and Bottom two Quintiles (40%) of Age-AdjustedLow-Risk Primary C/S Rates: LA County CA
HIGH: Hospitals with rates >17%
n=44/60 (73%)
LOW: Hospitals with rates < 16%
n=12/60 (20%)
20%73%

: Transforming Maternity Care
How Many Labor Cesareans are done Without an Indication?
Surprisingly few

The First Pregnancy is the Focus
NTSV
: Transforming Maternity Care
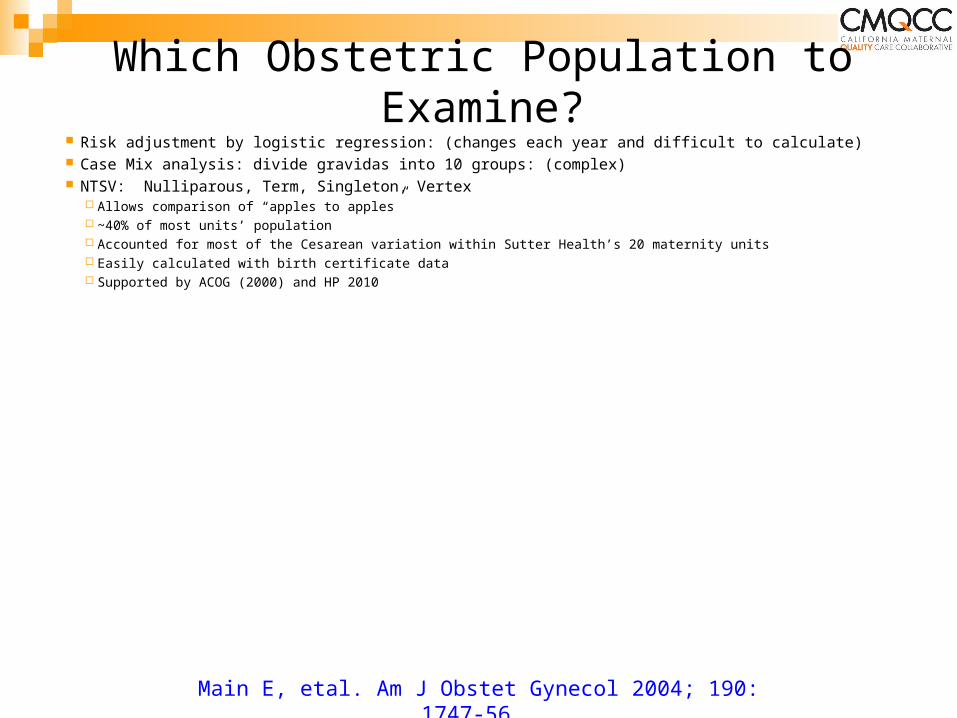
Which Obstetric Population to Examine? Risk adjustment by logistic regression: (changes each year and difficult to calculate) Case Mix analysis: divide gravidas into 10 groups: (complex) NTSV: Nulliparous, Term, Singleton, Vertex
Allows comparison of “apples to apples” ~40% of most units’ population Accounted for most of the Cesarean variation within Sutter Health’s 20 maternity units Easily calculated with birth certificate data Supported by ACOG (2000) and HP 2010
Main E, etal. Am J Obstet Gynecol 2004; 190: 1747-56.

: Transforming Maternity Care
Importance of NTSV population to the CS rate
98% of inter-institutional variation in overall CS rates can be attributed to NTSV (TSCN) rates
Brennan DJ. Am J Obstet Gynecol 2009; 201: 308.e1-8.

: Transforming Maternity Care
How do Obstetric Practices Effect CS Rates?Definitions:
NTSV: Nulliparous, Term, Singleton, Vertex Induction: use of oxytocin, prostaglandins, AROM, or mechanical techniques to begin
labor between 37 and 41 weeks. For this measure 41 wks was considered a “free pass”. Early Labor Admission: under 3cm dilation at time of decision for hospital admission. For
this measure women with ROM, bleeding, or other reasons not to do an admission cervical exam were excluded
Main E, etal. Am J Obstet Gynecol 2006; 194: 1644-52.

: Transforming Maternity Care
NTSV Induction Rate Correlates with NTSV Cesarean Rate
0%
NTSV <41wks Induction Rate
NT
SV
CB
Ra
te
10%
15%
20%
25%
30%
10% 20% 30% 40%
r = 0.57 (r2 =0.32)p<0.0001
-20 Hospitals-Circle size is proportionate to birth rate
Main E, etal. Am J Obstet Gynecol 2006; 194: 1644-52.

: Transforming Maternity Care
NTSV Early Labor Admit Rate Correlates with NTSV Cesarean Rate
NTSV Early Labor (<3cm) Admission Rate
10%
15%
20%
25%
30%
10% 20% 50% 60%30% 40%
r = 0.62 (r2 =0.38)p<0.0001
NT
SV
CB
Ra
te
-20 Hospitals-Circle size is proportionate to birth rate
Main E, etal. Am J Obstet Gynecol 2006; 194: 1644-52.

: Transforming Maternity Care
Combined Induction+Early Admit Rate Correlates BEST with NTSV Cesarean Rate
10%
15%
20%
25%
30%
20% 40% 60% 80%
NTSV Induction Rate + Early Labor Admission Rate
NT
SV
CB
Ra
te
r = 0.73 (r2 =0.53)p<0.0001
Induc. Early Admit
All Births
Main E, etal. Am J Obstet Gynecol 2006; 194: 1644-52.

: Transforming Maternity Care
Dilation < 3cm at Time of Admit Decision & Risk of Cesarean Birth
Data from Sutter Health FPAD:
2001-2002Elliott Main, MD
(inductions excluded N = 4,151)
Relative Risk = 1.9 p < .00001

: Transforming Maternity Care
Cleveland Metro:3,087 Low Risk NTSV women in
spontaneous labor(1993-2001)
Bailit J etal: Obstet Gynecol 2005;105:77-9.
Dilation < 3cm at time of Admit Decision & Risk of Obstetric Complications

: Transforming Maternity CareBailit J etal: Obstet Gynecol 2005;105:77-9.
More Nullips than Multips present in Latent Phase:51% Nullip v. 28% Multip
OR
Active Phase Arrest 2.2 p<0.001
Oxytocin Use 2.3 p<0.001
IUPC Use 2.2 p<0.001
Chorioamnionitis 2.7 p<0.001
Latent Phase Admits in Nullips had more…
Dilation < 3cm at time of Admit Decision & Risk of Obstetric Complications
: Transforming Maternity Care
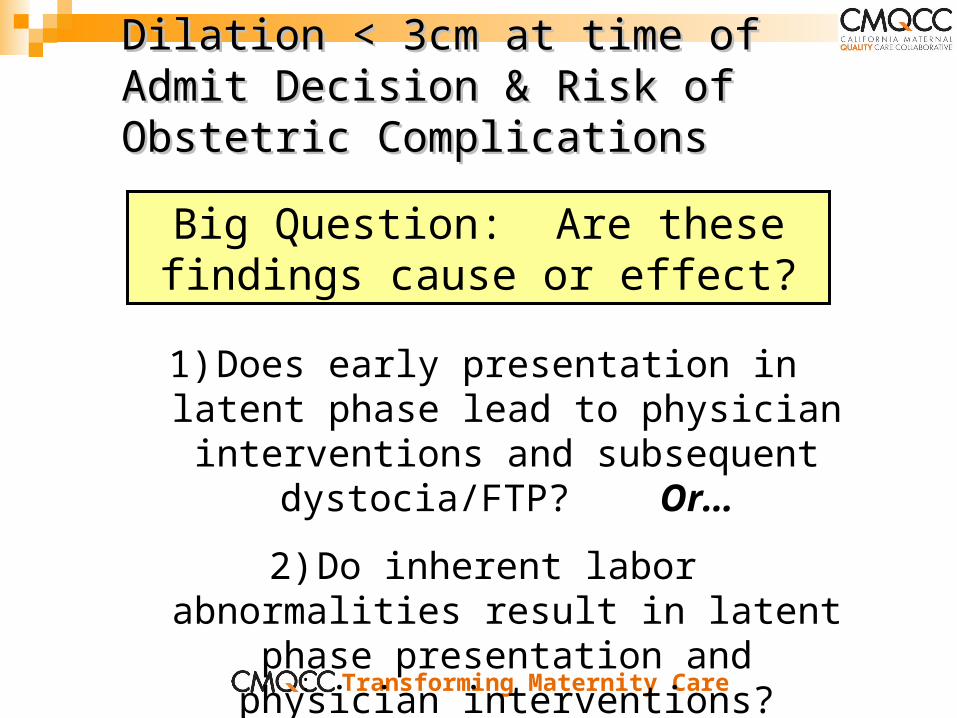
Dilation < 3cm at time of Admit Decision Dilation < 3cm at time of Admit Decision & Risk of Obstetric Complications& Risk of Obstetric Complications
Big Question: Are these findings cause or effect?
1) Does early presentation in latent phase lead to physician interventions and subsequent dystocia/FTP? Or…
2) Do inherent labor abnormalities result in latent phase presentation and physician
interventions?
: Transforming Maternity Care
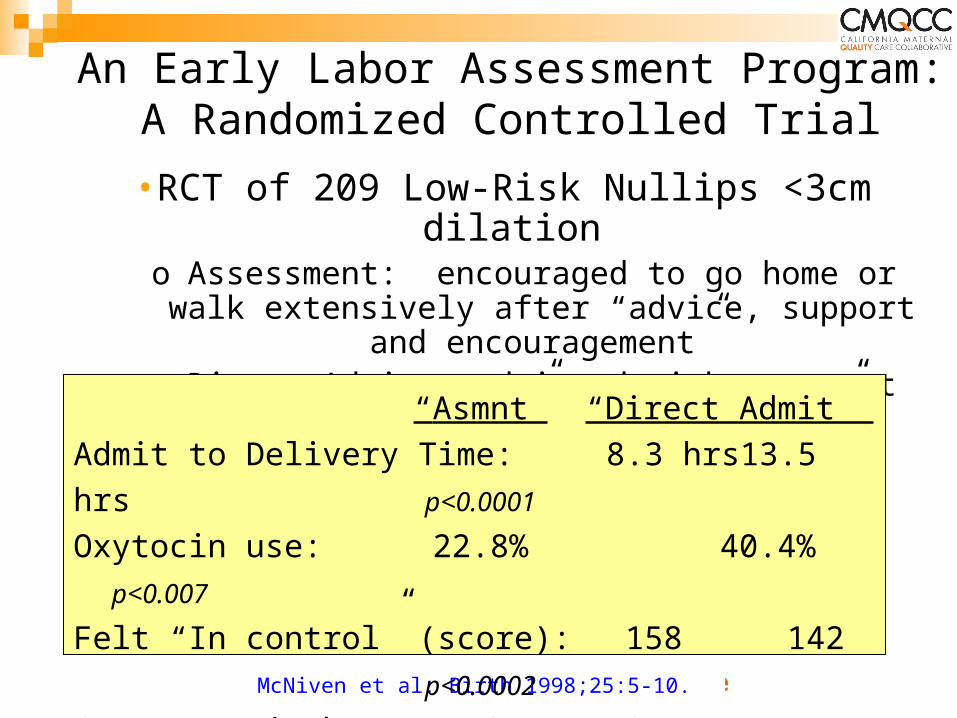
An Early Labor Assessment Program: A Randomized Controlled Trial
McNiven et al: Birth 1998;25:5-10.
•RCT of 209 Low-Risk Nullips <3cm dilationo Assessment: encouraged to go home or walk
extensively after “advice, support and encouragement”
o Direct Admit: admitted without outpt assessment
“Asmnt” “Direct Admit”
Admit to Delivery Time: 8.3 hrs 13.5 hrs p<0.0001
Oxytocin use: 22.8% 40.4% p<0.007
Felt “In control” (score): 158 142 p<0.0002
Cesarean Birth: 7.6% 10.5% n.s
(underpowered for this outcome and this low rate)

: Transforming Maternity Care
What are the concerns of women seeking admission during latent phase?
In-depth interviews 2-6 weeks PP (Sweden)5 Key reasons/themes:
“Longing to complete the pregnancy” “Having difficulty managing the uncertainty” “Having difficulty enduring the slow progress” “Suffering from pain to no avail” “Oscillating between powerfulness and
powerlessness” These provide a base for validating concerns
and supporting women in OB Triage Carlsson IM, Hallberg LR, Odberg Pettersson K. Swedish women's experiences of seeking care and being admitted during the latent phase of labour: a grounded
theory study. Midwifery. 2009;25:172-80.
: Transforming Maternity Care
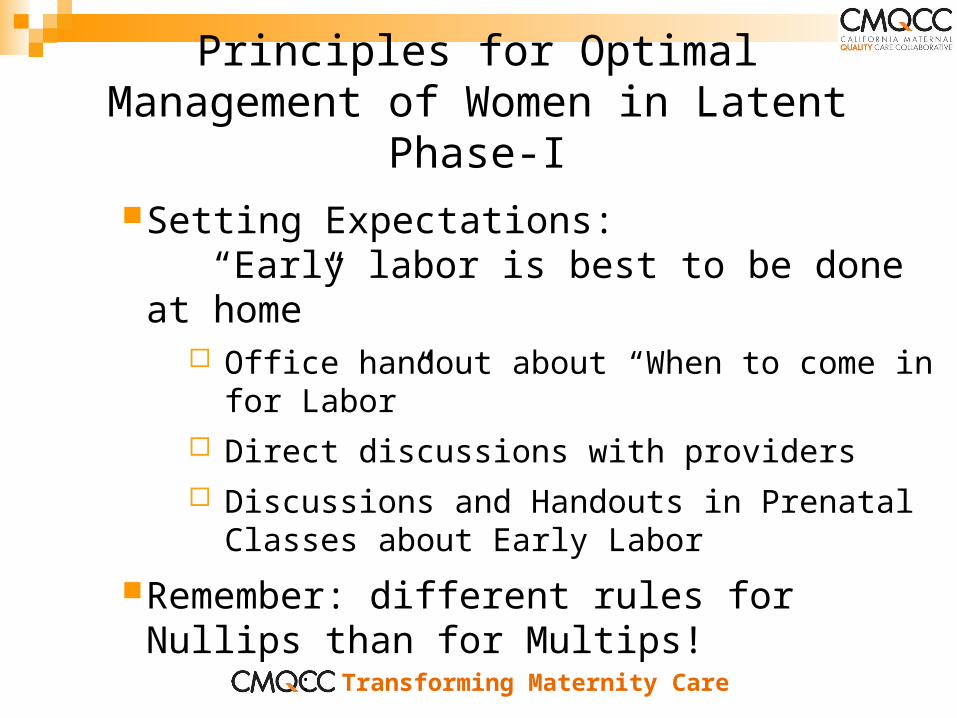
Principles for Optimal Management of Women in Latent Phase-I
Setting Expectations: “Early labor is best to be done at home”
Office handout about “When to come in for Labor” Direct discussions with providers Discussions and Handouts in Prenatal Classes
about Early Labor
Remember: different rules for Nullips than for Multips!

: Transforming Maternity Care
Principles for Optimal Management of Women in Latent Phase-II
Triage Evaluation & Care: Nursing is Critical!Fetal evaluation = ReassuranceKey Communications: Encouragement, Support,
Alleviation of AnxietyReview of Coping Techniques—Handouts for
PartnerHydration and NutritionA subset: Therapeutic Rest: 15mg of Morphine IM
– OK to send home after MS, 80%+ will awake in active phase labor
Need MD “Buy-in”

: Transforming Maternity Care
Oxytocin Safety and Quality
IHI Perinatal Bundles HCA/Steve Clark Oxytocin Safety Initiative Common features
Pre-use checklistModest increase regimen In-use checklist to confirm fetal wellbeing and
minimize tachysystoleClark S, etal. Implementation of a conservative checklist-based protocol for oxytocin
administration: maternal and newborn outcomes. Am J Obstet Gynecol. 2007;197:480.e1-5.IHI Perintal Bundles:
http://www.ihi.org/IHI/Topics/PerinatalCare/PerinatalCareGeneral/EmergingContent/ElectiveInductionandAugmentationBundles.htm

: Transforming Maternity Care
Davis
Santa RosaCoast
Delta
Saint Lukes
Los Banos
Alta Bates Summit
Auburn
Amador
SystemCPMC
Marin
SacramentoEden
Roseville
Santa Cruz
Mills Peninsula
ModestoSolano
Tracy
Lakeside
10
20
30
40
50
Ra
te %
15.5
Cesarean Delivery for 07Q3
Target: less than or equal to 15.5 percent
*
11.7
15
128
13.8
24
174
14.7
5
34
15.6
14
90
15.7
20
127
16.4
9
55
19.5
139
711
20.0
9
45
21.1
8
38
21.5
814
3782
22.0
148
674
22.3
35
157
22.6
104
461
24.1
21
87
24.3
73
300
24.8
30
121
25.3
44
174
25.6
54
211
29.0
29
100
31.0
18
58
40.5
15
37
Rate %
Num
Den
+
-

: Transforming Maternity Care
04Q304Q4
05Q105Q2
05Q305Q4
06Q106Q2
06Q306Q4
07Q107Q2
15.0%
17.5%
20.0%
22.5%
25.0%
15.5
Statistically unfavorable to target, neutral trend
Note: " + " indicates positive direction; " - " indicates negative direction
+
-
Cesarean Delivery for CPMC
Target: less than or equal to 15.5 percent

: Transforming Maternity Care
0%
10%
20%
30%
40%
50%
60%
Maternal Age (years)
Pe
rce
nt
NT
SV
Ces
are
an
Bir
thEffect of Maternal Age on NTSV Cesarean
Rate is Continuous from Age 17
Sutter Health Data: 2001-2003: 41,416 NTSV births
Age 35
For ages 17 - 42 yrs,r2 = 0.961 (p<0.001)
Main E, etal. Am J Obstet Gynecol 2006; 194: 1644-52.

: Transforming Maternity Care
Age-Adjusted Primary Cesarean Rate, 2006Term, Singleton, Vertex Deliveries
8%
10% 10% 10%
12% 12%13% 13% 13% 13%
14%15% 15%
16% 16%17% 17% 17%
19%
27%
0%
5%
10%
15%
20%
25%
30%
Davis
Santa
Ros
a
St. Lu
ke's
Santa
Cru
z
CPMC
Solano
Mar
inDel
ta
Los B
anos
Coast
Mills
Pen
insul
a
Sacra
men
to
Rosev
ille
ABSMC
Lake
side
Tracy
Eden
Aubur
n
Mod
esto
Amad
or
Statewide Average = 16%
+
-This is an OSHPD measure, similar to FPAD but includes
multips (excludes all prior CS), and is age-adjusted.

: Transforming Maternity Care
In Effort to Limit C-Sections, Two Methods Yield Different Results on Staten Island
Staten Island University Hospital 23.2% Cesarean rate Strong leadership and
determination No elective inductions
prior to 41 wks No elective CS Non-interventionist
policy
Richmond University Medical Center 48.3% Cesarean rate “Perinatal Center” ( for
high-risk pregnancies) “Peer Review” to
reduce CS 2nd opinions for
elective CS (half-hearted?)
Susan Dominus NYT April 19, 2010

National Quality Measures for Obstetrics
NQF
Leapfrog Group
The Joint Commision

: Transforming Maternity Care
Our Strategy….
First, develop measures and identify confidential outcome data
Second, provide high quality QI programs to assist providers in meeting the measures
Third, partner for public release, and alignment of financial incentives

: Transforming Maternity CareJC Core Measure Set-2010
NQF National ObstetricQuality Measures/Quality Standards
(November 2008)
Leapfrog Group Measures-2009
Episiotomy rate Cesarean rate for low-risk first births Elective delivery prior to 39 weeks Prophylactic antibiotics for Cesarean birth DVT prophylaxis for women having a Cesarean birth Exclusive breastfeeding at hospital discharge Birth trauma rate (limited ICD9 codes) Rate of antenatal steroids for under 32 week births Infants under 1500g (VLBW) not delivered at
Level III center
OB/Mom
OB/Baby
( to be added in 2011) CHART: Public Release
VBAC Available?

: Transforming Maternity Care
Keys to Success…Summary Leadership!! Medical and nursing Use external pressures and aligned incentives Focus on the culture on Labor and Delivery Fewer Inductions, more “gentle” oxytocin
(protocol driven), admit in active labor whenever possible
Public and professional education

: Transforming Maternity Care
What has resonated best in our system…
Focus on changing practices that reduce indications to do a cesarean rather than reducing cesareans once the indication is already there…

: Transforming Maternity Care
How to get Cesarean Rates back in the box
CesareanRate
PtEd
MDTime
Sched-ule
MDWorry
Fear ofLabor
Per-fection
Labormgmt
Leader-ship
EdSafety
Align$
Work with medical liability
companies
: Transforming Maternity Care
Thank You!

: Transforming Maternity Care
CONFIDENTIAL
WSHA CQIP Peer Review and Quality Improvement Information.
Protected from disclosure or discovery under RCW 43.70.510


![[MS-WSH]: Windows Security Health Agent (WSHA) and …](https://img.pdfslide.net/doc/110x75/618a3b02785d59451c569c5d/ms-wsh-windows-security-health-agent-wsha-and-.jpg)