Embed Size (px)
Citation preview
InsertCustomSessionQR ifDesired.
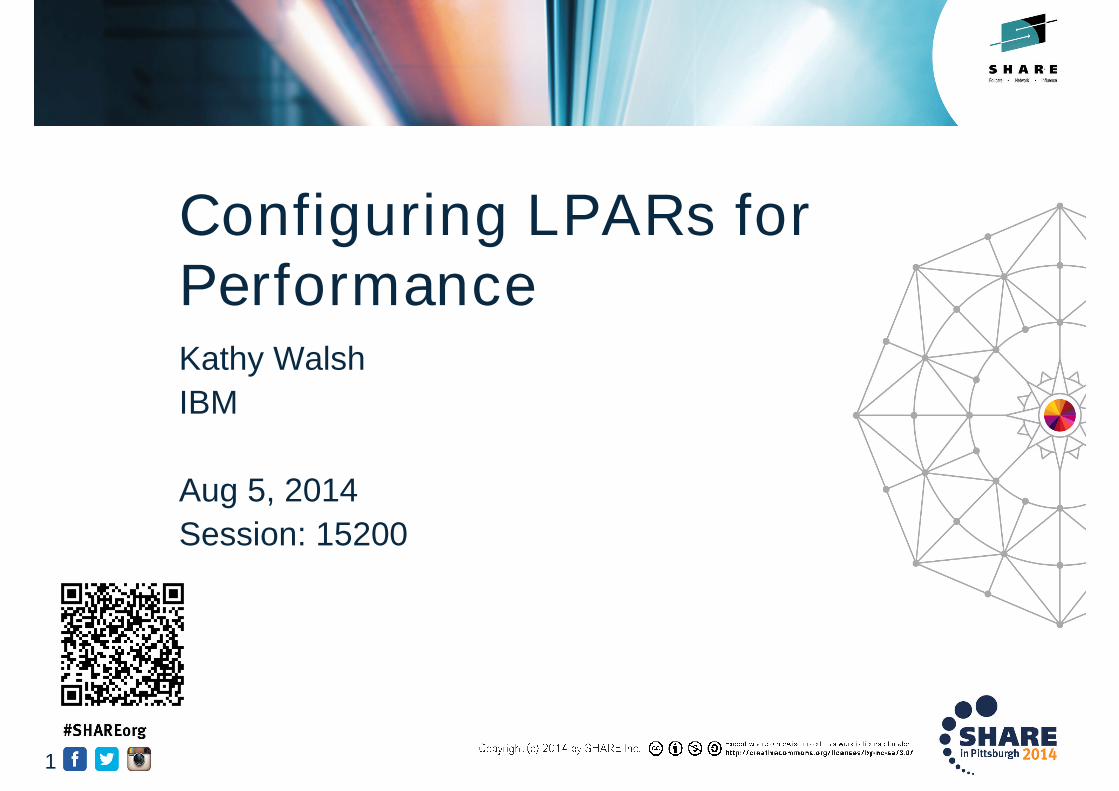
Configuring LPARs forPerformanceKathy Walsh
IBM
Aug 5, 2014
Session: 15200
1
© 2014 IBM Corporation2
Configuring LPARs for Performance
Overview of terms and partitioning controls
–Per CP share
–Short CPs
Managing capacity
–Intelligent Resource Director
–Initial capping
–Absolute capping
–Soft capping
–Group capacity
Agenda
© 2014 IBM Corporation
Configuring LPARs for Performance
3
LPAR weight and per CP share
Effective dispatch time
Partition dispatch
Shorts CPs
Important terms to understand
Important concepts to understand
LPAR weights become important only when the processor is verybusy or capped
There are two dispatchers involved in making resource allocations– PR/SM
– Operating systems
© 2014 IBM Corporation
Configuring LPARs for Performance
4
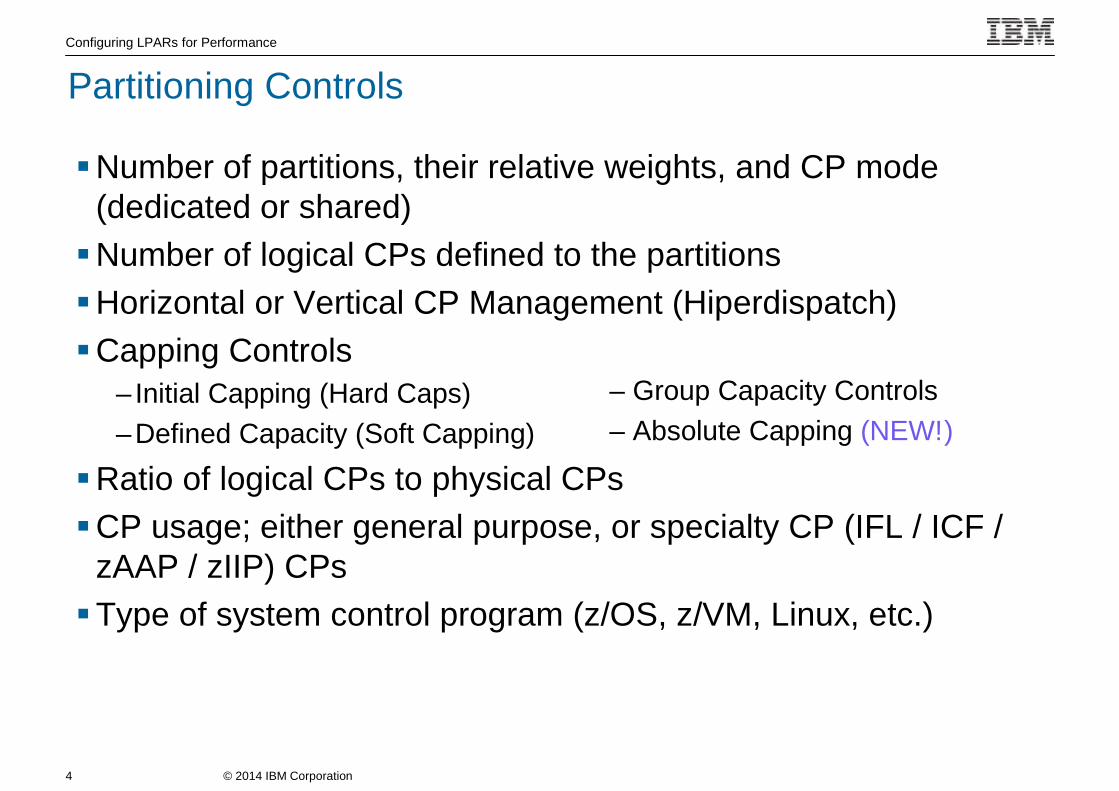
Number of partitions, their relative weights, and CP mode(dedicated or shared)
Number of logical CPs defined to the partitions
Horizontal or Vertical CP Management (Hiperdispatch)
Capping Controls– Initial Capping (Hard Caps)
–Defined Capacity (Soft Capping)
Ratio of logical CPs to physical CPs
CP usage; either general purpose, or specialty CP (IFL / ICF /zAAP / zIIP) CPs
Type of system control program (z/OS, z/VM, Linux, etc.)
– Group Capacity Controls
– Absolute Capping (NEW!)
Partitioning Controls
© 2014 IBM Corporation
Configuring LPARs for Performance
5
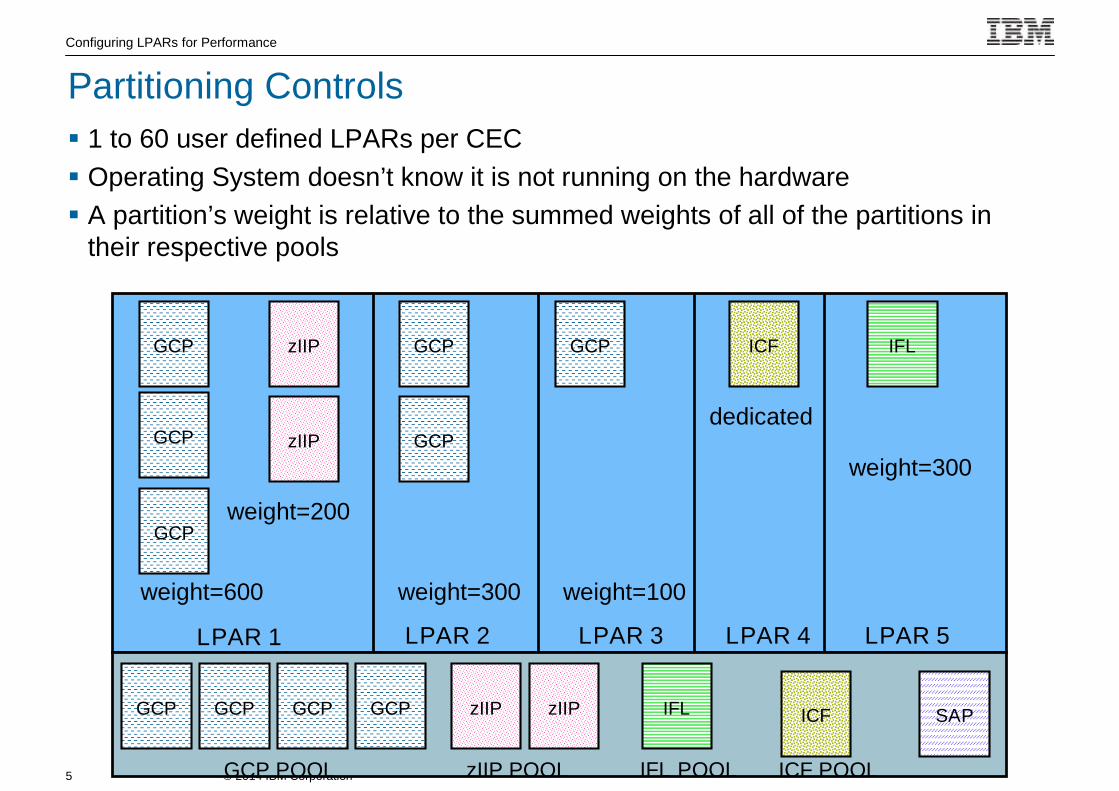
1 to 60 user defined LPARs per CEC
Operating System doesn’t know it is not running on the hardware
A partition’s weight is relative to the summed weights of all of the partitions intheir respective pools
GCP
GCP
GCP ICFGCP
GCP POOL
zIIP
zIIP
zIIP POOL ICF POOL
IFL
SAP
IFL POOL
GCP
GCP
GCP
zIIP
zIIP
GCP
GCP
GCP ICF
IFL
LPAR 1 LPAR 2 LPAR 3 LPAR 4 LPAR 5
weight=600
weight=200
weight=300 weight=100
weight=300
dedicated
Partitioning Controls
© 2014 IBM Corporation
Configuring LPARs for Performance
6
0
1
2
3
4
5
6
7
8
9
10
WSC2
WSC1
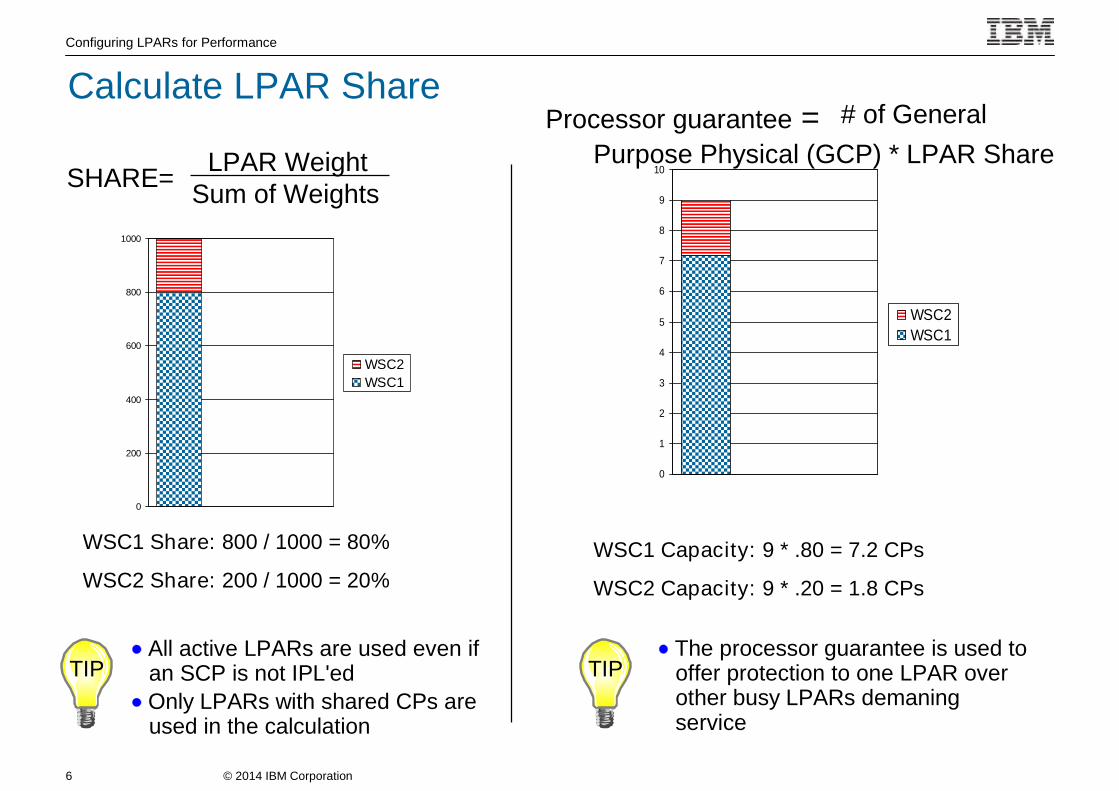
LPAR WeightSum of Weights
SHARE=
WSC1 Capacity: 9 * .80 = 7.2 CPs
WSC2 Capacity: 9 * .20 = 1.8 CPs
All active LPARs are used even ifan SCP is not IPL'ed
Only LPARs with shared CPs areused in the calculation
0
200
400
600
800
1000
WSC2
WSC1
Processor guarantee =Purpose Physical (GCP) * LPAR Share
# of General
WSC1 Share: 800 / 1000 = 80%
WSC2 Share: 200 / 1000 = 20%
TIPThe processor guarantee is used tooffer protection to one LPAR overother busy LPARs demaningservice
TIP
Calculate LPAR Share
© 2014 IBM Corporation
Configuring LPARs for Performance
7
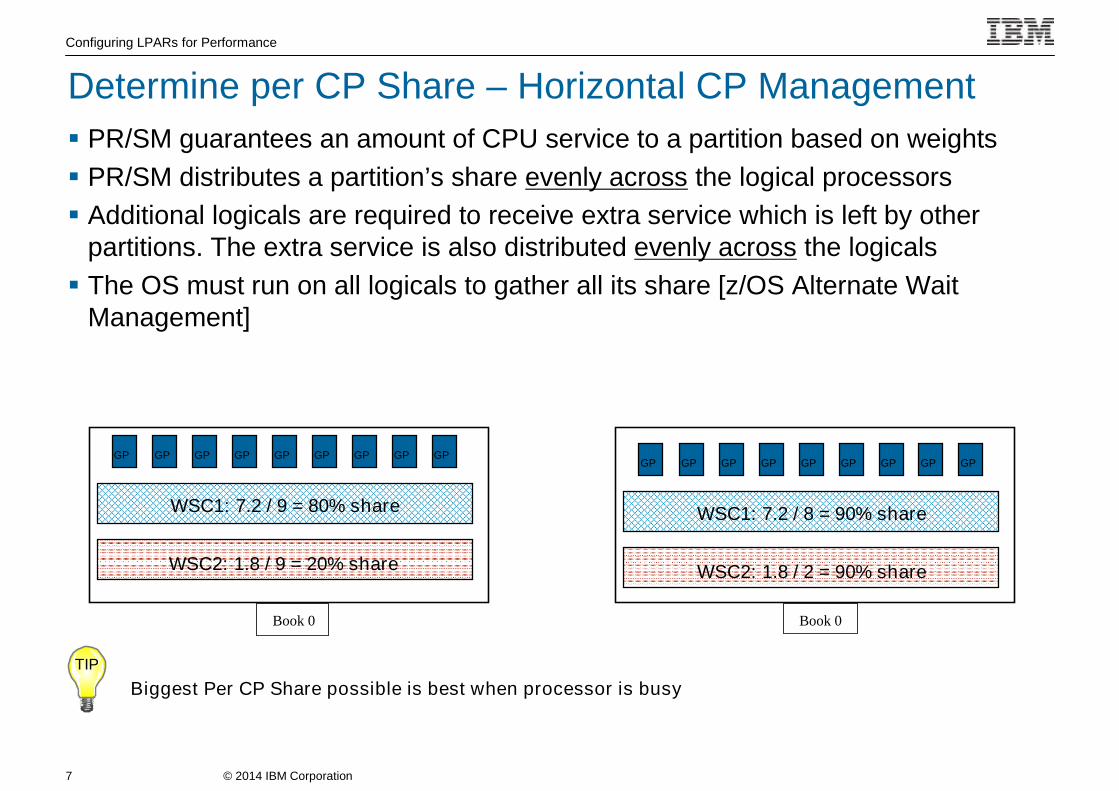
PR/SM guarantees an amount of CPU service to a partition based on weights
PR/SM distributes a partition’s share evenly across the logical processors
Additional logicals are required to receive extra service which is left by otherpartitions. The extra service is also distributed evenly across the logicals
The OS must run on all logicals to gather all its share [z/OS Alternate WaitManagement]
Book 0
GPGP GP GP GP GP GP GPGP
WSC1: 7.2 / 9 = 80% share
WSC2: 1.8 / 9 = 20% share
Book 0
GPGP GP GP GP GP GP GPGP
WSC1: 7.2 / 8 = 90% share
WSC2: 1.8 / 2 = 90% share
TIP
Biggest Per CP Share possible is best when processor is busy
Determine per CP Share – Horizontal CP Management
© 2014 IBM Corporation
Configuring LPARs for Performance
8
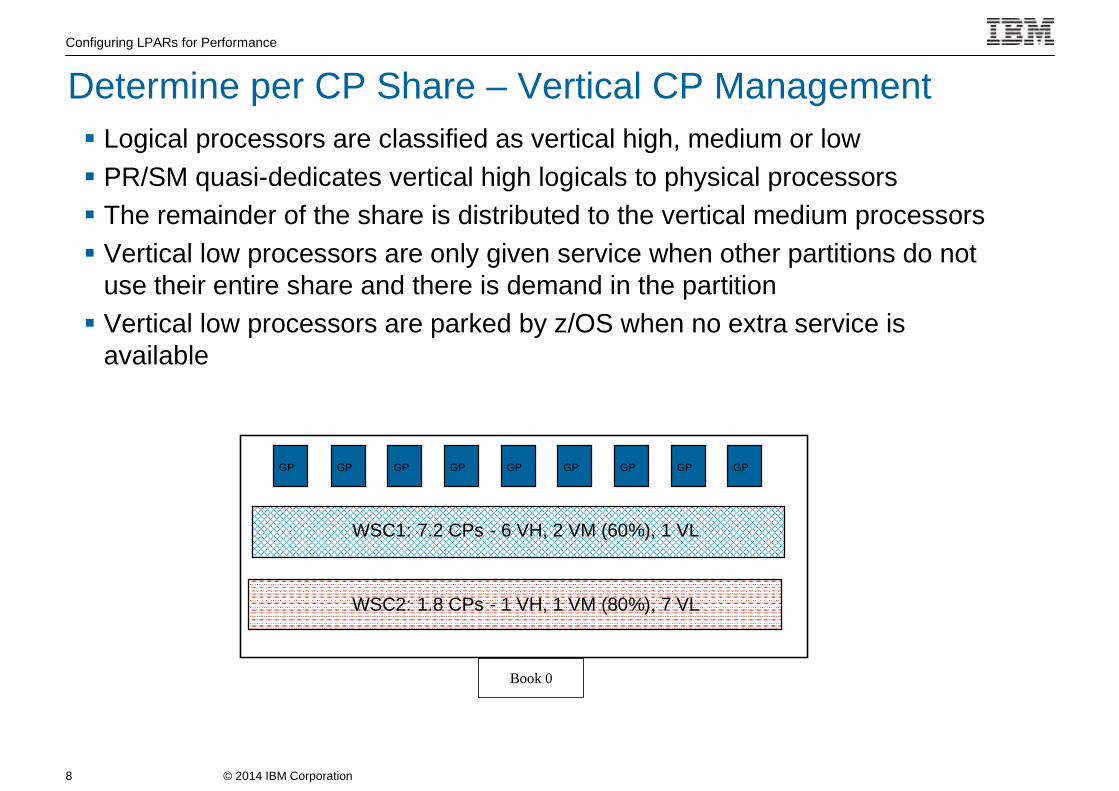
Logical processors are classified as vertical high, medium or low
PR/SM quasi-dedicates vertical high logicals to physical processors
The remainder of the share is distributed to the vertical medium processors
Vertical low processors are only given service when other partitions do notuse their entire share and there is demand in the partition
Vertical low processors are parked by z/OS when no extra service isavailable
Book 0
GPGP GP GP GP GP GP GPGP
WSC1: 7.2 CPs - 6 VH, 2 VM (60%), 1 VL
WSC2: 1.8 CPs - 1 VH, 1 VM (80%), 7 VL
Determine per CP Share – Vertical CP Management
© 2014 IBM Corporation
Configuring LPARs for Performance
9
Access to resources is relative to other partitions on the CEC
1 : 1
1 : 1
1 : 1
1.5 : 1
Logical toPhysical
Ratio
2 VH
1 VM, 40% share
2 VM, 60% share
1 VH, 2 VM
HD=YES
11DEDLPAR4ICF
1
1
2
0.4
1.2
2.4
Logicalsby
Weight
1
IFL
zIIP
GCP
GCP
GCP
Pool
1300
1300LPAR5
2200
2200LPAR1
61000
1100LPAR3
2300LPAR2
3600LPAR1
LogicalsDefined
WeightLPARName
2827-704
System z Partitioning Controls
© 2014 IBM Corporation
Configuring LPARs for Performance
10
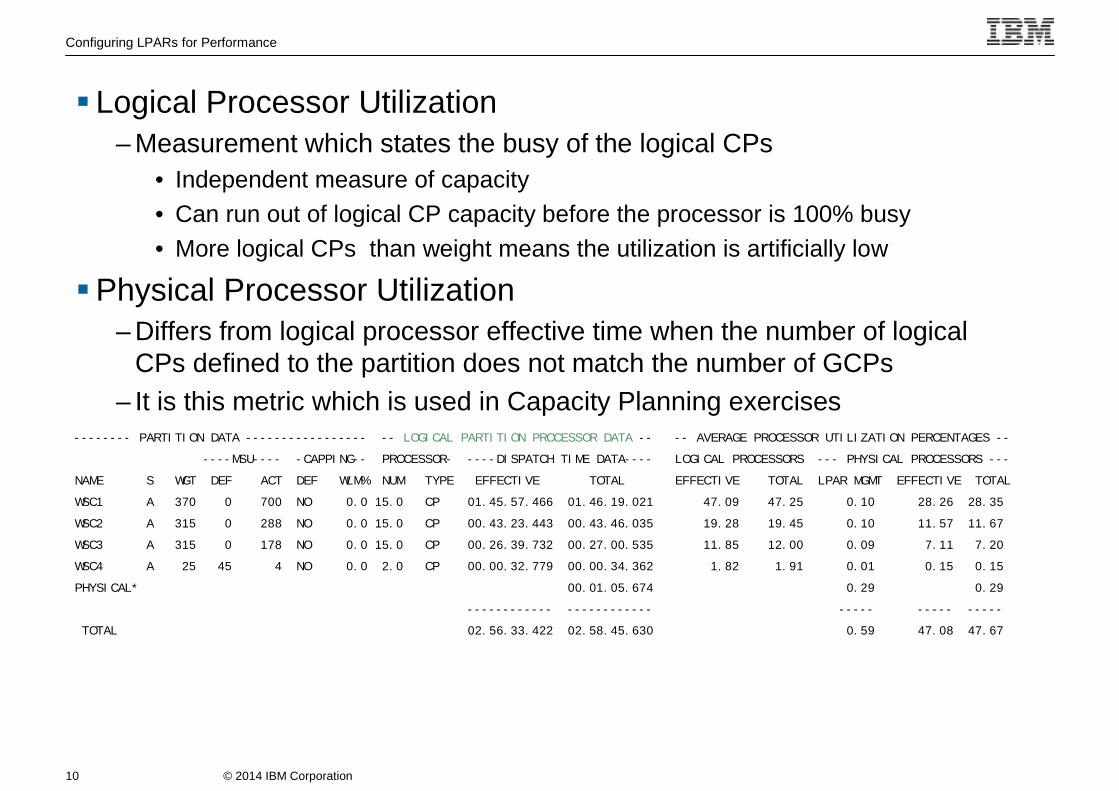
Logical Processor Utilization– Measurement which states the busy of the logical CPs
• Independent measure of capacity
• Can run out of logical CP capacity before the processor is 100% busy
• More logical CPs than weight means the utilization is artificially low
Physical Processor Utilization– Differs from logical processor effective time when the number of logical
CPs defined to the partition does not match the number of GCPs
– It is this metric which is used in Capacity Planning exercises-------- PARTITION DATA ----------------- -- LOGICAL PARTITION PROCESSOR DATA -- -- AVERAGE PROCESSOR UTILIZATION PERCENTAGES --
----MSU---- -CAPPING-- PROCESSOR- ----DISPATCH TIME DATA---- LOGICAL PROCESSORS --- PHYSICAL PROCESSORS ---
NAME S WGT DEF ACT DEF WLM% NUM TYPE EFFECTIVE TOTAL EFFECTIVE TOTAL LPAR MGMT EFFECTIVE TOTAL
WSC1 A 370 0 700 NO 0.0 15.0 CP 01.45.57.466 01.46.19.021 47.09 47.25 0.10 28.26 28.35
WSC2 A 315 0 288 NO 0.0 15.0 CP 00.43.23.443 00.43.46.035 19.28 19.45 0.10 11.57 11.67
WSC3 A 315 0 178 NO 0.0 15.0 CP 00.26.39.732 00.27.00.535 11.85 12.00 0.09 7.11 7.20
WSC4 A 25 45 4 NO 0.0 2.0 CP 00.00.32.779 00.00.34.362 1.82 1.91 0.01 0.15 0.15
PHYSICAL* 00.01.05.674 0.29 0.29
------------ ------------ ----- ----- -----
TOTAL 02.56.33.422 02.58.45.630 0.59 47.08 47.67

© 2014 IBM Corporation
Configuring LPARs for Performance
11
MVS PARTITION NAME WSC1 NUMBER OF PHYSICAL PROCESSORS 31
IMAGE CAPACITY 2469 CP 25
NUMBER OF CONFIGURED PARTITIONS 17 IFL 1
WAIT COMPLETION NO ICF 2
DISPATCH INTERVAL DYNAMIC IIP 3
--------- PARTITION DATA ----------------- -- LOGICAL
----MSU---- -CAPPING-- PROCESSOR-
NAME S WGT DEF ACT DEF WLM% NUM TYPE
WSC1 A 370 0 700 NO 0.0 15.0 CP
WSC2 A 315 0 288 NO 0.0 15.0 CP
WSC3 A 315 0 178 NO 0.0 15.0 CP
WSC4 A 25 45 4 NO 0.0 2.0 CP
*PHYSICAL*
TOTAL
CF01 A DED 2 ICF
*PHYSICAL*
TOTAL
WSC1 A 10 3 IIP
WSC2 A 10 3 IIP
WSC3 A 10 3 IIP
WSC4 A 10 1 IIP
*PHYSICAL*
Processor Running Time
– Default is limited to a range of 12.5-25 ms
– Dynamically calculated
25 ms * (Number of Physical Shared CPs)Total # of Logical CPs for all LPARs
– Vertical Highs get run time of 100 ms
– Recalculated when LPARs are stopped orstarted or CPs are Configured on/off
– When a logical CP does not go into a waitstate during its run time, it loses the physicalCP when it reaches the end of its run time
RMF partition report
© 2014 IBM Corporation
Configuring LPARs for Performance
12
Intelligent Resource Director
PR/SM Initial Capping – Hard Capping
Defined Capacity – Soft Capping
Group Capacity
Other Methods of Changing Capacity– Absolute Capping
– WLM Resource Groups
– Discretionary Goal Management
– Config CPU Command
– Customer Initiated Power Save Mode
– OOCoD
Managing Capacity on System z and z/OS

© 2014 IBM Corporation
Configuring LPARs for Performance
13
WLM Function which:
– Manages LPAR Weights
– Varies logical CPs On and Off – Disabled and replaced withHiperdispatch=YES
– Manages CHPIDs
– Manages I/O Priorities
Scope is an LPAR Cluster
– All MVS images on the same physical processor, in the same sysplex
LPAR1
SYSPLEX1
LPAR2
LPAR3
SYSPLEX1
LPAR
Cluster
LPAR4
SYSPLEX1CF
CEC2CEC1
Intelligent Resource Director
© 2014 IBM Corporation
Configuring LPARs for Performance
14
WLM manages physical CPU resource across z/OS images withinan LPAR cluster based on service class goals
– LPAR Weight Management• Dynamic changes to the LPAR weights
• Sum of LPAR weights can be redistributed within the cluster
• Partition(s) outside of the cluster are not affected
• Moves CP resource to the partition which requires it
• Reduces human intervention
– Vary CP Management• Dynamic management of online CPs to each partition in the cluster
• Optimizes the number of CPs for the partition's current weight
• Prevents 'short' engines
• Maximizes the effectiveness of the MVS dispatcher
• Has an IEAOPTxx option (VARYCPUMIN) to set minimum number of CPsregardless of LPAR’s weight
• Reduces human intervention
• Replaced by Hiperdispatch=yes
IRD Management
© 2014 IBM Corporation
Configuring LPARs for Performance
15
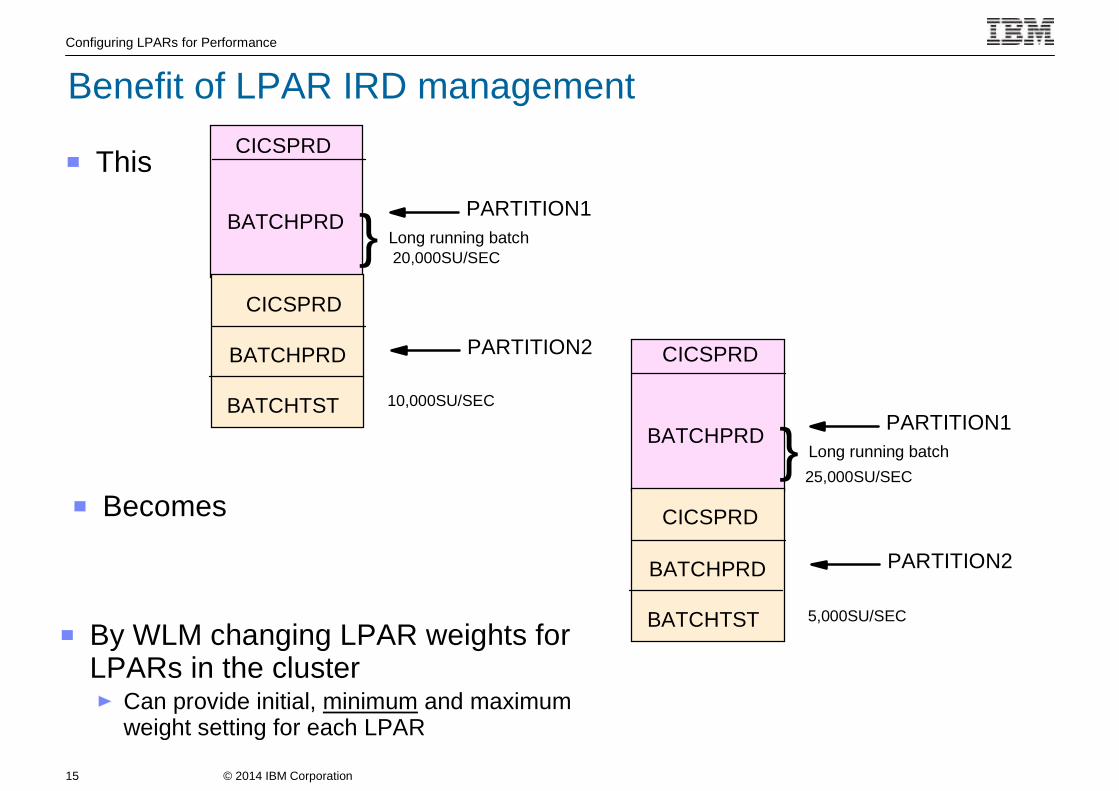
This
CICSPRD
BATCHPRD
CICSPRD
BATCHPRD
BATCHTST
PARTITION1
PARTITION2
Long running batch}25,000SU/SEC
5,000SU/SEC
Becomes
20,000SU/SEC
CICSPRD
BATCHPRD
CICSPRD
BATCHPRD
BATCHTST
PARTITION1
PARTITION2
Long running batch}
10,000SU/SEC
By WLM changing LPAR weights forLPARs in the cluster
Can provide initial, minimum and maximumweight setting for each LPAR
Benefit of LPAR IRD management
© 2014 IBM Corporation
Configuring LPARs for Performance
16
Need to have a multi system perspective when looking at overallthroughput in an LPAR Cluster
– WLM Policy and Goal Attainment
Need to examine CEC demand within and outside the cluster– Whitespace
Need to understand applicable capacity controls and their impact
IRD Performance Management
© 2014 IBM Corporation
Configuring LPARs for Performance
17
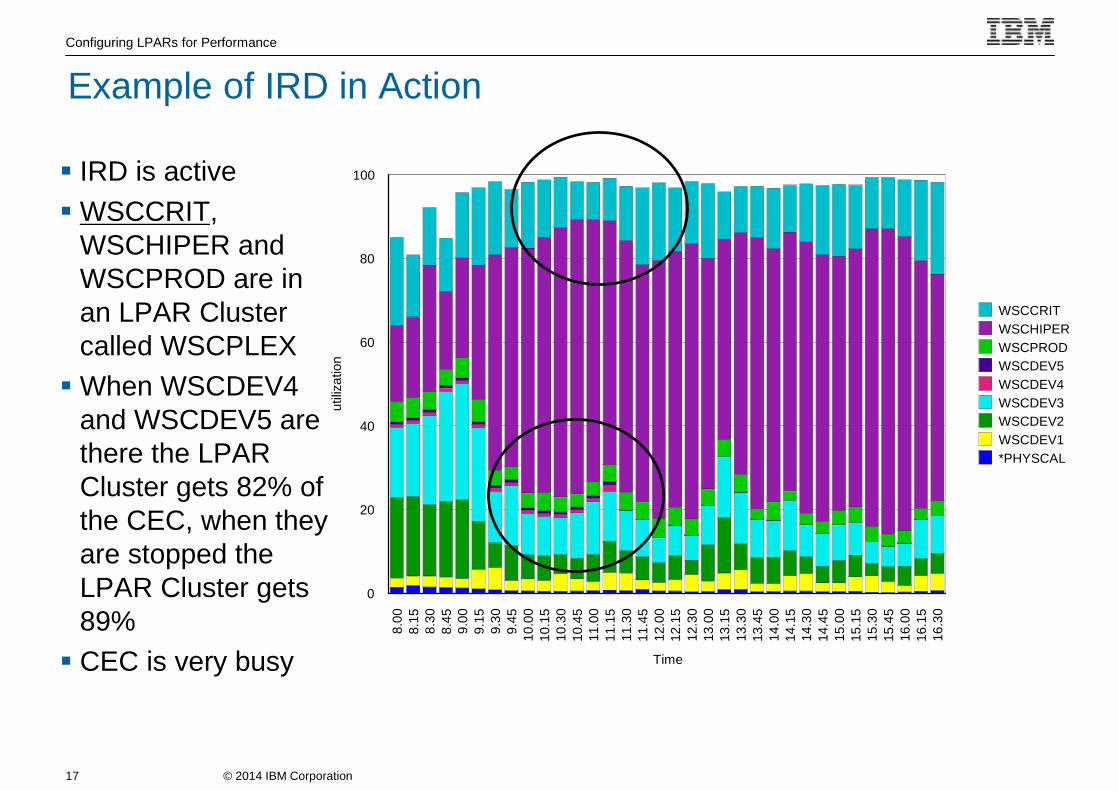
IRD is active
WSCCRIT,WSCHIPER andWSCPROD are inan LPAR Clustercalled WSCPLEX
When WSCDEV4and WSCDEV5 arethere the LPARCluster gets 82% ofthe CEC, when theyare stopped theLPAR Cluster gets89%
CEC is very busy
8.0
08
.15
8.3
08
.45
9.0
09
.15
9.3
09
.45
10
.00
10
.15
10
.30
10
.45
11
.00
11
.15
11
.30
11
.45
12
.00
12
.15
12
.30
13
.00
13
.15
13
.30
13
.45
14
.00
14
.15
14
.30
14
.45
15
.00
15
.15
15
.30
15
.45
16
.00
16
.15
16
.30
Time
0
20
40
60
80
100
util
iza
tion
WSCCRIT
WSCHIPER
WSCPROD
WSCDEV5
WSCDEV4
WSCDEV3
WSCDEV2
WSCDEV1
*PHYSCAL
Example of IRD in Action
© 2014 IBM Corporation
Configuring LPARs for Performance
18
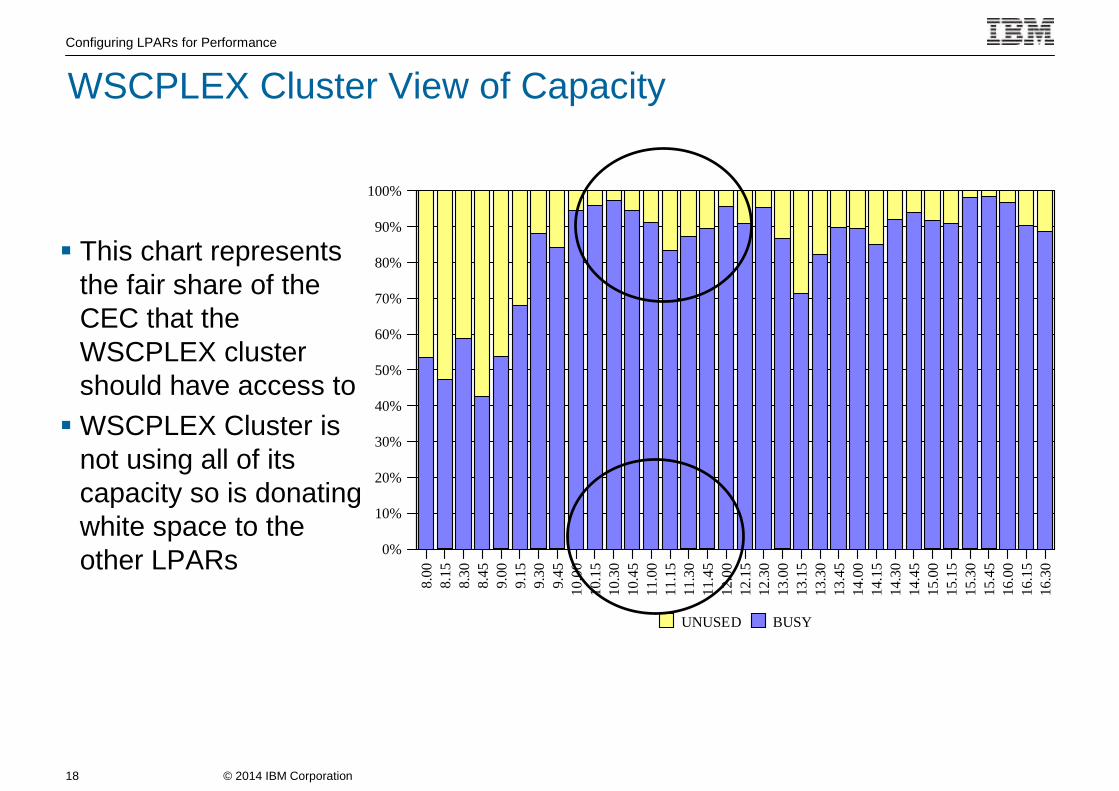
This chart representsthe fair share of theCEC that theWSCPLEX clustershould have access to
WSCPLEX Cluster isnot using all of itscapacity so is donatingwhite space to theother LPARs
8.00
8.15
8.30
8.45
9.00
9.15
9.30
9.45
10.0
0
10.1
5
10.3
0
10.4
5
11.0
0
11.1
5
11.3
0
11.4
5
12.0
0
12.1
5
12.3
0
13.0
0
13.1
5
13.3
0
13.4
5
14.0
0
14.1
5
14.3
0
14.4
5
15.0
0
15.1
5
15.3
0
15.4
5
16.0
0
16.1
5
16.3
0
0%
10%
20%
30%
40%
50%
60%
70%
80%
90%
100%
UNUSED BUSY
WSCPLEX Cluster View of Capacity

© 2014 IBM Corporation
Configuring LPARs for Performance
19
HOUR SCLASS IMP CP PINDX
11.15 SYSTEM 0 14 1
11.15 SYSSTC 0 21.7 1
11.15 TSOL1 1 1.4 1.3
11.15 TSO1 1 1 0.3
11.15 TRANONE 1 5.1 1.1
11.15 SERVERS 1 17.5 2.9
11.15 TRANTWO 1 1.1 3.4
11.15 CICSL2 1 0 72.1
11.15 DMGMT 1 3 3.9
11.15 STCHI1 1 3.7 5.3
11.15 TRNMULT 1 9.8 1.7
11.15 STC2 2 25.2 12.7
11.15 TRNMULT 2 24.7 107.2
11.15 TRANTWO 2 2.7 236.5
11.15 TSOL1 2 1 4.2
11.15 TSOHI 2 0.8 30.9
11.15 TRANONE 2 9.7 198.9
11.15 DBASE 2 0 14.5
11.15 BATCHL1 3 0 5138.8
11.15 DBASE 3 0 160.3
HOUR SCLASS IMP CP PINDX
10 SYSTEM 0 10.5 1
10 SYSSTC 0 17.9 1
10 TSOL1 1 1.5 0.5
10 TRANONE 1 2.6 0.1
10 DMGMT 1 4 1.4
10 SERVERS 1 23.3 25.5
10 CICSL2 1 0.1 3.4
10 STCHI 1 1.2 2
10 TSOHI 1 1.3 0.6
10 TRANTWO 1 8.9 0.1
10 TRNMULT 1 6.5 0.3
10 TRNMULT 2 28.6 1.4
10 STC2 2 46.7 1.1
10 TRANFIVE 2 3.5 3.4
10 TSOHI 2 0.2 1.9
10 TSOl1 2 1.4 13.3
10 TRANONE 2 12.5 3.6
10 HOTPROD 2 0 0.1
10 DBASE 2 0 0.1
10 BATCHL1 3 52.2 2
10 TSOL1 3 1.6 1.3
10 DBASE 3 0 1.2
10 BATCHL2 5 2.7 3.7
WSCCRIT Performance Degradation
© 2014 IBM Corporation
Configuring LPARs for Performance
20
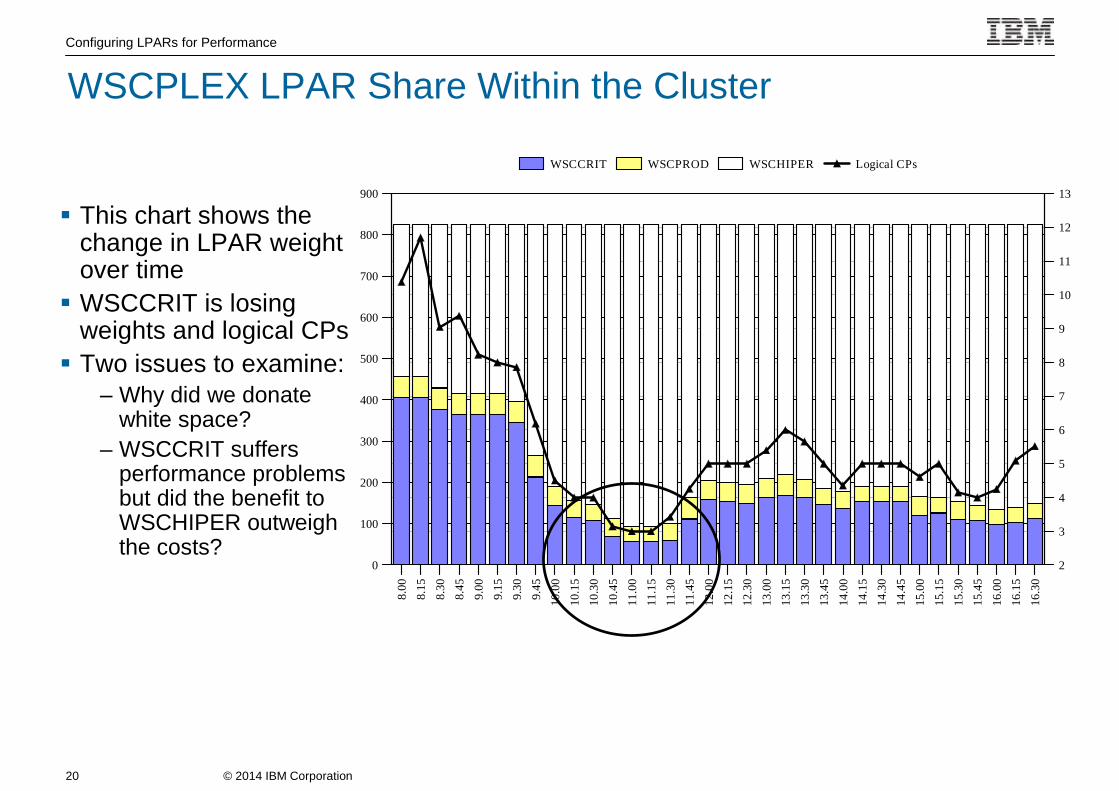
This chart shows thechange in LPAR weightover time
WSCCRIT is losingweights and logical CPs
Two issues to examine:– Why did we donate
white space?
– WSCCRIT suffersperformance problemsbut did the benefit toWSCHIPER outweighthe costs?
8.0
0
8.1
5
8.3
0
8.4
5
9.0
0
9.1
5
9.3
0
9.4
5
10
.00
10
.15
10
.30
10
.45
11
.00
11
.15
11
.30
11
.45
12
.00
12
.15
12
.30
13
.00
13
.15
13
.30
13
.45
14
.00
14
.15
14
.30
14
.45
15
.00
15
.15
15
.30
15
.45
16
.00
16
.15
16
.30
0
100
200
300
400
500
600
700
800
900
2
3
4
5
6
7
8
9
10
11
12
13
WSCCRIT WSCPROD WSCHIPER Logical CPs
WSCPLEX LPAR Share Within the Cluster
© 2014 IBM Corporation
Configuring LPARs for Performance
21
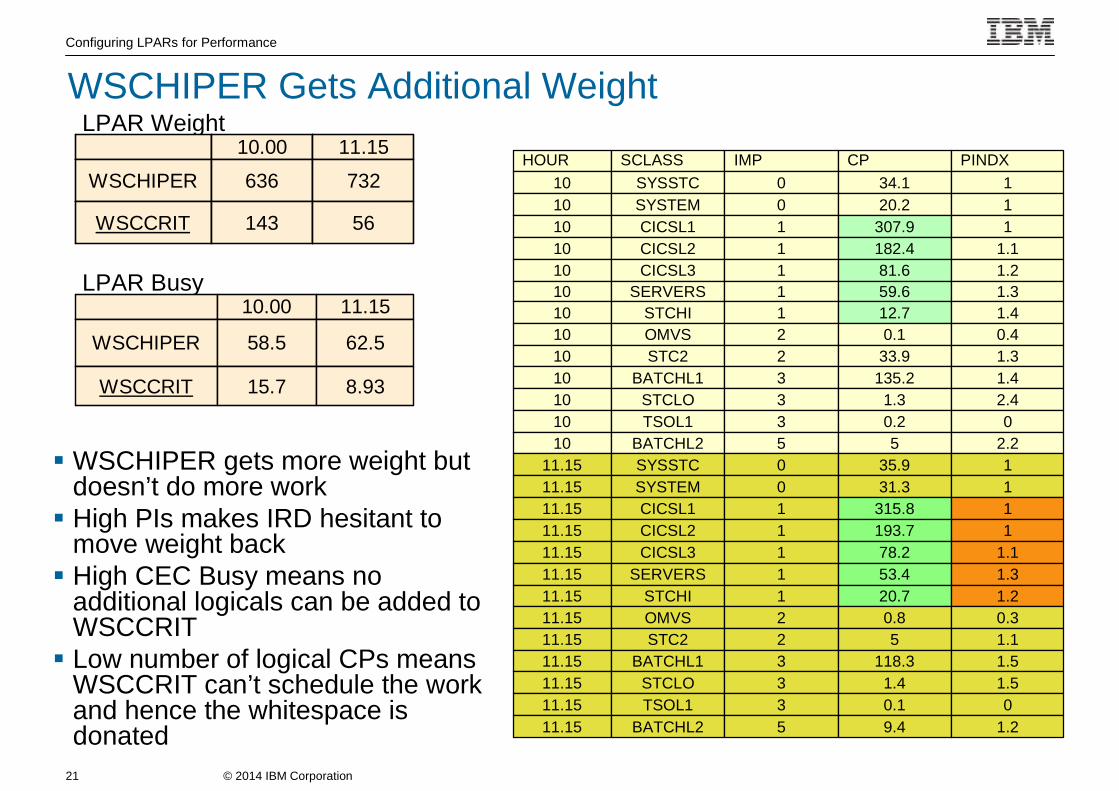
WSCHIPER gets more weight butdoesn’t do more work High PIs makes IRD hesitant to
move weight back High CEC Busy means no
additional logicals can be added toWSCCRIT Low number of logical CPs means
WSCCRIT can’t schedule the workand hence the whitespace isdonated
HOUR SCLASS IMP CP PINDX
10 SYSSTC 0 34.1 1
10 SYSTEM 0 20.2 1
10 CICSL1 1 307.9 1
10 CICSL2 1 182.4 1.1
10 CICSL3 1 81.6 1.2
10 SERVERS 1 59.6 1.3
10 STCHI 1 12.7 1.4
10 OMVS 2 0.1 0.4
10 STC2 2 33.9 1.3
10 BATCHL1 3 135.2 1.4
10 STCLO 3 1.3 2.4
10 TSOL1 3 0.2 0
10 BATCHL2 5 5 2.2
11.15 SYSSTC 0 35.9 1
11.15 SYSTEM 0 31.3 1
11.15 CICSL1 1 315.8 1
11.15 CICSL2 1 193.7 1
11.15 CICSL3 1 78.2 1.1
11.15 SERVERS 1 53.4 1.3
11.15 STCHI 1 20.7 1.2
11.15 OMVS 2 0.8 0.3
11.15 STC2 2 5 1.1
11.15 BATCHL1 3 118.3 1.5
11.15 STCLO 3 1.4 1.5
11.15 TSOL1 3 0.1 0
11.15 BATCHL2 5 9.4 1.2
LPAR Weight
LPAR Busy10.00 11.15
WSCHIPER 58.5 62.5
WSCCRIT 15.7 8.93
10.00 11.15
WSCHIPER 636 732
WSCCRIT 143 56
WSCHIPER Gets Additional Weight

© 2014 IBM Corporation
Configuring LPARs for Performance
22
What are the Tuning Options
If Hiperdispatch = No then use VaryCPUMIN to keep sufficientlogicals available
Update the WLM policy so the goals are more reasonable
Provide protection with IRD Minimum values
© 2014 IBM Corporation
Configuring LPARs for Performance
23
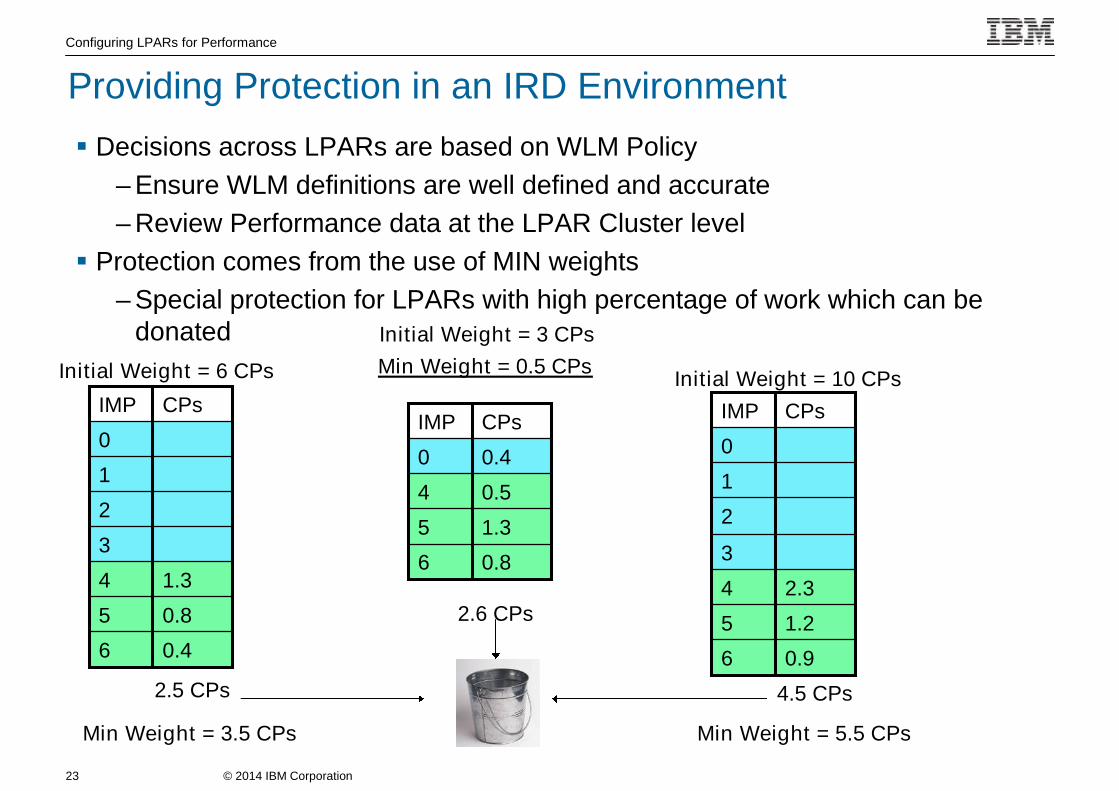
Decisions across LPARs are based on WLM Policy
– Ensure WLM definitions are well defined and accurate
– Review Performance data at the LPAR Cluster level
Protection comes from the use of MIN weights
– Special protection for LPARs with high percentage of work which can bedonated
CPsIMP
1.35
6
4
0
0.8
0.5
0.4
CPsIMP
0.85
6
4
3
2
1
0
0.4
1.3
Min Weight = 5.5 CPs
CPsIMP
1.25
6
4
3
2
1
0
0.9
2.3
Initial Weight = 10 CPs
Initial Weight = 3 CPs
2.6 CPs
4.5 CPs2.5 CPs
Initial Weight = 6 CPs
Min Weight = 3.5 CPs
Min Weight = 0.5 CPs
Providing Protection in an IRD Environment
© 2014 IBM Corporation
Configuring LPARs for Performance
24
Capping Controls
© 2014 IBM Corporation
Configuring LPARs for Performance
25
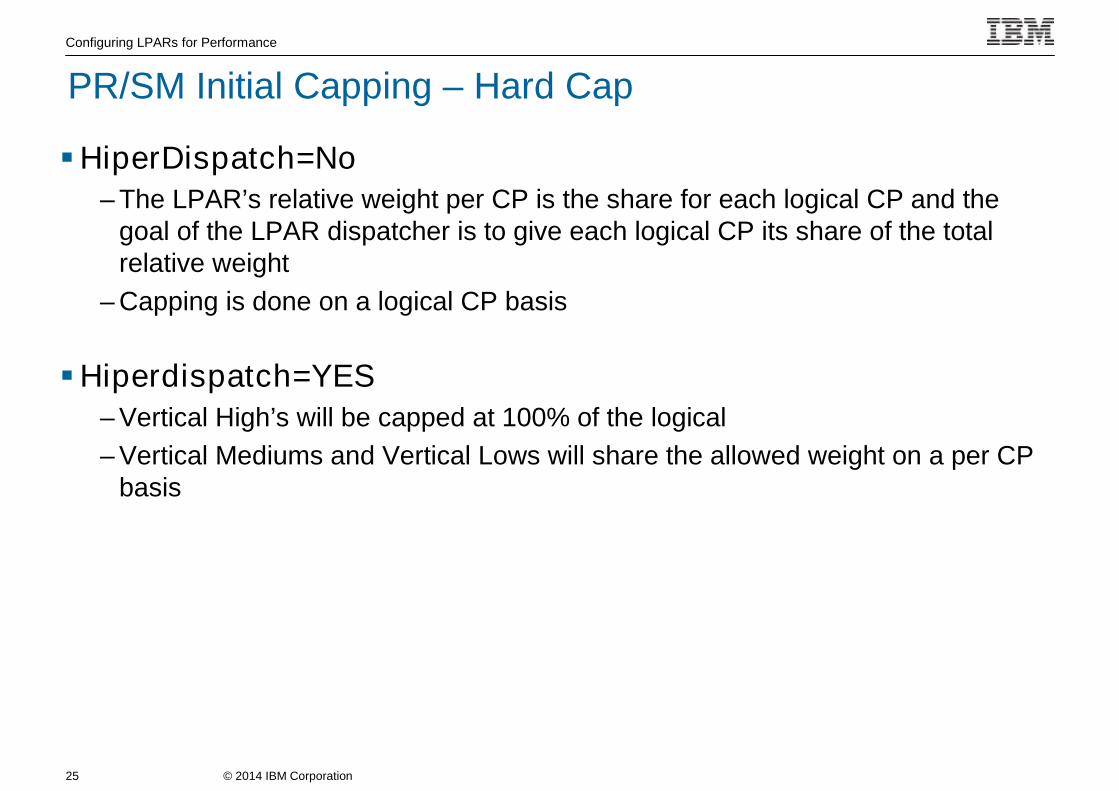
HiperDispatch=No– The LPAR’s relative weight per CP is the share for each logical CP and the
goal of the LPAR dispatcher is to give each logical CP its share of the totalrelative weight
– Capping is done on a logical CP basis
Hiperdispatch=YES– Vertical High’s will be capped at 100% of the logical
– Vertical Mediums and Vertical Lows will share the allowed weight on a per CPbasis
PR/SM Initial Capping – Hard Cap
© 2014 IBM Corporation
Configuring LPARs for Performance
26
Weight Enforcement Depends Upon LPAR definitions
– LPAR with Initial Capping• Enforces processing weights to within 3.6% of the LPAR’s physical per CP share for logical
CPs entitled to 1/10 or more of one physical CP
– LPAR is Uncapped• Enforces the processing weights to within 3.6% of the LPAR’s physical per CP share for
logical CPs entitled to 1/2 or more of one physical CP
– LPAR Logical CP fails enforcement levels• Enforce the processing weights to within 3.6% of the total capacity of the shared physical
CP resources
– Typically in most cases PR/SM will manage the processing weights to within1% of the LPAR’s physical per CP share
PR/SM – Weight Enforcement
© 2014 IBM Corporation
Configuring LPARs for Performance
27
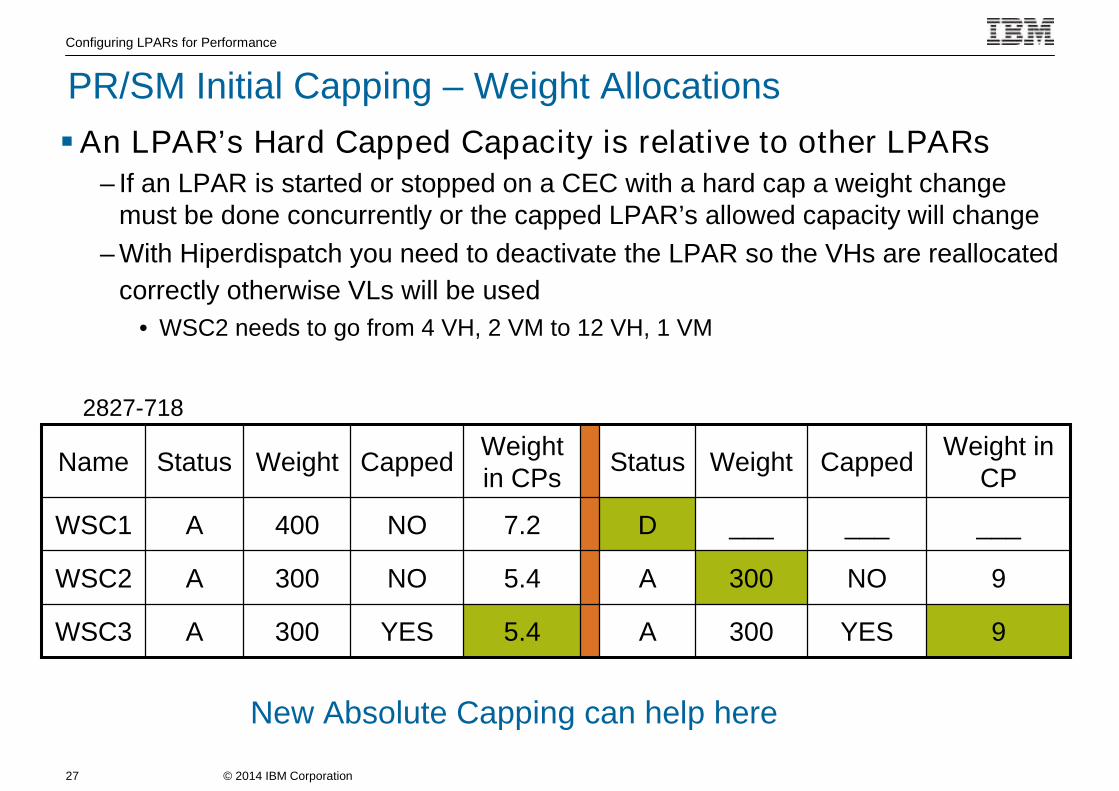
An LPAR’s Hard Capped Capacity is relative to other LPARs– If an LPAR is started or stopped on a CEC with a hard cap a weight change
must be done concurrently or the capped LPAR’s allowed capacity will change
– With Hiperdispatch you need to deactivate the LPAR so the VHs are reallocated
correctly otherwise VLs will be used
• WSC2 needs to go from 4 VH, 2 VM to 12 VH, 1 VM
9YES300A5.4YES300AWSC3
9NO300A5.4NO300AWSC2
_________D7.2NO400AWSC1
Weight inCP
CappedWeightStatusWeightin CPs
CappedWeightStatusName
2827-718
New Absolute Capping can help here
PR/SM Initial Capping – Weight Allocations
© 2014 IBM Corporation28
Configuring LPARs for Performance
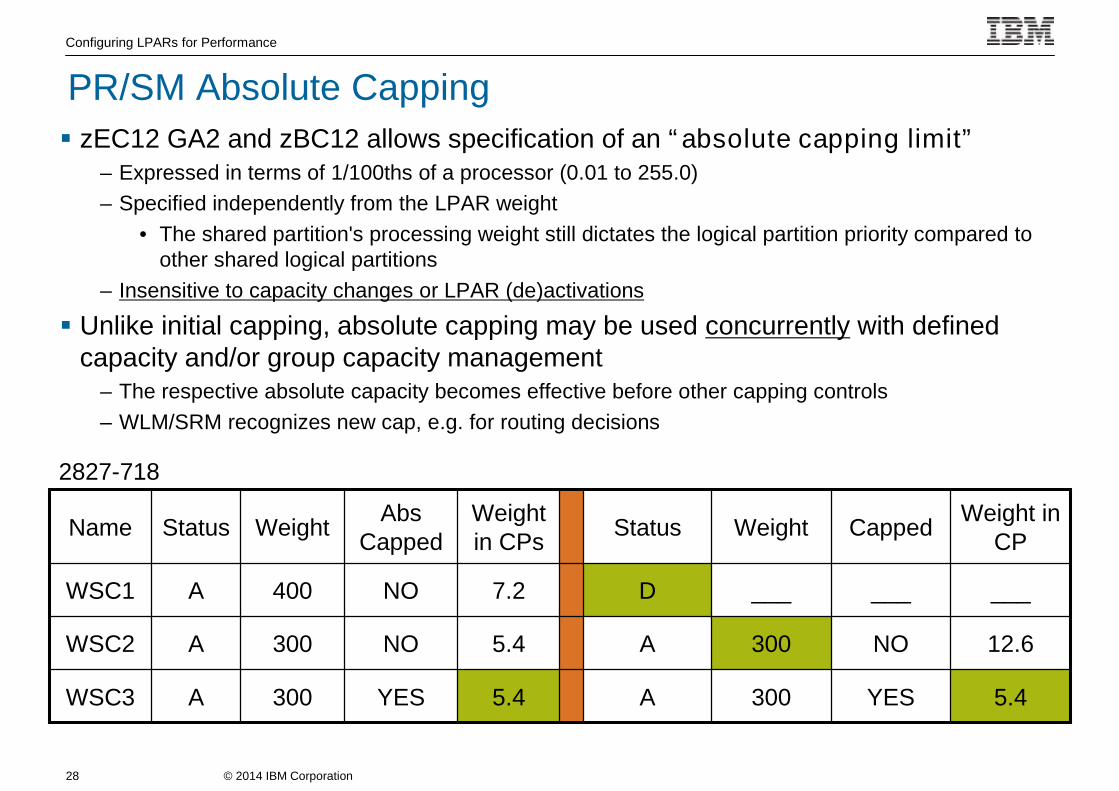
zEC12 GA2 and zBC12 allows specification of an “absolute capping limit”– Expressed in terms of 1/100ths of a processor (0.01 to 255.0)
– Specified independently from the LPAR weight
• The shared partition's processing weight still dictates the logical partition priority compared toother shared logical partitions
– Insensitive to capacity changes or LPAR (de)activations
Unlike initial capping, absolute capping may be used concurrently with definedcapacity and/or group capacity management
– The respective absolute capacity becomes effective before other capping controls
– WLM/SRM recognizes new cap, e.g. for routing decisions
PR/SM Absolute Capping
5.4YES300A5.4YES300AWSC3
12.6NO300A5.4NO300AWSC2
_________D7.2NO400AWSC1
Weight inCP
CappedWeightStatusWeightin CPs
AbsCapped
WeightStatusName
2827-718
© 2014 IBM Corporation
Configuring LPARs for Performance
29
Specified via LPAR definitions– Provides sub-CEC pricing by allowing definition of LPAR capacity in MSUs
• Allows a defined capacity smaller than the total capacity of the LPAR
• Provides 1 MSU of granularity
– Only way to get a soft cap
– Initial Capping (PR/SM Hard Cap) and Defined Capacity cannot be definedfor the same partition
– Absolute Capping and Defined Capacity can be defined for the samepartition
– LPAR must be using Shared CPs (Dedicated CPs are not allowed)
Defined Capacity – Soft Capping

© 2014 IBM Corporation
Configuring LPARs for Performance
30
Rolling 4-hour average tracked by Workload Manager– Rolling 4-hour average is not permitted to exceed defined capacity
• May exceed during early capping intervals
– If 4-hour average exceeds defined capacity, LPAR gets soft capped
1 2 3 4 5 6 7 8
Time (hours)
MS
Us
Utilization 4-hour Rolling Average Defined Capacity
Rolling 4 hr Average (R4HA) & Defined Capacity

© 2014 IBM Corporation
Configuring LPARs for Performance
31
When softcapped the LPAR is allowed to continually use theamount of capacity defined
Work is not stopped to “make up” for time period when rolling4hr average exceeds the defined capacity
10:45 11:00 11:15 11:30 11:45 12:00 12:15 12:30 12:45 13:00 13:15 13:30 13:45 14:00 14:15 14:30 14:45
Time
80
100
120
140
160
180
200
MS
Us
0
1
2
3
4
5
6
MSU USED
Roll 4hr
CAP
LOG OutR
Managing to the Rolling 4hr Average
© 2014 IBM Corporation
Configuring LPARs for Performance
32
Manage CPU for a group of z/OS LPARs on a single CEC
– Limit is set to total usage by all LPARs in group
• Level of granularity is 1 MSU
• Members which don't want their share will donate to other members
– Independent of sysplex scope and IRD LPAR cluster
– Works with defined capacity limits on an LPAR
• Target share will not exceed defined capacity
– Works with IRD
– Can have more than one group on a CEC but an LPAR may only be a memberof one group
– LPARs must share engines and specify WAIT COMPLETION = NO
Capacity groups are defined on the HMC Change LPAR Group Controlspanels
– Specify group name, limit in MSUs, and LPARs in the group
– Members can be added or removed dynamically
LPAR Group Capacity Basics

© 2014 IBM Corporation
Configuring LPARs for Performance
33
Uses WLM rolling 4 hr avg in MSUs to manage the Group Capacity limit– Cap enforced by PR/SM if group rolling 4 hr avg exceeds limit– Each member is aware of other members' usage and determines its share
based on its weight as a percentage of total weight for all members in group• When using IRD the weights can change and therefore the target MSU value can change• The defined capacity limit, if also specified, is never exceeded
Until members "learn" about the group and build a history, the cap is notenforced
– May take up to 4 hours for capping to start, like the bonus period with definedcapacity
– When new member joins the group, it has to build up its history and duringthis time the group usage may exceed the capacity limit
– Capping is removed when the group rolling 4 hour average drops belowgroup limit
Example shows how many MSUs each LPAR would get if they all wanted theirshare. Target MSUs based on a group limit of 200. Total group weight is 500.
LPAR WEIGHT SYSPLEX CAPACITY GROUP TARGET MSU
LPAR1 150 PLEX1 GROUPA 60
LPAR2 300 PLEX2 GROUPA 120
LPAR3 500 PLEX1 n/a n/a
LPAR4 50 PLEX1 GROUPA 20
LPAR Group Capacity Basics

© 2014 IBM Corporation
Configuring LPARs for Performance
34
0
688
1,376
2,064
2,752
3,440
4,128
4,816
5,504
6,192
6,880
7,568
8,256
8,944
0
9/29/2012
4 8 12 16 20 0
9/30/2012
4 8
0
84.25
168.5
252.75
337
421.25
505.5
589.75
674
758.25
842.5
926.75
1011
1095.25
WSC8
WSC6
WSC5
WSC4
WSC1
WSC3
WSC2
Group Cap
4HR Avg
MIPs Rate
Example of Group Capacity
© 2014 IBM Corporation
Configuring LPARs for Performance
35
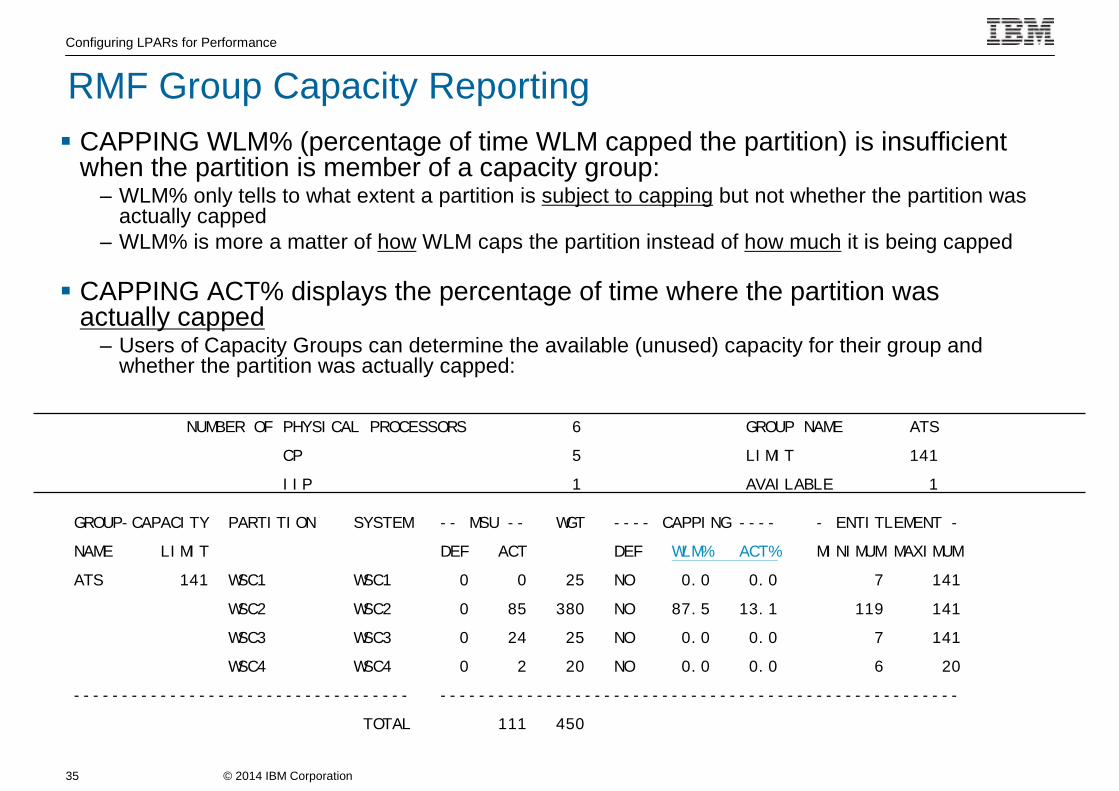
CAPPING WLM% (percentage of time WLM capped the partition) is insufficientwhen the partition is member of a capacity group:
– WLM% only tells to what extent a partition is subject to capping but not whether the partition wasactually capped
– WLM% is more a matter of how WLM caps the partition instead of how much it is being capped
CAPPING ACT% displays the percentage of time where the partition wasactually capped
– Users of Capacity Groups can determine the available (unused) capacity for their group andwhether the partition was actually capped:
GROUP-CAPACITY PARTITION SYSTEM -- MSU -- WGT ---- CAPPING ---- - ENTITLEMENT -
NAME LIMIT DEF ACT DEF WLM% ACT% MINIMUM MAXIMUM
ATS 141 WSC1 WSC1 0 0 25 NO 0.0 0.0 7 141
WSC2 WSC2 0 85 380 NO 87.5 13.1 119 141
WSC3 WSC3 0 24 25 NO 0.0 0.0 7 141
WSC4 WSC4 0 2 20 NO 0.0 0.0 6 20
----------------------------------- ------------------------------------------------------
TOTAL 111 450
NUMBER OF PHYSICAL PROCESSORS 6 GROUP NAME ATS
CP 5 LIMIT 141
IIP 1 AVAILABLE 1
RMF Group Capacity Reporting

© 2014 IBM Corporation
Configuring LPARs for Performance
36
On zEC12 GA2 the initial LPAR weight will be used for group capacity
– Only if all systems in a capacity group are• z/OS V2.1, or
• z/OS V1.12, V1.13 with OA41125 applied
OA29314 - DOC - IRD and Group Capacity
WLM only manages partitions in a Group Capacity which meet the followingconditions:
– Partition must not be defined with dedicated processors
– Partition must run with Shared processors and Wait Complete=No must be set
– Operating System must be z/OS 1.8 and above
– z/OS cannot be running as a z/VM Guest
– PR/SM Hard Capping is not allowed
Any LPAR not meeting the conditions is removed from the Group and theremaining LPARs are managed to the Group Limit
Group Capacity will function with IRD weight management as long as thepartitions in the Group are not subject to capping
– No Weight moves will take place as long as the Group is being capped
Intersection of IRD and Group Capacity
NEW!
© 2014 IBM Corporation
Configuring LPARs for Performance
37
It is recommended to turn on recording of SMF 99 subtype 11when you start to exploit group capping
–The collected data is small and only written every 5 minutes
–Size is about 1300 bytes fixed + 240 bytes per LPAR on a CEC
• Approximately 3k for a CEC with 8 partitions
–The data is crucial for all analysis done by IBM therefore recommendthe data be collected unconditionally
Enhanced SMF Recording
© 2014 IBM Corporation
Configuring LPARs for Performance
38
Summary
LPAR controls are important in controlling capacity available toworkloads
IRD weight management is still valuable if you have the rightenvironment
–Measure and manage at the LPAR Cluster level
Capping controls are inter-related and can be used to controloverall CEC capacity
–Be aware of the impacts on performance
© 2014 IBM Corporation
Configuring LPARs for Performance
39
© 2014 IBM Corporation
Configuring LPARs for Performance
40
TrademarksThe following are trademarks of the International Business Machines Corporation in the United States, other countries, or both.
The following are trademarks or registered trademarks of other companies.
* All other products may be trademarks or registered trademarks of their respective companies.
Notes:
Performance is in Internal Throughput Rate (ITR) ratio based on measurements and projections using standard IBM benchmarks in a controlled environment. The actual throughput that any userwill experience will vary depending upon considerations such as the amount of multiprogramming in the user's job stream, the I/O configuration, the storage configuration, and the workloadprocessed. Therefore, no assurance can be given that an individual user will achieve throughput improvements equivalent to the performance ratios stated here.
IBM hardware products are manufactured from new parts, or new and serviceable used parts. Regardless, our warranty terms apply.
All customer examples cited or described in this presentation are presented as illustrations of the manner in which some customers have used IBM products and the results they may haveachieved. Actual environmental costs and performance characteristics will vary depending on individual customer configurations and conditions.
This publication was produced in the United States. IBM may not offer the products, services or features discussed in this document in other countries, and the information may be subject tochange without notice. Consult your local IBM business contact for information on the product or services available in your area.
All statements regarding IBM's future direction and intent are subject to change or withdrawal without notice, and represent goals and objectives only.
Information about non-IBM products is obtained from the manufacturers of those products or their published announcements. IBM has not tested those products and cannot confirm theperformance, compatibility, or any other claims related to non-IBM products. Questions on the capabilities of non-IBM products should be addressed to the suppliers of those products.
Prices subject to change without notice. Contact your IBM representative or Business Partner for the most current pricing in your geography.
Adobe, the Adobe logo, PostScript, and the PostScript logo are either registered trademarks or trademarks of Adobe Systems Incorporated in the United States, and/or othercountries.Cell Broadband Engine is a trademark of Sony Computer Entertainment, Inc. in the United States, other countries, or both and is used under license therefrom.Java and all Java-based trademarks are trademarks of Sun Microsystems, Inc. in the United States, other countries, or both.Microsoft, Windows, Windows NT, and the Windows logo are registered trademarks of Microsoft Corporation in the United States, other countries, or both.Intel, Intel logo, Intel Inside, Intel Inside logo, Intel Centrino, Intel Centrino logo, Celeron, Intel Xeon, Intel SpeedStep, Itanium, and Pentium are trademarks or registered trademarksof Intel Corporation or its subsidiaries in the United States and other countries.UNIX is a registered trademark of The Open Group in the United States and other countries.Linux is a registered trademark of Linus Torvalds in the United States, other countries, or both.ITIL is a registered trademark, and a registered community trademark of the Office of Government Commerce, and is registered in the U.S. Patent and Trademark Office.IT Infrastructure Library is a registered trademark of the Central Computer and Telecommunications Agency, which is now part of the Office of Government Commerce.
Not all common law marks used by IBM are listed on this page. Failure of a mark to appear does not mean that IBM does not use the mark nor does it mean that the product is notactively marketed or is not significant within its relevant market.
Those trademarks followed by ® are registered trademarks of IBM in the United States; all others are trademarks or common law marks of IBM in the United States.
For a complete list of IBM Trademarks, see www.ibm.com/legal/copytrade.shtml:
*BladeCenter®, DB2®, e business(logo)®, DataPower®, ESCON, eServer, FICON, IBM®, IBM (logo)®, MVS, OS/390®, POWER6®, POWER6+, POWER7®,Power Architecture®, PowerVM®, S/390®, Sysplex Timer®, System p®, System p5, System x®, System z®, System z9®, System z10®, Tivoli®, WebSphere®,X-Architecture®, zEnterprise®, z9®, z10, z/Architecture®, z/OS®, z/VM®, z/VSE®, zSeries®
© 2014 IBM Corporation
Configuring LPARs for Performance
41
Any information contained in this document regarding Specialty Engines ("SEs") and SEeligible workloads provides only general descriptions of the types and portions of workloadsthat are eligible for execution on Specialty Engines (e.g., zIIPs, zAAPs, and IFLs). IBMauthorizes customers to use IBM SEs only to execute the processing of Eligible Workloadsof specific Programs expressly authorized by IBM as specified in the “Authorized Use Tablefor IBM Machines” provided at:www.ibm.com/systems/support/machine_warranties/machine_code/aut.html (“AUT”).
No other workload processing is authorized for execution on an SE.
IBM offers SEs at a lower price than General Processors/Central Processors becausecustomers are authorized to use SEs only to process certain types and/or amounts ofworkloads as specified by IBM in the AUT.
Notice Regarding Specialty Engines (e.g., zIIPs, zAAPsand IFLs):