Embed Size (px)
Citation preview

University of Massachusetts Amherst University of Massachusetts Amherst
ScholarWorks@UMass Amherst ScholarWorks@UMass Amherst
Doctoral Dissertations 1896 - February 2014
1-1-1986
Confirmatory analysis of market segments : an information Confirmatory analysis of market segments : an information
theoretic approach. theoretic approach.
Ajith Kumar University of Massachusetts Amherst
Follow this and additional works at: https://scholarworks.umass.edu/dissertations_1
Recommended Citation Recommended Citation Kumar, Ajith, "Confirmatory analysis of market segments : an information theoretic approach." (1986). Doctoral Dissertations 1896 - February 2014. 6037. https://scholarworks.umass.edu/dissertations_1/6037
This Open Access Dissertation is brought to you for free and open access by ScholarWorks@UMass Amherst. It has been accepted for inclusion in Doctoral Dissertations 1896 - February 2014 by an authorized administrator of ScholarWorks@UMass Amherst. For more information, please contact [email protected].


CONFIRMATORY ANALYSIS OF MARKET SEGMENTS:
AN INFORMATION THEORETIC APPROACH
A Dissertation Presented
By
AJITH KUMAR
Submitted to the Graduate School of the University of Massachusetts in partial fulfillment
of the requirements for the degree of
DOCTOR OF PHILOSOPHY
February 1986
School of Management

Ajith Kumar
All Rights Reserved
• • i l

CONFIRMATORY ANALYSIS OF MARKET SEGMENTS:
AN INFORMATION-THEORETIC APPROACH
A Dissertation Presented
by
Ajith Kumar
Approved, as to style and content by:
Acting Doctoral Program Director School of Management

ACKNOWLEDGEMENTS
This dissertation is the natural consequence of an abiding interest
in the application of quantitative methods to marketing which was fos¬
tered in me by William R. Dillon. My debt to Bill is both intellectual
and personal.
Anna Nagurney's timely and-expert supervision of the mathematical
programming aspects of the dissertation is gratefully acknowledged. Her
knowledge of mathematical programming made it possible for me to feel
less uneasy about my relative ignorance of the same.
Although Tom Madden's constant words of encouragement and prodding
to "get on with the program" were not always received with the proper
enthusiasm at the times they were proffered, they are, in retrospect,
gratefully acknowledged as being a contributory factor in the timely
completion of this dissertation.
A words of thanks to an unofficial committee member—Narendra
Mulani, whose programming expertise and knowledge of the CDC CYBER 175
system were always generously made available to the author. Against
Naren, it could truly be said, even the CYBER didn’t stand a chance.
And finally, an acknowledgement of gratitude to an anonymous
benefactor whose generosity reached halfway across the globe and made
possible the realization of a long-cherished dream--the ordinary tax¬
payer of Massachusetts who made it all possible.
iv

ABSTRACT
Confirmatory Analysis of Market Segments:
An Information Theoretic Approach
(February 1986)
Ajith Kumar, B.Sc. (Hons.), Indian Institute of Technology, Kharagpur
P.G.D.M., Indian Institute of Management, Calcutta
Ph.D., University of Massachusetts
Directed by: Dr. William R. Dillon
This dissertation develops a model-based framework for the
analysis/identification of market segments. Following earlier work, the
segmentation problem is conceptualized as the specification of two sets
of variables—a basis set used to form segments and a descriptor set
used to discriminate among segments. The problem of using descriptor
sets consisting of categorical variables is the focus of research. The
evaluation of descriptor sets, in terms of their performance in discrim¬
inating among segments, is conceptualized as a sequence of tests of
nested models.
The information theoretic approach is shown to be a suitable one
for estimating model parameters and simultaneously assessing the
goodness-of-fit of the model to the data. The methodology is imple¬
mented using the variable metric method of minimization.
A simulation study establishes the satisfactory performance of both
the methodology and the algorithm used in implementation. An example
illustrating the use of the methodology is also presented.
v

TABLE OF CONTENTS
ACKNOWLEDGEMENTS . iv
ABSTRACT . v
Chapter I. INTRODUCTION . 1
II. SEGMENTATION: THEORY AND PRACTICE . 3
III. THE PROBLEM OF SEGMENT EVALUATION USING CATEGORICAL DATA . . 9
IV. ESTIMATION BY SEQUENTIAL UNCONSTRAINED MINIMIZATION .... 20
V. SIMULATION AND DATA ANALYSIS.27
VI. CONCLUSIONS.'.53
SELECTED BIBLIOGRAPHY . 55
vi

LIST OF TABLES
1. ANOVA Results for KITER.35 2. Cell Means for the Analysis of Simple Main Effects (KITER) ... 36 3. ANOVA Results for ABSDEV.39 4. Cell Means for the Analysis of Simple Main Effects (ABSDEV) ... 40 5. Distribution of ABSDEV.42 6. Data Presented by Goldstein and Dillon (1978) . 46 7. Estimates of Cell Probabilities Under Hypothesis H3 . 50 8. Allocation of States to Populations . 51
vi i

CHAPTER I
INTRODUCTION
This dissertation focuses on the development of a methodology to
evaluate sets of variables (descriptors) in terms of their efficacy in
discriminating among previously defined market segments. The choice of
variables is restricted to those which are categorical in nature.
In Chapter II, a review of the literature on segmentation reveals
important gaps in approaches to segmenting markets especially with
regard to the specification of descriptor sets. An alternate approach
to segmentation is then presented which treats the segmentation problem
as a dual problem of clustering and discrimination.
Chapter III introduces and describes the problem of evaluating
descriptor sets consisting of categorical variables. The evaluation
problem is reformulated as a set of models/hypotheses posited to hold in
the population under study, and the estimation of certain unknown popu¬
lation parameters. Under certain specified conditions, the estimation
problem is shown to reduce to a nonlinear programming problem. The use
of the Minimum Discrimination Information statistic provides for the
simultaneous estimation of parameters and the assessment of the goodness-
of-fit of the model under which the estimation is carried out. Illus¬
trative examples of possible models/hypotheses which could be tested in
the context of the segmentation problem are also provided.
The implementation of the nonlinear programming problem is
described in Chapter IV. The method of sequential unconstrained
1

2
minimization is briefly presented, with details of the exterior penalty
function method. The large number of variables involved and the needed
computational requirements dictate the use of the Davidon-Fletcher-
Powell variable metric method for minimization.
Chapter V describes the results of a simulation study carried out
to assess the performance of the methodology and the algorithm used to
implement it. In addition an example illustrating the use of the meth¬
odology in a segmentation context is presented.
The final chapter contains a summary of the conclusions which
emerged from the empirical investigations and provides recommendations
for extensions of the methodology, both within and outside the marketing
disci piine.

CHAPTER II
SEGMENTATION: THEORY AND PRACTICE
Segmentation has long been recognized by academics and practition¬
ers alike as being a dominant concept of marketing. In one of the
earliest articles on segmentation, Wendell Smith (1956) sought to draw a
distinction between product differentiation and market segmentation as
alternative strategies available to the firm. Both strategies implicit¬
ly assume the existence of several demand curves for a single product,
where each curve graphs the response of a subset of consumers. The
strategy of product differentiation describes attempts by the firm to
bring about convergence on the demand side to a single product while the
strategy of market segmentation requires several product offerings, with
each product meeting the requirements of a specific sub-group of con¬
sumers rather than the total market.
Changes in the marketplace, both on the supply side and the demand
side, have made market segmentation the dominant strategy and in many
instances, the strategy of product differentiation is no longer a viable
alternative. While Smith (1956) provides an elegant conceptualization
of segmentation, no framework or model is offered which could be used to
develop a theory or methodology of segmentation.
In examining the literature, one is struck by the gap between aca¬
demically oriented research and managerial applications. As noted by
Wind (1978), theories of segmentation that have been proposed are norma¬
tive (e.g., Claycamp and Massy, 1968; Mahajan and Jain, 1978; Tollefson
3

and Lessig, 1978) and virtually ignore the practical difficulties
involved in implementation.
Before attempting to analyze the theoretical literature on segmen¬
tation in greater detail, it is necessary to establish a general frame¬
work within which the analysis can be carried out. This framework is
provided by the segmentation model, which, following Wind (1978),
requires the specification of two sets of variables--one set forming a
basis for segmentation and the other set consisting of variables which
serve to describe the segments. It should be noted that there exists no
consensus in the segmentation literature on the use of terminology.
Sometimes the terms dependent variables and independent variables are
used to denote the basis set and the descriptor set respectively (e.g.,
Frank, Massy and Wind, 1972). The terms basis and descriptor variables
will be used herein since the labeling of variables as dependent and
independent typically tends to imply the existence of structural or
causal relationships between the two sets.
A review of the literature shows that most segmentation studies do
not maintain the distinction between basis variables and descriptors.
Indeed, as noted by Wind, "the variables used as basis for and descrip¬
tors of segments have included all variables suggested in the consumer
behavior literature" (1978, p. 319). This suggests one of two possi-
bilities--that the distinction is vacuous or that it needs to be expli¬
cated in greater detail if it is to prove useful. The position taken
herein is that the distinction is useful, and as will be shown later,
conceptually and methodologically important.

5
Studies attempting to provide a perspective on segmentation have,
for the most part, adopted what might be termed a taxonomic approach.
The objective of such approaches was to classify segmentation studies
into two or more groups on the basis of some criterion variable. Thus
Wind's (1978) review of segmentation research classifies segmentation
studies as a priori or clustering based segmentation designs, which
appears to differ very little from Green's (1977) dichotomy of a priori
and post hoc segmentation designs.
An alternative classification of approaches to segmentation was
provided by Assael and Roscoe (1976), where two dichotomous variables
were used simultaneously to cross-classify segmentation studies. One
dichotomy was the definition of response behavior as univariate or
multivariate. The other dichotomy was the specification of the behav¬
ioral criterion as response level at a given point in time versus
response elasticity over time.
Another distinction which has been made is between behaviorist and
decision oriented schools of market segmentation research (Frank, Massy
and Wind, 1972). Behavioral research seeks to identify and document
group differences, searches for predictors of such differences and
attempts to provide a theoretical explanation for the existence of such
group differences. Decision oriented research, on the other hand, pre¬
supposes the existence of group differences and focuses on forming mean¬
ingful segments. As with behavioral research, predictors of group dif¬
ferences are specified, and in addition, procedures are sought to be
developed for the allocation of marketing resources to various segments.

The essential difference between the two schools is the presence or
absence of a theoretical framework which postulates the existence of
structural/causal relationships (in contradistinction to the theory
characterizing normative approaches). However, a review of the segmen¬
tation and consumer behavior literature shows the absence of any accept¬
able, unifying theoretical framework and it may be safely assumed that
any theoretical developments in segmentation would probably occur on the
normative side, making the above classification unnecessary.
> Critique
As pointed out earlier, most of the previous analyses of segmenta¬
tion studies took the form of classification of the studies on the basis
of some criterion variable. Wind's (1978) classification of studies as
a priori or clustering based segmentation designs focuses on one half of
the segmentation model--the delineation of segments using some set of
variables as a basis. The same comment holds for Green's (1977) dicho¬
tomy of a priori and post hoc segmentation designs.
While the need to take cognizance of customer characteristics is
pointed out, descriptor variables are not explicitly incorporated into
the two way classification of segmentation studies by Assael and Roscoe
(1976).
A fundamental gap in the above approaches to segmentation research
is that they tend to highlight the basis part of the segmentation model
and virtually ignore the problems of descriptor set specification. A
notable departure from this trend is found in the more recent work of

7
Green and his colleagues who have introduced flexible and componential
segmentation designs which incorporate both product and consumer charac¬
teristics (Green and Wind, 1973; Green, Carroll and Carmone, 1977).
From a managerial standpoint effective segmentation requires the
specification of both the basis variables and the descriptor set.
Situations may arise where the choice of a suitable basis set yields
well-defined and meaningful segments. At the same time, the lack of a
suitable descriptor set permitting the decision maker to discriminate
among those segments may result in the basis set being rejected and
alternative bases being examined. In addition to segmenting the market,
it is important to evaluate each segment to ascertain the feasibility of
marketing to a particular segment. It is' in this context that descrip¬
tors play an important role in segmentation. These managerial consi¬
derations dictate an alternative approach to the segmentation problem.
An Alternative Approach
In simple terms the segmentation problem can be described as fol¬
lows. It is assumed that the total market for a product is composed of
sub-groups where each sub-group is characterized by similar needs and
wants. This is a precondition for segmentability of the market. Thus
one can specify variables such that for each variable every consumer has
a preference for some level of that variable. If the preferred level
for every variable is known, then each consumer can be represented as a
point in the joint space with the variables as coordinates. Then the
problem of specifying a basis set reduces to a problem of selecting a

8
set of variables which yield clusters of consumers in the joint space.
Once a suitable basis yielding meaningful clusters has been found, the
task becomes one of selecting a set of descriptors which enables the
decision maker to discriminate among the clusters, that is, to identify
the segments.
From a managerial standpoint, the basis set should be chosen from
the set of controllable variables in the marketing.mix, that is, those
variables whose levels can be varied freely by the decision maker, or
variables which are surrogates for the controllable variables.
Similarly, the descriptor set should be chosen from variables which
help to identify consumers or from surrogates of these variables. Thus
market segmentation is a dual problem of clustering and discrimination.
In this framework, the previously proposed classifications of segmenta¬
tion studies are seen to be classifications of clustering procedures
depending on the choice of variables and/or methods. In addition, this
framework preserves the conceptual distinction between basis variables
and descriptors, and a particular variable can belong to only one of the
two sets.

CHAPTER III
THE PROBLEM OF SEGMENT EVALUATION
USING CATEGORICAL DATA
Any product offering can be viewed as embodying a bundle of attri¬
butes. From a practical standpoint, it makes sense to consider only
those attributes which are elements of the marketing mix. Therefore any
product can be represented as a vector whose elements are the levels of
various attributes.
The set of products in a market can be represented in terms of
attribute vectors. However, each attribute vector may not represent a
distinct market segment. It is possible that two or more attribute
vectors may be similar enough to represent the same market segment.
Here it is assumed that the set of products has been partitioned
such that each member of the partition represents a distinct market
segment. It is necessary to characterize the consumers in the different
segments in much the same way as the segments themselves can be charac¬
terized by attribute vectors.
Just as products are characterized as attribute vectors, individual
consumers can be represented by measurements on a predetermined set of
descriptor variables. Ideally, the set of descriptor variables should
be chosen such that each vector of these variables can be uniquely
assigned to one (and only one) market segment; that is, all consumers
with identical measurements on the descriptor variables set should
belong to the same market segment. The set of all descriptor variable
9

10
vectors assigned to a particular market segment serve to define the
consumers belonging to that segment.
In practice, however, it is found that such unique assignments are
not possible, that is, consumers with the same measurements on the set
of descriptors may not belong to the same segment. In such instances,
the assignments of descriptor variable vectors have to be made probabil¬
istically. In other words, given a particular vector of measurements on
the descriptor set, there is a probability that a consumer with those
measurements on the descriptor variables will belong to any particular
market segment. The probability may be zero for some market segments.
The probabilistic assignment reflects the fact that the set of
descriptor variables are not perfect indicators of the market segments.
In the absence of a theory linking consumer preferences with a set of
descriptors, the choice of a descriptor set tends to be somewhat ad hoc
and therefore necessarily imperfect.
In the case where the variables constituting the descriptor set are
continuous, and the market segments are specified a priori, the tech¬
nique of discriminant analysis can be used to classify consumers into
distinct market segments. Typically a linear discriminant function is
employed to effect the classification. When the variables in the
descriptor set are categorical, a variety of methods have been adopted
to develop classification schemes. These include: (1) treating the
categorical variables as if they were continuous and using Fisher's
linear discriminant function or some variant thereof; (2) reparameteri¬
zation of the full multinomial model to achieve a more parsimonious

n
representation of the data (e.g., loglinear and logit models); and
(3) the use of procedures based on distributional distances (Matusita,
1954).
The purpose of this study is to develop a method by which sets of
descriptor variables can be evaluated in terms of their effectiveness in
discriminating among consumers belong to different segments. The study
is restricted to variables which are categorical in nature. Prior to
the elucidation of the method proposed, it is necessary to redefine the
problem for the special case of categorical variables.
Notation
Let . X denote the categorical variable that indi- 9 cates an individual's membership of a market
segment
X., X., X, and X„ denote an individual's "measurements" on the J L variables in the descriptor set
g=l ,2,...,G i=l ,2,... ,1 j=l,2,... ,J k=l,2,... ,K Z=1,2,...,L
For expository purposes, only four variables are included in the
descriptor set. The extension of the method to descriptor sets of
larger or smaller sizes is straightforward.
With reference to all the variables mentioned above, it is assumed
that an individual is assigned to only one category of each variable,
that is, the classification is mutually exclusive and collectively
exhaustive. The total number of profiles generated by the descriptor
variable set is IxJxKxL.

12
Let X. .. ^ = (i,j,k,£) denote the typical profile with respect J to the descriptor set alone
= 0,1,1,1), (1,1,1,2), (I,J,K,L)
X .... = (g,i,j,k,Jl) denote the individual's profile with 9 J respect to the descriptor set and the market
segment indicator
(g,i,j,k,£) = (1,1,1,1,1), (1,1,1,1,2), ..., (G,I,J,K,L)
Given the a priori specification of market segments, the segmentation
problem becomes one of choosing a descriptor set such that each profile
in the descriptor set, that is, each (i,j,k,£) can be uniquely assigned
to one (and only one) market segment. Mathematically the problem be¬
comes one of choosing variables X., X., X^, and X^ such that
D/w |Y \ _ rl for only one value of X g1 Aijkr 10 for other values of X 9
V
for all IxJxKxL profiles. In the above, P(Xg| X^j^) represents the con¬
ditional probability of being in the gth category of Xg given that the
individual has profile (i,j,k,Ji).
However, in practice such unique assignments are not possible, and
one finds that the conditional probability tends to be non-zero for more
than one value of g. The question then arises as to what classification
schemes might be optimal in such situations. One approach would be to
assign each profile in the descriptor set to that category of Xg for
which the conditional probability is the highest among all categories of
Xg. Should there be more than one such category, the assignment is to
be done randomly to one category from among those for which the tie
occurs.

13
If the descriptor set profile and the market segment membership of
every individual in the relevant population is known, then the approach
outlined above can be implemented in a fairly straightforward manner and
some estimate can be obtained of the errors in classification. In terms
of discriminating among segments, alternative descriptor sets can be
compared on the basis of their relative error rates.
In most practical situations, however, the population probabilities
have to be estimated from observations made on a random sample. In the
case where no assumptions are made about the descriptor set profiles and
their relationships to the market segments, the sample-based probabili¬
ties are taken to be the estimates of the corresponding population prob¬
abilities, and the assignments of descriptor set profiles to market
segments are made accordingly, and estimates of classification errors
are obtained.
However, situations could arise where additional information is
available to the decision maker which could be utilized in conjunction
with the sample observations for estimating the population parameters.
The additional information takes the form of relationships hypothesized
to hold among the descriptor set profiles and the market segments.
The method to be proposed can utilize any information which can be
expressed as a linear combination of the population probabilities. This
approach differs from the approach of estimating the population prob¬
abilities from the corresponding sample probabilities in that the popu¬
lation values are estimated subject to one or more linear constraints.

14.
In a particular segmentation problem, the set of linear constraints can
be viewed as a model or underlying mechanism generating the data.
The constraints used in the estimation process fall into two cate¬
gories— those which are known to hold in the population and those repre¬
senting hypotheses postulated by the decision maker. An example of the
former is a situation where the market shares of all the brands con¬
cerned are known. This information can usefully be incorporated into
the estimation process in the form of certain equality constraints on
some marginal probabilities, as will be shown later.
As an example of the second category, the decision maker might
hypothesize that a particular variable in the descriptor set does not
discriminate among the market segments given the other variables in the
descriptor set. As with the previous example, this hypothesis can be
translated into a set of constraints on certain population probabili¬
ties.
Although a model in a typical problem would consist of constraints
belonging to both categories, the distinction is important when evaluat¬
ing the adequacy of the models in terms of how well they fit the data.
The estimation of population probabilities involves the minimization of
a certain function subject to the constraints implied by the model. The
estimation process, in addition to providing estimates of population
probabilities, also provides a test statistic which can be used to
assess the goodness-of-fit between the model and the data. While accep¬
tance of the null hypothesis (the model) would imply empirical support

15
for the entire model, rejection of the null hypothesis would only imply
rejection of the constraints representing the untested hypotheses.
Estimation
The problem as described previously requires the selection of a set
of probabilities, satisfying the constraints imposed by the model, as
estimates of the population values. In general, many different sets of
probabilities are feasible solutions, that is, more than one set of
probabilities will satisfy the set of constraints implied by the model.
Therefore, a criterion is required by which a solution can be chosen
from the feasible set.
The criterion proposed to be used is the discrimination information
function (Gokhale and Kullback, 1978) defined by
I (n: p) = £ii((juUn(n(a))/p(u))) n
where p(.w) are the observed sample cell probabilities, II(w) is any set
of probabilities satisfying the model constraints, and the summation is
carried out over all cells in the multiway contingency table. The set
of probabilities chosen as the estimate of the population values is that
which minimizes the function described above. In other words, the solu¬
tion chosen from the feasible set is that which is "nearest" to the
observed sample probabilities.
In the special case where no constraints are placed on the popula¬
tion probabilities, the estimates minimizing the function will be equal
to the corresponding sample probabilities, and the value of the function

16
will be zero since £n(n(a))/p(a))) = £n 1=0, for all terms in the summa¬
tion.
Another special case is the situation where all the constraints in
the model equate some of the population probabilities to the correspond¬
ing sample marginals. The estimates obtained in such cases would be
identical to those obtained using the equivalent loglinear models.
Hypothesis Testing
If in the expression
I(n:p) = In(u>)zn(n(co)/pU))
cell frequencies/counts are substituted for the corresponding probabili¬
ties, the function can be alternatively expressed as
I (X*: X) = £X*(w)£ n(X*(a))/X(aj)) ft
where X*(u)) = Nil (ca)
X(oo) = Np (co)
N = sample size
The function 21(X*:X) is distributed asymptotically as a central
chi-square random variable with degrees of freedom equal to the number
of linearly independent equality constraints in the model. This does
not include the equality constraint which specifies the probabilities to
sum to one. Large values of the test statistic would lead to the rejec¬
tion of the model. In this approach, parameter estimation and hypothe¬
sis testing are carried out simultaneously.

17
Some Illustrative Examples
Notation
Let n(gijk£) be the probability (in the population) that an indi¬ vidual belongs to the gth category of X , the ith category of X., the jth category of X.,ythe kth category of X^, and the Uh category of X£.
nCgi/jkil) be the probability that the individual belongs to the gth category of X and the ith category of X. given that he/she belongs to the jth, kth, and &th categories of Xj, Xk, and X£ respectively.
P(gijk£) and P(gi/jk£) be the sample based probabilities corresponding to the population probabilities described above.
Example 1: The Test that a Specified Descriptor Set Does Not Discriminate Among Market Segments
Consider a typical descriptor set profile (ijk£). The profile
cannot be assigned, except randomly, to any group g if
n(g/ijkA) = 1/G for all categories of Xg
This implies that
n(1/ljkA) = n(2/ijki) = ... = n(G/ljka)
However
n(g/ijk£) = n(gijk£)/n(ijk£)
Therefore
n(lljkJl) = H(21jkA) = ... = n(Gijk£)
is an equivalent hypothesis.
The above hypothesis is reformulated in terms of linear constraints
as follows.

18
n(lijla) - n(2ijk£) = 0
n(2ijk£) - n(3ijkH) = 0
n[(G-l)i jkJi] - n(Gijk£) = 0
For each (ijk£) we have G-l linearly independent restrictions, yielding
a total of IxJxKxl_x(G-l) restrictions in all.
Example 2: Improving Estimates of Population Probabilities when Additional Information is Available
Let the market shares of various brands be known and for illustra¬
tive purposes let each brand represent a distinct segment, that is, a
distinct category of X . Letting c denote the market share of the gth
brand, the following restrictions can be imposed.
^ = ijk?giJU = Cg 9=1,2’--"G
In the above case, if the numerical value of the test statistic turns
out to be significantly large, then the sample has to be rejected as
being unrepresentative of the population since the model only contains
constraints known to hold in the population.
Example 3: Detection of “Significant" Profiles
In certain situations, when a model is rejected, the decision maker
might wish to ascertain the extent to which a subset of the profiles
contributes to the rejection of the model. Here a model is fitted (Ml)
where the restrictions are applied to all profiles. Then another model
(M2) is fitted where the restrictions are applied to all profiles other

19
than those belonging to the specified subset. Each model yields a chi-
square test statistic. Since the models are nested, the difference in
chi-square values is itself distributed as a chi-square random variate
with degrees of freedom equal to the difference in the degrees of free¬
dom for the two models.

CHAPTER IV
ESTIMATION BY SEQUENTIAL UNCONSTRAINED MINIMIZATION
For the sake of clarity in exposition, a different notation will be
used in this chapter.
Let s be the total number of cells in the complete multiway table
p. be the observed probability (in the sample) for the ith cell
n. be the population probability for the ith cell
l 1,2,...,s
First the estimation process is described for the single sample
case. The extension to the multi-sample case, which is fairly straight¬
forward, is then briefly presented.
The estimation of parameters under the hypotheses given in Chapter
III can be subsumed under the mathematical programming problem given
below.
Minimize
I(n:p) = l ILtnOl./pJ i=l 1 1 1
subject to
I n. = l i=l 1
s l c..n. = 0. j=l ,2,... ,m itks
i=l J' 1 J
20

21
1|1d^iTIi - n£ 1 l,2,...,q
n. j> 0 i=l,2,... ,s
where c.. 0., d.., and n0 are known constants. J I J Xj I A/
The objective function is strictly convex for IT^>0, while the con¬
straints are linear. Hence the estimation process simplifies to a con¬
vex programming problem, guaranteeing the existence of a unique minimum,
Rewriting the constraints as follows
I n - i = o 1=1 1
s } c,.n. - 0. = 0 j=l,2,...,m m<s
ji i j
n. < o i-i ,2,... ,s
and let
<(-n.)> = max {(-n.),0} i=l,2,...,s
s s <(n£-J^djll.ni)> = max {(nA- ,0} £=l,2,...,q
The objective function and the constraints are utilized to form the
following auxiliary function

22
s Q(jJi,Yk) = J H^nUlj/p.) + yk
+ Y
m s 2 + Yk V ( Y c..n.-e.)
where Yk is an increasing sequence of positive real numbers
(k=l,2,3,...) and is termed the penalty parameter.
Following Rao (1984) the estimation proceeds as follows.
(i) Set k=l. Start with a set of values for the n.'s and a suit¬
able value for y..
(ii) Find the vector jj* that minimizes Q0j,Yk)«
(iii) Test whether the point JJ* satisfies all the constraints. If
JJ* is indeed feasible, then it is the desired minimum. Other¬
wise, set k=2 and choose the next value of the penalty param¬
eter which satisfies the relation
Vi > \
(iv) Go to step (ii).
The choice of the exterior penalty function method (over the inter¬
ior penalty function method) is made on grounds of expediency. The use
of the interior penalty function method requires the specification of a
vector from the feasible set as start values. In problems with a large
number of constraints, finding an appropriate vector of start values
itself becomes a mathematical programming problem.

23
The constraints specifying nonnegativity of parameter estimates,
that is, n.>0, may be redundant since the objective function is defined
only for positive values of the n.'s. Another point to be noted is that
the function n.£n(n./p.j) is not defined when is exactly equal to
zero. In implementing the optimization problem, insufficiency of arith¬
metic precision may cause some parameter to be estimated at zero (say
nk). In such cases, it is proposed to set the corresponding summand in
the objective function (i^ntn^/p^)) to zero, consistent with the limit¬
ing behavior of the function as
For each value of the penalty parameter the unconstrained mini¬
mization is to be carried out using the Davidon-Fletcher-Powell variable
metric method (Davidon, 1959; Fletcher and Powell, 1963). This method
is preferred in cases where the number of variables in the objective
function is large. In the present problem, the number of variables is
equal to the number of cells in the multiway contingency table. The
Davidon-Fletcher-Powell method does not require the evaluation of the
matrix of second order partial derivatives of the auxiliary function.
Further, being a conjugate gradient method, it is quadratically conver¬
gent.
Following Rao (1984) the iterative procedure of the method is as
follows.
(i) Start with an initial vector n. and an sxs positive definite
symmetric matrix , where s is the number of parameters to be
estimated, that is, the number of cells in the contingency
table. Usually is taken as the identity matrix I. Set
iteration number n=l.

24
(ii) Compute the gradient of the function (VQ ) and at the point
JJ and set
(iii) Find the optimal step length A* in the direction £n and set
^n+1 ^n + ^n^n
Civ) Test the new point for optimality. If JJn+^ is optimal,
terminate the iterative process. Otherwise go to step (v).
(v) Update the H matrix as
^n+1 ttn + Wn + Wn
where
*n Xn77 £n£n
and
n
$n V^n+1 ’ V(^n
(vi) Increase the iteration number by one unit and go to step (ii)
The computation of the gradient vector, the search direction, and
the matrices Jj, jjj, and Jjl is straightforward. However, the efficient
use of the method requires the accurate determination of the optimal
step length A* at each iteration. The optimal step length is to be
determined as follows.

25
Let$n = (Sm’S2n’-"’Ss n) where s is the number of cells in the
table
Then Gn+l = fin + X$n
and *£+1 = (nln+XnSln’II2n+XnS2n.nsn+XnSsn^
Then the problem of finding the optimal step length reduces to finding
the value of An which minimizes Q(jJn+A S), for fixed JJn and £ .
Since A is the only variable, and since the function has continu¬
ous first and second order partial derivatives with respect to A , a
Newton-Raphson procedure can be employed to determine the optimal step
length.
/
Extension to n Samples
It is assumed that the samples are drawn independently.
Let s^ denote the total number of cells in the kth sample (multi¬
way table)
k = 1,2,... ,n
p.k denote the observed probability (in the kth sample) for the
ith cell)
i = 1,2,.. ,s
IIik denote the population probability (in the kth population)
for the ith cell
w^ denote a set of known weights, that is,
n \ w. = 1 and 0 £ w, < 1
k=l * K

The estimation problem then becomes
Minimize
n sk I(H-P) ~ £ £ nik^n^ik^ik^
k 1 l 1
subject to
bk
i nik i=l 1K
= 1 k=l,2,... ,n
i|1CjikTIik 9jk • ,mk mk<sk
l i=l dJ’ikIIik - nJtk Z 1)2)...
_> 0 i=l ,2,... jS^; k=l,2,...,n
where c^^, 9j^, d^, and are known constants.
The auxiliary function is
n sk
Q^ik’V “ k|1wki|iIIik5'n^TIik/p-ik^
n qk sk n sk + Yh I l <(rij,k- l dj,iknik)> + Yh I I <(-n
n k=l 4=1 !tK i=l 161K 1K nk=l i=l
n sk o n m sk + Y^ I ( I ^ik“l) + Y^ 1 I ( I cjikrTik"ejk^
nk=l i=l 1K nk=l ,i=l i=l J1K 1K JK
where is the penalty parameter at the hth interation.

CHAPTER V
SIMULATION AND DATA ANALYSIS
This chapter describes a simulation which was conducted to assess
the practical utility of the methodology, and presents an illustrative
example of how the methodology can be applied in a segmentation context.
Simulation
Although the nature of the non-linear programming problem and the
use of the variable metric minimization method assures theoretical con¬
vergence to the global minimum, it is still necessary to assess the
methodology from a practical standpoint. Numerical errors and the arbi¬
trary specification of the parameters of the algorithm (e.g., specifica¬
tions of convergence and termination criteria) may lead to lack of
convergence or convergence to a sub-optimal feasible solution. For
example, efficient use of the variable metric minimization method
requires accurate determination of the step length. However, too much
accuracy may result in convergence to sub-optimal solutions (Box, 1966).
An important practical consideration is the rate of convergence. If the
rate of convergence is inadequate even for problems of reasonable size,
then alternative algorithms (minimization methods) should be studied.
For any particular problem, the parameters of the algorithm can be spe¬
cified by trial and error to provide reasonably accurate solutions.
However, the assessment of a methodology (in its implementation) re¬
quires that its performance be monitored over a wide variety of problems
27

28
which form a representative sample drawn from the domain of application
of the methodology. This requirement provided the rationale for the
simulation design and the analysis of simulation results.
Simulation Design
Although the methodology can be applied to solve a variety of prob¬
lems in different disciplines, the focus of this dissertation is on the
analysis of market segments. Therefore, the domain of application was
restricted to segmentation issues in designing the simulation study.
In the segmentation area alone several models can be hypothesized
and tested. The appropriateness of a particular model or subset of
models is a function of the specific problem situation and the manager¬
ial requirements, if any. However, one model which is of interest in
almost all situations is an assessment of the extent to which a speci¬
fied set of descriptor variables serve to discriminate among segments.
This assessment is carried out by estimating parameters (cell probabili¬
ties) under a model which hypothesizes that the descriptors jointly pro¬
vide no discrimination among market segments. Tests of and estimation
under other models are meaningful only if the above hypothesis is
rejected. Should the hypothesis not be rejected, the decision maker has
to specify an alternative descriptor set for segment identification/
evaluation. Therefore, the model which tests the hypothesis of no dis¬
crimination among market segments was chosen for the simulation study.
Given the above model, there exists infinitely many population
structures (discrete probability distributions) from which random

29
samples can be drawn for use in the simulation. However, from the
segmentation standpoint, these distributions can be placed on a bipolar
continuum with one endpoint consisting of distributions which provide
absolutely no discrimination and the other consisting of probability
distributions which discriminate perfectly among segments. Mathematic¬
ally, the endpoints can be described as follows.
Let n(g/ijk2,) be the conditional probability of being in the gth
group (i.e., gth category of X ) given the ith, jth, kth and ith levels
of descriptor variables X., Xj, X^ and X^ respectively,
g = 1,2,...,6
i = 1,2,...,1
Z = 1,2,... ,L
Then the end-point consisting of distributions which provide abso¬
lutely no discrimination is the set of all distributions which satisfy
the condition
nO/ijkZ) = n(2/ijkJl) = ... * H(g/ijkz) = ... = n(G/ijk*)
V (ijkJl)
Similarly, the end-point consisting of distributions which discrim¬
inate perfectly among segments is the set of all distributions which
satisfy the condition
_/ f 1 for one category of X„ -(g/ijk£) for 0ther categories 8f X^
V (ijki)
In order to generate random samples for the simulation it was de¬
cided to specify two population structures/distributions. .ne *irst

30
distribution provided absolutely no discrimination among groups. The
number of groups was fixed at two. The second distribution was speci¬
fied by the condition
n(l/ijia) = .8
n(2/ijk£) = .2
\/ (ijk£)
which provides reasonably good discrimination. It was not considered
necessary to vary the number of groups for reasons given later.
Given the above models, the size of the problems can be varied by
changing the number of descriptor variables or the number of categories
associated with each descriptor variable. Insofar as the models are
concerned, the method by which the problem size is altered is immaterial
since the only effect is that the cell probabilities decrease as the
number of cells in the complete multiway table increase. Therefore,
rather than consider the number of descriptor variables or the number of
categories for each variable, the problem was reformulated in terms of
varying the total number of cells. It follows from the above that vary¬
ing the number of groups would only serve to change the total number of
cells; hence the decision not to incorporate the number of groups as a
factor in the study. Thus the effect of varying the problem size was
incorporated by specifying three levels of problem size-64 cells, 32
cells, and 16 cells. Assuming that the number of groups is fixed at two
and that all descriptor variables are dichotomous, these cell sizes
correspond to problems having 5, 4, and 3 descriptor variables respec¬
tively. While an upper limit of 64 cells might appear small, it appears

unlikely that a confirmatory approach such as the one adopted in this
dissertation can be implemented with large problems since the decision¬
maker has to specify a model by positing constraints on cell probabili¬
ties. Except possibly for the initial hypothesis of no discrimination
among groups most models incorporate constraints which are essentially
derived from the intuitions and knowledge of the decision-maker. Conse¬
quently the cognitive strain of model specification increases rapidly
with increasing problem size. On the other hand, if the problem is
large and the set of constraints relatively few in number, the methodol¬
ogy is unlikely to yield estimates which differ meaningfully from those
observed in the sample.
In addition to the above, the effect of varying sample size was'
explicitly incorporated by specifying three levels of sample size--100,
500, and 1,000 respectively. The upper limit reflects what is usually
observed in practice. This factor was incorporated to examine the
effect of variability due to sampling. As the sample size increases,
the distribution observed in the sample can be expected to conform more
closely to the underlying population structure. Thus the simulation
design used was a three-way layout with eighteen cells—two population
structures (uniform and discriminant), three levels of problem size
(16, 32, and 64 cells), and three levels of sample size (100, 500, and
1,000), completely crossed with one another. The number of replications
in each of the eighteen cells was set at 100. For all cells, the esti¬
mation of cell probabilities was carried out under the model that the

32
descriptor variable set did not provide for any discrimination between
the two groups.
Specification of Dependent Measures
As mentioned earlier, an important practical consideration is the
rate of convergence. There exist several criteria which could be used
to assess this. The implementation of the methodology required three
different types of iterations (each type being nested in the type imme¬
diately following)—a one-dimensional minimization using the cubic
interpolation method to determine the optimal step length, the uncon¬
strained minimization of the penalty function itself for a predetermined
value of the penalty parameter, and iteration of the above for a se¬
quence of penalty parameter values. The third type of iteration, that
is, the number of times the penalty function was minimized (KITER) was
chosen as the measure of the rate of convergence. The choice was a
logical consequence of the program implementation. For the sake of
efficiency the maximum number of iterations allowed for the uncon¬
strained minimization of the penalty function was set equal to the
number of variables (i.e., the number of cells in the multiway table).
Therefore this number varied with the problem size and could not be used
as a measure of the rate of convergence. Since the iterations of the
optimal step-length determination were nested within the above, that
measure could not be used either.
A second measure, designed to assess the methodology (i.e., the
information-theoretic approach) rather than the algorithm used, was the

33
average absolute deviation of the cell probability estimates (ABSDEV)
from a predesignated probability distribution. The averaging was done
over the number of cell probabilities estimated. The baseline distribu¬
tion (from which absolute deviations were computed) was taken to be the
population model of no discrimination between groups, for all cells in
the simulation design. The rationale for choosing this measure is
described below. The constraints in the model do not require the algo¬
rithm to recover the population structure. However, the model con¬
straints would require that probability estimates be close to the above
baseline distribution at least to the extent the sample mimics the popu¬
lation structures used for sample generation.
In summary, two dependent measures were specified--the number of
times the penalty function was minimized (hereinafter referred to as
"KITER") and the average absolute deviation of the cell probability
estimates from the baseline distribution (hereinafter referred to as
"ABSDEV").
Simulation Results
The analysis of results obtained from simulation are reported for
the two dependent measures separately. In both cases, the data were
analyzed in an ANOVA framework. Some additional analysis was carried
out using the second measure (ABSDEV) to investigate its distribution
about the baseline distribution. The alpha level was set at .10 for all
statistical tests of significance.

34
Results for KITER (the Measure of the Rate of Convergence
Table 1 provides the ANOVA table for the dependent measure KITER.
Although the table provides results of all main effects and interac¬
tions, any explanation of the findings should begin with the highest
order interaction which is found to be significant and focus on the
simple main effects associated with that particular interaction term.
Interpretation of lower order interactions and main effects is not mean¬
ingful and provides no additional information. In the present case,
the three-way interaction is not statistically significant. However
all two-way interactions are significant. Hence the analysis is based
on the simple mai-n effects associated with these interaction terms.
Table 2 provides the cell means necessary to analyze these simple main
effects.
The general framework used for the analysis of simple main effects
is as follows. If a kth order interaction is the highest significant
effect in an n-way (n>k) layout (which implies that the nth order inter¬
action is the highest possible) then variations in cell means across
levels of one factor are analyzed for fixed levels of the remaining k-1
factors appearing in that interaction term. This is repeated for each
of the k factors. Thus the results provided in Table 2 can be inter¬
preted as follows. For every level of sample size, the discriminant
model required more iterations than the uniform model. This is as
expected since the estimation in all cases was carried out under the
model hypothesizing no discrimination between groups. The samples

35
TABLE 1
ANOVA RESULTS FOR KITER
Source of Variation Sum of Squares
Degrees of Freedom
Mean Square F
Main effects
(i) Sample size 3-21.01 2 160.51 1085.07
(ii) Model 246.42 1 246.42 1665.86
(ill) Problem size 14.06 2 7.03 47.52
(iv) Total [(iMiiMiu)] 581.49 5 116.30 786.21
Two-way interactions 0 •
(i) Sample size x Model 5.52 2 2.76 18.67
(ii) Sample size x Problem size 142.78 4 35.70 241.31
(iii) Model x Problem size 100.05 2 50.03 338.19
(iv) Total 248.35 8 31.04 209.87
Three-way interactions 0.273 4 .07 0.46*
Residual 263.60 1782 .15
*Not significant at the pre-specified alpha level of .10

36
TABLE 2
CELL MEANS FOR THE ANALYSIS OF SIMPLE MAIN EFFECTS (KITER)
Model
Sample size Uniform Discriminant
100 500
1000
8.11 9.01 7.34 8.00 7.33 7.99
(b) Problem Size
Sample size 16 32 64
100 8.11 8.52 9.05 500 8.00 7.50 7.50
1000 8.00 7.50 7.49
Problem Size
Model 16 32 64
Uniform 8.00 7.31 7.47 Discriminant 8.07 8.37 8.56

37
generated using the uniform model would, on average, be more similar to
the hypothesized model, and therefore be expected to converge more
readily. For both levels of the model KITER decreases with increasing
sample size. While the result is not unexpected for the uniform model,
the plausible explanation for the occurrence of the same in the case of
the discriminant model is that with increasing sample size, the proba¬
bility of observing cells with zero counts (given the population struc¬
ture used to generate the samples) decreases. It is likely that the
logarithmic component of the objective function affects the rate of
convergence for samples with cell probabilities in the neighborhood of
zero.
In examining the simple main effects associated with the other two
interactions certain anomalies manifest themselves. In the case of the
interaction between sample size and the problem size KITER decreases
with increasing problem size for sample sizes of 500 and 1,000 and
increases with increasing problem size when the sample size is 100.
This suggests that a sample size of 500 is adequate at least for prob¬
lems of sizes incorporated into the simulation design. This is further
substantiated by the observation that for every level of problem size
KITER decreases as the sample size is increased from 100 to 500 and
remains fairly stable thereafter. An inexplicable anomaly occurs in the
interaction of problem size and model variations. While KITER increases
with increasing problem size for the discriminant model, in the case of
the uniform model it decreases as problem size increases from 16 to 32
cells and then increases. In the absence of any other probable cause.

38
this can only be interpreted as a sampling artifact. However, for all
levels of problem size KITER is higher for the discriminant model.
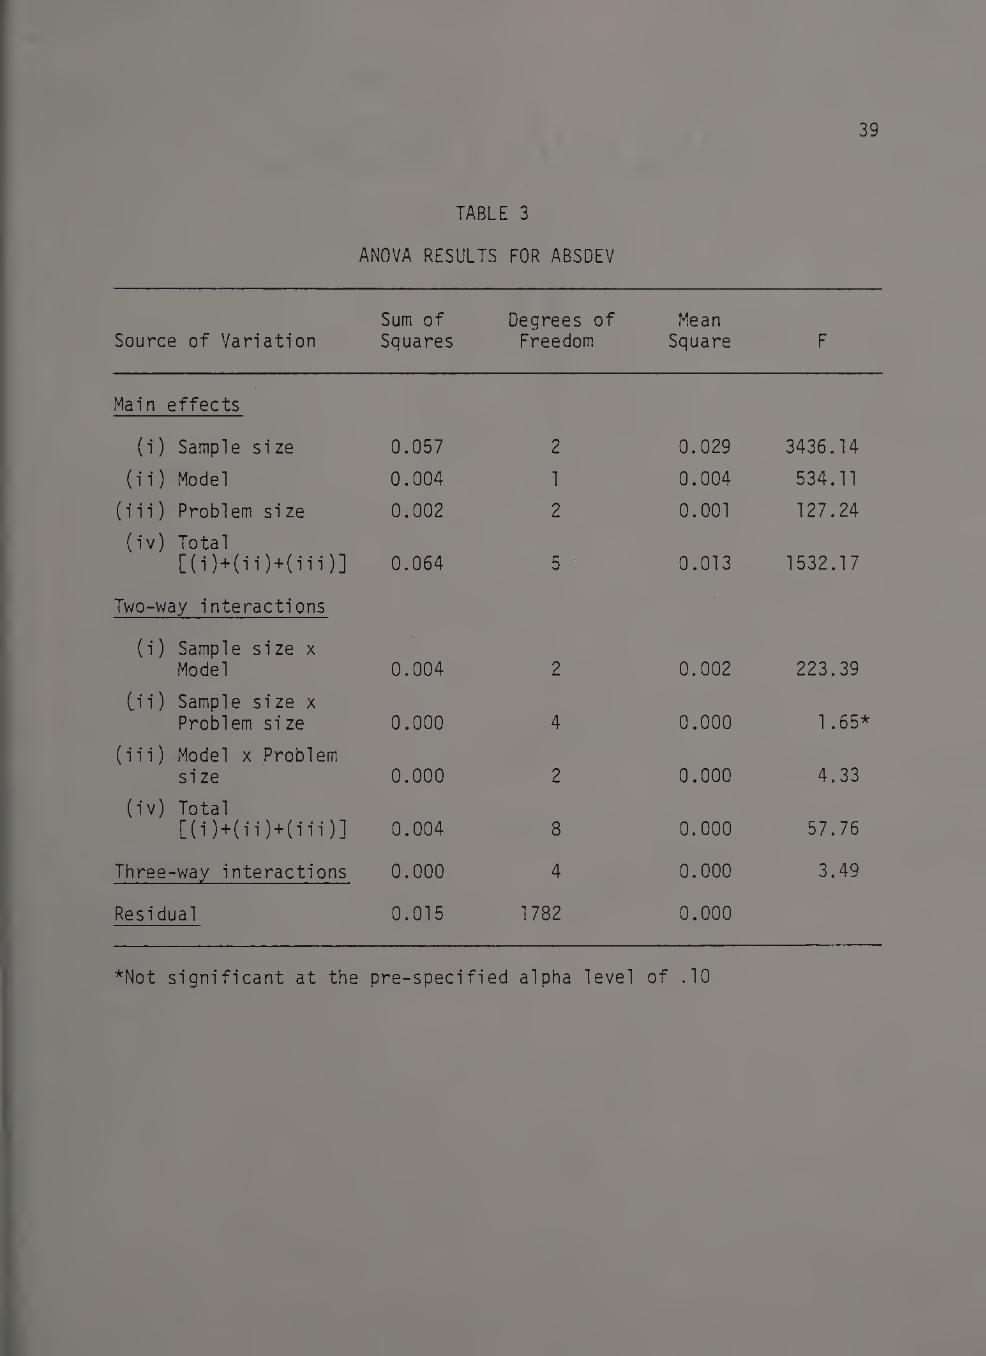
Results for ABSDEV (the Measure of Deviation from the Baseline Distribution)
Table 3 presents the ANOVA table for the dependent measure ABSDEV.
Since the three-way interaction is significant, the analysis is done for
the associated simple main effects. The appropriate cell means are
provided in Table 4.
The analysis of simple main effects yields the following general
conclusions. ABSDEV is less, on average, for the uniform model compared
to the discriminant model although the differences tend to diminish with
increasing sample size. With smaller sample sizes one can expect to
find more zero cells (i.e., cells with zero counts) in samples generated
from the discriminant population structure. In samples generated from
either population structure ABSDEV tends to decrease with increasing
sample size. Contrary to expectations, for fixed levels of sample size
and model, ABSDEV did not vary as problem size was varied in three of
the six comparisons. This may well be a sampling artifact. Another
counterintuitive observation is that for sample size of 500 ABSDEV
increases with decreasing problem size for both uniform and discriminant
models. The same phenomenon occurs to a lesser extent with sample size
of 1000.
Distribution of ABSDEV. In another attempt to assess the perfor¬
mance of the methodology, the distribution of ABSDEV in each cell of the
simulation design was studied. Within each cell the 100 replications
39
TABLE 3
ANOVA RESULTS FOR ABSDEV
Source of Variation Sum of Squares
Degrees of Freedom
Mean Square F
Main effects
(i) Sample size 0.057 2 0.029 3436.14
(ii) Model 0.004 1 0.004 534.11
(iii) Problem size 0.002 2 0.001 127.24
(iv) Total [OWIIMUO] 0.064 5 0.013 1532.17
Two-way interactions •
(i) Sample size x Model 0.004' 2 0.002 223.39
Cii) Sample size x Problem size 0.000 4 0.000 1.65*
(iii) Model x Problem size 0.000 2 0.000 4.33
(iv) Total [(i)+(ii)+(iii)] 0.004 8 0.000 57.76
Three-way interactions 0.000 4 0.000 3.49
Residual 0.015 1782 0.000
*Not significant at the pre-specified alpha level of .10

40
TABLE 4
CELL MEANS FOR THE ANALYSIS OF SIMPLE MAIN EFFECTS (ABSDEV)
(a) Problem size = 16
Sample size
100 500
1000
Model
Uniform
0.01 0.01 0.00
Discriminant
0.02 0.01 0.01
(b) Problem size = 32
Sample size
100 500
1000
Model
Uniform
0.01 0.00 0.00
Piscriminant
0.02 0.01 0.00
(c) Problem size = 64
Sample size
Model
Uniform Discriminant
100 500
1000
0.01 0.00 0.00
0.02 0.00 0.00

41
available were used to compute the standard deviation. Each value of
ABSDEV was then compared to the standard deviation corresponding to that
cell to assess the nature of the distribution. Using the standard
deviation as the unit of measurement, the frequency of occurrence of
ABSDEV in different intervals (ranges) was computed. The results are
presented in Table 5 for each of the eighteen cells.
From the correspondence that exists between each sample (replica¬
tion) and the set of cell probability estimates associated with that
sample it is clear that the distribution of the solutions would bear a
direct relation to the distribution of the samples. However, the meas¬
ure ABSDEV is an average deviation where the averaging is done over the
cell probabilities. Therefore, it is reasonable to expect the Central
Limit Theorem to hold and consequently about 68% of the values of
ABSDEV can be expected to lie within the range of one standard devia¬
tion. On average this expectation is largely fulfilled. The two most
serious aberrations in this regard are the two cells characterized by
the treatment combinations of (1) Uniform model, problem size = 64,
sample size = 100 and (2) Discriminant model, problem size = 16, sample
size = 1000. Overall, the results suggest that the variations in the
solutions obtained are a direct consequence of sampling variations. It
should be noted that the standard deviation used above was a sample-
based estimate rather than the true population value since the latter
was unknown.

42
TABLE 5
DISTRIBUTION OF ABSDEV
Model Problem
Si ze Sample
Si ze a b
Range*
c d e
Uniform 16 100 35 11 15 16 23
Uniform 16 500 31 18 20 13 18
Uniform 16 1000 30 16 17 17 20
Uniform 32 100 34 6 25 18 17
Uniform 32 100 34 6 25 18 17
Uniform 32 1000 29 18 11 22 20
Uniform 64 100 42 10 15 14 19
Uniform 64 500 30 15 13 21 21
Uniform 64 1000 32 14 16 30 18
Discriminant 16 100 28 13 16 16 27
Discriminant 16 500 33 15 16 17 19
Discriminant 16 1000 41 9 13 15 22
Discriminant 32 100 37 7 19 13 24
Discriminant 32 500 32 11 19 15 23
Discriminant 32 1000 37 9 13 16 25
Discriminant 64 100 27 22 29 0 22
Discriminant 64 500 35 12 20 20 13
Discriminant 64 1000 34 17 12 21 16
*a - greater than one standard deviation b - between 75% and 100% of standard deviation g - between 50% and 75% of standard deviation d - between 25% and 50% of standard deviation e - within 25% of standard deviation

43
Summary of Simulation Results
Two measures of performance were used--one to assess the perfor¬
mance of the algorithm (KITER) and another to assess the performance of
the methodology (ABSDEV). The analysis of simulation results shows that
on both counts the performance was satisfactory, and with few excep¬
tions, in accordance with expectations. While the ANOVAs showed signif¬
icant effects due to varying levels of different factors, the tests
should be interpreted with some caution. An important assumption in the
analysis of variance is that of variance homogeneity across treatments.
This assumption is clearly violated at least in treatments with differ¬
ing sample sizes and has implications for how the F-tests for the sta¬
tistical significance of various main and interaction effects should be
interpreted. On the other hand, the relatively large number of observa¬
tions (1800 in all) may have a countervailing effect since the F-test is
relatively robust to variance heterogeneity when sample sizes are large.
However, large sample sizes make the F-test relatively powerful with the
result that differences in means which are found to be statistically
significant may have no practical significance whatsoever. At least
with one measure (KITER) this appears to be the case especially consi¬
dering that only integer valued differences are meaningful from a prac¬
tical standpoint. Also no direct correspondence should be made between
variations (or lack thereof) in KITER and computer time required since
the number of iterations in the middle loop (i.e., the iterations to
minimize the penalty function for a fixed value of the penalty

parameter) was allowed to vary in accordance with the requirements of
the algorithm.
44
An Illustrative Example
Description of Data
The data for the illustrative example are taken from Goldstein and
Dillon (1978) and previously reported in an abridged form by Dash,
Schiffman and Berenson (1977). Data on information-seeking activities
were used to discriminate between two groups—shoppers who patronized a
full-line department store and shoppers who patronized an audio equip¬
ment specialty store. The descriptor set consisted of four dichotomous
variables related to information-seeking activities and is described
below (Goldstein and Dillon, 1978).
Variable 1: (Information Seeking)
1 if the individual sought information from friends x, = and/or neighbors before purchase
0 otherwise
Variable 2: (Information Transmitting)
1 if the individual has recently been asked for an x2 = opinion about buying any audio product
0 otherwise
Variable 3: (Prior Shopping Experience)
1 if the individual has shopped in any stores for x3 = audio equipment before making a decision
0 otherwise
Variable 4: (Catalog Experience)
1 if the individual had sought information from x. = manufacturers' catalogs before purchase
0 otherwise

45
The complete cross-classification of all respondents in the sample as
reported by Goldstein and Dillon (1978, p. 16) is given in Table 6.
Goldstein and Dillon (1978) used the data to illustrate the similari¬
ties/differences in the classification of states to one of the two
groups using different methods such as the ful1-multinomial, nearest
neighbor and first-order independence rules.
Reanalysis of the Data
The first step in the reanalysis was to test the hypothesis (H^)
that the four descriptor variables did not provide any discrimination
between the two groups. Tests of other hypotheses are meaningful only
if the above hypothesis is rejected. To test the hypothesis of no
discrimination between groups, the estimation of the population cell
probabilities was done subject to the following constraints. Letting
n(gijk£) denote the joint probability of being in the gth group and the
ith, jth, kth, and £th categories of the descriptor set X., X., X^, X^
respectively, the constraints are given by
n(nill) - n(2im) = o
n(imo) - n(2ino) = o
• • •
• • •
• • •
11(10000) - 11(20000) = 0
In general
n(lljkJt) - n(2ijkj>) = 0 V (ijkJl)

46
TABLE 6
DATA PRESENTED BY GOLDSTEIN AND DILLON (1978)
(X 1
State X2 X3
Full-1ine Department Store
Audio Equipment Specialty Store
1111
1110
110 1
110 0
10 11
10 10
10 0 1
10 0 0
0 111
0 110
0 10 1
0 10 0
0 0 11
0 0 10
0 0 0 1
0 0 0 0
5
2
15
4
3
3
3
5
14
8
26
12
2
3
32
17
86
22
23
11
3
4
4
3
33
6
30
5
8
6
8
6

47
The value of the objective function at the minimum was .2230,
which, when multiplied by twice the sample size, is distributed as a
central chi-square with degrees of freedom equal to the number of
linearly independent equality constraints in the model. This excludes
the equality constraint which requires the cell probabilities to sum to
unity. The number of relevant equality constraints in the model is 16.
The value of the chi-square random variable is approximately 183.75
(2x412x.2230) and therefore the hypothesis of no discrimination between
groups is unambiguously rejected. In the present case this finding is
hardly surprising since visual examination of the sample data would
serve to indicate such an outcome. Given the rejection of the model,
the estimates of cell probabilities are not meaningful and therefore are
not reported. Having established that the descriptor set provides dis¬
crimination between the two groups, the logical step is to determine
whether there exists some managerially meaningful structure/model under¬
lying the data. In the present case, closer examination of the sample
data reveals that not all profiles (that is, states described by the
descriptor set alone) contribute to discrimination between the two
groups. Thus from a managerial standpoint it would be useful to sepa¬
rate the profiles which discriminate well between the two groups from
those which do not. A framework which provides for such a partition of
the profiles is described below.
It is clear even from a cursory examination of the audio equipment
market that consumers exhibit varying degrees of involvement. Given the
nature of the variables in the descriptor set, the degree of involvement

48
can be characterized by the number of variables to which the individual
responds positively. For example, the profiles denoted by (1111) and
(0000) describe individuals with the highest and lowest degrees of
involvement respectively. If it is assumed that all four variables
describe the degree of involvement equally well (i.e., they are equally
weighted), then any two profiles can be ordered (by the degree of in¬
volvement) by comparing the number of ones appearing in each profile.
Thus profiles (1100) and (0101) would imply the same degree of involve¬
ment whereas (1100) implies a lesser degree of involvement compared to
(0111). In this framework the midpoint is characterized by profiles
with two zeros and two ones.
The above framework is used to develop a sequence of nested hypo¬
theses as follows. The first hypothesis (H2) in the sequence is that
only states (1111) and (0000) serve to discriminate between segments.
This implies the set of constraints
n(lijkit) - n(2ijk£) = 0
for all (ijk£) except (1111) and (0000). There are fourteen constraints
in all and the model comprising these is nested in the model described
earlier, that is, the hypothesis that no profile in the descriptor set
discriminates between segments. The minimum value of the objective
function was .757 yielding a chi-square value of approximately 62.38
with 14 degrees of freedom which leads to rejection of the hypothesis.
The next hypothesis, (_H3), nested in the previous two, is that only
states with at least three zeros (or ones) provide discrimination
between the two segments. The constraints are

49
n(lljkJi) - n(2ijk£) = o
for all (ijk£) with exactly two ones (or equivalently, exactly two
zeros). This gives a model with six constraints. The value of the
objective function at the minimum was .0102 and the chi-square value was
8.4 with 6 degrees of freedom. The critical value at the .10 level is
10.645. Therefore the hypothesis is supported. The estimates of cell
probabilities corresponding to the hypothesis are given in Table 7.
The table shows certain interesting features. All unconstrained
probabilities are close to but higher than the corresponding observed
values. The same phenomenon occurred with the cell probability esti¬
mates corresponding to the previous hypothesis (H2). The effect of sam¬
ple size on the rejection or acceptance of hypotheses is highlighted by
the fact that even though most probability estimates are close to the
observed values, the chi-square value is fairly high. However, the
utility of the estimates can best be illustrated in using them to allo¬
cate the states to one of the two groups using the following rule.
Assign state (ijk£) to n-j if n(lijk£)>n(2ijk£) and to n2 if
n(lijk£)<n(2ijk£). The assignment is to be made randomly if equality
holds. The assignments are given in Table 8. For comparison purposes
the allocation according to the full multinomial model (see Goldstein
and Dillon, 1978) is also presented.
Except for those states for which assignments are to be made at
random and the state (1101) the two rules are in agreement. The allo¬
cation using the estimated cell probabilities appears to be more conser¬
vative. With both rules an anomaly occurs with state (0010). Contrary

50
TABLE 7
ESTIMATES OF CELL PROBABILITIES UNDER HYPOTHESIS H3
State
Full-1ine Department Observed
Store (n,) Estimated
Specialty Observed
Store (n2) Estimated
1111 .0121 .0123 .2087 .2108
1110 .0048 .0049 .0534 .0539
1101 .0364 .0368 .0558 .0564
nooa .0097 .0163 .0267 .0163
ion .0073 .0074 .0073 .0074
101 oa .0073 .0085 .0097 .0085
1001a .0073 .0085 .0097 .0085
1000 .0121 .0123 .0073 .0074
0111 .0340 .0343 .0801 .0809
onoa .0194 .0170 .0146 .0170
0101a .0631 .0685 .0728 .0685
0100 .0291 .0294 .0121 .0123
001 la .0048 .0098 .0194 .0098
0010 .0073 .0074 .0146 .0147
0001 .0777 .0784 .0194 .0196
0000 .0413 .0417 .0146 .0147
aindicates states with equality constraints
The probabilities may not sum to one due to rounding error.

51
TABLE 8
ALLOCATION OF STATES TO POPULATIONS
State Allocation Allocation by full multinomial model
nn n2 n2
mo n2 n2
1101 n2 nl
noo Random n2
ion Random nl
1010 Random
1001 Random nl
1000 ni nl
0111 n2 n2
0110 Random nl
0101 Random nl
0100 ni nl
0011 Random n2
0010 n2 n2
0001 ni *1
0000 nl nl

52
to expectation, the state is assigned to population n2, and may repre¬
sent a sampling artifact.
Summary of Reanalysis
The reanalysis of the data presented by Goldstein and Dillon (1978)
illustrates the potential of the methodology for model building and
hypothesis testing. The methodology is sufficiently flexible for a
wide variety of models to be hypothesized and tested. In addition the
methodology permits the development of models which provide for conser¬
vative allocation rules in discrimination problems.

CHAPTER VI
CONCLUSIONS
This dissertation develops a model-based approach to the analysis
and evaluation of market segments. The segmentation problem was formu¬
lated as one of specifying two sets of variables--a basis set and a
descriptor set. The basis set consists of variables-which enable the
decision maker to form managerially meaningful segments. The descriptor
set serves to discriminate among segments.
From a methodological standpoint, the segmentation task was concep¬
tualized as a dual problem of clustering and discrimination. A norma¬
tive framework for discriminating among segments using descriptor sets
consisting of categorical variables was developed. The use of the
information theoretic approach made it possible to perform statistical
estimation and hypothesis testing simultaneously.
A simulation study was designed to assess the performance of the
methodology and the efficiency of the algorithm used to implement the
methodology. The results showed that the methodology performed satis¬
factorily in uncovering any underlying structure. For problems of
reasonable size, the algorithm was found to be reasonably efficient.
The methodology was applied to a particular data set to show how the
problem of discriminating among segments could be specified as a
sequence of tests of nested models/hypotheses.
While the methodology was developed in the context of discriminat¬
ing among segments, it is applicable in a wide variety of problem
53

54
settings. There are two general conditions under which the methodology
can be used. First, the variables used are categorical in nature.
Second, a model can be specified, that is, a set of relationships
posited to hold among population parameters/probabilities. The estima¬
tion of population parameters is then carried out under the null hypo¬
thesis that the model holds in the population concerned. A significant
value of the chi square test statistic would indicate lack of support
for the null hypothesis, that is, the model.
There are many other areas in marketing itself where this methodol¬
ogy could be fruitfully applied. One important application is to the
analysis of brand switching data and the inference of market structure.
Another possible extension is to latent class analysis which is present¬
ly modeled as a special case of- the general framework of log!inear
models.

SELECTED BIBLIOGRAPHY
Assael, Henry and A. Marvin Roscoe, Jr. "Approaches to Market Segmenta¬ tion Analysis." Journal of Marketing, October 1976, 67-76.
Box, M.J. "A Comparison of Several Current Optimization Methods and the Use of Transformations in Constrained Problems." The Computer Journal, 9, 1966, 67-77.
Claycamp, H.J. and W.F. Massy. "A Theory of Market Segmentation." Journal of Marketing Research, Vol. V, November 1968, 388-394.
Dash, J.F., L. Schiffman, and C. Berenson. "Information Search and Store Choice." Journal of Advertising Research, 16, 1976, 35-40.
Davidon, W.C. "Variable Metric Method of Minimization." Argonne National Laboratory Report No. ANL-5990, 1959.
Fletcher, R. and M.J.D. Powell. "A Rapidly Convergent Descent Method for Minimization." Computer Journal, Vol. 6, No. 2, 1963, 163-168.
Frank, R., William Massy, and Yoram Wind. Market Segmentation. Engle¬ wood Cliffs, New Jersey: Prentice-Hall, Inc., 1972.
Goldstein, Matthew and William R. Dillon. Discrete Discriminant Analy¬ sis. New York: John Wiley & Sons, Inc., 1978.
Green, P.E. "A New Approach to Market Segmentation." Business Hori¬ zons, 20, February 1977, 61-73.
Green, P.E., J.D. Carroll, and F.J. Carmone. "Some New Types of Frac¬ tional Factorial Designs for Marketing Experiments." In J.N. Sheth, ed.. Research in Marketing, Vol. I. Greenwich, Connecticut: JAI Press, 1977.
Green, P.E. and Yoram Wind. Multiattribute Decisions in Marketing: A Measurement Approach. Hinsdale, Illinois: Dryden Press, 1973.
Mahajan, V. and A.K. Jain. "An Approach to Normative Segmentation." Journal of Marketing Research, 15, August 1978.
Matusita, K. "On Estimation by the Minimum Distance Method." Ann. Inst. Stat. Math., 7, 67-77.
Rao, S.S. Optimization Theory and Applications, 2nd ed. New York: John Wiley and Sons, Inc., 1984.
55

56
Smith, W. "Product Differentiation and Market Segmentation as Alterna¬ tive Marketing Strategies." Journal of Marketing, 21, July 1956, 3-8.
Tollefson, J.O. and P. Lessig. "Aggregation Criteria in Normative Market Segmentation Theory." Journal of Marketing Research, 15, August 1978.
Wind, Y. "Issues and Advances in Segmentation Research." Journal of Marketing Research, 15, August 1978, 317-337.