Embed Size (px)
Citation preview

Policy Research Working Paper 5428
Conflicts and Returns to Stability in Developing Countries
A Comparative Analysis
Hippolyte Fofack
The World BankWorld Bank InstitutePoverty Reduction and Economic Management DivisionSeptember 2010
WPS5428P
ublic
Dis
clos
ure
Aut
horiz
edP
ublic
Dis
clos
ure
Aut
horiz
edP
ublic
Dis
clos
ure
Aut
horiz
edP
ublic
Dis
clos
ure
Aut
horiz
edP
ublic
Dis
clos
ure
Aut
horiz
edP
ublic
Dis
clos
ure
Aut
horiz
edP
ublic
Dis
clos
ure
Aut
horiz
edP
ublic
Dis
clos
ure
Aut
horiz
ed

Produced by the Research Support Team
Abstract
The Policy Research Working Paper Series disseminates the findings of work in progress to encourage the exchange of ideas about development issues. An objective of the series is to get the findings out quickly, even if the presentations are less than fully polished. The papers carry the names of the authors and should be cited accordingly. The findings, interpretations, and conclusions expressed in this paper are entirely those of the authors. They do not necessarily represent the views of the International Bank for Reconstruction and Development/World Bank and its affiliated organizations, or those of the Executive Directors of the World Bank or the governments they represent.
Policy Research Working Paper 5428
Sub-Saharan Africa’s dismal development outcomes—growth collapse and declining real income—are often used to highlight its sharp development contrast with other regions of the developing world. Drawing on a large cross-section analysis, this paper shows that Africa’s underlying dismal records can also be largely accounted for by the skewed distribution of growth in the post-independence era. In particular, structurally low investment rates in a context of high political risk and uncertainty undermined growth prospects in the region.
This paper—a product of the Poverty Reduction and Economic Management Division, World Bank Institute—is part of a larger effort in the department to understand the complexity of the relationship between conflict and growth in the process of economic development. Policy Research Working Papers are also posted on the Web at http://econ.worldbank.org. The author may be contacted at [email protected].
However, counterfactual simulations based on a variation of neoclassical growth models and under the hypothetical equalization of political risk profile alternative result in large economic returns, reflected in the significantly higher level of aggregate output and income in the subset of conflict-affected countries. Income gets even higher when the hypothetical reduction of political risks alternative is accompanied by sustained increases in capital accumulation.

Conflicts and Returns to Stability in Developing Countries: A Comparative Analysis
Hippolyte Fofack1 The World Bank, Washington DC, 20433
Keywords: Equalization of political risk profile, peace dividends, returns to stability. JEL Classification Numbers: C33, O11, O56, O57 1 An earlier version of this paper was presented at the Africa and Indian Ocean Conference held in Abu Dhabi (United Arab Emirates), March 14-16, 2010, organized by New York University and NYU Africa House. This paper benefited greatly from suggestions and comments by participants to the conference and colleagues. In particular, I would like to thank Shanta Devarajan, Ibrahim Elbaddawi, Kene Ezemenari, Margaret Kilo, Leonce Ndikumana, Raj Nallari, Michael Thoyer, Yaw Nyarko, Anver Versi, Xiao Ye and Simplice Zouhon Bi. I would also like to thank Nihal Bayraktar for excellent research assistance.

2
“Be always at war with your vices, at peace with your neighbors and
let each new year find you a better man.” Benjamin Franklin I. Introduction According to a Chinese proverb, “For a nation to survive and prosper, heaven must smile to it, the earth must be favorable to it and its people must be at peace.” Hence, the survival and prosperity of a nation—sustained accumulation of human and physical capital in support of continued expansion of the knowledge base, endogenous growth and welfare improvement—is based on three key pillars in the Chinese mythology. While expected returns and natural benefits under the first two pillars spelled out—heaven and earth—are initially largely subject to the vagary of nature in the pre-industrial revolution era of low technology endowment, the latter—peace—is invariably within the realm of humans. In effect, in the post-industrial revolution era, where irrigation techniques and mechanization dramatically increased agricultural yields and reduced exposures to natural and exogenous shocks, and where innovations have ensured continued productivity enhancement with increasing shifts in production possibility frontiers, the third pillar, which emphasized the positive externalities of political stability, might have emerged as one of the most critical determinants of growth. In this regard, it is not at all surprising that it has played an increasingly greater role in the process of economic development in both developed and developing countries alike in recent years. In advanced economies, the remarkable income growth and improvement of living standards achieved by European countries in the second half of the 20th century is largely attributed to decades of sustained economic growth under the European Union stability pact. That pact provided the foundation for a lasting peace between formerly rival nations in the postwar era. Similarly, the remarkable transformation achieved by the People Republic of China and most Asian emerging market economies in recent years can also be attributed to the peace and security that these countries have enjoyed over the period following their accession to independence. Although the economic success achieved by most Asian emerging market economies is often attributed to reforms initiated a couple of decades ago, these reforms and ensued impressive economic outcomes would not have been possible if these countries had not enjoyed long virtuous cycles of uninterrupted peace and stability over most of the decades following their independence.2 Likewise, that long period of political stability provided the bedrock for sustained capital accumulation. Over time, that accumulation process resulted in a significant improvement of economic and physical infrastructures largely responsible for the robust and sustained growth rates envied by the rest of the world [Nelson and Pack (1999), IMF (2010)]. In contrast to successful Asian emerging market economies, most countries in Sub-Saharan Africa (SSA) instead went through periods of recurrent political instability and conflicts over the decades following their accession to independence. An overview of the African political landscape suggests that conflicts have affected the overwhelming majority of countries in the region, either directly or 2 Disruptive socioeconomic movements such as the student protests notwithstanding, China post-civil war era starting in 1949 has been characterized by a remarkable stability, which has provided the bedrock for sustained investments in support of economic growth and poverty reduction.

3
indirectly [Collier and Gunning (1999)].3 And in some cases, political instability has been the rule, with episodes of conflicts largely exceeding the rather short spells of relative peace and security.4 The economic costs of these conflicts and recurrent episodes of political instability have been significant for the SSA region as a whole.5 In particular, growth rates have been extremely volatile and public investments have remained excessively low in the region, as resources were largely directed to finance long-duration wars or allocated to recurrent spending under fiscal austerity and adjustment following the emergence of structural disequilibrium [Akyuz and Gore (2001), Addison (2004), Bayraktar and Fofack (2007)]. Even though conflicts and political instability may not necessarily be the only cause of diverging development paths between SSA and other regions of the developing world, they certainly played a significant role, especially in light of their adverse effects in the process of growth, human and capital accumulation. Recurrent conflicts and political instability provide negative signals to risk-averse investors. Over time, they also crowd out limited resources and may prompt recourse to higher taxes to finance expected large fiscal deficits incurred as part of the war efforts. In this context, conflicts have been increasingly singled out as major constraints to growth in SSA [Bodea and Elbadawi (2008)]. In this line, several studies have been devoted to the origins and causes of conflicts in the region [DFID (2001), Collier and Hoeffler (2004)].6 This paper assesses the economic costs of conflicts in a comparative analytical framework using a variation of neoclassical growth models. Although initial versions of these models emphasized human and physical capital accumulation, there are other important variables. For instance, conflicts negatively affect investments and are also source of macroeconomic instability. In this regard, expanding these models to account for the costs of conflicts could enhance their relevance and improve understanding of Africa poverty trap. Building on a variant of these models, this paper investigates the possible role that conflicts might have played in the emergence of asymmetric development outcomes between SSA and Asian emerging market economies over the last few decades. It also explores the prospects for convergence under the hypothetical equalization of political risk profile alternative. Of particular interest are the interaction between political stability and physical capital accumulation on one hand, and invariance of exports and recurrence of conflicts on the other. Consistent with existing research, empirical results suggest that conflict has a robust and negative effect on growth. In particular, the model suggests that a one point improvement of the political stability index in the subset of SSA conflict-affected countries result in over 1.7 percent increase in the average GDP per capita. Furthermore, counterfactual simulations suggest that the economic and social benefits under the underlying hypothetical equalization of political risk profile could be
3 According to Human Security Centre (2005), Sub-Saharan Africa has become the region of the world most affected by conflict. It accounts for more conflict-related deaths than all other regions of the world combined. 4 This is particularly the case for countries such as Angola, Burundi, Central African Republic, Chad, Congo Republic, Democratic Republic of Congo, Guinea Bissau, Liberia, Mozambique, Niger, Nigeria, Rwanda, Sierra Leone, Somalia, Sudan, Togo and Uganda. 5 Bodea and Elbadawi (2008) estimate the costs of the Sudanese civil war at more than US$46 billion. 6These studies have highlighted ethnolinguistic fractionalization (Easterly and Levine (1997), greed and grievances (Collier and Hoeffler (2004)) as some of the leading causes of conflicts in the region.
4
significant across SSA, and even result in sharp reductions of income and welfare gaps with other regions of the developing world, especially, if improved security is accompanied by sustained accumulation of capital across the region. The remainder of the paper is organized as follows. The next section contrasts development outcomes between SSA and other regions of the developing world, with emphasis on conflict-affected countries. Section III proposes an empirical framework for estimating the peace dividends in these countries. The proposed model is then used to investigate the possible causes of divergence and counterfactually simulate the prospects for convergence under the hypothetical equalization of political risk profile alternative in Section IV. The last section concludes. II. Sub-Saharan Africa’s Expectation Gap and Emerging Asia Sub-Saharan Africa (SSA) exhibited significantly better economic and social indicators than Asia in the immediate post-independence era in the 1960s. Existing historical records and evidence suggest that it had higher average per capita income and better human development indicators [Maddison (1995, 2002)].7 In addition, it enjoyed favorable economic outlook, particularly in light of its impressive size of arable lands and excess natural resource endowment [Myrdal (1972)]. As a result of these favorable initial conditions, its growth and development prospects were seen as superior to those of the overpopulated Asia by many experts. This positive outlook was well captured by Gunnar Myrdal—the 1974 Nobel Laureate in Economics—in the Asian Drama [Myrdal (1972)]. Over time, the overwhelming majority of Sub-Saharan African countries failed to capitalize on these favorable initial conditions to achieve the levels of growth required for income convergence and overall improvement of welfare, however. Instead, growth rates fell far below expectations. After initial spells of output expansion, growth faltered with the first oil shock in the early 1970s. However, the 1974 oil crisis was just the first in a series of recurrent negative terms of trade shocks and balance of payments crises that will later undermine growth prospects in most countries across the region. As a result of these adverse shocks, many countries experienced extremely high growth volatility and negative economic growth in subsequent years [Easterly and Levine (1997)].8 According to Artadi and Sala-i-Martin (2003), SSA’s GDP per capita entered a long-term decline after the 1974 oil crisis, falling to negative 0.5% in the late 1970s, negative 1.2% in second half of the decade between 1980 and 1985. Later in the first half of the 1990s, growth rates dropped even more sharply, falling to negative 1.5%. In the face of this protracted recession, poverty increased dramatically in the region, rising from 48% in 1970 to more than 60% in 1995, a 25% increase. This growth reversal triggered by the first oil shock and sustained by recurrent adverse terms of trade in subsequent years had lasting effects in the region and globally. Within the region, most
7 On the basis of Maddison’s (1995) estimates of per capita GDP spanning the whole second half of the twentieth century, Africa grew significantly more rapidly than Asia up to 1973. 8 The costs of negative terms of trade shocks could be exacerbated by mismanagement and poor governance. After all, capital flight, which is believed to have undermined domestic savings and hence investment is a manifestation of corruption [Fofack and Ndikumana (2010)].

5
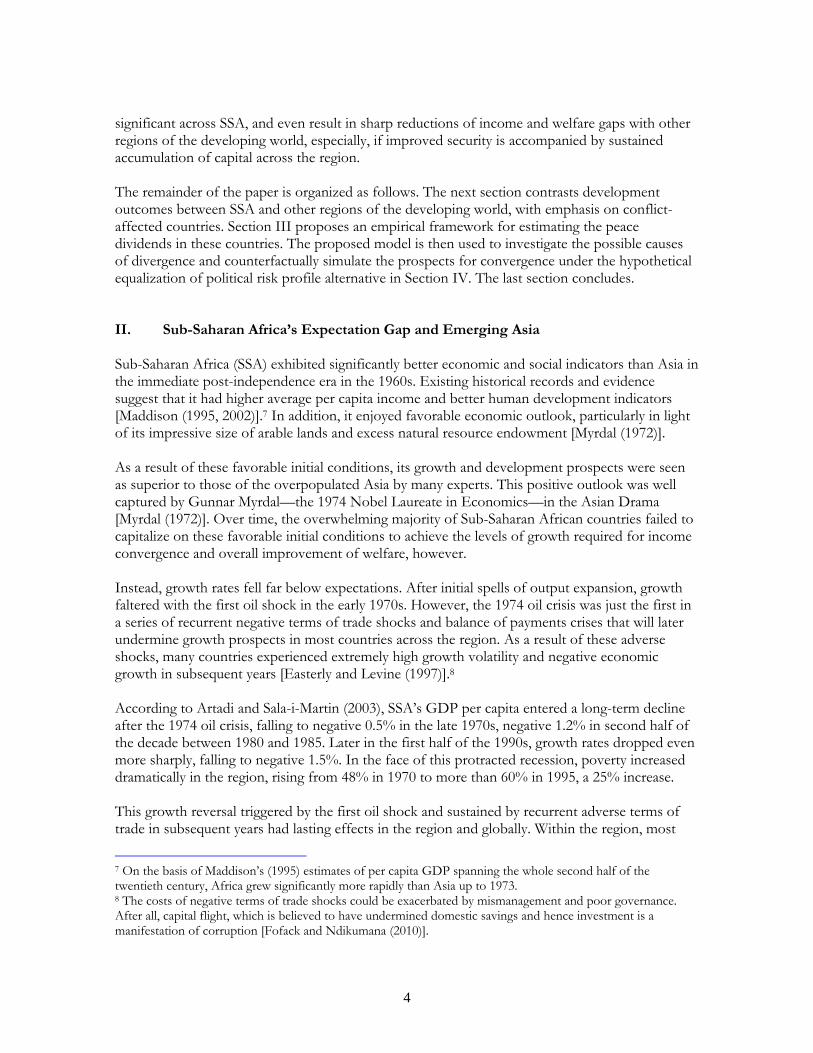
countries have been caught in poverty traps—self-reinforcing mechanisms whereby unfavorable institutions and policies adversely shape development outcomes and cause poverty to persist [Azariadis and Stachurski (2008)]. In spite of the positive growth rates experienced in the post-HIPC, poverty has remained widespread. Projections suggest that most countries will miss the first millennium development goals of halving poverty by 2015 [Berg and Qureshi (2005)]. At the global level, the remarkable growth and income acceleration achieved by other regions of the developing world, and especially the East Asia region, resulted in a significant reduction of global poverty. According to Artadi and Sala-i-Martin 2003’s estimates, world poverty counts fell from over 37% in 1970 to 16% in 2000. In East Asia, the decline has been even more spectacular, with poverty rates falling to single digits in most countries [Chen and Ravallion (2007)].9 The combined dismal growth performance and widening income gap with other regions of the developing world over the past decades further marginalized SSA within the global economy. This contrast has led a number of scholars to characterize Africa’s growth performance as “the economic tragedy of the 20th century” [Artadi and Sala-i-Martin (2003)]. At the same time, others have characterized the post-independence years as “the lost decades” in reference to the huge expectation gap exhibited by the region [Easterly and Levine (1997), Anyang’ Nyongo (1992)]. Still expectation gaps have been even more pronounced in SSA’s conflict-affected countries, where growth rates averaged negative 3.7% in the first half of the 1990s, significantly below the average across the whole region. The poor economic performance of these countries may be largely explained by their significantly lower investment rates and higher incidence of macroeconomic instability, owing in part to political instability-induced risks and uncertainty, and the diversion of limited resources towards unproductive and low-returns investments. In fact, using stochastic AK technology models, it has been shown that conflict reduces the level of economic efficiency, even for a given stock of capital [Bodea and Elbadawi (2008)]. Indeed, SSA’s conflict-affected countries experienced a significantly higher frequency of hyper-inflation and recurrent balance of payments crises, which partly explain their relatively larger stock of external liabilities [Beaugrand et al. (2003), Bodea and Elbadawi (2008)].10 However, nowhere in the continent have expectation gaps on the development path been more obvious than in the Democratic Republic of Congo (DRC), one of the wealthiest countries in the world, which over the past decades has been mired in recurrent conflicts and political instability.11 According to recent estimates, the DRC has mineral reserves in excess of US$24 trillion—equivalent to the combined GDP of Europe and the US [African Business (2009)]. Yet it is listed as one of the poorest countries in the world on the UN Human Development index [UNDP (2009)]. Interestingly, its poor ranking on this composite index is also consistent with other quantitative indicators of welfare. Since 1974, its income has fallen by more than 70% in real terms (see Panel A in figure 1).
9 However, the largest reduction in poverty has been registered in China, where the incidence of poverty has fallen below 9 percent, from over 50 percent in 1980 [Stiglitz (2006)]. 10 The average stock of external debt exceeded 150 percent of GDP in the pre-HIPC era (Figure A1 in Annex). 11 A peer-reviewed study put the DRC war’s death toll at 5.4 million as of April 2007 and rising at 45,000 a month. That would leave the total today after a dozen years, at 6.9 million [Kristof (2010)].

6
Figure 1: Per Capita Gross Domestic Product (in constant 2000 US$)
0
50
100
150
200
250
300
350
400
1960
1962
1964
1966
1968
1970
1972
1974
1976
1978
1980
1982
1984
1986
1988
1990
1992
1994
1996
1998
2000
2002
2004
2006
2008
Panel A: Democratic Republic of Congo
0
5000
10000
15000
20000
25000
30000
35000
1960
1962
1964
1966
1968
1970
1972
1974
1976
1978
1980
1982
1984
1986
1988
1990
1992
1994
1996
1998
2000
2002
2004
2006
2008
Panel B: Belgium and Singapore
Belgium Singapore
7
Contrasting SSA growth tragedy, Asian emerging market economies which experienced robust and sustained growth in the post-independence saw their income grow unabated [World Bank (2005)]. For illustration, Panel B of Figure 1 provides the distribution of income over the same reference period for Singapore and Belgium. Unlike the DRC, Singapore achieved impressive growth and income convergence with advanced economies, building on political stability, technological catch-up and economic diversification [Nelson and Pack (1999)]. Across Asia, the remarkable success achieved by Singapore is not an isolated case, however. The emergence of Asia has been illustrated by increasing reference to the shift of power from the West to the East in recent years [Fergusson (2009)]. In practice, this emergence has been made obvious by a number of quantitative indicators, including the strong net foreign asset positions via current account surpluses, and impressive scale of foreign reserves [Summers (2006), Yongding (2009)]. Also indicative is the extent and distributive nature of growth across the whole Asia region, and very short and limited episodes of crises [World Bank (1993, 2005)].12 As a result of that strong economic performance, Asia has accounted for an increasingly large share of the global trade (Panel A of Figure A2). Panel A depicts the contribution to global trade, contrasting SSA and China. While China’s contribution to global trade has grown almost exponentially over the last three decades—to the point where China now accounts for over 10 percent of global trade—the contribution of SSA has declined significantly over the same period. China’s share of global trade is more than six times that of SSA, though the latter accounted for a significantly larger share of the global trade up till the late 1980s. The contrast with SSA conflict-affected countries is even more impressive. In spite of their extremely large endowment in natural resources and increasing demands of these resources during the globalization era, the contribution of these countries to world trade has declined even more dramatically. However, SSA’s declining contribution to global trade does not necessarily reflect its decreasing volume of exports. Instead, it is the consequences of the changing globalization landscape increasingly dominated by manufactured goods. Since the 1980s, the manufacture content of developing countries exports has increased dramatically, rising from 25% in 1980 to more than 80% in the late 1990s [World Bank (2002)]. Hence, under this new globalization landscape, the combined net barter terms of trade effects of primary products and deficit of economic diversification may largely explain the widening income gap between Asia and SSA.13 The emergence of Asia is not a mere reflection of its superior economic performance over SSA, however. The impressive growth rates and inherent sizable share of global trade achieved by Asian economies have changed the global economic landscape inherited from the postwar. According to IMF estimates, China and India made the largest country-level contributions to world growth in PPP terms in 2007. Their combined contribution exceeded 40%, with China alone accounting for over 30%, significantly above the US share (Panel B of Figure A2) [IMF (2007)].14
12 Over the last three decades, China has been the fastest-growing economy of the world [Yonding (2009)]. 13 In the absence of economic diversification, SSA’s exposure to negative terms of trade shocks has been a constant problem. The IMF estimates that a number of SSA countries experienced terms of trade losses of more than 5 percent of GDP during the 2008 global economic and financial crisis [IMF (2009)]. 14 The ascendancy of Asia might have become even stronger after the crisis, which disproportionately affected other regions of the world [IMF (2010)].

8
Several attributes have been used to characterize Asia’s impressive economic performance, including the reference to Asian Tigers and Miracle [World Bank (1993), Kim (1998)]. The reference to miracle reflects the extraordinary long virtuous cycle of economic growth and aggregate output expansion fueled by strong investment rates under a well-crafted export-led growth model. For decades, these countries have consistently enjoyed some of the higher rates of gross capital formation, over twice the average across SSA (see Table A1 in the Annex). At the same time the much lower rate of investments in SSA’s conflict-affected countries suggests that recurrent political instability might have exacerbated the growth collapse in the region, with the negative spillover effects of political instability magnifying perceived risks in neighboring countries. Invariably, the majority of SSA countries consistently operated far below their potential, experiencing significantly lower growth rates than their Asian counterparts. Nevertheless, the potentially adverse effects of recurrent political instability remain far greater in conflict-affected countries, which experienced significantly lower rates of capital formation. Ceteris paribus, there is no reason a priori to justify the much lower rate of capital accumulation for these countries, but the adverse effects of conflicts either directly or indirectly through the interaction between conflict and investments. Under budgetary constraints, the diversion of resources to fund long-duration wars is often achieved at the expenses of public capital accumulation and may indirectly affect private capital formation by undermining the complementarity between public and private investments [Lorentzen et al. (2006)]. The next sections discuss the extent to which political instability and conflicts might have contributed to divergent development outcomes between SSA and other regions of the developing world. III. Analytical Framework This paper contrasts economic growth and development outcomes in politically-stable Asian emerging market economies (EME) against the alternative costs of recurrent conflicts in Sub-Saharan Africa. The paper assumes that the returns to stability are essentially measured by economic growth reflected in sustained increases in per capita income.15 Hence, the analytical framework builds on neoclassical growth models. In their standard representation, these models estimate aggregate output as a function of factor inputs and total factor productivity (TFP) as follows:
),,( ZLKfAY (1) In this representation, Y is the level of output, K is the stock of physical capital, L is the labor force, and Z is a vector of all other factors driving the growth process [Solow (1957)]. The variable A measures factor productivity, which is assumed to grow at a constant exogenous rate because it is largely driven by technology and innovation. For all practical purposes, TFP is assumed uniform within any set of country groupings and variable across groups.
15 However, they could also be measured by a set of inclusive institutions underpinning the transformation of countries on a development path. In practice, such a transformation will require a sustained accumulation of human and physical capital that will ultimately lead to increased life expectancy, reduction of poverty rates and improvement of other social indicators more subject to short-term changes, as a result of income growth.

9
While the initial version of these growth models emphasizes factor inputs, in recent years TFP has been assigned increasingly large weights in both developed and developing countries alike [World Bank (2005)].16 In effect, the contribution of TFP to growth has increased significantly in Asian EME, which has drawn on technological catch-up to achieve income convergence [Nelson and Pack (1999)]. According to World Bank estimates, productivity growth has accounted for over one-third of income growth in these economies in recent years [World Bank (1993)]. In this regard, differences in TFP may also be viewed as a key factor explaining the divergent development outcomes between Asian EME and SSA countries. Its contribution to growth has remained abysmally low in the latter, owing in part to the deficit of economic diversification, but also to conflicts and long-duration wars [Njikam et al. (2006)]. In fact, the TFP contribution to growth is even lower in SSA’s conflict-affected countries where negative values have abounded [Tahari et al. (2004)].17 This contrast between conflict-affected countries and the more politically-stable nations furthers supports inferences from stochastic AK models for which a high probability of war onset undermines economic efficiency. Consistent with economic theory, the signs of all partial derivatives of Y with respect to the argument in )(f as well as A are assumed to be positive. Hence, expressing equation (1) in growth terms, we obtain the following:
A
dA
Z
dZ
y
Z
Z
yA
L
dL
y
L
L
yA
y
dK
K
yA
y
dy
(2)
However, for estimation purpose, equation (2) can be rewritten in a regression format as follows:
13
12
110
1
Z
Z
L
L
y
dK
y
y (3)
withA
dA0 ,
K
yA
1 ,y
L
L
yA
2 , y
Z
Z
yA
3 .
Under this latter specification, the constant term 0 captures the growth in productivity. However, to the extent that productivity is largely driven by technology and innovation, it is assumed that this factor grows proportionally with the level of investments in R&D, and is inversely proportional to political risks. In this regard, it is expected to be higher in Asian EME, which have drawn on technology absorption and assimilation to expand their stock of manufactures and high-tech exports over the past decades [World Bank (2002, 2005)]. Likewise the coefficient 1 , which is a partial elasticity measuring the productivity of investment is assumed to grow proportionally with technology acquisition and capital accumulation. Investment uncertainty created either by conflicts or political instability should adversely affect the rate of
16 Empirical results on technology-led productivity growth suggest that technological change explained more than half of output growth in the first half of the first half of the 20th century in the United States [Solow (1957)]. 17 According to Tahari et al. (2004) the contribution of TFP to growth is negative (-0.8) in SSA conflict-affected countries between 1960 and 2002, significantly below the average across the whole region.
10
capital accumulation and overall productivity of capital. Hence, the marginal productivity of capital is also expected to be much higher in Asian EME, and even higher when the productivity benchmark is based on SSA’s conflict-affected countries. Although the returns to stability can be equally assessed from the productivity angle, it might be interesting to assess how aggregate output and welfare are affected by other determinants of growth when conflict is controlled for. This conditional assessment can be achieved by expanding the vector Z to include other relevant variables. In the initial version of neoclassical growth models, Z is primarily proxied by either exports or imports of goods and services [Balassa (1978), Khan and Reinhart (1990)].18 However, the deficit of institutions and recurrent conflicts has also been singled out as important constraints to growth in developing countries in recent years [Acemoglu et al. (2001), Rodrik et al. (2004)]. Acemoglu et al. (2001) have attributed the relative economic success of Botswana (also known as exception to natural resources curse) to the strength and resilience of its traditional institutions. Conversely, the abysmal development outcomes in most other countries in the region (including other resource-rich countries), have been attributed to the deficit of institutions and poor governance [Mauro (1995), Fofack (2010)]. At the same time, recent empirical studies have singled out the prohibitively high cost of conflicts as a major constraint to economic development in the region [Collier and Hoeffler (2004), Bodea and Elbadawi (2008)]. In addition to direct adverse effects—destruction of physical and human capita and distortions in the allocation of resources—conflicts may affect growth indirectly through the export and investment channels. In particular, they may affect the distribution of exports in low-income countries in a nonlinear way. For instance, while the proceeds from natural resource exports may rise and even fuel long-duration wars, most other sectors of production, including labor-intensive and primary commodity exports, tend to suffer from wars. The collapse of commodity production and exports in Burundi, and particularly coffee—the main source of foreign reserves—during the 1980s civil war provides a good example of the potentially adverse effects of conflict on output growth [Kimonyo and Ntiranyibagira (2007), IMF (2009)].19 However, falling volume of commodity production and output contraction should be contrasted with the resilience of largely capital-intensive natural resource exports, which have also come to be known as ‘conflict commodities’. ‘Conflict commodities’ include gem stones, blood diamonds, timber and drugs [Addison (2004)]. This label refers to the fact that these particular commodities have been used to finance wars across Sub-Saharan Africa. Over time, the stable flows of income from the exports of these commodities became the strong motives for perpetuating conflicts [Collier (2003), Malone and Nitzschke (2004)].
18 The focus on trade in earlier versions of these models is emphasized by the proponents of export-led growth theory [Balassa (1978)]. According to this theory, trade is largely responsible for infrastructure development and transfer of technology. 19 Coffee production, the main source of foreign reserves in Burundi, sharply dropped during the war, from over 40,000 metric tons in 1994 to 16,000 tons (about 60% decline) in 1999 [Kimonyo and Ntiranyibagira (2007)].

11
Indeed, it is believed that conflicts which have resulted in millions of victims in numerous countries in SSA, including Angola, the DRC and Sierra Leone, have to a large extent been financed by proceeds from ‘conflict commodities’, suggesting that resource extraction is not necessarily inversely related to conflict intensity [Addison (2004)]. Nonetheless, the resilience of natural resource exports in a context of conflicts has not necessarily led to higher growth and improved development outcomes in these countries.20 In effect while exports are generally thought to be growth-enhancing, the interaction between conflicts and exports and the potential welfare benefits of exports depends on the nature of
exports. In order to capture this ambiguous relationship, the vector Z
is expanded to account for possible direct and indirect effects of conflicts on growth. In addition to the interaction between conflict and exports, the potentially adverse effects of conflicts on investments are also considered in the expanded model. The new vector is therefore represented in a matrix form as follows:
Z= =
Under this representation, XCV
captures the interaction between conflict and exports, and
ICW
accounts for the interaction between conflict and capital accumulation. Conflict variables are derived from the International Country Risk Guide (ICRG), a composite index of economic, financial and political risks. Following this expansion, inference on the comparative analysis of peace dividends is based on a modified version of equation (3) represented by equations (4) and (5) below. While the former focuses on interaction between conflict and exports of goods and services, the latter focuses on interaction between conflict and capital formation.
15
14
13
12
110
1
V
V
X
X
C
C
L
L
y
dK
y
y (4)
15
14
13
12
110
1
W
W
X
X
C
C
L
L
y
dK
y
y (5)
IV. Estimation and Empirical Results Equations (4) and (5) are estimated for a panel of 25 countries. These countries are grouped into three subsets: SSA conflict-affected countries (13), SSA countries enjoying relative peace and
20 This paradox of widespread poverty in the midst of plenty (also known as the natural resource curse) is often explained by a number of models, including rent-seeking, terms of trade shocks and Dutch Disease [Isham et al. (2005), Fofack (2010)]. According to rent-seeking models, point-source non-renewable resources like minerals and oil are highly capital-intensive, and tend to yield lower economic growth rates and worse development outcomes than countries with fewer natural resources [Sachs and Warner (1995)].

12
stability (8) and Asian EME (4). The restriction of the sample to 25 is dictated by the availability of the data. In particular, the challenges of securing data on conflict that is consistent across countries impeded the sample expansion.21 The dataset covers the period 1985-2007. Identifying the appropriate models for estimating the adverse effects of conflicts on output, either directly or indirectly via the capital accumulation and export channels is the main objective in the first part of this section. In this regard, several different empirical models are considered and optimal models are selected through a stepwise procedure. These optimal models (in terms of significance of the regression coefficients and overall goodness-of-fit) are shown in Tables A2 and A3 in the Annex. These tables provide estimates of regression coefficients immediately followed by their corresponding t-statistics in parentheses. The main difference between the two tables lies in the choice of regressors. While the predicted aggregate output from equation (4) is based on a model, which focuses on interaction terms between conflict and exports of goods and services, the model based on equation (5) focuses on the interaction term between conflict and capital formation. Note that in each case, the model considers internal conflict, external conflict and a variable that combines both internal and external conflict. Similarly, the results appear in the form of nine columns in each table, reflecting the fact that three different empirical models are retained for each subset of countries (SSA conflict-affected countries, SSA enjoying relative peace and Asian EME) following successive iterations. This sequential approach is chosen to mitigate the risk of multicollinearity in the set of regressors, particularly between the conflict index variables, especially given the nature and range of these regressors.22 Although the two empirical models capture a sizable share of proportional variance in the data, a comparison of results suggests that the model, which has conflict and capital accumulation as interaction term (model specified by equation (5)) exhibits a better goodness-of-fit. The goodness-of-fit of that model is most notably reflected in the relatively large size of the adjusted R-Square across the three groups. In effect, the consistently large value of the coefficient of determination suggests that a significant proportion of variability in the data is accounted for by that model. Even the sub-panel of Sub-Saharan African conflict-affected countries for which the model appears to capture a much lower proportional variability in the data consistently has a coefficient of determination in excess of 90 percent. In particular, when political instability is the fact of external conflicts, more than 95 percent of variability in the data is accounted for by the model (column 1). However, the variability captured by the underlying model is slightly lower (about 90 percent) when the stability index combines external and internal conflict as a weighted average. At the same time, the coefficient of determination is even larger when the model is applied to the panels of Asian emerging market economies and Sub-Saharan African countries not affected by
21 In particular, conflict index variables (external and domestic conflict) derived from ICRG do not have information on African Indian Ocean countries. However, ICRG has consistent time series data on conflict for Asian emerging market economies, which are used as benchmarks in the comparative analysis. 22 Although multicollinearity may not necessarily reduce the predictive power of the model as a whole, it can affect the calculation and estimation of individual predictors and hence the respective coefficient.

13
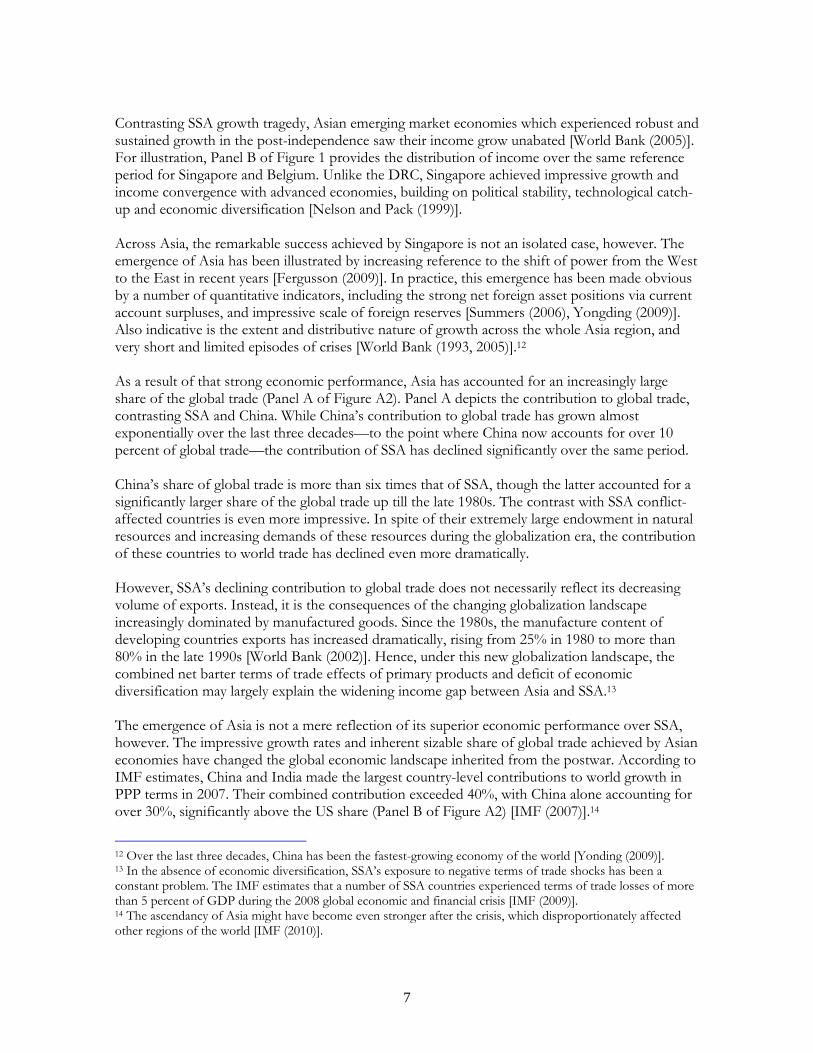
conflicts. For countries in these two subpanels, the adjusted R-square is consistently greater than 98 percent across the three empirical models. In other words, more than 98 percent of the proportional variability observed in the data is accounted for by the underlying models. The larger coefficient of determination in the Asian sub-sample suggests an even better prediction of aggregate output by the underlying models. The better prediction of these models is further illustrated by Figure 2 below. This figure has three panels referring to the three subgroups of countries. Each panel compares actual per capita GDP with its predicted values derived from the models over the reference period. While the predicted and actual per capita income consistently overlap over the support of the distribution for Asian emerging market economies (panel C), there appears to be deviations of predicted from actual per capita GDP for the SSA sub-panels (Panels A and B). Nonetheless, even for these two sub-groups, the predicted values remain consistent with actual GDP. Notwithstanding the overall goodness-of-fit of these models, the contribution of individual regressors to changes in aggregate output varies considerably across panels. For the sub-panel of conflict-affected countries, external and internal conflicts adversely affect aggregate output both directly and indirectly. As shown in the first model (column 1 & row 4, column 2 & row 5), these variables have the largest coefficient across the three models and are significantly different from zero at the 1% level for the first two models. Interestingly, the combined conflict index is also significant, albeit at the 10 percent level (column 3 & row 6). At the same time, the coefficient associated with the interaction term (external conflict and capital formation) is also significantly different from zero. The significance of this term is even stronger when the conflict index is either internal or combines both internal and external conflict. Under both alternatives, the interaction term is significantly different from zero at the 5 and 1 percent level, respectively. Moreover, the signs of the coefficient are consistently negative, suggesting that the adverse effects of conflict on growth through the capital accumulation channels may be stronger in countries facing internal conflicts. However, this could also be a mere reflection of a disproportionately high incidence of internal conflicts within the region [HSC (2005)]. The significance of these regressors and their potential adverse effects for growth in conflict-affected countries further support the findings of earlier studies [Messer et al. (1998), Gyimah-Brempong and Traynor (1999), Bodea and Elbadawi (2008)]. A study undertaken by IFPRI estimates the economic costs of conflict and political instability to be extremely high across war-torn countries in the region, especially in the agricultural sector where production fell by more than 3% per annum on average.23 Also interesting however, is the lack of statistical significance of conflict-related regressors in the set of countries which enjoy relative peace and stability within the region, but also in the sub-panel of Asian EME.
23 For instance, according to Messer et al. (1998), Angola suffered production losses of up to 45% in the agricultural sector as a result of the protracted civil war, which significantly undermined the supply of agricultural products. Production and prospects for expansion of the production base are still constrained by land mines in that country. However, the costs of conflicts have also been relatively high in other regions of the developing world. According to Ra and Singh (2005), a 4.2% decline in development expenditure during the civil war in Nepal resulted in a total GDP loss of more than 8.3% for the period 2005-2009, corresponding to an average loss of more than 1.7% growth per annum.

14
Figure 2: Assessing the goodness-of-fit of the empirical model
0
100
200
300
400
500
1985
1986
1987
1988
1989
1990
1991
1992
1993
1994
1995
1996
1997
1998
1999
2000
2001
2002
2003
2004
2005
2006
2007
Panel A: SSA Conflict countries
Actual GDPPC Estimated GDPPC
0
200
400
600
800
1000
1985
1986
1987
1988
1989
1990
1991
1992
1993
1994
1995
1996
1997
1998
1999
2000
2001
2002
2003
2004
2005
2006
2007
Panel B: SSA Non-conflict countries
Actual GDPPC Estimated GDPPC
4000
6000
8000
10000
12000
14000
1985
1986
1987
1988
1989
1990
1991
1992
1993
1994
1995
1996
1997
1998
1999
2000
2001
2002
2003
2004
2005
2006
2007
Panel C: Asian emerging market economies
Actual GDPPC
Estimated GDPPC
15
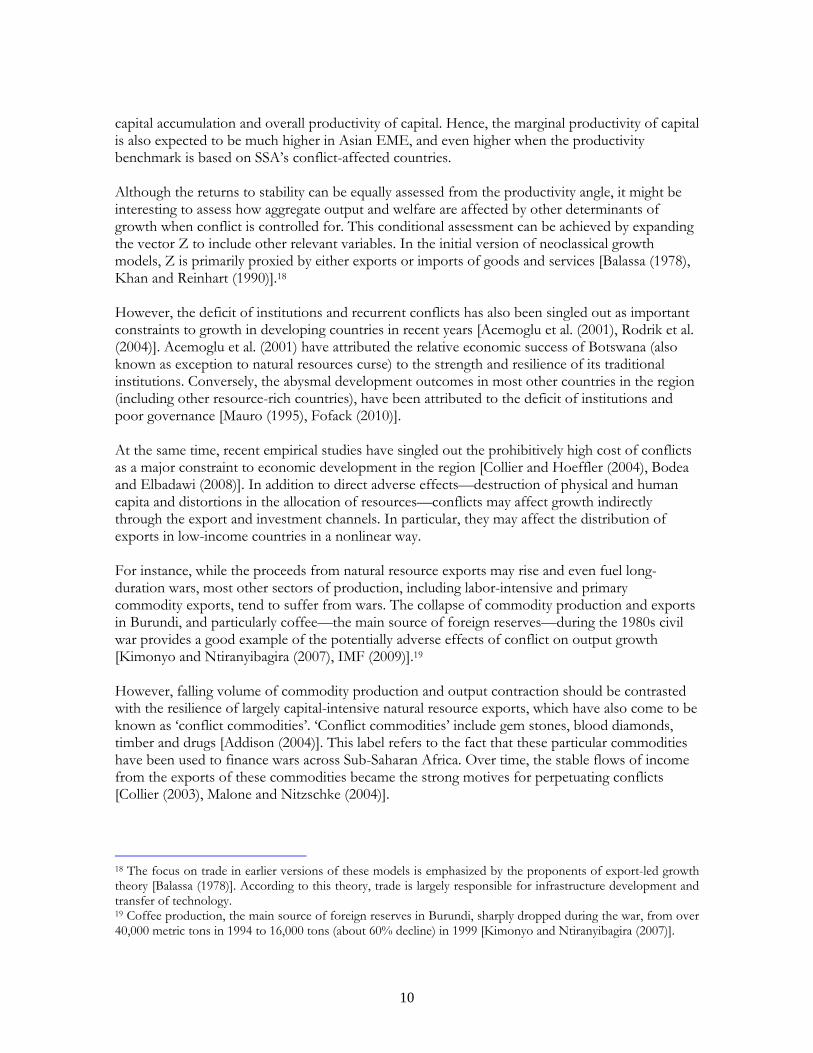
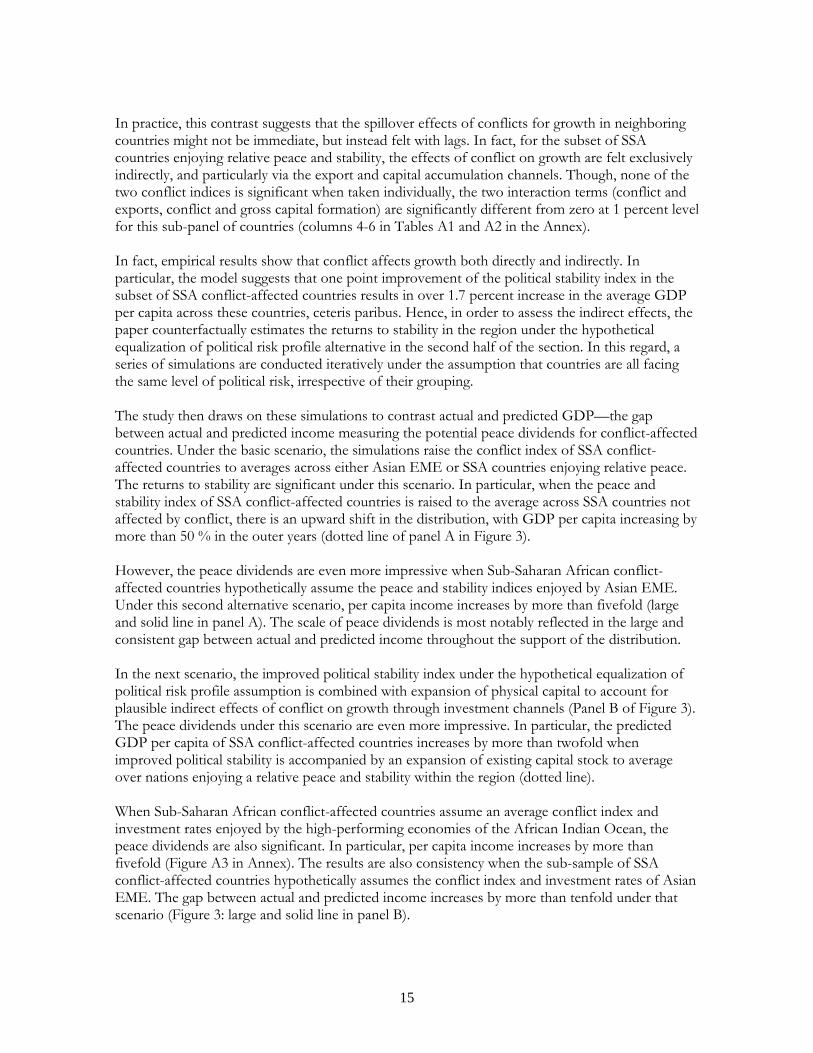
In practice, this contrast suggests that the spillover effects of conflicts for growth in neighboring countries might not be immediate, but instead felt with lags. In fact, for the subset of SSA countries enjoying relative peace and stability, the effects of conflict on growth are felt exclusively indirectly, and particularly via the export and capital accumulation channels. Though, none of the two conflict indices is significant when taken individually, the two interaction terms (conflict and exports, conflict and gross capital formation) are significantly different from zero at 1 percent level for this sub-panel of countries (columns 4-6 in Tables A1 and A2 in the Annex). In fact, empirical results show that conflict affects growth both directly and indirectly. In particular, the model suggests that one point improvement of the political stability index in the subset of SSA conflict-affected countries results in over 1.7 percent increase in the average GDP per capita across these countries, ceteris paribus. Hence, in order to assess the indirect effects, the paper counterfactually estimates the returns to stability in the region under the hypothetical equalization of political risk profile alternative in the second half of the section. In this regard, a series of simulations are conducted iteratively under the assumption that countries are all facing the same level of political risk, irrespective of their grouping. The study then draws on these simulations to contrast actual and predicted GDP—the gap between actual and predicted income measuring the potential peace dividends for conflict-affected countries. Under the basic scenario, the simulations raise the conflict index of SSA conflict-affected countries to averages across either Asian EME or SSA countries enjoying relative peace. The returns to stability are significant under this scenario. In particular, when the peace and stability index of SSA conflict-affected countries is raised to the average across SSA countries not affected by conflict, there is an upward shift in the distribution, with GDP per capita increasing by more than 50 % in the outer years (dotted line of panel A in Figure 3). However, the peace dividends are even more impressive when Sub-Saharan African conflict-affected countries hypothetically assume the peace and stability indices enjoyed by Asian EME. Under this second alternative scenario, per capita income increases by more than fivefold (large and solid line in panel A). The scale of peace dividends is most notably reflected in the large and consistent gap between actual and predicted income throughout the support of the distribution. In the next scenario, the improved political stability index under the hypothetical equalization of political risk profile assumption is combined with expansion of physical capital to account for plausible indirect effects of conflict on growth through investment channels (Panel B of Figure 3). The peace dividends under this scenario are even more impressive. In particular, the predicted GDP per capita of SSA conflict-affected countries increases by more than twofold when improved political stability is accompanied by an expansion of existing capital stock to average over nations enjoying a relative peace and stability within the region (dotted line). When Sub-Saharan African conflict-affected countries assume an average conflict index and investment rates enjoyed by the high-performing economies of the African Indian Ocean, the peace dividends are also significant. In particular, per capita income increases by more than fivefold (Figure A3 in Annex). The results are also consistency when the sub-sample of SSA conflict-affected countries hypothetically assumes the conflict index and investment rates of Asian EME. The gap between actual and predicted income increases by more than tenfold under that scenario (Figure 3: large and solid line in panel B).

16
Figure 3: Simulated GDP per capita of SSA conflict-affected countries under the equalization of political risk profile alternative
0
500
1000
1500
2000
2500
1985
1986
1987
1988
1989
1990
1991
1992
1993
1994
1995
1996
1997
1998
1999
2000
2001
2002
2003
2004
2005
2006
2007
Panel A: Conflict index and coefficients of politically stable nations
Actual GDP per capita
Simulated GDPPC with Non-conflict Peace Dividend and Non-conflict Estimated Coefficient of this Variable
Simulated GDPPC with Asia Peace Dividend and Asia Estimated Coefficient of this Variable
0
500
1000
1500
2000
2500
3000
3500
4000
4500
5000
1985
1986
1987
1988
1989
1990
1991
1992
1993
1994
1995
1996
1997
1998
1999
2000
2001
2002
2003
2004
2005
2006
2007
Panel B: Conflict index and investments of politically stable nations
Actual GDP per capita
Simulated GDPPC with Non-conflict Peace Dividend, Investment and Non-conflict Estimated Coefficients of these Variables

17
Although the above simulations did not specifically explore the potential peace dividends under the alternative counterfactual option of a concomitant increased volume of export of goods and services, one can plausibly infer that the predicted distributions under such a scenario will almost surely follow a trend similar to the one driven by hypothetical expansion of physical capital assumption. In fact, the coefficient associated with the interaction term (conflict and exports) is robust and consistently significant at the 1 percent level, irrespective of the nature of conflicts (Table A3 in the Annex). Likewise Table A3 in the Annex provides estimates of regression coefficients along with t-statistics. Consistently, these estimates suggest that conflict may affect growth and overall aggregate output in Sub-Saharan Africa both directly and indirectly via export channels. However, the rise in exports of goods and services often reflects both price and volume effects. And to the extent that exports volume directly relates to investments and gross capital formation, the trend should be consistent, with differences exclusively limited to the levels of predicted output. Moreover, since the indirect effects of conflict tend to follow a nonlinear path when exports of goods and services are the indirect channels—conflicts could reduce the volume of commodity exports without necessarily affecting trade prospects in the highly capital intensive ‘conflict commodities’—the potential peace dividends under this alternative scenario will then be determined by the net effects. This is particularly the case because ‘conflict commodities’ tend to be detrimental to capital formation—misallocation of resources and destruction of capital stock [Addison (2004)]. In addition, the potential indirect effects of conflict via the export channels are influenced by the production structures and extent of economic diversification. Hence, for a country with diversified sources of growth and exports, the peace dividends could be significant, especially as improved peace and security is often accompanied by a surge in aggregate output in the aftermath—peace dividends. However, most SSA countries remain commodity-dependent and in some cases, ‘conflict commodities’-dependent. In this regard, the net welfare effects will be determined by countries’ comparative advantage. For instance, countries specialized in the production of globally non-competing goods (coffee and cocoa) not exposed to rich-country protectionism could benefit, provided that the going terms of trade are structurally favorable. Conversely, countries depending on globally competing goods such as cotton could still suffer even in a context of improved security, as they face stiff competition from European and US farmers who have been granted large subsidies year after year over the past decades [Addison (2004)].24 Under these conditions, diversification becomes essential to long-run growth and sustainable economic development in post-conflict countries.
24 It is estimated that US and EU cotton producers and farmers received more than US$4 billion in the peak production year of 2001-2002. It is estimated that these subsidies depressed the world price of cotton by more than 12.6% during that year [Alden (2004)]. Although significant, these subsidies represent only one aspect of government support to cotton producers in advanced economies. An equally important factor of contributing to trade advantage is the technological edge and research which also benefit from government support and may indirectly boost production and productivity in these countries.

18
V. Conclusion and Policy Recommendations This year, many African countries will be celebrating their 50 years of independence. For most of these years, the overwhelming majority of countries have been mired in recurrent conflicts and political instability, however. Across the region, these conflicts have adversely affected growth prospects and greatly undermined development outcomes and expectations, which were on the bright side in the immediate post-independence. This paper draws on a comparative analysis to contrast development outcomes between Asian EME and Sub-Saharan Africa and counterfactually assess the potential returns to stability for the subset of conflict-affected countries in the region. On the first point, contrasting development outcomes, the paper shows that despite the favorable initial conditions enjoyed by SSA in the post-independence, most countries failed to meet expectations on the development path. Instead, they faced excess growth volatility with dramatic welfare consequences, most notably reflected in falling real income and persistently high rates of poverty. In addition, countries have remained extremely vulnerable to external shocks. Poverty counts increased sharply in the region after the 2008 global crisis, further compromising the prospects of meeting the first MDG of halving poverty by 2015 [Ravallion (2009)]. In contrast, the impressive growth record achieved by Asian EME during the globalization era enabled them to weather crises better. Though unexpected, this contrast reflects the shift in favor of Asia following impressive records of growth in that region. That shift started in the years following the independences; and over time, the income gap between the two regions widened significantly, especially with the increasing share of manufactured goods in global trade and persistent deficit of economic diversification in SSA. At the same time, the income gaps between Asian EME and SSA conflict-affected countries grew even more rapidly. Using a variation of standard neoclassical growth models, this paper shows that SSA’s abysmal growth records and its growing income gap with other regions of the developing world can be largely accounted for by the skewed distribution of growth and returns to stability in the post-independence era. In effect, as Asian EME capitalized on long virtuous cycles of political stability to expand human and physical capital in support of growth, the proliferation of long-duration wars throughout Africa adversely affected growth prospects both directly and indirectly, particularly via the exports and capital accumulation channels. Drawing on the flexibility of these models, the paper also estimates the potential returns to stability in a counterfactual analysis where SSA conflict-affected countries hypothetically assume a number of Asian EME stylized facts—peace and stability, robust and strong investment rates. In particular, counterfactual simulations under the hypothetical equalization of political risk profile result in large economic returns, reflected in the significantly higher level of aggregate output and income in the subset of SSA conflict-affected countries. The potential returns are even higher when the hypothetical reduction of political risks is accompanied by expansion of physical capital. Although political stability may not be sufficient for sustained growth and economic development, it may be a sine-qua-none condition for it to happen, these empirical results may suggest. Indeed, the welfare benefits of peace and stability at the individual and household level have become even more evident since Benjamin Franklin: “Be always at war with your vices, at peace with your neighbors and

19
let each year find you a better man”. Naturally, these benefits can be extended to nations at the macro level, as countries which have enjoyed relative peace and stability have also grown more rapidly, building on sustained accumulation of human and physical capital and optimal allocation of resources to achieve long-run growth and poverty reduction. Until recently, sustained capital accumulation and expansion of labor-intensive manufactured goods have been emphasized in attempts to explain the remarkable success of Asian EME. In retrospect, it is not clear that these countries would have enjoyed the same record of economic growth and diversification, fueled by massive investments and FDI inflows in the absence of peace and stability, however. Therefore, the emergence of peace and security as important stylized facts underpinning the growth process in Asia suggests that the success of African countries in the second phase of their independence—both in terms of growth and poverty reduction—may also hinge on the peace and security parameters.

20
References: Acemoglu Daron, Simon Johnson and James Robinson (2002). “An African Success Story: Botswana”. Centre for Economic Policy Research. Discussion Paper Series No. 3219. MIT.
Addison Tony (2004). “The Global Economy, Conflict Prevention, and Post-Conflict Recovery”. World Institute for Development Economics Research (WIDER).
African Business (2009). “Mining in Africa: DR Congo’s US$24 trillion fortune” African Business, February 2009.
Akyuz Yilmaz and Charles Gore (2001). “African Economic Development in a Comparative Perspective”, Cambridge Journal of Economics, Vol. 25, 265-288.
Alden E. (2004). “Cotton Report Frays Temper of US Farmers.” Financial Times, May 20.
Anyang’Nyongo (1992). “30 Years of Independence in Africa: The Lost Decades?” The African Association of Political Science, Academy Science Publishers, Nairobi, Kenya.
Artadi V. Elsa and Xavier Sala-i-Martin (2003). “The Economic Tragedy of the 20th century: Growth in Africa”, National Bureau of Economic Research Working Paper No. 9865.
Azariadis Costas and John Stachurski (2008). “Poverty Traps”. In P. Aghion and S. Durlauf (eds), Handbook of Economic Growth, New York: Oxford University Press.
Balassa Bela (1978). “Exports and Economic Growth: Further Evidence.” Journal of Development Economics, Vol. 5, No. 2, pp. 181-189.
Basdevant Olivier (2009). “How Can Burundi Raise Its Growth Rate? The Impact of Civil Conflict and State Intervention on Burundi’s Growth Preformance”. IMF Working Paper, WP/09/11.
Bayraktar Nihal and Hippolyte Fofack (2007). “Specification of Investment Function in Sub-Saharan Africa”, World Bank Policy Research Working Paper No. 4171.
Beaugrand Phillipe (2003). "Overshooting and dollarization in the Democratic Republic of the Congo," IMF working paper ; WP/03/105.
Berg Andy and Zia Qureshi (2005). “The MDGs: Building a Momentum”, Finance and Development, the International Monetary Fund. Vol. 42, Number 3.
Bodea Cristina and Ibrahim Elbadawi (2008). “Political Violence and Economic Growth”, World Bank Policy Research Working Paper, WPS4692. The World Bank Group.
Chen Shaohua and Martin Ravallion (2007). “Absolute Poverty Measures for the Developing World, 1981-2004.” World Bank Policy Research Working Paper No. 4211.
Collier Paul and Jan Willem Gunning (1999). “Explaining African Economic Performance”. Journal of Economic Literature, Vol. 37, No. 1, 64-111.
Collier Paul and Anke Hoeffler (2004). “Greed, Grievance and Civil War.” Oxford Economic Papers. 26:563-595.
DFID (2001). “The Causes of Conflict in Sub-Saharan Africa: Framework Document.” Department for International Development, United Kingdom.
Easterly William and Ross Levine (1997). “Africa’s Growth Tragedy: Policies and Ethnic Divisions,” Quarterly Journal of Economics. CXII (4), 1203-1250.
Fergusson Niall (2009). “The decade the world tilted east.” Financial Times, December 2009.
21
Fofack Hippolyte (2010). “Africa and Arab Gulf States: Divergent Development Paths and Prospects for Convergence.” Journal of African Development, Vol. 2, No. 1.
Fofack Hippolyte and Leonce Ndikumana (2010). “Capital Flight Repatriation: Investigation of its Potential Gains for Sub-Saharan African Countries.” African Development Review, Volume 22, Issue 1, pp. 4-22.
Gyimah-Brempong Kwabena and Thomas Traynor (1999). “Political Instability, Investment and Economic Growth in Sub-Saharan Africa.” Journal of African Economies, Vol. 8, No. 1, pp. 52-86.
Human Security Centre, University of British Columbia (2005). Human Security Report 2005: War and Peace in the 21st Century. Oxford University Press: New York, Oxford.
IMF (2007). “World Economic Outlook: Globalization and Inequality.” The International Monetary Fund, Washington DC.
IMF (2009). “World Economic Outlook: Crisis and Recovery.” The International Monetary Fund.
IMF (2010). “World Economic Outlook: Rebalancing Growth.” The International Monetary Fund, Washington DC.
Isham Jonathan, Michael Woolcock, Lant Pritchett and Gwen Busby (2005). “The Varieties of Resource Experience: Natural Resource Export Structures and the Political Economy of Economic Growth.” World Bank Economic Review, Vol. 19, No. 2, pp. 141-174.
Khan Mohsin and Carmen Reinhart (1990). “Private Investment and Economic Growth in Developing Countries.” World Development, Vol. 18, No. 1, pp. 19-27.
Kim Eun Mee (1998). The Four Asian Tigers: Economic Development and the Global Political Economy. Academic Press,
Kimonyo Jean-Paul and Damase Ntiranyibagira (2007). “Reform of the Coffee Sector in Burundi: Prospects for Participation, Prosperity and Peace”. International Alert, ISBN: 978-1-898702-89-4.
Kristof Nicholas (2010). “The World Capital of Killing.” The New York Times, February 2010.
Lorentzen P, J. McMillan and R. Wacziarg (2006). “Death and Development.” Unpublished mimeo, Graduate School of Business, Stanford University, Stanford, CA 94305-5015, USA.
Maddison Angus (1995). “Monitoring the World Economy: 1820-1992.” Development Centre of the Organization of Economic Cooperation and Development. OECD, Paris, France.
Maddison Angus (2002). “The World Economy: A Millennial Perspective.” Development Centre of the Organization of Economic Cooperation and Development. OECD, Paris, France.
Malone D. and H. Nitzschke (2004). “Economic Agendas in Civil Wars: What We Know, What We Need to Know.” Paper presented at the UNU-WIDRE Conference “Making Peace Work”, June 4-5, 2004. Helsinki (Available at: www.wider.unu.edu).
Mauro Paolo (1995). “Corruption and Growth.” Quarterly Journal of Economics 110:681-712.
Messer Ellen, Marc J. Cohen and Jashinta D’Costa (1998). “Food from Peace: Breaking the Links between Conflict and Hunger.” Food, Agriculture, and the Environment Discussion Paper 24, International Food Policy Research Institute, Washington DC.
Myrdal Gunnar (1972). Asian Drama: An Inquiry into the Poverty of Nations. New York: Random House.
Nelson Richard and Howard Pack (1999). “The Asian Miracle and Modern Growth Theory”. The Economic Journal, 109, 416-436.

22
Njikam Ousmanou, J. Binam and S. Tachi (2006). “Understanding total factor productivity growth in Sub-Saharan African Countries”. SISERA Working Papers No. 2006/3.
Ra Sungsup and Bipul Singh (2005). “Measuring the Economic Costs of Conflict.” Asian Development Bank Working Paper Series No. 2. The Asian Development Bank.
Ravallion Martin (2009). “The Crisis and the World Poorest.” Development Outreach, Vol. 11, No. 3, The World Bank Institute.
Rodrik Dani, A. Subramanian and F. Trebbi (2004). “Institutions Rule: The Primacy of Institutions over Integration and Geography in Development.” Journal of Economic Growth, 9, 131-165.
Sachs Jeffrey and Andrew Warner (1995). “Natural Resource Abundance and Economic Growth.” NBER Working Paper No. 5398. The National Bureau of Economic Research.
Stiglitz Joseph (2006). “Development in Defiance of the Washington Consensus.” Guardian, I3 April 2006.
Summers Lawrence H. (2006). “Reflections on Global Account Imbalances and Emerging Markets Reserve Accumulation.” Harvard University, Office of the President.
Solow Robert (1957). “Technical Changes and the Aggregate Production Function.” Review of Economics and Statistics, 39(3), 312-20.
Tahari Amor, D. Ghura, B. Akitoby, and E. Brou Aka (2004). “Sources of Growth in Sub-Saharan Africa”, IMF Working Paper WP/04/176. International Monetary Fund.
UNDP (2009). “Human Development Report 2009: Overcoming barriers—Human mobility and Development.” United Nations Development Program, New York.
World Bank (2005). Economic Growth in the 1990s: Learning from a Decade of Reform. Washington DC, The World Bank.
World Bank (2002). “Globalization, Growth and Poverty: Building an Inclusive World Economy.” World Bank Policy Research Report. The World Bank Group, Washington DC.
World Bank (1993). The East Asian Miracle: Economic Growth and Public Policy, Summary. New York, Oxford University Press.
Yongding Yu (2009). “The Management of Cross-Border Capital Flows and Macroeconomic Stability in China”. TWN Global Economic Series No. 14. The Third World Network.

23
Annexes: Figures and Tables
Figure A1: External debt stocks (in % of GDP)
0
50
100
150
200
250
300
1975197619771978197919801981198219831984198519861987198819891990199119921993199419951996199719981999200020012002200320042005200620072008
Conflict Countries
Non-conflict countries
Emerging Asia

24
Figure A2: Contribution to global trade and growth (in percentage of global total)
0
1
2
3
4
5
6
7
8
9
1980
1981
1982
1983
1984
1985
1986
1987
1988
1989
1990
1991
1992
1993
1994
1995
1996
1997
1998
1999
2000
2001
2002
2003
2004
2005
2006
2007
2008
Panel A: Contribution to global trade (% of World Exports)
China SSA SSA - conflict
-5
0
5
10
15
20
25
30
35
40
1981
1982
1983
1984
1985
1986
1987
1988
1989
1990
1991
1992
1993
1994
1995
1996
1997
1998
1999
2000
2001
2002
2003
2004
2005
2006
2007
2008
Panel B: Contribution to global growth (%)
China SSA

25
Figure A3: Simulated GDP per capita of SSA conflict-affected countries under the equalization of political risk profile alternative (Seychelles case)
Panel A: Simulated GDP with SSA-conflict affected coefficients
Panel B: Simulated GDP with SSA non-conflict peace dividends and coefficients
0
500
1000
1500
2000
2500
3000
1985
1986
1987
1988
1989
1990
1991
1992
1993
1994
1995
1996
1997
1998
1999
2000
2001
2002
2003
2004
2005
2006
2007
Actual GDP per capitaSimulated GDPPC with Non-conflict Peace DividendSimulated GDPPC with Non-conflict Peace Dividend and Seychelles investment
0
500
1000
1500
2000
2500
3000
1985
1986
1987
1988
1989
1990
1991
1992
1993
1994
1995
1996
1997
1998
1999
2000
2001
2002
2003
2004
2005
2006
2007
Actual GDP per capitaSimulated GDPPC with Non-conflict Peace DividendSimulated GDPPC with Non-conflict Peace Dividend and Seychelles investment

26
1980 1985 1990 1995 2000 2005 2008 AVERAGE
China 35.19 38.35 36.14 41.90 35.12 44.02 42.61 39.05
Emerging Asia 35.21 32.50 35.66 38.60 30.24 23.30 31.15 32.38
(Korea, Malaysia, Singapore)
India 18.55 23.47 24.16 26.59 24.16 34.82 39.20 27.28
Gulf countries 27.80 25.27 16.83 22.63 17.08 22.99 18.55 21.59
SSA ‐ conflict 18.61 18.29 17.24 14.85 13.06 13.69 13.79 15.65
SSA ‐ no conflict 25.43 24.63 23.52 20.85 19.74 19.54 19.74 21.92
SSA 23.06 18.91 19.23 21.40 19.58 21.40 23.57 21.02
Table A1 ‐ Gross capital formation (% of GDP)

27
Dependent variable: G
DP per capita in
constant 2000 US dollars
Row/ column
12
34
56
78
9
1Constant term
134.466
101.907
424.058
2209.349
143.911
284.729
1665.189
116.341
205.151
(1.502)
(1.032)
(3.332)
(0.67)
(0.581)
(1.134)
(0.822)
(0.045)
(0.083)
2Gross capital form
ation per capita (in constant 2000 US $)
0.028
0.026
0.026
0.002
0.018
0.006
0.047
0.044
0.051
(3.486)***
(4.678)***
(5.609)***
(0.952)
(5.782)***
(2.089)**
(9.580)***
(4.476)***
(7.909)***
3Log of labor force
‐6.73
‐3.352
‐19.914
‐130.542
7.354
5.743
‐119.16
‐66.859
‐85.055
(‐1.212)
(‐0.586)
(‐2.577)**
(‐0.602)
(0.465)
(0.356)
(‐1.757)*
(‐1.377)
(‐1.417)
4External conflict index
15.18
……
2.5
……
79.658
……
(4.583)***
(0.772)
(1.016)
5Internal conflict index
…16.052
……
10.153
……
111.294
…
(4.483)***
(1.718)*
(0.456)
6Combined conflict index
……
6.26
……
20.152
……
147.426
(1.684)*
3.224
(1.021)
7Exports per capita (in constant 2000 US $)
0.823
0.867
0.809
1.036
1.093
1.079
0.213
0.175
0.197
(14.015)***(14.191)***(14.616)***
(5.457)***
(15.821)***(15.773)***
(12.025)***(14.229)***(14.501)***
8External conflict index * Gross capital form
ation per capita
‐0.002
……
0.001
……
‐0.002
……
(‐1.826)*
(6.283)***
(‐3.896)***
9Internal conflict index * Gross capital form
ation per capita
…‐0.002
……
‐0.001
……
‐0.0015
…
(‐2.304)**
(‐1.908)*
(‐1.651)*
10Combined conflict index * Gross capital form
ation per capita…
…‐0.001
……
0.001
…‐0.002
(‐2.758)***
(2.467)**
(‐3.856)***
Number of observations
257
257
257
177
177
177
7676
75
Adjusted R‐square
0.959007
0.96317
0.892103
0.996762
0.98658
0.986401
0.991
0.988
0.991
Table A2 ‐ Regression results: Growth and Peace Dividends (M
odel 1)
SSA conflict
SSA non‐conflict
Asia
Note: Countries included are basedon availability of confict index. Conflict countriesare Angola, D
RC, Congo
Rep, Cote d'Ivoire, Ethiopia, Liberia, M
adagascar, M
ozambique,
Niger, Sierra Leone, Sudan, and Uganda. Nonconflict countries are Botswana, Cam
eroon, G
hana, Kenya, M
alaw
i, Senegal, Tanzania ,South Africa and Zam
bia. Asian
countries
are China, Korea, Malaysia, Singapore. Both time and country dummies rae included but not reported in the table. Higher conflictindex indicates higher peace dividends. The
numbers in paranthesis are t‐statistics. * indicates significance at 10%, ** at 5%
, and *** at 1%. Combined conflict index is the average
if internal and external index.

28
Dependent variable: G
DP per capita in
constant 2000 US dollars
Row/ column
12
34
56
78
9
1Constant term
174.261
120.37
92.143
195.969
327.669
225.678
1746.312
10029.91
18.139
(1.93)*
(1.195)
(0.927)
(0.586)
(1.015)
(1.008)
(0.924)
(0.387)
(0.007)
2Gross capital form
ation per capita (in constant 2000 US $)
0.05
0.049
0.053
0.018
0.024
0.025
0.054
0.041
0.056
(6.37)***
(7.959)***
(7.557)***
(5.202)***
(5.464)***
(10.956)***
(12.388)***(4.143)***
(9.118)***
3Log of labor force
‐10.975
‐6.315
‐7.266
13.607
‐6.593
9.918
‐130.342
‐803.641
‐86.005
(‐1.998)**
(‐1.098)
(‐1.277)
(0.591)
(‐0.32)
(0.69)
(‐2.038)**
(‐0.535)
(‐1.494)
4External conflict index
17.935
……
14.251
……
97.971
……
(5.327)***
(3.916)***
(1.381)
5Internal conflict index
…19.966
……
5.779
……
479.971
…
(5.462)***
(2.083)**
(1.782)*
6Combined conflict index
……
23.279
……
21.853
……
169.075
(6.054)***
(3.874)***
(1.252)
7External conflict index * Exports per capita (in constant 2000 US $)
0.085
……
0.097
……
0.021
……
(15.527)***
(5.085)***
(12.693)***
8Internal conflict index * Exports per capita (in constant 2000 US $)
…0.115
……
0.11
……
0.022
…
(14.858)***
(5.133)***
(5.704)***
9Combined conflict index * Exports per capita (in constant 2000 US $)…
…0.099
……
0.121
……
0.018
(16.067)***
(18.583)***
(15.052)***
10External conflict index * Gross capital form
ation per capita
‐0.004
……
‐0.001
……
‐0.003
……
(‐4.579)***
(‐2.04)**
(‐5.625)***
11Internal conflict index * Gross capital form
ation per capita
…‐0.005
……
‐0.001
……
‐0.002
…
(‐5.713)***
(‐2.489)**
(‐2.136)**
……
‐0.001
12Combined conflict index * Gross capital form
ation per capita
……
‐0.005
(‐6.691)***
……
‐0.003
(‐5.628)***
(‐4.784)***
Number of observations
257
257
257
177
177
177
7676
75
Adjusted R‐square
0.960175
0.893526
0.962975
0.996851
0.9985
0.988944
0.992
0.986
0.991
Table A3 ‐ Regression results: Growth and Peace Dividends (M
odel 2)
SSA conflict
SSA non‐conflict
Asia
Note: Countries included are basedon availability of confict index. Conflict countriesare Angola, D
RC, Congo
Rep, Cote d'Ivoire, Ethiopia, Liberia, M
adagascar, M
ozambique, N
iger,
Sierra Leone, Sudan, and Uganda. Nonconflict countries are Botswana, Cam
eroon, G
hana, Kenya, M
alaw
i, Senegal, Tanzania , South Africa and Zam
bia. A
sian
countries are China,
Korea, Malaysia, Singapore. Both time and country dummies rae included but not reported in the table. H
igher conflict index indicates higher peace dividends. The numbers in
paranthesis are t‐statistics. * indicates significance at 10%, ** at 5%
, and *** at 1%
. Combined conflict index is the average
if internal and external index.