Embed Size (px)
Citation preview
Conformal Therapy Using Maximum Entropy Optimization
William A. Sandham, Yong Yuan, and Tariq S. Durrani
Signal Processing Division, Department of Electronic and Electrical Engineering, University of Strathclyde, Glasgow G1 lXW, Scotland, United Kingdom
ABSTRACT Conformal therapy offers considerable advantages over conventional radiotherapy treatment, because it has the potential for matching almost exact/y the delivered dose distribution to the prescribed dose distribution. Associated (inverse) treatment planning methods ad- dress a constrained linear optimization problem. In this article, a method based on maximizing the total entropy of the beam profiles is developed. Maximum entropy optimization constrains the computed dose to be within well-defined tolerances of the prescribed dose, and has advantages of robustness, fast convergence, and high accuracy. For the work reported here, it is assessed using clinically prescribed irregular target dose volumes based on magnetic resonance imaging and computed tomography images. Results are shown for a two- dimensional, homogeneous absorption, primary dose computation model, to illustrate the feasibility of the approach; however, the method may be extended to accommodate a more general three- dimensional model, including inhomogeneities and scatter dose contributions. Optimization of beam offset for a regular angular displacement of beams is also considered, with particular regard to implications on total beam energy, entropy, and computation time. @ 1995 John Wiley 8 Sons, Inc.
I. INTRODUCTION Conventional external beam radiotherapy treatment planning (RTP) addresses the forward problem of obtaining the computed dose from available beam profiles, body cross- sectional information, and the prescribed dose [ 11. Because the methodology is essentially supervised or informed trial and error, optimal computed dose distributions are very rarely achieved in realistic planning times, as a result of the large throughput required during routine clinical planning and treatment.
Conformation radiotherapy, also known as conformal therapy, is a comparatively recent innovation in external beam radiotherapy which offers considerable advantages over conventional methods [2]. Conformal RTP is concerned with the inverse problem of determining optimum beam parame- ters from body cross-sectional information [computed tomog- raphy (CT) images] and the prescribed dose, and has the potential for matching almost exactly the delivered and prescribed dose distributions.
Most conformal RTP algorithms are concerned with de- termining treatment beam profiles or intensity modulation functions (IMFs), given some optimization criterion and imposed constraints. At present, most gantry positions are
chosen independent of the tumor or critical organs, and usually consist of an odd number (e.g., seven, nine, or 11) of treatment beams equispaced 360" around the body. Confor- mal RTP involves the determination of IMFs from prescribed target dose volumes, analogous to image reconstruction from projections in CT [3]. Because of this similarity, methods for determining IMFs have been coined inverse computed tomog- raphy by some researchers. However, as pointed out correctly by Webb [4], this analogy is not very rigorous, one reason being that negative beam intensities would be required for exact inversion. We prefer the more concise (and correct) title inverse therapy planning.
The conformal RTP problem has been formulated in more detail in another article in this Special Issue [5 ] , which also contains articles describing the major solutions for inverse therapy planning which have been proposed, including back- projection and steepest descent [6], tomotherapy [7] , singular value decomposition [S], simulated annealing [9], and pencil- beam and kernel-based methods [lo]. Other optimization approaches which have been proposed include genetic algo- rithms [l l] , Bayesian methods [12], and distributed simulated annealing [13].
This article describes an alternative approach to the conformal RTP (linear) inversion problem, based on maximiz- ing the total entropy of the beam profiles. This maximum entropy optimization method constrains the computed dose to be within well-defined tolerances of the prescribed dose, and has advantages of robustness, fast convergence, and high accuracy. For the work reported here, it is assessed using clinically prescribed irregular target dose volumes based on magnetic resonance imaging (MRI) and CT images. Results are shown for a two-dimensional, homogeneous absorption, primary dose computation model, to illustrate the feasibility of the approach; however, the method may be extended to accommodate a more general three-dimensional model, in- cluding inhomogeneities and scatter dose contributions [12]. Optimization of beam offset for a regular angular displace- ment of beams is also considered, with particular regard to implications on total beam energy, entropy, and computation time.
The article is organized as follows. In Section 11, the two-dimensional dose computation model used in the present work is developed. Maximum entropy optimization is pre- sented in Section 111. First, its applications in image recon- struction from a number of projections (tomographic imag- ing) are reviewed briefly. Then, the associated problem, of
International Journal of Imaging Systems and Technology, Vol. 6, 80-90 (1995) 0 1995 John Wiley & Sons, Inc. CCC 0899-9457/95/0 10080- 1 1
determining IMFs from prescribed target volumes (inverse therapy planning) is presented. Determination of IMF initial conditions and termination criteria are also discussed in this section. Results obtained for clinically prescribed irregular target dose volumes, based on MRI and CT images, are described in Section IV, where they are evaluated quantita- tively using dose-volume histograms. In Section V, the effects of beam offset are considered, specifically with regard to convergence time, total beam energy, mean, standard devia- tion, and entropy. Results are illustrated for a difficult test phantom scenario. Finally, general conclusions are given in Section VI.
II. DOSE COMPUTATION MODEL The computation model for determining the dose distribution in RTP is based on the principle of superposition; the resultant dose at a point is equal to the algebraic summation
m Bi(
X
of independent doses delivered by a number of radiation beams at different orientations. Further, the contribution of
superposition and consists of two parts, primary dose and
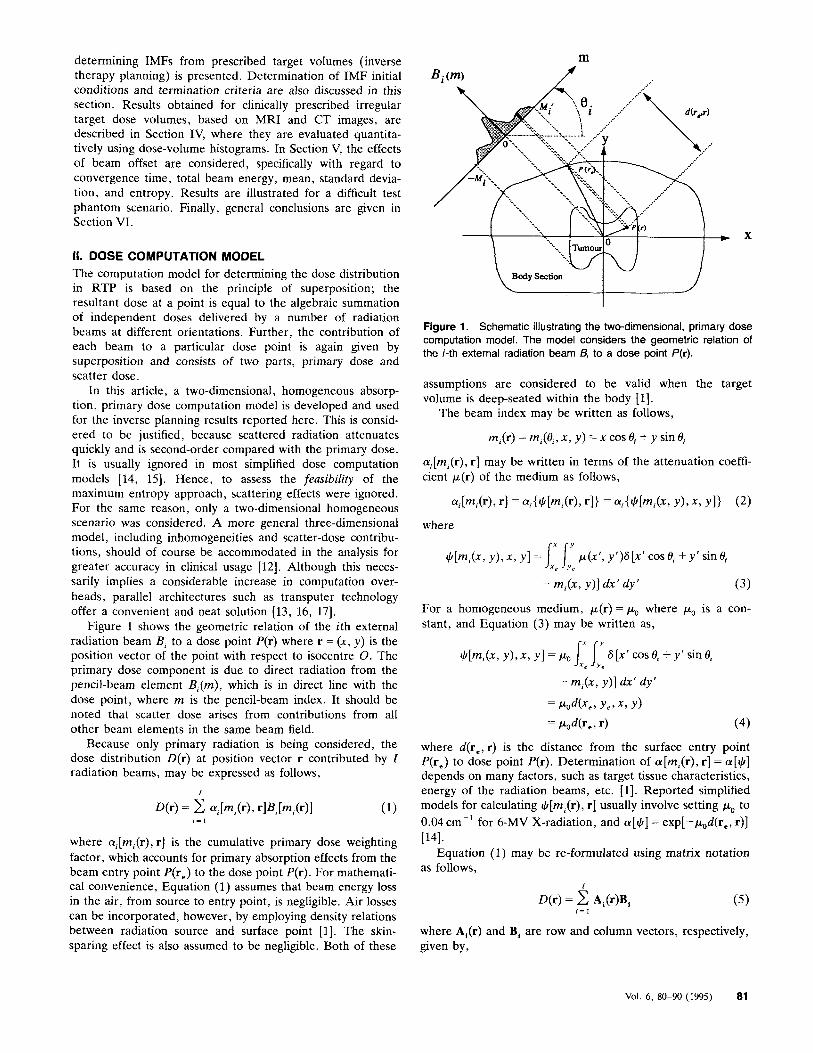
Figure 1. Schematic illustrating the two-dimensional, primary dose computation model. The model considers the geometric relation of each beam to a particular dose point is again given by the j-th external radiation beam si to a dose point p(r).
scatter dose. In this article, a two-dimensional, homogeneous absorp-
tion, primary dose computation model is developed and used for the inverse planning results reported here. This is consid-
assumptions are considered to be valid when the target volume is deep-seated within the body [l].
The beam index may be written as follows,
ered to be justified, because scattered radiation attenuates quickly and is second-order compared with the primary dose. It is usually ignored in most simplified dose computation models [14, 151. Hence, to assess the feusibilify of the
mi(r) = mi@, x , y ) = x cos 0, + y sin 0,
ai[mi(r), r1 may be written in terms of the attenuation coeffi- cient P(r) of the mxhum as follows,
maximum entropy approach, scattering effects were ignored. For the same reason, only a two-dimensional homogeneous scenario was considered. A more general three-dimensional model, including inhomogeneities and scatter-dose contribu- tions, should of course be accommodated in the analysis for greater accuracy in clinical usage [12]. Although this neces- sarily implies a considerable increase in computation over- heads, parallel architectures such as transputer technology offer a convenient and neat solution [13, 16, 171.
Figure 1 shows the geometric relation of the ith external radiation beam B, to a dose point P(r) where r = ( x , y ) is the position vector of the point with respect to isocentre 0. The primary dose component is due to direct radiation from the pencil-beam element Bt(m), which is in direct line with the dose point, where m is the pencil-beam index. It should be noted that scatter dose arises from contributions from all other beam elements in the same beam field.
Because onIy primary radiation is being considered, the dose distribution D(r) at position vector r contributed by I radiation beams, may be expressed as follows,
I
4.) = c %[ml(r), rlBI[mi(r)l ( 1 ) r = l
a,[m,W, .I = ar{+[m,(r), .I) = L.,{+[m,(x> Y ) , X , Y l ) (2)
where
+ [ m , ( x , y ) , * , Y l = ~ ~ ~ ~ ~ ~ ~ ( x ’ , Y ’ ) S [ x ’ c o s e , +y’sinO,
+[m,(x, Y ) , x , Y 1 = Po I:, 6 [x’ cos e, + Y sin e,
- m,(x, Y ) ] dx’ dY‘ (3)
For a homogeneous medium, p(r) = po where po is a con- stant, and Equation ( 3 ) may be written as,
- m h , Y ) l dx’ dY’
= P o 4 X , , Y , > X , Y )
= P&,, ( 4 )
where d(re,r) is the distance from the surface entry point P(r,) to dose point P(r). Determination of a[ml(r), r ] = a[+] depends on many factors, such as target tissue characteristics, energy of the radiation beams, etc. [l]. Reported simplified models for calculating +[mz(r), r] usually involve setting po to 0.04 cm-’ for 6-MV X-radiation, and a[+] = exp[-pod(re, r)]
where ai[mi(r), r] is the cumulative primary dose weighting factor, which accounts for primary absorption effects from the beam entry point P(rJ to the dose point P(r). For mathemati- cal convenience, Equation ( 1 ) assumes that beam energy loss
can be incorporated, however, by employing density relations between radiation source and surface point [ l ] . The skin- sparing effect is also assumed to be negligible. Both of these
[141.
as follOws~ Equation (1) may be re-formulated using matrix notation
I
in the air, from source to entry point, is negligible. Air losses D(r) = c Ai(r)B, (5) i = l
where A,@) and B, are row and column vectors, respectively, given by,
Vol. 6 , 80-90 (1995) 81
Ai(r) = [@,(-MI, r) ac(-Mf + 1, r) . . . q ( m , r) . . . .,(Mi, r)]
( 6 )
B i = [B, ( -M,) B,(-M, + 1 ) . . . B,(m) . . . B,(M:)IT -M, 5 m 5 M i
(7)
and where T refers to the transpose of a vector. Equation ( 5 ) may be written as follows,
D(r) = A(r)B (8)
(9)
(10)
where, A(r) = [A,(r) A2(r) . . . A,(r)]
B = [B, B, . . . B,IT
Finally, assuming a total of J dose points, the dose vector D may be written as,
where, D = A B (11)
(12) D = [D(O) D(1) . . . D(J - l)]'
A = [A(O) A( 1) . . . A(J - l)]'
Equation ( l l ) , which is linear, enables the dose vector D to be determined from the transformation matrix A and the beam IMF vector B. It reflects a transformation of radiation beam distribution into radiation dose distribution, and each element of A represents a weighting factor of contributions from one radiation pencil-beam element to a radiation dose point [18].
111. MAXIMUM ENTROPY OPTIMIZATION Entropy is a measurement of uncertainty [19, 201. Every probability distribution, such as those represented by image pixels or beam IMFs, has some "uncertainty" associated with it. According to the maximum entropy principle, given incomplete information about a random variable, scalar, o r vector, the probability distribution should be chosen, which is consistent with the given information, but otherwise has maximum uncertainty associated with it. In other words, a solution should be chosen by maximizing the uncertainty of the unknown information.
The maximum entropy principle, first stated explicitly by E . T . Jaynes [21], has been applied in many fields, including thermodynamics and statistical mechanics, nonparametric estimation, time series analysis, astronomy, speech and signal processing, and image reconstruction.
In the following two sections, the maximum entropy principle is reviewed for the optimization problem in tomo- graphic imaging, and a maximum entropy method is then developed for the closely associated optimization problem in inverse therapy planning.
A. Tomographic Imaging. The aim of tomographic imaging is to produce noninvasive, accurate, numerical representations of the distributions of various structures within an object. The technique is well developed in many application areas, such as nondestructive testing (NDT) for industrial inspection, seis- mic data processing for oil and gas exploration, and, of most relevance for the present work, medical imaging for clinical diagnosis and treatment. This latter application includes X-ray CT, MRI, single photon emission computed tomography
(SPECT), and positron emission tomography (PET) tomog- raphic imaging techniques.
The general principles of phys'ics and mathematics upon which different tomographic imaging modalities are based are fundamentally similar. Some form of energy is measured after its passage through an object, and from these measurements, mathematical estimates are computed and images are pro- duced, representing two- or three-dimensional distributions of interactions between the energy and the object textures (e.g., absorption, attenuation, or nuclear mechanical disturbance). However, the specific details of applying these principles, and the engineering and instrumentation developed to implement them into practice, and most significantly the information content and quality of the final images, are quite different. This is due primarily to the different energy-texture interac- tions which are measured, and the varying biological, phys- ical, and technological constraints imposed in obtaining these measurements in a practical way.
The principal idea of X-ray CT is based on the fact that X-rays transmitted through the human body are attenuated through absorption by bone, muscle tissue, and blood. Differ- ent tissues possess different attenuation coefficients [22], and measurements of this attenuation can be processed to produce the anatomic structure of the body.
The scanning technique used in first generation CT scan- ners employed parallel beams. This developed into a fan- beam-scanning technique and resulted in the evolution of the second-, third-, and fourth-generation CT scanning systems [23, 241. The ease of conversion between fan-beam and parallel-beam reconstructions [24] is a major motivation behind the use of the latter to explain the general tomo- graphic imaging principles. Hence, because of its mathemati- cal simplicity and ease of understanding, the parallel-beam reconstruction model will be adopted for all discussions which follow.
Each cross-section may be represented as an image whose gray levels (intensities) correspond to the attenuation, repre- sented by a two-dimensional function f ( x , y ) . For a parallel ray geometry, if a narrow width X-ray pencil beam of density I,, is transmitted through the slice, then the quantity
is measured at a detector placed at an angle 8 with respect to the frame of reference. The integration is along the line L : x cos 8 + y sin 6 = t .
Taking measurements at all other parallel strips will produce a complete one-dimensional projection at angle 8, of the image two-dimensional function f ( x , y ) . Equation (13) may be rewritten as follows,
This procedure is then repeated at other angles to acquire all projections. The estimation of f ( x , y ) from projection mea- surements { p , ( t ) } represents the tomographic imaging prob- lem.
Each projection measurement p,( t ) of an image f ( x , y ) is an estimate of a particular line integral of the image, which, for the noise-free case, is,
82 Vol. 6 , 80-90 (1995)

a m Image reconstruction from incomplete projections using the maximum entropy method implies choosing a solution
p , ( t ) = /-, /-, f ( x , y )6 (x cos 8 + y sin 8 - t ) dx dy (15)
which maximizes the-entropy, Equation (18) or f19), subject to various known constraints. A number of algorithms have been developed to tackle this optimization problem, including least-square and linear constraints, and the minimum discrimi- nation method. Further details may be found in [32].
The maximum entropy solution with a linear constraint may be stated as follows:
The delta line 6(x cos 8 + y sin 8 - t ) sifts out the desired line L in f ( x , y ) to provide an effective line integration.
Obtaining the image function f ( x , y ) , given the projections p , ( t ) at all orientations, is the basic mathematical problem which was first solved by Radon [25] in his classic paper [English translation in (26)].
Algorithms for image reconstruction from projections can . . be classified into two categories: direct reconstruction algo- rithms and iterative (optimal) algorithms. The former include the Fourier transform, filtered back-projection, and convolved back-projection approaches [27, 281. They are all equivalent; however, their implementation varies.
Iterative algorithms have a strong potential in dealing with problems of image reconstruction from incomplete measure- ments (projections), such as limited view data, truncated data, etc. [28]. Direct reconstruction methods, in such cases, fail to approach a unique solution because of insufficient measure- ments provided. Extra constraints have to be made for the reconstructing procedure to approach a unique solution based o n so-called prior-information-the known incomplete part of data and the knowledge about data (non-negativity of image pixels, etc.).
Optimization reconstruction algorithms developed so far can be roughly classified into three categories, according to the properties of the optimization function chosen. Most of the methods fall into the Bayesian and maximum entropy approaches, and the rest are based on individual reconstruc- tion models which are somewhat related to the first two categories, but may not be exactly the same.
Using the discrete form of Equation (15), the relation between measurements and the image to be reconstructed is,
I - 1
p , = C u , , ~ 0 5 i 5 1 - I (16) , = n
where u,, reflects the contribution ratio of pixel f , to the projection line p , . J is the number of image pixels, and I is the number of projections. The matrix form of the above is
P = A F (17) where A is the transformation matrix which projects image vector F into projection vector P. Equations (16) and (17) are the basis of the so-called series expansion approach of the Radon transform [29, 301.
The image reconstruction problem my be stated as follows: Using Equation (17) and given the projection vector P, estimate image vector F. Different optimization criteria chosen for reconstruction result in different reconstruction methods, such as the Bayesian and maximum entropy optimi- zation techniques. Only the latter is considered here.
The entropy of an image f ( x , y ) is defined as [30, 311,
where D is the domain of f ( x , y ) . O r in discrete form,
in which OlogO is defined to be 0.
1 - 1
Maximize H = - C L. log f ; (20)
Subject to: P = AF (21)
J . 2 0 O s i < J (22)
i=o
An efficient algorithm for solving the above problem is the multiplicative algebraic reconstruction technique (MART). This algorithm was first suggested in [33], and later it was proved [34] that the solution converges under reasonable conditions (that a non-negative solution exists and that the coefficient matrix A is non-negative).
The MART algorithm is defined as follows:
f ( O ) = e - ’ e (23)
(24) where e is the base of the natural logarithm, and e is a vector containing all ones. (a,,, f ‘ ” ) is the p:”, i.e., the projection at index j calculated from image f l ” . { p k } are relaxation parameters such that 0 < p, 5 1.0, and I is the total number of projections. Equations are computed cyclically, i.e., i = i, =
k(mod I ) + 1.
B. Inverse Therapy Planning. The inverse therapy planning problem is closely associated with the tomographic imaging problem above. However, in this case the beam vector B has to be determined in terms of the dose vector D and the absorption matrix A. Direct inversion is not possible, since matrix A is very large, non-Toeplitz, rectangular, and ex- tremely sparse (typically only 1 - 2% nonzero elements).
A more quantitative comparison between tomographic imaging and inverse therapy planning is given in Table I. Although both methods involve different physical problems, their abstracted mathematical equations and behavior of related variables are fundamentally the same. For example, both have non-negative elements and the transformation matrices share similar properties. Hence, some of the tech- niques developed for solving the inverse problem in tomog- raphic imaging may be directly applicable to inverse therapy planning.
In the previous section, an optimization algorithm was discussed for the tomographic inversion problem using the maximum entropy method. This technique will now be formulated for the inverse planning problem in conformal therapy.
From a mathematical perspective, the greater the number of treatment beams for conformal RTP, the higher the correlation between delivered dose and prescribed target volume. However, this implies more complicated clinical
Vol. 6, 80-90 (1995) 83

Table I. Comparison of tomographic imaging and inverse therapy planning
Tomographic Imaging Inverse Therapy Planning
Problem
Mathematical representation
Transformation matrix characteristics
Maximum entropy approach
Other constraints
Solution initial guess
Image reconstruction from incomplete projec- tions
P = A f P: known projection vector f
A: transformation matrix 0 Transforms image from image domain into
projection domain Each element represents a weighting factor of each image element into a projection element
image vector to be reconstructed (non-nega- tive)
0 Huge and sparse Difficult to determine A-'
Maximize: H = -c f; log
Subject to: P = Af
Knowledge regarding image such as limited re- gion support, etc., can be treated as extra con- straints appended to optimization models Image obtained from filtered back-projection of the available projections
f ; zo
Determination of intensity modulation functions (IMFs) based on prescribed dose description of target volume
D = A B D: prescribed dose vector B: IMF vector to be determined (non-negative)
A: transformation matrix Transforms beams into a dose distribution
0 Each element represents a contribution weighting factor of each pencil-beam element to a dose point
0 Huge and sparse 0 Difficult to determine A-'
Maximize: H = -2 B, log B,
Subject to: D = AB
Prescribed dose distribution limitation on organs at risk, etc., can be treated as extra constraints appended to optimization models IMF profiles obtained from filtered projection of mescribed tareet dose distribution
B! 2 0
radiotherapy practice, with longer preparation times required for physically setting up the treatment machine. A com- promise in the number of (odd) beams of the order of 11 is therefore usually imposed [15], resulting in a suboptimal inversion.
The maximum entropy approach to the inverse planning problem requires the determination of a set of IMFs {B,(m), (i = 1,2, . . . , I , -MI 5 m 5 M : ) } , such that the total entropy of the radiation beams (defined below) is maximized,
I M'
H = - C C B,(m) log B,(m) (25) r = l m = - M
subject to:
1. the calculated dose distribution D matching the pre- scribed dose distribution Do, i.e.,
AB = Do (26)
M ; i c q ( m , i)B,(m) = Do(;) r = l m = - M ,
(27) ;=0 ,1 , . . . , J-1
2. non-negativity of beam constraint,
B,(m) 2 0 i= 1 ,2 , . . . , I ; m = - M E , -M, + 1 , . . . , M : (28)
3. critical regions receiving dose Dcr,t lower than a specified tolerable low dose DlOw, i.e.,
Dcm DIOW (29)
Formulating the MART algorithm for the inverse planning
problem results in the following radiotherapy MART (R- MART) algorithm,
where p is a relaxation parameter confined to the interval 0 < p 5 1.0.
C. IMF Initial Conditions and Termination Criteria. The R-MART algorithm requires initial values for the IMFs to start the iteration process. Obviously, the more accurate these initial values are, the faster the algorithm will converge. Because the process of beam irradiation is very similar to the filtered back-projection method in tomographic imaging, we chose the filtered projections of the prescribed dose as the initial IMF values. The filtered projection method forces the isodose lines to follow the shape of the target, and provides a much more reasonable initial guess of IMFs for further optimization. Details are described in [15] and [32].
The R-MART algorithm is an iterative process. Termina- tion occurs at the kth iteration where,
and
(33)
(34)
In the above equations, /3 is a mismatch tolerance ratio (we assume /3 = 1% for the results reported here), Aturnor is the
84 VOI. 6 , 80-90 (1995)
area of the target volume, is the high dose area within the target area Aturnor, and in AEih the dose distribution
Acric is the area of the critical regions. A::: is the low dose area within ACrit, and in A::: the dose distribution 0::: satisfies 0 5 D::: 5 Dlow. Usually, Dlow < 60%. 100% refers to the maximum dose.
Dhigh ( k ) satisfies Dhigh 5 DEih 5 100%. Usually, Dhigh 2 95%.
IV. RESULTS AND DISCUSSION The R-MART algorithm was applied to two different RTP scenarios. The first, which involved an MRI image, concerned the treatment of a concave tumor, when a critical region was present within the concavity. The second plan involved a CT image, and was concerned with the treatment of a tumor present in a bladder, when surrounded by three critical regions. In both cases, 11 external radiation beams equally distributed around [0,27i-] were employed.
The two-dimensional, homogeneous absorption, primary dose computation model, discussed in Section 11, was used in both cases. An attenuation coefficient po of 0.04cm-', appropriate for typical 6-MV radiation, was employed.
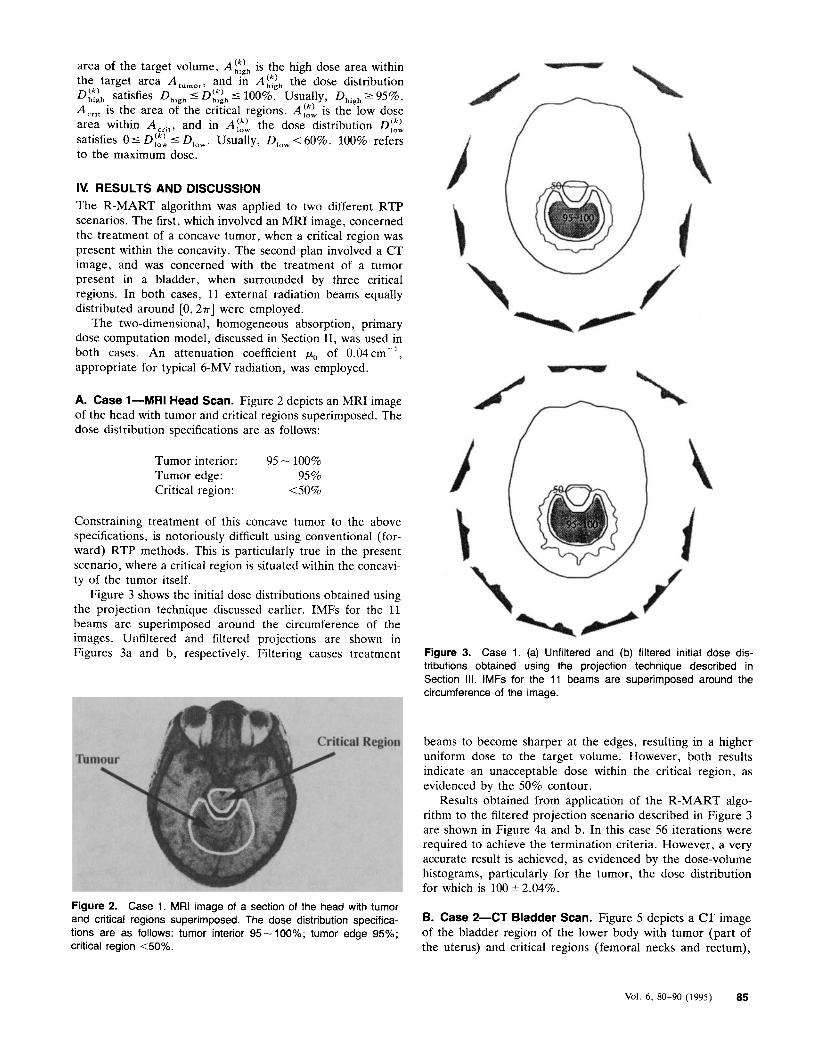
A. Case 1-MRI Head Scan. Figure 2 depicts an MRI image of the head with tumor and critical regions superimposed. The dose distribution specifications are as follows:
Tumor interior: 95 - 100%
Critical region: 4 0 % Tumor edge: 95 %
Constraining treatment of this concave tumor to the above specifications, is notoriously difficult using conventional (for- ward) RTP methods. This is particularly true in the present scenario, where a critical region is situated within the concavi- ty of the tumor itself.
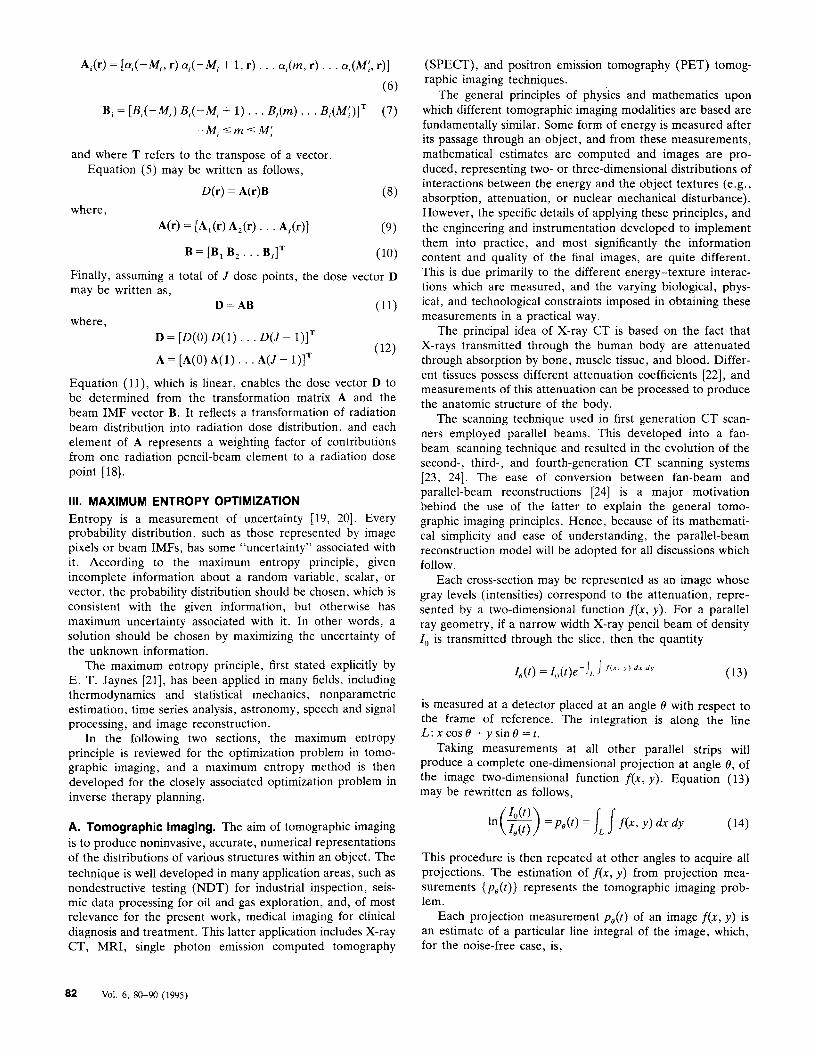
Figure 3 shows the initial dose distributions obtained using the projection technique discussed earlier. IMFs for the 11 beams are superimposed around the circumference of the images. Unfiltered and filtered projections are shown in Figures 3a and b, respectively. Filtering causes treatment Figure 3. Case 1. (a) Unfiltered and (b) filtered initial dose dis-
tributions obtained using the projection technique described in Section Ill. IMFs for the 11 beams are superimposed around the circumference of the image.
beams to become sharper at the edges, resulting in a higher uniform dose to the target volume. However, both results indicate an unacceptable dose within the critical region, as evidenced by the 50% contour.
Results obtained from application of the R-MART algo- rithm to the filtered projection scenario described in Figure 3 are shown in Figure 4a and b. In this case 56 iterations were required to achieve the termination criteria. However, a very accurate result is achieved, as evidenced by the dose-volume histograms, particularly for the tumor, the dose distribution for which is 100 * 2.04%.
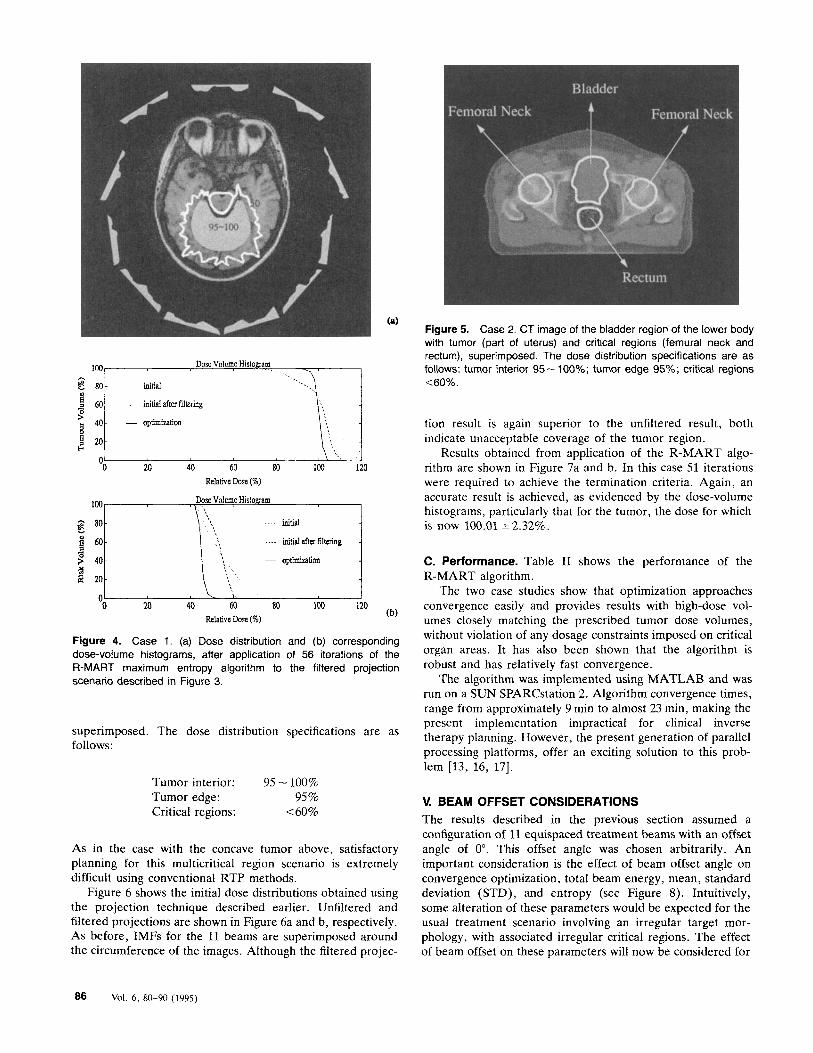
B- Case 2-cT Bladder Scan- Figure 5 depicts a CT image of the bladder region of the lower body with tumor (part of the uterus) and critical regions (femoral necks and rectum),
Figure 2. Case 1. MRI image of a section of the head with tumor and critical regions superimposed. The dose distribution specifica- tions are as follows: tumor interior 95-100%; tumor edge 95%; critical region <50%.
Vol. 6 , 80-90 (1995) 85
initial
0 20 40 60 ao 103 120 Relative Dose (%)
Dose Volume Histogram \ I
initial
i 60- > 40- Q $ 20-
0 20 40 60 80 1W 120 Relative Dose (%)
Figure 4. Case 1. (a) Dose distribution and (b) corresponding dose-volume histograms, after application of 56 iterations of the R-MART maximum entropy algorithm to the filtered projection scenario described in Figure 3.
superimposed. The dose distribution specifications are as follows:
Tumor interior: 95 - 100%
Critical regions: -40% Tumor edge: 95 %
As in the case with the concave tumor above, satisfactory planning for this multicritical region scenario is extremely difficult using conventional RTP methods.
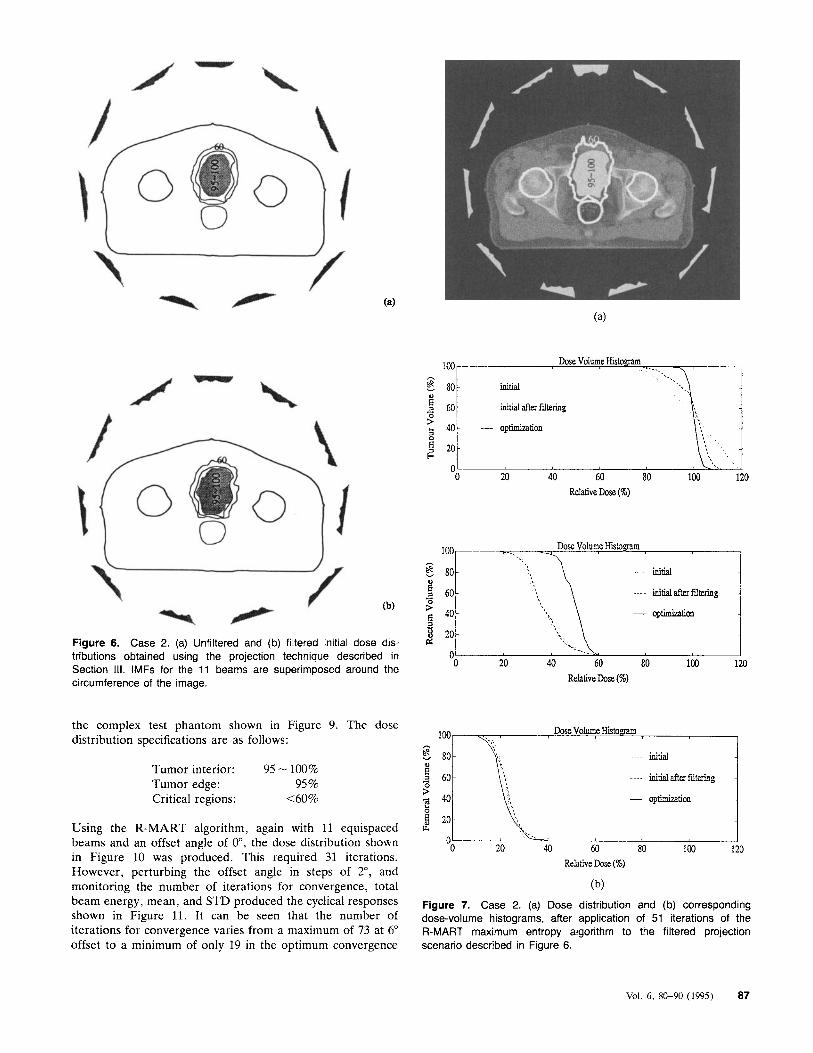
Figure 6 shows the initial dose distributions obtained using the projection technique described earlier. Unfiltered and filtered projections are shown in Figure 6a and b, respectively. AS before, IMFs for the 11 beams are superimposed around the circumference of the images. Although the filtered projec-
Figure 5. Case 2. CT image of the bladder region of the lower body with tumor (part of uterus) and critical regions (femural neck and rectum), superimposed. The dose distribution specifications are as follows: tumor interior 95 - 100%; tumor edge 95%; critical regions <60%.
tion result is again superior to the unfiltered result, both indicate unacceptable coverage of the tumor region.
Results obtained from application of the R-MART algo- rithm are shown in Figure 7a and b. In this case 51 iterations were required to achieve the termination criteria. Again, an accurate result is achieved, as evidenced by the dose-volume histograms, particularly that for the tumor, the dose for which is now 100.01 * 2.32%.
C. Performance. Table I1 shows the performance of the R-MART algorithm.
The two case studies show that optimization approaches convergence easily and provides results with high-dose vol- umes closely matching the prescribed tumor dose volumes, without violation of any dosage constraints imposed on critical organ areas. It has also been shown that the algorithm is robust and has relatively fast convergence.
The algorithm was implemented using MATLAB and was run on a SUN SPARCstation 2. Algorithm convergence times, range from approximately 9 min to almost 23 min, making the present implementation impractical for clinical inverse therapy planning. However, the present generation of parallel processing platforms, offer an exciting solution to this prob- lem [13, 16, 171.
V. BEAM OFFSET CONSIDERATIONS The results described in the previous section assumed a configuration of 11 equispaced treatment beams with an offset angle of 0". This offset angle was chosen arbitrarily. An important consideration is the effect of beam offset angle on convergence optimization, total beam energy, mean, standard deviation (STD), and entropy (see Figure 8). Intuitively, some alteration of these parameters would be expected for the usual treatment scenario involving an irregular target mor- phology, with associated irregular critical regions. The effect of beam offset on these parameters will now be considered for
86 Vol. 6 . 80-90 (1995)
-0 20 40 60 80 100 120 Relative Dose (%)
h c 80-
... a, 60- 0
(b) 3 4o - a , - 3 20- P: Figure 6. Case 2. (a) Unfiltered and (b) filtered initial dose dis-
0
initial
loo--- --..
---- initialafkffdtering -
- Opt i I I ld icm
the complex test phantom shown in Figure 9. The dose distribution specifications are as follows:
Tumor interior: 95 - 100%
Critical regions: <60% Tumor edge: 95 %
Using the R-MART algorithm, again with 11 equispaced beams and an offset angle of o", the dose distribution shown in Figure 10 was produced. This required 31 iterations. However, perturbing the offset angle in steps of 2", and monitoring the number of iterations for convergence, total beam energy, mean, and STD produced the cyclical responses shown in Figure 11. It can be seen that the number of iterations for convergence varies from a maximum of 73 at 6" offset to a minimum of only 19 in the optimum convergence
Dose Volume Histogram
initial
100
$ 80 ,.
---- initialafterfdtering
- optimi2aticm
L4
0 20 40 60 80 100 120 Relative Dose (%)
Figure 7. Case 2. (a) Dose distribution and (b) corresponding dose-volume histograms, after application of 51 iterations of the R-MART maximum entropy algorithm to the filtered projection scenario described in Figure 6.
Vol. 6, 80-90 (1995) 87
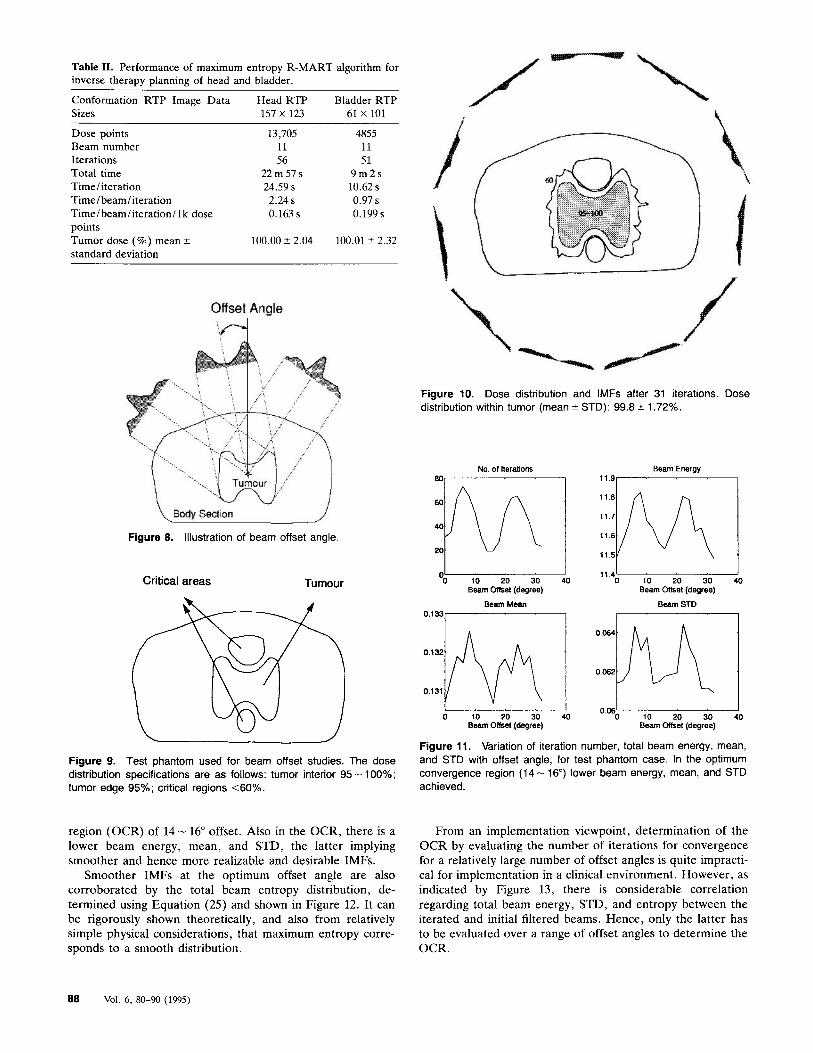
Table 11. Performance of maximum entropy R-MART algorithm for inverse therapy planning of head and bladder.
Conformation RTP Image Data Head RTP Bladder RTP Sizes 157 x 123 61 X 101
Dose points Beam number Iterations Total time Time / iteration Time/ beam/iteration Time/beam/iteration/ l k dose points Tumor dose (%) mean 2 standard deviation
13,705 11 56
22m57s 24.59 s 2.24 s 0.163 s
100.00 ? 2.04
4855 11 51
9 m 2 s 10.62 s 0.97 s 0.199 s
100.01 2 2.32
Offset Angle
Figure 10. Dose distribution and IMFs after 31 iterations. Dose distribution within tumor (mean * STD): 99.8 2 1.72%.
Figure 8. Illustration of beam offset angle.
Critical areas Tumour
Figure 9. Test phantom used for beam offset studies. The dose distribution specifications are as follows: tumor interior 95 - 100%; tumor edge 95%; critical regions <6O%.
region (OCR) of 14- 16" offset. Also in the OCR, there is a lower beam energy, mean, and STD, the latter implying smoother and hence more realizable and desirable IMFs.
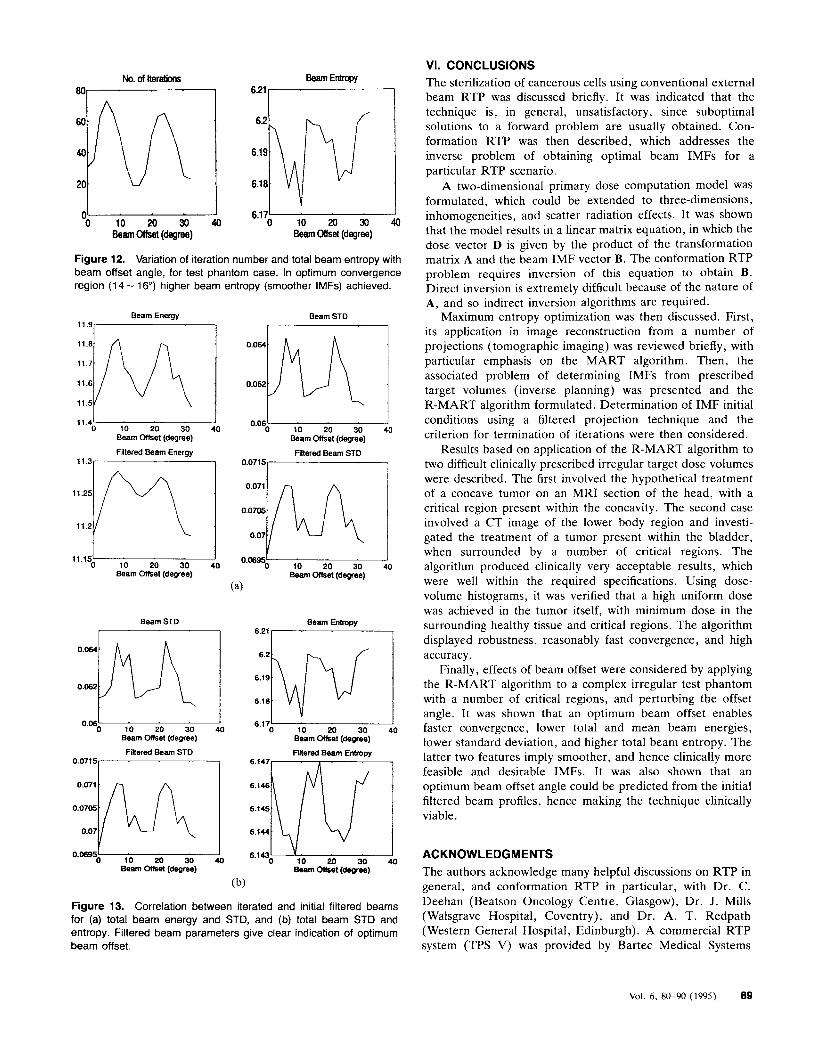
Smoother IMFs at the optimum offset angle are also corroborated by the total beam entropy distribution, de- termined using Equation (25) and shown in Figure 12. It can be rigorously shown theoretically, and also from relatively simple physical considerations, that maximum entropy corre- sponds to a smooth distribution.
NO. of Reraliom 80,
I '0 10 20 30
Beam ottset (degree)
Beam Mean 0.133, I
0 10 20 30 40 Beam Offset (degree)
Beam Energy
11.s7
11.4- 0 10 20 30
Beam Offset (degree)
Beam STD
0.06 0 10 20 30 40
Beam Offset (degree)
Figure 11. Variation of iteration number, total beam energy, mean, and STD with offset angle, for test phantom case. In the optimum convergence region (14- 16") lower beam energy, mean, and STD achieved.
From an implementation viewpoint, determination of the OCR by evaluating the number of iterations for convergence for a relatively large number of offset angles is quite impracti- cal for implementation in a clinical environment. However, as indicated by Figure 13, there is considerable correlation regarding total beam energy, STD, and entropy between the iterated and initial filtered beams. Hence, only the latter has to be evaluated over a range of offset angles to determine the OCR.
88 Vol. 6, 80-90 (1995)
No. of iteratiom Beam Entropy 1
0- 6.17- 0 1 0 2 0 3 0 4 0 0 10 20 30 40
Beam Olfset (degree) Beam Offset (degree)
Figure 12. Variation of iteration number and total beam entropy with beam offset angle, for test phantom case. In optimum convergence region (1 4 - 16") higher beam entropy (smoother IMFs) achieved.
Beam Energy
ll.g-
11.4' 1 0 10 20 30 40
Beam offset (degree)
Filtered Beam Enerm
Beam STD
Beam STD
0 10 20 30 40 Beam Offset (degree)
Filtered Beam STD 0.0715,
0.0695- 0 10 20 30 40
Beam Offset (degree)
Beam Entmpy 6.21 1-1
0.06 6.17' 0 10 20 30 40 0 10 20 30 40
Beam offset (degree) Beam offset (deqee)
Finered Beam STD
0.07'57 Fllered Beam Entropy
6.147
6.144
0.06%- 6.1430- 0 10 20 30 40 10 20 30 40
Beam offset (degree) Beem offset (degree)
(b)
Figure 13. Correlation between iterated and initial filtered beams for (a) total beam energy and STD, and (b) total beam STD and entropy. Filtered beam parameters give clear indication of optimum beam offset.
VI. CONCLUSIONS The sterilization of cancerous cells using conventional external beam RTP was discussed briefly. It was indicated that the technique is, in general, unsatisfactory, since suboptimal solutions to a forward problem are usually obtained. Con- formation RTP was then described, which addresses the inverse problem of obtaining optimal beam IMFs for a particular RTP scenario.
A two-dimensional primary dose computation model was formulated, which could be extended to three-dimensions, inhomogeneities, and scatter radiation effects. It was shown that the model results in a linear matrix equation, in which the dose vector D is given by the product of the transformation matrix A and the beam IMF vector B. The conformation RTP problem requires inversion of this equation to obtain B. Direct inversion is extremely difficult because of the nature of A, and so indirect inversion algorithms are required.
Maximum entropy optimization was then discussed. First, its application in image reconstruction from a number of projections (tomographic imaging) was reviewed briefly, with particular emphasis on the M A R T algorithm. Then, the associated problem of determining IMFs from prescribed target volumes (inverse planning) was presented and the R-MART algorithm formulated. Determination of IMF initial conditions using a filtered projection technique and the criterion for termination of iterations were then considered.
Results based on application of the R-MART algorithm to two difficult clinically prescribed irregular target dose volumes were described. The first involved the hypothetical treatment of a concave tumor on an MRI section of the head, with a critical region present within the concavity. The second case involved a CT image of the lower body region and investi- gated the treatment of a tumor present within the bladder, when surrounded by a number of critical regions. The algorithm produced clinically very acceptable results, which were well within the required specifications. Using dose- volume histograms, it was verified that a high uniform dose was achieved in the tumor itself, with minimum dose in the surrounding healthy tissue and critical regions. The algorithm displayed robustness, reasonably fast convergence, and high accuracy.
Finally, effects of beam offset were considered by applying the R-MART algorithm to a complex irregular test phantom with a number of critical regions, and perturbing the offset angle. It was shown that an optimum beam offset enables faster convergence, lower total and mean beam energies, lower standard deviation, and higher total beam entropy. The latter two features imply smoother, and hence clinically more feasible and desirable IMFs. It was also shown that an optimum beam offset angle could be predicted from the initial filtered beam profiles, hence making the technique clinically viable.
ACKNOWLEDGMENTS The authors acknowledge many helpful discussions on RTP in general, and conformation RTP in particular, with Dr . C. Deehan (Beatson Oncology Centre, Glasgow), Dr . J. Mills (Walsgrave Hospital, Coventry), and Dr. A. T. Redpath (Western General Hospital, Edinburgh). A commercial RTP system (TPS V) was provided by Bartec Medical Systems
Vol. 6 , 80-90 (1995) 89
Ltd. , Farnborough. MRI and CT data were provided by the Insti tute of Neurology, National Hospital, London, and Walsgrave Hospital , Coventry, respectively. Dr. Yuan grate- fully acknowledges the support of a Sino-British Friendship Sponsorship, and a University of Strathclyde Faculty Re- search Fellowship.
REFERENCES 1. R. F. Mould, Radiotherapy Treatment Planning, 2nd edn. (Adam
Hilger Ltd. Bristol), 1983. 2. S. Webb, The Physics of Three-Dimensional Radiation Therapy:
Conformation Radiotherapy, Radiosurgery and Treatment Plan- ning (IOP Publishing Ltd., Bristol and Philadelphia), 1993.
3. A . Brahme, “Similarities and differences between radiotherapy optimisation and tomographic imaging,” Int. J . h a g . Syst. Technol. (this issue).
4. S. Webb, “Optimisation of conformal radiotherapy dose dis- tributions by simulated annealing: 2. Inclusion of scatter in the 2D technique,” Phys. Med. Biol. 36, 1227-1237 (1991).
5 . A. Cormack, “Introduction,” Int. J . h a g . Syst. Technol. (this issue).
6. T. Bortfeld and A. Boyer, “Back projection and steepest des- cent,” Int. J . Imag. Syst. Technol. (this issue).
7. T. Holmes and R. Mackie, “Tomotherapy,” Int. J . h a g . Syst. Technol. (this issue).
8. D. Leftopoulos, “Singular value decomposition,” Int. J . h a g . Syst. Technol. (this issue).
9. S. Webb, “Simulated annealing,” Int. J . Imag. Syst. Technol. (this issue).
10. B. Lind and A. Brahme, “Pencil beam and kernel based meth- ods,” Int. J . Imag. Syst. Technol. (this issue).
11. R. Vance, W. A. Sandham, and T. S. Durrani, “Optimisation of beam profiles in conformal therapy using genetic algorithms,” Proceedings of World Congress on Med. Phys. and Biomed. Eng., 21-26 August 1994, Rio de Janeiro, Brazil. Abstract in Physics in Medicine and Biology 39a, 518 (1994).
12. Y. Yuan, W. A. Sandham, T. S. Durrani, J . A. Mills, and C. Deehan, “Application of Bayesian and maximum entropy optimi- sation to conformation radiotherapy treatment planning,” Appl. Signal Proc. 1, 20-34 (1994).
13. S. Scarth, W. A. Sandham, and R. Wilkinson, “Conformation radiotherapy optimisation using distributed simulated annealing,” in Proceedings of 7th Int. Conf. of the European Assoc. for Sig. Proc. (EUSIPCO-94), Edinburgh, UK, 13-16 September 1994.
14. S. Webb, “Optimisation of conformal radiotherapy dose dis- tributions by simulated annealing,” Phys. Med. Biol. 34, 1349- 1369 (1989).
15. T. Bortfeld, J. Burkelbach, R. Boesecke, and W. Schlegel, “Methods of image reconstruction from projections applied to conformation radiotherapy,” Phys. Med. Biol. 35, 1423-1439 ( 1990).
16. W. A. Sandham, R. Vance, Y. Yuan, C. Deehan, and J. Mills, “Transputer implementation of a 3-D radiotherapy treatment planning algorithm,” in Transputer Applications ’93. R. Grebe et al., Eds., 10s Press, Amsterdam, 1993, pp. 1298-1310.
“Transputer implementation of a 3-D radiotherapy treatment planning algorithm,” in Transputer Applications ’93. R. Grebe et al., Eds., 10s Press, Amsterdam, 1993, pp. 1298-1310.
17. T. S. Durrani, W. A. Sandham, J. J. Soraghan, and S . Forbes (Eds.), Applications of Transputers 3 (10s Press, Amsterdam), 1991.
18. A. Boyer and E. Mok, “A photon dose distribution model employing convolution calculations,” Med. Phys. 12, 169-177 (1985).
19. J. N. Kapur, Maximum Entropy Models in Science and Engineer- ing (John Wiley & Sons, New York), 989.
20. J . N. Kapur and H. K. Kesavan, Entropy Optimization Principles with Applications (Academic Press, New York), 1992.
21. E. T. Jaynes, “Information theory and statistical mechanics,” Phys. Rev. 106, 620-630 (1957).
22. Z . H. Cho and I. S. Ahn, “Computer algorithm for the tomo- graphic image reconstruction with x-ray transmission scans,” Computers Biomed. Res. 8, 8-25 (1974).
23. A. R. Robb (Ed.), Three-Dimensional Biomedical Imaging (Vol. I ) (CRC Press, New York), 1985.
24. G . T. Herman, Image Reconstruction from Projections, the Fundamentals of Computerized Tomography (Academic Press, New York), 1980.
25. J . Radon, “Uber die bestimming von funktionen durch ihre integralwerte langs gewisser mannigffaltigkeiten,” Sachsiche Berichte Akademie der Wissenschaften 69, 262-277 (1917).
26. S. R. Deans, The Radon Transform and Some of its Applications (John Wiley & Son, New York), 1983.
27. G . T. Herman (Ed.), Image Reconstruction from Projections- Implementation and Applications (Springer-Verlag, New York), 1979.
28. A. K. Louis and F. Natterer, “Mathematical problems of com- puterised tomography,” Proc. IEEE 71, 379-389 (1983).
29. Y. Censor, “Finite series-expansion reconstruction methods,” Proc. IEEE 71, 409-419 (1983).
30. G. T. Herman, “Application of maximum entropy and Bayesian optimization methods to image reconstruction from projections,” in Maximum Entropy and Bayesian Methods in Inverse Problems. C . R. Smith and W. T. Grandy Jr., Eds., D. Reidel, Holland,
31. B. Buck and V. A. Macaulay (Eds.), Maximum Entropy in Action (Clarendon Press, Oxford), 1991.
32. Y. Yong, New Extensions for Tomographic Imaging and Con- formation Radiotherapy Treatment Planning, Ph.D. thesis, Uni- versity of Strathclyde, Glasgow, Scotland, UK, 1993.
33. R. Gordon, R. Bender, and G. T. Herman, “Algebraic recon- struction techniques (ART) for three-dimensional electron micro- scopy and x-ray photography,” J. Theor. Biol. 29, 471-481 (1970).
34. A. Lent, “A convergent algorithm for maximum entropy image restoration, with a medical x-ray application,” in Image Analysis and Evaluation (SPSE Conf. Proc.) R. Shaw, Ed., Washington, DC, Society of Photographic Scientists and Engineers, 1977, pp.
1985, pp. 319-338.
249-257.
90 Vol. 6 , 80-90 (1995)