Embed Size (px)
Citation preview

Preliminary and Incomplete
Conforming corporate book income and corporate taxable
income: evidence of possible information loss in the EU
Willem Buijink *
Christos Grambovas #
Current version: 22/5/2006
*Department of Accountancy, FEB, Universiteit van Tilburg
#[email protected], CAIR, Manchester Business School,
University of Manchester:
2
Abstract
We examine the question of whether increased conformity between (consolidated)
corporate book income and taxable income would lead to a loss of information to
investors in the UK and Germany. Current European Commission initiatives to create
a common corporate income tax base based on IFRSs may affect the reporting of
book income in the future in the EU (European Union). Moreover, in the US several
observers, dismayed by the discrepancies between corporate book income and
corporate taxable income in the US, have begun to call for 'closing the book-tax
accounting gap'. While these observers point at benefits resulting from such a step, it
potentially has costs as well. This paper empirically investigates the potential
information loss of aligning consolidated book income and taxable income in two
large EU member states.

3
1. Introduction
This paper is motivated by two developments. The first development is
European. The European Commission is currently studying the possibility of a
common EU (European Union) consolidated corporate income tax base. The material
available on the European Commission (EC) Taxation website suggests that serious
thought is given to basing such a common corporate income tax base in the EU on
IFRS based pre-tax book income. This may lead to an alignment between corporate
book and taxable income across the EU.
The second development is increasing advocacy in the US for the abolishment
of the non-alignment of corporate book income and corporate taxable income (Desai,
2006, Whitaker, 2005). The argument for corporate book-taxable income alignment is
based on a double worry about corporate earnings management, managing book
income upward, and corporate tax minimization, managing taxable income
downwards. This discussion may easily carry over to Europe.
While a case for the benefits of using IFRS based pre-tax income for
corporate income taxation, and for a greater alignment of book and taxable income to
fight both earnings management and corporate tax evasion can be made, it also
important to consider the potential costs of stricter alignment. This paper attempts to
do that in the context of the EU by measuring the information loss that would
potentially result from corporate book-taxable income conformity. Further, it should
be noted that this study builds on, and adds to, earlier US research, most notably
Hanlon, Kelley and Shevlin (2005) – HKS – and Hanlon and Shevlin (2005) – HS.
We focus on two EU member states, the UK and Germany. Both are large EU
economies. But more importantly we also want to 'control' for within EU differences
on the outcome of our analysis. The UK and Germany are institutionally different. In
Germany at the individual company (legal entity) level there is book-tax conformity.
The UK has greater share ownership dispersion and also more loan financing through
the capital market (bonds). There are also corporate governance differences, notably
more employee involvement in Germany. Moreover, Germany has a stakeholder

4
orientated system while the UK has a shareholder oriented market, which affects the
power balance between individual and institutional shareholders.
We study the effect of book-tax conformity by looking at the relative
information content of corporate book income and estimated corporate taxable income
in the case of UK and German non-financial firms in the period 1998-2003. We find
that in both Germany and the UK there is a loss of information when the corporate
taxable income is considered as the income figure instead of the corporate book
income.
2. Hypothesis development
Countries differ in the extent to which determination of a company's book
income, reported in GAAP based financial statements, is different from the
determination of the same company's taxable income for the same period. Why this is
the case it is not clear. Nobes and Schwencke (2006) speculate about this in general
and examine the case of Norway. Desai (2006) discusses the history of the difference
between book and taxable income in the US
A standard defence, reason, for making a distinction between a company's
(pre-tax) book and taxable income (non-alignment) is that the two income numbers
simply serve different purposes. Both are summary measures of the financial
performance of a firm. But book income of a corporation is calculated under (local)
GAAP to help firm stakeholders to make decisions with regard to the company.
Whereas that company's taxable income is determined by the tax authorities in order
to raise government revenue equitably and/or to induce desirable company behaviour.
Keeping these measures separate therefore has benefits.
However, given non-alignment, companies have incentives to report higher
than 'true' (pre-tax) book income and lower than 'true' taxable income. Within limits
of course, because both measures derive from the same underlying accrual based
financial accounting system, and also because the tax authorities can also observe

5
book income (see Mills, 1998). Nonetheless, to the extent that this happens, it
represents a potential cost of non-alignment.
Presumably, in the countries that we look at below perceived net benefits have
in the UK led to non-alignment and perceived net-costs have led to alignment in
Germany (but see Nobes and Schwencke, 2006, for an alternative story).
Two recent developments warrant further, preferably empirical, attention to
the benefits and costs of the choice between non-alignment and alignment. The first
development is within the EU efforts for corporate income tax harmonisation. An
important first step here would be the creation of a common corporate income tax
base across EU member states. The European Commission has recently taken the
initiative to create a Study Group with a mandate to develop ideas for the creation of a
common corporate income tax base in the EU. In the documentation available on the
EC taxation website it is clear that basing such a common corporate income tax base
on IFRSs is perceived as a prominent option. Indeed, from 2005 IFRSs basically
constitute EU GAAP for listed EU companies. Using IFRSs to base a within-EU
common corporate income tax base on, immediately raises the issue of (non-)
alignment and the related benefits and costs.
The second development is a discussion taking place in the US. Observing a
widening gap between aggregate corporate profits (book income) and corporate
taxable income (as reported to the US tax authorities) has led to a suspicion the
companies use the non-aligned corporate book-taxable income reporting system in the
US opportunistically, i.e. that it generates both (book) earnings management and
corporate taxable income avoidance. For forceful articulations of this view see
Whitttaker (2005) and Desai (2006). This has led to several suggestions for remedies.
One is to make companies also publish their corporate income tax returns (which are
currently not available to outside stakeholders of companies). Another is to mandate
more information on the reconciliation between book and taxable income in the
published financial statements. A third idea is to do away with non-alignment
altogether. The same concerns have so far not been raised within EU, but given within
EU financial reporting 'accidents', the US discussion could easily find its way to the
EU.

6
We feel that both developments create the need to generate more empirical
evidence of the benefits and costs of (non-) alignment also in the EU. This paper
focuses on the potential costs of non-alignment. Considering an introduction of
alignment between book and taxable income, it can be expected that given the
revenue/behaviour influencing role of corporate income taxation, aligned book
income will become much like what currently is taxable income (see on this Hanlon,
Shevlin, 2005, p.5).
Hence, to gauge the potential information loss (a cost) to outside stakeholders
of alignment, below we attempt to document the relative information content, for one
prominent, class of company stakeholders, investors, of company book income and
taxable income.
We use UK and German data. Germany's corporate income taxation is aligned
at the legal entity level, in the UK this is not the case. We look at consolidated book
and taxable income. At the consolidated level book and taxable income are not
aligned also in Germany, but effects of the underlying aligned system may be
observable.
We expect that in both countries book income will exhibit larger relative
information content then taxable income, and that the difference will be larger in the
UK. That is, we predict that taxable income under non-alignment will be the less
informative number.
3. Research Design and Data Selection
The main objective of this study is to assess which income measure explains
better the security returns, i.e. whether book or taxable income are more relevant for
investors. To this end we will examine the relative and the incremental information
content of the two income measures to the market, by regressing the two figures on
the cross-sectional variation of equity returns. First, we will assess the relative
7
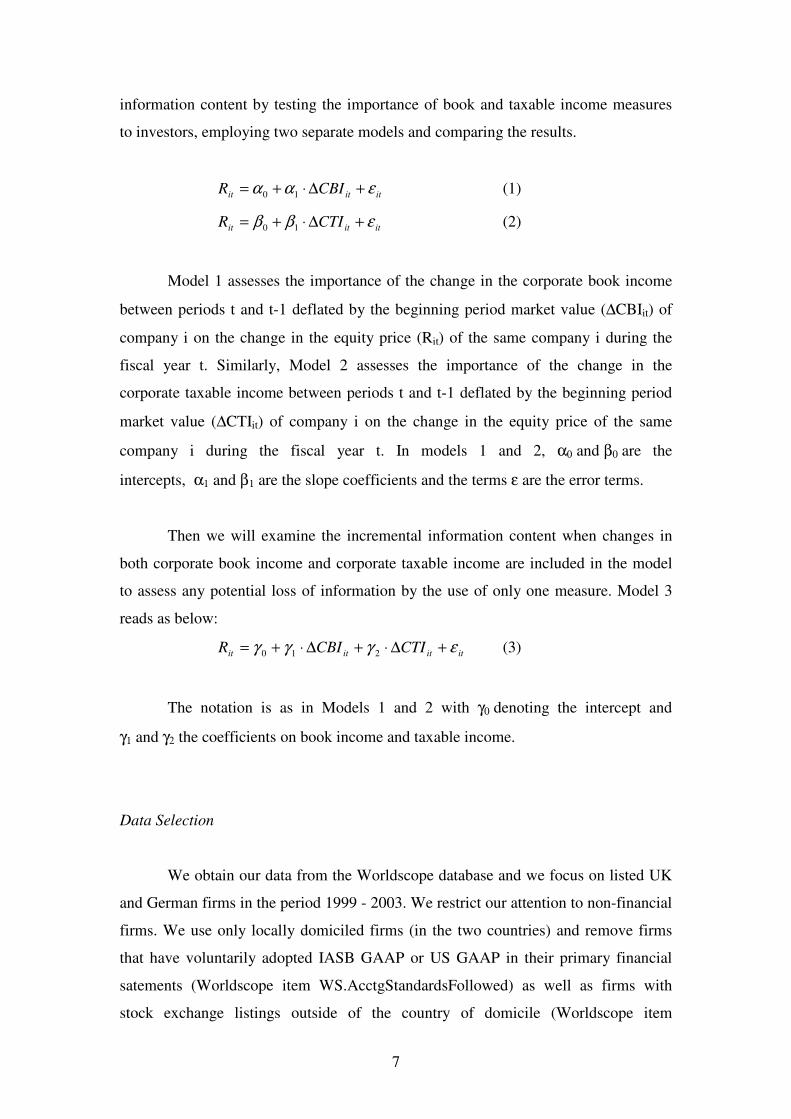
information content by testing the importance of book and taxable income measures
to investors, employing two separate models and comparing the results.
ititit CBIR εαα +∆⋅+= 10 (1)
ititit CTIR εββ +∆⋅+= 10 (2)
Model 1 assesses the importance of the change in the corporate book income
between periods t and t-1 deflated by the beginning period market value (∆CBIit) of
company i on the change in the equity price (Rit) of the same company i during the
fiscal year t. Similarly, Model 2 assesses the importance of the change in the
corporate taxable income between periods t and t-1 deflated by the beginning period
market value (∆CTIit) of company i on the change in the equity price of the same
company i during the fiscal year t. In models 1 and 2, α0 and β0 are the
intercepts, α1 and β1 are the slope coefficients and the terms ε are the error terms.
Then we will examine the incremental information content when changes in
both corporate book income and corporate taxable income are included in the model
to assess any potential loss of information by the use of only one measure. Model 3
reads as below:
itititit CTICBIR εγγγ +∆⋅+∆⋅+= 210 (3)
The notation is as in Models 1 and 2 with γ0 denoting the intercept and
γ1 and γ2 the coefficients on book income and taxable income.
Data Selection
We obtain our data from the Worldscope database and we focus on listed UK
and German firms in the period 1999 - 2003. We restrict our attention to non-financial
firms. We use only locally domiciled firms (in the two countries) and remove firms
that have voluntarily adopted IASB GAAP or US GAAP in their primary financial
satements (Worldscope item WS.AcctgStandardsFollowed) as well as firms with
stock exchange listings outside of the country of domicile (Worldscope item

8
WS.Exchange). We also only use firms that provide consolidated financial statements
(for reasons explained above). A firm that meets all these requirements in each year in
the period considered enters the sample. This process created a sample of 619 German
and 2,892 UK firms.
We calculate corporate book income as consolidated pre-tax book income
(Worldscope item WS.IncomeBefIncomeTaxes) minus minority interest (Worldscope
item WS.MinorityInterestIncomeStmt). We estimate corporate taxable income as the
consolidated current tax expense divided in each year by the top corporate income tax
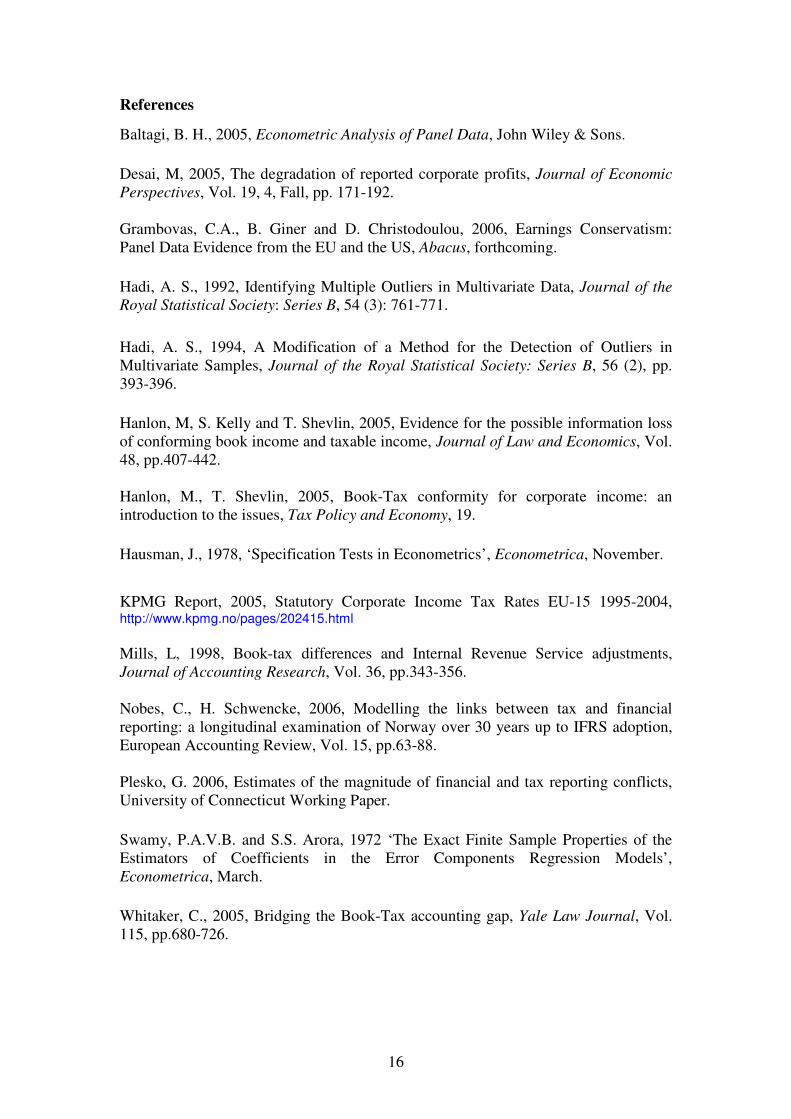
rate (STR; statutory tax rate) for the year in both countries. Table 1 give these top
corporate tax rates by year and by country in the years considered. We arrive at the
consolidated tax expense by subtracting the change in deferred taxes (Worldscope
item WS.DeferredTaxesBalSht) from the total tax expense (Worldscope item
WS.IncomeTaxes). In Worldscope the item that we use for deferred taxes represents
the accumulation of taxes which are deferred as a result of timing differences between
reporting sales and expenses for tax and financial reporting purposes and it is adjusted
to include deferred tax debits.
Table 1 about here
In addition, it should be pointed out that reporting about corporate income tax
in both countries is such that the tax expense excludes permanent book-tax differences
but includes timing book-tax income differences. Hence the correction for the change
deferred taxes to arrive at an estimate of taxed paid and of taxable income.
Note also that taxes actually paid for a given year may well differ from our
estimate. But (see on this also HKS 2005), given the confidentiality of company tax
returns investors also can only estimate taxes actually paid by a company for a given
year and its taxable income. Hence, it makes sense to use the estimated (taxes paid
and) taxable income number in our tests below.
Companies in our sample may operate in various countries and face different
STRs. However, both the UK and Germany tax companies on world wide income, in
which case the use of UK and German STRs top corporate income tax rate is sensible.
9
However, as a sensitivity analysis we will also redo our analyses for a subset of
domestically operating firms in the two countries. We use international sales
(Worldscope item WS.InternationalSales) to identify domestically operating
companies. Finally, in the information content tests below we use market adjusted
contemporaneous fiscal year end returns calculated by deducting beginning-period
share price from end-period equity price with the result deflated by the former.
Furthermore, in large parts of the previous literature the common rule is to
remove outliers at the 1% up and down of the sample. However, this would create
discontinuity in the panel structure of our dataset (large number of panels-firms for a
number of years) and it would restrict the panel estimation. Instead, following
Grambovas, Giner and Christodoulou (2006), we have decided to eliminate outliers
based on the behaviour of the firm-mean in each panel in such way that if the mean
return and mean income measures for firm i and time t appear as a multivariate
outlier, then we remove all the observations of the specific firm-panel. In order to
achieve that we employ the Hadi multivariate outlier detection technique as it has
been articulated by Hadi (1992 & 1994).
In section 4 we first present and analysis of the descriptive statistics and we
present results with regard to the evolution in the book-taxable income gap in the UK
and Germany over the period considered.
4. Results
4.1. Descriptive results
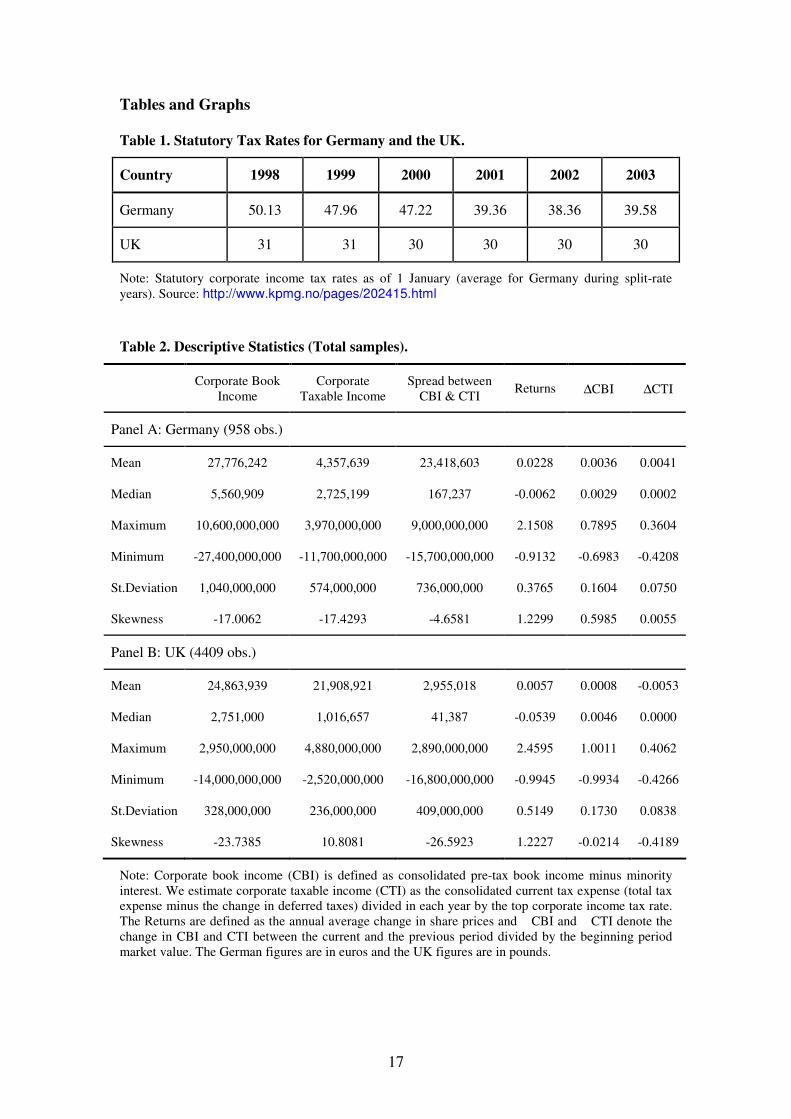
In Table 2, below, one can observe the descriptive statistics of the variables
we examine in this study. The mean and the median of the corporate book income
measure are higher than the relevant figures of the corporate taxable income measure
in both countries. This was expected as the two figures are used for different purposes
and the management of the companies may be tempted to report higher book income
(to attract investors) and lower taxable income (to avoid taxation) as it is described
above. It appears that for German companies the average spread between the two
10
income measures is much higher than the equivalent spread for the UK companies
(note the difference in the currencies of the reported figures – euros and pounds). At
the same time the standard deviation of both income figures is higher in the case of
Germany, indicating the higher variation within the sample for reported and taxable
income when comparing with the UK. Finally, it should be noticed that on average
German companies have higher equity returns than companies based in the UK.
Table 2 about here
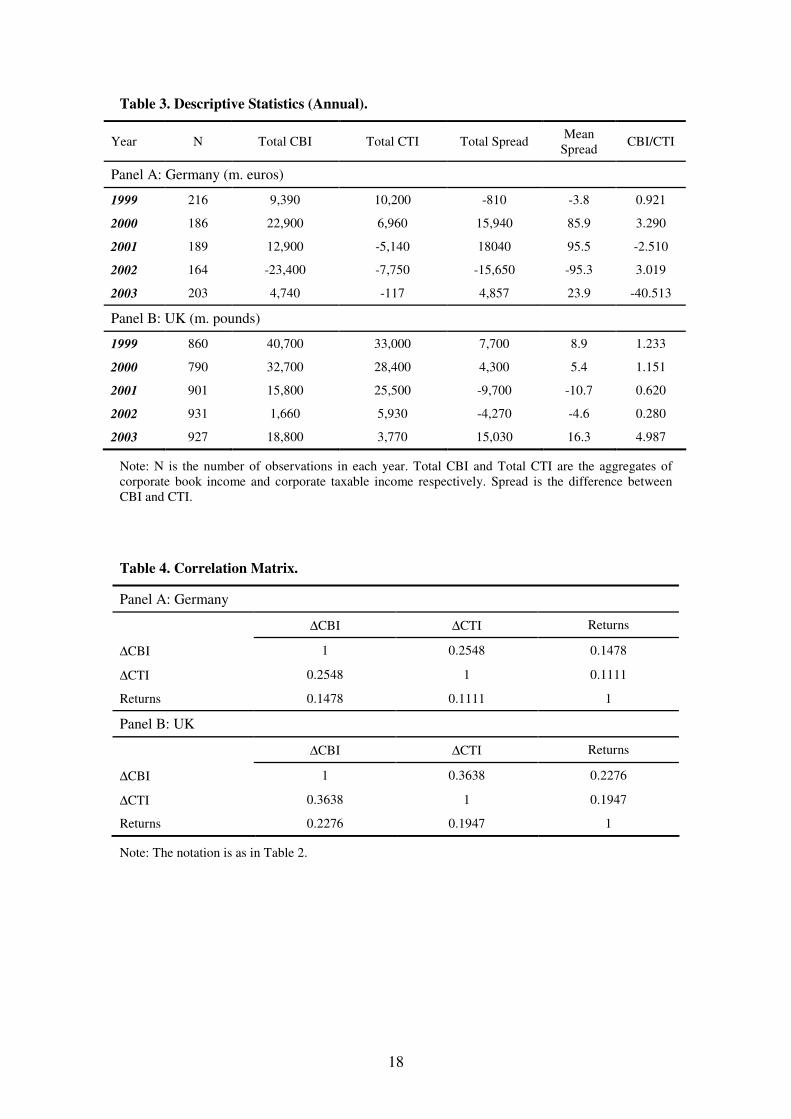
Furthermore, in Table 3 the annual descriptive statistics are presented. It can
be seen that the total corporate book income is in most of the cases higher than the
total corporate taxable income resulting to a positive total (and mean) spread between
the two. However, in four cases the total taxable income is higher which leads to a
negative spread. Although not expected, the relevant result may be explained by
specific events that have occurred in this particular period. For example, in the case of
Germany in 1999 the negative spread might be the result of the burst of the stock
exchange bubble that took place during that year, while the negative spread for the
UK companies in 2001 may be related to the financial crisis that followed the 11th
of
September events (as it is also suggested by HKS 2005, p.19). Both events may have
resulted to a ‘big-bath’, i.e. the reporting of much lower book income figures than
expected ‘blamed’ on the crises in an effort to promote higher future earnings.
Table 3 about here
In the last column of Table 3 one can observe the ratio between the total
corporate book income and the total corporate tax income. In two cases we have a
negative ratio that is produced when the two income measures have a different sign.
These two years (both for German companies) report low positive book income
figures and at the same time negative taxable income figures. This may imply the
existence of earnings management where the reported book income figures were
managed to be just above zero and the taxable income figures just below zero for
reason discussed above and developed widely in the earnings management literature,
especially for the case of Germany. When we compare the absolute ratios in Germany
and the UK with the results reported by HKS (1995) for the US we can see that the
11
UK and US results appear to be very similar while the ratios reach much higher
figures in Germany.
Finally, the correlation matrices, presented in Table 4 below, show the low
correlation between the returns and the income measures. The level of correlation
appears to be similar in the UK and the US, when we compare our results with those
of HKS 2005. On the other hand, for German companies equity returns and corporate
income is less correlated. The two income measures are more correlated with each
other without, however, reaching high levels of correlation.
Table 4 about here
4.2. Methodology Selection
Before engaging in the tests regarding the relevant and incremental
information content the appropriate methodology should be selected. The choice of
pooled OLS techniques appears to be problematic since the structure of the sample is
such that we have different companies (panels) for a number of years. If we just pool
the whole sample and test it we would ignore the specific firm characteristics that are
very important in order to obtain and explain the results. Therefore, we should employ
panel data methodology that would account for differences among firms and
differences during time. Baltagi (2005) lists a number of reasons why one should use
panel data techniques with the most relevant in our case being that panel data: are
“controlling for individual [firm] heterogeneity”, “give more variability, less
collinearity among the variables, more degrees of freedom and more efficiency” (pp.
4-5).
In addition to our intuition of employing panel data methodology due to the
structure of our sample we will perform tests and diagnostics in order to examine
whether the panel data methods are indeed superior to the pooled OLS estimation.
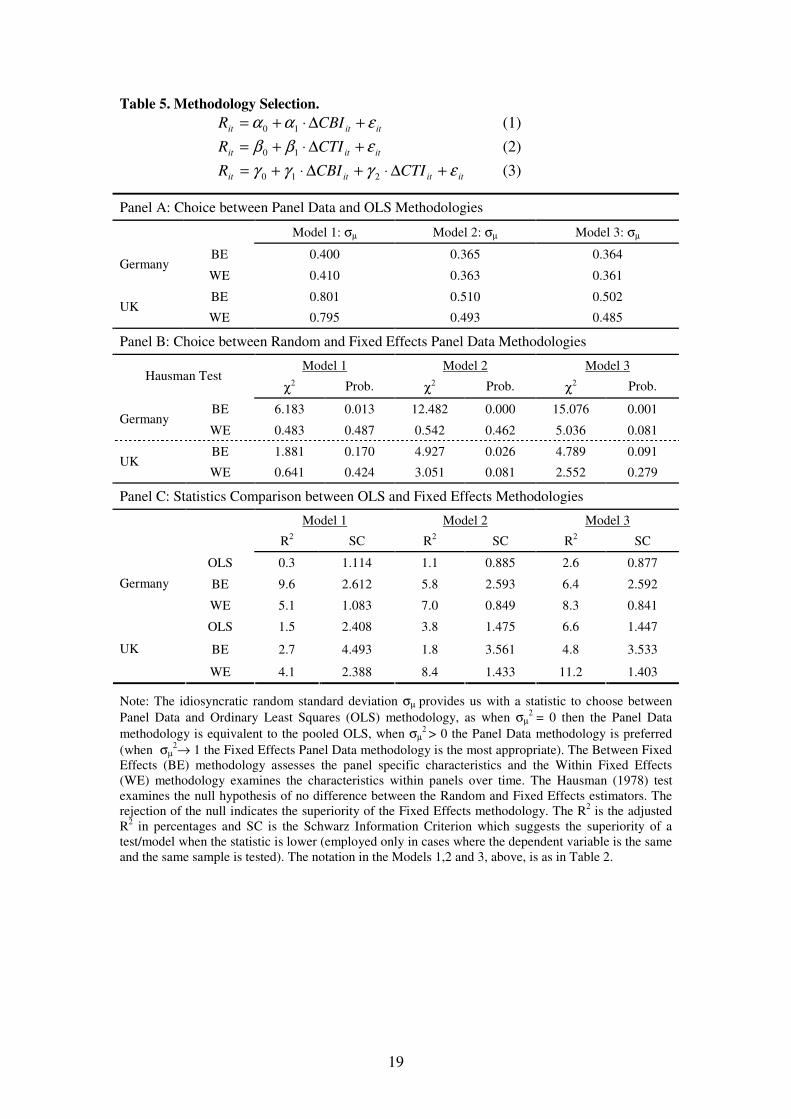
Initially, we test the potential choice between OLS and panel data methodologies by
employing the idiosyncratic standard deviation σµ from the random effects panel data
model that we choose to test using the Swamy and Arora (1972) estimator of
12
component variances. According to this diagnostic when σµ2 = 0 the panel data
methodology is not superior to the pooled OLS, when σµ2
> 0 the panel data (random
effects) methodology is preferred and when σµ2→ 1 the fixed effects panel data
methodology is the most appropriate. The results are presented in Table 5 below for
tests including both period (WE) and cross-sectional (BE) random effects.
Table 5 about here
The results of the tests, presented in Panel A of the table, suggest the
superiority of the panel data methods to the pooled OLS in all cases, as the standard
deviation σµ appears to be in all cases above zero. Therefore, we will use the panel
data methodology for our study. At this point we should choose the most appropriate
panel data technique and namely to choose between fixed and random effects. In the
former case, the unobservable firm-specific effects are assumed to be fixed when in
the latter case they are assumed to be random. In order to assess which of the two
methodologies is the appropriate for our sample, we will perform the Hausman (1978)
χ2−test that examines the null hypothesis of no difference between the random and
fixed effects estimators. The rejection of the null indicates the superiority of the fixed
effects methodology. The results can be seen in Panel B of the table 5 above and they
include both period (WE) and cross-sectional (BE) fixed and random effects. We
observe that in most cases the null hypothesis is rejected and thus, the fixed effects
methodology is preferable to the random effects one.
Furthermore, we present at Panel C of table 5 the adjusted R2s and the
Schwarz Information Criteria1 as diagnostics for a choice between the Between fixed
effects methodology (that assesses the panel specific characteristics) and the Within
fixed effects methodology (that examines the characteristics within panels over time).
For comparison and verification reasons we present the relevant diagnostics from the
pooled OLS tests as well. We see that in five out of the six cases the adjusted R2s are
higher and in all cases the Schwarz criteria are lower for the within-effects estimation.
Therefore, we select the fixed effects methodology as the appropriate one and in
1 Note that the Schwarz Information Criterion suggests the superiority of a test/model when the statistic
is lower and it can be employed only in cases where the dependent variable is the same among
tests/models and the same sample is tested.

13
particular the within-effects estimation. Next, we will perform the selected estimation
techniques for the total sample, while we will also present annual results based on
cross-sectional least squares methods in order to examine the relative and incremental
information content in our study.
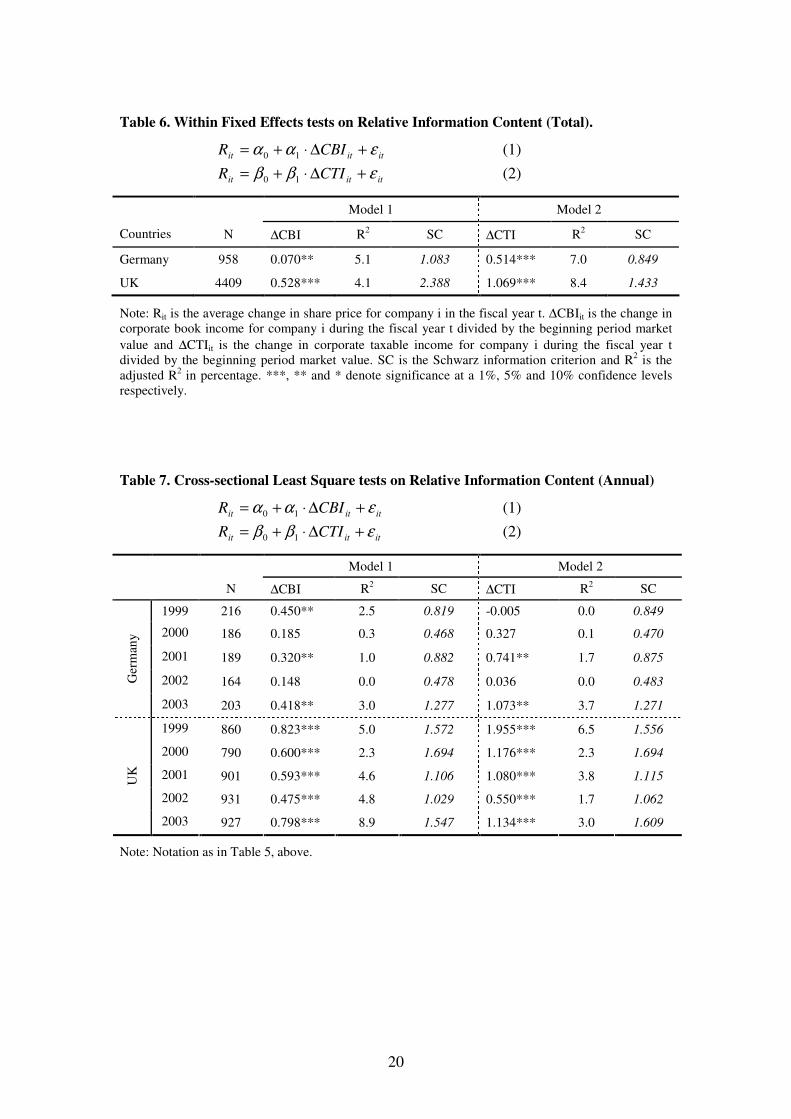
4.3. Relative information content tests
The results of the within-effects tests on the relative information content are
presented in Table 6, below. The results indicate the importance of both income
measures in both countries. The coefficients on corporate income (accounting and
taxable) are higher for UK firms than for German firms with the one on taxable
income higher than the one on book income in both countries. Comparing the adjusted
R2s and the Schwarz information criteria it appears that Model 2 outperforms Model 1
suggesting the high importance of taxable income to the investors.
Table 6 about here
In Table 7, below, one can observe the annual results of the cross-sectional
least squares tests on the relative information content. In the case of Germany few
coefficients are statistically significant and the adjusted R2s fall dramatically probably
due to the least-squares technique employed and the smaller samples. On the contrary,
for the UK the results appear to verify the general results presented in table 6 with
both book and taxable income statistically significant in all occasions.
Table 7 about here
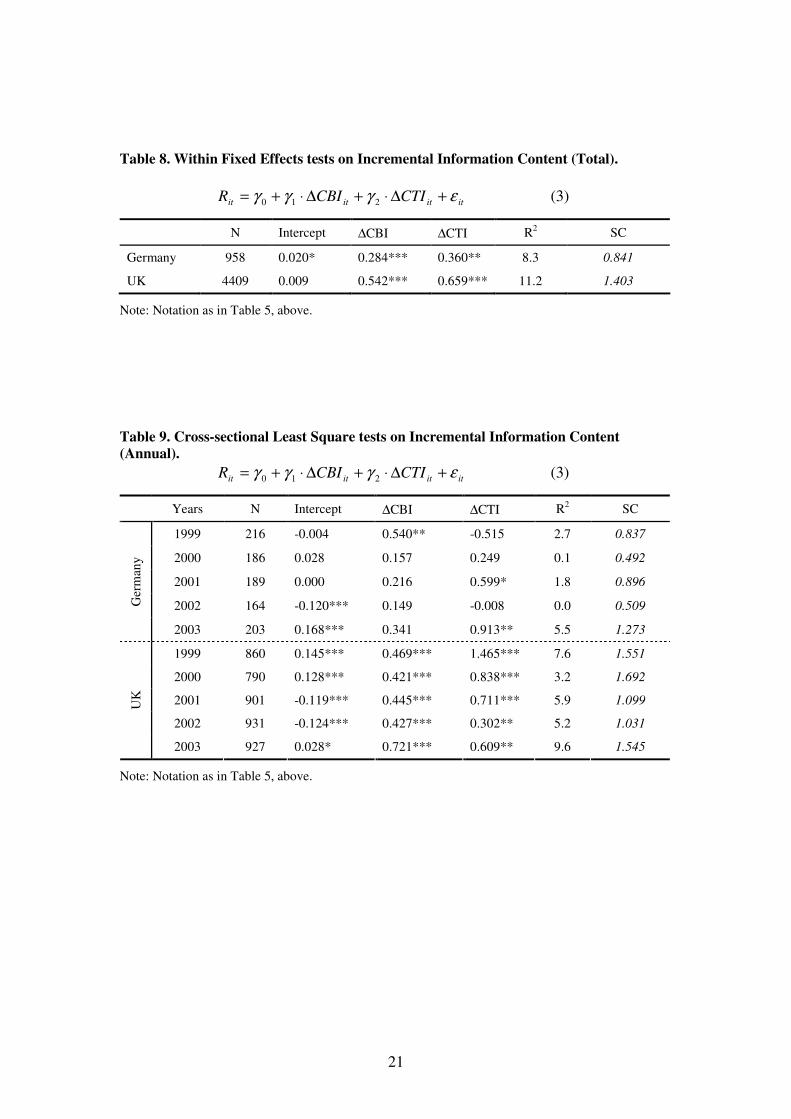
4.4. Incremental information content tests
Further, we turn on the analysis of the incremental information content with
the results of the within-effects estimation for the total samples in both countries
presented in Table 8. The evidence supports the existence of an information loss in
the case of total alignment between the two income measures as both book and
14
taxable income are important for German and UK companies. Once more, the
coefficients on the income measures for UK firms are higher than the coefficients on
the same measures for German firms.
Table 8 about here
In order to analyse more the aforementioned result we perform annual cross-
sectional least squares tests to assess the incremental information content for the cases
of Germany and the UK. The relevant results are presented in Table 9, below. The
results follow a similar pattern as in the case of the annual tests for the relative
information content. Most coefficients are statistically insignificant for the case of
Germany while they are statistically significant for the UK. The UK results justify the
within-effects total results and provide further evidence of the information loss in the
case of total alignment of corporate book and taxable income.
Table 9 about here
4.5. Sensitivity analysis
Finally, we perform sensitivity tests in order to examine specific aspects of the
analysis that might have influenced the reported results above. We run the same tests
dividing the sample into two large parts based on the international involvement or not
of the companies under discussion. We define international involvement (as we have
already excluded interlisted firms) by the existence of foreign sales. The results for
the two groups in both countries are presented in Table 10, below.
Table 10 about here

15
5. Concluding remarks
This study owes its motivation to two relevant developments. Namely, the
European Commission’s discussion on a common EU consolidated corporate income
tax base and the increasing advocacy in the US for the abolishment of the non-
alignment of corporate book income and corporate taxable income. We choose to add
to the literature by studying the two largest EU economies that would be leading in
the relevant developments.
The evidence supports the existence of potential information loss in the case of
a complete alignment between the two income measures. The results are important
both for Germany and the UK, however, there is more solid evidence of incremental
information loss in the latter case.
16
References
Baltagi, B. H., 2005, Econometric Analysis of Panel Data, John Wiley & Sons.
Desai, M, 2005, The degradation of reported corporate profits, Journal of Economic
Perspectives, Vol. 19, 4, Fall, pp. 171-192.
Grambovas, C.A., B. Giner and D. Christodoulou, 2006, Earnings Conservatism:
Panel Data Evidence from the EU and the US, Abacus, forthcoming.
Hadi, A. S., 1992, Identifying Multiple Outliers in Multivariate Data, Journal of the
Royal Statistical Society: Series B, 54 (3): 761-771.
Hadi, A. S., 1994, A Modification of a Method for the Detection of Outliers in
Multivariate Samples, Journal of the Royal Statistical Society: Series B, 56 (2), pp.
393-396.
Hanlon, M, S. Kelly and T. Shevlin, 2005, Evidence for the possible information loss
of conforming book income and taxable income, Journal of Law and Economics, Vol.
48, pp.407-442.
Hanlon, M., T. Shevlin, 2005, Book-Tax conformity for corporate income: an
introduction to the issues, Tax Policy and Economy, 19.
Hausman, J., 1978, ‘Specification Tests in Econometrics’, Econometrica, November.
KPMG Report, 2005, Statutory Corporate Income Tax Rates EU-15 1995-2004, http://www.kpmg.no/pages/202415.html
Mills, L, 1998, Book-tax differences and Internal Revenue Service adjustments,
Journal of Accounting Research, Vol. 36, pp.343-356.
Nobes, C., H. Schwencke, 2006, Modelling the links between tax and financial
reporting: a longitudinal examination of Norway over 30 years up to IFRS adoption,
European Accounting Review, Vol. 15, pp.63-88.
Plesko, G. 2006, Estimates of the magnitude of financial and tax reporting conflicts,
University of Connecticut Working Paper.
Swamy, P.A.V.B. and S.S. Arora, 1972 ‘The Exact Finite Sample Properties of the
Estimators of Coefficients in the Error Components Regression Models’,
Econometrica, March.
Whitaker, C., 2005, Bridging the Book-Tax accounting gap, Yale Law Journal, Vol.
115, pp.680-726.
17
Tables and Graphs
Table 1. Statutory Tax Rates for Germany and the UK.
Country 1998 1999 2000 2001 2002 2003
Germany 50.13 47.96 47.22 39.36 38.36 39.58
UK 31 31 30 30 30 30
Note: Statutory corporate income tax rates as of 1 January (average for Germany during split-rate
years). Source: http://www.kpmg.no/pages/202415.html
Table 2. Descriptive Statistics (Total samples).
Corporate Book
Income
Corporate
Taxable Income
Spread between
CBI & CTI Returns ∆CBI ∆CTI
Panel A: Germany (958 obs.)
Mean 27,776,242 4,357,639 23,418,603 0.0228 0.0036 0.0041
Median 5,560,909 2,725,199 167,237 -0.0062 0.0029 0.0002
Maximum 10,600,000,000 3,970,000,000 9,000,000,000 2.1508 0.7895 0.3604
Minimum -27,400,000,000 -11,700,000,000 -15,700,000,000 -0.9132 -0.6983 -0.4208
St.Deviation 1,040,000,000 574,000,000 736,000,000 0.3765 0.1604 0.0750
Skewness -17.0062 -17.4293 -4.6581 1.2299 0.5985 0.0055
Panel B: UK (4409 obs.)
Mean 24,863,939 21,908,921 2,955,018 0.0057 0.0008 -0.0053
Median 2,751,000 1,016,657 41,387 -0.0539 0.0046 0.0000
Maximum 2,950,000,000 4,880,000,000 2,890,000,000 2.4595 1.0011 0.4062
Minimum -14,000,000,000 -2,520,000,000 -16,800,000,000 -0.9945 -0.9934 -0.4266
St.Deviation 328,000,000 236,000,000 409,000,000 0.5149 0.1730 0.0838
Skewness -23.7385 10.8081 -26.5923 1.2227 -0.0214 -0.4189
Note: Corporate book income (CBI) is defined as consolidated pre-tax book income minus minority
interest. We estimate corporate taxable income (CTI) as the consolidated current tax expense (total tax
expense minus the change in deferred taxes) divided in each year by the top corporate income tax rate.
The Returns are defined as the annual average change in share prices and �CBI and �CTI denote the
change in CBI and CTI between the current and the previous period divided by the beginning period
market value. The German figures are in euros and the UK figures are in pounds.
18
Table 3. Descriptive Statistics (Annual).
Year N Total CBI Total CTI Total Spread Mean
Spread CBI/CTI
Panel A: Germany (m. euros)
1999 216 9,390 10,200 -810 -3.8 0.921
2000 186 22,900 6,960 15,940 85.9 3.290
2001 189 12,900 -5,140 18040 95.5 -2.510
2002 164 -23,400 -7,750 -15,650 -95.3 3.019
2003 203 4,740 -117 4,857 23.9 -40.513
Panel B: UK (m. pounds)
1999 860 40,700 33,000 7,700 8.9 1.233
2000 790 32,700 28,400 4,300 5.4 1.151
2001 901 15,800 25,500 -9,700 -10.7 0.620
2002 931 1,660 5,930 -4,270 -4.6 0.280
2003 927 18,800 3,770 15,030 16.3 4.987
Note: N is the number of observations in each year. Total CBI and Total CTI are the aggregates of
corporate book income and corporate taxable income respectively. Spread is the difference between
CBI and CTI.
Table 4. Correlation Matrix.
Panel A: Germany
∆CBI ∆CTI Returns
∆CBI 1 0.2548 0.1478
∆CTI 0.2548 1 0.1111
Returns 0.1478 0.1111 1
Panel B: UK
∆CBI ∆CTI Returns
∆CBI 1 0.3638 0.2276
∆CTI 0.3638 1 0.1947
Returns 0.2276 0.1947 1
Note: The notation is as in Table 2.
19
Table 5. Methodology Selection.
ititit CBIR εαα +∆⋅+= 10 (1)
ititit CTIR εββ +∆⋅+= 10 (2)
itititit CTICBIR εγγγ +∆⋅+∆⋅+= 210 (3)
Panel A: Choice between Panel Data and OLS Methodologies
Model 1: σµ Model 2: σµ Model 3: σµ
BE 0.400 0.365 0.364 Germany
WE 0.410 0.363 0.361
BE 0.801 0.510 0.502 UK
WE 0.795 0.493 0.485
Panel B: Choice between Random and Fixed Effects Panel Data Methodologies
Model 1 Model 2 Model 3 Hausman Test
χ2 Prob. χ2 Prob. χ2 Prob.
BE 6.183 0.013 12.482 0.000 15.076 0.001 Germany
WE 0.483 0.487 0.542 0.462 5.036 0.081
BE 1.881 0.170 4.927 0.026 4.789 0.091 UK
WE 0.641 0.424 3.051 0.081 2.552 0.279
Panel C: Statistics Comparison between OLS and Fixed Effects Methodologies
Model 1 Model 2 Model 3
R2 SC R
2 SC R
2 SC
OLS 0.3 1.114 1.1 0.885 2.6 0.877
BE 9.6 2.612 5.8 2.593 6.4 2.592 Germany
WE 5.1 1.083 7.0 0.849 8.3 0.841
OLS 1.5 2.408 3.8 1.475 6.6 1.447
BE 2.7 4.493 1.8 3.561 4.8 3.533 UK
WE 4.1 2.388 8.4 1.433 11.2 1.403
Note: The idiosyncratic random standard deviation σµ provides us with a statistic to choose between
Panel Data and Ordinary Least Squares (OLS) methodology, as when σµ2 = 0 then the Panel Data
methodology is equivalent to the pooled OLS, when σµ2 > 0 the Panel Data methodology is preferred
(when σµ2→ 1 the Fixed Effects Panel Data methodology is the most appropriate). The Between Fixed
Effects (BE) methodology assesses the panel specific characteristics and the Within Fixed Effects
(WE) methodology examines the characteristics within panels over time. The Hausman (1978) test
examines the null hypothesis of no difference between the Random and Fixed Effects estimators. The
rejection of the null indicates the superiority of the Fixed Effects methodology. The R2 is the adjusted
R2 in percentages and SC is the Schwarz Information Criterion which suggests the superiority of a
test/model when the statistic is lower (employed only in cases where the dependent variable is the same
and the same sample is tested). The notation in the Models 1,2 and 3, above, is as in Table 2.
20
Table 6. Within Fixed Effects tests on Relative Information Content (Total).
ititit CBIR εαα +∆⋅+= 10 (1)
ititit CTIR εββ +∆⋅+= 10 (2)
Model 1 Model 2
Countries N ∆CBI R2
SC ∆CTI R2
SC
Germany 958 0.070** 5.1 1.083 0.514*** 7.0 0.849
UK 4409 0.528*** 4.1 2.388 1.069*** 8.4 1.433
Note: Rit is the average change in share price for company i in the fiscal year t. ∆CBIit is the change in
corporate book income for company i during the fiscal year t divided by the beginning period market
value and ∆CTIit is the change in corporate taxable income for company i during the fiscal year t
divided by the beginning period market value. SC is the Schwarz information criterion and R2 is the
adjusted R2 in percentage. ***, ** and * denote significance at a 1%, 5% and 10% confidence levels
respectively.
Table 7. Cross-sectional Least Square tests on Relative Information Content (Annual)
ititit CBIR εαα +∆⋅+= 10 (1)
ititit CTIR εββ +∆⋅+= 10 (2)
Model 1 Model 2
N ∆CBI R2
SC ∆CTI R2
SC
1999 216 0.450** 2.5 0.819 -0.005 0.0 0.849
2000 186 0.185 0.3 0.468 0.327 0.1 0.470
2001 189 0.320** 1.0 0.882 0.741** 1.7 0.875
2002 164 0.148 0.0 0.478 0.036 0.0 0.483 Ger
man
y
2003 203 0.418** 3.0 1.277 1.073** 3.7 1.271
1999 860 0.823*** 5.0 1.572 1.955*** 6.5 1.556
2000 790 0.600*** 2.3 1.694 1.176*** 2.3 1.694
2001 901 0.593*** 4.6 1.106 1.080*** 3.8 1.115
2002 931 0.475*** 4.8 1.029 0.550*** 1.7 1.062
UK
2003 927 0.798*** 8.9 1.547 1.134*** 3.0 1.609
Note: Notation as in Table 5, above.
21
Table 8. Within Fixed Effects tests on Incremental Information Content (Total).
itititit CTICBIR εγγγ +∆⋅+∆⋅+= 210 (3)
N Intercept ∆CBI ∆CTI R2
SC
Germany 958 0.020* 0.284*** 0.360** 8.3 0.841
UK 4409 0.009 0.542*** 0.659*** 11.2 1.403
Note: Notation as in Table 5, above.
Table 9. Cross-sectional Least Square tests on Incremental Information Content
(Annual).
itititit CTICBIR εγγγ +∆⋅+∆⋅+= 210 (3)
Years N Intercept ∆CBI ∆CTI R2
SC
1999 216 -0.004 0.540** -0.515 2.7 0.837
2000 186 0.028 0.157 0.249 0.1 0.492
2001 189 0.000 0.216 0.599* 1.8 0.896
2002 164 -0.120*** 0.149 -0.008 0.0 0.509 Ger
man
y
2003 203 0.168*** 0.341 0.913** 5.5 1.273
1999 860 0.145*** 0.469*** 1.465*** 7.6 1.551
2000 790 0.128*** 0.421*** 0.838*** 3.2 1.692
2001 901 -0.119*** 0.445*** 0.711*** 5.9 1.099
2002 931 -0.124*** 0.427*** 0.302** 5.2 1.031
UK
2003 927 0.028* 0.721*** 0.609** 9.6 1.545
Note: Notation as in Table 5, above.
22
Table 10. Relative and Incremental Information Content for Firms with and without
International Involvement.
ititit CBIR εαα +∆⋅+= 10 (1)
ititit CTIR εββ +∆⋅+= 10 (2)
itititit CTICBIR εγγγ +∆⋅+∆⋅+= 210 (3)
Models 1 & 2 Model 3
N ∆CBI R2
SC ∆CTI R2 SC ∆CBI ∆CTI R
2 SC
Panel A: Firms with Int. Involvement
Germany
UK
Panel B: Firms with no Int. Involvement
Germany
UK
Note: Notation as in Table 5, above. Firms that report international sales are selected as firms with
international involvement.