Embed Size (px)
Citation preview

Co/Ni ratios at taenite/kamacite interfaces and relativecooling rates in iron meteorites
John T. Wasson a,b,⇑, Peter Hoppe c
a Institute of Geophysics and Planetary Physics, University of California, Los Angeles, CA 90095-1567, USAb Department of Earth and Space Sciences and Department of Chemistry and Biochemistry, University of California,
Los Angeles, CA 90095-1567, USAc Max-Planck-Institut fur Chemie, Becherweg 27, D-55128 Mainz, Germany
Received 21 June 2011; accepted in revised form 17 January 2012; available online 31 January 2012
Abstract
We report a pilot study of a new technique to use the distribution of Co between kamacite and taenite to infer relativecooling rates of iron meteorites; data of Widge and Goldstein (1977) showed that the distribution is temperature dependent.A plot of the logarithm of the double ratio [(Co/Ni)kamacite/(Co/Ni)taenite] (abbreviated Rac) against inverse temperatureyields a linear equation showing that the ratio ranges from �2.5 at 1080 K to �30 at 710 K. Thus, a measurement of Racin the kamacite and taenite near the interface offers information about relative cooling rates; the higher Rac, the lower thecooling rate. A major advantage of this technique is that it is mainly affected by the final (low-temperature) cooling rate, justbefore the sample cooled to the blocking temperature where diffusion became insignificant. To test this method we used theNanoSIMS ion probe to measure Rac in two IVA and two IIIAB irons; members of each pair differ by large factors in ele-mental composition and in published metallographic cooling rates (Yang and Goldstein, 2006; Yang et al., 2008). Despitediffering by a factor of 25 in estimated metallographic cooling rate, the two IVA irons showed similar Rac values of �22.If experimental uncertainties are considered this implies that, at low temperatures, their cooling rates differ by less than a fac-tor of 5 with 95% confidence, i.e., significantly less than the range in metallographic cooling rates. In contrast, the IIIAB ironshave different ratios; Rac in Haig is 29 whereas that in Cumpas, with a reported cooling rate 4.5 times lower, is 22, the oppo-site of that expected from the published cooling rates. A reevaluation of the Yang–Goldstein IIIAB data set shows that Haighas anomalous metallographic properties. We suggest that both the high Rac in Haig and the systematically low taenite cen-tral Ni contents are the result of impact-produced fractures in the taenite that allowed equilibration with kamacite down tolower temperatures but shut down Ni transport to the interiors of taenite lamellae. Our observations of similar Rac values inIVA irons differing by a factor of 25 in metallographic cooling rates implies that there was, in fact, only a comparatively smalldifference in low-temperature cooling rates in IVA irons; because we studied only two IVA irons, this conclusion will remaintentative until further studies can be completed.� 2012 Elsevier Ltd. All rights reserved.
1. INTRODUCTION
The iron meteorite groups are divided into the magmaticgroups that formed by the fractional crystallization of
molten cores and the nonmagmatic groups that formedby solidification processes that were too rapid to permitfractional crystallization (e.g., Wasson, 1974). The magni-tude of elemental fractionations is much higher in the mag-matic groups; for example, compatible Ir is fractionated bya factor of 1400 in group IIIAB and incompatible As by afactor of 8, whereas much smaller fractionations are ob-served in the nonmagmatic IAB main group.
0016-7037/$ - see front matter � 2012 Elsevier Ltd. All rights reserved.
doi:10.1016/j.gca.2012.01.008
⇑ Corresponding author at: Department of Earth and SpaceSciences and Department of Chemistry and Biochemistry, Univer-sity of California, Los Angeles, CA 90095-1567, USA.
E-mail address: [email protected] (J.T. Wasson).
www.elsevier.com/locate/gca
Available online at www.sciencedirect.com
Geochimica et Cosmochimica Acta 84 (2012) 508–524

Fractional crystallization requires efficient mixing of theparental magma which can only occur during slow coolingof the body implying that these groups were produced ininitially molten asteroidal cores surrounded by insulatingmantles. Because the thermal conductivity of metal is about30� that in silicates, the cooling rates of such cores aredetermined by the overlying insulating mantle, with thesame cooling rates being present throughout the entire coreand thus through the full compositional range of the metal.
During the past four decades metallographic evidencehas been combined with information about stability fieldsand diffusion parameters to obtain model-dependent cool-ing rates for iron meteorites (e.g., Wood, 1964; Goldsteinand Ogilvie, 1965; Hopfe and Goldstein, 2001; Yang et al.,2008). The modeling involves the simulation of kamacite(a-iron) growth within a parental crystal of taenite (c-iron).With one exception, published metallographic cooling rates(MCR) for the magmatic group IVA span a wide range(Moren and Goldstein, 1979; Rasmussen et al., 1995; Yanget al., 2008); for example, Yang et al. (2008) report MCRranging from 6600 K/Ma in the high-Ir IVA La Grange ironto 100 K/Ma in the low-Ir IVA Duchesne iron. The oneexception is the study of Willis and Wasson (1978) whonoted that small adjustments in the placement of phaseboundaries and in the extrapolations of Ni diffusion coeffi-cients to low temperatures could bring the cooling rates ofhigh-Ir and low-Ir irons into rough agreement. To explainthe large apparent range in MCR Yang et al. (2008) inferredthat, at the time the Widmanstatten pattern formed, the ra-dius of the body was 150 km and the insulating silicate layerwas <1 km in thickness.
The most recent paper discussing MCR for IVA irons isby Goldstein et al. (2009a); the authors reexamined a newmethod based on the size of high-Ni particles formed inthe taenite cloudy zone and produced new observationsthat disagree with the roughly constant cooling rates im-plied in a previous study by this method by Yang et al.(1997); these new cooling rates show a composition-corre-lated range of a factor of 15, much smaller than the factorof 66 implied by the classic metallographic method but farhigher than expected in a core surrounded by an insulatingmantle.
The modeling of metallographic data in terms of coolingrates requires detailed information about phase boundariesand diffusion coefficients at temperatures that are too lowto permit accurate study in the laboratory. As a result, pub-lished cooling rates are partly based on values obtained byextrapolation of high-temperature data down to much low-er temperatures. Modeling the parameters to calculate cool-ing rates also requires assumptions regarding the time,temperature and kinetics of kamacite nucleation and thespacing between nuclei. An assumption of the models isthat cooling was monotonic whereas impact heating wouldbe expected to involve stochastic temperature spikes.
Afiattalab and Wasson (1980) plotted experimental dataof Widge and Goldstein (1977) to show that the logarithm ofthe ratio of Co in kamacite to that in taenite (Cokam/Cotaen)
is linearly related to the inverse temperature 1/T. Becauseour technique has better precision than accuracy, we nowuse the double ratio (Co/Ni)kam to (Co/Ni)taen which shows
a similar dependence on temperature. When an iron meteor-ite cools this ratio will therefore continue to increase downto the blocking temperature at which the rate of diffusionis too slow to produce further changes. The lower the cool-ing rate, the lower the blocking temperature. Thus, if someIVA irons cooled faster than others by factors of 10 or more,this is expected to lead to appreciably higher Cokam/Cotaen
ratios in the irons that cooled more slowly. This is the basisof our new method to infer relative cooling rates in ironmeteorites.
In this study we used a NanoSIMS ion probe to measureCo/Ni ratios in kamacite and taenite phases. There is agreat advantage to using a cooling-rate method that isbased on the interface between two phases because condi-tions for such systems are much more controlled. In partic-ular, to obtain relative cooling rates we do not need toknow exact diffusion coefficients. It is not even requiredthat the temperature dependence of the Co distribution beaccurate, only that the qualitative trend be correct.
2. EXPERIMENTAL TECHNIQUES
The goal is to measure the Co/Ni ratio in kamacite andtaenite as close as possible to the interface between thesephases because the “equilibration” or “blocking” tempera-ture decreases as the distance to the interface decreases. Thesimplest and least expensive technique would be the elec-tron microprobe but, because the diameter of the electronmicroprobe (EMP) spot is relatively large (�1.5 lm) andthe Co content of taenite near the interface is close to theEMP detection limit, this technique is less well suited forthis measurement.
In this study we used the NanoSIMS ion probe to obtaindata; the NanoSIMS permits us to analyze points withdimensions of 61 lm within �1 lm of the interface withnegligible levels of contamination by signals generated bythe beam striking the other phase.
2.1. NanoSIMS analysis of kamacite and taenite
The distributions of Fe, Co, and Ni around taenite–kamacite interfaces in the iron meteorites Duchesne(IVA), Bishop Canyon (IVA), Cumpas (IIIAB), and Haig(IIIAB) were measured with the Cameca NanoSIMS 50ion probe at Max-Planck Institute for Chemistry in foursessions between June 2008 and July 2010. The measure-ments were conducted on thick sections. The metallic partsof the samples were not coated, only the surrounding epoxywas coated with C to ensure good surface conductivity.
The Fe, Co, and Ni abundances were measured in a mul-ti-collection mode with static magnetic field controlled andregulated by an NMR probe. Positive secondary ions of56Fe, 59Co, and 62Ni, produced by bombardment of thesamples with a �400 (in two cases 800) nm-sized O� pri-mary ion beam (16 keV, �1.5–15 pA) rastered over areas20 � 20 lm2 or 40 � 40 lm2 in size (Table 1), were recordedwith three Hamamatsu miniature electron multipliers.
Images consist of 256 � 256 pixels and total integrationtimes varied between 3932 and 9830 s (Table 1), subdividedinto 4–10 image planes. The resulting depths of the analysis
New iron-meteorite cooling-rate method 509

fields are estimated to be <100 nm, based on an assumedsputter yield of 1 sputtered atom per primary ion (Wilsonet al., 1989) and the measurement parameters as givenabove.
For Ni abundances, the isotope 62Ni (3.63% of Ni) wasselected because, in multi-collection, measurements of iso-topes in the Fe mass region require a mass separation ofat least 2 amu. Thus, the more abundant isotopes 58Niand 60Ni could not be measured.
In a Fe–Ni matrix, 56Fe and 62Ni are free of significantisobaric interferences; for 59Co, however, special care mustbe taken to account for the 58NiH and 58FeH interferences.The analyses were made with a mass resolution M/DM of
�3000 for 56Fe and 62Ni (80 lm exit slit widths) and of�4500 for 59Co (50 lm exit slit width), respectively. Withthe latter setting and by taking the data �1.5–2 mamu tothe left of the 59Co peak center, contributions from 58NiHand 58FeH to 59Co are negligible (Fig. 1).
Several regions around kamacite–taenite interfaces wereanalyzed (Fig. 2). Because we chose sets of kamacite lamel-lae that were narrower than one or more of the remainingsets, the interfaces were roughly normal (within �20�) tothe polished surface. For such orientations the absence ofan accurate control of the angle that the lamellae intersectthe polished surface introduces a trivial (<5%) relative errorin our knowledge of how far away from the interface our
Table 1Overview of Fe–Co–Ni measurements with the NanoSIMS ion probe on the Fe meteorites Duchesne (IVA), Bishop Canyon (IVA), Cumpas(IIIAB), and Haig (IIIAB).
Session Meteorite K/T interfaceregion
Analysis field(lm2)
Primary current(pA)
Primary beam size(nm)
Integration time(s)
1 Duchesne Du-1 40 � 40 15 800 7864Du-2 40 � 40 15 800 5898Du-2 40 � 40 1.5 400 9830
2 BishopCanyon
Bi-1 40 � 40 15 400 3932Bi-2 40 � 40 15 400 3932
3 BishopCanyon
Bi-3 20 � 20 15 400 3932Bi-4 20 � 20 15 400 3932Bi-5 20 � 20 15 400 3932
4 Cumpas Cu-1 20 � 20 5 400 3932Cu-2 20 � 20 5 400 3932
Haig Ha-1 20 � 20 5 400 3932Ha-2 20 � 20 5 400 3932
59
58
58
-1
0
1
2
3
59
58
58
Fig. 1. Cobalt-59 and 58FeH/58NiH peaks recorded on Filomena kamacite (left) and on Duchesne taenite (right) with the Cameca NanoSIMS50 by varying the deflection plate voltage in front of the exit slit; the respective mass numbers, inferred from the plate voltages, are displayed atthe top. The measurements of 59Co were made at the position of the vertical line, i.e., about 1.5–2 mamu to the left of the peak center.
510 J.T. Wasson, P. Hoppe / Geochimica et Cosmochimica Acta 84 (2012) 508–524

data were obtained. The shallow depth (<100 nm) of ouranalytical spot also avoids signals from other phases belowthe plane of the section.
All measured secondary ion intensities were corrected fordetector dead time (44 ns) and detector background(<0.01 cps); the resulting corrections were minor as typicalcount rates were 20,000 cps for 56Fe and 50–100 cps for59Co and 62Ni. Prior to the analyses all measured areas weresputtered ca. 30 min with a relatively high primary ion-beamcurrent of several 100 pA to remove surface contaminationand to achieve steady-state conditions for secondary ionyields.
In each of the four analytical sessions we also carried outSIMS measurements on Filomena (a IIAB hexahedriteconsisting of nearly pure kamacite commonly used as astandard) to infer the relative sensitivity factors e(Co+)/
e(Fe+) and e(Ni+)/e(Fe+) needed to convert the measuredion ratios into true isotope ratios (cf. Fig. 3). Metal-phaseconcentrations in Filomena are: [Fe] = 935 mg/g, [Co] =4.54 mg/g, and [Ni] = 56.3 mg/g (Wasson et al., 1998), i.e.59Co/56Fe = 5.02 � 10�3 and 62Ni/56Fe = 2.27 � 10�3 atomratio. The inferred sensitivity factors varied between 0.66 and0.71 for e(Co+)/e(Fe+) and between 0.41 and 0.48 for e(Ni+)/e(Fe+) for measurements with primary currents between 5and 15 pA and somewhat higher values for measurementswith low primary current conditions. These variations reflectdifferent detector sensitivities and tuning conditions betweenthe different analysis sessions. In principle, these sensitivityfactors could be used to calculate Co/Fe and Ni/Fe ratiosin the samples of this study. However, due to possible matrixeffects this may not be strictly applicable to taenite andkamacite, leading to small systematic uncertainties. Most
Duchesne Lamella Du-1
Field of view: 40 x 40 μm2
Primary beam size: ~800 nm
Duchesne Lamella Du-2
Field of view: 40 x 40 μm2
Primary beam size: ~800 nm
Duchesne Lamella Du-2
Field of view: 40 x 40 μm2
Primary beam size: ~400 nm
Bishop Canyon Lamella Bi-1
Field of view: 40 x 40 μm2
Primary beam size: ~400 nm
Bishop Canyon Lamella Bi-2
Field of view: 40 x 40 μm2
Primary beam size: ~400 nm
Bishop Canyon Lamella Bi-3
Field of view: 20 x 20 μm2
Primary beam size: ~400 nm
A
C
A B
B
C
A
A C
A C
B C
Fig. 2. NanoSIMS 59Co/56Fe and 62Ni/56Fe ratio images for selected regions around taenite lamellae in the iron meteorites Duchesne, BishopCanyon, Cumpas, and Haig. All images are 256 � 256 pixels; field of view is 20 � 20 lm2 or 40 � 40 lm2. The maximum (white) in the colorscale represents values of 0.014 for 59Co/56Fe and of 0.042 for 62Ni/56Fe (corrected for the different secondary ion sensitivities of these threeelements as inferred from measurements on Filomena). Profiles of these two quantities along selected lines (labeled A–C) are displayed inFig. 3. The bright spot in the Ni/Fe image of Du-2 is a schreibersite grain.
New iron-meteorite cooling-rate method 511

important in the context of the discussion of our data (seebelow) is the Co/Ni ratio and that the relative sensitivity fac-tor e(Co+)/e(Ni+) is similar for taenite and kamacite. Theaverage relative sensitivity factor e(Co+)/e(Ni+) that wemeasured in Filomena differs by only 7% from that reportedfor NanoSIMS measurements on NIST SRM 610 glass(Marhas et al., 2008). Since these samples have a very differ-ent matrix and very different Co/Ni ratios (0.08 in Filomenaand 0.85 in SRM 610 glass) we conclude that potential differ-ences between taenite and kamacite are small. In any case, apossible difference between the Co/Ni sensitivity factors inkamacite and taenite has no effect on the interpretation ofour data since all samples considered here are expected tobe affected in the same way.
3. RESULTS
Regions containing narrow taenite–plessite fields sand-wiched between kamacite lamellae were chosen for analysis.
We analyzed two interface regions each in Duchesne, Cum-pas, and Haig, and five in Bishop Canyon (Table 1). Fig. 2shows 59Co/56Fe and 62Ni/56Fe ratio images for these re-gions (one region in Duchesne was measured twice, oncewith 400-nm primary beam size, and once with a 800-nmbeam). The kamacite–taenite interfaces are characterizedby a strong increase in Ni/Fe and a moderate decrease inCo/Fe in moving from kamacite to taenite.
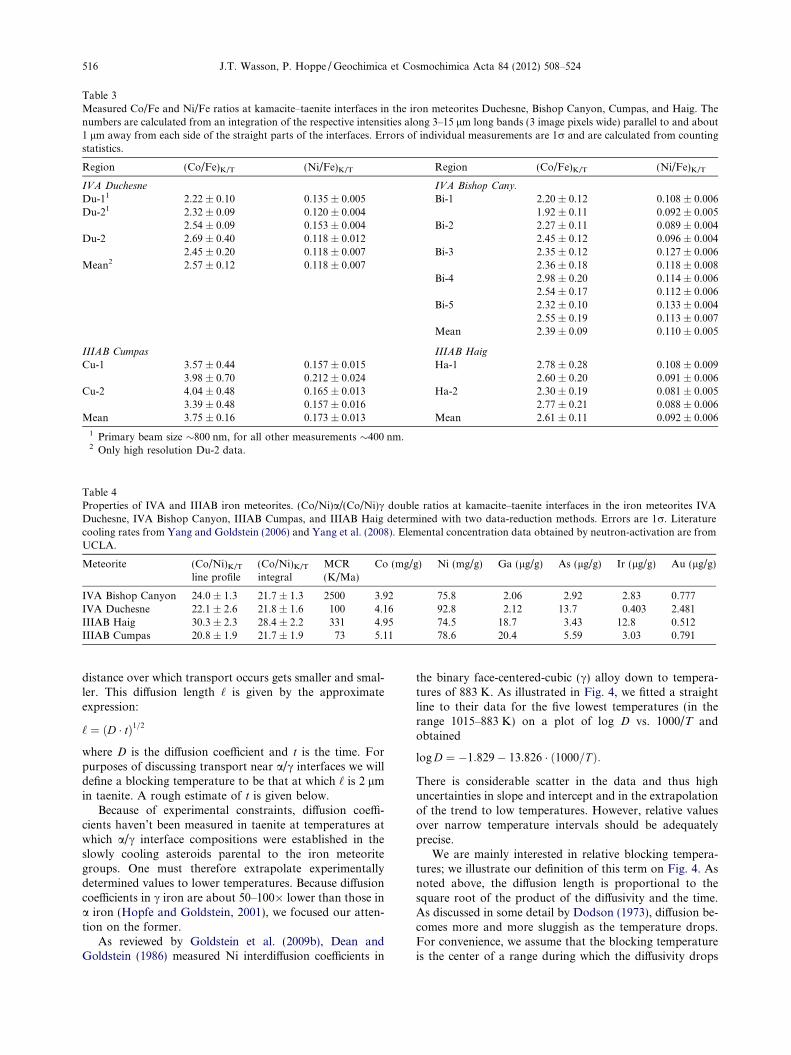
To help quantify the concentration ratios at the kama-cite–taenite interfaces we plotted in Fig. 3 profiles of59Co/56Fe and 62Ni/56Fe ratios along selected lines, labeledA, B, and/or C in Fig. 2, where each point is a superpositionof 4 � 4 or 8 � 8 image pixels (i.e., the sum of 16 or 64 pixels.Taking this superposition as well as the primary beam sizeinto account, the spatial resolution along the line is between0.5 and 1 lm. The changes of concentration ratios Co/Feand Ni/Fe at the kamacite–taenite interface (in the followingthese are designated as (Co/Fe)K/T and (Ni/Fe)K/T, respec-tively, with (Co/Fe)K/T = (Co/Fe)kamacite/(Co/Fe)taenite and(Ni/Fe)K/T = (Ni/Fe)kamacite/(Ni/Fe)taenite) occur typically
Bishop Canyon Lamella Bi-4
Field of view: 20 x 20 μm2
Primary beam size: ~400 nm
Bishop Canyon Lamella Bi-5
Field of view: 20 x 20 μm2
Primary beam size: ~400 nm
Cumpas Lamella Cu-1
Field of view: 20 x 20 μm2
Primary beam size: ~400 nm
Cumpas Lamella Cu-2
Field of view: 20 x 20 μm2
Primary beam size: ~400 nm
Haig Lamella Ha-1
Field of view: 20 x 20 μm2
Primary beam size: ~400 nm
Haig Lamella Ha-2
Field of view: 20 x 20 μm2
Primary beam size: ~400 nm
B A
A B
A B
B A
A
A
Fig 2. (continued)
512 J.T. Wasson, P. Hoppe / Geochimica et Cosmochimica Acta 84 (2012) 508–524

over distances of 1–2 lm, with (Co/Fe)K/T values of about 3and (Ni/Fe)K/T values of about 0.1–0.2 (Table 2).
In a second approach we integrated the Co, Ni, andFe intensities along 3–15 lm-long bands (3 image pixelswide, the length was selected according to the length of
the straight parts of the kamacite–taenite interfaces) par-allel to and about 1 lm away from each side of theinterfaces, representing the region of maximum Ni/Fein taenite and typical Ni/Fe in kamacite. Calculated(Co/Fe)T/K and (Ni/Fe)T/K values are given in Table 3.
0 10 20 30 40Distance (μm)
0.000
0.010
0.020
0.030
59C
o/56
Fex
3or
62Ni
/56Fe
Ni
Co
Du-1 Line B (LR)
0 10 20 30 40Distance (μm)
0.000
0.010
0.020
0.030
59C
o/56
Fex
3or
62Ni
/56Fe
Ni
Co
Du-1 Line C (LR)
0 10 20 30 40Distance (μm)
0.000
0.010
0.020
0.030
59C
o/56
Fex
3or
62Ni
/56Fe
Ni
Co
Du-2 Line A (LR)
0 10 20 30 40Distance (μm)
0.000
0.010
0.020
0.030
59C
o/56
Fex
3or
62Ni
/56Fe
Ni
Co
Du-2 Line C (LR)
0 10 20 30 40Distance (μm)
0.000
0.010
0.020
0.03059
Co/
56Fe
x3
or62
Ni/56
Fe
Ni
Co
Du-2 Line A
0 10 20 30 40Distance (μm)
0.000
0.010
0.020
0.030
59Co
/56Fe
x3
or62
Ni/56
Fe
Ni
Co
Du-2 Line C
0 5 10 15 20 25Distance (μm)
0.000
0.010
0.020
0.030
59C
o/56
Fex
3or
62Ni
/56Fe
Ni
Co
Bi-1 Line A
0 10 20 30 40 50Distance (μm)
0.000
0.010
0.020
0.030
59C
o/56
Fex
3or
62Ni
/56Fe
Ni
Co
Bi-1 Line B
0 10 20 30 40 50Distance (μm)
0.000
0.010
0.020
0.03059
Co+ /56
Fe+
x3
or62
Ni+ /56
Fe+
Ni
Co
Bi-1 Line C
0 10 20 30Distance (μm)
0.000
0.010
0.020
0.030
59C
o/56
Fex
3or
62Ni
/56Fe
Ni
Co
Bi-2 Line A
0 10 20 30 40 50Distance (μm)
0.000
0.010
0.020
0.030
59C
o+ /56Fe
+x
3or
62Ni
+ /56Fe
+
Ni
Co
Bi-2 Line B
0 10 20 30 40 50Distance (μm)
0.000
0.010
0.020
0.030
59C
o+ /56Fe
+x
3or
62Ni
+ /56Fe
+
Ni
Co
Bi-2 Line C
Fig. 3. Profiles of 59Co/56Fe and 62Ni/56Fe ratios along selected lines (cf. Fig. 3) from kamacite–taenite interfaces in Duchesne, BishopCanyon, Cumpas, and Haig. Each point is a superposition of 4 � 4 image pixels (Du-1, Du-2, Bi-1, Bi-2, Bi-3, Bi-4, Bi-5) or 8 � 8 image pixels(Cu-1, Cu-2, Ha-1, Ha-2). Errors are 1r and were calculated from counting statistics. All measurements were done with �400 nm primary ionbeam size, except those marked by “LR” where the beam size was �800 nm.
New iron-meteorite cooling-rate method 513

In Table 4 the results resulting from the two approachesare compared.
In Table 2 (line profile data) all the data sets have v2 val-ues not far from unity, i.e., the scatter is compatible withcounting statistics (on which errors of individual measure-ments are based).
In Table 3 (integral data) this is true as well, except for(Co/Fe)K/T in Bishop Canyon and (Ni/Fe)K/T in Haig
which have v2 values between 3 and 4. This obviously re-flects variations not covered by counting statistics. This isfully considered in the errors of average values which are gi-ven as standard deviations of the means.
In taenite in the two IVA irons the Ni/Fe ratio exhibits apronounced M-shaped profile; in contrast, in the two IIIABirons, in particular Cumpas, the Ni/Fe ratio appears com-paratively constant in the taenite. The increase in Ni/Fe
0 5 10 15 20 25Distance (μm)
0.000
0.010
0.020
0.030
59C
o/56
Fex
3or
62Ni
/56Fe
Ni
Co
Bi-3 Line A
0 5 10 15 20 25Distance (μm)
0.000
0.010
0.020
0.030
59C
o/56
Fex
3or
62Ni
/56Fe
Ni
Co
Bi-4 Line A
0 5 10 15 20 25Distance (μm)
0.000
0.010
0.020
0.030
59C
o/56
Fex
3or
62Ni
/56Fe
Ni
Co
Bi-5 Line A
0 5 10 15 20 25Distance (μm)
0.000
0.010
0.020
0.030
59C
o/56
Fex
3or
62Ni
/56Fe
Ni
Co
Cu-1 Line A
0 5 10 15 20 25Distance (μm)
0.000
0.010
0.020
0.03059
Co/
56Fe
x3
or62
Ni/56
Fe
Ni
Co
Cu-1 Line B
0 5 10 15 20 25Distance (μm)
0.000
0.010
0.020
0.030
59C
o/56
Fex
3or
62Ni
/56Fe
Ni
Co
Cu-2 Line A
0 5 10 15 20 25Distance (μm)
0.000
0.010
0.020
0.030
59C
o/56
Fex
3or
62Ni
/56Fe
Ni
Co
Cu-2 Line B
0 5 10 15 20 25Distance (μm)
0.000
0.010
0.020
0.030
59C
o/56
Fex
3or
62Ni
/56Fe
Ni
Co
Ha-1 Line A
0 5 10 15 20Distance (μm)
0.000
0.010
0.020
0.030
59C
o/56
Fex
3or
62Ni
/56Fe
Ni
Co
Ha-1 Line B
0 10 20 30Distance (μm)
0.000
0.010
0.020
0.030
59C
o/56
Fex
3or
62Ni
/56Fe
Ni
Co
Ha-2 Line A
0 5 10 15 20Distance (μm)
0.000
0.010
0.020
0.030
59C
o/56
Fex
3or
62Ni
/56Fe
Ni
Co
Ha-2 Line B
Fig 3. (continued)
514 J.T. Wasson, P. Hoppe / Geochimica et Cosmochimica Acta 84 (2012) 508–524

from kamacite to taenite is smallest for Cumpas and highestfor Haig; the respective values for the two IVA irons areintermediate between those from the two IIIAB irons.The largest decrease in Co/Fe from kamacite to taenite isobserved in the two IIIAB irons Cumpas and Haig.
From the (Co/Fe)K/T and (Ni/Fe)K/T values we obtainedthe double ratio [(Co/Ni)kamacite/(Co/Ni)taenite] (abbreviatedRac). As can be seen from Fig. 3, our technique gives nor-mal compositions of kamacite and taenite about 1 lm fromthe interface.
As summarized in Table 4, there is no systematic differ-ence between the IIIAB and IVA irons. Duchesne, BishopCanyon, and Cumpas have very similar Rac with valuesaround 22 whereas a much higher value of �29 was foundfor Haig.
4. THE FE–NI–CO SYSTEM: RELATIONSHIP
BETWEEN CO DISTRIBUTION RATIOS AND
TEMPERATURE
4.1. The structure of iron meteorites and the Fe–Ni system
Most iron meteorites are octahedrites. These structuresformed when body-centered-cubic (bcc) a iron exsolved
from parental high-temperature face-centered-cubic (fcc) ciron. This transition required the least amount of atomtranslation if the 110 planes of a iron replaced the 111planes of c iron. The 111 cubic planes are oriented likethe faces of a regular octahedron; an octahedron has 8faces, but those on opposite sides are parallel. As a resultthere are four sets of kamacite planes in octahedrites. TheFe–Ni phase diagram shows that the temperature at whicha iron becomes stable in a cooling system depends on the Nicontent of the preexisting c iron; at 100 mg/g Ni the a phasebecomes stable at 980 K.
Hopfe and Goldstein, 2001 and Goldstein et al. (2009b)published reviews of the Fe–Ni system and its applicationto cosmochemistry; the reader is referred to these papersfor details. The metallic systems that record the lowest cool-ing rates are the mesosiderites for which the inferred coolingrates are only 0.05 K/Ma (Hopfe and Goldstein, 2001). Thecompositional variations of kamacite and taenite reflect thediffering degrees of diffusional equilibration of kamacite andtaenite during the cooling of the system. Diffusion is muchfaster in kamacite thus, for regions having similar dimen-sions, gradients are much smaller in kamacite. As the parentalasteroid housing a fractionally crystallized core cools, diffusionrates decrease exponentially as a function of temperature. The
Table 2Measured Co/Fe and Ni/Fe ratios at kamacite–taenite interfaces in the iron meteorites Duchesne, Bishop Canyon, Cumpas, and Haig. Thedata are for the line profiles displayed in Figs. 2 and 3. Errors of individual measurements are 1r and are calculated from counting statistics.
Region (Co/Fe)K/T (Ni/Fe)K/T Region (Co/Fe)K/T (Ni/Fe)K/T
IVA Duchesne IVA Bishop Cany.Du-1, line B1 2.44 ± 0.30 0.140 ± 0.013 Bi-1, line A 1.76 ± 0.26 0.120 ± 0.017Du-1, line C1 2.79 ± 0.37 0.127 ± 0.013 2.22 ± 0.40 0.081 ± 0.014Du-2, line A1 2.59 ± 0.36 0.120 ± 0.012 Bi-1, line B 2.71 ± 0.47 0.089 ± 0.016
2.15 ± 0.29 0.160 ± 0.017 2.40 ± 0.44 0.080 ± 0.016Du-2, line C1 2.45 ± 0.32 0.130 ± 0.014 Bi-1, line C 2.19 ± 0.40 0.124 ± 0.019
2.24 ± 0.30 0.141 ± 0.015 2.66 ± 0.50 0.077 ± 0.014Du-2, line A 2.27 ± 0.69 0.127 ± 0.031 Bi-2, line A 3.03 ± 0.39 0.101 ± 0.011
2.03 ± 0.66 0.122 ± 0.028 2.24 ± 0.28 0.134 ± 0.015Du-2, line C 2.86 ± 1.02 0.084 ± 0.022 Bi-2, line B 2.79 ± 0.37 0.102 ± 0.012
2.40 ± 0.81 0.098 ± 0.026 3.57 ± 0.49 0.086 ± 0.011Mean2 2.39 ± 0.18 0.108 ± 0.010 Bi-2, line C 2.53 ± 0.33 0.114 ± 0.013
2.15 ± 0.29 0.093 ± 0.012Bi-3, line A 2.20 ± 0.34 0.101 ± 0.016
2.80 ± 0.48 0.096 ± 0.014Bi-4, line A 2.63 ± 0.37 0.105 ± 0.013
2.25 ± 0.31 0.110 ± 0.014Bi-5, line A 2.66 ± 0.41 0.143 ± 0.018
2.16 ± 0.33 0.114 ± 0.015Mean 2.50 ± 0.10 0.104 ± 0.004
IIIAB Cumpas IIIAB Haig
Cu-1, line A 4.32 ± 0.78 0.199 ± 0.026 Ha-1, line A 2.59 ± 0.50 0.076 ± 0.0143.16 ± 0.56 0.144 ± 0.021 2.40 ± 0.46 0.098 ± 0.015
Cu-1, line B 3.67 ± 0.70 0.207 ± 0.027 Ha-1, line B 3.74 ± 0.69 0.097 ± 0.0143.46 ± 0.66 0.178 ± 0.023 3.17 ± 0.65 0.086 ± 0.014
Cu-2, line A 3.19 ± 0.54 0.192 ± 0.024 Ha-2, line A 2.39 ± 0.33 0.094 ± 0.0113.47 ± 0.66 0.206 ± 0.030 2.62 ± 0.32 0.096 ± 0.011
Cu-2, line B 5.33 ± 1.31 0.149 ± 0.023 Ha-2, line B 2.27 ± 0.29 0.095 ± 0.0113.02 ± 0.54 0.149 ± 0.024 3.34 ± 0.46 0.105 ± 0.012
Mean 3.70 ± 0.27 0.178 ± 0.010 Mean 2.82 ± 0.19 0.093 ± 0.003
1 Primary beam size �800 nm, for all other measurements �400 nm.2 Only high resolution Du-2, line A and C data.
New iron-meteorite cooling-rate method 515
distance over which transport occurs gets smaller and smal-ler. This diffusion length ‘ is given by the approximateexpression:
‘ ¼ ðD � tÞ1=2
where D is the diffusion coefficient and t is the time. Forpurposes of discussing transport near a/c interfaces we willdefine a blocking temperature to be that at which ‘ is 2 lmin taenite. A rough estimate of t is given below.
Because of experimental constraints, diffusion coeffi-cients haven’t been measured in taenite at temperatures atwhich a/c interface compositions were established in theslowly cooling asteroids parental to the iron meteoritegroups. One must therefore extrapolate experimentallydetermined values to lower temperatures. Because diffusioncoefficients in c iron are about 50–100� lower than those ina iron (Hopfe and Goldstein, 2001), we focused our atten-tion on the former.
As reviewed by Goldstein et al. (2009b), Dean andGoldstein (1986) measured Ni interdiffusion coefficients in
the binary face-centered-cubic (c) alloy down to tempera-tures of 883 K. As illustrated in Fig. 4, we fitted a straightline to their data for the five lowest temperatures (in therange 1015–883 K) on a plot of log D vs. 1000/T andobtained
log D ¼ �1:829� 13:826 � ð1000=T Þ:
There is considerable scatter in the data and thus highuncertainties in slope and intercept and in the extrapolationof the trend to low temperatures. However, relative valuesover narrow temperature intervals should be adequatelyprecise.
We are mainly interested in relative blocking tempera-tures; we illustrate our definition of this term on Fig. 4. Asnoted above, the diffusion length is proportional to thesquare root of the product of the diffusivity and the time.As discussed in some detail by Dodson (1973), diffusion be-comes more and more sluggish as the temperature drops.For convenience, we assume that the blocking temperatureis the center of a range during which the diffusivity drops
Table 4Properties of IVA and IIIAB iron meteorites. (Co/Ni)a/(Co/Ni)c double ratios at kamacite–taenite interfaces in the iron meteorites IVADuchesne, IVA Bishop Canyon, IIIAB Cumpas, and IIIAB Haig determined with two data-reduction methods. Errors are 1r. Literaturecooling rates from Yang and Goldstein (2006) and Yang et al. (2008). Elemental concentration data obtained by neutron-activation are fromUCLA.
Meteorite (Co/Ni)K/T
line profile(Co/Ni)K/T
integralMCR(K/Ma)
Co (mg/g) Ni (mg/g) Ga (lg/g) As (lg/g) Ir (lg/g) Au (lg/g)
IVA Bishop Canyon 24.0 ± 1.3 21.7 ± 1.3 2500 3.92 75.8 2.06 2.92 2.83 0.777IVA Duchesne 22.1 ± 2.6 21.8 ± 1.6 100 4.16 92.8 2.12 13.7 0.403 2.481IIIAB Haig 30.3 ± 2.3 28.4 ± 2.2 331 4.95 74.5 18.7 3.43 12.8 0.512IIIAB Cumpas 20.8 ± 1.9 21.7 ± 1.9 73 5.11 78.6 20.4 5.59 3.03 0.791
Table 3Measured Co/Fe and Ni/Fe ratios at kamacite–taenite interfaces in the iron meteorites Duchesne, Bishop Canyon, Cumpas, and Haig. Thenumbers are calculated from an integration of the respective intensities along 3–15 lm long bands (3 image pixels wide) parallel to and about1 lm away from each side of the straight parts of the interfaces. Errors of individual measurements are 1r and are calculated from countingstatistics.
Region (Co/Fe)K/T (Ni/Fe)K/T Region (Co/Fe)K/T (Ni/Fe)K/T
IVA Duchesne IVA Bishop Cany.
Du-11 2.22 ± 0.10 0.135 ± 0.005 Bi-1 2.20 ± 0.12 0.108 ± 0.006Du-21 2.32 ± 0.09 0.120 ± 0.004 1.92 ± 0.11 0.092 ± 0.005
2.54 ± 0.09 0.153 ± 0.004 Bi-2 2.27 ± 0.11 0.089 ± 0.004Du-2 2.69 ± 0.40 0.118 ± 0.012 2.45 ± 0.12 0.096 ± 0.004
2.45 ± 0.20 0.118 ± 0.007 Bi-3 2.35 ± 0.12 0.127 ± 0.006Mean2 2.57 ± 0.12 0.118 ± 0.007 2.36 ± 0.18 0.118 ± 0.008
Bi-4 2.98 ± 0.20 0.114 ± 0.0062.54 ± 0.17 0.112 ± 0.006
Bi-5 2.32 ± 0.10 0.133 ± 0.0042.55 ± 0.19 0.113 ± 0.007
Mean 2.39 ± 0.09 0.110 ± 0.005
IIIAB Cumpas IIIAB Haig
Cu-1 3.57 ± 0.44 0.157 ± 0.015 Ha-1 2.78 ± 0.28 0.108 ± 0.0093.98 ± 0.70 0.212 ± 0.024 2.60 ± 0.20 0.091 ± 0.006
Cu-2 4.04 ± 0.48 0.165 ± 0.013 Ha-2 2.30 ± 0.19 0.081 ± 0.0053.39 ± 0.48 0.157 ± 0.016 2.77 ± 0.21 0.088 ± 0.006
Mean 3.75 ± 0.16 0.173 ± 0.013 Mean 2.61 ± 0.11 0.092 ± 0.006
1 Primary beam size �800 nm, for all other measurements �400 nm.2 Only high resolution Du-2 data.
516 J.T. Wasson, P. Hoppe / Geochimica et Cosmochimica Acta 84 (2012) 508–524

by an order of magnitude and becomes too low to producefurther compositional changes. Shown on Fig. 4 is a pointlabeled cooling rate = A; which is an arbitrarily blockingtemperature for one system. If now, a second composition-ally and structurally similar system cools at a rate ten timesmore slowly, diffusion can continue until a temperature thatcorresponds to a diffusivity ten times lower (because it takesten times longer for the diffusivity to drop by an order ofmagnitude). On Fig. 4 the blocking temperature for the firstsystem is �970 K and that for the second system is �900 K.
We discuss below the view that impact damage can leadto spuriously high cooling rates thus, in published set ofMCR, the lower range near 100 K/Ma appears to be moreworthy of trust. At the low temperatures (around 700 K)where diffusion in the c iron of common iron meteoriteseffectively ceased, the temperature range over which diffu-sivity drops an order of magnitude is about 40 K corre-sponding to a time of 0.40 Ma.
Our blocking temperature depends on the diffusionlength. This length is related to the analytical footprintand to the distance to the interface. The practical definitionis to assume it to be the length of the analytical spot in adirection perpendicular to the kamacite/taenite interface(the assumption being that this is approximately the sameas the distance from the center of the spot to the interface).For the data reported in this pilot study this corresponds to�2 lm. From this length and the above time we can calcu-late a diffusivity of 3 � 10�21 cm2 s�1. Based on the regres-sion fit in Fig. 4, this corresponds to a temperature of about741 K.
If now, another meteorite from the same group cooled ata rate 10� higher, then its blocking temperature will havebeen reached when D was 10� higher, or 3 � 10�20 cm2 s�1
in this example. This corresponds to a temperature of782 K. We will show that such different blocking tempera-tures correspond to very different Co/Ni ratios in kamaciteand taenite.
It seems probable that interdiffusion coefficients for Niand Co in either a or c iron are the same within a factor
of 2, similar to that observed in the range 1373–1588 byFilipek et al. (2005). In the remainder of the paper we willassume that the Co diffusion coefficient is the same as thatof Ni. Small differences among these elements are of noimportance for the interpretations we present.
It should be noted that, although it is desirable to mea-sure as close to the interface as practical (because this takesfull advantage of gains associated with emphasizing compo-sitions that were established a low temperatures), differ-ences in relative cooling-rate values should be nearly thesame over a range of, say, 0.4–2 lm from the interface.
4.2. The distribution of Co between kamacite and taenite and
its relationship to temperature
Widge and Goldstein (1977) investigated the distributionof Co between a and c iron. The studies were carried out atfour temperatures (1073, 1023, 973 and 923 K) and for ini-tial Co contents ranging from 18 to 101 mg/g and initial Nicontents ranging from 25 to 147 mg/g. Two heat treatmentprotocols were used. In heat-treatment 1 a sample of c ironwas cooled until nucleation of a occurred, then the samplewas annealed at the chosen temperature. In heat treatment2 a martensitic sample (a2) was annealed at the chosen tem-perature until it transformed to mixes of a + c coarseenough to study.
Because of difficulties associated with determining abso-lute concentrations with the NanoSIMS we converted theWidge–Goldstein data into double ratios, Rac, as explainedin Section 3. The Widge–Goldstein experiments revealed adependence of Rac on Co contents. Because the bulk Cocontents of iron meteorite groups are < 8 mg/g we usedonly the data for the lowest Co contents (ranging from 18to 25 mg/g) from their study. And, because Rac valuestended to be higher (farther from unity) implying morecomplete equilibration) for heat treatment 2, we limitedour consideration to these values.
In Fig. 5 we show a plot of log Rac vs. 1/T using theselected data. We show two regression lines, both of which
36
-17.5
-17.0
-16.5
-16.0
-15.5
-15.0
-14.5
-14.0
-13.5
-13.0
0.84 0.88 0.92 0.96 1.00 1.04 1.08 1.12
1000/T
log
Dγ
Cooling rate = A
Blocking temperature dependence on cooling rate
1150 1100 1050 1000 960 920 880
D units are cm2 s-1
Cooling rate = A/10
Dean and Goldstein (1986)Ni diffusivity in γ iron
Fig. 4. Diffusivity data for Ni in c iron from Dean and Goldstein (1986) are plotted against 1000/T. The regression line is fitted to the fivepoints on the right; see text for details. Positions of blocking temperatures for two cooling rates differing by a factor of 10 are illustrated.
New iron-meteorite cooling-rate method 517
are consistent with the experimental data. The one withhigher slope is based on giving each point equal weight. Be-cause the quality of the data increases with increasing tem-perature we fitted a second, improved regression line withthe data given arbitrary weighting factors as follows: rela-tive to the 923-K datum which was assigned weights of 1:1073 K, 4�, 1023, 3�, and 973, 2�.
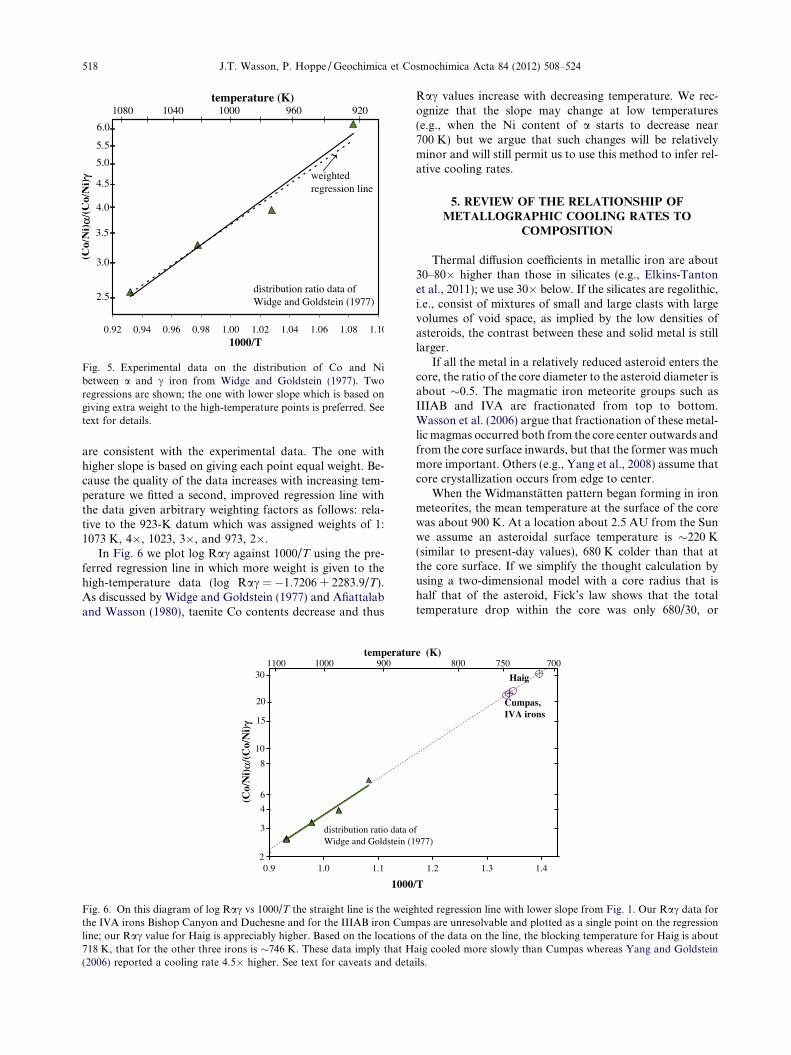
In Fig. 6 we plot log Rac against 1000/T using the pre-ferred regression line in which more weight is given to thehigh-temperature data (log Rac = �1.7206 + 2283.9/T).As discussed by Widge and Goldstein (1977) and Afiattalaband Wasson (1980), taenite Co contents decrease and thus
Rac values increase with decreasing temperature. We rec-ognize that the slope may change at low temperatures(e.g., when the Ni content of a starts to decrease near700 K) but we argue that such changes will be relativelyminor and will still permit us to use this method to infer rel-ative cooling rates.
5. REVIEW OF THE RELATIONSHIP OF
METALLOGRAPHIC COOLING RATES TO
COMPOSITION
Thermal diffusion coefficients in metallic iron are about30–80� higher than those in silicates (e.g., Elkins-Tantonet al., 2011); we use 30� below. If the silicates are regolithic,i.e., consist of mixtures of small and large clasts with largevolumes of void space, as implied by the low densities ofasteroids, the contrast between these and solid metal is stilllarger.
If all the metal in a relatively reduced asteroid enters thecore, the ratio of the core diameter to the asteroid diameter isabout �0.5. The magmatic iron meteorite groups such asIIIAB and IVA are fractionated from top to bottom.Wasson et al. (2006) argue that fractionation of these metal-lic magmas occurred both from the core center outwards andfrom the core surface inwards, but that the former was muchmore important. Others (e.g., Yang et al., 2008) assume thatcore crystallization occurs from edge to center.
When the Widmanstatten pattern began forming in ironmeteorites, the mean temperature at the surface of the corewas about 900 K. At a location about 2.5 AU from the Sunwe assume an asteroidal surface temperature is �220 K(similar to present-day values), 680 K colder than that atthe core surface. If we simplify the thought calculation byusing a two-dimensional model with a core radius that ishalf that of the asteroid, Fick’s law shows that the totaltemperature drop within the core was only 680/30, or
0.92 0.94 0.96 0.98 1.00 1.02 1.04 1.06 1.08 1.101000/T
(Co/
Ni)
α/(C
o/N
i)γ
2.5
3.5
4.5
4.0
3.0
5.5
6.0
5.0
1080 1040 1000 960 920temperature (K)
distribution ratio data of Widge and Goldstein (1977)
weighted regression line
Fig. 5. Experimental data on the distribution of Co and Nibetween a and c iron from Widge and Goldstein (1977). Tworegressions are shown; the one with lower slope which is based ongiving extra weight to the high-temperature points is preferred. Seetext for details.
0.9 1.0 1.1 1.2 1.3 1.4
1000/T
(Co/
Ni)
α/(C
o/N
i)γ
4
2
Haig
distribution ratio data of Widge and Goldstein (1977)
Cumpas,IVA irons
temperature (K)1000 900 800 750 700
30
20
15
10
8
6
3
1100
Fig. 6. On this diagram of log Rac vs 1000/T the straight line is the weighted regression line with lower slope from Fig. 1. Our Rac data forthe IVA irons Bishop Canyon and Duchesne and for the IIIAB iron Cumpas are unresolvable and plotted as a single point on the regressionline; our Rac value for Haig is appreciably higher. Based on the locations of the data on the line, the blocking temperature for Haig is about718 K, that for the other three irons is �746 K. These data imply that Haig cooled more slowly than Cumpas whereas Yang and Goldstein(2006) reported a cooling rate 4.5� higher. See text for caveats and details.
518 J.T. Wasson, P. Hoppe / Geochimica et Cosmochimica Acta 84 (2012) 508–524

23 K. If one calculates the temperature drop for sphericalgeometry the core gradient decreases by a large factor.For practical purposes, the core is isothermal, and the cool-ing rates should be the same at all levels in the core. How-ever, as shown on a plot of log cooling rate vs. log Aucontent (Fig. 7), there is a strong correlation betweenIVA MCR and the composition of the metal, with a rangeof a factor of 25–60 between the low-Au irons and high-AuDuchesne. It was therefore necessary for Yang et al. (2007,2008) to propose that >99% of the mantle and crust hadbeen stripped away to expose the naked (but still intact)core prior to cooling into the a + c field.
As discussed below, although Yang and Goldstein(2006) reported that the IIIAB cooling rates show a compo-sition-dependent variation of a factor of �6, we find that,with one or two exceptions, their compositional data indi-cate that the IIIAB irons cooled at the same rate.
6. NANOSIMS CO, NI AND FE STUDIES: EVIDENCE
REGARDING RELATIVE COOLING RATES OF IVA
AND IIIAB IRONS FROM DIFFERENT POSITIONS
IN THE CRYSTALLIZATION SEQUENCE
Our Rac results for two IVA irons and for two IIIABirons are listed in Table 4 together with literature coolingrates and some elemental concentrations. Before discussinginterpretations of our observations it is important to men-tion what would be expected if the literature metallographiccooling rates (MCR) are correct.
The MCR estimates for the IVA irons Bishop Canyonand Duchesne differ by a factor of 25 (Yang et al., 2008).The MCR for the low-Ni, low Au, high-Ir Bishop Canyoniron is 2500 K/Ma, that for the high-Ni, high-Au, low-IrDuchesne iron is 100 K/Ma.
The MCRs reported by Yang and Goldstein (2006) forthe two IIIAB irons differ by a factor of 4.5; the cooling ratefor low-Ni, low-Au, high-Ir Haig is 331 K/Ma, that forhigh-Ni, high-Au, low-Ir Cumpas is 73 K/Ma (Table 4).
Our Rac results (taken from method 2, “Integral”, inTable 4) are plotted on the trend line in Fig. 6. The twoIVA irons and IIIAB Cumpas yield ratios that are the samewithin 1% (fortuitously closer than expected based on thecounting statistics) and are plotted as a single point; how-ever, Rac in our IIIAB Haig sample is about 30% higherthan that in Cumpas, etc. According to the fitted linear rela-tionship on Fig. 6, the former values correspond to a equil-ibration (blocking) temperature of �746 K whereas theestimated Haig blocking temperature is �718 K. Becauseof scatter in the data and the long extrapolation of the Wid-ge–Goldstein trend, we do not claim that the absolute tem-peratures are well defined. The important point is that, ifthe trend is roughly that plotted in Fig. 6, the apparentblocking temperature for Haig is �30 K lower than thatof the other IIIAB iron Cumpas.
As just discussed, because the duration in any tempera-ture interval varies with the inverse of the cooling rate,lower cooling rates yield lower blocking temperatures andthe high Rac value in Haig implies that it cooled apprecia-bly more slowly than Cumpas. This disagrees with MCRswhich show Haig to have cooled 4.5� faster than Cumpas.We will show that the source of this discrepancy is probablyrelated to impact effects in Haig metal.
7. IMPACT EFFECTS AND THE METALLOGRAPHIC
RECORD
7.1. The ubiquity of impacts in the early solar system
All meteorites record impact effects. The iron meteoritespreserve the record of large and small impacts. Very largeimpacts were required to disintegrate the parental cores ofthe iron–meteorite groups, and there are structural, compo-sitional and crystallographic effects of the numerous largeimpacts that occurred prior and subsequent to the breakupof the metallic cores. The mineralogical record of the earli-est impacts is, however, obscured by later annealing effects.
Au (μg/g)
infe
rred
coo
ling
rate
(K
/Ma)
8000
Bishop Canyon
Duchesne
Haig
1000
2000
4000
800
100
200
400
80
40
Cumpas
0.4 0.5 0.6 0.8 1.0 1.2 1.5 2.0 2.4
Bella Roca
IIIAB irons
IVA irons
Fig. 7. Metallographic-cooling-rate (MCR) data for IVA (Yang et al., 2008) and IIIAB (Yang and Goldstein, 2006) irons are plotted againstour neutron-activation data for Au. The MCR for IVA irons correlate with composition. 2r error limits of 3% relative are attached to the Auvalues; 1r error limits are attached to the MCR for the four irons studied by us; others are in the same range.
New iron-meteorite cooling-rate method 519

Many IVA irons display the epsilon structure, whichreflects impact loading to pressures >13 GPa (Jain andLipschutz, 1970). Goldstein et al. (2009a) summarize theshock effects in IVA irons including those studied by Yanget al. (2008). Some authors assert that iron meteorites thatdo not show the e structure (e.g., 8 of the 16 IVA irons onthe Goldstein et al. list) have avoided impact alteration, butthis is generally not the case. If impact loading occurredwhen the metal was still hot (or the mass was significantlyheated by the impact) and insulated enough to cool slowly,the e structure was removed by annealing.
Although late annealing effects have rendered all impacteffects more difficult to recognize, there are some featuresthat survive. An example is the conversion of kamacitelamellae into equiaxed grains such as are observed in IIIABWillamette or IVA Social Circle (Buchwald, 1975).
There is no reason to doubt that the parental asteroids ofthe IIIAB and IVA iron meteorites experienced thousandsof impacts with energies slightly (ca. 10�) too low to breakup the core and that many of these produced physical effectsin the cores during their subsolidus history. Of special inter-est are those that occurred while the Widmanstatten struc-ture was forming, i.e., during the period of slow coolingthrough the a + c portion of the Fe–Ni phase diagram thatproduced the features that are used to estimate MCR.
7.2. Impact alteration and structural evolution of iron
meteorite cores
The physical–chemical processes responsible for forma-tion of the Widmanstatten pattern are relatively well under-stood. In the c field at high temperatures, above 900–1100 K,large crystals of c iron form; in IVA irons typical sizes ofparental c crystals are 10–50 cm (in Gibeon), in IIIAB irons100–200 cm (Buchwald, 1975). As the system cooled itcrossed the boundary between the c field and that of a + c.After some undercooling the a phase nucleated along 111planes of the c crystals and the Widmanstatten patternstarted to form. As discussed above, the growing a planesare oriented to each other like the faces of a regular octahe-dron. It is of great importance to note that, in the MCR mod-els, the increase in the amount of a iron, the shrinkage of the cphase, and the change in compositions of these phases are allmainly controlled by the slow process of body diffusionthrough the massive parental c crystals between the growinga lamellae. Additional details about kamacite nucleation andgrowth can be found in Goldstein et al. (2009b).
Chiefly because the Ni content of the c/(a + c) boundaryincreases with falling temperature, the amount of a gradu-ally increases at the expense of c. And, because diffusion isone to two orders of magnitude slower in c than in a Deanand Goldstein, 1986), a strong Ni gradient develops in the c,with much lower Ni contents in the centers of taenite crys-tals than at their surfaces. This causes c lamellae to formthe familiar M-shaped profile on plots of Ni vs. distance.In wide lamellae a eventually nucleates near the center ofthe lamellae producing central plessitic regions; in somecases the plessitic kamacite grains grew large enough(>1 lm) to cause appreciable Ni fluctuations in electron-microprobe traces across these regions.
Now imagine that a massive impact occurs on the parentasteroid, and that the compression and rarefaction wavesproduce a high density of defects in the metal. A simplethought picture is that many tiny fractures were producedin the c lamellae (as discussed above we will simplify thediscussion by assuming that diffusion in c is the rate-limit-ing step). If such an event also produced a high density ofdefects that resulted in the nucleation of a iron, the M pro-file ceased to evolve in this region because a-c equilibrationwas occurring on a local scale rather than via body diffusionthrough massive taenite.
It is commonly accepted that diffusion along surfaces isat least an order of magnitude faster than body diffusion.Thus the effect of an impact that produces microcracks intaenite with a relatively close spacing (e.g.,<20 lm) is togreatly increase the diffusion of Co, Ni and Fe in and outof the now-much-smaller c crystals.
8. A CRITICAL ASSESSMENT OF
METALLOGRAPHIC COOLING RATES IN IIIAB
AND AN IMPACT-ALTERATION SCENARIO TO
EXPLAIN THE HIGH RaC IN IIIAB HAIG
It seems implausible that IIIAB Haig (which, followingtechniques such as those discussed in Wasson and Choi(2003), we model to have formed after about 6% crystalliza-tion of the parental magma) and Cumpas (modeled to haveformed after 34% crystallization) could have had suchdifferent Rac values and thus imply cooling-rate differencesthe opposite of those inferred by Yang and Goldstein(2006). We therefore suggest that impacts caused the intro-duction of microfractures into Haig taenite that reduced theeffective grain size of taenite near the interface and permit-ted exchange with the neighboring kamacite (and conver-sion of c to a) via grain-boundary diffusion. As a result,the Co/Ni ratio in the interface taenite became slightly low-er and that in the interface kamacite became slightly highercompared to IIIAB irons in which those processes werecontrolled by diffusion through massive taenite. We showbelow that such a process could also create properties thatsuggest a higher MCR for the Haig iron.
As discussed above, Fig. 7 shows that there is a strongnegative correlation between cooling rate and compositionin group IVA but a much less pronounced trend in IIIAB.Yang and Goldstein (2006) emphasize that there is a factorof six range in cooling rates across group IIIAB based onthe ratio of that estimated for Picacho (338 K/Ma) to thatin Spearman (56 K/Ma). Although they note that the corre-lation with composition may in part reflect “the variation innucleation temperature of the Widmanstatten pattern withNi content and the nucleation mechanism” they later state“we assert that there is a real and measurable variation inthe cooling rate across the IIIAB group”. Yang et al.(2008) again state that IIIAB shows a “significant cool-ing-rate range”.
We noted above that an advantage of the Rac method isthat, by taking the data close to the kamacite/taenite inter-face, we minimize the effects of processes that occurred athigh temperatures. For similar reasons, cooling rate esti-mates based on the Ni contents of the centers of M profiles
520 J.T. Wasson, P. Hoppe / Geochimica et Cosmochimica Acta 84 (2012) 508–524

improve with decreasing thicknesses of the lamellae (at leastdown to thicknesses too thin to measure precisely or so thinthat patches of taenite resorption were occurring). Thenarrower the lamellae, the greater the central Ni contentdepends on low-temperature diffusional transport overshort differences and thus the lower the importance ofhigh-temperature effects on the profile. For example, differ-ences in nucleation temperature, the spacing between nucleiand the P content of the metal phases are all diminished(the latter because, in most systems, schreibersite will havenucleated and the P content will be the saturation value,whatever the initial P content) by limiting considerationto narrow lamellae.
A close examination of the IIIAB data set on which theYang–Goldstein claim of variable cooling rates is basedshows the interesting result that, if one limits oneself to nar-row taenite lamellae, the meteorites other than Haig andBella Roca show the same compositional distributions inde-pendent of MCRs.
We transcribed the Yang and Goldstein (2006) data for14 IIIAB irons and plotted them together on Fig. 8. Datafor halfwidths >13 lm are not shown, and the followingdiscussion is based on halfwidths between 4 and 10 lm(marked by vertical lines on Fig. 8). The lower limit was cho-sen because there are relatively few data for smaller half-widths, the higher to emphasize low-temperature effects.
Eleven “normal” meteorites show distributions withinthe 4–10 lm range that cannot be distinguished; these areshown with filled symbols on Fig. 8. The three remaining ir-ons are shown with stick symbols (such as X). For Spearmanno lamellae 610 lm were studied by Yang and Goldstein
(2006). The points for Bella Roca fall into two clusters, threewith lamella halfwidths <7 plot together with the normalIIIAB irons whereas five with halfwidths >7 lm fall far be-low the normal trend. The third is Haig, for which all pointsfall below the normal trend.
To demonstrate the similarities among the IIIAB irons weneeded to eliminate effects associated with the negative trendon Fig. 8. We accomplished this by first fitting a regressionline to the data for the normal irons in the 4–10 lm halfwidthrange; a single low point for Greenbrier County (at 288 mg/gNi and 7.3 lm halfwidth) that was 4r below the mean waseliminated, but its inclusion would scarcely have changedthe position of the line. We then divided the observed centralNi value by the value calculated from the regression line forthat halfwidth, obtaining ratios close to unity.
In Fig. 9 we plot mean ratios against the publishedMCRs for the 13 irons (other than Spearman; the lowGreenbrier point was not included). The error bars show90% confidence limits based on a Student’s t distribution.The 11 normal IIIAB irons show mean ratios between0.99 and 1.01 with 90% confidence limits that generallyencompass this entire range. Bella Roca, for which the datafall into two very different clusters, has a low mean near0.95 but a large uncertainty that extends to 0.98. Haighas a mean of 0.95 but has a narrow confidence intervalthat overlaps that of Bella Roca but does not come closeto the normal IIIAB range. Our first important conclusionis that Haig is unique among the set of 13 irons on Fig. 9.Our second important conclusion is that the 11 normalIIIAB irons cooled at the same rate independent of thecooling rate published by Yang and Goldstein (2006). A
270
275
280
285
290
295
300
305
310
315
320
325
330
taenite halfwidth (μm)
cent
ral N
i (m
g/g)
AngelicaBella RocaCasas Gr.CumpasChupaderosDavis MtnsDrum MtnsGreenbrier CntyHaigLivingston MTPicachoPoint of RocksSpearmanUrachic
IIIAB ironsYang+Goldstein, 2006
3 4 5 6 7 8 9 10 12
Fig. 8. Taenite central Ni contents are plotted against lamellae halfwidths for group IIIAB; data are transcribed from Yang and Goldstein(2006). Data for halfwidths >13 lm are not plotted and our conclusions are limited to the data with halfwidths in the 4–10 lm range. Asdiscussed in the text, data for small lamellae are most dependent on low-temperature processes and conditions, and thus are most free fromeffects associated with composition-associated differences that may have been present at higher temperatures. Eleven of the 14 IIIAB ironsform similar data arrays; we call these the normal IIIAB irons and fit them with a regression line. Of the remaining three, the points athalfwidths <7 lm for Bella Roca are not resolvable from the normal 11, but the points at halfwidths >7 lm cluster much lower. ForSpearman, no data were reported for halfwidths as low as 10 lm. The third iron, Haig, is unique; it forms an array that is distinctly lower thanthose of the normal 11 irons.
New iron-meteorite cooling-rate method 521

minor conclusion is that the data for Bella Roca are ambig-uous; this iron warrants further, more-detailed study.
The fact that Haig central Ni contents are low (Figs. 8and 9) is consistent with the Yang and Goldstein (2006)claim that it cooled more rapidly than most other IIIABirons. However, as noted above, the Co–Ni distributionsummarized in the Rac ratio show the opposite; our highRac for Haig implies that it cooled more slowly than Cum-pas, the only one of the 11 normal irons that we studied.
Impact effects have the potential to produce artifactsthat cause the two cooling rate methods to give false infor-mation in opposite directions. We mentioned above thattaenite fractures can cause grain boundary diffusion to bemore important than body diffusion. If impact processesresulted in fractures and thus a major reduction in meansize of taenite grains near the interface with kamacite, thesegrains could exchange with the kamacite at an enhancedrate compared to massive taenite. This higher transport ratewould cause a more rapid transformation of taenite intokamacite, a higher Ni and lower Co in the remaining tae-nite, and a higher Co content in the adjacent kamacite.
A different effect of shock could cause the central Ni con-tents (used to determine the MCRs) to stop increasing. Astemperatures fall, the centers of larger taenite lamellae alwayseventually break down into plessite (i.e., mixtures of a and c);the lower the Ni content, the higher the temperature at whicha nucleates to form the plessite. An impact can cause this ples-sitic a to nucleate at a still higher temperature. Once fineplessite forms in the central taenite region, the bulk composi-tion of the area ceases to evolve. If the plessite is finer than the1.5 lm spot of an electron probe, the analyst may not recog-nize that the central Ni content is not massive taenite, as thecooling-rate model requires.
We recommend that Haig be considered anomalous, andthat IIIAB cooling rates be based on “normal” irons suchas the 11 plotted in Figs. 8 and 9. We conclude that the
irons of IIIAB, the largest group of iron meteorites, cooledat the same rate independent of composition and thus posi-tion within the core.
9. PRELIMINARY EVIDENCE THAT IVA IRONS
COOLED AT A SIMILAR RATE
We also transcribed the Yang et al. (2008) central-taenite vs. halfwidth data set for group IVA; these showmore complexity that the Yang and Goldstein (2006) IIIABdata. In IVA the low-slope, linear portion of the trend endsat a lower halfwidth than in IIIAB. We therefore limitedour consideration to taenite lamella with halfwidths in therange 3–9 lm. Here we summarize key features but donot show the diagram nor attempt to explain its complexand curious features. (At the request of a reviewer we showthe diagram in our online annex but do not attempt to sum-marize or explain its features).
Within this halfwidth range all the meteorites with MCRP1900 K/Ma have some very low central Ni values<200 mg/g (Jamestown, 2 of 10; La Grange, 3 of 5; Obern-kirchen, 3 of 7, and Bishop Canyon 1 of 5. The highestpoints in these irons cluster around the same value,260 ± 30 mg/g. In contrast, in the remaining IVA ironsthe central M values are higher; mean values are in therange 290 ± 20 mg/g and there are no values <260 mg/g.Thus there is a big difference in taenite composition be-tween the compositional parts of group IVA.
Goldstein et al. (2009a) reported observations on thecloudy zone (a kind of plessite formed by spinodal decom-position) which, in iron meteorites, commonly occurs intaenite 50–100 nm from the kamacite/taenite interface. Insome IVA irons impact alteration has made it difficult torecognize the cloudy zone. Interestingly, the range in re-ported cooling rates in the IVA irons that have a recogniz-able cloudy zone is quite large, with that in Gibeon
0.92
0.93
0.94
0.95
0.96
0.97
0.98
0.99
1.00
1.01
1.02
1.03
50 100 150 200 250 300 350
metallographic cooling rate (K/Ma)
cent
ral N
i rat
io
IIIAB ironsYang and Goldstein, 2006
Hai
g
Bel
la R
oca
Pica
cho
Gre
enbr
ier
Dav
is M
tns
Cum
pas
Uru
achi
c
Chu
pade
ros
Poin
t of
Roc
ks
Ang
elic
a
Cas
as G
rand
es
80% confidence limits
Dru
m M
tns
Liv
ings
ton
Fig. 9. To better compare the Yang–Goldstein IIIAB data for the 13 irons with halfwidths in the range 4–10 lm we calculated ratios ofobserved central Ni contents to those expected from the regression line in Fig. 7 and plotted these against MCR reported by Yang andGoldstein (2006); 90%-confidence limits are shown. For the 11 normal IIIAB irons there is no significant correlation between the calculatedratios and the MCR based on these data. Two irons have low ratios. That for Bella Roca shows a high uncertainty because of the largedifference between the central Ni contents of narrower (<7 lm) and wider (>7 lm) taenite lamellae. The unique Haig iron shows both a lowmean ratio and a small uncertainty implying an unusual thermal/mechanical history. See text for more details.
522 J.T. Wasson, P. Hoppe / Geochimica et Cosmochimica Acta 84 (2012) 508–524

(1500 K/Ma) 15� larger than that in Duchesne (100 K/Ma). In this paper we will not attempt to sort out the com-plexities of the IVA data and potential problems with con-verting the data to cooling rates, but only agree with Yanget al. (2008) that there is a significant difference in theM-profile data between irons with the highest MCRs andthe remaining IVA irons.
The best way to avoid such complexities is to infer coolingrates from processes occurring very near the kamacite–taenite interface. This is the strength of our new technique.If we assume that the relationship between Rac and T fromFig. 6 and that between D and T given in Section 4.1 iscorrect, it is possible to quantify the relative cooling rates.Since the cooling rate CR is proportional to D it follows:
CR1=CR2 ¼ ½ðRacÞ2=ðRacÞ1�6:054
Weighted averages for Rac from methods 1 and 2(Table 4) are 22.9 ± 1.1 for Bishop Canyon and 21.9 ± 1.4for Duchesne, i.e. (Rac)BC/(Rac)Du = 1.046 ± 0.084. Thistranslates into a cooling rate difference of a factor of 1.3. Ifwe use the 2r uncertainty then the maximum difference isless than a factor of�3. The spatial resolution of our method(500–1000 nm) is lower than the scales on which relativelarge changes in Ni concentrations in taenite occur(100 nm) (Goldstein et al., 2009a). This leads to lower in-ferred Rac values than actually present. Because we areinterested in relative cooling rates this will have no effect ifthe shapes of the Ni (and Co) profiles in two meteorites tobe compared are identical. However, variations in profileshapes are observed (Goldstein et al., 2009b) and if we takethis into account then we have to consider an additional sys-tematic uncertainty of about 10% for the ratio of two Racvalues. This adds another factor of 1.8 to the uncertaintyof relative cooling rates and overall we conclude that thecooling rates of Duchesne and Bishop Canyon differ by nomore than a factor of 5 at the 2r level. As noted above ourRac value for IIIAB Cumpas is similar to those of theIVA irons studied here; relative to Duchesne we obtain(Rac)Cu/(Rac)Du = 0.968 ± 0.086. This results in a 2rupper limit for the relative cooling rate difference betweenIVA and IIIAB of a factor of �4 and, if we take the system-atic uncertainty of profile variations into account, of a factorof �8.
Although our result is preliminary because we have onlystudied two IVA irons, our data imply that the IVA ironsBishop Canyon and Duchesne cooled at rates that differ sig-nificantly less than those inferred by the metallographicmethod of Yang et al. (2008) which indicate a differencein cooling rate of a factor of 25. Our results imply that cool-ing rate does not correlate with composition in group IVAand that there are problems with published MCRs.
10. SUMMARY
We carried out a pilot study of a new method to deter-mine relative cooling rates of iron meteorites based on thedistribution of Co and Ni between kamacite and taenite.By studying kamacite and taenite close to their mutualinterface one minimizes the influence of processes occurringat higher temperatures (e.g., the nucleation of kamacite).
We used the NanoSIMS to measure of [(Co/Ni)kamacite/(Co/Ni)taenite] (abbreviated Rac) ratios at kamacite/taeniteinterfaces in IVA and IIIAB iron meteorites. As study ob-jects we chose the IVA irons Bishop Canyon and Duchesne,with reported metallographic cooling rates (MCRS) of 2500and 100 K/Ma (Yang et al., 2008), and IIIAB irons Haigand Cumpas, with published cooling rates of 331 and73 K/Ma (Yang and Goldstein, 2006).
Our IIIAB results showed different Rac values; in thelow-Au iron Haig we observed a Rac of 29 whereas thatin the intermediate-Au iron Cumpas was 21. This impliesthat Haig cooled more slowly than Cumpas, the oppositeof that expected based on the Yang–Goldstein MCRs.Our results imply that Haig had a lower diffusional block-ing temperature than Cumpas whereas the faster metallo-graphic cooling rate implies a higher blocking temperature.
A reexamination of the data published by Yang andGoldstein (2006) shows that Haig records an anomaloushistory. We suggest that defects and tiny fractures wereintroduced into the taenite as a result of impact-inducedshock, and that grain-boundary diffusion played a muchlarger role in the diffusion of Co, Ni and Fe in Haig com-pared to normal IIIAB iron meteorites. We show that thedata of Yang and Goldstein (2006) imply similar (unresolv-able) cooling rates for 11 normal IIIABs despite reportedMCRs that differ by a factor of 6.
We measured very similar Rac values in two IVA ironsdiffering by a factor of 25 in metallographic cooling rates(Yang et al., 2008). Our preliminary results indicate a max-imum cooling rate difference of a factor of 5 with 95% con-fidence and are thus inconsistent with the larger rangesinferred by these and earlier authors.
Our pilot study shows that the distribution of Co be-tween kamacite and taenite has great potential for thedetermination of low-temperature relative cooling rates iniron meteorites. Further studies are planned.
ACKNOWLEDGMENTS
We are indebted to Joe Goldstein for the provision of data ta-bles and for many past discussions and Joachim Huth for SEMdocumentation. Goldstein, Heather Watson, and an anonymousreferee provided useful reviews of different versions of this paper.Nhi Dang helped transcribe and plot data and Elmar Groner pro-vided key technical support on the NanoSIMS. Research at UCLAwas mainly supported by NASA grants NNG06GG35G andNNX10AG98G.
APPENDIX A. SUPPLEMENTARY DATA
Supplementary data associated with this article can befound, in the online version, at doi:10.1016/j.gca.2012.01.008.
REFERENCES
Afiattalab F. and Wasson J. T. (1980) Composition of the metalphases in ordinary chondrites: implications regarding classifi-cation and metamorphism. Geochim. Cosmochim. Acta 44, 431–
446.
New iron-meteorite cooling-rate method 523

Buchwald V. F. (1975) Handbook of Iron Meteorites. Univ.California Press, pp. 1418.
Dean D. C. and Goldstein J. I. (1986) Determination of theinterdiffusion coefficients in the Fe–Ni and Fe–Ni–P systemsbelow 900 �C. Met. Trans. 17A, 1131–1138.
Dodson M. H. (1973) Closure temperature in cooling geochrono-logical and petrological systems. Contrib. Mineral. Petrol. 40,
259–274.
Elkins-Tanton L. T., Weiss B. P. and Zuber M. T. (2011)Chondrites as samples of differentiated planetesimals. Earth
Planet. Sci. Lett. 305, 1–10.
Filipek R., Danielewski M. and Bachorczyk R. (2005) Interdiffu-sion studies in Co–Fe–Ni alloys. Defect Diffus. Forum 237–240,
408–413.
Hopfe W. D. and Goldstein J. I. (2001) The metallographic coolingrate method revised: Application to iron meteorites andmesosiderites. Meteorit. Planet. Sci. 36, 125–154.
Goldstein J. I. and Ogilvie R. E. (1965) A re-evaluation of the iron-rich portion of the Fe–Ni system. Trans. Met. Soc. AIME 233,
2083–2087.
Goldstein J. I., Yang J., Kotula P. G., Michael J. R. and Scott E.R. D. (2009a) Thermal histories of IVA iron meteorites fromtransmission electron microscopy of the cloudy zone micro-structure. Meteorit. Planet. Sci. 44, 343–358.
Goldstein J. I., Scott E. R. D. and Chabot N. L. (2009b) Ironmeteorites: crystallization, thermal history, parent bodies andorigin. Chemie Erde 69, 293–325.
Jain A. V. and Lipschutz M. E. (1970) On preferred disorder andshock history of chemical group IVA meteorites. Geochim.
Cosmochim. Acta 34, 883–892.
Marhas K. K., Amari S., Gyngard F., Zinner E. and Gallino R.(2008) Iron and nickel isotopic ratios in presolar SiC grains.Astrophys. J. 689, 622–645.
Moren A. E. and Goldstein J. I. (1979) Cooling rate of group IVAiron meteorites determined from a ternary Fe–Ni–P model.Earth Planet. Sci. Lett. 43, 151–161.
Rasmussen K. L., Clausen H. B. and Kallemeyn G. W. (1995) Noiridium anomaly after the 1908 Tungusta impact: evidence froma Greenland ice core. Meteoritics 30, 634–638.
Wasson J. T. (1974) Meteorites—Classification and Properties.Springer, New York, pp. 316.
Wasson J. T. and Choi B.-G. (2003) Main-group pallasites:chemical composition, relationships to IIIAB irons, and origin.Geochim. Cosmochim. Acta 67, 3079–3096.
Wasson J. T., Choi B.-G., Jerde E. and Ulff-Møller F. (1998)Chemical classification of iron meteorites: XII. new members ofthe magmatic groups. Geochim. Cosmochim. Acta 62, 715–724.
Wasson J. T., Matsunami Y. and Rubin A. E. (2006) Silica andpyroxene in IVA irons; possible formation of the IVA magmaby impact melting and reduction of L-LL-chondrite materialsfollowed by crystallization and cooling. Geochim. Cosmochim.
Acta 70, 3149–3172.
Widge S. and Goldstein J. I. (1977) Redetermination of the Fe-richportion of the Fe–Ni–Co phase diagram. Met. Trans. 8A, 309–
315.
Willis J. and Wasson J. T. (1978) Cooling rates of group IVA ironmeteorites. Earth Planet. Sci. Lett. 40, 141–150.
Wilson R. G., Stevie F. A. and Magee C. W. (1989) Secondary Ion
Mass Spectrometry: A Practical Handbook for Depth Profiling
and Bulk Impurity Analysis. Wiley-Interscience, pp. 384.Wood J. A. (1964) The cooling rates and parent planets of several
iron meteorites. Icarus 3, 429–459.
Yang J. and Goldstein J. I. (2006) Metallographic cooling rates ofthe IIIAB iron meteorites. Geochim. Cosmochim. Acta 70, 3197–
3215.
Yang C.-W., Williams D. B. and Goldstein J. I. (1997) A newempirical cooling rate indicator for meteorites based on the sizeof the cloudy zone of the metallic phases. Meteorit. Planet. Sci.
32, 423–429.
Yang J., Goldstein J. and Scott E. R. D. (2007) Iron meteoriteevidence for early catastrophic disruption of protoplanets.Nature 446, 888–891.
Yang J., Goldstein J. I. and Scott E. R. D. (2008) Metallographiccooling rates and origin of IVA iron meteorites. Geochim.
Cosmochim. Acta 72, 3043–3061.
Associate editor: Frank A. Podosek
524 J.T. Wasson, P. Hoppe / Geochimica et Cosmochimica Acta 84 (2012) 508–524