Embed Size (px)
Citation preview

Conjugate hemisphere ionospheric response to the St.Patrick’s Day storms of 2013 and 2015 in the 100°Elongitude sectorBitap Raj Kalita1, Rumajyoti Hazarika1, Geetashree Kakoti1, P. K. Bhuyan1, D. Chakrabarty2,G. K. Seemala3, K. Wang4, S. Sharma5, T. Yokoyama6, P. Supnithi7, T. Komolmis8, C. Y. Yatini9,M. Le Huy10, and P. Roy5
1Centre for Atmospheric Studies and Department of Physics, Dibrugarh University, Dibrugarh, India, 2Physical ResearchLaboratory, Ahmedabad, India, 3Indian Institute of Geomagnetism, Navi Mumbai, India, 4Space Weather Services, Bureau ofMeteorology, Surry Hills, New South Wales, Australia, 5Department of Physics, Kohima Science College, Kohima, India,6National Institute of Information and Communications Technology, Koganei, Japan, 7Faculty of Engineering, KingMongkut’s Institute of Technology Ladkrabang, Bangkok, Thailand, 8Department of Electrical Engineering, Chiang MaiUniversity, Chiang Mai, Thailand, 9Space Science Center, Indonesian National Institute of Aeronautics and Space, Jakarta,Indonesia, 10Institute of Geophysics, Vietnamese Academy of Science and Technology, Hanoi, Vietnam
Abstract The effects of the St. Patrick’s Day geomagnetic storms of 2013 and 2015 in the equatorial andlow-latitude regions of both hemispheres in the 100°E longitude sector is investigated and compared with theresponse in the Indian sector at 77°E. The data from a chain of ionosondes and GPS/Global Navigation SatelliteSystems receivers at magnetic conjugate locations in the 100°E sector have been used. The perturbation inthe equatorial zonal electric field due to the prompt penetration of the magnetospheric convective undershielded electric field and the over shielding electric field gives rise to rapid fluctuations in the F2 layer parameters.The direction of IMF Bz and disturbance electric field perturbations in the sunset/sunrise period is found to play acrucial role in deciding the extent of prereversal enhancement which in turn affect the irregularity formation(equatorial spread F) in the equatorial region. The northward (southward) IMF Bz in the sunset period inhibited(supported) the irregularity formation in 2015 (2013) in the 100°E sector. Large height increase (hmF2) duringsunrise produced short-duration irregularities during both the storms. The westward disturbance electric field on18 March inhibited the equatorial ionization anomaly causing negative (positive) storm effect in low latitude(equatorial) region. The negative effect was amplified in lowmidlatitude by disturbed thermospheric compositionwhich produced severe density/total electron content depletion. The longitudinal and hemispheric asymmetry ofstorm response is observed and attributed to electrodynamic and thermospheric differences.
1. Introduction
The response of the ionosphere to geomagnetic storms has received extensive attention from the scientificcommunity due its influence over space weather. The general processes of the storm time ionosphericresponse is well understood, but a complete understanding that would accurately predict or nowcast theresponse of the ionosphere is still lacking. The ionospheric response to a storm varies widely with latitude,longitude, season, and local time. The complex nature of ionosphere-magnetosphere coupling, where twosystems with different processes meet and interact [Wolf, 1975; Kamide et al., 1997, 1998; Tsurutani et al.,1997; Tsurutani and Gonzalez, 1997; Somayajulu, 1998] via the Earth’s magnetic field lines, can create aplethora of effects in the Earth’s ionosphere-thermosphere system during geomagnetic storms. Theenhanced energy coupling between the solar wind and the magnetosphere-ionosphere system during mag-netic storms cause ionospheric disturbances, or storms, which are manifested in terms of large deviations ofionospheric behavior from the regular quiet time behavior. The ionospheric density or electron content isfound to be either enhanced (positive storm) or depleted (negative storm) [Prolss et al., 1988, Rishbeth,1991; Fuller-Rowell et al., 1994; Field and Rishbeth, 1997; Field et al., 1998] depending on the local time ofthe storm commencement, season, latitude, and longitude of observation. The effects may vary from theF2 layer to the topside [Astafyeva et al., 2015; Liu et al., 2016]. During magnetic storms, the high-latitude polarregion is directly affected by the disturbed solar wind condition through the deposition of energetic particlesvia the near-vertical field lines when the frozen in solar wind magnetic field interacts with the geomagneticfield. At middle, low, and equatorial latitudes where geomagnetic field lines are inclined at a finite angle or
KALITA ET AL. IONOSPHERIC RESPONSE TO GEOMAGNETIC STORM 1
PUBLICATIONSJournal of Geophysical Research: Space Physics
RESEARCH ARTICLE10.1002/2016JA023119
Special Section:Geospace system responses tothe St. Patrick's Day storms in2013 and 2015
Key Points:• Differential ionospheric responsebetween two equinoctial storms isinvestigated in the 100°E meridianwith conjugate hemisphere data
• Contribution of the electrodynamicsand thermospheric compositionchange to severe negative stormeffect is assessed
• Generation of equatorial irregularitiesis observed in the sunrise period dueto disturbance electric field
Correspondence to:B. R. Kalita,[email protected]
Citation:Kalita, B. R., et al. (2016), Conjugatehemisphere ionospheric response tothe St. Patrick’s Day storms of 2013 and2015 in the 100°E longitude sector,J. Geophys. Res. Space Physics, 121,doi:10.1002/2016JA023119.
Received 28 JUN 2016Accepted 15 OCT 2016Accepted article online 19 OCT 2016
©2016. American Geophysical Union.All Rights Reserved.

are horizontal effects due to storms occur via three processes—(1) The direct penetration of magnetosphericconvective electric fields to the low latitudes; (2) the propagation of disturbed thermospheric winds gener-ated by joule heating or ion drag effect, which transfer energy/momentum and circulate storm-inducedcompositional changes; and (3) the generation of disturbance electric fields by dynamo action of the dis-turbed wind system. In the first process, the magnetospheric convective electric field couples into the polarregion where it can promptly penetrate into the low and equatorial latitudes within a few seconds [Kikuchiet al., 1996]. This prompt penetration electric field (PPEF) is oriented dawn to dusk, or eastward on the day-side and westward on the night side. The buildup of charges via region 1 field-aligned currents (FACs) atthe solar terminator give rise to a dusk to dawn electric field which tends to shield/oppose the dawn todusk field. The effectiveness of these two opposing electric fields at the equatorial region depends onthe direction of the IMF Bz, with southward (northward) direction supporting the eastward (westward)penetration fields. During rapid southward turning of the IMF Bz, the magnetospheric dawn to dusk electricfield can penetrate to the low latitudes before the development of any opposing shielding field and iscalled the undershielding effect. The rapid decay of region 1 FAC electric field due to the northward turningof IMF Bz reinforces the shielding dusk to dawn field, and then the region 2 FAC electric field can overcomethe dawn to dusk electric field [Kelley et al., 1979; Kikuchi et al., 2000], which is called the overshieldingeffect. These electric fields are superimposed on the quiet time Sq electric field causing perturbationsmainly in the equatorial zonal electric field. Consequently, the equatorial electrojet (EEJ), the equatorial ioni-zation anomaly (EIA), the equatorial spread F and scintillation, and the equatorial temperature and windanomaly (ETWA), etc., are affected. The equatorial and low-latitude ionospheric response during the mainphase of the storm in the first few hours is modulated by these convection electric fields. The daytimeequatorial electrojet is enhanced by the undershielded eastward field during southward IMF Bz turningand the counter electrojet is caused by the overshielding westward field during northward IMF turning[Kikuchi et al., 2010]. In the second process, the storm time particle precipitation in the auroral region setsup a series of energy transfer events via disturbed winds and tides, which propagate both toward the poleand the equator from the source region [Fuller-Rowell et al., 1994]. These thermospheric disturbances gen-erate acoustic gravity waves (AGWs) which are manifested as traveling atmospheric disturbances (TADs)and traveling ionospheric disturbances (TIDs). The TIDs generated in conjugate hemisphere auroral zonesduring geomagnetic storms [Hajkowicz, 1991] due to auroral zone heating can produce significant distur-bances in the equatorial region [Fesen et al., 1989]. Behind these disturbed winds, a disturbed thermo-spheric circulation is also set up [Rishbeth, 1975; Fuller-Rowell et al., 1994] and the equatorward surgescarry neutral molecular-rich air from the polar region to the low- and middle-latitude region and can causea negative effect due to enhanced recombination. Due to lower ion drag during the local night time, thewind and TIDs are more effective in the night sectors. The thermospheric effects last longer into the recov-ery and poststorm period due to the high inertia of the winds [Blanc and Richmond, 1980]. The energydeposited in the polar thermosphere due to Joule heating cause changes in the global thermosphericenergy balance and thereby alters the ionospheric quiet time wind dynamo, which creates the Sq currentsand electric fields at low and middle latitudes [Blanc and Richmond, 1980]. Therefore, a few hours after thestorm commencement, an electric field due to the disturbed wind dynamo may also be active in the low-and middle-latitude regions and is the third process for the transmission of storm effect to these regions.The disturbed winds due to corotation creates an eastward current in the dayside midlatitudes, which inturn causes an accumulation of charges at the solar terminator due to conductivity difference in the day-side and the nightside. These charges build up a westward electric field in the dayside and an eastwardfield electric field in the nightside of low- and middle-latitude regions. This effect of producing a currentsystem opposite to the Sq current system by the disturbed wind dynamo action is called the ionosphericdisturbance dynamo [Blanc and Richmond, 1980] in contrast to the quiet time dynamo action which pro-duces eastward and westward electric fields in the dayside and the nightside, respectively. The disturbancedynamo electric fields are produced late in the storm period, about 6–9 h after storm commencement[Blanc and Richmond, 1980; Scherliess and Fejer, 1997] and mostly during the storm recovery phase whenthe geomagnetic activity is low. Therefore, the low- and middle-latitude ionospheric response to a geomag-netic storm can be the result of the combined effect of all three mechanisms which operate concurrentlyfor a major part of the storm. Deeper understandings of magnetospheric-ionospheric-thermospheric pro-cesses are required for accurate prediction of the electric fields [Fejer and Emmert, 2003] and for fixingthe relative importance of the three processes in a storm time ionospheric response.
Journal of Geophysical Research: Space Physics 10.1002/2016JA023119
KALITA ET AL. IONOSPHERIC RESPONSE TO GEOMAGNETIC STORM 2

The strongest storm of solar cycle 24occurred on the St. Patrick’s Day (17March) of 2015 which was marked byDst index falling to less than 200 nT, AEcrossing 2000 nT, and highest recordedKp value of 8. Interestingly, on 17March of 2013 also, a storm of lessermagnitude was observed when theminimum recorded Dst was 132 nT, AEcrossed 2000 nT, and highest recordedKp value was 6. The solar activity duringthe two storms was moderate and simi-lar (F10.7 ~ 120 solar flux units). Both thestorms were sparked by coronal massejection (CME) and started (6 UT) andreached the peak condition at almostsame time of the day (21–23UT).The effects of St. Patrick’s Day storm of2015 have been reported widely[Astafyeva et al., 2015; Singh et al.,
2015; Tulasi Ram et al., 2016; Le et al., 2016; Liu et al., 2016]. Le et al. [2016] reported the equatorward expan-sion of the FAC and the auroral arc up to 60magnetic latitude. Liu et al. [2016] have found asymmetrybetween topside and bottomside response to the storm over Millstone Hill. From TEC/topside measurementsacross the globe, Astafyeva et al. [2015] have reported the hemispheric asymmetry in ionospheric response tothis storm even though the storm occurred in equinox where interhemispheric neutral flows are usually notpresent. The strong negative effects in the Northern Hemisphere of the Asian sector are reported and attrib-uted mainly to compositional changes. Singh et al. [2015] reported the occurrence of an F3 layer in the Indiansector (77°E) on 17 March daytime due to PPEF effect as well as postsunset irregularity formation with sharpheight rise. Tulasi Ram et al. [2016] have shown that the effect of the PPEF during sunset hours is affected bythe solar terminator position and that the ionospheric behavior along 100°E in the Indonesian sector wasmarked by the absence or inhibition of evening PRE, whereas strong PRE and associated intense scintillationwas observed in the Indian longitude along 77°E in the evening period of 17 March 2015. In comparison tothe 2015 storm, the effect of St. Patrick’s Day storm of 2013 has not been reported widely. The equinoctialperiod provide an opportunity to study the differential effect of storm on latitude, longitude, and conjugatehemisphere by eliminating the seasonal effects to the first order and thereby help in fixing the storm drivers.These considerations and the observation of the quiet time longitudinal WN4 structure peak in the 100°Elongitude [Sagawa et al., 2005; Immel et al., 2006; England et al., 2006; Kil et al., 2008; Scherliess et al., 2008;Liu and Watanabe, 2008, etc.] motivated us to investigate and compare the response of the ionosphere alongthe 100°E meridian to the St. Patrick’s Day storm of 2013 and 2015 using conjugate hemisphere data. In thisstudy, we present the latitudinal profile of the ionospheric response along the longitude of 100� 5°E using ameridional chain of stations from conjugate locations with multi-instrument data and compare the samewiththe response in the Indian sector at 77� 5°E. We attempt to evaluate the relative importance of the electro-dynamic and thermospheric processes in the storm response.
2. Materials and Methods
Figure 1 shows the map of the ionospheric stations used in this study. The data from a chain of ionosondeslocatedatDibrugarh (27.5°N, 95°E, 43° dip), ChiangMai (18.76°N, 98.93°E, 25°dip), Chumphon (10.72°N, 99.37°E,5° dip), Bac Lieu (9.3°N, 105.96°E, 4° dip), Kototabang (0.2°S, 100.32°E, 19° dip), and Cocos Island (12.2°S, 96.8°E,43° dip) andGPS/Global Navigation Satellite Systems (GNSS) TECmeasurements at Dibrugarh, Kohima (25.5°N,94.1°E, 39° dip), Cari (11.61°N, 92.71°E, 9° dip), Port Blair (11.6°N, 92.7°E, 9° dip), and Cocos Island have beenused. The stations form a latitudinal chain from the northern to the southern midlatitudes along 100� 5°E.For comparison of the storm response in the Indian sector, the TEC data from Lucknow (26.91°N, 80.95°E,41° dip), Bangalore (13.02°N, 77.67°E, 13° dip), and Ahmedabad (23.02°N, 72.5°E, 35° dip) are used. We
Figure 1. Themap showing the locations of the ionospheric stations usedin the study.
Journal of Geophysical Research: Space Physics 10.1002/2016JA023119
KALITA ET AL. IONOSPHERIC RESPONSE TO GEOMAGNETIC STORM 3

cover a latitudinal range of around 40° starting from the northern low midlatitude (43° dip) to the southernlow midlatitude (43° dip). Chumphon and Bac Lieu are located on the geomagnetic equator (trough of EIA).The nearly magnetic conjugate pair of Chiang Mai-Kototabang is located just off the magnetic equator.Dibrugarh-Cocos Island also forms magnetic conjugate pair at low midlatitude region but are at differentgeographic positions relative to the respective poles. The identical equinoctial conditions during the twostorms nullify the hemispherical (seasonal) effects, and conjugate hemisphere observations should providenew insights. The magnetically conjugate location of Dibrugarh and Cocos Island is unique in the sense thatthey are located in the transition region between low- and middle-latitude regions. The inclination of fieldlines in these two locations (dip ~ 43°) maximizes the effect of winds at the height of the F2 layer [Rishbeth,1971] and is ideally suited to study the effects of neutral winds. On the other hand due to the strongest peakof E× B drift longitudinal structure [Kil et al., 2008, etc.] in the 90°–100°E longitude sector, the EIA in this long-itude extends poleward and the crest location is found in higher latitudes [Sagawa et al., 2005; Immel et al.,2006] as compared to other longitudes. Therefore, the density/TEC over Dibrugarh and Cocos Island are sig-nificantly affected by the EIA as well the thermospheric conditions. The ground-based magnetometer datafrom Tirunelveli (TIR: 8.73°N, 77.80°E, 3° dip), a station close to the dip equator, and Alibag (ABG: 18.61°N,72.87°E, dip 26°), a station sufficiently away from the influence of the electrojet (to subtract the direct mag-netospheric effects), have been used following the methodology suggested by Chandra and Rastogi [1974]to obtain the EEJ which serves as the indicator of the equatorial electric field.
3. Data
The ionosonde data in Chiang Mai, Bac Lieu, Chumphon, and Kototabang are obtained from Southeast AsiaLow latitude Ionospheric Network (SEALION) which is operated by the National Institute of Information andCommunication Technology, Japan (http://seg-web.nict.go.jp/sealion/). These are frequency-modulated con-tinuous wave (CW) ionosondes. Canadian Advanced Digital Ionosonde (CADI) is operated by DibrugarhUniversity from July 2010. In Cocos Island, an IPS 5D ionosonde is operated by the Bureau of Meteorology,Australia from August 2008. The IPS 5D sweeps from 1 to 21.5MHz and records ionograms every 5min.The ionograms of these stations are manually scaled to obtain the F2 layer critical frequency foF2, the F2 layerreal height hmF2, and the virtual height h′F2 at fixed frequencies (2.5–8MHz). The real height of the F2 layerpeak density hmF2 is obtained by real height inversion of ionograms using POLAN [Titheridge, 1985]. TheTEC and scintillation data are obtained from Novatel GPS station 6 GNSS receiver measurements atDibrugarh and Kohima and Novatel GSV4004B receiver at Ahmedabad. The procedure to estimate the verti-cal TEC is explained in Bhuyan and Hazarika [2012]. The GNSS receivers in Dibrugarh and Kohima are cali-brated by a Novatel proprietary software. The GPS receiver in Ahmedabad is calibrated with a similarreceiver in Ahmedabad which is part of GAGAN (GPS Aided Geo-Augmented Navigation) network which isa Satellite Based Augmentation System (SBAS) developed by Indian Space Research Organization (ISRO) incollaboration with Airports Authority of India (AAI). The receiver bias for the GAGAN receivers is correctedusing a methodology described in Acharya et al. [2007]. For Novatel receivers, the satellite bias values are per-iodically obtained from the site (http://aiuws.unibe.ch/spec/dcb.php#p1c1) and these values are used peri-odically to recalibrate the data. The TEC obtained from the International GPS Service (IGS) stations atLucknow, Bangalore, Cari, Port Blair, and Cocos Island is also used and available at (ftp://cddis.gsfc.nasa.gov/pub/gps/data/daily/) in RINEX format. RINEX files are converted to TEC using the GPS-TEC program[Seemala and Valladares, 2011] downloaded from http://seemala.blogspot.com/. The vertical TEC (here afterVTEC) from all the visible satellites with elevation mask of 50° has been considered to reduce effect of single-shell model in VTEC conversion and multipath [Rama Rao et al., 2006]. The residual error due to transforma-tion into VTEC using single-shell model for elevation> 50° is less than 1 TEC unit. To eliminate multipatheffect for the scintillation data, the elevation angle is cutoff at 30°. The IMF Bz data are taken from ACE(Advanced Composition Explorer) and Wind satellite, which time shifted to Bow Shock Nose. To describethe geomagnetic disturbance fields in midlatitudes with high time resolution (i.e., 1min), symmetric(SYM-H) disturbance index data are taken from Kyoto World Data Center website (http://wdc.kugi.kyoto-u.ac.jp/wdc/Sec3.html). The solar wind velocity (SW), AE, and ASY-D data are taken from http://cdaweb.gsfc.nasa.gov/istp_public/ website. The auroral electrojet index, AE, is used as indicator of substorm activity, and theasymmetric ring current index D component, ASY-D, is used as indicator of field-aligned currents (FACs)following Wei et al. [2011]. The thermospheric neutral composition variations in terms of (O/N2) described
Journal of Geophysical Research: Space Physics 10.1002/2016JA023119
KALITA ET AL. IONOSPHERIC RESPONSE TO GEOMAGNETIC STORM 4

in this study has been obtained from Global Ultraviolet Imager (GUVI) instrument on board Thermosphere,Ionosphere, Mesosphere, Energetics and Dynamics (TIMED) spacecraft (http://guvi.jhuapl.edu/).
4. Results and Discussion
The response of the ionosphere to the 17–18 March 2015 super storm is discussed first, followed by 2013storm and the comparison. The geomagnetic activity indices during 16–18 March 2015 are shown inFigure 2. The sudden storm commencement (SSC) occurs at 4:45 UT followed by main phase at around6UT and recovery phase starting at around 24UT of 17 March as seen from the SYM-H index. We presentthe response of the ionosphere to the enhanced magnetic activity on 17 March in the form of a time history
Figure 2. The z component of interplanetary magnetic field IMF Bz, the solar wind speed, the auroral elctrojet index AE, thesymmetric ring current index SYM-H, the asymmetric ring current index D component ASY-D, and equatorial electrojet (EEJ)indices for the period of 16–18 March 2015.
Journal of Geophysical Research: Space Physics 10.1002/2016JA023119
KALITA ET AL. IONOSPHERIC RESPONSE TO GEOMAGNETIC STORM 5

of the events associated with the onset of the storm. The response of all the ionospheric parameters to thetriggering geomagnetic conditions is examined together and the probable mechanisms are discussed.
4.1. The Electrodynamic Response
The response of the F2 layer parameters hmF2 and NmF2 obtained from the meridional chain of ionosondes atDibrugarh, Chiang Mai, Chumphon, Kototabang, and Cocos Island to the variations of z component of theinterplanetary magnetic field (IMF) Bz on 17 and 18 March are shown in Figures 3 and 4, respectively. TheGPS/GNSS TEC variations over Dibrugarh, Kohima, Ahmedabad, Cari, and Cocos Island are shown inFigure 5. Five quiet days before and after 17 March 2015 are used as control days, and their average issuperimposed for estimation of storm-induced changes. We observe that the hmF2 variation during daytimeof 17 March is in a different scale than the variation at night and the height variation on the 18 March duringthe recovery phase of the storm. Therefore, to discuss the response of the height of the F2 layer peak densityhmF2 during daytime of 17 March, a blown up version of 0–15UT period of Figure 3 is shown in Figure 6 andthe critical events on the time (UT) axis are marked by vertical lines which provide a snapshot of themagneto-spheric and ionospheric conditions at those instances. After storm commencement, fluctuations of signifi-cant amplitude can be seen in the ionospheric parameters of all the stations. The simultaneous height
Figure 3. The variation of F2 layer height hmF2 in the 100°E longitude on 17 and 18 March 2015. Unmarked data gaps aredue to lack of data during these periods.
Journal of Geophysical Research: Space Physics 10.1002/2016JA023119
KALITA ET AL. IONOSPHERIC RESPONSE TO GEOMAGNETIC STORM 6

(hmF2) fluctuations (Figures 3 and 6) are indicative of the penetration of the magnetospheric convective elec-tric fields to the equatorial and low-latitude regions due to the sudden turnings of the IMF Bz component. Theeffect of winds on the daytime height variations is minimum as interhemispheric neutral winds are not sig-nificant in equinox. The daytime fluctuations are more prominent on the hmF2 variations over Chumphonat the magnetic equator, whereas nighttime variations are higher in the low latitudes. The superposition ofthe short-duration PPEF on the Sq electric field creates perturbation on the zonal electric field and lead tofluctuations in the vertical E× B drift. The perturbed vertical drifts are manifested as sharp and rapid heightvariation over the equatorial region. The first southward turning of the IMF Bz was observed at around6:20UT (vertical line 1) with increase in AE indices due to energy input in the polar region. The rapid and largedeviations of the hmF2 over Chumphon from the quiet day values may be used to infer the presence ofprompt penetration convection electric fields [Balan et al., 2011; Wei et al., 2011] and in this case the hmF2increase of about 65 km in less than 30min and a deviation of about 60 km from the quiet day value overChumphon (at around 6:45 UT) can be observed. The in-phase superposition of the dawn to dusk promptpenetration electric field with the quiet time eastward zonal electric field leads to the enhancement of the
Figure 4. The variation of NmF2 in the 100°E longitude on 17 and 18 March 2015. Different scales are used for each stationto highlight the fluctuations.
Journal of Geophysical Research: Space Physics 10.1002/2016JA023119
KALITA ET AL. IONOSPHERIC RESPONSE TO GEOMAGNETIC STORM 7
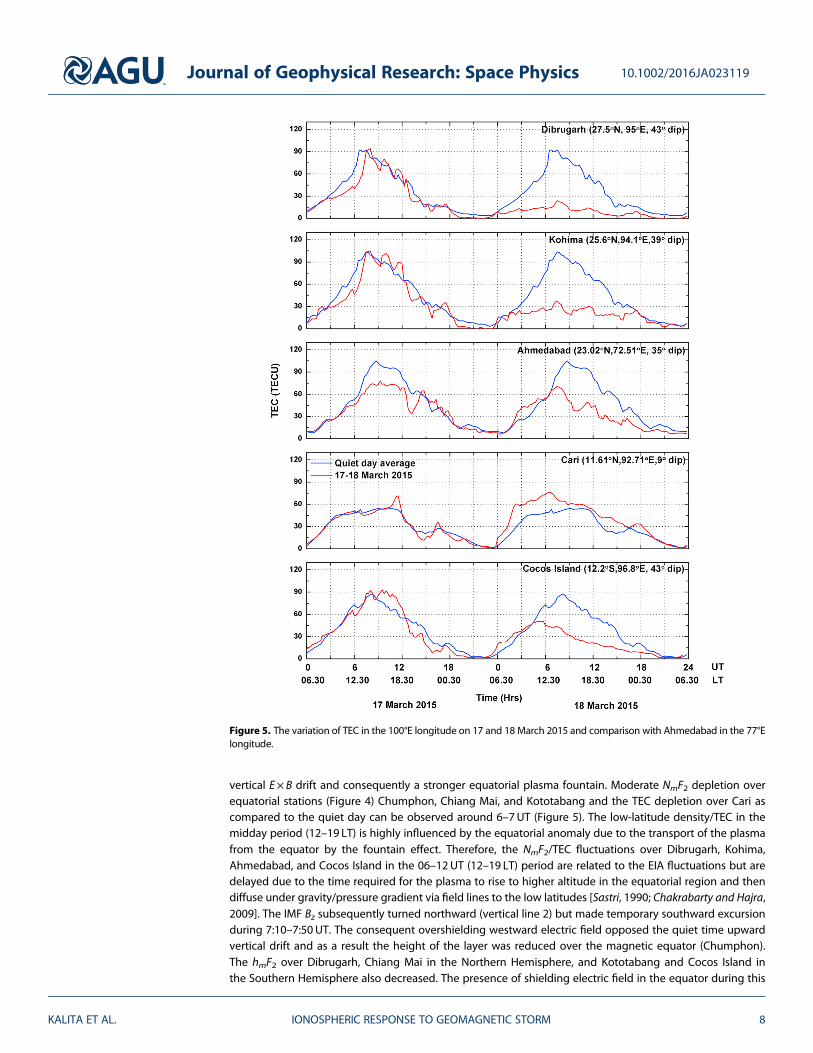
vertical E× B drift and consequently a stronger equatorial plasma fountain. Moderate NmF2 depletion overequatorial stations (Figure 4) Chumphon, Chiang Mai, and Kototabang and the TEC depletion over Cari ascompared to the quiet day can be observed around 6–7UT (Figure 5). The low-latitude density/TEC in themidday period (12–19 LT) is highly influenced by the equatorial anomaly due to the transport of the plasmafrom the equator by the fountain effect. Therefore, the NmF2/TEC fluctuations over Dibrugarh, Kohima,Ahmedabad, and Cocos Island in the 06–12UT (12–19 LT) period are related to the EIA fluctuations but aredelayed due to the time required for the plasma to rise to higher altitude in the equatorial region and thendiffuse under gravity/pressure gradient via field lines to the low latitudes [Sastri, 1990; Chakrabarty and Hajra,2009]. The IMF Bz subsequently turned northward (vertical line 2) but made temporary southward excursionduring 7:10–7:50 UT. The consequent overshielding westward electric field opposed the quiet time upwardvertical drift and as a result the height of the layer was reduced over the magnetic equator (Chumphon).The hmF2 over Dibrugarh, Chiang Mai in the Northern Hemisphere, and Kototabang and Cocos Island inthe Southern Hemisphere also decreased. The presence of shielding electric field in the equator during this
Figure 5. The variation of TEC in the 100°E longitude on 17 and 18 March 2015 and comparison with Ahmedabad in the 77°Elongitude.
Journal of Geophysical Research: Space Physics 10.1002/2016JA023119
KALITA ET AL. IONOSPHERIC RESPONSE TO GEOMAGNETIC STORM 8

period is confirmed by the decreasing electrojet strength (Figure 2). Consequently, the equatorial plasmafountain is weakened, and the equatorial NmF2 is stabilized. Subsequently, the IMF Bz turned southwardaround 7:45 UT (vertical line 3) and remained so for an extended duration. The weak electrojet and the insig-nificant hmF2 change over Chumphon during this period indicate that in this case the quiet time zonal electricfield in the local afternoon sector (08–10UT) was not altered significantly. The increase in ASY-D (Figure 2)during this period suggests increase in region 2 field-aligned currents. The low-latitude TEC in the 100°E long-itude sector (Dibrugarh, Kohima, and Cocos Island) fluctuated rapidly, whereas the TEC at the crest of EIA inthe 77°E longitude sector (Ahmedabad) was saturated (Figure 5). The fluctuations in the TEC could be due tofluctuating strength of the equatorial fountain. The northward turning of IMF Bz after 9 UT (vertical line 4)which remained so till around 12UT caused the hmF2 to decrease at all the stations. The presence of west-ward electric field in equatorial and low latitudes can be inferred from the counter electrojet event andthe lower values of the hmF2 as compared to the quiet day values. The prolonged southward IMF Bz previously(7:50–9:30 UT) allowed the growth of the overshielding westward electric field. The maximum NmF2 overChumphon and Chiang Mai (and minor enhancement in Kototabang) were registered around 11:30–12UT(vertical line 5) coinciding with the recovery from the minimum of hmF2 when the IMF Bz was still pointingnorth. The NmF2 over Chumphon and Chiang Mai almost doubled within just 1 h and showed enhancements
Figure 6. The variation of hmF2 in the 100°E meridional chain on 17 March 2015.
Journal of Geophysical Research: Space Physics 10.1002/2016JA023119
KALITA ET AL. IONOSPHERIC RESPONSE TO GEOMAGNETIC STORM 9
of about 40% from the quiet time value.The asymmetry between Chiang Maiand Kototabang is noteworthy andcould be related to the slightly differentdip angles or the hemispherical asym-metry in the EIA. The TEC in the equator-ial region (Cari) of 100°E longitudesector exhibited a peak around 12UT,whereas the NmF2/TEC at low latitudeshowed smaller enhancements atslightly earlier time. The NmF2/TECenhancements in the same period arealso reported from the Indian sector at77°E longitude [Singh et al., 2015]. Asthe IMF Bz was northward with the sub-storm in the recovery phase from 9:45 to11:15 UT, the hmF2 in all equatorial sta-
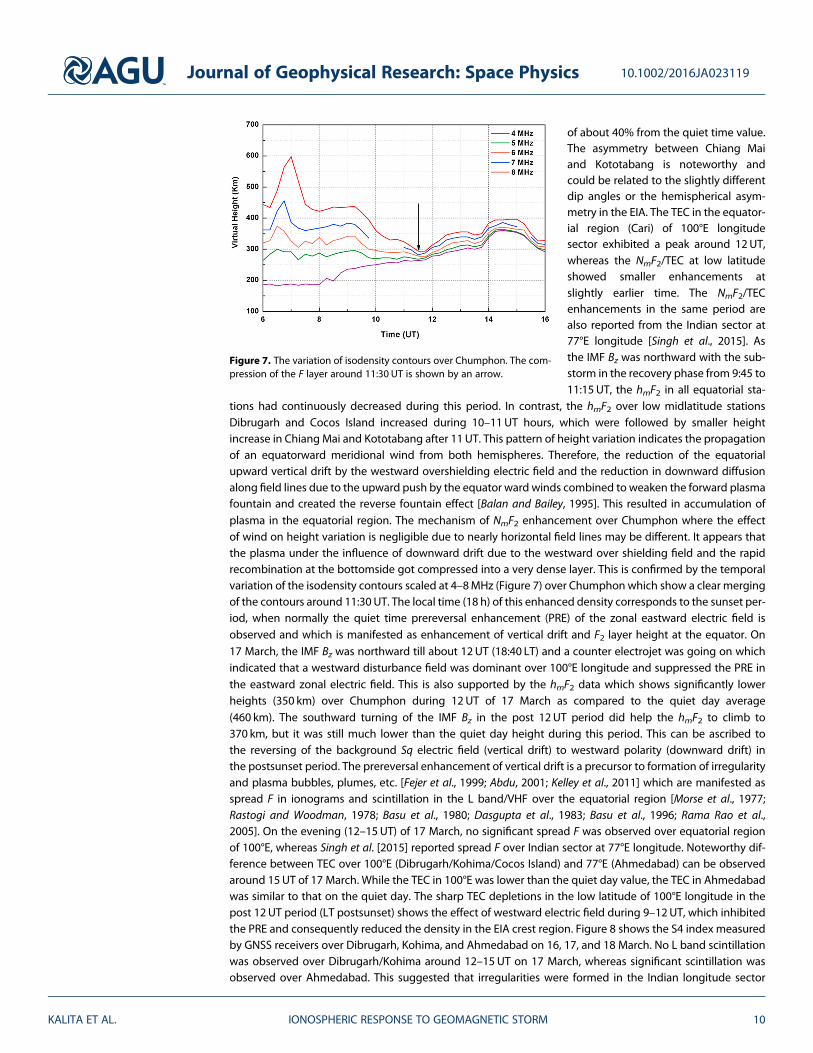
tions had continuously decreased during this period. In contrast, the hmF2 over low midlatitude stationsDibrugarh and Cocos Island increased during 10–11UT hours, which were followed by smaller heightincrease in Chiang Mai and Kototabang after 11UT. This pattern of height variation indicates the propagationof an equatorward meridional wind from both hemispheres. Therefore, the reduction of the equatorialupward vertical drift by the westward overshielding electric field and the reduction in downward diffusionalong field lines due to the upward push by the equator ward winds combined to weaken the forward plasmafountain and created the reverse fountain effect [Balan and Bailey, 1995]. This resulted in accumulation ofplasma in the equatorial region. The mechanism of NmF2 enhancement over Chumphon where the effectof wind on height variation is negligible due to nearly horizontal field lines may be different. It appears thatthe plasma under the influence of downward drift due to the westward over shielding field and the rapidrecombination at the bottomside got compressed into a very dense layer. This is confirmed by the temporalvariation of the isodensity contours scaled at 4–8MHz (Figure 7) over Chumphon which show a clear mergingof the contours around 11:30 UT. The local time (18 h) of this enhanced density corresponds to the sunset per-iod, when normally the quiet time prereversal enhancement (PRE) of the zonal eastward electric field isobserved and which is manifested as enhancement of vertical drift and F2 layer height at the equator. On17 March, the IMF Bz was northward till about 12UT (18:40 LT) and a counter electrojet was going on whichindicated that a westward disturbance field was dominant over 100°E longitude and suppressed the PRE inthe eastward zonal electric field. This is also supported by the hmF2 data which shows significantly lowerheights (350 km) over Chumphon during 12UT of 17 March as compared to the quiet day average(460 km). The southward turning of the IMF Bz in the post 12UT period did help the hmF2 to climb to370 km, but it was still much lower than the quiet day height during this period. This can be ascribed tothe reversing of the background Sq electric field (vertical drift) to westward polarity (downward drift) inthe postsunset period. The prereversal enhancement of vertical drift is a precursor to formation of irregularityand plasma bubbles, plumes, etc. [Fejer et al., 1999; Abdu, 2001; Kelley et al., 2011] which are manifested asspread F in ionograms and scintillation in the L band/VHF over the equatorial region [Morse et al., 1977;Rastogi and Woodman, 1978; Basu et al., 1980; Dasgupta et al., 1983; Basu et al., 1996; Rama Rao et al.,2005]. On the evening (12–15UT) of 17 March, no significant spread F was observed over equatorial regionof 100°E, whereas Singh et al. [2015] reported spread F over Indian sector at 77°E longitude. Noteworthy dif-ference between TEC over 100°E (Dibrugarh/Kohima/Cocos Island) and 77°E (Ahmedabad) can be observedaround 15UT of 17 March. While the TEC in 100°E was lower than the quiet day value, the TEC in Ahmedabadwas similar to that on the quiet day. The sharp TEC depletions in the low latitude of 100°E longitude in thepost 12UT period (LT postsunset) shows the effect of westward electric field during 9–12UT, which inhibitedthe PRE and consequently reduced the density in the EIA crest region. Figure 8 shows the S4 index measuredby GNSS receivers over Dibrugarh, Kohima, and Ahmedabad on 16, 17, and 18 March. No L band scintillationwas observed over Dibrugarh/Kohima around 12–15UT on 17 March, whereas significant scintillation wasobserved over Ahmedabad. This suggested that irregularities were formed in the Indian longitude sector
Figure 7. The variation of isodensity contours over Chumphon. The com-pression of the F layer around 11:30 UT is shown by an arrow.
Journal of Geophysical Research: Space Physics 10.1002/2016JA023119
KALITA ET AL. IONOSPHERIC RESPONSE TO GEOMAGNETIC STORM 10

on 17March as confirmed by Singh et al. [2015] and Tulasi Ram et al. [2016]. The presence of an eastward PPEFdue to the southward turning of the IMF Bz after 12 UT coincided with the sunset period (PRE occurrencetime) in the 77°E (LT =UT + 5:30) longitude sector and thereby supported the irregularity formation. On theother hand northward IMF Bz prior to 12UT inhibited PRE in the 100°E longitude sector which is about1.5 h ahead in LT. The absence (presence) of PRE in the 100°E (77°E) longitude shows the critical role playedby the direction of interplanetary magnetic field in storm time response of the ionosphere and the modifica-tion of the quite time equatorial electrodynamics by storm-induced currents/fields. The IMF Bz remainedsouthward from 12UT (18:30 LT) to midnight (6:30 LT) with the minimum IMF Bz values of around 30 nT beingrecorded during 13–14UT. The height variations (hmF2) more or less followed the modulation of the IMF Bzand the substorm development-recovery phase as indicated by variations in AE index. The large substormdevelopment (Figure 2) was followed by height increase over all the stations during 13–14UT. The quiet timeelectric fields during this period are mainly westward providing downward drift, and therefore, the penetra-tion electric field perturbation can be inferred from the large height increases. The equatorward neutralwinds amplified the height increase over low midlatitude stations (the different scale in Dibrugarh andCocos Island is to be noted) as compared to the equatorial stations. The higher NmF2 (Figure 4) across all thestations was due to the reduced recombination at higher altitude. The height enhancements during 16 UTand 19 UT seem to be related to the meridional winds as the corresponding height change overChumphon at the equator was insignificant. Sudden increase in the hmF2 (Figure 3) is observed across allthe station during 23:00–23:30 UT (05:00–05:30 LT). The F layer over the equatorial stations Chumphon,Chiang Mai, and Kototabang recorded their highest hmF2 of around 700 km with the formation of F3-likeledge at higher altitude. This large (~100%) increase from the quiet time value is due to large vertical driftcaused by an eastward electric field or equator ward neutral meridional winds. The simultaneous increase(with magnetic equator) across all latitudes points favorably to an eastward electric field which may resultfrom the PPEF associated with substorm development and recovery or/and the disturbance dynamo electric
Figure 8. The S4 index for 16–18 March 2015 showing the scintillations over Ahmedabad in the local evening of 17 March.The elevation angle is cutoff at 30°.
Journal of Geophysical Research: Space Physics 10.1002/2016JA023119
KALITA ET AL. IONOSPHERIC RESPONSE TO GEOMAGNETIC STORM 11
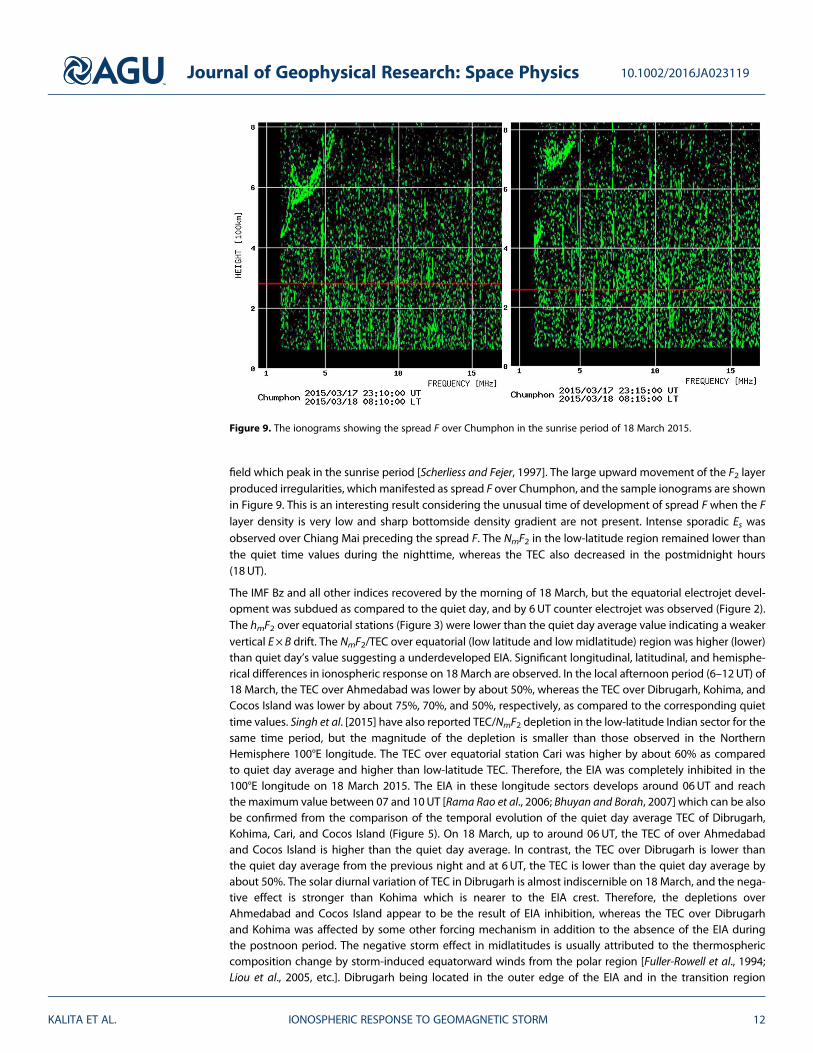
field which peak in the sunrise period [Scherliess and Fejer, 1997]. The large upward movement of the F2 layerproduced irregularities, which manifested as spread F over Chumphon, and the sample ionograms are shownin Figure 9. This is an interesting result considering the unusual time of development of spread F when the Flayer density is very low and sharp bottomside density gradient are not present. Intense sporadic Es wasobserved over Chiang Mai preceding the spread F. The NmF2 in the low-latitude region remained lower thanthe quiet time values during the nighttime, whereas the TEC also decreased in the postmidnight hours(18UT).
The IMF Bz and all other indices recovered by the morning of 18 March, but the equatorial electrojet devel-opment was subdued as compared to the quiet day, and by 6UT counter electrojet was observed (Figure 2).The hmF2 over equatorial stations (Figure 3) were lower than the quiet day average value indicating a weakervertical E× B drift. The NmF2/TEC over equatorial (low latitude and low midlatitude) region was higher (lower)than quiet day’s value suggesting a underdeveloped EIA. Significant longitudinal, latitudinal, and hemisphe-rical differences in ionospheric response on 18 March are observed. In the local afternoon period (6–12UT) of18 March, the TEC over Ahmedabad was lower by about 50%, whereas the TEC over Dibrugarh, Kohima, andCocos Island was lower by about 75%, 70%, and 50%, respectively, as compared to the corresponding quiettime values. Singh et al. [2015] have also reported TEC/NmF2 depletion in the low-latitude Indian sector for thesame time period, but the magnitude of the depletion is smaller than those observed in the NorthernHemisphere 100°E longitude. The TEC over equatorial station Cari was higher by about 60% as comparedto quiet day average and higher than low-latitude TEC. Therefore, the EIA was completely inhibited in the100°E longitude on 18 March 2015. The EIA in these longitude sectors develops around 06UT and reachthe maximum value between 07 and 10UT [Rama Rao et al., 2006; Bhuyan and Borah, 2007] which can be alsobe confirmed from the comparison of the temporal evolution of the quiet day average TEC of Dibrugarh,Kohima, Cari, and Cocos Island (Figure 5). On 18 March, up to around 06UT, the TEC of over Ahmedabadand Cocos Island is higher than the quiet day average. In contrast, the TEC over Dibrugarh is lower thanthe quiet day average from the previous night and at 6UT, the TEC is lower than the quiet day average byabout 50%. The solar diurnal variation of TEC in Dibrugarh is almost indiscernible on 18 March, and the nega-tive effect is stronger than Kohima which is nearer to the EIA crest. Therefore, the depletions overAhmedabad and Cocos Island appear to be the result of EIA inhibition, whereas the TEC over Dibrugarhand Kohima was affected by some other forcing mechanism in addition to the absence of the EIA duringthe postnoon period. The negative storm effect in midlatitudes is usually attributed to the thermosphericcomposition change by storm-induced equatorward winds from the polar region [Fuller-Rowell et al., 1994;Liou et al., 2005, etc.]. Dibrugarh being located in the outer edge of the EIA and in the transition region
Figure 9. The ionograms showing the spread F over Chumphon in the sunrise period of 18 March 2015.
Journal of Geophysical Research: Space Physics 10.1002/2016JA023119
KALITA ET AL. IONOSPHERIC RESPONSE TO GEOMAGNETIC STORM 12

Figure 10. The image of global distribution of O/N2 ratio on 15, 17, and 18 March 2015 as measured by TIMED/GUVI satel-lite. The 17 and 18 March are shown for the main phase and recovery phase of the storm, while 15 March is the nearestquiet day for comparison. The equatorward expansion of lower O/N2 ratio thermospheric composition along the 100°E inNorthern Hemisphere and along 120°E in Southern Hemisphere on 18 March may be noted.
Journal of Geophysical Research: Space Physics 10.1002/2016JA023119
KALITA ET AL. IONOSPHERIC RESPONSE TO GEOMAGNETIC STORM 13

between low and middle latitudes is likely to be affected by neutral composition disturbances traveling fromhigh latitudes. The thermospheric effects along 100°E are discussed in the next section.
4.2. The Thermospheric Response
During strong geomagnetic activity, the density of molecular species relative to atomic oxygen is enhancedin the polar region and these changes expand up to middle and low latitudes [Prölss, 1987]. Good correlationof the decrease of NmF2/TEC (or F2 layer critical frequency) to the directly measured [O/N2] ratio changes hasbeen reported previously [Prölss and von Zahn, 1974; Prölss, 1987; Burns et al., 1991, Fuller-Rowell et al., 1994].The enhanced molecular density and temperature lead to higher recombination rates and cause densitydepletion in middle and low latitudes. Astafyeva et al. [2015] reported large depletion of O/N2 ratio within100°–130°E during 18 March 2015 which reached the low latitudes in the Asian sector. The GUVI image of18 March 2015 around 10 LT (Figure 10) indicate a very large decrease in O/N2 ratio (~0.4) in the NorthernHemisphere of 100°E and insignificant thermospheric disturbance in the conjugate Southern Hemisphereas well in the 77°E. According to Prölss [1993], the disturbed thermospheric composition or region ofenhanced molecular species expands toward the low latitudes in the night sectors when the backgroundcondition of lower ion drag and equatorward wind acts favorably. These changes can move into the daysidedue to the corotation effect [Kil et al., 2011] and consequently affect daytime density. In previous discussionof hmF2 variations (Figures 3 and 6), it was noted that in the period starting 10:30 UT (17LT) of 17 March, theheight variation over the magnetic equator and the off equator stations in 100°E are not simultaneous at allhours and large fluctuations in the ionospheric parameters (hmF2, NmF2, and TEC) in the low midlatitudes(Dibrugarh and Cocos Island) as well as at the off magnetic equator stations (Chiang Mai and Kototabang)indicated the propagation of meridional winds or traveling disturbances. The storm-induced joule heatingat the polar region set up equatorward meridional winds that add to the quiet time equatorward wind inthe premidnight period [Titheridge, 1995]. The SEALION network of ionosondes at Chiang Mai, Chumphon,and Kototabang has been used previously to estimate the thermospheric meridional winds [Maruyamaet al., 2007] with one station (Chumphon) at the geomagnetic equator and the other two stations (ChiangMai and Kototabang) slightly off the equator at magnetic conjugate points. In this study, we use the virtualheight h′F obtained by scaling the ionograms of these three stations at 2.5 and 3MHz during the night of17 March to estimate the Northern Hemisphere and Southern Hemisphere meridional thermospheric winds
Figure 11. The meridional wind velocity along 100°E longitude from SEALION ionosonde network. Positive values indicatepoleward velocity.
Journal of Geophysical Research: Space Physics 10.1002/2016JA023119
KALITA ET AL. IONOSPHERIC RESPONSE TO GEOMAGNETIC STORM 14

following Krishna Murthy et al. [1990]. The estimated winds are shown in Figure 11 for the 11:30–23:00 UT per-iod which corresponds to local night time. The top and bottom panels show the Northern Hemisphere andSouthern Hemisphere winds, respectively, along with the average quiet day winds for comparison. It isobserved that the wind direction fluctuated during the night of 17 March as compared to the quiet daywinds. Large equatorward wind surges in the main phase of the storm at around 16UT and 19UT can beinferred, which are about 3.5 h after the major substorm development at 12:20 UT and 16UT as indicatedby the AE index. The pattern of the winds was also estimated by the method of Maruyama et al. [2007] usingthe model behavior for an equatorial and two magnetic conjugate stations. The virtual heights of the F layerover Chiang Mai, Chumphon, and Kototabang scaled from the ionograms at 2.5MHz are plotted in Figure 12.The relatively higher heights in off equator stations as compared to the equatorial station confirm equator-ward wind surge during 16UT and 19UT. These height patterns and the periodic variations in the NmF2/TEC obtained from the spaced ionosonde/TEC observations manifest the traveling ionospheric disturbances(TID) associated with the propagation of traveling atmospheric disturbance (TAD) due to the storm-inducedacoustic gravity waves (AGWs). The sequence of the relative heights at the stations located on the magneticequator and conjugate points also suggest that the TIDs due to the AGW traveling from both the hemi-spheres interfered in the equator and then passed through to the other hemisphere as suggested byHajkowicz and Hunsucker [1987], Fuller-Rowell et al. [1994], and Balthazor and Moffett [1997]. The passage ofgravity waves can create sporadic Es layer [Nygrén et al., 1990; Shalimov et al., 2009], and such a sporadic Eslayer was observed over the low midlatitude station Cocos Island during 15–17UT on 17 March (not shown)that resulted in complete blanketing of the F layer above. The velocity of the TID is estimated using theground distances between Chiang Mai-Chumphon and Kototabang-Chumphon and is found to be around430m/s and 370m/s for Northern Hemisphere and Southern Hemisphere TIDs, respectively. These speedsare comparable to the equatorward speed of LSTID predicted by Hajkowicz [1991] but lower than the speedof 600m/s predicted by Fuller-Rowell et al. [1994]. Therefore, the conjugate hemispherical TEC difference(Dibrugarh-Cocos Island) is likely a thermospheric effect due to asymmetric thermospheric circulations andgeographic differences between the stations. The disturbed thermospheric circulation on 18 March is furtherconfirmed by the observation of TID associated with AGW during the daytime over Cocos Island. The
Figure 12. The virtual height scaled at 2.5 MHz from the SEALIONmeridional chain indicating the presence of equatorwardmeridional wind around 16 UT and 19 UT on 17 March 2015.
Journal of Geophysical Research: Space Physics 10.1002/2016JA023119
KALITA ET AL. IONOSPHERIC RESPONSE TO GEOMAGNETIC STORM 15

ionograms in Cocos Island around 2:30–3:00UT (~9:30 LT) show an additional upward ledge in the F2 tracewhich move initially in overhead direction and then move away (Figure 13). The isodensity contours overCocos Island scaled at 4–7MHz for the same period (Figure 14) show the downward traveling phase front.
4.3. The Ionospheric Response on 17–18 March 2013
The geomagnetic activity indices for the 2013 St. Patrick’s Day storm are shown in Figure 15. The stormstarted at 6:00 UT (SSC), and the first southward excursion of the IMF Bz was observed around 6:20UT. Thestormwas less severe than the 2015 storm as minimum SYM-Hwas around�120 nT, and the IMF Bz remainedhigher than �20 nT throughout. The response of the ionospheric height hmF2 for the four stations along
the 100°E, Chiang Mai, Bac Lieu,Kototabang, and Cocos Island, is shownin Figure 16. Ionosonde data forChumphon and Dibrugarh for theperiod of 16–18 March 2013 are notavailable. The height variation over theequatorial station Bac Lieu on 17March was modulated by the south-ward and northward turning of the IMFBz. Increase in hmF2 around 7UT due tothe first southward turning of IMF Bzand subsequent decrease with north-ward turning prior to 9 UT is observed.The counter electrojet around 10–11UT(local afternoon) suggested a westwardovershielding electric field, and conse-quently, the lowest hmF2 was recordedduring this period due to the net driftbeing downward. Southward IMF Bzaround 12UT (18:30 LT) resulted in large
Figure 13. The sequence of only ordinary ray trace (O-ray) of ionograms over Cocos Island showing the passage of thetraveling ionospheric disturbance (TID). The transient satellite trace due to traveling disturbance is marked by arrow.
Figure 14. The isodensity contours over Cocos Island showing the down-ward propagating phase during the passage of the TID.
Journal of Geophysical Research: Space Physics 10.1002/2016JA023119
KALITA ET AL. IONOSPHERIC RESPONSE TO GEOMAGNETIC STORM 16

height increase over Chinag Mai and spread F over Bac Lieu (Figure 17). L band scintillations were recorded bythe GPS receiver in Dibrugarh (Figure 18) but not in Bangalore in the Indian sector. In the postsunset period, thehmF2 over Bac Lieu was enhanced around 17UT coinciding with the substorm development (AE index). ThehmF2 in Chiang Mai and Kototabang was enhanced around 19UT without corresponding enhancement overBac Lieu. Similar to the 2015 storm response, simultaneous height increase but with lower magnitude(hmF2 ~ 500km) were observed around 22–23UT in all stations. This coincided with the local sunrise periodand resulted in spread F over Bac Lieu. On 18 March, the height variation was almost the same as that onthe quiet day with daytime hmF2 magnitude over Chiang Mai and Kototabang slightly lower than that on thequiet day. The EEJ was very weak on 18 March, but no counter electrojet was observed. The NmF2 measure-ments over ChiangMai, Bac Lieu, Kototabang, and Cocos Island are shown in Figure 19. The NmF2 over equator-ial region was higher than the quiet day values in the local afternoon period and showed a peak around 12UT.In the postsunset period, the maximum diurnal NmF2 over Kototabang was recorded around 15UT (21 LT) with
Figure 15. The z component of interplanetary magnetic field IMF Bz, the solar wind speed, the auroral elctrojet index AE,the symmetric ring current index SYM-H, asymmetric ring current index ASY-D, and the equatorial electrojet (EEJ) indicesfor the period of 16–18 March 2013.
Journal of Geophysical Research: Space Physics 10.1002/2016JA023119
KALITA ET AL. IONOSPHERIC RESPONSE TO GEOMAGNETIC STORM 17

similar but lower amplitude enhancements over Bac Lieu and ChiangMai. In Cocos Island, the NmF2 on the localevening of 17March to earlymorning period of 18Marchwas lower than the equatorial values, and therefore, theequatorial anomaly was inhibited in the local nighttime. On 18 March, the NmF2 was enhanced (depleted) inthe equatorial stations (low latitude) as compared to the quiet day values. In low-latitude station Cocos Island,the daytime NmF2 reduction was severe (>66%) as compared the NmF2 enhancements in equatorial stations(~33%). The TEC for the 100°E longitude stations Dibrugarh, Port Blair, and Cocos Island and the 77°E longitudestations Lucknow and Bangalore are shown in Figure 20. Significant TEC enhancements over Dibrugarh andCocos Island can be observed after storm commencement on 17March in contrast to Lucknow in the Indian sec-tor. The TEC in the equatorial stations, Port Blair and Bangalore, was enhanced in the local afternoon sector,whereas the TEC in Dibrugarh and Lucknow exhibited rapid fluctuations. Dibrugarh recorded a secondary peakin the postsunset period, whereas Cocos Island on Southern Hemisphere showed flatter TEC. The disturbed dayTEC in the postsunset period was higher in the equatorial region as compared to the low-latitude region indicat-ing the inhibition of EIA in both longitudes. TEC enhancements (depletion) are observed in the equatorial region(low latitude) indicating positive (negative) storm effect in the recovery phase. Therefore, the TEC mirrored the
Figure 16. The variation of F2 layer height hmF2 in the 100°E longitude on 17 and 18 March 2013.
Journal of Geophysical Research: Space Physics 10.1002/2016JA023119
KALITA ET AL. IONOSPHERIC RESPONSE TO GEOMAGNETIC STORM 18

behavior of the NmF2. TEC enhancements of about 35% in equatorial stations and TEC depletion of about 20%,40%, and 66% in Dibrugarh, Lucknow, and Cocos Island, respectively, were observed. In contrast to the stormresponse on St. Patrick’s Day of 2015, in 2013, the negative effect is stronger in the Southern Hemisphere stationCocos Island relative to the Northern Hemisphere station Dibrugarh. On the night of 17 March, TEC overDibrugarh is almost same as the quiet day TEC, whereas the TEC over Cocos Island is lower than quiet time values.On 18 March, the TEC in Cocos Island starts to decrease after 4UT (10:30 LT), whereas Dibrugarh and LucknowTEC decreases only after 8UT (12:30 LT). On 18 March, the EEJ was weaker as compared to that on 16 Marchand can explain the equatorial enhancement and the postnoon low-latitude depletion as due to the weakeningof the plasma fountain/EIA. The severe TEC and NmF2 (~58%) depletion over Cocos Island on 18 March coincidedwith the decrease of O/N2 ratio to~0.6 in the forenoon period (~10 LT) of 100°–130°E in the SouthernHemisphere as observed from TIMED/GUVI image (Figure 21). It is interesting to note that during 18 March2015, such severe O/N2 change in the forenoon was observed for the Northern Hemisphere low latitude andcoincided with severe negative effect over Dibrugarh and Kohima. The longitudinal expansion of the thermo-spheric disturbance seems to be limited to a narrow belt around 100–130°E and the Indian sector was lessaffected in the forenoon period. This behavior is similar to the 2015 storm response and indicative of the sharplongitudinal variability of the storm time dynamics. Therefore, even though the GUVI measurements are for avery brief period in the forenoon, it is indicative of the level of negative storm effect during the peak daytimehours.
To estimate the neutral meridional circulations on the night of 17 March, the virtual heights scaled at 2.5MHzfrom ionograms over Bac Lieu, Chiang Mai, and Kototabang are shown in Figure 22 for the 11:30–23:30 UT
Figure 17. The ionograms over Bac Lieu showing the postsunset F2 layer on a 16 March and spread F during 17 March 2013.
Journal of Geophysical Research: Space Physics 10.1002/2016JA023119
KALITA ET AL. IONOSPHERIC RESPONSE TO GEOMAGNETIC STORM 19

hours. Chiang Mai and Kototabang are almost at the same meridian (~99–100°E), while Bac Lieu is at slightlydifferent meridian (~106°E). Due to the data unavailability over 99°E meridian station Chumphon, the meri-dional winds could not be calculated and the height variations in Figure 22 are used as indicator of meridio-nal winds in this sector. The evening height increase related to the PRE is observed over Bac Lieu but not inthe other two equatorial stations. The height enhancement around 19UT over Chiang Mai and Kototabangand the absence over Bac Lieu suggest that these changes are due to the thermospheric meridional winds.The variations in the nighttime NmF2 (Figure 19) can be ascribed to the height variations. The simultaneousheight enhancement around 22:30 UT which corresponds to the sunrise period in local time could be relatedto the PPEF and/or disturbance dynamo drift [Scherliess and Fejer, 1997].
4.4. The Comparison of the Ionospheric Response in 2013 and 2015
The ionospheric response to the 17–18March geomagnetic storms in 2013 and 2015 are similar in the follow-ing aspects:
1. The southward (northward) turning of the IMF Bzwas reflected as increase (decrease) of the hmF2 and fluc-tuations in NmF2 and TEC. During themain phase of both the storm, significant fluctuations in the equatorialzonal electric field due to the penetration of magnetospheric convective electric fields could be inferred.
2. The equatorial NmF2/TEC during both the storms was enhanced in the sunset period, whereas the low-latitude NmF2/TEC was depleted in the postsunset sector, thereby indicating the inhibition of the night-time EIA.
3. Large nighttime variations in the hmF2, NmF2, and TEC were observed in the 100°E meridian on storm daydue to traveling disturbances.
4. Sharp height increase and ESF was observed during the sunrise period of 18 March. The early morningheight enhancements were larger in 2015 as compared to that in 2013. To investigate the cause of thisheight enhancement, the empirical vertical drift model after Scherliess and Fejer [1997] was used to obtain
Figure 18. The S4 index for 16–18 March 2013 showing the scintillations over Dibrugarh in the local evening of 17 March.The elevation angle is cutoff at 30°.
Journal of Geophysical Research: Space Physics 10.1002/2016JA023119
KALITA ET AL. IONOSPHERIC RESPONSE TO GEOMAGNETIC STORM 20

the vertical drift on 17 March. The model uses the AE index and the F10.7 flux data as input and provides thequiet time drift, PPEF, and disturbance dynamo drift and the total drift. The drift due to the PPEF and thedisturbance dynamo electric field and the total drift (quiet time+disturbed drift) are shown in Figure 23 (leftcolumn). The model predicted very high upward vertical drift during the local sunrise hours for boththe storm with higher amplitude in 2015 (~40m/s) which is supported by much higher measured hmF2 dur-ing 2015 (~700 km; Figure 3) as compared to 2013 (~500km; Figure 16). In 2015, the model-predicted ver-tical drift in the sunrise period of 18 March is higher than the drift during evening PRE of 17 March. Thevertical drift estimated from the rate of change of nighttime virtual height (h′F) over Bac Lieu in 2013 andChumphon in 2015 are comparedwith themodel drift in Figure 23 (right column). The observed vertical driftduring sunrise of 18 March 2015 (2013) is larger than (same as) drift during sunset period of 17 March 2015(2013). The observed drift during sunrise is slightly delayed and larger (in 2013) than the model drift. Suchunusually large upward drift resulted in the irregularity development and ESF during sunrise period in boththe storms.
In spite of this generally similar response of the ionosphere during the St. Patrick’s Day storms of 2013 and2015, the following subtle differences were noted:
1. The northward (southward) direction of the IMF Bz during the sunset period of 17 March 2015 (2013)inhibited (enhanced) the prereversal enhancement (PRE) in zonal electric field and consequent irregular-ity formation.
Figure 19. The variation of F2 layer peak density NmF2 in the 100°E on 17 and 18 March 2013. The scales for the equatorialand low-latitude station are different to highlight the fluctuations.
Journal of Geophysical Research: Space Physics 10.1002/2016JA023119
KALITA ET AL. IONOSPHERIC RESPONSE TO GEOMAGNETIC STORM 21

2. Postsunset irregularities caused ESF and scintillations in the 100°E, but no scintillations were observed inthe 77°E during the evening of 17 March 2013. The response was reversed during the evening of 17 March2015 when ESF and L band amplitude scintillations were observed over the Indian sector but not in the100°E sector. These longitudinal differences are attributed to the local time variation of electrodynamicprocesses with the changing direction of IMF Bz.
3. The EIA was weakened on 18 March 2013, whereas it was completely inhibited on 18 March 2015.4. The negative (positive) effect of the storm in the recovery phase of the storm (18 March) in low-latitude
(equatorial) region was stronger in 2015 as compared to 2013. The negative effect of the storm wasmarked by longitudinal and hemispherical asymmetry. In 2013, the O/N2 depletions around 10 LT andthe negative storm effect in TEC were severe in the Southern Hemisphere station Cocos Island ascompared to the moderate effect in the Northern Hemisphere conjugate station Dibrugarh. The oppositethermospheric-ionospheric response was observed in 2015 as the forenoon compositional changeand TEC depletions were stronger over Dibrugarh. The severe negative storm effect over Dibrugarh in
Figure 20. The variation of TEC in the 100°E longitude on 17 and 18 March 2013 and comparison with TEC in 77°Elongitude.
Journal of Geophysical Research: Space Physics 10.1002/2016JA023119
KALITA ET AL. IONOSPHERIC RESPONSE TO GEOMAGNETIC STORM 22

Figure 21. The image of global distribution of O/N2 ratio on 13, 17, and 18March 2013 asmeasured by TIMED/GUVI satellite.The image of 17 and 18March show themain phase and recovery phase of the storm,while 13March is the nearest quiet dayfor comparison. Theequatorwardexpansion of lowerO/N2 ratio thermospheric composition can benoted around100–120°E inSouthern Hemisphere on 18 March. In contrast no such expansion to northern low latitude is observed.
Journal of Geophysical Research: Space Physics 10.1002/2016JA023119
KALITA ET AL. IONOSPHERIC RESPONSE TO GEOMAGNETIC STORM 23

2015 cannot be attributed to the electrodynamics alone as the effect was much stronger than the corre-sponding positive (negative) effect at the equator (conjugate location) and preceded the equatorialanomaly development. The negative effect in Kohima which is closer to the EIA crest was also compara-tively less severe than that in Dibrugarh. Similarly, the negative effect over Cocos Island in 2013 was muchstronger than the corresponding enhancement (depletion) over equatorial region (Dibrugarh). In both
Figure 22. The nighttime virtual height at 2.5 MHz indicating the presence of equatorward meridional winds during 19 UT(01:30 LT) of 17 March 2013.
Figure 23. (left column) The variation of model vertical drift due to the PPEF and the Disturbance Dynamo and the total(quiet + disturbance) drift on 17 March. (right column) The comparison of the model drift with the observed drift overBac Lieu (in 2013) and Chumphon (in 2015) estimated from the rate of change of night time virtual height.
Journal of Geophysical Research: Space Physics 10.1002/2016JA023119
KALITA ET AL. IONOSPHERIC RESPONSE TO GEOMAGNETIC STORM 24

these cases, thermospheric composition played a significant role as hinted by the O/N2 measurement inthe forenoon period. Therefore, the severe negative storm effect in Dibrugarh/Kohima in 2015 and inCocos Island in 2013 is attributed to combined effect of electrodynamic and thermospheric perturbations.
5. The longitudinal asymmetry of ionospheric response vis-a-vis the negative effect is observed. The longi-tudinal differences in the disturbance dynamo electric fields, thermospheric circulation, and magneticpole offset as well as the unknown longitudinal variation in the auroral energy deposition may contributetoward the longitudinal asymmetry.
6. Significant thermospheric effect in the 100°E longitude sector lasted till 18 March 2015 as shown by TIDover Cocos Island.
5. Conclusions
The ionospheric response to the St. Patrick’s Day storms of 2013 and 2015 along the 100°E meridian ispresented using multi-instrument data from magnetically near conjugate stations from middle to low andequatorial latitudes. The observations are also compared with that in the Indian sector. The conclusionscan be summarized as below:
1. The ebb and flow of the equatorial plasma fountain induced by the perturbation of zonal electric fieldcauses appreciable density and electron content variation in the equatorial anomaly region.
2. The direction of the IMF Bz during the sunset period is pivotal to the evening equatorial electrodynamics—either enhancing or inhibiting the irregularity formation.
3. The storm-induced upward vertical drift at sunrise can be larger than the drift during evening PRE. Thislead to sharp height increase and consequently enable equatorial irregularity formation (spread F).
4. The negative effect in the low latitude during the recovery phase of the stormmay be attributed to the EIAinhibition as well as thermospheric composition modification. The expansion of thermospheric composi-tional disturbance or O/N2 suppression region to the low latitudes could cause severe negative stormeffect (>50%) when it overlap with the EIA inhibition region.
5. The hemispherical asymmetry of the negative storm response is contributed mainly by the asymmetricexpansion of the disturbed thermospheric composition, whereas the longitudinal asymmetry may beattributed to electrodynamic as well as thermospheric processes.
ReferencesAbdu, M. A. (2001), Outstanding problems in the equatorial ionosphere-thermosphere electrodynamics relevant to spread F, J. Atmos. Sol.
Terr. Phys., 63, 869–884, doi:10.1016/S1364-6826(00)00201-7.Acharya, R., N. Nagori, N. Jain, S. Sunda, M. R. Sivaraman, and K. Bandyopadhyay (2007), Ionospheric studies for the implementation of
GAGAN, Indian J. Radio Space Phys., 36(5), 394–404.Astafyeva, E., I. Zakharenkova, and M. Förster (2015), Ionospheric response to the 2015 St. Patrick’s Day storm: A global multi-instrumental
overview, J. Geophys. Res. Space Physics, 120, 9023–9037, doi:10.1002/2015JA021629.Balan, N., and G. J. Bailey (1995), Equatorial plasma fountain and its effects: Possibility of an additional layer, J. Geophys. Res., 100,
21,421–21,432, doi:10.1029/95JA01555.Balan, N., et al. (2011), A statistical study of the response of the dayside equatorial F2 layer to the main phase of intense geomagnetic storms
as an indicator of penetration electric field, J. Geophys. Res., 116, A03323, doi:10.1029/2010JA016001.Balthazor, R. L., and R. J. Moffett (1997), A study of atmospheric gravity waves and travelling ionospheric disturbances at equatorial latitudes,
Ann. Geophys., 15(8), 1048–1056, doi:10.1007/s00585-997-1048-4.Basu, S., J. McClure, S. Basu, W. Hanson, and J. Aarons (1980), Coordinated study of equatorial scintillation and in situ and radar observations
of nighttime F region irregularities, J. Geophys. Res., 85, 5119–5130, doi:10.1029/JA085iA10p05119.Basu, S., et al. (1996), Scintillations, plasma drifts, and neutral winds in the equatorial ionosphere after sunset, J. Geophys. Res., 101,
26,795–26,809, doi:10.1029/96JA00760.Bhuyan, P. K., and R. Hazarika (2012), GPS TEC near the crest of the EIA at 95°E during the ascending half of solar cycle 24 and comparison
with IRI simulations, Adv. Space Res., 52, 1247–1260, doi:10.1016/j.asr.2013.06.029.Bhuyan, P. K., and R. R. Borah (2007), TEC derived from GPS network in India and comparison with the IRI, Adv. Space Res., 39(5), 830–840,
doi:10.1016/j.asr.2006.12.042.Blanc, M., and A. Richmond (1980), The ionospheric disturbance dynamo, J. Geophys. Res., 85, 1669–1686, doi:10.1029/JA085iA04p01669.Burns, A. G., T. L. Killeen, and R. G. Robie (1991), A simulation of thermospheric composition changes during an impulse storm, J. Geophys.
Res., 96, 14,153–14,167, doi:10.1029/91JA00678.Chakrabarty, S. K., and R. Hajra (2009), Electrojet control of ambient ionization near the crest of the equatorial anomaly in the Indian zone,
Ann. Geophys., 27, 93–105, doi:10.5194/angeo-27-93-2009.Chandra, H., and R. G. Rastogi (1974), Geomagnetic storm effects on ionospheric drifts and the equatorial Es over the magnetic equator, Ind.
J. Radio Space Phys., 3, 332–336.DasGupta, A., S. Basu, J. Aarons, J. A. Klobuchar, S. Basu, and A. Bushby (1983), VHF amplitude scintillations and associated electron content
depletions as observed at Arequipa, Peru, J. Atmos. Sol. Terr. Phys., 45, 15–26, doi:10.1016/S0021-9169(83)80003-8.
Journal of Geophysical Research: Space Physics 10.1002/2016JA023119
KALITA ET AL. IONOSPHERIC RESPONSE TO GEOMAGNETIC STORM 25
AcknowledgmentsThe study is sponsored by the SERB,Department of Science and Technology,Government of India through the grantSB/S4/As-127/2013. The authors aregrateful to ACE SWEPAM for providingthe IMF Bz data. The authors alsoacknowledge the NASA/GSFC’s SpacePhysics data facility’s OMNIWeb for theWind satellite IMF Bz, solar wind, AE, andASY-D index data. For SYM-H, we arethankful to World Data Center forGeomagnetism, Kyoto University. Theauthors would like thank the IndianInstitute of Geomagnetism (IIG),Mumbai, for providing the EEJ data. TheGUVI data used here are providedthrough support from the NASAMO&DA program. The GUVI instrumentwas designed and built by TheAerospace Corporation and The JohnHopkins University. The PrincipalInvestigator is Andrew B. Christensenand the Chief Scientist and the co-PI isLarry J. Paxton. The authors would liketo thank Ludger Scherliess for providingthe empirical vertical drift model andkind suggestions. Rumajyori Hzarikaand Geetashri Kakoti are grateful to DST,Government of India, for providing thefellowship under the above mentionedgrant. The work of D.Chakrabarty issupported by the Department of Space,Government of India. The ionosphericdata for Dibrugarh, Kohima,Ahmedabad, Cocos Island, and theSEALION are available with the authors.

England, S. L., S. Maus, T. J. Immel, and S. B. Mende (2006), Longitudinal variation of the E-region electric fields caused by atmospheric tides,Geophys. Res. Lett., 33, L21105, doi:10.1029/2006GL027465.
Fejer, B. G., and J. T. Emmert (2003), Low-latitude ionospheric disturbance electric field effects during the recovery phase of the19–21October 1998 magnetic storm, J. Geophys. Res., 108(A12), 1454, doi:10.1029/2003JA010190.
Fejer, B. G., L. Scherliess, and E. R. de Paula (1999), Effects of the vertical plasma drift velocity on the generation and evolution of equatorialspread F, J. Geophys. Res., 104, 19,859–19,869, doi:10.1029/1999JA900271.
Fesen, C. G., G. Crowley, and R. G. Roble (1989), Ionospheric effects at low latitudes during the March 22, 1979, geomagnetic storm,J. Geophys. Res., 94, 5405–5417, doi:10.1029/JA094iA05p05405.
Field, P. R., and H. Rishbeth (1997), The response of the ionospheric F2 layer to geomagnetic activity: an analysis of worldwide data, J. Atmos.Sol. Terr. Phys., 59(2), 163–180, doi:10.1016/S1364-6826(96)00085-5.
Field, P. R., H. Rishbeth, R. J. Moffett, D. W. Wenden, T. J. Fuller-Rowell, G. H. Millward, A. D. Aylward (1998), Modelling composition changes inF-layer storms, J. Atmos. Sol. Terr. Phys., 60(5), 523–543, doi:10.1016/S1364-6826(97)00074-6.
Fuller-Rowell, T. J., M. V. Codrescu, R. J. Moffett, and S. Quegan (1994), Response of the thermosphere and ionosphere to geomagneticstorms, J. Geophys. Res., 99, 3893–3914, doi:10.1029/93JA02015.
Hajkowicz, L. A. (1991), Auroral electrojet effect on the global occurrence pattern of large scale travelling ionospheric disturbances, Planet.Space Sci., 39(8), 1189–1196, doi:10.1016/0032-0633(91)90170-F.
Hajkowicz, L. A., and R. D. Hunsucker (1987), A simultaneous observation of large-scale periodic TIDs in both hemispheres following an onsetof auroral disturbances, Planet. Space Sci., 35, 785–791, doi:10.1016/0032-0633(87)90038-9.
Immel, T. J., E. Sagawa, S. L. England, S. B. Henderson, M. E. Hagan, S. B. Mende, H. U. Frey, C. M. Swenson, and L. J. Paxton (2006), The controlof equatorial ionospheric morphology by atmospheric tides, Geophys. Res. Lett., 33, L15108, doi:10.1029/2006GL026161.
Kamide, Y., R. L. McPherron, W. D. Gonzalez, D. C. Hamilton, H. S. Hudson, J. A. Joselyn, S. W. Kahler, L. R. Lyons, H. Lundstedt, andE. Szuszczewicz (1997), Magnetic storms: Current understanding and outstanding questions, inMagnetic Storms, edited by B. T. Tsurutani,et al., pp. 1–19, AGU, Washington, D. C., doi:10.1029/GM098p0001.
Kamide, Y., et al. (1998), Current understanding of magnetic storms: Storm-substorm relationships, J. Geophys. Res., 103, 17,705–17,728,doi:10.1029/98JA01426.
Kelley, M. C., B. G. Fejer, and C. A. Gonzales (1979), An explanation for anomalous equatorial ionospheric electric fields associated with anorthward turning of the interplanetary magnetic field, Geophys. Res. Lett., 6, 301–304, doi:10.1029/GL006i004p00301.
Kelley, M. C., J. J. Makela, O. de La Beaujardière, and J. Retterer (2011), Convective ionospheric storms: A review, Rev. Geophys., 49, RG2003,doi:10.1029/2010RG000340.
Kikuchi, T., H. Lühr, T. Kitamura, O. Saka, and K. Schlegel (1996), Direct penetration of the polar electric field to the equator during a DP 2event as detected by the auroral and equatorial magnetometer chains and the EISCAT radar, J. Geophys. Res., 101, 17,161–17,173,doi:10.1029/96JA01299.
Kikuchi, T., H. Lühr, K. Schlegel, H. Tachihara, M. Shinohara, and T. I. Kitamura (2000), Penetration of auroral electric fields to the equatorduring a substorm, J. Geophys. Res., 105, 23,251–23,261, doi:10.1029/2000JA900016.
Kikuchi, T., Y. Ebihara, K. K. Hashimoto, R. Kataoka, T. Hori, S. Watari, and N. Nishitani (2010), Penetration of the convection and overshieldingelectric fields to the equatorial ionosphere during a quasiperiodic DP 2 geomagnetic fluctuation event, J. Geophys. Res., 115, A05209,doi:10.1029/2008JA013948.
Kil, H., E. R. Talaat, S. J. Oh, L. J. Paxton, S. L. England, and S. Y. Su (2008), Wave structures of the plasma density and vertical E × B drift inlow-latitude F region, J. Geophys. Res., 113, A09312, doi:10.1029/2008JA013106.
Kil, H., L. J. Paxton, K.-H. Kim, S. Park, Y. Zhang, and S. J. Oh (2011), Temporal and spatial components in the storm time ionosphericdisturbances, J. Geophys. Res., 116, A11315, doi:10.1029/2011JA016750.
Krishna Murthy, B. V., S. S. Hari, and V. V. Somayajulu (1990), Nighttime equatorial thermospheric meridional winds from ionospheric h’F data,J. Geophys. Res., 95, 4307–4310, doi:10.1029/JA095iA04p04307.
Le, G., et al. (2016), Magnetopause erosion during the 17 March 2015 magnetic storm: Combined field-aligned currents, auroral oval, andmagnetopause observations, Geophys. Res. Lett., 43, 2396–2404, doi:10.1002/2016GL068257.
Liou, K., P. T. Newell, B. J. Anderson, L. Zanetti, and C. I. Meng (2005), Neutral composition effects on ionospheric storms at middle and lowlatitudes, J. Geophys. Res., 110, A05309, doi:10.1029/2004JA010840.
Liu, H., and S. Watanabe (2008), Seasonal variation of the longitudinal structure of the equatorial ionosphere: Does it reflect tidal influencesfrom below?, J. Geophys. Res., 113, A08315, doi:10.1029/2008JA013027.
Liu, J., W. Wang, A. Burns, X. Yue, S. Zhang, Y. Zhang, and C. Huang (2016), Profiles of ionospheric storm-enhanced density during the 17March 2015 great storm, J. Geophys. Res. Space Physics, 121, 727–744, doi:10.1002/2015JA021832.
Maruyama, T., M. Kawamura, S. Saito, K. Nozaki, H. Kato, N. Hemmakorn, T. Boonchuk, T. Komolmis, and C. Ha Duyen (2007), Low latitudeionosphere-thermosphere dynamics studies with ionosonde chain in Southeast Asia, Ann. Geophys., 25(7), 1569–1577, doi:10.5194/angeo-25-1569-2007.
Morse, F.A., etal. (1977), Equion:Anequatorial ionospheric irregularity experiment, J.Geophys. Res.,82, 578–592,doi:10.1029/JA082i004p00578.Nygrén, T., B. S. Lanchester, A. Huuskonen, L. Jalonen, T. Turunen, H. Rishbeth, and A. P. Van Eyken (1990), Interference of tidal and gravity
waves in the ionosphere and an associated sporadic E-layer, J. Atmos. Sol. Terr. Phys., 52, 609–613, doi:10.1016/0021-9169(90)90056-S.Prölss, G. W. (1987), Storm-induced changes in the thermospheric composition at middle latitudes, Planet. Space Sci., 35, 807–811,doi:10.1016/0032-0633(87)90041-9.
Prölss, G. W. (1993), On explaining the local time variation of ionospheric storm effects, Ann. Geophys., 11, 1–9.Prölss, G. W., and U. von Zahn (1974), Esro 4 Gas Analyzer results: 2. Direct measurements of changes in the neutral composition during an
ionospheric storm, J. Geophys. Res., 79, 2535–2539, doi:10.1029/JA079i016p02535.Prolss, G. W., M. Roemer, and J. W. Slowey (1988), Dissipation of solar wind energy in the Earth’s upper atmosphere: The geomagnetic activity
effect, CIRA, Adv. Space Res., 8(5), 215–261.Rama Rao, P. V. S., S. Tulasi Ram, K. Niranjan, D. S. V. V. D. Prasad, S. Gopi Krishna, and N. K. M. Lakshmi (2005), VHF and L-band scintillation
characteristics over an Indian low latitude station, Waltair (17.7°N, 83.3°E), Ann. Geophys., 23(7), 2457–2464, doi:10.5194/angeo-23-2457-2005.Rama Rao, P. V. S., K. Niranjan, D. S. V. V. D. Prasad, S. Gopi Krishna, and G. Uma (2006), On the validity of the ionospheric pierce point (IPP)
altitude of 350 km in the Indian equatorial and low-latitude sector, Ann. Geophys., 24, 2159–2168, doi:10.5194/angeo-24-2159-2006.Rastogi, R. G., and R. F. Woodman (1978), VHF radio wave scattering due to range and frequency types of equatorial spread-F, J. Atmos. Sol.
Terr. Phys., 40, 485–491, doi:10.1016/0021-9169(78)90182-4.Rishbeth, H. (1971), Thermospheric winds and the F-region: A review, J. Atmos. Terr. Phys., 34, 1–47, doi:10.1016/0021-9169(72)90003-7.Rishbeth, H. (1975), F-region storms and thermospheric circulation, J. Atmos. Terr. Phys., 37(6), 1055–1064, doi:10.1016/0021-9169(75)90013-6.
Journal of Geophysical Research: Space Physics 10.1002/2016JA023119
KALITA ET AL. IONOSPHERIC RESPONSE TO GEOMAGNETIC STORM 26

Rishbeth, H. (1991), F-region storms and thermospheric dynamics, J. Geomagn. Geoelec., 43(Supplement1), 513–524.Sagawa, E., T. J. Immel, H. Frey, and S. B. Mende (2005), Longitudinal structure of the equatorial anomaly in the nighttime ionosphere
observed by IMAGE/FUV, J. Geophys. Res., 110, A11302, doi:10.1029/2004JA010848.Sastri, J. H. (1990), The relationship between the structure of the equatorial anomaly and the strength of the equatorial electrojet, Ind. J. Radio
Space Phys., 19, 225–240.Scherliess, L., and B. G. Fejer (1997), Storm time dependence of equatorial disturbance dynamo zonal electric fields, J. Geophys. Res., 102,
24,037–24,046, doi:10.1029/97JA02165.Scherliess, L., D. C. Thompson, and R. W. Schunk (2008), Longitudinal variability of low-latitude total electron content: Tidal influences,
J. Geophys. Res., 113, A01311, doi:10.1029/2007JA012480.Seemala, G. K., and C. E. Valladares (2011), Statistics of total electron content depletions observed over the South American continent for the
year 2008, Radio Sci., 46, RS5019, doi:10.1029/2011RS004722.Shalimov, S., T. Ogawa, and Y. Otsuka (2009), On the gravity wave-driven instability of E layer at mid-latitude, J. Atmos. Sol. Terr. Phys., 71,
1943–1947, doi:10.1016/j.jastp.2009.08.004.Singh, R., S. Sripathi, S. Sreekumar, S. Banola, K. Emperumal, P. Tiwari, and S. Kumar (2015), Low-latitude ionosphere response to super
geomagnetic storm of 17/18 March 2015: Results from a chain of ground-based observations over Indian sector, J. Geophys. Res. SpacePhysics, 120, 10,864–10,882, doi:10.1002/2015JA021509.
Somayajulu, V. V. (1998), Magnetosphere-Ionosphere coupling, PINSA, 64(A3), 341–351.Titheridge, J. (1985), Ionogram analysis with the generalized program POLAN, World Data Center Report, UAG-93, WDC-A-STP, Boulder,CO,
194 pp.Titheridge, J. E. (1995), Winds in the ionosphere—A review, J. Atmos. Sol. Terr. Phys., 57(14), 1681–1714, doi:10.1016/0021-9169(95)00091-F.Tsurutani, B. T., and W. D. Gonzalez (1997), The interplanetary causes of magnetic storms: A review, in Magnetic Storms, edited by B. T.
Tsurutani et al., 77 pp., AGU, Washington, D. C., doi:10.1029/GM098p0077.Tsurutani, B. T., W. D. Gonzalez, and Y. Kamide (1997), Magnetic storms, Surv. Geophys., 18, 363–383, doi:10.1023/A:1006555215463.Tulasi Ram, S., et al. (2016), Duskside enhancement of equatorial zonal electric field response to convection electric fields during the St.
Patrick’s Day storm on 17 March 2015, J. Geophys. Res. Space Physics, 121, 538–548, doi:10.1002/2015JA021932.Wei, Y., W. Wan, Z. Pu, M. Hong, Q. Zong, J. Guo, B. Zhao, and Z. Ren (2011), The transition to overshielding after sharp and gradual
interplanetary magnetic field northward turning, J. Geophys. Res., 116, A01211, doi:10.1029/2010JA015985.Wolf, R. A. (1975), Ionosphere-magnetosphere coupling, Space Sci. Rev., 17, 537–562, doi:10.1007/BF00718584.
Journal of Geophysical Research: Space Physics 10.1002/2016JA023119
KALITA ET AL. IONOSPHERIC RESPONSE TO GEOMAGNETIC STORM 27