Embed Size (px)
Citation preview
TELEKOM MALAYSIA BERHAD CONNECT COMMUNICATE COLLABORATE
CIMB 6th Annual Malaysia Corporate Day
Kuala Lumpur 8 January 2014
This presentation is not and does not constitute an offer, invitation, solicitation or recommendation to subscribe for, or purchase, any securities
and neither this presentation nor anything contained in it shall form the basis of, or be relied on in connection with any contract or commitment or
investment decision.
This presentation has been prepared solely for use at this presentation. By your continued attendance at this presentation, you are deemed to
have agreed and confirmed to Telekom Malaysia Berhad (the “Company”) that: (a) you agree not to trade in any securities of the Company or its
respective affiliates until the public disclosure of the information contained herein; and (b) you agree to maintain absolute confidentiality
regarding the information disclosed in this presentation until the public disclosure of such information, or unless you have been otherwise
notified by the Company.
Reliance should not be placed on the information or opinions contained in this presentation or on its completeness. This presentation does not
take into consideration the investment objectives, financial situation or particular needs of any particular investor.
No representation or warranty, express or implied, is made as to the fairness, accuracy, completeness or correctness of the information,
opinions and conclusions contained in this presentation. None of the Company and its affiliates and related bodies corporate, and their
respective officers, directors, employees and agents disclaim any liability (including, without limitation, any liability arising from fault or
negligence) for any loss arising from any use of this presentation or its contents or otherwise arising in connection with it.
This presentation contains projections and “forward-looking statements” relating to the Company’s business and the sectors in which the
Company operates. These forward-looking statements include statements relating to the Company’s performance. These statements reflect the
current views of the Company with respect to future events and are subject to certain risks, uncertainties and assumptions. It is important to note
that actual results could differ materially from those anticipated in these forward looking statements. The Company does not undertake to inform
you of any matters or information which may come to light or be brought to the Company’s attention after the date hereof.
The forecasts and other forward-looking statements set out in this presentation are based on a number of estimates and assumptions that are
subject to business, economic and competitive uncertainties and contingencies, with respect to future business decisions, which are subject to
change and in many cases outside the control of the Company. The directors and officers of the Company believe that they have prepared the
forecasts with due care and attention and consider all best estimates and assumptions when taken as a whole to be reasonable at the time of
preparing the presentation. However, the Company’s forecasts presented in this presentation may vary from actual financial results, and these
variations may be material and, accordingly, neither the Company nor its directors or officers can give any assurance that the forecast
performance in the forecasts or any forward-looking statement contained in this presentation will be achieved. Details of the forecasts and the
assumptions on which they are based are set out in the presentation.
This presentation may not be copied or otherwise reproduced without the written consent of the Company.
Disclaimer
2
3
2
3
•Snapshot of TM
4
•TM 3Q2013 Results Performance
1 •Country & Industry Overview
5
•High Speed Broadband Update
•The Road Ahead: 2014

Source : Malaysia Communications & Multimedia Commission (MCMC) Note: *per 100 households
^The household penetration rate is calculated based on households and not subscriptions. A household with multiple subscription is counted as 1
18.4 22.9 25.5 24.5 26.9 27.1 27.7 28.0 2.7
8.3
28.3 35.3 33.3 35.2 34.9 35.0
1.9 4.2 4.1 2.9 2.7 2.7
0
10
20
30
40
50
60
70
2008 2009 2010 2011 2012 1Q13 2Q13 3Q13
Fixed Wireless 1Malaysia Netbook
6,091 6,220 6,605 6,675 6,744 6,873 6,895 6,919
0
1,000
2,000
3,000
4,000
5,000
6,000
7,000
8,000
2008 2009 2010 2011 2012 1Q13 2Q13 3Q13
Households
Households (‘000)
4
(%) Broadband Penetration Rate*/^
Country & Industry Overview
21.1
31.2
55.6 62.3 66.0
66.6 66.8 67.2
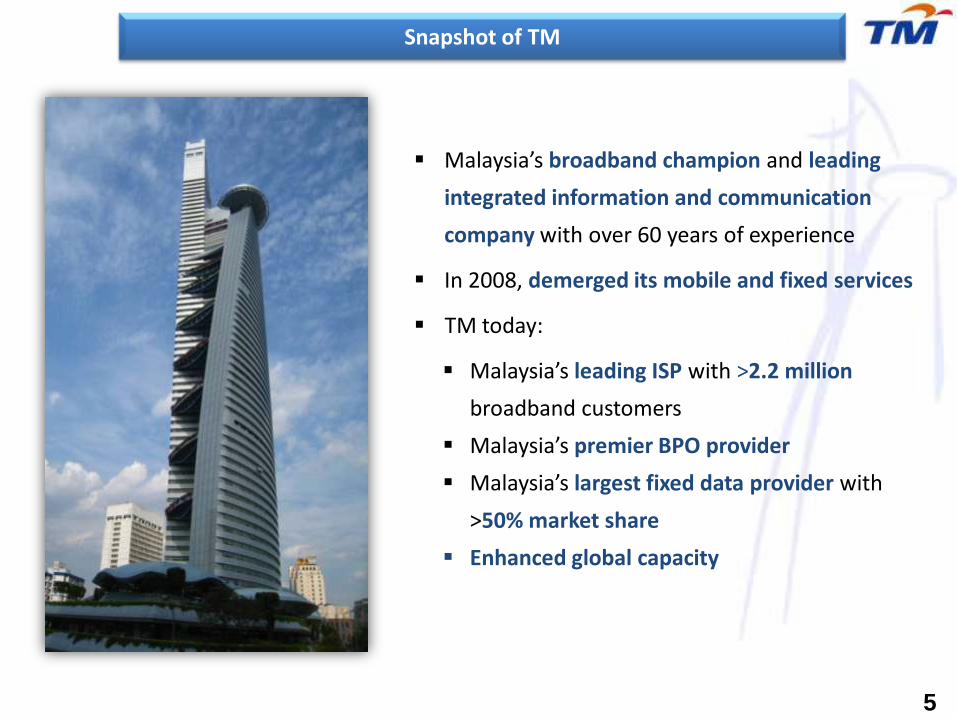
Malaysia’s broadband champion and leading
integrated information and communication
company with over 60 years of experience
In 2008, demerged its mobile and fixed services
TM today:
Malaysia’s leading ISP with >2.2 million
broadband customers
Malaysia’s premier BPO provider
Malaysia’s largest fixed data provider with
>50% market share
Enhanced global capacity
Snapshot of TM
5
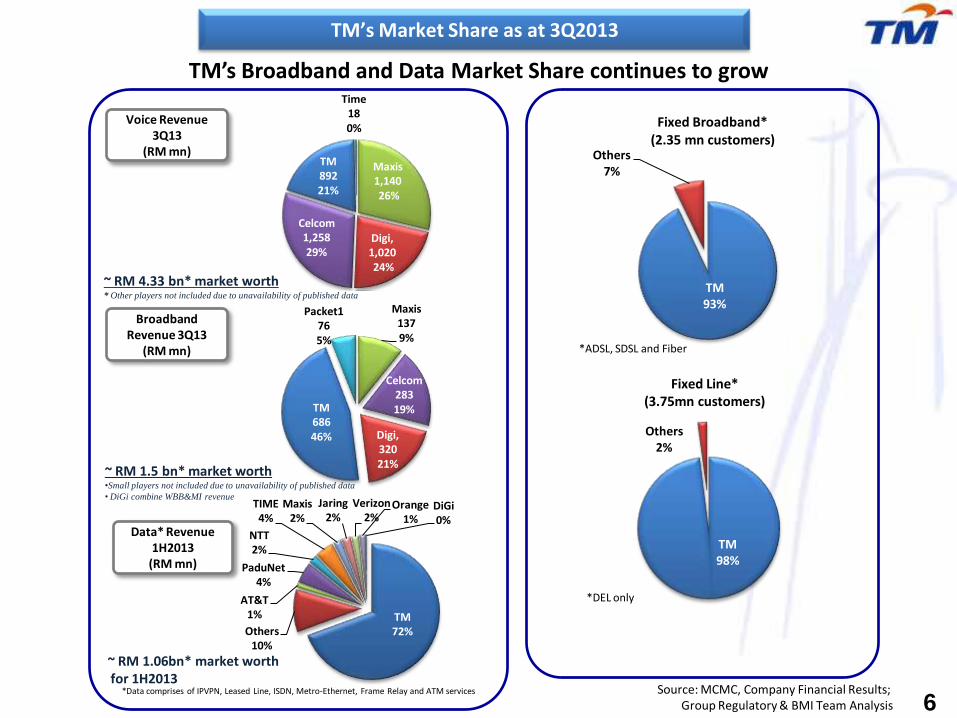
TM 93%
Others 7%
Fixed Broadband* (2.35 mn customers)
TM’s Market Share as at 3Q2013
6
TM 72% Others
10%
AT&T 1%
PaduNet 4%
NTT 2%
TIME 4%
Maxis 2%
Jaring 2%
Verizon 2%
Orange 1%
DiGi 0%
~ RM 1.5 bn* market worth •Small players not included due to unavailability of published data
• DiGi combine WBB&MI revenue
Maxis 137 9%
Celcom 283 19%
Digi, 320 21%
TM 686 46%
Packet1 76 5%
~ RM 4.33 bn* market worth * Other players not included due to unavailability of published data
Maxis 1,140 26%
Digi, 1,020 24%
Celcom 1,258 29%
TM 892 21%
Time 18 0%
Voice Revenue 3Q13
(RM mn)
Broadband Revenue 3Q13
(RM mn)
Data* Revenue 1H2013
(RM mn)
~ RM 1.06bn* market worth for 1H2013
Source: MCMC, Company Financial Results; Group Regulatory & BMI Team Analysis
*Data comprises of IPVPN, Leased Line, ISDN, Metro-Ethernet, Frame Relay and ATM services
TM 98%
Others 2%
Fixed Line* (3.75mn customers)
*DEL only
*ADSL, SDSL and Fiber
TM’s Broadband and Data Market Share continues to grow
800
1,000
1,200
1,400
1,600
1,800
2,000
1.00
2.00
3.00
4.00
5.00
6.00
7.00
Apr-
08
Jul-08
Oct-
08
Jan-0
9
Apr-
09
Jul-09
Oct-
09
Jan-1
0
Apr-
10
Jul-10
Oct-
10
Jan-1
1
Apr-
11
Jul-11
Oct-
11
Jan-1
2
Apr-
12
Jul-12
Oct-
12
Jan-1
3
Apr-
13
Jul-13
Oct-
13
T MK Equity
FBMKLCI Equity
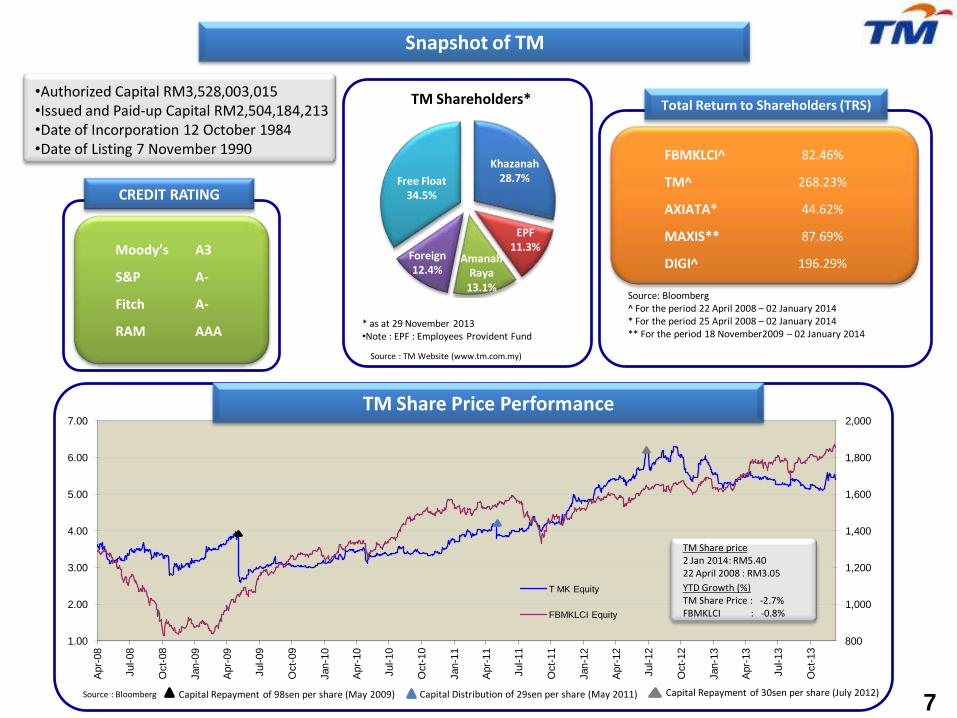
•Authorized Capital RM3,528,003,015 •Issued and Paid-up Capital RM2,504,184,213 •Date of Incorporation 12 October 1984 •Date of Listing 7 November 1990
CREDIT RATING
Source : Bloomberg Capital Distribution of 29sen per share (May 2011) Capital Repayment of 98sen per share (May 2009)
TM Share price 2 Jan 2014: RM5.40 22 April 2008 : RM3.05
Snapshot of TM
TM Share Price Performance
YTD Growth (%) TM Share Price : -2.7% FBMKLCI : -0.8%
* as at 29 November 2013 •Note : EPF : Employees Provident Fund
Source : TM Website (www.tm.com.my)
Capital Repayment of 30sen per share (July 2012)
TM Shareholders*
Khazanah 28.7%
EPF 11.3%
Amanah Raya
13.1%
Foreign 12.4%
Free Float 34.5%
FBMKLCI^ 82.46%
TM^ 268.23%
AXIATA* 44.62%
MAXIS** 87.69%
DIGI^ 196.29%
Source: Bloomberg ^ For the period 22 April 2008 – 02 January 2014 * For the period 25 April 2008 – 02 January 2014 ** For the period 18 November2009 – 02 January 2014
Total Return to Shareholders (TRS)
Moody’s A3
S&P A-
Fitch A-
RAM AAA
7
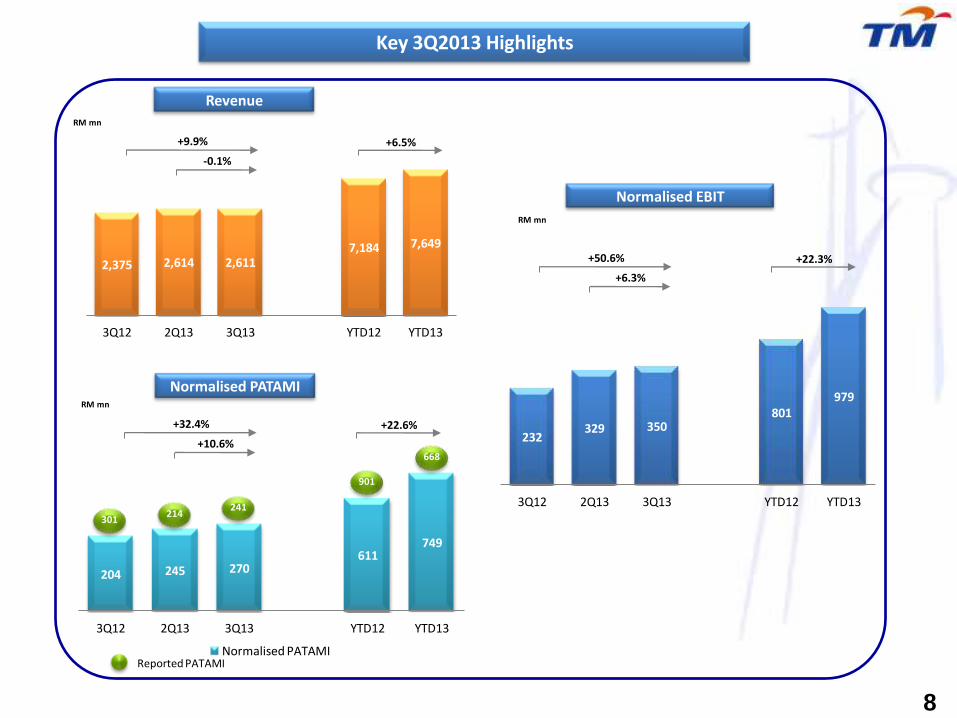
204 245 270 611
749
3Q12 2Q13 3Q13 YTD12 YTD13
Normalised PATAMI
232 329 350
801 979
3Q12 2Q13 3Q13 YTD12 YTD13
2,375 2,614 2,611 7,184 7,649
3Q12 2Q13 3Q13 YTD12 YTD13
RM mn
RM mn
Normalised EBIT
Normalised PATAMI RM mn
Reported PATAMI
Revenue
8
Key 3Q2013 Highlights
241
901
668
214 301
+9.9%
-0.1%
+6.5%
+50.6%
+6.3%
+22.3%
+32.4%
+10.6%
+22.6%
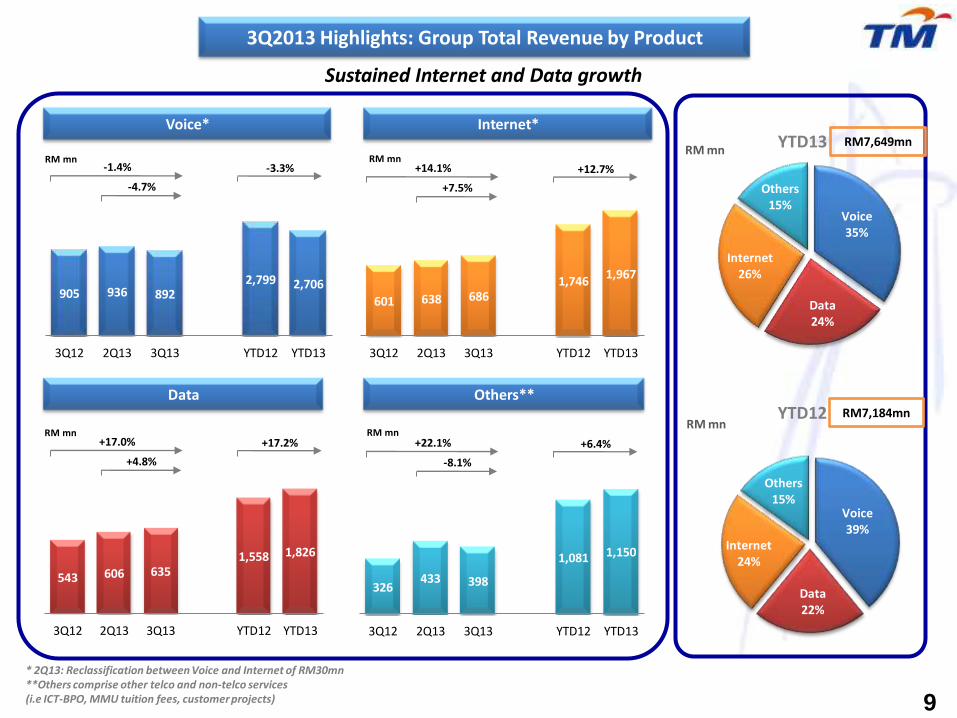
9
3Q2013 Highlights: Group Total Revenue by Product
326 433 398
1,081 1,150
3Q12 2Q13 3Q13 YTD12 YTD13
543 606 635 1,558 1,826
3Q12 2Q13 3Q13 YTD12 YTD13
601 638 686 1,746
1,967
3Q12 2Q13 3Q13 YTD12 YTD13
905 936 892 2,799 2,706
3Q12 2Q13 3Q13 YTD12 YTD13
Voice 39%
Data 22%
Internet 24%
Others 15%
Voice 35%
Data 24%
Internet 26%
Others 15%
Data
RM mn
RM mn RM mn
Voice*
Others**
Internet* YTD13
YTD12
RM mn RM mn
RM mn
RM7,649mn
RM7,184mn
* 2Q13: Reclassification between Voice and Internet of RM30mn **Others comprise other telco and non-telco services (i.e ICT-BPO, MMU tuition fees, customer projects)
-1.4%
-4.7%
-3.3% +14.1%
+7.5%
+12.7%
+17.0%
+4.8%
+17.2% +22.1%
-8.1%
+6.4%
Sustained Internet and Data growth

10
3Q2013 Highlights: Group Total Revenue by Lines of Business
Retail 75%
Global & Wholesale
17%
Others 8%
Retail 75%
Global & Wholesale
16%
Others 9%
1,788 1,957 1,947 5,419
5,757
3Q12 2Q13 3Q13 YTD12 YTD13
201 244 222
572 664
3Q12 2Q13 3Q13 YTD12 YTD13
386 412 442
1,193 1,228
3Q12 2Q13 3Q13 YTD12 YTD13
Global & Wholesale
YTD13 YTD12 RM7,649mn RM7,184mn
* Others comprise revenue from VADS (reclassified from retail), Property Development, TM R&D, TMIM, UTSB and MKL
Retail
RM mn RM mn RM mn
Others*
Retail (C+S+E+G): 75% Retail (C+S+E+G): 75%
+8.9%
-0.5%
+6.2% +14.5%
+7.3%
+2.9% +10.4%
-9.0%
+16.1%
Positive growth across all segments

32%
20%
48%
Support System* Core Network Access
407 356
YTD12 YTD13
11%
42%
47%
Support System* Core Network Access
1,012 752
YTD12 YTD13
21.1 20.4
17.6 17.2
19.5 21.3
11.3 11.1
8.2 6.6
6.2 6.2
4.3 3.5 0.9
0.8
YTD 12 YTD 13
Bad Debt
Marketing Expenses
Supplies & material
Maintenance Cost
Other operating cost
Manpower cost
Direct cost
Dep & Amortisation
RM6,482.3
89.1%
RM6,741.9
87.2%
RM mn
3Q2013 Highlights: CAPEX & OPEX
Business As Usual (BAU) Capex
HSBB Capex*
5.7
4.7
Note: * gross CAPEX
BAU Capex / Revenue
Cost % of Revenue ¹
1 Revenue = Operating Revenue + Other Operating Income
RM mn
Note: The classification of cost is as per financial reporting
YTD13
14.1 9.8
HSBB Capex / Revenue
YTD13
11
RM mn
Total Cost / Revenue ( %)
% of Revenue
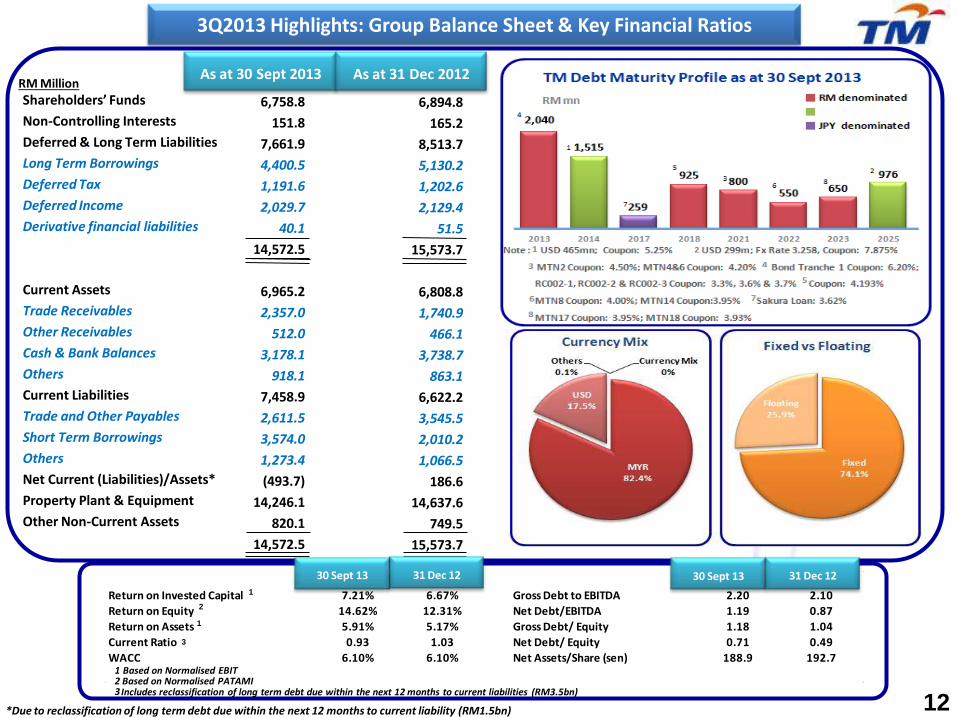
30 Sept 13 31 Dec 12 30 Sept 13 31 Dec 12Return on Invested Capital 7.21% 6.67% Gross Debt to EBITDA 2.20 2.10
Return on Equity 14.62% 12.31% Net Debt/EBITDA 1.19 0.87
Return on Assets 5.91% 5.17% Gross Debt/ Equity 1.18 1.04
Current Ratio 0.93 1.03 Net Debt/ Equity 0.71 0.49
WACC 6.10% 6.10% Net Assets/Share (sen) 188.9 192.7
3
1
1
2
6,894.8
165.2
8,513.7
5,130.2
1,202.6
2,129.4
51.5
15,573.7
6,808.8
1,740.9
466.1
3,738.7
863.1
6,622.2
3,545.5
2,010.2
1,066.5
186.6
14,637.6
749.5
15,573.7
6,758.8
151.8
7,661.9
4,400.5
1,191.6
2,029.7
40.1
14,572.5
6,965.2
2,357.0
512.0
3,178.1
918.1
7,458.9
2,611.5
3,574.0
1,273.4
(493.7)
14,246.1
820.1
14,572.5
Shareholders’ Funds
Non-Controlling Interests
Deferred & Long Term Liabilities
Long Term Borrowings
Deferred Tax
Deferred Income
Derivative financial liabilities
Current Assets
Trade Receivables
Other Receivables
Cash & Bank Balances
Others
Current Liabilities
Trade and Other Payables
Short Term Borrowings
Others
Net Current (Liabilities)/Assets*
Property Plant & Equipment
Other Non-Current Assets
As at 30 Sept 2013 RM Million
As at 31 Dec 2012
12
3Q2013 Highlights: Group Balance Sheet & Key Financial Ratios
3 Includes reclassification of long term debt due within the next 12 months to current liabilities (RM3.5bn)
Based on Normalised EBIT Based on Normalised PATAMI 2
1
*Due to reclassification of long term debt due within the next 12 months to current liability (RM1.5bn)
30 Sept 13 31 Dec 12 31 Dec 12 30 Sept 13
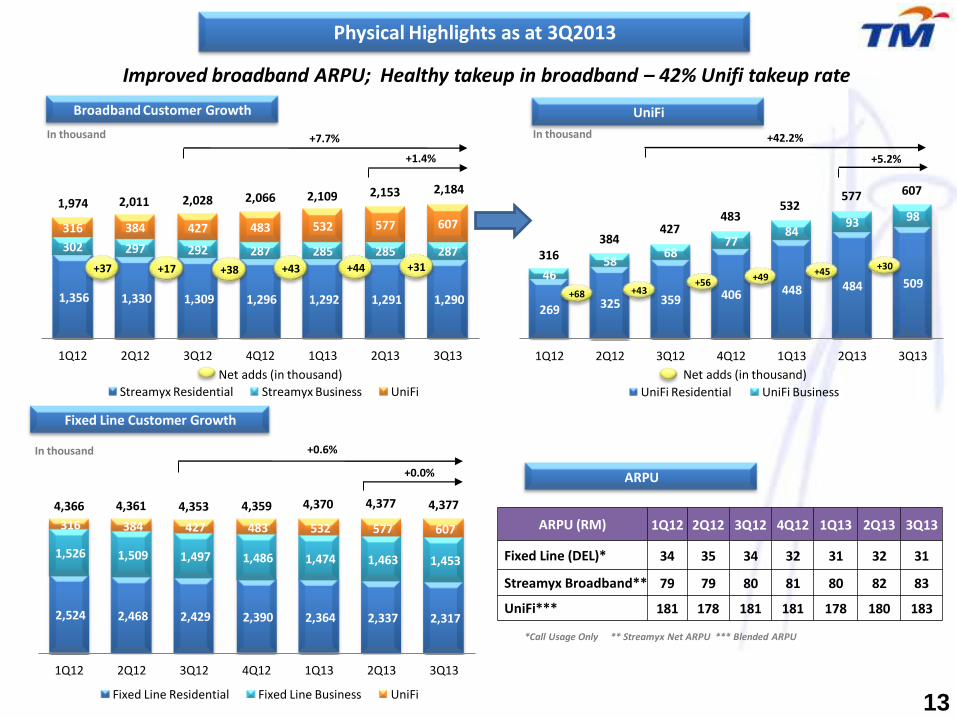
13
Physical Highlights as at 3Q2013
2,524 2,468 2,429 2,390 2,364 2,337 2,317
1,526 1,509 1,497 1,486 1,474 1,463 1,453
316 384 427 483 532 577 607
1Q12 2Q12 3Q12 4Q12 1Q13 2Q13 3Q13
Fixed Line Residential Fixed Line Business UniFi
1,356 1,330 1,309 1,296 1,292 1,291 1,290
302 297 292 287 285 285 287
316 384 427 483 532 577 607
1Q12 2Q12 3Q12 4Q12 1Q13 2Q13 3Q13
Streamyx Residential Streamyx Business UniFi
269 325 359 406 448 484 509 46
58 68
77 84
93 98
1Q12 2Q12 3Q12 4Q12 1Q13 2Q13 3Q13
UniFi Residential UniFi Business
Net adds (in thousand)
In thousand
In thousand
+7.7%
+1.4%
Broadband Customer Growth
Fixed Line Customer Growth
+43
4,370
2,109 1,974
4,366
+0.6%
+0.0%
+5.2%
Net adds (in thousand)
+42.2%
532
316
UniFi
+37
2,011
+49
+68
384
4,361
2,028
427
+43
+17
4,353
2,066
+38 +56
483
4,359
*Call Usage Only ** Streamyx Net ARPU *** Blended ARPU
ARPU (RM) 1Q12 2Q12 3Q12 4Q12 1Q13 2Q13 3Q13
Fixed Line (DEL)* 34 35 34 32 31 32 31
Streamyx Broadband** 79 79 80 81 80 82 83
UniFi*** 181 178 181 181 178 180 183
ARPU
577
+45 +44
2,153
4,377
In thousand
+30
607 2,184
+31
4,377
Improved broadband ARPU; Healthy takeup in broadband – 42% Unifi takeup rate
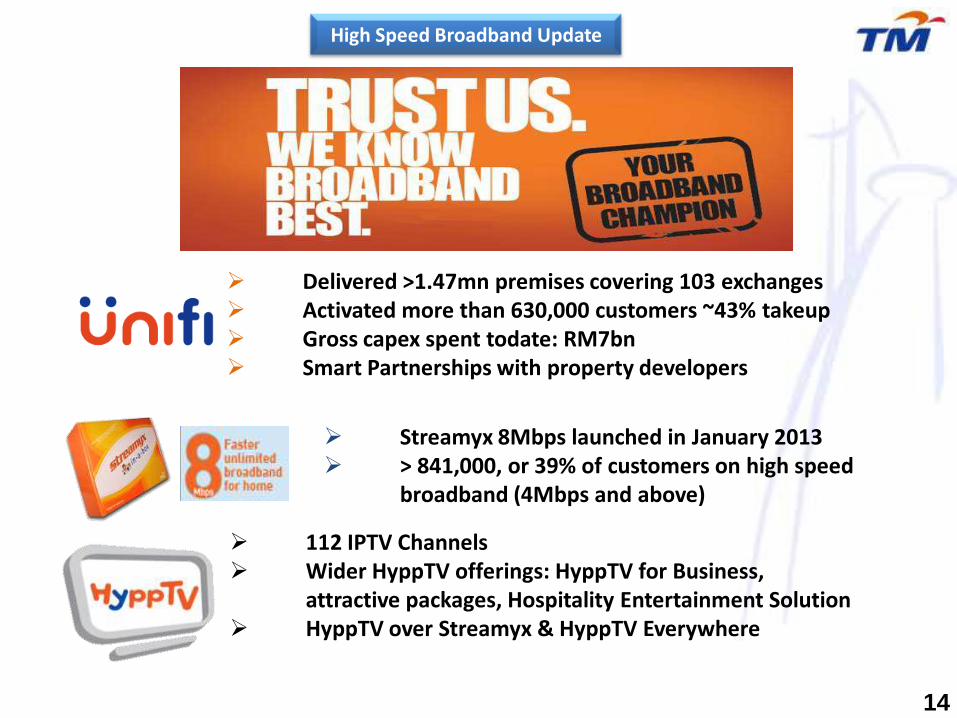
High Speed Broadband Update
112 IPTV Channels Wider HyppTV offerings: HyppTV for Business, attractive packages, Hospitality Entertainment Solution HyppTV over Streamyx & HyppTV Everywhere
Delivered >1.47mn premises covering 103 exchanges Activated more than 630,000 customers ~43% takeup Gross capex spent todate: RM7bn Smart Partnerships with property developers
14
Streamyx 8Mbps launched in January 2013 > 841,000, or 39% of customers on high speed
broadband (4Mbps and above)
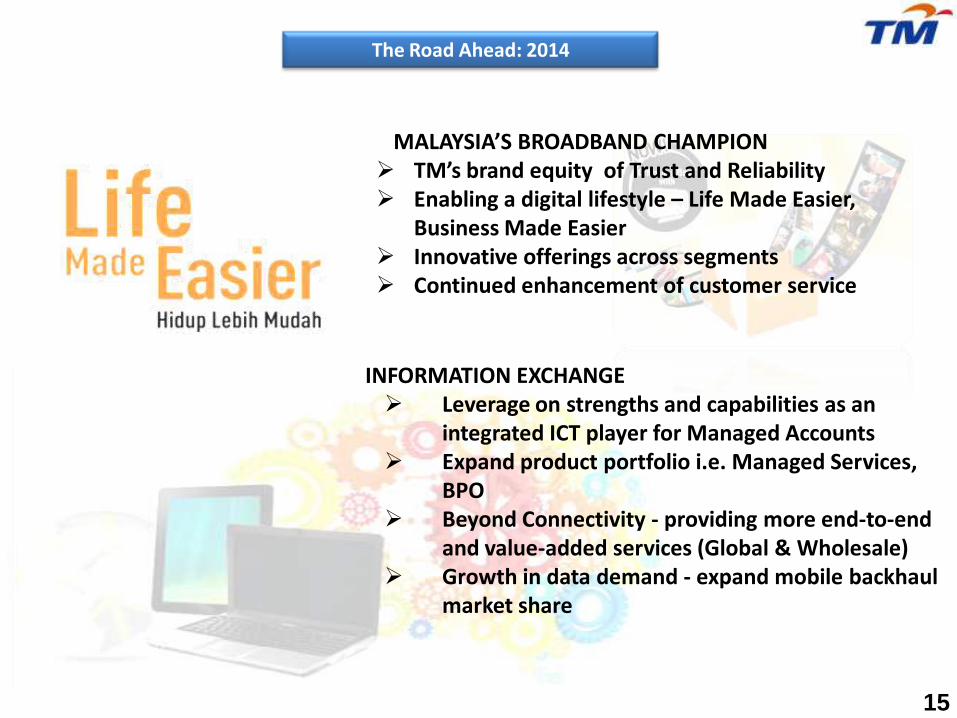
The Road Ahead: 2014
MALAYSIA’S BROADBAND CHAMPION TM’s brand equity of Trust and Reliability Enabling a digital lifestyle – Life Made Easier, Business Made Easier Innovative offerings across segments Continued enhancement of customer service
INFORMATION EXCHANGE Leverage on strengths and capabilities as an integrated ICT player for Managed Accounts Expand product portfolio i.e. Managed Services, BPO Beyond Connectivity - providing more end-to-end and value-added services (Global & Wholesale) Growth in data demand - expand mobile backhaul market share
15
THANK YOU

Appendix
17
18
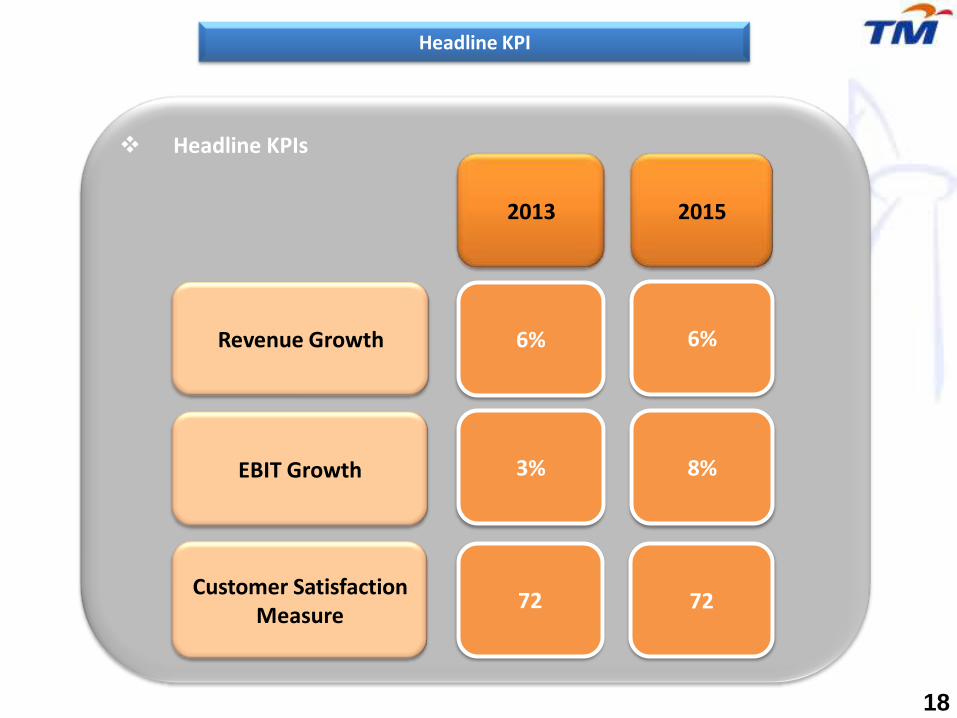
Headline KPI
Headline KPIs
2013 2015
Revenue Growth
EBIT Growth
Customer Satisfaction Measure
6% 6%
3% 8%
72 72
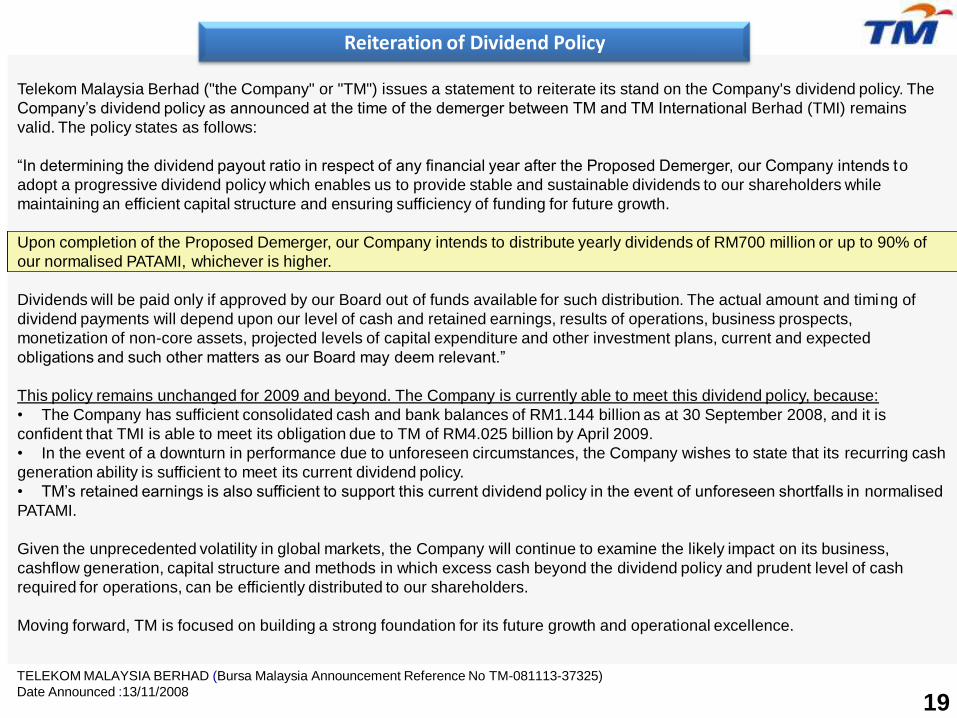
Telekom Malaysia Berhad ("the Company" or "TM") issues a statement to reiterate its stand on the Company's dividend policy. The
Company’s dividend policy as announced at the time of the demerger between TM and TM International Berhad (TMI) remains
valid. The policy states as follows:
“In determining the dividend payout ratio in respect of any financial year after the Proposed Demerger, our Company intends to
adopt a progressive dividend policy which enables us to provide stable and sustainable dividends to our shareholders while
maintaining an efficient capital structure and ensuring sufficiency of funding for future growth.
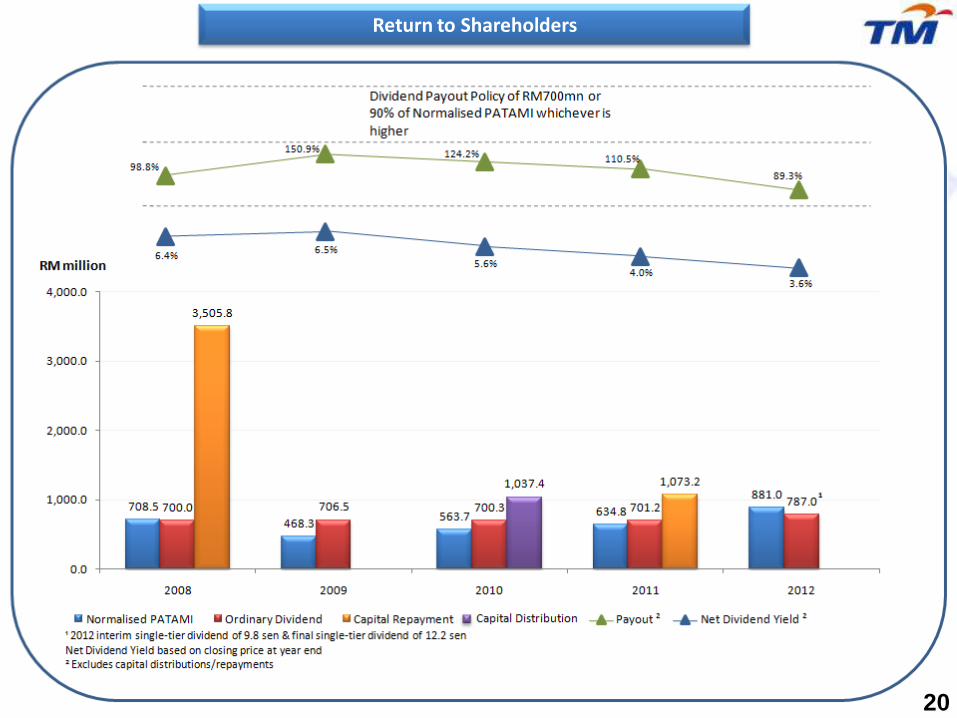
Upon completion of the Proposed Demerger, our Company intends to distribute yearly dividends of RM700 million or up to 90% of
our normalised PATAMI, whichever is higher.
Dividends will be paid only if approved by our Board out of funds available for such distribution. The actual amount and timing of
dividend payments will depend upon our level of cash and retained earnings, results of operations, business prospects,
monetization of non-core assets, projected levels of capital expenditure and other investment plans, current and expected
obligations and such other matters as our Board may deem relevant.”
This policy remains unchanged for 2009 and beyond. The Company is currently able to meet this dividend policy, because:
• The Company has sufficient consolidated cash and bank balances of RM1.144 billion as at 30 September 2008, and it is
confident that TMI is able to meet its obligation due to TM of RM4.025 billion by April 2009.
• In the event of a downturn in performance due to unforeseen circumstances, the Company wishes to state that its recurring cash
generation ability is sufficient to meet its current dividend policy.
• TM’s retained earnings is also sufficient to support this current dividend policy in the event of unforeseen shortfalls in normalised
PATAMI.
Given the unprecedented volatility in global markets, the Company will continue to examine the likely impact on its business,
cashflow generation, capital structure and methods in which excess cash beyond the dividend policy and prudent level of cash
required for operations, can be efficiently distributed to our shareholders.
Moving forward, TM is focused on building a strong foundation for its future growth and operational excellence.
TELEKOM MALAYSIA BERHAD (Bursa Malaysia Announcement Reference No TM-081113-37325)
Date Announced :13/11/2008
19
Reiteration of Dividend Policy
20
Return to Shareholders
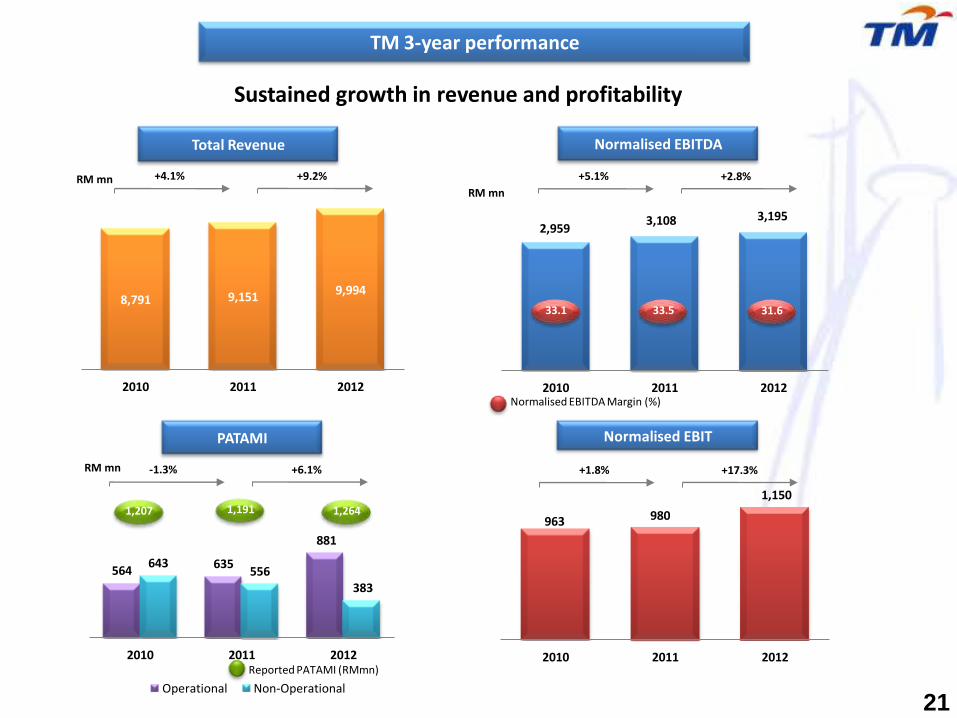
564 635
881
643 556
383
2010 2011 2012
Operational Non-Operational
2,959 3,108 3,195
2010 2011 2012
8,791 9,151 9,994
2010 2011 2012
+4.1%
Total Revenue
RM mn
Normalised EBITDA Margin (%)
RM mn
Normalised EBITDA
PATAMI
RM mn
33.5 33.1 31.6
1,191 1,207 1,264
Reported PATAMI (RMmn)
TM 3-year performance
963 980
1,150
2010 2011 2012
Normalised EBIT
21
+9.2% +5.1% +2.8%
+1.8% +17.3% -1.3% +6.1%
Sustained growth in revenue and profitability
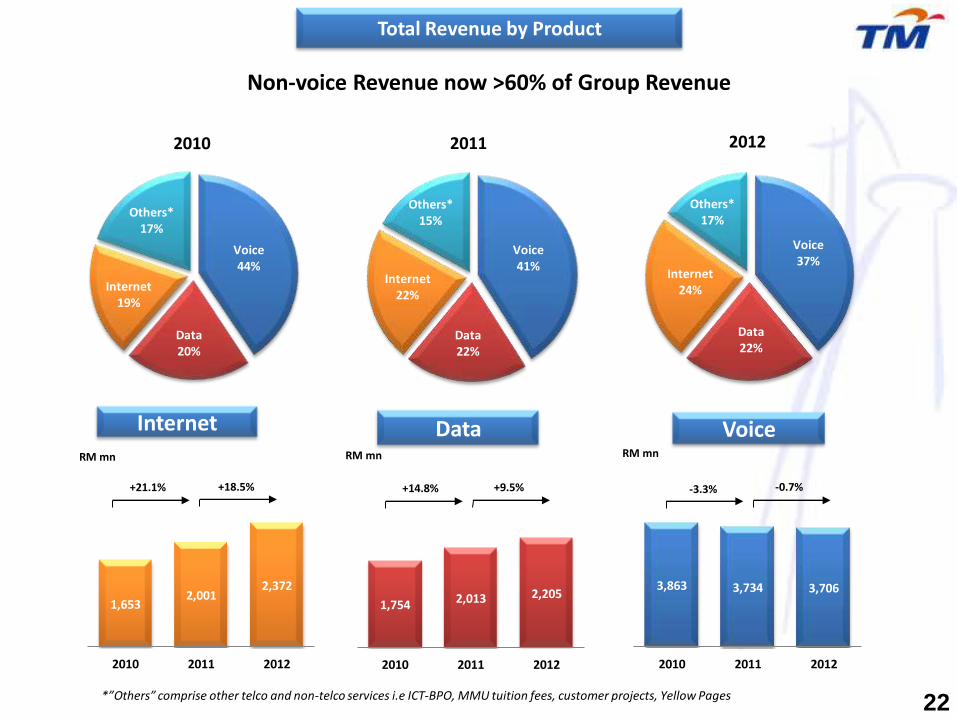
Voice 44%
Data 20%
Internet 19%
Others* 17%
1,653 2,001
2,372
2010 2011 2012
1,754 2,013 2,205
2010 2011 2012
3,863 3,734 3,706
2010 2011 2012
Voice Data Internet RM mn RM mn RM mn
2012 2011
Total Revenue by Product
+18.5%
2010
Non-voice Revenue now >60% of Group Revenue
Voice 41%
Data 22%
Internet 22%
Others* 15%
Voice 37%
Data 22%
Internet 24%
Others* 17%
+21.1% +9.5% +14.8% -0.7% -3.3%
22 *”Others” comprise other telco and non-telco services i.e ICT-BPO, MMU tuition fees, customer projects, Yellow Pages

22.3 23.0 20.1
20.4 16.6 17.0
18.9 20.2
19.9
11.6 11.7
11.6
5.6 6.5 8.5
5.7 6.5 6.3
4.3 4.5 4.2 0.7 0.8 0.6
2010 2011 2012
Bad Debt
Marketing Expenses
Supplies & Material
Maintenance Cost
Other Operating Cost
Manpower Cost
Direct Cost
Dep & Amortisation
511 401 338
308 343
278
309 395
276
2010 2011 2012 Access Core Network Support System*
RM mn
Business As Usual (BAU) Capex
HSBB Capex**
12.8 12.4
Note: **gross CAPEX
BAU Capex / Revenue
Cost % of Revenue ¹
1 Revenue = Operating Revenue + Other Operating Income
RM mn
Note: The classification of cost is as per financial reporting
HSBB Capex / Revenue
23
RM mn
Total Cost / Revenue ( %)
RM8,015.4
89.6%
RM8,313.2
89.7%
% of Revenue
CAPEX & OPEX
1,128 1,139
892
8.9
591 659 781
530 633
645
463 132 228
2010 2011 2012 Access Core Network Support System*
1,584 1,424
1,654
18.0 15.6 16.6
RM8,972.0
88.3%
*Include Application, Support System & Others (building, land improvement, moveable plants, application & other assets)
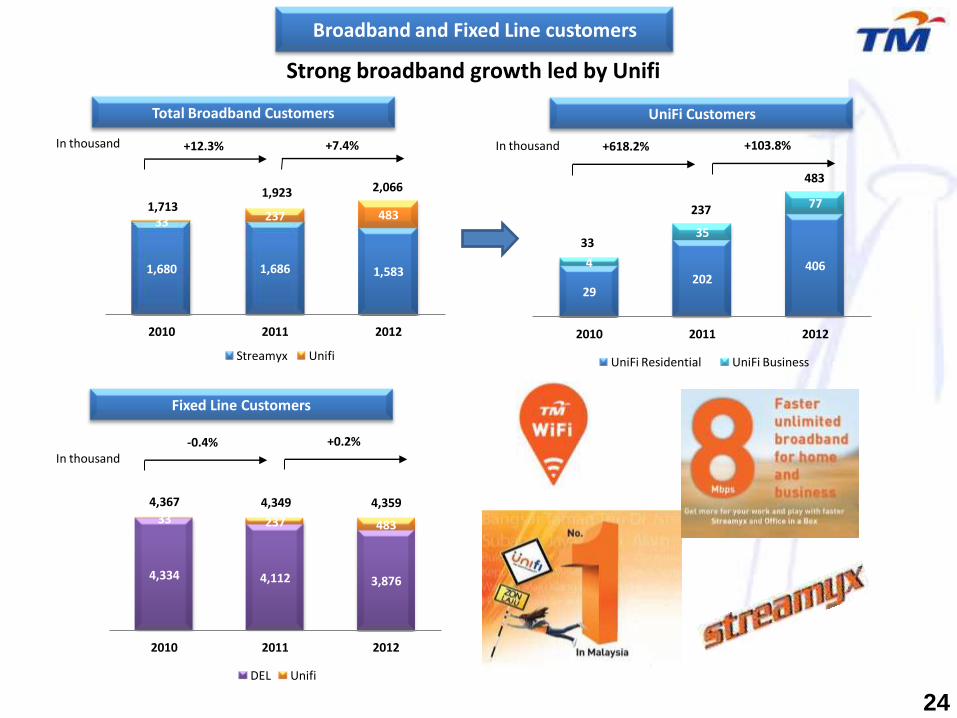
29 202
406 4
35
77
2010 2011 2012
UniFi Residential UniFi Business
4,334 4,112 3,876
33 237 483
2010 2011 2012
DEL Unifi
1,680 1,686 1,583
33 237 483
2010 2011 2012
Streamyx Unifi
Broadband and Fixed Line customers
Total Broadband Customers
In thousand
In thousand
1,713
4,367 4,349 4,359
+7.4%
1,923 2,066
Strong broadband growth led by Unifi
Fixed Line Customers
UniFi Customers
In thousand
33
237
483
+12.3%
+0.2% -0.4%
+103.8% +618.2%
24
Any queries please email to : Rohaila Mohamed Basir
Investor Relations Telekom Malaysia Berhad
•Investor Relations • Level 11 (South Wing) • Menara TM •Jln Pantai Baharu •50672 Kuala Lumpur, Malaysia • Tel (603) 2240 4848/ 7366 / 7388