Embed Size (px)
Citation preview
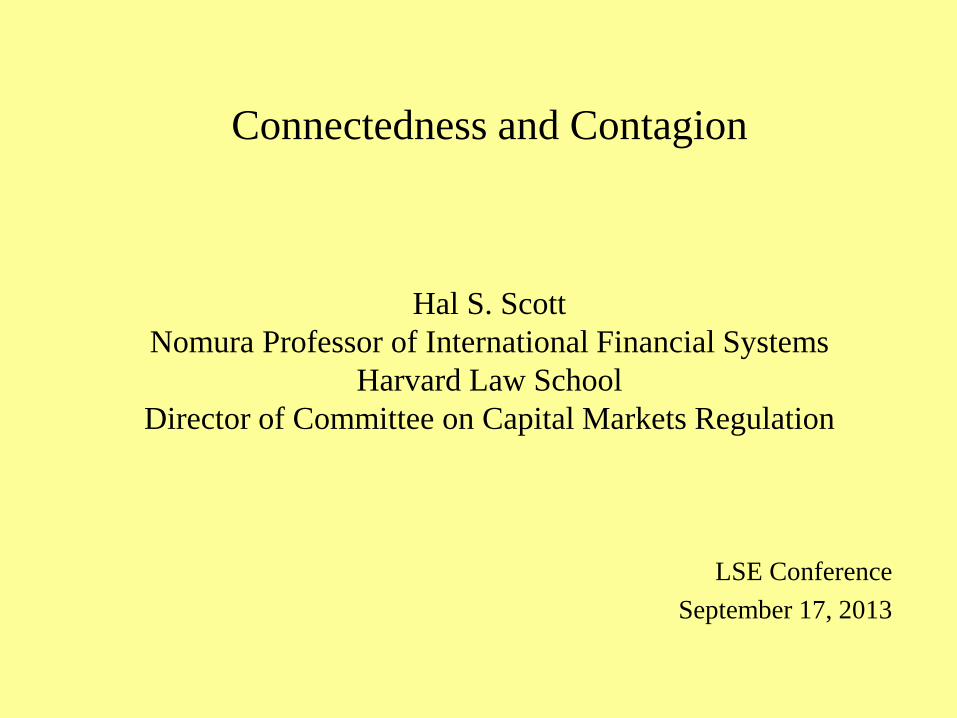
Connectedness and Contagion
Hal S. Scott
Nomura Professor of International Financial Systems
Harvard Law School
Director of Committee on Capital Markets Regulation
LSE Conference
September 17, 2013
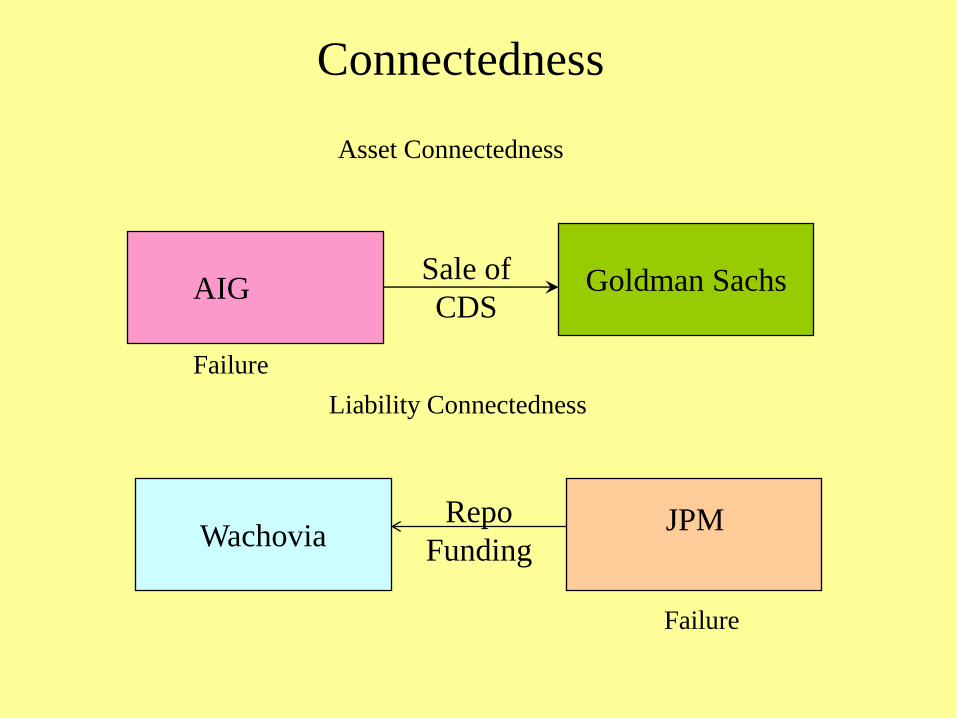
Connectedness
Wachovia JPM
AIG Goldman Sachs Sale of
CDS
Repo
Funding
Asset Connectedness
Liability Connectedness
Failure
Failure

Claims Filed Against LBHI and Affiliated Chapter 11 Debtors
($ in billions)
Initial Plan (Apr. 2010) Modified Third Amended Plan
(Aug/Dec 2011)*
Claim Type Filed Outstanding Allowed Outstanding Allowed
Direct $ 210 $ 183 $ 102 $ 110 $ 110
Intercompany $ 80 $ 56 $ 43 $ 52 $ 52
Guarantee $ 570 $ 367 $ 115 $ 156 $ 108
Third Party $ 255 $ 143 $ 94 $ 97 $ 95
Affiliate $ 315 $ 224 $ 21 $ 59 $ 13
Total LBHI Claims $ 860 $ 605 $ 260 $ 320 $ 273
All other Debtors $ 302 $ 135 $ 135 $ 50 $ 89
$ 1,162 $ 740 $ 395 $ 370 $ 362
* Claims data has been made available only for the Third Amended Plan, but the Modified Third Amended Plan is presumably
based on the same claims data as the Third Amended Plan. Thus, in the claims context, all references in this report to the Modified
Third Amended Plan are based on information from the disclosure statement for the Third Amended Plan.
3
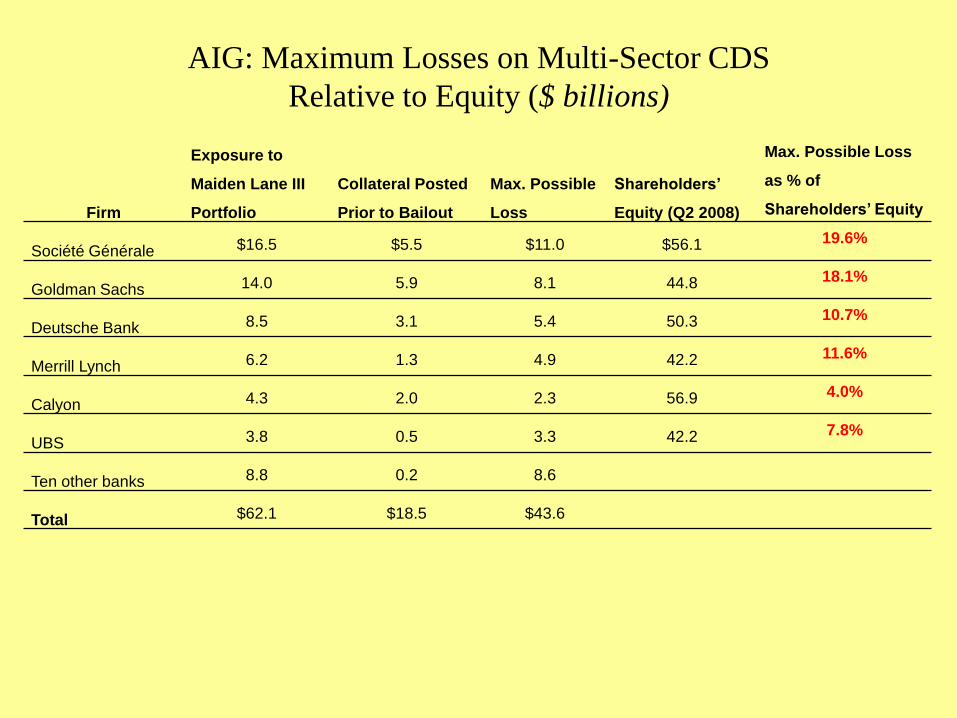
AIG: Maximum Losses on Multi-Sector CDS
Relative to Equity ($ billions)
Firm
Exposure to
Maiden Lane III
Portfolio
Collateral Posted
Prior to Bailout
Max. Possible
Loss
Shareholders’
Equity (Q2 2008)
Max. Possible Loss
as % of
Shareholders’ Equity
Société Générale $16.5 $5.5 $11.0 $56.1 19.6%
Goldman Sachs 14.0 5.9 8.1 44.8 18.1%
Deutsche Bank 8.5 3.1 5.4 50.3 10.7%
Merrill Lynch 6.2 1.3 4.9 42.2 11.6%
Calyon 4.3 2.0 2.3 56.9 4.0%
UBS 3.8 0.5 3.3 42.2 7.8%
Ten other banks 8.8 0.2 8.6
Total $62.1 $18.5 $43.6
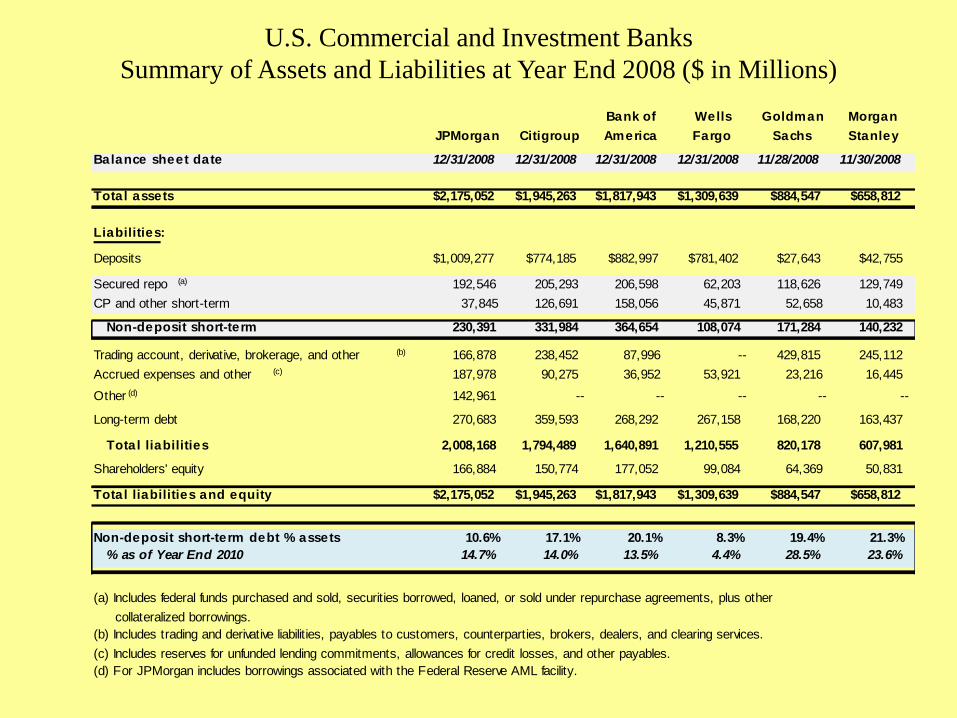
U.S. Commercial and Investment Banks
Summary of Assets and Liabilities at Year End 2008 ($ in Millions)
Bank of Wells Goldman Morgan
JPMorgan Citigroup America Fargo Sachs Stanley
Balance sheet date 12/31/2008 12/31/2008 12/31/2008 12/31/2008 11/28/2008 11/30/2008
Total assets $2,175,052 $1,945,263 $1,817,943 $1,309,639 $884,547 $658,812
Liabilities:
Deposits $1,009,277 $774,185 $882,997 $781,402 $27,643 $42,755
Secured repo (a) 192,546 205,293 206,598 62,203 118,626 129,749
CP and other short-term 37,845 126,691 158,056 45,871 52,658 10,483
Non-deposit short-term 230,391 331,984 364,654 108,074 171,284 140,232
Trading account, derivative, brokerage, and other (b) 166,878 238,452 87,996 -- 429,815 245,112
Accrued expenses and other (c) 187,978 90,275 36,952 53,921 23,216 16,445
Other (d) 142,961 -- -- -- -- --
Long-term debt 270,683 359,593 268,292 267,158 168,220 163,437
Total liabilities 2,008,168 1,794,489 1,640,891 1,210,555 820,178 607,981
Shareholders' equity 166,884 150,774 177,052 99,084 64,369 50,831
Total liabilities and equity $2,175,052 $1,945,263 $1,817,943 $1,309,639 $884,547 $658,812
Non-deposit short-term debt % assets 10.6% 17.1% 20.1% 8.3% 19.4% 21.3%
% as of Year End 2010 14.7% 14.0% 13.5% 4.4% 28.5% 23.6%
(a) Includes federal funds purchased and sold, securities borrowed, loaned, or sold under repurchase agreements, plus other
collateralized borrowings.
(b) Includes trading and derivative liabilities, payables to customers, counterparties, brokers, dealers, and clearing services.
(c) Includes reserves for unfunded lending commitments, allowances for credit losses, and other payables.
(d) For JPMorgan includes borrowings associated with the Federal Reserve AML facility.
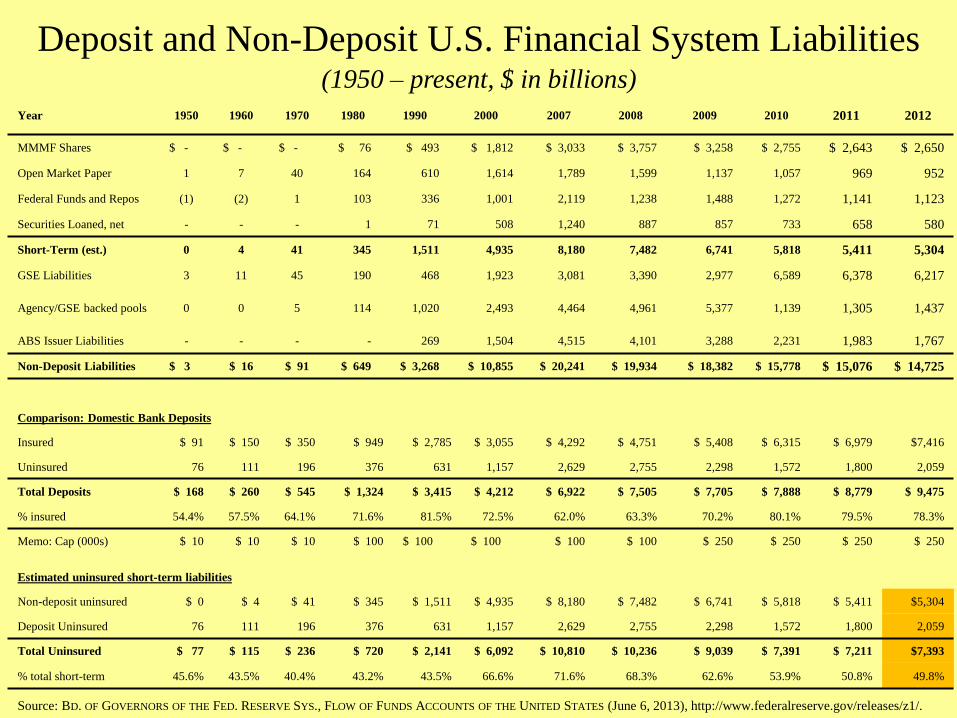
Deposit and Non-Deposit U.S. Financial System Liabilities (1950 – present, $ in billions)
Source: BD. OF GOVERNORS OF THE FED. RESERVE SYS., FLOW OF FUNDS ACCOUNTS OF THE UNITED STATES (June 6, 2013), http://www.federalreserve.gov/releases/z1/.
Year 1950 1960 1970 1980 1990 2000 2007 2008 2009 2010 2011 2012
MMMF Shares $ - $ - $ - $ 76 $ 493 $ 1,812 $ 3,033 $ 3,757 $ 3,258 $ 2,755 $ 2,643 $ 2,650
Open Market Paper 1 7 40 164 610 1,614 1,789 1,599 1,137 1,057 969 952
Federal Funds and Repos (1) (2) 1 103 336 1,001 2,119 1,238 1,488 1,272 1,141 1,123
Securities Loaned, net - - - 1 71 508 1,240 887 857 733 658 580
Short-Term (est.) 0 4 41 345 1,511 4,935 8,180 7,482 6,741 5,818 5,411 5,304
GSE Liabilities 3 11 45 190 468 1,923 3,081 3,390 2,977 6,589 6,378 6,217
Agency/GSE backed pools 0 0 5 114 1,020 2,493 4,464 4,961 5,377 1,139 1,305 1,437
ABS Issuer Liabilities - - - - 269 1,504 4,515 4,101 3,288 2,231 1,983 1,767
Non-Deposit Liabilities $ 3 $ 16 $ 91 $ 649 $ 3,268 $ 10,855 $ 20,241 $ 19,934 $ 18,382 $ 15,778 $ 15,076 $ 14,725
Comparison: Domestic Bank Deposits
Insured $ 91 $ 150 $ 350 $ 949 $ 2,785 $ 3,055 $ 4,292 $ 4,751 $ 5,408 $ 6,315 $ 6,979 $7,416
Uninsured 76 111 196 376 631 1,157 2,629 2,755 2,298 1,572 1,800 2,059
Total Deposits $ 168 $ 260 $ 545 $ 1,324 $ 3,415 $ 4,212 $ 6,922 $ 7,505 $ 7,705 $ 7,888 $ 8,779 $ 9,475
% insured 54.4% 57.5% 64.1% 71.6% 81.5% 72.5% 62.0% 63.3% 70.2% 80.1% 79.5% 78.3%
Memo: Cap (000s) $ 10 $ 10 $ 10 $ 100 $ 100 $ 100 $ 100 $ 100 $ 250 $ 250 $ 250 $ 250
Estimated uninsured short-term liabilities
Non-deposit uninsured $ 0 $ 4 $ 41 $ 345 $ 1,511 $ 4,935 $ 8,180 $ 7,482 $ 6,741 $ 5,818 $ 5,411 $5,304
Deposit Uninsured 76 111 196 376 631 1,157 2,629 2,755 2,298 1,572 1,800 2,059
Total Uninsured $ 77 $ 115 $ 236 $ 720 $ 2,141 $ 6,092 $ 10,810 $ 10,236 $ 9,039 $ 7,391 $ 7,211 $7,393
% total short-term 45.6% 43.5% 40.4% 43.2% 43.5% 66.6% 71.6% 68.3% 62.6% 53.9% 50.8% 49.8%
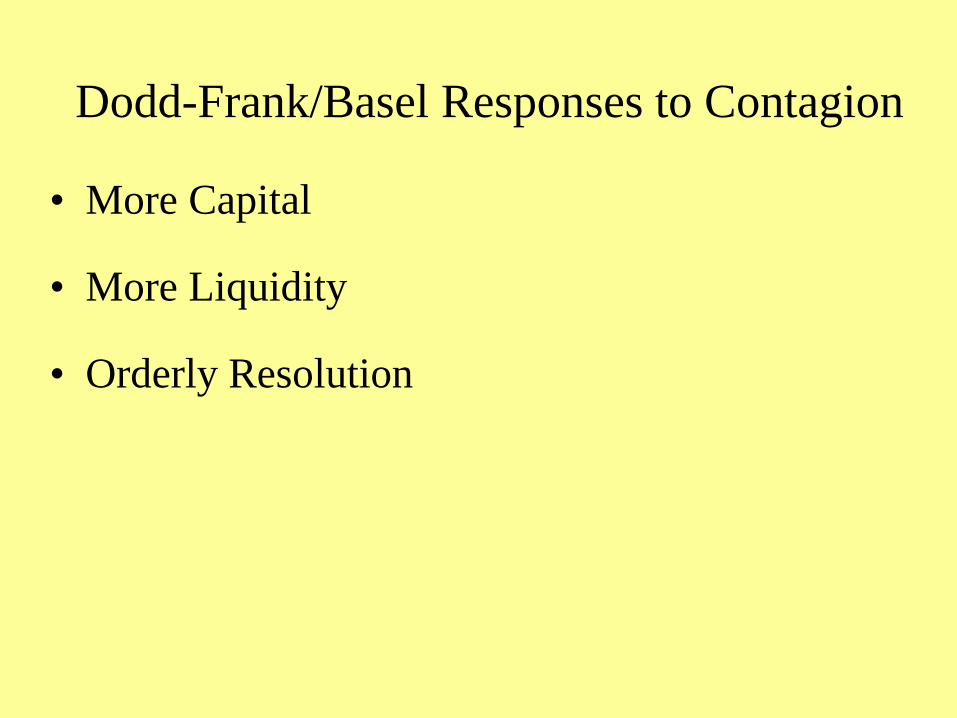
Dodd-Frank/Basel Responses to Contagion
• More Capital
• More Liquidity
• Orderly Resolution
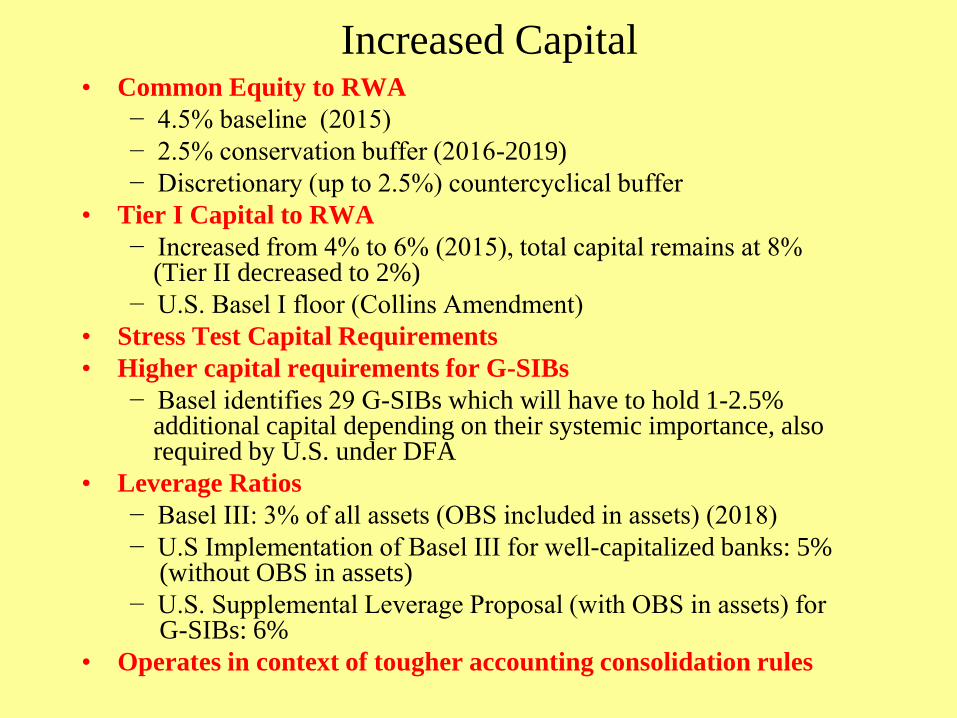
Increased Capital
• Common Equity to RWA
− 4.5% baseline (2015)
− 2.5% conservation buffer (2016-2019)
− Discretionary (up to 2.5%) countercyclical buffer
• Tier I Capital to RWA
− Increased from 4% to 6% (2015), total capital remains at 8% (Tier II decreased to 2%)
− U.S. Basel I floor (Collins Amendment)
• Stress Test Capital Requirements
• Higher capital requirements for G-SIBs
− Basel identifies 29 G-SIBs which will have to hold 1-2.5% additional capital depending on their systemic importance, also required by U.S. under DFA
• Leverage Ratios
− Basel III: 3% of all assets (OBS included in assets) (2018)
− U.S Implementation of Basel III for well-capitalized banks: 5% (without OBS in assets)
− U.S. Supplemental Leverage Proposal (with OBS in assets) for G-SIBs: 6%
• Operates in context of tougher accounting consolidation rules

“The Dog and the Frisbee,” Speech by Mr. Andrew G Haldane, Executive Director, Financial
Stability, Bank of England, and Mr. Vasileios Madouros, Economist, Bank of England.
Given at the Federal Reserve Bank of Kansas City’s 366th economic policy symposium, “The
changing policy landscape,” Jackson Hole, Wyoming, 31 August 2012.
The Dog and the Frisbee
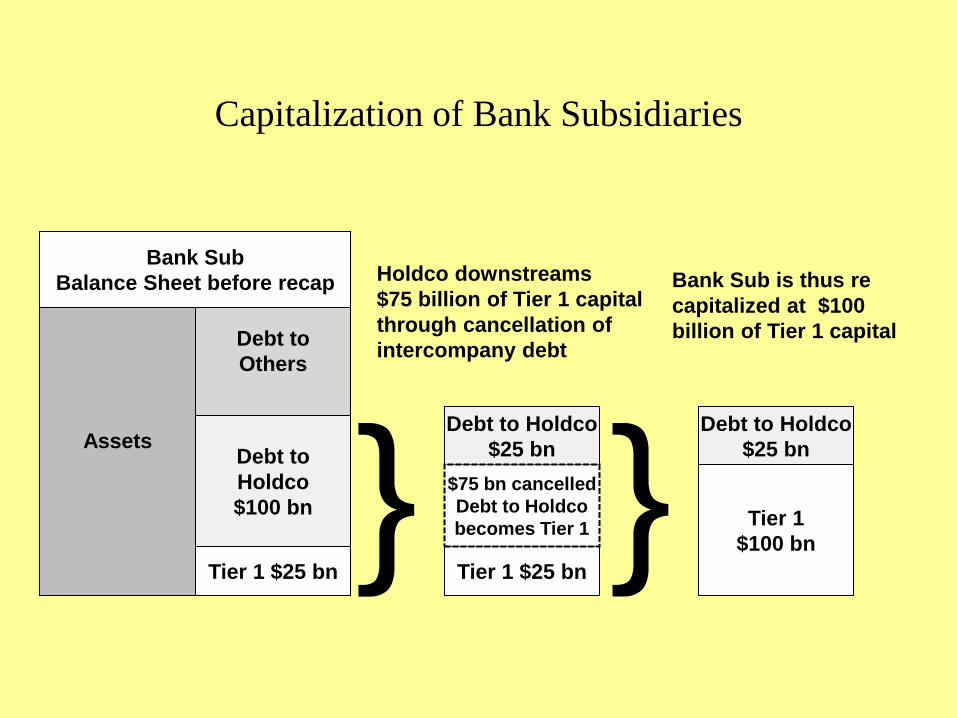
Assets
Debt to
Others
Debt to
Holdco
$100 bn
Tier 1 $25 bn
Bank Sub
Balance Sheet before recap
} Debt to Holdco
$25 bn
Tier 1 $25 bn
$75 bn cancelled
Debt to Holdco
becomes Tier 1
Holdco downstreams
$75 billion of Tier 1 capital
through cancellation of
intercompany debt
} Debt to Holdco
$25 bn
Tier 1
$100 bn
Bank Sub is thus re
capitalized at $100
billion of Tier 1 capital
Capitalization of Bank Subsidiaries
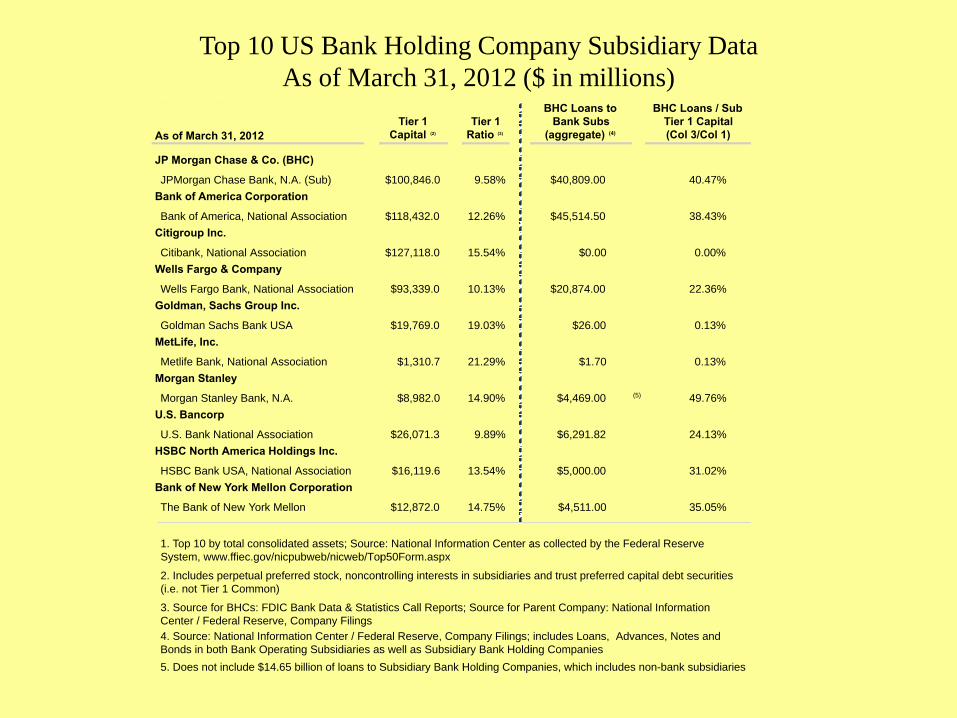
Top 10 US Bank Holding Company Subsidiary Data
As of March 31, 2012 ($ in millions)
Top 10 U.S. Bank Holding Company Subsidiary Data (1)
($ in millions)
As of March 31, 2012
JP Morgan Chase & Co. (BHC)
JPMorgan Chase Bank, N.A. (Sub)
Top 10 U.S. Bank Holding Company Subsidiary Data (1)
Tier 1
Capital (2)
$100,846.0
Top 10 U.S. Bank Holding Company Subsidiary Data (1)
Tier 1
Ratio (3)
9.58%
Top 10 U.S. Bank Holding Company Subsidiary Data (1)Top 10 U.S. Bank Holding Company Subsidiary Data (1)
BHC Loans to
Bank Subs
(aggregate) (4)
BHC Loans / Sub
Tier 1 Capital
(Col 3/Col 1)
$40,809.00 40.47%
Bank of America Corporation
Bank of America, National Association $118,432.0 12.26% $45,514.50 38.43%
Citigroup Inc.
Citibank, National Association $127,118.0 15.54% $0.00 0.00%
Wells Fargo & Company
Wells Fargo Bank, National Association $93,339.0 10.13% $20,874.00 22.36%
Goldman, Sachs Group Inc.
Goldman Sachs Bank USA $19,769.0 19.03% $26.00 0.13%
MetLife, Inc.
Metlife Bank, National Association $1,310.7 21.29% $1.70 0.13%
Morgan Stanley
Morgan Stanley Bank, N.A. $8,982.0 14.90% $4,469.00 (5) 49.76%
U.S. Bancorp
U.S. Bank National Association $26,071.3 9.89% $6,291.82 24.13%
HSBC North America Holdings Inc.
HSBC Bank USA, National Association $16,119.6 13.54% $5,000.00 31.02%
Bank of New York Mellon Corporation
The Bank of New York Mellon $12,872.0 14.75% $4,511.00 35.05%
5. Does not include $14.65 billion of loans to Subsidiary Bank Holding Companies, which includes non-bank subsidiaries
1. Top 10 by total consolidated assets; Source: National Information Center as collected by the Federal Reserve
System, www.ffiec.gov/nicpubweb/nicweb/Top50Form.aspx
2. Includes perpetual preferred stock, noncontrolling interests in subsidiaries and trust preferred capital debt securities
(i.e. not Tier 1 Common)
3. Source for BHCs: FDIC Bank Data & Statistics Call Reports; Source for Parent Company: National Information
Center / Federal Reserve, Company Filings
4. Source: National Information Center / Federal Reserve, Company Filings; includes Loans, Advances, Notes and
Bonds in both Bank Operating Subsidiaries as well as Subsidiary Bank Holding Companies
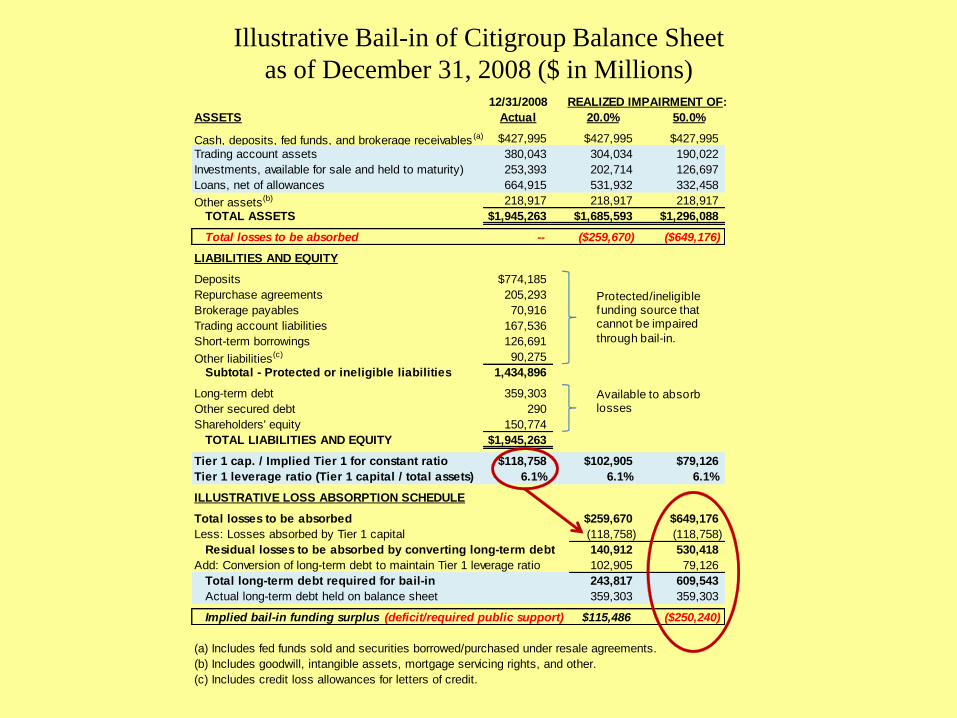
Illustrative Bail-in of Citigroup Balance Sheet
as of December 31, 2008 ($ in Millions) 12/31/2008 REALIZED IMPAIRMENT OF:
ASSETS Actual 20.0% 50.0%
Cash, deposits, fed funds, and brokerage receivables (a) $427,995 $427,995 $427,995
Trading account assets 380,043 304,034 190,022
Investments, available for sale and held to maturity) 253,393 202,714 126,697
Loans, net of allowances 664,915 531,932 332,458
Other assets(b) 218,917 218,917 218,917
TOTAL ASSETS $1,945,263 $1,685,593 $1,296,088
Total losses to be absorbed -- ($259,670) ($649,176)
LIABILITIES AND EQUITY
Deposits $774,185
Repurchase agreements 205,293
Brokerage payables 70,916
Trading account liabilities 167,536
Short-term borrowings 126,691
Other liabilities(c) 90,275
Subtotal - Protected or ineligible liabilities 1,434,896
Long-term debt 359,303
Other secured debt 290
Shareholders' equity 150,774
TOTAL LIABILITIES AND EQUITY $1,945,263
Tier 1 cap. / Implied Tier 1 for constant ratio $118,758 $102,905 $79,126
Tier 1 leverage ratio (Tier 1 capital / total assets) 6.1% 6.1% 6.1%
ILLUSTRATIVE LOSS ABSORPTION SCHEDULE
Total losses to be absorbed $259,670 $649,176
Less: Losses absorbed by Tier 1 capital (118,758) (118,758)
Residual losses to be absorbed by converting long-term debt 140,912 530,418
Add: Conversion of long-term debt to maintain Tier 1 leverage ratio 102,905 79,126
Total long-term debt required for bail-in 243,817 609,543
Actual long-term debt held on balance sheet 359,303 359,303
Implied bail-in funding surplus (deficit/required public support) $115,486 ($250,240)
(a) Includes fed funds sold and securities borrowed/purchased under resale agreements.
(b) Includes goodwill, intangible assets, mortgage servicing rights, and other.
(c) Includes credit loss allowances for letters of credit.
Protected/ineligible funding source that cannot be impaired
through bail-in.
Available to absorb losses

How to Deal with Contagion
• Strong and Clear Lender of Last Resort
• Possible Limit on Short-term Liabilities
• Possible Extension of Insurance of Short-term
Liabilities
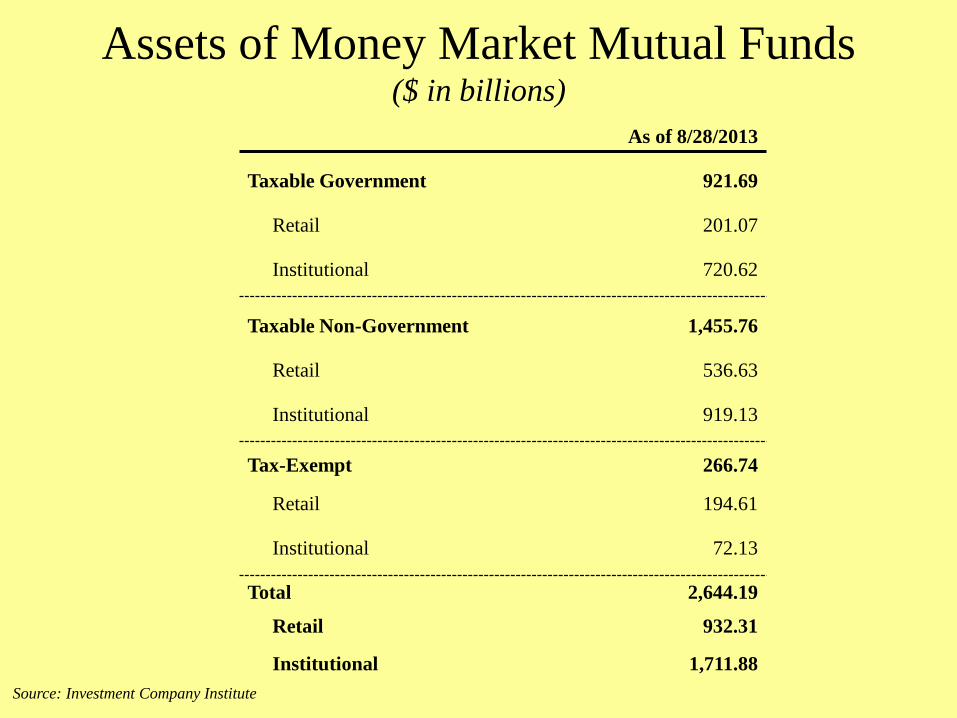
Assets of Money Market Mutual Funds ($ in billions)
As of 8/28/2013
Taxable Government 921.69
Retail 201.07
Institutional 720.62
Taxable Non-Government 1,455.76
Retail 536.63
Institutional 919.13
Tax-Exempt 266.74
Retail 194.61
Institutional 72.13
Total 2,644.19
Retail 932.31
Institutional 1,711.88
Source: Investment Company Institute
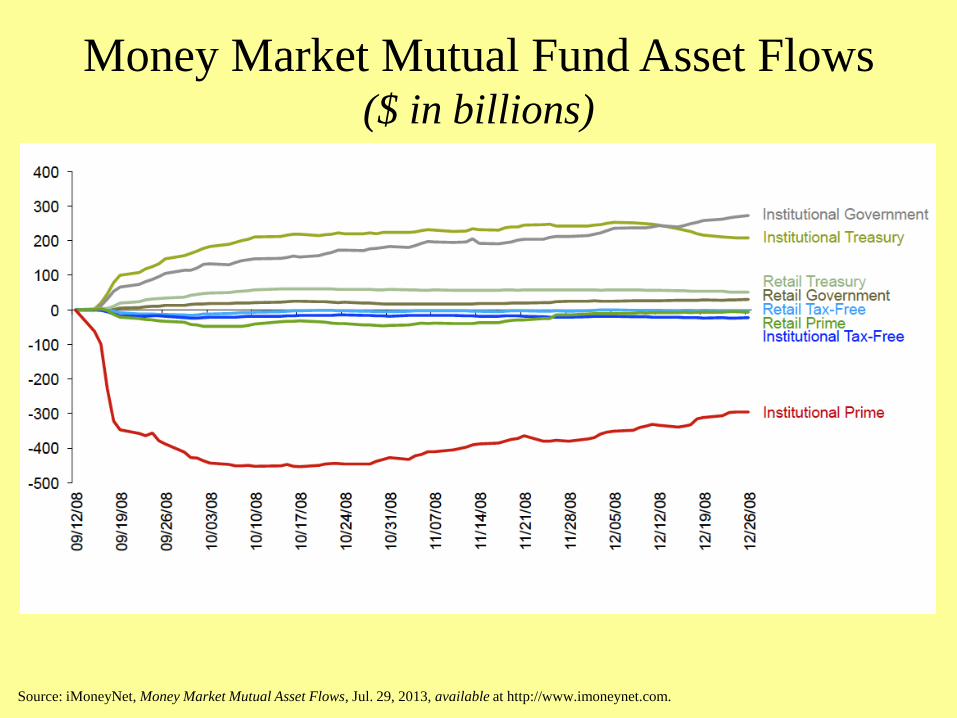
Money Market Mutual Fund Asset Flows ($ in billions)
Source: iMoneyNet, Money Market Mutual Asset Flows, Jul. 29, 2013, available at http://www.imoneynet.com.
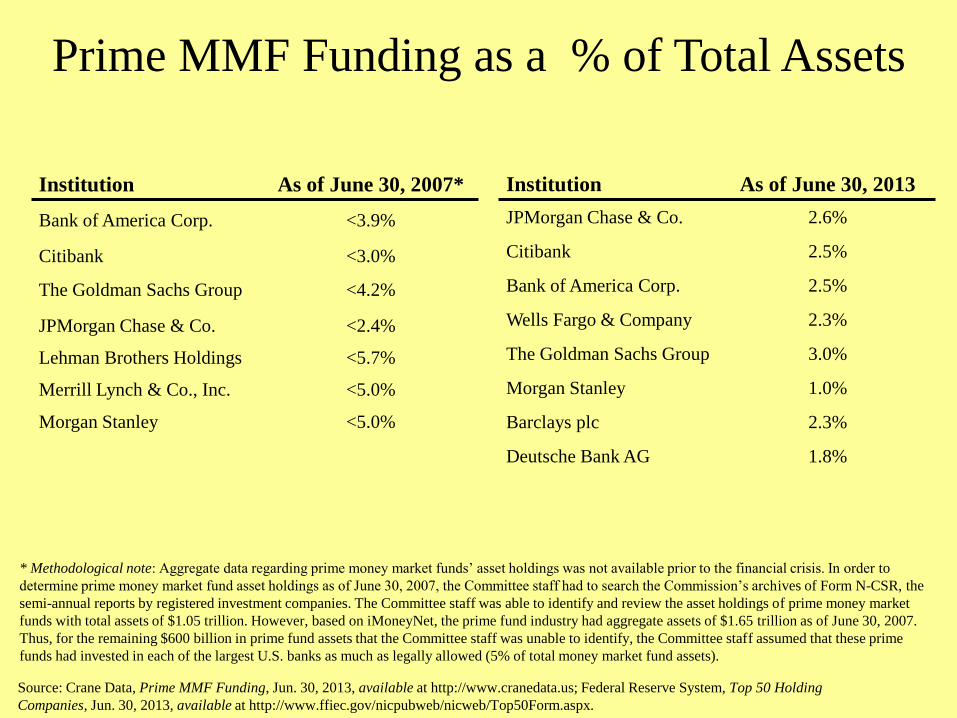
Prime MMF Funding as a % of Total Assets
Institution As of June 30, 2013
JPMorgan Chase & Co. 2.6%
Citibank 2.5%
Bank of America Corp. 2.5%
Wells Fargo & Company 2.3%
The Goldman Sachs Group 3.0%
Morgan Stanley 1.0%
Barclays plc 2.3%
Deutsche Bank AG 1.8%
Source: Crane Data, Prime MMF Funding, Jun. 30, 2013, available at http://www.cranedata.us; Federal Reserve System, Top 50 Holding
Companies, Jun. 30, 2013, available at http://www.ffiec.gov/nicpubweb/nicweb/Top50Form.aspx.
Institution As of June 30, 2007*
Bank of America Corp. <3.9%
Citibank <3.0%
The Goldman Sachs Group <4.2%
JPMorgan Chase & Co. <2.4%
Lehman Brothers Holdings <5.7%
Merrill Lynch & Co., Inc. <5.0%
Morgan Stanley <5.0%
* Methodological note: Aggregate data regarding prime money market funds’ asset holdings was not available prior to the financial crisis. In order to
determine prime money market fund asset holdings as of June 30, 2007, the Committee staff had to search the Commission’s archives of Form N-CSR, the
semi-annual reports by registered investment companies. The Committee staff was able to identify and review the asset holdings of prime money market
funds with total assets of $1.05 trillion. However, based on iMoneyNet, the prime fund industry had aggregate assets of $1.65 trillion as of June 30, 2007.
Thus, for the remaining $600 billion in prime fund assets that the Committee staff was unable to identify, the Committee staff assumed that these prime
funds had invested in each of the largest U.S. banks as much as legally allowed (5% of total money market fund assets).