Embed Size (px)
Citation preview
-1-
Connecting Research to Practice
in a Culture of Assessment
for Introductory College-level Statistics
Report Arising from a Research Retreat at
American Statistical Association
This report may be cited as Pearl, D.K., Garfield, J.B., delMas, R., Groth, R.E., Kaplan, J.J., McGowan, H., and Lee, H.S. (2012). Connecting Research to Practice in a Culture of Assessment for Introductory College-level Statistics. [Online: http:// www.causeweb.org/research/guidelines/ResearchReport_Dec_2012.pdf]
-2-
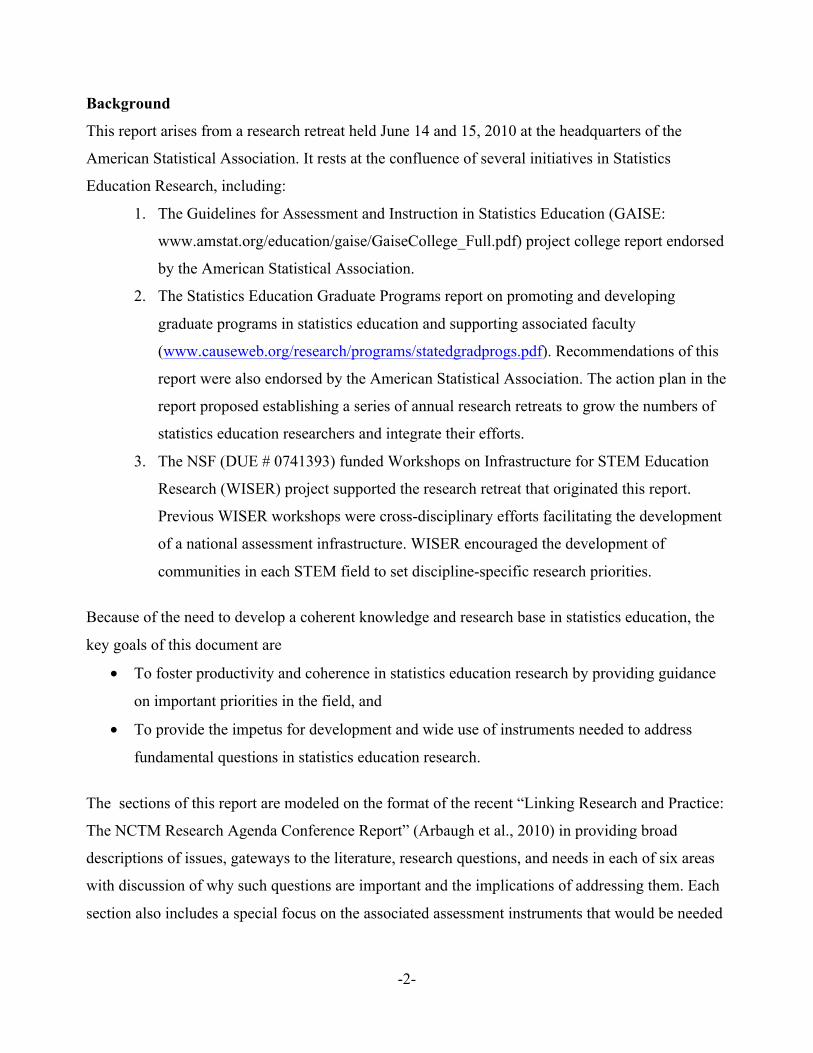
Background
This report arises from a research retreat held June 14 and 15, 2010 at the headquarters of the
American Statistical Association. It rests at the confluence of several initiatives in Statistics
Education Research, including:
1. The Guidelines for Assessment and Instruction in Statistics Education (GAISE:
www.amstat.org/education/gaise/GaiseCollege_Full.pdf) project college report endorsed
by the American Statistical Association.
2. The Statistics Education Graduate Programs report on promoting and developing
graduate programs in statistics education and supporting associated faculty
(www.causeweb.org/research/programs/statedgradprogs.pdf). Recommendations of this
report were also endorsed by the American Statistical Association. The action plan in the
report proposed establishing a series of annual research retreats to grow the numbers of
statistics education researchers and integrate their efforts.
3. The NSF (DUE # 0741393) funded Workshops on Infrastructure for STEM Education
Research (WISER) project supported the research retreat that originated this report.
Previous WISER workshops were cross-disciplinary efforts facilitating the development
of a national assessment infrastructure. WISER encouraged the development of
communities in each STEM field to set discipline-specific research priorities.
Because of the need to develop a coherent knowledge and research base in statistics education, the
key goals of this document are
• To foster productivity and coherence in statistics education research by providing guidance
on important priorities in the field, and
• To provide the impetus for development and wide use of instruments needed to address
fundamental questions in statistics education research.
The sections of this report are modeled on the format of the recent “Linking Research and Practice:
The NCTM Research Agenda Conference Report” (Arbaugh et al., 2010) in providing broad
descriptions of issues, gateways to the literature, research questions, and needs in each of six areas
with discussion of why such questions are important and the implications of addressing them. Each
section also includes a special focus on the associated assessment instruments that would be needed
-3-
to address these important research questions while a review of currently available assessment
instruments is provided in a seventh section. The areas discussed are then
1. Cognitive outcomes 2. Affective constructs 3. Curriculum
4. Teaching Practice 5. Teacher Development 6. Technology 7. Assessment
Finally, two important points that should be taken into account when reading this report. First, we
note that it is important to explicitly include issues of diversity in addressing all of the research
questions stated since results do not always generalize across different populations. Secondly, while
the references cited in the report are dominated by those in statistics education research, it is also
important to recognize the parallel work done in other STEM education areas that must be
examined to have a command of any of these areas.
Writing Team:
Robert delMas, University of Minnesota
Joan Garfield, University of Minnesota (co-chair)
Randall Groth, Salisbury University
Jennifer J. Kaplan, University of Georgia
Herle McGowan, North Carolina State University
Hollylynne S. Lee, North Carolina State University
Dennis Pearl, Ohio State University (co-chair)
Other Research Retreat Participants:
Felicity Enders, Mayo Clinic
Iddo Gal, University of Haifa, Israel
Sterling Hilton, Brigham Young University
Cliff Konold, University of Massachusetts
Michael Posner, Villanova University
Candace Schau, CS Consultants, LLC
Michael Shaughnessy, Portland State University
Finbarr Sloane, Arizona State University We wish to acknowledge the help of Elizabeth Fry in checking references and helping to prepare this report.
-4-
1. Cognitive Outcomes
“… the nature of knowledge and learning are suggestive of instructional approaches we should stress (and others we should de-emphasize) if we want to affect how students think (as opposed to how they respond on exams).” (Konold, 1995).
Introduction
We define cognitive outcomes as the content knowledge and thinking processes that we want
students to develop in an introductory statistics course. As the field and practice of statistics has
changed, it has become more difficult to provide an agreed upon list of specific topics or procedures
that all students should learn. There are, however, some guidelines that may be useful in the
development of such a list. Two examples are the organization of outcomes distinguished in terms
of statistical literacy, reasoning and thinking (see Garfied and Ben-Zvi, 2008) and the GAISE
report, which defines a set of learning outcomes for first courses that describe ways of
understanding and thinking about statistics but does not list topics or content to be covered.
Brief Literature Review
In their review of research on teaching and learning statistics, Garfield and Ben-Zvi (2007)
identified common student errors and misconceptions citing evidence that they are widespread and
persistent, similar at all age levels and difficult to change (e.g. Garfield, 2003; Gigerenzer, 1996;
Kahneman et al., 1982; Sedlmeier, 1999). Studies also suggest that statistical reasoning is often self-
contradictory as indicated by assessment data (e.g., Konold et al., 1993). While there is some
evidence that statistical instruction can lead to positive results (e.g., Kaplan & Du, 2009), there is no
strong evidence that learning is sustained beyond the instructional sessions, or that it is generalized
beyond the specific types of problems used.
Studies of instructional approaches indicate that developing an understanding of some of the
important ideas in statistics (e.g., distribution, center, variability, inference) can be accomplished
through carefully designed sequences of activities that use technological tools selected to support
students’ conceptual development (e.g. Ben-Zvi & Amir, 2005; Cobb, McClain & Gravemeijer,
2003; Lehrer & Schauble, 2002, 2007; Paparistodemou & Meletiou-Mavrotheris, 2008; Pfannkuch,
2006; Watson, 2008). Other recommendations from the research literature are that concepts need to
be revisited over substantial periods of time (Ben-Zvi, 2000), that understanding can be facilitated
by starting with informal, intuitive ideas and moving toward more formal ways of thinking
-5-
(Garfield & Ben-Zvi, 2010; Lee, Angotti, & Tarr, 2010), and that the concepts of distribution,
center and spread should be treated simultaneously, rather than as separate, isolated topics (see
Garfield & Ben-Zvi, 2008).
Few standard assessments have been used to assess cognitive outcomes. Nearly all published
studies using such tools provide data on the Statistical Reasoning Assessment (SRA: see Garfield,
2003) and the Comprehensive Assessment of Outcomes of a first course in Statistics (CAOS: see
delMas, Garfield, Ooms, and Chance, 2007). These studies corroborate the evidence that students
have difficulty reasoning about statistical concepts. Studies using interviews and qualitative data
methods have also revealed student difficulty in reasoning about important statistical ideas (see
delMas & Liu, 2005; Groth & Bergner, 2006). Qualitative studies have also indicated that even
students who receive the highest grades in a college-level introductory statistics course can have
relatively unsophisticated understanding of important ideas at the end of the course (e.g. Clark,
Karuat, Mathews & Wimbish, 2003; Mathews & Clark, 2003).
More recent research on helping students achieve desired cognitive outcomes focus on the
construction and testing of learning trajectories. Garfield and Ben-Zvi (2008) suggest sequences of
activities that provide a hypothetical “learning trajectory” for developing 11 of the big ideas in
statistics, such as data distribution, center, and variability. According to Confrey, Maloney, Nguyen,
Wilson, and Mojica (2008):
A learning trajectory is a researcher-conjectured, empirically supported description of the ordered network of constructs a student encounters through instruction (i.e. activities, tasks, tools, forms of interaction and methods of evaluation), in order to move from informal ideas, through successive refinements of representation, articulation, and reflection, towards increasingly complex concepts over time.
An example of a hypothetical learning trajectory for how students develop an understanding of how
to construct and interpret data displays is provided by Lehrer, Konold and Kim (2006).
In contrast to studies on developing particular types of statistical reasoning, Wild and Pfannkuch
(1999) developed a model of statistical thinking that has been used to promote and study student
learning outcomes.
-6-
Research Questions & Priorities Two research priorities are described that are needed to advance our knowledge of appropriate
learning progressions for an agreed upon list of learning outcomes.
Research Priority 1: What are the core learning outcomes of statistics that students should develop
in order to be statistically literate citizens, to be prepared to use statistics in their careers or future
courses and/or to be statistical thinkers, having a statistician's approach to problem solving?
Examples of questions include:
1. What core learning outcomes employed in a particular profession do individuals need to
develop in order to perform well in that profession (e.g., the outcomes that are common and
those that are unique to disciplines such as psychology, biology, and economics)?
2. What core learning outcomes help people to make informed decisions based on data on a
daily basis (e.g., what types of statistical literacy are needed to understand statistical
information in the media and other public forums)?
3. What are the new learning outcomes that students will need to develop given the changing
nature of the discipline of statistics (e.g. what new learning outcomes result from the
changing nature of data, availability of computing tools, or changes in available analysis
methods)?
Research Priority 2: What are efficient and valid learning progressions or trajectories associated
with developing the core learning outcomes of statistics?
Examples of questions include:
1. What are the cognitive processes that underlie student development of more expert
conceptions of a particular statistical concept (e.g., the nature of informal inferential
thinking, the nature of formal inferential thinking)?
2. What are the stages of development for students learning a particular statistical concept or
core idea (e.g., the nature of student progress from informal to formal understanding of a
statistical concept)?
3. What are the relationships among different learning outcomes and learning progressions for
the various types of statistical understanding being developed (e.g., understanding sampling
distributions as a putative requirement to understanding the core logic of hypothesis
testing)?
4. How do learning progressions differ for different types of students?
-7-
If we knew the answer to these questions, then:
• Curriculum developers and other resource developers would have guidance in choosing
content and progressions of content aligned with the student audience.
• Instructors would have guidance in choosing written curricula and classroom pedagogies to
enact a curriculum and meet the needs of their students.
• Textbook authors would have guidance in sequencing topics and providing supplementary
materials for classroom use that would be effective in supporting student learning.
Measurement/Assessment Needs
We need more validated assessments of cognitive outcomes that can be used for both formative and
summative assessment to provide feedback to students and instructors, to departments and
programs, and to researchers. These assessments should provide flexibility, perhaps in a modular
form, so that they can be adapted for courses with different outcomes, and should be updated
periodically to reflect the changing field and practice of statistics.
Specific assessments to be used at various stages of learning progressions will allow more precise
information about the development of students’ learning and reasoning about particular outcomes
(e.g. Battista, 2004; Clements & Sarama, 2004; Lehrer, Konold & Kim, 2006).
-8-
2. Affective Constructs
“…students' feelings about statistics education, and the effects of these feelings on resulting learning, knowledge and further interest in statistics, should occupy a more central role in the minds of statistics educators.” (Gal & Ginsburg, 1994)
Introduction
An important set of constructs, we shall call affective for want of a better term, falls outside of the
definition of cognitive outcomes described in the previous section. These include the broad areas of
attitudes, beliefs, emotions, dispositions, and motivations (Bloom, 1956). Of course, within each of
these categories there exist several narrower constructs that are important for educational research,
for example: self-efficacy, cognitive competence, persistence, anxiety, perceived value, goals,
interest, expectations, desire to learn, learning approaches, curiosity, flexibility, engagement, effort,
participation, etc. This partial list of affective constructs is meant to illustrate the wide variety of
student or teacher characteristics putatively important to achieving success in teaching and learning
and that also serve as important outcomes in their own right. Educational and psychological
theories such as Expectancy-Value Theory (EVT: Eccles et al, 1983) stress the importance of these
affective constructs in teaching and learning and as outcomes (see Wentzel and Wigfield (2009) for
reviews of this and other relevant theories). Implicitly throughout this discussion we focus on these
issues as they pertain to statistics (e.g. attitudes toward statistics, desire to learn statistics, or teacher
beliefs about the value of statistics and their self-efficacy in teaching it).
Brief Literature Review
Perhaps because students often express negative opinions about statistics and statistics courses,
many researchers have focused on attitudes including anxiety towards statistics, and instruments
have been developed to assess these constructs. Schau and Gal (1997) reviewed the work in this
area prior to the mid 1990’s, while Zieffler et al. (2008) reviewed the research focusing on college
students and non-cognitive factors that affect the learning of statistics. Many of the studies reviewed
tried to relate the affective factors to cognitive outcomes. For example, Budé, et al. (2007)
developed and used a questionnaire to examine motivational constructs and their effect on students’
academic achievement within a statistics course. They identified dimensions of causal attributions,
outcome expectancy, affect, and study behavior, with respect to statistics. Their results, based on a
path analysis, suggested a relationship between negative attitudes toward statistics and poor study
habits, which led to poor scores on achievement measures.
-9-
More recently, using EVT and other theories, Ramirez, Schau, and Emmioğlu (2012) created a
longitudinal conceptual model that includes three broad constructs that research results show are
related to statistics course outcomes: student characteristics, previous achievement-related
experiences, and statistics attitudes. Although the model is described using attitudes, any of the
affective constructs can be substituted; in fact, the model is likely to be most useful when a
constellation of such constructs are included. Emmioğlu and Capa-Aydin (2012), using meta-
analysis, showed that the relationships among attitudes and course achievement was positive and
small or moderate in size with a tendency for stronger relationships in studies done in the US. Hood,
Creed, and Neumann (2012) used path analysis to test an expectancy value model of motivation and
found that past performance, effort, and expectancies for success in the course contributed
positively to achievement.
The research on the learning of statistics by college students has provided evidence supporting the
effect of other specific affective factors in learning statistics. Finney and Schraw (2003) found that
self-efficacy concerning statistics plays an important role not only in students’ attitudes about
statistics, but also in their performance in a statistics course. Onwuegbuzie and Wilson (2003)
define statistics anxiety as "anxiety which occurs when a student encounters statistics in any form
and at any level (p. 196)" – in other words, anxiety and negative feelings elicited by statistics in
general that may hinder performance on statistics-related tasks. They further assert that the research
findings support statistics anxiety as one of the biggest predictors of achievement in research
methodology and statistics courses. Gal and Ginsburg (1994) expand this idea by positing that
statistics anxiety could engender ill-prepared students who may not master material because they
feel hindered by nervousness. Thus, the potential role of statistics anxiety in particular has been well
documented in the literature.
Recent surveys by Nolan, Beran, and Hecker (2012) and by Ramirez, Schau, and Emmioğlu (2012)
all together listed 22 instruments designed to assess attitudes in general or specific attitude
components. However, research results from only four of these instruments were found to show
reasonable amounts of evidence regarding their validity and reliability under the rationale of
classical test theory (e.g., Cashin and Elmore, 2005; Schau, Stevens, Dauphinee, and Del Vecchio,
1995), though further improvements may be needed (e.g. Vanhoof et al. 2010). These four
instruments include: the two versions of the Survey of Attitudes Toward Statistics (SATS)
-10-
developed by Schau (1992, 2003); the Attitude Toward Statistics Scale (ATS) developed by Wise
(1985); and the Statistics Attitude Survey (SAS) developed by Roberts and Bilderback (1980).
These attitude surveys present students with a series of statements about statistics that they rate on a
Likert-type agreement/disagreement scale.
Zieffler et al. (2008) conclude that studies of affective factors suggest that careful use of
instruments such as the SATS, ATS, and SAS, may allow teachers to learn about students’ attitudes
and anxiety about learning statistics; what value judgments students place on the study of statistics;
how difficult they perceive statistics to be; and how useful they perceive statistics to be. However,
they caution that studies of pre-post course change as measured by such instruments, often show
little change, perhaps indicating the stability of the factors studied and the accompanying resistance
to change (e.g., Gal, Ginsburg, & Schau, 1997). However, a few researchers have reported modest
success at improving student attitudes in individual courses (e.g., Carlson & Winquist, 2011;
Harlow et al., 2002; Posner, 2011). Gal and Ginsburg (1994) wrote that "students’…affective
responses or self-confidence regarding statistics, may be more labile and likely to fluctuate
depending on changing circumstances and classroom events. Thus, interpretation of score changes
needs to take into account the expected stability over time of the constructs being measured."
Although most studies examining attitudes are quantitative in design, some qualitative and mixed
methods studies also exist. The results from these studies suggest, for example, that students’
experiences with statistics (e.g., Reid and Petocz, 2002) and that their reflections of their
experiences and understandings of what it means to do statistics (e.g., Gordon, 1995) can affect
their motivations to persevere in learning difficult concepts and in their views of the discipline of
statistics.
There is widespread agreement that statistics instructors need to try to make the study of statistics a
positive one for students and to find ways to bring in examples of interesting research studies, data
sets, and problems. Students come to statistics courses with varying expectations and perceptions of
what statistics is about (Bond, Perkins, & Ramirez, 2012). Reid and Petocz (2002) argue that an
awareness of the professional statistician’s point of view is important for helping students
appreciate why certain concepts are important to understand. Zieffler et al. (2008) suggest that when
students' attitudes toward statistics improve, they may be more motivated to attend class and engage
-11-
in activities and challenging tasks, which could ultimately improve their cognitive learning
outcomes. Also, beyond immediate impacts on cognitive outcomes, positive attitudes developed
during the instructional period may improve long term disposition toward statistics; an important
endpoint in its own right.
Research Questions & Priorities
Four broad priorities pertaining to affective constructs were identified; the first three refer to
students’ affect while the fourth refers to teachers. These priorities are: 1) measurement, 2)
relationship to cognitive outcomes, 3) importance beyond introductory statistics, and 4) teachers’
affect.
Research Priority 1: How can affective constructs be accurately measured?
Examples of questions include:
1. Are some better measured through a particular approach, such as self-report, observational
report, interviews, and/or measuring physical correlates?
2. What instruments need to be developed to measure these affective constructs within the
context of statistics? What general non-attitudinal instruments can be adapted to statistics
students and can these instruments be designed to deal with the multidimensional nature of
the constructs?
3. What are the relationships between general constructs like anxiety and statistics-specific
constructs like statistics anxiety? Can the relationships be exploited to provide valid
information using a statistics-specific modular addition to an instrument measuring an
affective construct in general?
Research Priority 2: How do affective constructs contribute to success in learning statistics, in
either the short or long term?
Examples of questions include:
1. Which affective constructs can be improved in the context of a course and which are too
stable to change (the “states or traits” question)?
-12-
2. What factors--such as teaching practices and teacher characteristics, curriculum,
technologies, learning experiences, social dynamics/class chemistry--are most effective in
improving affective traits amenable to change?
3. Is the role of affective constructs in learning different in online or hybrid courses?
Research Priority 3: How do these affective constructs contribute to long-term engagement with
statistics (e.g. statistically literate citizenship)?
Examples of questions include:
1. Which are related to or influence a student’s decision to take additional statistics courses?
2. Which are related to or influence student attitudes when encountering statistics outside of
school, in their personal or work life?
Research Priority 4: What are the important affective constructs to measure about teachers, and
how do these influence teaching practice and ultimately impact student outcomes?
Examples of questions include:
1. What instruments need to be developed for measuring the important affective constructs for
teachers within the context of statistics? How can these instruments be made to deal with the
multidimensional nature of these constructs?
2. What can be learned from the interactions between the different affective constructs that will
directly influence teaching practice?
3. How does a teacher’s passion or excitement for statistics influence student outcomes? How
can passion or excitement be measured, for example can a rating scale of observed passion
or excitement in the classroom be developed?
If we knew the answers to these questions, then:
• Researchers would better understand the complex web of factors that influence outcomes of
statistics instruction and that shape statistically literate behavior after the end of instruction.
• Instructors and curriculum developers could develop interventions (e.g. course materials,
pedagogical approaches) that target specific affective constructs.
• Professional development efforts could make instructors and advisors aware of the
importance of these affective constructs and demonstrate why attention to them is essential.
-13-
Instructors could use tools that enable them to evaluate students' affective constructs prior to,
during, or after instruction and could structure instruction and course work to maximize them.
Student learning could be improved if validated interventions could be used that targeted affective
factors that might otherwise impede the attainment of important learning outcomes.
Measurement/Assessment Needs
Although a variety of surveys assess students’ attitudes toward statistics (see Nolan, Beran, &
Hecker, 2012, and Ramirez, Schau, and Emmioğlu, 2012), we need instruments to measure other
affective constructs and to measure attitudes using other measurement approaches. These could be
entirely new instruments dedicated to affective constructs within the context of statistics, existing
instruments that measure these affective constructs more generally, or statistics-specific add-ons to
existing measures. In addition to instruments measuring affective constructs on the student level,
instruments specific to teacher’s affective constructs are needed. Finally, given that many of these
constructs are multidimensional, we may need multiple measures--for students and teachers--of the
same construct.
Measuring affective constructs presents a number of interesting research challenges including those
often associated with self-reported Likert-type agreement scales. First, they may only measure a
student's perception of the construct; this is important to measure also, but may not be an objective
measure of the underlying construct. Second, a student's perspective or understanding of the scale
may change (e.g., a student may feel differently about what it means to "strongly agree" at the end
of a course than at the beginning). Thus, a student’s rating may change even though the underlying
construct we are trying to measure may not have. In June 2009, a working group met at the
Statistical and Applied Mathematical Sciences Institute (SAMSI) to discuss this very issue; readers
are referred to the white paper from this meeting for more information on this topic (Swartz et al.,
2011).
-14-
3. Curriculum
“The need for curricular resources in statistics is acute, arguably more acute (at the college level) than in any other subject. The reason: Of all subjects taught as often as statistics, surely no other subject is so often taught by faculty with so little formal training in the subject.” (Cobb, 1993)
Introduction
In this section we discuss the need for research on curriculum and its effects on student outcomes.
The term curriculum may have different meanings in different contexts (Clements, 2007, Stein,
Remillard & Smith, 2007). For the purposes of this document, curriculum is defined broadly as
incorporating the content that is taught, the sequencing of the content, the statistical approach to the
content (e.g. Bayesian versus frequentist) as well as the approach to learning that underlies the
delivery of the content (e.g. inquiry-based versus activity-based learning). In keeping with the
theme of this document we will focus on the curriculum for undergraduate statistics at the
introductory level.
Brief Literature Review
Over the last two decades researchers within the statistics education community have recommended
reforming statistics courses to help students develop statistical thinking, reasoning, and literacy
skills (rather than just the mastery of skills, procedures, and computations), to use real data and to
foster active learning in the classroom. (Ben-Zvi & Garfield, 2004, Cobb, 1992, GAISE). There
have been calls to offer a larger variety of introductory courses targeted to specific client disciplines
and student majors (Zetterqvist, 2010), which are contradicted by arguments to offer fewer varieties
of the same course (Rossman, 2007). While work has begun in assessing student outcomes
associated with the use of randomization based curricula (e.g. Holcomb, Chance, Rossman, Tietjen,
& Cobb, 2010; Holcomb, Chance, Rossman, & Cobb, 2010; Tintle, VanderStoep, Holmes,
Quisenberry, & Swanson, 2011), the arguments about large scale curricular change are mostly
theoretical in nature and future research is needed to explore them empirically.
There are a few small scale empirical studies in the literature that inform curricular issues in first
courses of statistics, such as the effect of a project-based course (e.g., Meletiou, Lee and Meyers,
1999; Meletiou-Mavrotheris and Lee, 2002), different sequencing of topics (e.g., Zieffler and
Garfield, 2008), and the use of a Bayesian approach (e.g, Diaz,&Batanero, 2009). Some of these
studies find small-to-moderate positive outcomes but none have impacted the curriculum nationally
-15-
despite the recommendations and implications offered. Some studies not focused on curriculum
offer practical implications for curriculum writers, such as Kaplan, Rogness and Fisher (2011) who
make an empirical argument for textbook authors of books designed for the first course in statistics
to reduce the use of the word spread when introducing the concept of variability and, instead, rely
on the word variability itself.
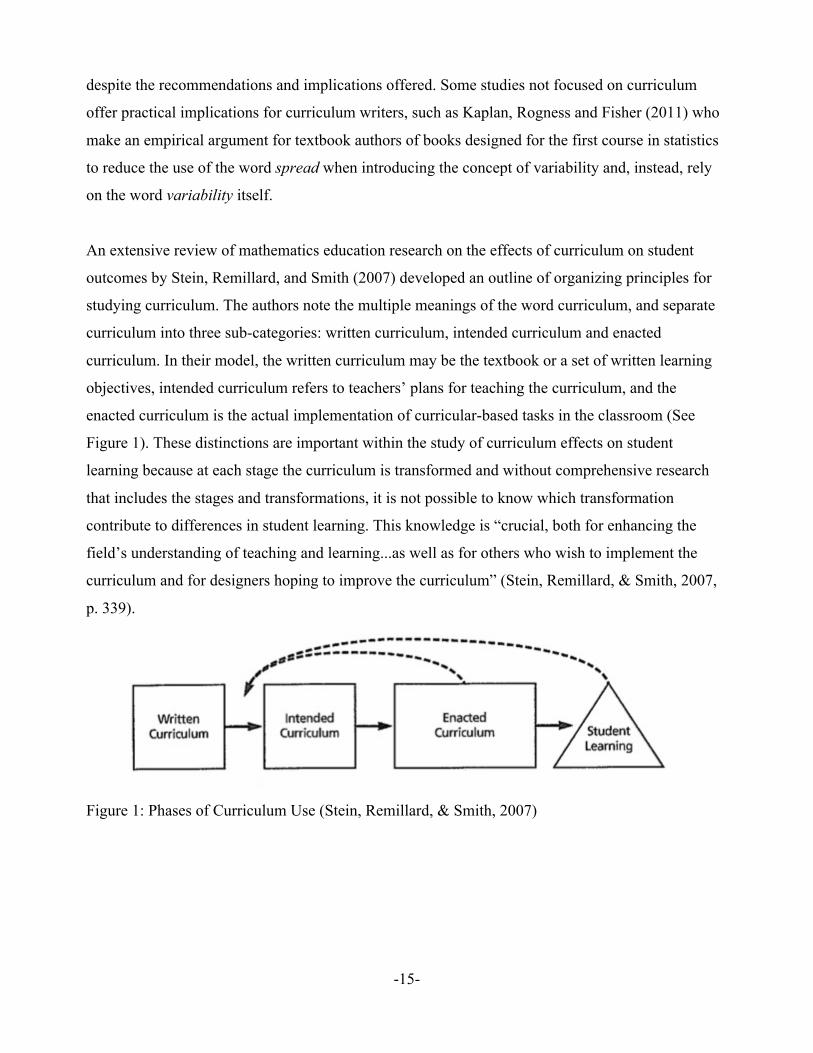
An extensive review of mathematics education research on the effects of curriculum on student
outcomes by Stein, Remillard, and Smith (2007) developed an outline of organizing principles for
studying curriculum. The authors note the multiple meanings of the word curriculum, and separate
curriculum into three sub-categories: written curriculum, intended curriculum and enacted
curriculum. In their model, the written curriculum may be the textbook or a set of written learning
objectives, intended curriculum refers to teachers’ plans for teaching the curriculum, and the
enacted curriculum is the actual implementation of curricular-based tasks in the classroom (See
Figure 1). These distinctions are important within the study of curriculum effects on student
learning because at each stage the curriculum is transformed and without comprehensive research
that includes the stages and transformations, it is not possible to know which transformation
contribute to differences in student learning. This knowledge is “crucial, both for enhancing the
field’s understanding of teaching and learning...as well as for others who wish to implement the
curriculum and for designers hoping to improve the curriculum” (Stein, Remillard, & Smith, 2007,
p. 339).
Figure 1: Phases of Curriculum Use (Stein, Remillard, & Smith, 2007)
-16-
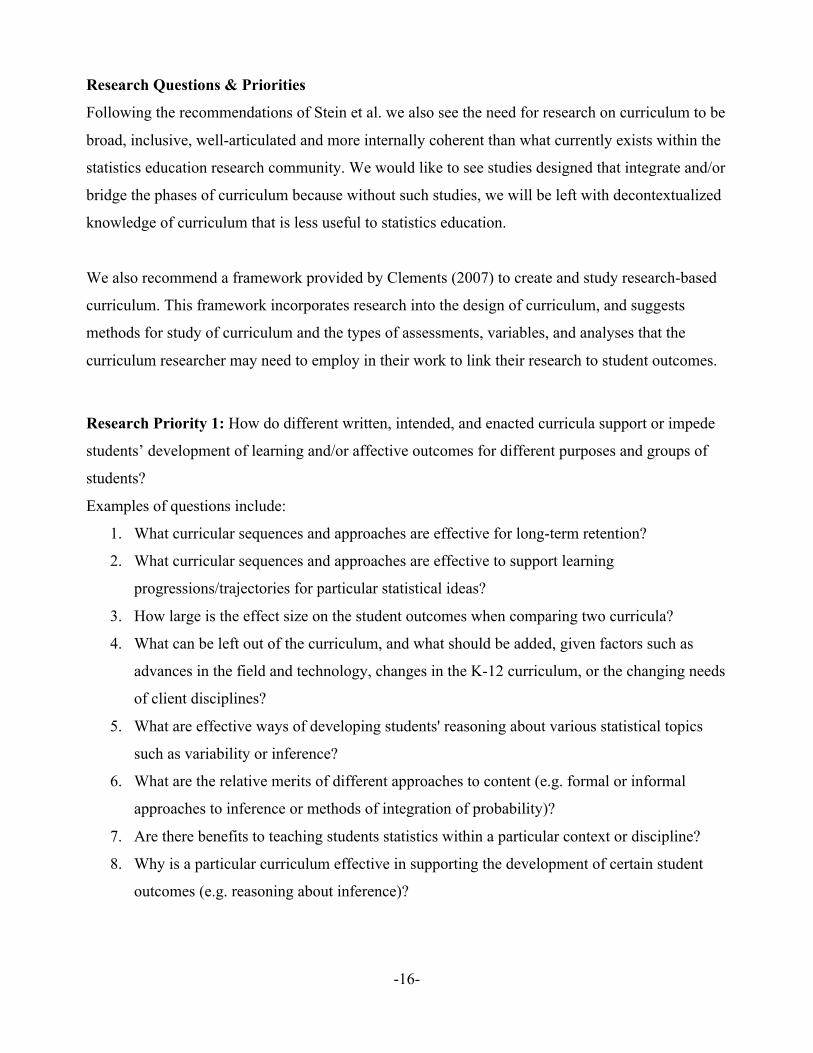
Research Questions & Priorities
Following the recommendations of Stein et al. we also see the need for research on curriculum to be
broad, inclusive, well-articulated and more internally coherent than what currently exists within the
statistics education research community. We would like to see studies designed that integrate and/or
bridge the phases of curriculum because without such studies, we will be left with decontextualized
knowledge of curriculum that is less useful to statistics education.
We also recommend a framework provided by Clements (2007) to create and study research-based
curriculum. This framework incorporates research into the design of curriculum, and suggests
methods for study of curriculum and the types of assessments, variables, and analyses that the
curriculum researcher may need to employ in their work to link their research to student outcomes.
Research Priority 1: How do different written, intended, and enacted curricula support or impede
students’ development of learning and/or affective outcomes for different purposes and groups of
students?
Examples of questions include:
1. What curricular sequences and approaches are effective for long-term retention?
2. What curricular sequences and approaches are effective to support learning
progressions/trajectories for particular statistical ideas?
3. How large is the effect size on the student outcomes when comparing two curricula?
4. What can be left out of the curriculum, and what should be added, given factors such as
advances in the field and technology, changes in the K-12 curriculum, or the changing needs
of client disciplines?
5. What are effective ways of developing students' reasoning about various statistical topics
such as variability or inference?
6. What are the relative merits of different approaches to content (e.g. formal or informal
approaches to inference or methods of integration of probability)?
7. Are there benefits to teaching students statistics within a particular context or discipline?
8. Why is a particular curriculum effective in supporting the development of certain student
outcomes (e.g. reasoning about inference)?
-17-
Research Priority 2: What conditions support or impede students’ cognitive and/or affective
outcomes development?
Examples of questions include:
1. Under what conditions (e.g. class size, student demographic) is the curriculum most
effective and why?
2. What are good methods for evaluating the effect of a curriculum on student outcomes, or
comparing curricula?
3. What is the impact of implementation fidelity on the effect of a curriculum? What are good
methods for determining this impact?
4. What are good methods (e.g. teaching experiments) for developing high quality, research-
based curricula?
5. Which enactments of the curriculum produce better long-term results (e.g. higher attainment
in future courses or higher self-efficacy)?
If we knew the answers to these questions, then:
● Instructors would know the impact of different components and sequencing on long-term
retention for students of different levels and backgrounds and from different client
disciplines, helping them to make decisions in the intended curriculum.
● Instructors would be able to make informed decisions in choosing curricula and textbooks
for their courses from the available set of written curricula.
● Instructors would have a guide to the best way to change the written college level curricula
over time to best incorporate changes in K-12 curricula and plan for changes in the field and
client disciplines.
● Instructors would know ideal options for including probability within statistics in the
intended and enacted curriculum. For instance, this might include new ways of teaching
probability such as through simulation rather than relying upon formal rules/formulas.
● Statistics education researchers would have a base of working knowledge from which to
evaluate potential curricular changes based upon changes in the K-12 curriculum, the field
of statistics, and evolving needs of client disciplines that accounts for transformations and
transitions between the phases of curriculum.
● Statistics departments would have a research base from which to discuss curricular decisions
with client disciplines.
-18-
● Client disciplines could understand whether their students would have access to statistics
curricula designed to meet the needs and goals of the discipline.
● Client disciplines could more objectively evaluate the benefits of teaching discipline-
specific statistics courses versus using those resources for teaching non-statistical
disciplinary courses or for research.*
● Students would benefit from access to courses tailored to their needs for long term retention
of appropriate statistical content.
● Textbook authors would have guidelines for choosing content, examples, approaches and
sequencing for their textbook and classroom material development.
Measurement/Assessment Needs
Stein, Remillard and Smith (2007) suggest appropriate measures to study each phase of curriculum-
- written, intended and enacted--as well as measures for assessing student learning outcomes.
Written curriculum can be measured based on what content is covered, how the content is
presented, including order, balance and organization, and what type of support the materials contain
for teacher implementation. When studying the transformation from written to intended curriculum,
the authors suggest that researchers collect data about the decisions teachers make in terms of
content coverage and how to implement lessons and supporting material as well as their
philosophies and conceptualizations of curriculum use. They further advocate that enactment of
curriculum be measured through the observations of instructional practice and not by self-report.
_________________ *modified 12/21/2012
-19-
4. Teaching Practice
“Shorn of all subtlety and led naked out of the protective fold of educational research literature, there comes a sheepish little fact: lectures don’t work nearly as well as many of us would like to think.” (Cobb, 1992)
Introduction
Sound pedagogy aims to engage students and ensure their success in learning. The Guidelines for
Assessment and Instruction in Statistics Education (GAISE; Aliaga et al., 2005) set forth guidelines
describing desirable teaching practices:
• Emphasize statistical literacy and develop statistical thinking
• Use real data
• Stress conceptual understanding rather than mere knowledge of procedures
• Foster active learning in the classroom
• Use technology for developing concepts and analyzing data
• Use assessments to improve and evaluate student learning
Effective, portable models for implementing these recommendations can be a challenge to construct
due to a variety of factors, such as: differences in class size, availability of technology, student
backgrounds, instructor backgrounds, and variability in the delivery of course content (e.g., face-to-
face versus online components). Nonetheless, the GAISE recommendations remain relevant in the
face of these challenges.
Brief Literature Review
There have been many studies done that compare one method of teaching to another, often using a
“traditional” course as a control group. Zieffler et al. (2008) critique many of these studies because
they typically do not provide results that can generalize to other studies, due to confounding factors
and lack of standard assessment instruments. An exception is a recent article in Science, which
makes a compelling argument for use of active learning methods in Physics compared to lecture
(Deslauriers, Schelew, and Wieman, 2011), provides a robust model for similar research in statistics
education.
One increasingly common teaching strategy, recommended in the GAISE framework, is to teach
with real data. Research indicates that doing so is a complex endeavor. At times, students'
knowledge of the context for data enriches their analysis, and at other times it interferes. For
-20-
example, Langrall, Nisbet, Mooney, & Jansem (2010) found that while students used appropriate
context knowledge to gain insights and enhance their understanding of a task, identify useful data
for a task, explain data, and justify claims, they also tended to include irrelevant information.
Similarly, Pfannkuch (2010) found that, while context assisted learners in finding meaningful
patterns in data, it could also distract students from learning new concepts or using new ideas.
Teaching with real data is an important technique for connecting statistics done in the classroom to
professional practice, but instructors need to monitor how students' background knowledge may
impede or facilitate their learning and provide scaffolding as necessary.
Another tenet of the GAISE framework, supported by research, is the idea that active engagement
supports learning. Active engagement can take many forms. For instance, there is evidence that
activity-based simulations promote students understanding of statistical concepts such as sampling,
sampling variability and sampling distributions (Saldanha, 2003; Shaughnessy, 2007; Shaughnessy,
Watson, Moritz & Reading, 1999). Studies of using cooperative learning to teach statistics have
provided positive results of higher test and course grades (Giraud, 1997; Keeler & Steinhorst, 1995;
Magel, 1998). Model eliciting activities (MEAs) have recently been shown to be effective for
catalyzing group discourse during cooperative learning. An MEA is a task that requires students to
go beyond producing a correct or incorrect response. Instead, they must form viable quantitative
models for making sense of phenomena (Lesh, Hoover, Hole, Kelly, & Post, 2000). In one study,
Hjalmarson, Moore, and delMas (2011) found that an MEA led undergraduates to design a
sampling plan, statistical measures, and an overall model for making sense of a statistical problem.
Such studies of active engagement in statistics provide strong empirical evidence that it is essential
to classrooms that promote learning.
Technological tools have been used profitably to engage students and foster rich statistical
understanding. Many such tools are discussed in the technology section of this report. In addition to
the technological tools described in that section, online learning environments continue to
transform the landscape of teaching practice. Some statistics courses are offered completely online
and others are hybrid courses with occasional face-to-face meetings. Even courses consisting
mainly of face-to-face meetings are often enhanced with course websites, discussion boards, and
chats. Available research is somewhat mixed in its conclusions about online learning. For instance,
while Suanpang, Petocz, and Kalceff (2004) found that students in an online statistics course
-21-
developed more favorable attitudes toward statistics, Summers, Waigandt, and Whittaker (2005)
found students in an online statistics course were less satisfied overall with the learning experience.
Everson and Garfield (2008) reported that online environments could make personal interactions
with students more difficult but enable instructors to gather more detailed information about
students' thinking when all are required to write comments in online discussions. As online
environments continue to develop, the nature of effective teaching practices associated with them
should come into sharper relief.
Research Questions & Priorities
The focus of research in this area should be those things that drive student outcomes, including the
formative assessment needed to optimize instructional practices.
Research Priority 1: What are effective instructional approaches for developing or improving
particular learning outcomes (e.g., statistical literacy, statistical thinking, conceptual understanding,
informal inferential reasoning)?
Examples of questions include:
1. What types of effects does using real data for instruction and assessment have on students'
statistical literacy?
2. What are essential characteristics of data that support developing learning outcomes?
3. Does the use of real, realistic, simulated, or fabricated data produce different learning
outcomes?
4. What are the essential characteristics of active learning instruction that support the
development of statistical literacy and thinking in students?
5. What are effective instructional approaches for engaging students and supporting the
learning of statistics in online environments?
Research Priority 2: What are effective methods for teachers to use to assess students’ progress
toward desired learning outcomes in the classroom?
Examples of questions include:
1. Which assessment methods can be used to provide accurate accounts of students' statistical
knowledge and thinking?
-22-
2. What types of assessment items (e.g., forced-choice, constructed response) are useful for
measuring important learning outcomes such as statistical thinking and students'
understanding of statistical inference?
3. What types of feedback are most effective in supporting statistical learning or correcting
students' misunderstandings and misconceptions?
4. How can teachers make use of assessment information to improve their instructional
practices?
If we knew the answers to these questions, then:
• Instructors would have tools to more accurately assess the impact of their instruction on
students’ learning.
• Students would receive more helpful feedback on their progress in learning.
• Instructors could better use the knowledge gained from classroom assessment to improve
and be more confident in the appropriate selection of instructional practices.
• Teacher educators could better prepare instructors of statistics
• Researchers could better evaluate instructional practices.
• Students would have better opportunities to attain targeted learning outcomes and be better
prepared for their professions.
Measurement/Assessment Needs
Statistics education instructors can gather formative assessment information from sources such as
student projects, portfolios, responses to carefully constructed multiple choice items, and students'
conversations with one another during cooperative learning (Gal & Garfield, 1997). Technological
tools such as online discussions (Groth, 2007) and classroom response systems (McGowan &
Vaughan, in press) can help automate the process of gathering student data and providing feedback.
In general, formative assessments are needed to determine the extent to which any given teaching
strategy attains its intended goals.
To address the research priorities identified above, it would be helpful to have models to assess the
effectiveness of teaching practices in terms of their impact on students’ learning. Tools that could
contribute to the construction of such models include classroom observation protocols, criteria for
assessing the quality of online environments, logs of teaching practice, surveys of instructional

-23-
practices, criteria for describing the quality of online and face-to-face classroom discourse,
quantitative measures of students’ cognitive and affective learning outcomes, and qualitative
problem-solving interview protocols to assess students’ learning after participating in classrooms
with different teaching and assessment practices.
-24-
5. Professional Development of Instructors of Statistics
“...good teachers of statistics need to be developed, as opposed to being trained.” (Garfield & Everson, 2009)
Introduction
There has been a large increase in the number of students taking an introductory statistics course in
college and high school (Kirkman, 2010). Many colleges and majors require an introductory
statistics course as part of their curriculum at the undergraduate and graduate level, and the
Advanced Placement Statistics course is one of the fast growing AP courses offered in high schools.
Thus, there are many more college faculty in a variety of departments, graduate teaching assistants,
and high school teachers that are teaching introductory level statistical concepts. These instructors
of statistics have varied backgrounds and understandings in statistical content (e.g., Noll, 2007;
Stohl, 2005) and pedagogical experiences and have varied affective aspects that may impact their
dispositions as an instructor.
Brief Literature Review
Instructors of statistics need a strong understanding of statistics that includes knowledge of the field
in general, abilities to engage in statistical thinking, appropriate and broad skills in statistical
analyses, and productive statistical dispositions (e.g., curiosity, need for data to build arguments,
persistence, relevance of context). While a strong foundation in statistical knowledge, skills, and
dispositions is essential, it is not sufficient for the knowledge needed for teaching statistics (Groth,
2007). Instructors of statistics also need a specialized knowledge of the conceptual underpinnings of
statistical content that can be used specifically in pedagogical contexts. In addition, there is the need
to have specialized pedagogical statistical knowledge, skills, and dispositions (Lee & Hollebrands,
2008, 2011) that can help an instructor make decisions such as: choosing curriculum, designing and
setting up tasks in a classroom, addressing issues related to lexical ambiguity of terms used (e.g.,
spread, random; Kaplan et al., 2009, 2010, 2011), considering the role of context in students’ sense
making of data, and fostering a classroom environment that requires and supports students’ data-
based argumentation. It is not hard to imagine how these knowledge skills and dispositions [KSDs]
can vary across instructors and greatly influence teaching practices and ultimately students’
learning.
-25-
The overarching goal of professional development (PD) for instructors of statistics is to facilitate
growth in their KSDs, but there are many models for and forms of PD that will meet this goal.
Professional development can certainly be an individual pursuit where an instructor is actively
seeking out and engaging in learning about issues they have self-identified as important for their
professional growth. Professional development that engages instructors as a community, however,
has more potential for widespread capacity building in the teaching of statistics. In order to provide
instructors of statistics with opportunities to engage in on-going discussions within professional
communities, special attention needs to be paid to building such a community. Communities of this
type are often referred to as communities of practice or inquiry, which is defined as “a group of
people informally bound together by shared expertise and passion for joint enterprise” (Wenger &
Snyder, 2000, p.139). In this case the expertise being developed and passion is for teaching
statistics. Several researchers (Wenger & Snyder, 2000; Garfield & Everson, 2009) have found that
these communities can meet face-to-face or even electronically (synchronous or asynchronous).
However, they and others emphasize that purposeful and sustained dialogue among instructors is
crucial so that faculty can ask questions, exchange ideas, and learn from each other (e.g., Rumsey,
1998; Garnham & Kaleta, 2002). This sort of sustained dialogue could occur in the form of a group
of statistics instructors having weekly dialogue about planning, assessment, and student engagement
(e.g., Rumsey, 1998), or a more focused form such as a lesson study that incorporates collaborative
lesson planning with purposeful classroom observations, reflection, analysis and revision of the
lessons (Fernandez, 2002).
Within statistics, several groups report personal growth and benefits from focusing on the
development and refinement of a single lesson, opening their classrooms for collaborative non-
threatening observations, and committing to and learning from a small dedicated community of
instructors as learners and inquiries into practice and students’ thinking (Garfield, delMas, &
Chance, 2005; Roback, Chance, Legler, & Moore, 2006). Using tasks situated in routine teaching
practices (e.g., analyzing students’ solutions) can develop content knowledge needed specifically
for teaching (Suzuka et al., 2009). The use of video is one possible way to engage instructors in
examining students’ work and classroom practice. Video makes it possible to recast the teacher as
an “observer” rather than “actor.” This recasting has been shown to help instructors focus on
particular pedagogical activities and students’ thinking rather than attend to all situations that arise
in classrooms and specific teacher actions (Sherin & van Es, 2005; van Es & Sherin, 2002).
-26-
Research provides support for key features of effective PD for instructors at all levels (e.g., ;
Darling-Hammond, 2009; Garet, Porter, Desimone, Birman & Yoon, 2001; Garfield & Everson,
2009; Moore, 2005; Roback, Chance, Legler, & Moore, 2006; Rumsey, 1998; Thus, research
suggests that PD for instructors of statistics should:
• Broaden and deepen instructors’ understandings of the statistical content they are teaching,
particularly using activity-oriented statistical tasks of the type being promoted for use in
courses;
• Strengthen instructors’ pedagogical skills specific to statistics;
• Provide opportunities to understand how students learn and differences in student statistical
reasoning and thinking, perhaps using artifacts of students work in the form of written work,
responses to assessment items, or video of small group work;
• Be connected to the practice of teaching (i.e. lesson planning, assessment, implementation of
tasks);
• Include discussions about important research and philosophical debates within the statistics
education community
• Provide access to and opportunities to evaluate and consider a variety of resources for
teaching statistics (e.g., online applets, archived webinars, tasks, etc); and
• Engage teachers in on-going discussions within professional communities
There is much room for increasing the research on the effectiveness of such forms of professional
development on instructors KSDs, their teaching practices and their students’ learning. While many
forms of PD may be happening within statistics education, there is a lack of research evidence on
the most effective forms and content barriers to engaging in PD might be related to academic
climate and administrative support.
Research Questions & Priorities
We need research to provide some answers to the question of which KSDs are necessary to teach
introductory statistics effectively and then develop PD to help teachers attain them. However, a
more realistic approach would likely be to look at existing PD programs, investigate the kinds of
KSD they develop, and then examine the extent to which they impact teachers' classroom practices
and students' learning. Data from the classroom could then inform the further refinement of the PD
-27-
programs. As PD programs are refined, they can be re-tested for their effect on the classroom (and
the loop continues...).
Research should leverage existing research and models of PD for K-12 and for higher education
faculty development. The approach used by Deborah Ball and colleagues to develop measures of
Mathematical Knowledge for Teaching (Hill, Schilling & Ball, 2004) provides a promising
framework for developing measures of Statistical Knowledge for Teaching. Methodology used to
study teachers' statistical knowledge (Groth & Bergner, 2005), statistical knowledge for teaching
(Groth, 2007) and knowledge for teaching statistics with technology (Wilson, Lee, & Hollebrands,
2011) can be utilized, adapted and extended.
Research Priority 1: What do teachers of statistics need to know with respect to statistical content
and how students learn statistical concepts and develop statistical thinking?
Examples of questions include:
1. How do particular factors (i.e., type of course, size, age of students, student background,
teacher knowledge, content delivery mode) affect teachers’ ability to deliver or adapt
effective pedagogical methods?
2. How does teachers' knowledge of effective ways to use technology for instruction affect
student outcomes?
3. What are effective methods for changing teachers' assessment practices or increasing their
knowledge of effective assessment practices?
Research Priority 2: What models of professional development (including methods, resources, and
tools) are most effective at impacting instructor knowledge, skills, and disposition (KSD) linked to
changing classroom practices and improved student outcomes in statistics?
Examples of questions include:
1. How do current methods of PD for statistics instructors (e.g, CAUSE webinars, workshops,
and faculty interest communities) impact KSD and student outcomes?
2. How effective are TA preparation programs in developing competent teachers of statistics?
3. What teacher development resources are effective in helping teachers of statistics develop
KSD?
-28-
4. What aspects of a short intervention would be most effective in optimizing KSDs? What
KSD should be targeted in a short professional development?
Research Priority 3: What factors contribute to instructors’ participation in and use of PD?
Examples of questions include:
1. What motivates teachers/faculty to engage in teacher development efforts?
2. What barriers exist to engaging in and participating in these efforts?
3. How do professional communities afford and constrain a teachers' PD, including their
attitudes, practices, sustained efforts, students' learning, etc.?
4. What communication/outreach efforts can help teachers of statistics become better
informed/prepared?
If we knew the answers to these questions, then:
• Departments and institutions would have the information needed to design effective courses
for teaching college-level introductory statistics across a variety of educational settings.
• Professional organizations would be able to tailor PD efforts to their clientele in a manner
that encourages participation and optimizes the likelihood that the knowledge of effective
practices acquired will find its way into the classroom.
Measurement/Assessment Needs
A challenge in assessing PD of teachers is to tease apart the complex relationship between teachers’
beliefs about teaching and learning and their actual teaching and assessment practices, which may
be constrained by additional factors such as institutional facilities and policies. The Statistics
Teaching Inventory (STI), which has scales for both practice and beliefs, was developed, piloted,
validated and modified as part of two NSF-funded grants to measure the beliefs and self-reported
teaching practice of teachers of introductory statistics ( see Zieffler et at. 2012) . Needed now are
modular supplements to extend this work to address online and hybrid learning environments and to
examine behavior of the instrument in a large sample of national data. Other instruments exist that
measure more generic characteristics, beliefs, and attributes of teachers (see the
Measurement/Assessment section below). While the STI has been used in a pre-post format to
assess change, there is a need for additional instruments that can be used to assess the impact of PD
experiences and other aspects of PD such as teacher knowledge and pedagogical content

-29-
knowledge. Overall, we need validated longitudinal models relating the particular KSDs targeted by
PD activities and the resulting teacher practices displayed. In addition instruments and tools are
needed that gather direct measures of the KSDs at hand over time, possibly as add-ons to existing
measures found in other higher education settings. These models, instruments and tools should then
be implemented in conjunction with assessment advancements in measuring teacher practices and
student outcomes described in previous sections.
-30-
6. Technology
“It is hard to imagine teaching statistics today without using some form of technology. However, just 20 years ago that was very common” (Garfield & Ben-Zvi, 2008).
Introduction
The technology revolution has had a great impact on the teaching of statistics, perhaps more so than
many other disciplines. This is not surprising given that technology has changed the way
statisticians work, and has therefore been changing what and how we teach. Statistics classes may
be taught in a classroom outfitted with a computer projected onto a screen, or may take place in a
setting with students working at their own or shared computers. Students commonly own a
calculator more powerful than the computers of 20 years ago and are agile users of portable
computing devices such as laptops, smartphones, and tablets. Teachers of statistics may offer a
Web-based course using video-recorded lectures, online applets, statistical analysis tools, interactive
on-line discussions, collaborative projects, or electronic text materials. Teachers have access to
wide ranging resource collections (such as those at www.CAUSEweb.org) and may provide course
specific resource collections directly to their students. Teachers also have access to a plethora of
statistical software packages (e.g., SAS, Minitab, SPSS, R), multimedia materials such as podcasts,
and educational statistical technologies that assist with dynamic visualization of data (e.g.,
Fathom®, TinkerPlotsTM, DataDesk, JMP). For example, in Fathom®, as data are randomly
generated, graphs can be simultaneously “building” so that variability in a distribution can be
analyzed as sample size increases. Further, dynamic visualization tools allow users to link
representations that afford, for example, the ability to drag data points within a graph (e.g.,
scatterplot) and notice an effect on other representations (table of data, residual plot), as well as
statistical measures (e.g., correlation) and models (e.g. least squares line).
Brief Literature Review
We are going to frame our discussion on technology use in learning statistics using the work of Pea
(1987) and Ben-Zvi (2000). According to Pea, technology tools are typically used in two different
ways: to amplify our abilities to solve problems or to reorganize the way we think about problems
and their solutions. Many technology tools (e.g., SAS, Minitab, Fathom®, spreadsheets, graphing
calculators) can be used to automate activities such as quickly organizing data, generating lists of
pseudorandom numbers, computing measures, applying statistical tests, and generating graphs. By
automating the tasks of computing or generating graphs, technology affords an opportunity to focus
-31-
on conceptual understanding, rather than processes needed for large computations and graph
production. However, when software has dynamic linking capability among data representations
and/or input parameters for models, the potential for such tools to enhance students’ conceptual
understanding and statistical reasoning and thinking is increased.
Ben-Zvi (2000) and Chance et al. (2007) illustrated several ways that tools could be used to
reorganize ones’ conceptions of statistical ideas, including visualizations, simulations, use of large
messy data sets, and collaborative tools. Others (e.g., Bakker, 2002) specify two different types of
tools that have potential for reorganizing students’ understanding: route-type and landscape-type.
Route-type tools are typically narrow in scope for visualizing specific statistical ideas (e.g., online
applet for visualizing the central limit theorem), while a landscape-type software (e.g., Fathom)
contain several objects that can be used together to represent data, build models, run simulations,
etc.
Despite the variety and number of available technology tools, there is little research on optimal
ways to use tools to improve student learning. The most careful and thoughtful research on
technology use has examined students at the primary and secondary levels (e.g., see studies by
Konold & Kozlak, 2008 Lee et. Al, 2010, Pratt et . al, 2008 ). At the college level, approaches to
study the impact of technology on student learning have been more simplistic comparisons such as a
class using technology compared to a “traditional” class (for a review see Zieffler et al., 2007).
Research studies need to account for the caveat that merely demonstrating abstract concepts with
tools or even having students explore a concept with a tool does not necessarily lead to improved
understanding. What students learn from using technology depends on the ways in which they are
able to interact with a tool (e.g., whole group visualization, individual manipulation, small group
work), the nature of questions and tasks in which they are engaged (e.g., step-by-step tasks, open-
ended explorations), and the scaffolding provided for use of the tool.
Under particular conditions certain tools have been shown to promote statistical thinking, especially
in developing students’ abilities to engage in informal inference (Pratt et al., 2008; Lee, Angotti, &
Tarr, 2010; Konold & Kazak, 2008) or using alternative ways of doing formal inference such as
randomization tests. Studies have also examined the use of technology to promote student reasoning
about particular concepts, particularly distribution (Konold, Harradine, and Kazak, 2007), center,

-32-
variability, outliers, random sample, random assignment (Chance, delMas & Garfield, 2004) and
standard deviation (delMas & Liu, 2005). Konold and Kazak (2008) found that use of these tools
can reveal aspects of students reasoning that we did not have access to before.
Studies comparing types and uses of technology tools have found some difference in student
outcomes but rarely can generalize to other situations as they examine specific outcomes for a
course and general levels of success in a course, as often measured by grades on final exams.
Another type of study has looked at the use of a particular computerized cognitive tool in
developing students’ statistical reasoning and thinking (e.g, Meyer & Lovett, 2002) and has found
positive results.
Research Questions & Priorities
Despite the variety and number of technology tools, there is little research on optimal ways to use
tools to improve student learning. As Hammerman and Rubin (2004) point out, using any new tool
necessitates changes in the content and pedagogy of statistics instruction and in many cases teachers
are unprepared for these changes, and there is a lack of research to inform their efforts.
While online courses are increasingly being offered as a way to teach students statistics, a useful
distinction can be made between courses that use technology primarily as a way to deliver
instruction online and other uses of technology designed to facilitate or improve learning. (See
section on teaching practice for a discussion of research questions related to online learning).
We recognize that technology changes rapidly so that by the time we explore and optimize a
particular technology it will likely be obsolete. Thus, we need to be forward thinking in what
technology might be able to do in the future and not limit our focus to existing tools.
In general, we think research should focus on the impact of technology on how to promote student
learning and the first research priority is then focused on cognitive learning outcomes. However, we
also think it is important to learn more about the effect of technology on affective constructs, the
second research priority area. The impact of technology on curriculum, and the challenges
technology presents for teaching practice and teacher development form additional research
priorities. The final area is the study of student assessment in light of technology use in teaching
statistics. We acknowledge that using technologies can lead to new problems as well as advantages,
so each of the research priorities includes questions addressing such drawbacks
-33-
Research priority 1 (Cognitive Outcomes): What characteristics of tools are needed to promote
student learning outcomes and what is the best way for a technology tool to be used to help students
think statistically? When students have access to good and appropriate technology tools, how can
that impact their ability to understand and reason about statistical ideas and to solve statistical
problems?
Examples of questions include:
1. How does a tool that offers flexible and changeable representations of data promote student
understanding of a particular concept?
2. How does a tool provide student insights into data that help them better understand
statistical ideas or relationships?
3. How can scaffolding be used with a modeling tool to help students model statistical
problems in a way that promotes their statistical thinking?
4. How do students think differently about a virtual object than a physical object or a modeling
process vs. a physical process, and does that affect their learning outcomes?
5. Does the use of particular technology tools affect the transfer of statistical content
knowledge to various applied domains?
6. To what extent does students’ use of a technology tool become integral to their way of
thinking about a statistical problem (Lee & Hollebrands, 2011)?
7. How important is it for students to develop technological statistical knowledge by using a
professional software tool (e.g., R or SAS) in order to have a broader sense of how such
software can be integral to solving problems in their later professional careers?
8. What new misconceptions arise when using technology tools and how to best deal with
these to promote student learning (e.g. sample size vs. number of samples).
9. How do certain uses of technology (e.g, pure automation of calculations by following
routine procedures to point and click only) affect student learning? Does using powerful
tools promote a black box conception of statistical procedures?
Research Priority 2 (Affective Constructs): What is the impact of technology use on Affective
constructs such as student attitudes, beliefs, motivation, anxiety, and interest in statistics?
Examples of questions include:
-34-
1. How do students’ perceptions of the value and quality or ease of use of a technology tool
impact their willingness to use it and their belief that it will help them better learn and do
statistics?
2. How does students’ self efficacy regarding use of technology tools affect their perceptions
of being a user and doer of statistics?
3. How does the use of particular technology tools affect students’ attitudes towards statistics,
their anxiety, and their motivation to learn statistics?
4. What aspects or characteristics of technology help to engage and motivate students in
learning statistics?
Research priority 3 (Curriculum): Technology allows us to do sophisticated things in informal
ways without traditional prerequisites. It allows us to access and work with large and messy data
sets with unique formats and sampling characteristics. The demands of learning new technology
tools raise questions about the balance of learning a tool and learning content, in light of tools that
are thought to promote instrumental genesis, so students learn to think with the tools.
Examples of questions include:
1. How does the effect of technology on the discipline of statistics change the content of the
introductory course?
2. What are some good models that balance learning to use tools and learning content that lead
to desired learning outcomes?
3. How does the goal of producing statistically literate citizens change the curriculum in light
of new types of data and sources of data brought on by technological advances (Gould,
2010)?
4. How do methods of data collection taught change in light of current types of data and ways
to access and sample them using technology?
5. How does technology change the ways we analyze and display data in terms of what is
taught in the introductory course?
6. How can new uses of technology remove barriers to curricular foundations we thought were
essential (e.g., teaching inference from day one without all of the prerequisite distributional
foundations traditionally used)?
7. Can technology help develop a link between topics or a more holistic approach to
data/problem solving (sequence, ordering and coherence)?
-35-
Research Priority 4 (Teaching Practice): How does technology affect teaching practice?
Teaching with technology can take many forms, and using technology can change pedagogy in
many ways.
Examples of questions include:
1. What are good models for using technology-based learning tools effectively in large classes
to promote student learning goals?
2. What are effective ways to provide guidance and scaffolding for students as they learn to use
technology tools and what are models for decreasing these guides so students can become
more independent users of software tools?
3. How can pedagogical decisions (such as how much time to spend on a topic or concept) be
informed by the use of particular technology tools?
4. What are good ways to deal with the unique challenges of using technology such as the
importance of teachers being able to think on their feet when simulations do not go
according to plan, or finding ways for students to work together on problems or activities
requiring technology?
5. What are optimal uses of a particular tool or a combination of types of tools in a particular
activity or course?
6. What are effective ways to deal with constraints by the types of technology available or the
need for students to learn particular tools for their major or for subsequent courses?
Research Priority 5 (Teacher Development): One major challenge of technology is preparing
teachers to use tools and understand the “hows and whys” of using these tools in their courses. As
technology changes, and new tools and data sources become available, it is important for teachers to
be open to changes in their courses that utilize these new tools and data sources.
Examples of questions include:
1. What is the impact of learning to use particular tools on teacher’s knowledge of and
understanding of statistics?
2. What is the impact of the technology on changing teachers’ perceptions of what statistics is,
and how can it help improve their understanding of current practices in statistics?
-36-
3. How does the use of technology tools in class affect teachers’ feeling of expertise and
proficiency in teaching statistics?
4. How can teachers’ pedagogical content knowledge be developed regarding how to use
particular tools to promote student learning?
5. How can we motivate teachers to engage in learning new tools or new ways to use tools to
promote student learning?
6. What is the impact of teacher knowledge and beliefs about technology use on their effective
use of tools and on student learning?
Research Priority 6: What is the impact of technology on Student Assessment? There are many
questions about teaching and assessing student learning that need to be addressed with research
studies.
Examples of questions include:
1. When students use technology as part of learning statistics, what implications does that have
for how we assess their learning, and what we assess?
2. How do we separate student understanding and use of the tools from their understanding of
statistics?
3. If learning the tool is part of learning to think statistically, how can we assess their learning
in ways that reveal their understanding of the tool and their statistical thinking?
4. If students are using technology in learning statistics and we do not assess them using
technology, are we losing important information about their learning outcomes?
5. How should technology change the type of items we use (e.g. including data analysis or
simulations as items)?
6. Can the use of technology-enhanced tasks reveal more about student thinking?
7. What are ways to reveal students understanding of things that a computer can automatically
generate? What are best ways to provide output and ask questions to produce useful
information on what students know and understand?
If we knew the answers to these questions, then:
• Researchers could design better assessments for student learning outcomes.
-37-
• Students, teachers and administrators would understand how the benefits in students’
learning balance any new costs for purchasing and requiring technology tools, labs
assignments, etc .
• Teachers would be able to use technology more effectively to promote student learning.
• Students would be able to learn more efficiently and have a deeper knowledge of
statistical ideas and processes.
• Teachers could better engage and motivate students,
• Teachers and administrators would be able to efficiently make major changes in course
content and curriculum.
• Students would be able to learn a more modern approach to statistics and have a more
authentic experience doing statistics.
• Programs and departments would be able to better prepare, support, and motivate
teachers and TAs to use technology in their classes.
• Students would be able to better utilize technology such as statistical software in their
personal and professional lives.
• Researchers could find better ways to reveal what students have really learned and what
they are able to do.
• It would ensure more authentic assessments aligned with the ways courses are taught
and are better able to assess students’ proficiency with technology use.
• Teachers would be able to prepare students for future work and careers, and also
motivate them regarding the need and time investment in learning to use technology
tools.
Measurement/Assessment Needs:
Assessments are needed to evaluate important student learning outcomes, so the impact of
technology can be accurately measured. Assessments of affective constructs are needed to measure
impact on students’ attitudes, motivation, anxiety and beliefs about statistics that allow focus on the
impact of technology - perhaps as modules for existing instruments. Other assessments needed are
teaching logs and observational ratings, student interview questions, and instruments to assess
teachers’ technology related pedagogical content knowledge. We need instruments to assess teacher
knowledge and teacher beliefs about student learning with technology. Assessment instruments

-38-
must be made adaptable to technological change since technology will continue to fundamentally
alter both what is taught and how it is taught.
-39-
7. Assessment
“In reality it is through classroom assessment that attitudes, skills, knowledge and thinking are fostered, nurtured and accelerated – or stifled ” (Hynes (1991) cited in Earl, 2004).
While there is little literature on the assessment of teacher outcomes, assessment of student
outcomes in the context of learning statistics has been of interest for several decades. Early work
focused on affective factors such as anxiety and attitudes and alternative methods of assessing
student learning such as projects, portfolios, etc. There are now two edited volumes focused
exclusively on assessment in statistics education (Gal & Garfield, 1997; Bidgodo et al., 2010). The
scope of these books goes from primary to secondary to tertiary education, and takes an
international perspective rather than focusing only on the college course in the United States.
However, many of the types of assessment issues and methods addressed are applicable to college
students, even if the specific section focuses on pre-college settings. The context of assessment in
these works is typically for formative uses, to improve learning and instruction, rather than for use
in research studies.
A weakness of many research studies focused on teaching statistics in the college course has been
the use of teacher-made instruments, final exam scores, or end of course grades, to assess outcomes
(see Zieffler et al., 2008). These instruments lack evidence of validity, and generally do not extend
or generalize beyond the particular setting in which they are used. For many years there was a lack
of awareness in the statistics education community about the existence of more standard, research
based tests that could be used in studies. Another issue constraining research studies is the lack of
enough diversity in available validated tests to allow good alignment between existing tests and
intended outcomes in a particular research study.
In addition to the two assessment volumes, sections on assessment appear in other books on
statistics education (e.g, Moore, 2000; Gelman & Nolan, 2002; Garfield & Ben-Zvi 2008; Garfield
& Franklin, 2011). These sections focus exclusively on teaching the introductory college course and
address issues of formative and summative assessment, assessments of statistical literacy and
thinking, sources of assessment resources, etc.
The ARTIST website (https://app.gen.umn.edu/artist) is the most complete current source for
statistics education related assessment items, instruments, and resources. Originally a five year NSF
-40-
funded project this website is now moving to CAUSEweb.org, and offers online versions of topic
tests as well as the CAOS test, a comprehensive assessment of outcomes in a first course in
statistics (delMas et al., 2005). The CAOS test has been widely used in research studies and is
currently under revision to address the needs of the more diverse course content and formats now
seen in introductory statistics courses.
The assessment needs outlined in each of the previous sections of this report point to the need for a
collection of high quality, accessible, and flexible instruments to provide formative and summative
data on teachers and students. Some of these instruments currently exist, and for others, there may
be generic versions for which a statistics education supplement can adequately address the need. A
list of some current instruments that might be useful in statistics education research studies is
provided at www.stat.osu.edu/~dkp/retreat/Assessment.pdf. These instruments are categorized by
the topics and are grouped by instruments developed by statistics educators and other instruments
that were developed either for more generic purposes or that might be adapted to a statistics context.
A unique challenge to statistics is how to update assessments to reflect changes in the discipline in
terms of both content and method, particularly in light of continuing advances in technology that
impact what and how students learn statistics. The areas most in need of new assessment strategies
are technology and teacher development. Issues raised in the technology section point to challenges
in simultaneously assessing students on their technology use as well as on unique aspects of
learning with new tools and approaches. In teacher development, tools are needed to assess
pedagogical content knowledge that could be used to evaluate programs to prepare teachers or
improve the teaching of practicing teachers.
Research Priority 1: What are effective ways to assess important student outcomes across a variety
of different introductory statistics classes, in ways that allow us to study the efficacy of different
approaches to learning statistics? This includes methods of administering assessments and
customizing assessment, ways of obtaining and making accessible samples of normative and
baseline data, determining methods for evaluating change in student outcomes, and methods of
distinguishing common and unique factors (e.g, text anxiety form statistics anxiety).
-41-
Research Priority 2: What are effective ways to assess important teacher factors across a variety of
instructional settings that allow us to study the efficacy of different approaches for preparing and
developing effective teachers? This includes ways of collecting data that allow flexible use, ways of
accessing data that allow examination of changes over time, etc.
Summary
We see assessment as the crucial area that is needed to enable high quality research that can inform
and improve the teaching and learning of statistics. While assessment data has typically been
gathered in a variety of ways to provide feedback to students and to assign grades, the use of
common, validated instruments in research studies has been lacking until recently, with the
increasing use of the CAOS test and SATs in several studies. The recently funded e-ATLAS project
will be developing modularized versions of the STI and CAOS test to promote flexibility in their
use and will also be collecting data from a large national sample. However, additional instruments
are needed to provide more options for those conducting research studies and to address the needs
outlined in each of the areas addressed in this report. As research programs begin to build and
produce generalizable findings and more refined hypotheses, it will become increasingly valuable to
apply multiple instruments simultaneously. Consortiums of institutions and organizations can play
an important role in making this process more efficient as well as helping with the development,
pilot testing, revisions, and administration of such assessments. We encourage the support of such
efforts and of this area of scholarship by researchers as well as dissertations for graduate students.
-42-
References Albert, J. (2002). Teaching Introductory Statistics from a Bayesian Perspective. In B. Philips (ed). Proceedings of the Sixth International Conference on Teaching Statistics. [CDROM]. International Statistical Institute: Cape Town. Aliaga, M., Cobb, G., Cuff, C., Garfield, J., Gould, R., Lock, R., Moore, T., Rossman, A., Stephenson, R., Utts, J., Velleman, P., & Witmer, J. (2005). Guidelines for assessment and instruction in statistics education: College report. Alexandria, VA: American Statistical Association. Retrieved May 19, 2010 from: http://www.amstat.org/education/gaise/
Arbaugh, F., Herbal-Eisenmann, B., Ramirez Knuth, E., Krandendonk, H., and Quander, J.,, N., (2010). Linking Research and Practice: The NCTM Research Agenda Conference Report. Reston, VA: National Council of Teachers of Mathematics (NCTM) Assessment Resource Tools for Improving Statistical Thinking (ARTIST) https://apps3.cehd.umn.edu/artist/ Bakker, A. (2002). Route-type and landscape-type software for learning statistical data analysis. In B. Phillips (Ed.), Proceedings of the Sixth International Conference on Teaching Statistics [CD-ROM]. Cape Town. Baloglu, M. (2001). An application of structural equation modeling techniques in the prediction of statistics anxiety among college students (Doctoral dissertation). PhD Texas A&M University - Commerce. Supervisor: Paul F. Zelhart. Retrieved from http://www.stat.auckland.ac.nz/~iase/publications/dissertations/dissertations.php Baloglu, M. (2002). Psychometric properties of the Statistics Anxiety Rating Scale. Psychological Reports: Volume 90, Issue , pp. 315-325. Battista, M.T. (2004). Applying cognition-based assessment to elementary school students' development of understanding of area and volume measurement. Mathematical Thinking and Learning, 6(2), 185 - 204 Ben-Zvi, D. (2000). Toward understanding the role of technological tools in statistical learning. Mathematical Thinking Learning, 2(1&2), 127–155. Ben-Zvi, D. & Amir, Y. (2005). How do primary school students begin to reason about distributions? In Reasoning about distribution: A collection of current research studies. Proceedings of the Fourth International Research Forum on Statistical Reasoning, Thinking, and Literacy (SRTL-4), Ed. K. Makar, University of Auckland, New Zealand, 2–7 July, 2005. Brisbane: University of Queensland.
-43-
Ben-Zvi, D., & Garfield, J. (2004). Statistical literacy, reasoning, and thinking: Goals and challenges. In J. Garfield & D. Ben-Zvi (Eds.), The challenge of developing statistical literacy, reasoning, and thinking (pp. 3-15). Dordrecht, The Netherlands: Kluwer. Bidgood, P., Hunt, N., and Jolliffe, F. (Eds.).(2010) Assessment Methods in Statistical Education: An International Perspective, Wiley & Sons Ltd . Black, P., & Wiliam, D. (1998). Inside the black box: Raising standards through classroom assessment. London: King's College. Bloom, B.S. (1956). Taxonomy of educational objectives handbook I: The cognitive domain. New York: David McKay Company, Inc. Bond, M.E., Perkins, S.N., & Ramirez, C. (2012). Students’ perceptions of statistics: An exploration of attitudes, conceptualizations, and content knowledge of statistics. Statistics Education Research Journal, 11(2), 6-24 [Online: http://www.stat.auckland.ac.nz/~iase/serj/SERJ11(2)_Bond.pdf] Bright, G.W. & Friel, S.N. (1998). Graphical representations: Helping students interpret data. In Reflections on Statistics: Learning, Teaching, and Assessment in Grades K-12, Ed. S.P. Lajoie, pp. 63–88. Mahwah, NJ: Lawrence Erlbaum. Brown, A. L., & Campione, J. C. (1996). Psychological theory and the design of innovative learning environments: On procedures, principles, and systems. In L. Schauble & R. Glaser (Eds.), Innovations in Learning: New Environments for Education. Mahwah, NJ: Lawrence Earlbaum Associates. Budè, L., Van De Wiel, M. W. J., Imbos, T., Candel, M. J. J. M., Broers, N. J., & Berger, M. P. F. (2007). Students’ achievements in a statistics course in relation to motivational aspects and study behaviour. Statistics Education Research Journal, 6(1), 5-21. [Online: http://www.stat.auckland.ac.nz/~iase/serj/SERJ6(1)_Bude.pdf] Carlson, K.A. & Winquist, J.R. (2011). Evaluating an active learning approach to teaching introductory statistics: A classroom workbook approach. Journal of Statistics Education, 19(1). http://www.amstat.org/publications/jse/v19n1/carlson.pdf Cashin, S. E., & Elmore, P. B. (2005). The Survey of Attitudes Toward Statistics scale: A construct validity study. Educational and Psychological Measurement, 65(3), 1-16. Catley, K., Lehrer, R. & Reiser, B. (2004). Tracing a prospective learning progression for developing understanding of evolution. Paper presented at the Committee on Test Design for K-12 Science Achievement. http://www7.nationalacademies.org/bota/evolution.pdf
-44-
Chance, B., Ben-Zvi, D., Garfield, J., & Medina, E. (2007, October). The role of technology in improving student learning of statistics. Technology Innovations in Statistics Education Journal, 1(1). (http://repositories.cdlib.org/uclastat/cts/tise/vol1/iss1/art2/) Chance, B.L., delMas, R., & Garfield, J. (2004). Reasoning about sampling distributions. In D. Ben-Zvi & J. Garfield (Eds.), The challenge of developing statistical literacy, reasoning, and thinking (pp. 295-323). Dordrecht, The Netherlands: Kluwer Academic Publishers. Chiesi, F,. & Primi, C. (2009). Assessing statistics attitudes among college students: Psychometric properties of the Italian version of the Survey of Attitudes Toward Statistics (SATS). Learning and Individual Differences, 19(2), 309-313. Cognitive and Non-Cognitive Factors Related to Students' Statistics Achievement. Statistics Education Research Journal, 9(1), 6 – 26. http://www.stat.auckland.ac.nz/~iase/serj/SERJ9(1)_Chiesi_Primi.htm
Chiesi, F. & Primi, C. (2009). Assessing statistics attitudes among college students: Psychometric properties of the Italian version of the Survey of Attitudes toward Statistics Learning and Individual Differences, 19 (2), 309-313. Clark, J., Karuat, G., Mathews, D. & Wimbish, J. (2003). The Fundamental Theorem of Statistics: Classifying Student understanding of basic statistical concepts. [Online: http://www1.hollins.edu/faculty/clarkjm/stat2c.pdf] Clements, D. H. (2007). Curriculum Research: Toward a framework for “research-based curricula.” Journal for Research in Mathematics Education, 38(1), 35 – 70. Clements, D.H. & Sarama, J. (2004). Learning trajectories in mathematics education. Mathematical Thinking and Learning, 6(2), 81-89. Cobb, G. (1992). Teaching Statistics. In Heeding the Call for Change: Suggestions for Curricular Action, L.Steen (ed.). Washington, D.C: Mathematical Association of America, pp 3-43. Cobb, G.W. (1993). Reconsidering Statistics Education: A National Science Foundation Conference. Journal of Statistics Education, 1(1). https://www.amstat.org/publications/jse/v1n1/cobb.html Cobb, G. W. (2007). The Introductory Statistics Course: A Ptolemaic Curriculum? Technology Innovations in Statistics Education, 1(1). www.escholarship.org/uc/item/6hb3k0nz Cobb, P., McClain, K. & Gravemeijer, K.P.E. (2003b). Learning about statistical covariation. Cognition and Instruction, 21(1), 1–78. Confrey, J., Maloney, A., Nguyen, K., Wilson, P. H., & Mojica, G. (2008, April). Synthesizing research on rational number reasoning. Working Session at the Research Pre-session of the National Council of Teachers of Mathematics, Salt Lake City, UT.
-45-
Corcoran, T., Mosher, F. A. & Rogat, A. (2009). Learning Progressions in Science: An Evidence-based Approach to Reform. New York: Center on Continuous Instructional Improvement Teachers College-Columbia University. Darling-Hammond, L. (2009). Recognizing and enhancing teacher effectiveness. The International Journal of Educational and Psychological Assessment December, 3, 1-24. DeFranco, T.C., & McGivney-Burelle, J. (2001). The beliefs and instructional practices of mathematics teaching assistants participating in a mathematics pedagogy course. Paper Presented at the 23rd Annual Conference of Psychology of Mathematics Education – North America, Snowbird, Utah. delMas, R. (2004). A comparison of mathematical and statistical reasoning. In D. Ben-Zvi and J. Garfield (Eds.), The Challenge of Developing Statistical Literacy, Reasoning, and Thinking (pp. 79-95). Dordrecht, The Netherlands: Kluwer Academic Publishers. delMas, R., Garfield, J., Ooms, A. & Chance, B. (2007). Assessing students’ conceptual understanding after a first course in statistics. Statistics Education Research Journal, 6(2), 28-58. http://www.stat.auckland.ac.nz/~iase/serj/SERJ6(2)_delMas.pdf delMas, R. & Liu, Y. (2005, May). Exploring students’ conceptions of the standard deviation. Statistics Education Research Journal, 4(1), 55–82. http://www.stat.auckland.ac.nz/~iase/serj/SERJ4(1)_delMas_Liu.pdf delMas, R., Garfield, J., Ooms, A., & Chance, B. (2007). Assessing students’ conceptual understanding after a first course in statistics. Statistics Education Research Journal, 6(2), 28-58. [Online: http://www.stat.auckland.ac.nz/~iase/serj/SERJ6(2)_delMas.pdf] Dempster, M. & McCorry, N.K. (2009). The Role of Previous Experience and Attitudes Toward Statistics in Statistics Assessment Outcomes among Undergraduate Psychology Students. Journal of Statistics Education, 17(2). [Online: http://www.amstat.org/publications/jse/v17n2/dempster.html]
Deslauriers, Schelew, and Wieman (2011). Improved learning in a large-enrollment physics class - Science 13 May 2011: Vol. 332 no. 6031 pp. 862-864 Diaz, C. and Batanero, C. (2009). University students’ knowledge and biases in conditional probability reasoning. International Electronic Journal of Mathematics Education Volume 4, Number 3, October 2009 Eccles, J.S., Adler, T.F., Futterman, R., Goff, S.B., Kaczala, C.M., Meece, J.L., & Midgley, C. (1983). Expectancies, values, and academic behaviors. In J.T. Spence (Ed.), Achievement and achievement motivation (pp. 75-146). San Francisco, CA: W.H. Freeman.
-46-
Emmioğlu, E. & Capa-Aydin, Y. (2012). Attitudes and achievement in Statistics: A meta-analysis study. Statistics Education Research Journal, 11(2), 95-102 [Online: http://www.stat.auckland.ac.nz/~iase/serj/SERJ11(2)_Emmioglu.pdf]
Everson, M.G., & Garfield, J. (2008). An innovative approach to teaching online statistics courses. Technology Innovations in Statistics Education, 2(1). http://escholarship.org/uc/item/2v6124xr Fernandez, C. (2002), “Learning from Japanese Approaches to Professional Development: The Case of Lesson Study,” Journal of Teacher Education, 53(5), 393-405. Finney, S.J. & Schraw, G. (2003). Self-efficacy beliefs in college statistics courses. Contemporary Educational Psychology, 28(2), 161 – 186. DOI: 10.1016/S0361-476X(02)00015-2 Gal, I., & Garfield, J.B. (Eds.) (1997). The assessment challenge in statistics education. Amsterdam: IOS Press.
Gal, I., & Ginsburg, L. (1994, November). The role of beliefs and attitudes in learning statistics: towards an assessment framework. Journal of Statistics Education, 2(2). Retrieved November 6, 2006, from http://www.amstat.org/publications/jse/v2n2/gal.html Gal, I., Ginsburg, L. & Schau, C. (1997). Monitoring attitudes and beliefs in statistics education. In The assessement challenge in statistics education, Eds. I. Gal and J.B. Garfield, pp. 37–54. Amsterdam , The Netherlands : International Statistical Institute/IOS Press. Garet, M. S., Porter, A. C., Desimone, L., Birman, B. F., & Yoon, K. (2001). What makes professional development effective? Results from a national sample of teachers. American Educational Research Journal, 38(4), 915-45. Garfield, J. (2003). Assessing statistical reasoning. Statistics Education Research Journal, 2(1), 22–38. Garfield, J. & Ben-Zvi, D. (2007). How Students Learn Statistics Revisited: A Current Review of Research on Teaching and Learning Statistics. International Statistical Review, 75, 3, 372–396. Garfield, J. & Ben-Zvi, D. (2008). Developing Students’ Statistical Reasoning: Connecting Research and Teaching Practice. Dordrecht: Springer. Garfield, J., & Everson, M. (2009). Preparing teachers of statistics: A graduate course for future teachers. Journal of Statistics Education, 17(2), http://www.amstat.org/publications/jse/v17n2/garfield.pdf
-47-
Garfield, J., delMas, R., & Chance, B. (2005), “The Impact of Japanese Lesson Study on Teachers of Statistics,” paper presented at the Joint Statistical Meetings, Minneapolis, MN. Garfield, J., delMas, R., & Chance, B. (2007). Using students’ informal notions of variability to develop an understanding of formal measures of variability. In M. C. Lovett and P. Shah (Ed.), Thinking with Data (Proceedings of the 33rd Carnegie Symposium on Cognition) (pp. 117-147). New York: Erlbaum. Garfield, J. and Franklin, C. (2011). Assessment of learning, for learning, and as learning in statistics education. In C. Batanero, G. Burrill, C. Reading, and A. Rossman (eds.). Teaching Statistics in School Mathematics - Challenges for Teaching and Teacher Education: A joint ICMI/IASE Study (pp. 133-145). New York: Springer Publishers.
Garnham, C., & Kaleta, R. (2002). Introduction to hybrid courses. Teaching with Technology Today, 8 (10) Gelman, A., & Nolan, D. (2002). Teaching Statistics: A Bag of tricks. New York: Oxford University Press.
Gigerenzer, G. (1996). On narrow norms and vague heuristics: A reply to Kahneman and Tversky (1996). Psychological Review, 103(3), 592–596. Giraud, G. (1997, November). Cooperative learning and statistics instruction. Journal of Statistics Education, 5(3). http://www.amstat.org/publications/jse/v5n3/giraud.html
Gordon, S. (1995). A Theoretical Approach to Understanding Learners of Statistics Journal of Statistics Education v.3, n.3
Gould, R (2010). Statistics and the modern student. International Statistical Review, 78 (2), 297-315. Groth, R.E. (2006). Analysis of an online case discussion about teaching stochastics. Mathematics Teacher Education and Development, 7, 53-71. Groth, R.E. (2007). Toward a conceptualization of statistical knowledge for teaching. Journal for Research in Mathematics Education, 38(5), 427-437. Groth, R.E. & Bergner, J.A. (2005, November). Preservice elementary school teachers’ metaphors for the concept of statistical sample. Statistics Education Research Journal, 4(2), 27–42. http://www.stat.auckland. ac.nz/∼iase/serj/SERJ4(2)_groth_bergner.pdf
Groth, R.E., & Bergner, J.A. (2006). Preservice elementary teachers' conceptual and procedural knowledge of mean, median, and mode. Mathematical Thinking and Learning, 8, 37-63.
-48-
Hammerman, J.K., & Rubin, A. (2004, November). Strategies for managing statistical complexity with new software tools. Statistics Education Research Journal, 3(2), 17-41. Retrieved December 4, 2006, from http://www.stat.auckland.ac.nz/~iase/serj/SERJ3(2)_Hammerman_Rubin.pdf Harlow, L. L., Burkholder, G. J., & Morrow, J. A. (2002). Evaluating attitudes, skill and performance in a learning-enhanced quantitative methods course: A structural modelling approach. Structural Equation Modeling, 9, 413-430. Hiebert, J. & Lefevre, P. (1986). Conceptual and procedural knowledge in mathematics: An introductory analysis. In J. Hiebert (Ed.), Conceptual and procedural knowledge: The case of mathematics (pp. 1-28). Hillsdale, NJ: Erlbaum. Hill, H.C., Schilling, S.G., & Ball, D.L. (2004) Developing measures of teachers’ mathematics knowledge for teaching. Elementary School Journal, 105, 11-30. Hjalmarson, M.A., Moore, T.J., & delMas, R. (2011). Statistical analysis when the data is an image: Eliciting student thinking about sampling and variability. Statistics Education Research Journal, 10 (1), 15-34. http://www.stat.auckland.ac.nz/~iase/serj/SERJ10%281%29_Hjalmarson.pdf Holcomb, J., Chance, B., Rossman, A., & Cobb, G. (2010). Assessing student learning about statistical inference, Proceedings of the 8th International Conference on Teaching Statistics. Holcomb, J., Chance, B. Rossman, A., Tietjen, E., & Cobb, G. (2010), Introducing Concepts of Statistical Inference via Randomization Tests, Proceedings of the 8th International Conference on Teaching Statistics. Hood, M., Creed, P.A., & Neumann, D.L. (2012). Using the expectancy value model of motivation to understand the relationship between student attitudes and achievement in Statistics. Statistics Education Research Journal, 11(2), 72-85 [Online: http://www.stat.auckland.ac.nz/~iase/serj/SERJ11(2)_Hood.pdf] Kahneman, D., Slovic, P. & Tversky, A. (Eds.). (1982). Judgment Under Uncertainty: Heuristics and Biases. New York: Cambridge University Press. Kaplan, J. J. & Du, J. (2009). Question format and representations: Do heuristics and biases appy to statistics students? Statistics Education Research Journal, 8(2), 56-73. Kaplan, J.J., Rogness, N. & Fisher, D. (2011). Lexical ambiguity: Making a case against spread. Teaching Statistics. DOI: 10.1111/j.1467-9639.2011.00477.x Kaplan, J.J., Fisher, D. & Rogness, N. (2010). Lexical Ambiguity in Statistics: How students use and define the words: association, average, confidence, random and spread. Journal of Statistics Education, 18(2), http://www.amstat.org/publications/jse/v18n2/kaplan.pdf
-49-
Keeler, C.M. & Steinhorst, R.K. (1995, July). Using small groups to promote active learning in the introductory statistics course: A report from the field. Journal of Statistics Education, 3(2). http://www.amstat.org/publications/jse/v3n2/keeler.html
Kirkman, E. (2010) CBMS Survey of Undergraduate Mathematical Sciences Programs, Washignton DC: Conference Board of Mathematical Sciences.
Konold, C. & Harradine, A. & Kazak, S. (2007), Understanding distributions by modeling them, International Journal of Computers for Mathematical Learning 12, 217-230. Konold, C. & Kazak, S. (2008). Reconnecting data and chance. Technology Innovations in Statistics Education, 2 (1), Article 1. Konold, C., Pollatsek, A., Well, A. & Gagnon, A. (1997). Students analyzing data: research of critical barriers. In Research on the Role of Technology in Teaching and Learning Statistics, Eds. J. Garfield and G. Burrill, pp. 151– 168. Voorburg, The Netherlands: International Statistical Institute. Konold, Clifford & Pollatsek, Alexander & Well, Arnold & Lohmeier, J. & Lipson, A. (1993), "Inconsistencies in students' reasoning about probability", Journal for Research in Mathematics Education 24, 392-414. Lancaster, S.M. (2008). A Study Of Preservice Teachers' Attitudes Toward Their Role As Students Of Statistics And Implications For Future Professional Development In Statistics. Paper Presented at the Proceedings of the ICMI Study 18 and 2008 IASE Round Table Conference, Mexico. Langrall, C., Nisbet, S., Mooney, E. & Jansem, S. (2010). The role of context expertise when comparing data. Mathematical Thinking and Learning, 13(1&2), 47-67. Lee, H. S., Angotti, R. & Tarr, J. E. (2010). Making comparisons between observed data and expected outcomes: Students’ informal hypothesis testing with probability simulation tools. Statistics Education Research Journal, 9(1), 68-96. http://www.stat.auckland.ac.nz/~iase/serj/SERJ9(1)_Lee.pdf Lee, H. S., & Hollebrands, K. F. (2008). Preparing to teach data analysis and probability with technology. In C. Batanero, G. Burrill, C. Reading, & A. Rossman (Eds.), Joint ICMI/IASE Study: Teaching Statistics in School Mathematics. Challenges for Teaching and Teacher Education. Proceedings of the ICMI Study 18 and 2008 IASE Round Table Conference. Retrieved from http://www.ugr.es/~icmi/iase_study/Files/Topic3/T3P4_Lee.pdf Lee, H. S., & Hollebrands, K. F. (2011). Characterizing and developing teachers’ knowledge for teaching statistics. In C. Batanero, G. Burrill, C. Reading, & A. Rossman (Eds.), Teaching Statistics in School Mathematics - Challenges for Teaching and Teacher Education: A joint ICMI/IASE Study (pp. 359-369), Springer.

-50-
Lehrer, R., Konold, C., & Kim, M. (2006, April). Constructing Data, Modeling Chance in the Middle School. Paper presented at the Annual Meeting of the American Educational Research Association, San Francisco, CA. Lehrer, R. & Schauble, L. (2002). Distribution: A resource for understanding error and natural variation. In Proceedings of the Sixth International Conference on Teaching Statistics: Developing a Statistically Literate Society, Ed. B. Phillips. Voorburg, The Netherlands: International Statistical Institute. Lehrer, R. & Schauble, L. (2006). Cultivating model-based reasoning in science education. In R. K. Sawyer (Ed.), Cambridge Handbook of the Learning Sciences (pp. 371-388). Cambridge: University Press. Lehrer, R., & Schauble, L. (2007). Contrasting emerging conceptions of distribution in contexts of error and natural variation. In Thinking with Data, Eds., M. Lovett and P. Shah, pp. 149–176. Mahwah, NJ: Erlbaum. Lesh, R., Hoover, M., Hole, B., Kelly, A., & Post, T. (2000). Principles for developing thought-revealing activities for students and teachers. In E.A. Kelly & R. Lesh (Eds.), Handbook of research design in mathematics and science education (pp. 591-646). Mahwah, NJ: Lawrence Erlbaum. Lovett, M.C. (2001). A Collaborative convergence on studying reasoning processes: A case study in statistics. In Cognition and Instruction: Twenty-Five Years of Progress, Eds. S. Carver and D. Klahr, pp. 347–384. Mahwah, NJ: Erlbaum. Magel, R.C. (1998, November). Using cooperative learning in a large introductory statistics class.Journal of Statistics Education, 6(3). http://www.amstat.org/publications/jse/v6 n3/magel.html Mathews, D. & Clark, J. (2003). Successful Students’ Conceptions of Mean, Standard Deviation and the Central Limit Theorem. Unpublished paper. http://www1.hollins.edu/faculty/clarkjm/stats1.pdf. McGowan, H.M., & Vaughan, J. (in press). Testing a student generated hypothesis using student data. Teaching Statistics Meletiou, M. & Lee, C. (2002). Teaching students the stochastic nature of statistical concepts in an introductory statistics course. Statistics Education Research Journal, 1(2), 22–37. http://www.stat.auckland.ac.nz/∼iase/serj/SERJ1(2).pdf Meletiou, M., Lee, C. & Myers, M. (1999). The role of technology in the introductory statistics classroom: Reality and potential. Proceedings of the International Conference on Mathematics/Science Education and Technology. San Antonio, TX.
-51-
Meletiou, M., & Lee, C. (2002). Teaching students the stochastic nature of statistical concepts in an introductory statistics course. Statistics Education Research Journal, 1(2), 22-37. Retrieved July 15, 2007, from http://www.stat.auckland.ac.nz/~iase/serj/SERJ1(2).pdf Meyer, O. & Lovett, M. (2002). Implementing a computerized tutor in a statistical reasoning course: Getting the big picture. In Proceedings of the sixth international conference on teaching statistics: Developing a statistically literate society, Ed. B. Phillips. Voorburg, The Netherlands: International Statistical Institute. Millar, A. M., & Schau, C. (2010). Assessing students’ attitudes: the good, the bad, and the ugly. Joint Statistical Meetings, Vancouver, [Online: www.evaluationandstatistics.com\JSM2010.pdf] Mokros, J. & Russell, S.J. (1995). Children’s concepts of average and representativeness. Journal of Research in Mathematics Education, 26, 20–39.
Moore and Cobb (2000) Statistics and mathematics: Tension and cooperation DS Moore, GW Cobb - The American Mathematical Monthly, 2000 Moore, D.S. (2005). Preparing graduate students to teach statistics: Introduction. The American Statistician, 59(1), pp. 1-3. Mvududu, N. (2003). A Cross-Cultural Study of the Connection Between Students' Attitudes Toward Statistics and the Use of Constructivist Strategies in the Course. Journal of Statistics Education, 11(3). http://www.amstat.org/publications/jse/v11n3/mvududu.html Nolan, M.M., Beran, T., & Hecker, K.G. (2012). Surveys assessing students’ attitudes towards statistics: A systematic review of validity and reliability. Statistics Education Research Journal, 11(2), 103-123 [Online: http://www.stat.auckland.ac.nz/~iase/serj/SERJ11(2)_Nolan.pdf] Noll, J. (2007). Statistics teaching assistants’ statistical content knowledge and pedagogical knowledge. Unpublished doctoral dissertation, Portland State University, Portland Oregon. http://www.stat.aukland.ac.nz/~iase/publications/dissertations/07.Noll.Dissertation.pdf Onwuegbuzie, A.J., & Wilson, V.A. (2003) Statistics Anxiety: nature, etiology, antecedents, effects, and treatments--a comprehensive review of the literature. In Teaching in Higher Education. Taylor & Francis Paparistodemou, E. & Meletiou-Mavrotheris, M. (2008). Developing young students informal inference skills in data analysis. Statistics Education Research Journal, 7(2), 83-106. [Online: http://www.stat.auckland.ac.nz/~iase/serj/SERJ7(2)_Watson.pdf] Pea, R. D. (1987). Cognitive technologies for mathematics education. In A. Schoenfeld (Ed.), Cognitive science and mathematics education (pp. 89–122). Hillsdale, NJ: Erlbaum.
-52-
Pfaff, T. J. & Weinberg, A. (2009). Do Hands-On Activities Increase Student Understanding?: A Case Study. Journal of Statistics Education, 17(3). http://www.amstat.org/publications/jse/v17n3/pfaff.html Pfannkuch, M. (2006, November). Comparing Box plot distributions: A teacher’s reasoning. Statistics Education Research Journal, 5(2), 27–45. Retrieved July 15, 2007, from http://www.stat.auckland.ac.nz/∼iase/serj/SERJ5(2) Pfannkuch.pdf Pfannkuch, M. (2010). The Role of Context in Developing Informal Statistical Inferential Reasoning: A Classroom Study. Mathematical Thinking and Learning, 13(1&2), 27-46. Posner, M. (2011). The impact of a proficiency-based assessment and reassessment of learning outcomes system on student achievement and attitudes. Statistics Education Research Journal, 10(1), 3-14. [Online: http://www.stat.auckland.ac.nz/~iase/serj/SERJ10(1)_Posner.pdf] Pratt, D., Johnston-Wilder, P., Ainley, J. & Mason, J. (2008). Local and global thinking in statistics inference. Statistics Education Research Journal, 7(2), 107-129. [Online: http://www.stat.auckland.ac.nz/~iase/serj/SERJ7(2)_Pratt.pdf] Quilici, J.L. & Mayer, R.E. (2002). Teaching students to recognize structural similarities between statistics word problems. Applied Cognitive Psychology, 16(3), 325–342. Ramirez, C., Emmioğlu, E., & Schau, C. (2010). Understanding students’ attitudes toward statistics: New perspectives using an expectancy-value model of motivation and the Survey of Attitudes Toward Statistics. Joint Statistical Meetings, Vancouver, [Online: www.evaluationandstatistics.com\JSM2010EVM.pdf] Ramirez, C., Emmioğlu, E., & Schau, C. (2012). The importance of attitudes in Statistics Education. Statistics Education Research Journal, 11(2), 57-71 [Online: http://www.stat.auckland.ac.nz/~iase/serj/SERJ11(2)_Ramirez.pdf] Reid, A. and Petocz, P. (2002). ‘Students’ conceptions of statistics: a phenomenographic study’. Journal of Statistics Education 10(2), [On-line: http://www.amstat.org/publications/jse/jse_index.html] Roback, P., Chance, B., Legler, J., & Moore, T. (2006, July). Applying Japanese lesson study principles to an upper-level undergraduate statistics course. Journal of Statistics Education, 14(2). Retrieved December 28, 2006, from http://www.amstat.org/publications/jse/v14n2/roback.html Roberts, D.M., & Bilderback, E.W. (1980). Reliability and validity of a statistics attitude survey. Educational and Psychological Measurement, 40, 235-238.
Rossman, A. (2007). Seven Challenges for the Undergraduate Statistics Curriculum in 2007. Plenary Session, United Statistics Conference on Teaching Statistics (USCOTS), Columbus, OH, May 17 - 19.
-53-
Rubin, A., Bruce, B. & Tenney, Y. (1991). Learning about sampling: Trouble at the core of statistics. In Proceedings of the Third International Conference on Teaching Statistics, Ed. D. Vere-Jones, Vol. 1, pp. 314–319. Voorburg, The Netherlands: International Statistical Institute. Rumsey, D.A. (1998). A cooperative teaching approach to introductory statistics. Journal of Statistics Education, 6(1), http://www.amstat.org/publications/jse/v6n1/rumsey.html Russell, S.J. (1990). Issues in training teachers to teach statistics in the elementary school: A world of uncertainty. In Training Teachers to Teach Statistics: Proceedings of the International Statistical Institute Round Table Conference, Ed. A. Hawkins, pp. 59–71. Voorburg, The Netherlands: International Statistical Institute. Russell, S.J. & Mokros, J. (1996). What do children understand about average? Teaching Children Mathematics, 2, 360–364. Saldanha, L. (2003). Is this sample unusual? An investigation of students exploring connections between sampling distributions and statistical inference. Unpublished doctoral dissertation, Vanderbilt University, Tennessee. Saldanha, L. & Thompson, P. (2003). Conceptions of sample and their relationship to statistical inference. Educational Studies in Mathematics, 51, 257–270.
Schau, C. (1992). Survey of Attitudes Toward Statistics (SATS-28). [Online: http://evaluationandstatistics.com] Schau, C. (2003). Survey of Attitudes Toward Statistics (SATS-36). [Online: http://evaluationandstatistics.com]
Schau, C., Stevens, J., Dauphinee, T., & Del Vecchio, A. (1995). The development and validation of the Survey of Attitudes Toward Statistics. Educational & Psychological Measurement, 55 (5), 868-876. Sedlmeier, P. (1999). Improving Statistical Reasoning: Theoretical Models and Practical Implications. Hillsdale, NJ: Erlbaum. Shaughnessy, J.M. (1992). Research in probability and statistics: Reflections and directions. In Handbook of Research on Mathematics Teaching and Learning, Ed. D. Grouws, pp. 465–494. New York: Macmillan.
-54-
Shaughnessy, J.M. (1997). Missed opportunities in research on the teaching and learning of data and chance. In People in Mathematics Education (Proceedings of the 20th annual meetings of the Mathematics Education Research Group of Australasia), Eds. F. Biddulph and K. Carr, pp. 6–22. Rotorua, New Zealand: MERGA. Shaughnessy, J.M. (2007). Research on statistics learning and reasoning. In The Second Handbook of Research on Mathematics, Ed. F.K. Lester, pp. 957–1010. Reston, VA: National Council of Teachers of Mathematics (NCTM). Shaughnessy, J. M., Watson, J. M, Moritz, J. B., & Reading, C. (1999, April). School mathematics students’ acknowledgement of statistical variation: There’s more to life than centers. Paper presented at the Research Pre-session of the 77th Annual meeting of the National Council of Teachers of Mathematics, San Francisco, CA. Sherin, M. G., & van Es, E. A. (2005). Using video to support teachers’ ability to notice classroom interactions. Journal of Technology and Teacher Education 13, 475–491. Speer, N., Gutmann, T., Murphy, T.J. (2005). Mathematics teaching assistants preparation and development. College Teaching, 53(2), 75-80. Stein, M. K., Remillard, J., & Smith, M. S. (2007). How curriculum influences student learning. In F. Lester (Ed.), Second handbook of research on mathematics teaching and learning. Greenwich, CT: Information Age Publishing. Stewart, W. (2011). Bayesian Statistics - The Second Coming! Plenary Session, United States Conference on Teaching Statistics (USCOTS), Cary, NC, May 19 - 21. Stohl, H. (2005). Probability in teacher education and development. In G. Jones (Ed.), Exploring probability in school: Challenges for teaching and learning (pp. 345-366). Dordrecht, The Netherlands: Kluwer. Suzuka, K., Sleep, L., Ball, D. L., Bass, H., Lewis, J. M., and Thames, M. K. AMTE Monograph 6 Scholarly Practices and Inquiry in the Preparation of Mathematics Teachers, pp. 7–23 Suanpang, P., Petocz, P., & Kalceff, W. (2004). Student attitudes to learning business statistics: Comparison of online and traditional practices. Journal of Educational Technology & Society, 7 (3), 9-20. Summers, J.J., Waigandt, A., & Whittaker, T.A. (2005). A comparison of student achievement and satisfaction in an online versus a traditional face-to-face statistics class. Innovative Higher Education, 29 (3), 233-250.
-55-
Swartz RJ, Schwartz C, Basch E, Cai L, Fairclough DL, McLeod L, Mendoza TR, Rapkin B; The SAMSI Psychometric Program Longitudinal Assessment of Patient-Reported Outcomes Working Group. (2011). The king's foot of patient-reported outcomes: current practices and new developments for the measurement of change. Qual Life Res. Tempelaar, D.T., van der Loeff, S.S., Gijselaers, W.H. (2007). A structural equation model analyzing the relationship of students' attitudes toward statistics, prior reasoning abilities and course performance. Statistics Education Research Journal, 6(2), 78 – 102. http://www.stat.auckland.ac.nz/~iase/serj/SERJ6(2).pdf Tintle, N., VanderStoep, J. Holmes, V., Quisenberry, B. & Swanson, T. (2011). Development and assessment of a preliminary randomization-based introductory statistics curriculum. Journal of Statistics Education, 19(1). http://www.amstat.org/publications/jse/v19n1/tintle.pdf van Es, E. A., & Sherin, M. G. (2002). Learning to notice: Scaffolding new teachers’ interpretations of classroom interactions. Journal of Technology and Teacher Education, 10, 571–596. Vanhoof, S., Sotos, A. E. C., Onghena, P., Verschaffel, L., Van Dooren, W., & Van den Noortgate, W. (2006). Attitudes toward statistics and their relationship with short- and long-term exam results. Journal of Statistics Education, 14(3). http://www.amstat.org/publications/jse/v14n3/vanhoof.html
Vanhoof, S. (2010). Statistics Attitudes in University Students: Structure, stability, and relationship with achievement Unpubhlised doctoral dissertation. http://www.stat.auckland.ac.nz/~iase/publications/dissertations/10.Vanhoof.Dissertation.pdf Wenger, Etienne and Snyder, William (2000) `Communities of Practice? The Organizational Frontier', Harvard Business Review January-February. Watson, J. (2008). Exploring beginning inference with novice grade 7 students. Statistics Education Research Journal, 7(2), 59-83. http://www.stat.auckland.ac.nz/~iase/serj/SERJ7(2)_Watson.pdf Wentzel, K.R., & Wigfield, A. (2009) Handbook of Motivation at School. New York: Routledge. Wild, C.J., & Pfannkuch, M. (1999). Statistical thinking in empirical enquiry. International
Statistical Review, 67(3), 223–265. Wilson, P. H., Lee, H. S., & Hollebrands, K. F. (2011). Understanding prospective mathematics teachers' processes for making sense of students' work with technology. Journal for Research in Mathematics Education, 42(1), 42-67. Wise, S. L. (1985). The development and validation of a scale measuring attitudes toward statistics.
-56-
Educational and Psychological Measurement, 45, 401 – 405. Zieffler, A., Garfield, J., Alt, S. Dupuis, D., Holleque, K, & Chang, B. (2008). What does research suggest about the teaching and learning of introductory statistics at the college level? A review of the literature. Journal of Statistics Education. . 16 (2) [Online: www.amstat.org/publications/jse/v16n2/zieffler.html] Zieffler, A., & Garfield, J. (2009) Modeling the growth of students covariational reasoning during an introductory statistics course. Statistics Education Research Journal 8(1), 7-31. Zieffler, A., Park, J., Garfield, J., delMas, R., & Bjornsdottir, A. (2012) The Statistics Teaching Inventory: A survey on statistics teachers’ classroom practices and beliefs. Journal of Statistics Education