Embed Size (px)
Citation preview

STATUTORY ANNUAL REPORT 2016
CONNECTINGTHE DOTS

TABLE OF CONTENTS
ABOUT
STRATEGY & BUSINESS
PERFORMANCE REVIEW
SHAREHOLDERS
GOVERNANCE
FINANCIAL STATEMENTS
OUR COMPANYOur founder’s legacy 4The world in which we operate 6At a glance 8Letter to shareholders 11Corporate responsibility 15Chip making 17CONNECTING THE DOTS
OUR STRATEGYMission, vision, strategy and focus areas 26Value creation 29OUR INNOVATION AT WORKCollaboration and innovation at work 33Markets & products 34Research & development 38Breakthrough technologies 40People 42Patents and trademarks 45
FINANCIAL & NON-FINANCIAL RESULTSFinancial performance 47CR performance 63
SHAREHOLDER INFORMATIONInterview with the CFO 66Share listing 68Shareholder returns 70Key dates 72Key figures 73Contact information 74
CORPORATE GOVERNANCECorporate governance principles 76Management Board 77Supervisory Board 81Supervisory Board report 87Shares and shareholders’ rights 89External auditor 93Declarations 94RISK MANAGEMENTRisk management approach 95Risk categories and factors 98
CONSOLIDATED FINANCIAL STATEMENTS
ASM INTERNATIONAL NV FINANCIAL STATEMENTS
INDEPENDENT AUDITOR’S REPORT
OTHER INFORMATION
AB
OU
TS
TR
AT
EG
Y &
BU
SIN
ES
SP
ER
FO
RM
AN
CE
RE
VIE
WS
HA
RE
HO
LD
ER
SG
OV
ER
NA
NC
EF
INA
NC
IAL
STA
TE
ME
NT
SASMI STATUTORY ANNUAL REPORT 2016 2
ABOUT
OUR COMPANY >Our founder’s legacy
>The world in which we operate
>At a glance
>Letter to shareholders
>Corporate responsibility
>Chip making
CONNECTING THE DOTS
AB
OU
TS
TR
AT
EG
Y &
BU
SIN
ES
SP
ER
FO
RM
AN
CE
RE
VIE
WS
HA
RE
HO
LD
ER
SG
OV
ER
NA
NC
EF
INA
NC
IAL
STA
TE
ME
NT
SASMI STATUTORY ANNUAL REPORT 2016 3
AB
OU
T
EMPLOYEES1,670
NET SALES598EUR MILLION
COUNTRIES14
CONTINENTS3
OUR FOUNDER’S LEGACY
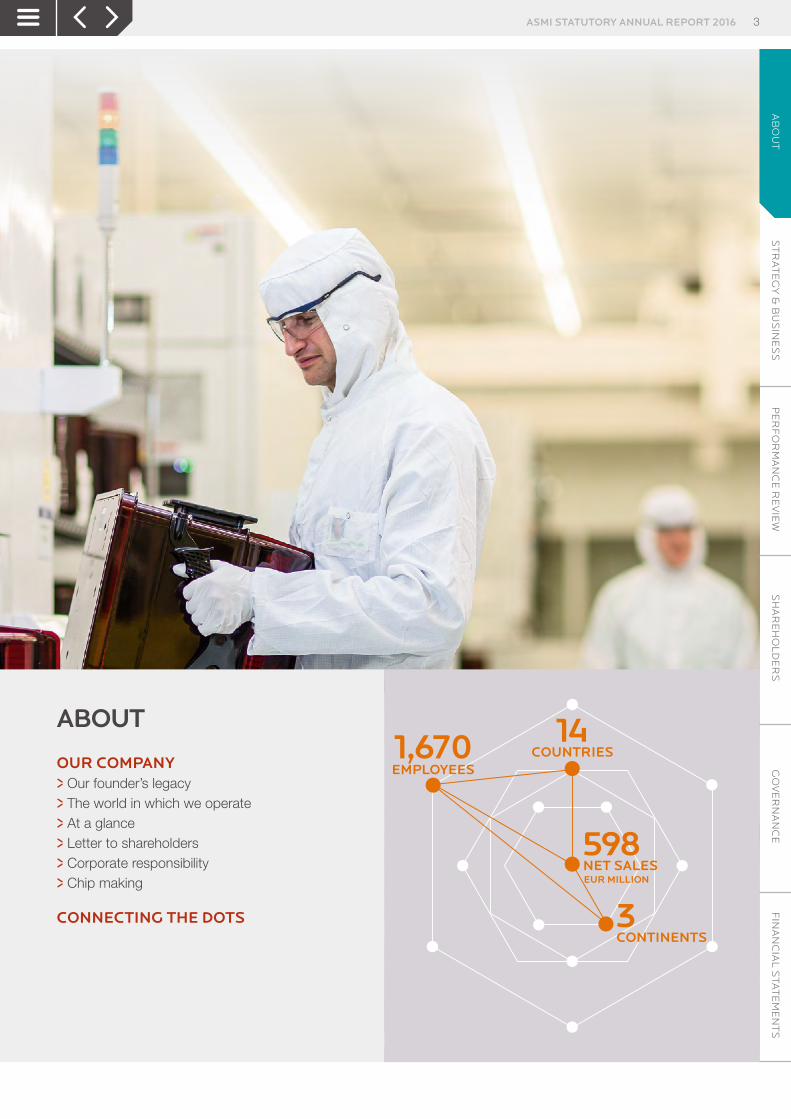
Arthur del Prado, ASMI’s founder and former CEO, played a fundamental and founding role in the semiconductor industry. He is globally viewed as a legend within our industry and his legacy extends from Silicon Valley to Tokyo. He excelled in innovation. Combined with strategic vision and a steadfast focus on the long-term, it proved the touchstone of his success and laid the foundation for the growth of ASMI and the semiconductor equipment manufacturing sector. He founded ASM in 1964, and was its Chief Executive Officer until 2008. In 1975, he established ASM Pacific Technology (ASMPT), and was Chairman until May 9, 2016. His entrepreneurship and drive led to the creation, in 1984, of ASML, a joint venture between Philips and ASMI.
Arthur del Prado was born in Batavia, Indonesia, in 1931. In 1945 his family moved to the Netherlands, where he studied Chemistry in Enschede and Economics in Amsterdam, after which he spent some time at Harvard Business School in Boston. In 1964, he started Advanced Semiconductor Materials (ASM) in Bilthoven, the Netherlands. His charisma, energy, and optimism won him the confidence and support of many. Arthur thought only in opportunities and rarely saw obstacles. He had the ability to identify and develop promising technologies at an early stage. And his vision extended far beyond the Netherlands.
In 1971 ASMI launched production of the first vapor deposition furnaces. The company grew from sales to innovation, developing and manufacturing its own technologies. In 1974 del Prado acquired a controlling stake in Fico Toolings, later ASM Fico, a manufacturer of materials for use in the semiconductor packaging industry. From the 1960s, this part of the industry was mostly located in Southeast Asia. Seeing the trend, in 1975 del Prado opened ASM Asia in Hong Kong. In 1988 these activities would be publicly listed as ASM Pacific Technology, which would grow to become the world’s largest supplier of semiconductor assembly and packaging technologies.
In 1976 del Prado established ASM America, the company’s first US operation, in Phoenix, Arizona, nearby Motorola Semiconductors, then the largest semiconductor manufacturer. ASM America was the company through which del Prado brought the plasma enhanced CVD process to the market, marking the breakthrough of ASMI as an original equipment supplier. In 1982 ASMI became the first Dutch company to establish a wholly-owned subsidiary in Japan.
In 1984 ASMI launched a joint venture with Philips to develop and market Philips’ lithography technology. The company was called ASM Lithography, now known as ASML. By the mid-eighties, ASMI’s product portfolio included nearly all major semiconductor production technologies: deposition furnaces, lithography, ion implantation, die and wire bonders, and various packaging technologies.
ARTHUR DEL PRADOFounder of ASMI and former CEO1931 - 2016
OUR COMPANY
ST
RA
TE
GY
& B
US
INE
SS
PE
RF
OR
MA
NC
E R
EV
IEW
SH
AR
EH
OL
DE
RS
GO
VE
RN
AN
CE
FIN
AN
CIA
L S
TAT
EM
EN
TS
ASMI STATUTORY ANNUAL REPORT 2016 | OUR FOUNDER’S LEGACY | 4A
BO
UT

TIMELINE ARTHUR DEL PRADO
Born in Batavia.
ASM establishes ASM Assembly Materials in Hong Kong.
Manufactures first machine(chemical vapor deposition furnace).
Acquires Fico Toolings,renamed ASM Fico.
Arrives inthe Netherlands.
Establishes ASM Asia.
Founds ASM America.
ASM launches plasma-enhancedchemical vapor deposition.
Starts Advanced SemiconductorMaterials (ASM) in Bilthoventhe Netherlands.
1931
1981
ASM Pacific Technologyopens plant in Singapore.
1991
Retires as CEO of ASMI.Receives “Legend of the Industry”award at Semicon West.
2008
ASMPT becomes the world’s largestsupplier of semiconductor assemblyand packaging technologies.
2005
Sells ASM Fico toBerliner Electro Holding(BESI).
1993
Acquisition of Microchemistrywhich developed atomic layerdeposition (ALD).
1999
ASMI aquires Genitech,a Korean plasma enhanced atomiclayer deposition (PEALD) manufacturer.
2004
Retires as Chairman of ASMPT.
Named Officer in the“Orde van Oranje Nassau”receives this medal of honorpersonally from the DutchMinister of Economic Affairs.
2009
2016
Founds ASM Japan – first Dutch company with a wholly-owned subsidiary in Japan.
1982
Establishes Epsilon Technology for the development of a newepitaxial reactor.
IPO ASM Pacific Technology (ASMPT)in Hong Kong. Withdraws from ASML joint venture. Sale of ASM Ion Implant to Varian.
EstablishesASM Ion Implantin Boston.
Joint ventureASM Lithographywith Philips.
1983
1988 1985
1984
1971
1974
1945
197519761980
1964
In 1999 ASMI acquired Finnish company Microchemistry and in 2004 ASMI acquired the Korean company Genitech, cementing its position as a pioneer in atomic layer deposition (ALD).
In 2008 Arthur was awarded the prestigious ‘Legend of the Industry’ award at Semicon West, which is presented annually to an individual who has made extraordinary contributions to the semiconductor industry over an extended period of time. That same year, Arthur retired as CEO, and shareholders approved the appointment of his eldest son, Chuck, as his successor. Arthur remained Chairman of ASMPT until his retirement in May 2016.
Arthur died peacefully at his home on September 9, 2016. He is rightfully recognized as the father of the European semiconductor industry. Indeed it is impossible to imagine today’s industry without him. From its onset, more than five decades ago, to the present day, his imprint and influence on the industry has been clear and unmistakable.
ST
RA
TE
GY
& B
US
INE
SS
PE
RF
OR
MA
NC
E R
EV
IEW
SH
AR
EH
OL
DE
RS
GO
VE
RN
AN
CE
FIN
AN
CIA
L S
TAT
EM
EN
TS
ASMI STATUTORY ANNUAL REPORT 2016 | OUR FOUNDER’S LEGACY | 5A
BO
UT

THE WORLD IN WHICH WE OPERATEWe live in a society that is increasingly connected. From the way we interact and travel, to the cities we inhabit, we rely on electronic devices to help us communicate, navigate, learn and play. Today, we are used to being able to work anywhere, anytime. Smart homes are helping us lower our energy requirements, saving costs and helping cut emissions. At the same time, greater connectivity in the health sector is advancing care in the community, helping people enjoy a better quality of life.
The next phase in this journey is the move towards the Internet of Things, where electronic devices connect to one another. This connected world is creating the demand for massive amounts of data, requiring ever-greater computer processing power and storage, capable of analyzing and acting on the data quickly and effectively. Achieving this requires the processing power of semiconductor chips. And ASMI’s technology is one of the steps toward making it all possible.
OUR ROLEWe design, manufacture, and sell equipment and services to our customers for the production of semiconductor devices, or integrated circuits (ICs). Semiconductor ICs, often called chips, are a key technology that enable the advanced electronic products used by consumers and businesses everywhere. Our innovative technologies are used by the most advanced semiconductor manufacturers, primarily for the deposition of thin films.
Our customers’ goal is to build faster, cheaper, and more powerful semiconductors. We work closely with them to make this a reality, forging mutually beneficial partnerships that enable us to help them develop their technology roadmap. At the same time, our customers become expert users of our equipment, and their insights help us to continuously improve our systems, resulting in greater productivity and lower operating costs per wafer, benefiting us, them and the end consumer.
Because collaboration is such a vital part of our success, we also develop close ties with many of our other stakeholders. For example, we maintain partnerships with technical institutions and universities to carry out leading-edge research and development. At the same time, working closely with our suppliers helps us manufacture, service, and sustain our products efficiently.
UNIVERSITY RESEARCH/R&D INSTITUTES
MATERIALSSUPPLIERS
SEMICONDUCTORsuPPLIERS
INDUSTRY CONSUMERS
FAB EQUIPMENTSUPPLIERS
THE VALUE CHAIN IN OUR INDUSTRY
ST
RA
TE
GY
& B
US
INE
SS
PE
RF
OR
MA
NC
E R
EV
IEW
SH
AR
EH
OL
DE
RS
GO
VE
RN
AN
CE
FIN
AN
CIA
L S
TAT
EM
EN
TS
ASMI STATUTORY ANNUAL REPORT 2016 | THE WORLD IN WHICH WE OPERATE | 6A
BO
UT

COMPLEX PROCESSESThe process of making semiconductor chips is both highly complex and very costly. Semiconductor fabrication plants, called fabs, house a large set of wafer processing equipment which performs a series of process steps on round silicon wafers, which are typically 300mm in diameter. The equipment is operated in cleanrooms, which filter the air to avoid contamination from small particles that could negatively affect the circuitry on the chips.
Most of our systems are designed for deposition processes when thin films, or layers, of various materials are grown or deposited onto the wafer. After testing the individual circuits for correct performance, the chips on the wafer are separated and then packaged in a protective housing before ultimately becoming part of a set of semiconductor chips on circuit boards within an electronic product.
THE DRIVING FORCE Our people are the driving force and the differentiating factor behind these innovations, which is why we focus on attracting and retaining talented individuals from across the globe. We know that it takes the right mix of people, working together, to solve big challenges. Investing in our people enables us to deliver the advanced nano technologies that enable better products to connect lives.
Thermal products business unit
Almere, the NetherlandsPhoenix, AZ, US
Plasma products business unit
Product research& development
Tokyo, JapanCheonan, South Korea
Researchfacilities
Leuven, BelgiumHelsinki, Finland
Manufacturing
SingaporeCheonan, South Korea
Product research& development
ST
RA
TE
GY
& B
US
INE
SS
PE
RF
OR
MA
NC
E R
EV
IEW
SH
AR
EH
OL
DE
RS
GO
VE
RN
AN
CE
FIN
AN
CIA
L S
TAT
EM
EN
TS
ASMI STATUTORY ANNUAL REPORT 2016 | THE WORLD IN WHICH WE OPERATE | 7A
BO
UT
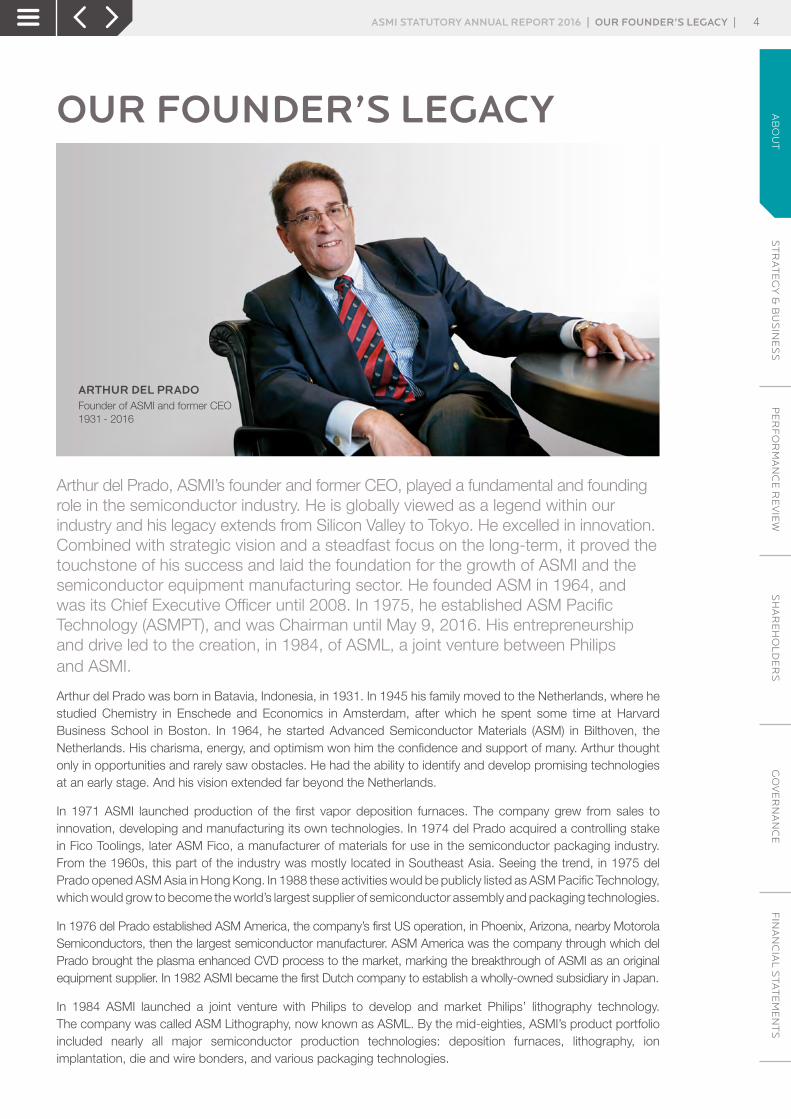
AT A GLANCEASM International NV (ASMI) is a leading supplier of semiconductor wafer processing equipment and process solutions. Our customers include all of the top semiconductor device manufacturers in the world. We help them create faster, cheaper and more powerful semiconductors that bring greater opportunities for people to understand, create and share more.
ORGANIZATION STRUCTUREASMI organizes its activities in two operating segments, Front-end (wafer processing) and Back-end (assembly and packaging).
ASM WaFEr proCEssing ASM PACIFIC tECHNOLOGYAssembly & Packaging / Surface Mount Technology
39.19% Ownership
ASM INTERNATIONAL
Headquarters: Almere, the Netherlands
HIGHLIGHTS **
* Excluding effects sale ASMPT shares.** Front-end segment.
BOOKINGSEUR million
622NET EARNINGS*EUR million
163OPERATING CASH FLOWEUR million
91
NET SALESEUR million
598RESULT ON INVESTMENT* EUR million
67.7CASH EUR million
378
OPERATING RESULT(EBIT) EUR million
82EARNINGS PER SHARE*(Diluted) EUR
2.66STAFFEmployees
1,670
ST
RA
TE
GY
& B
US
INE
SS
PE
RF
OR
MA
NC
E R
EV
IEW
SH
AR
EH
OL
DE
RS
GO
VE
RN
AN
CE
FIN
AN
CIA
L S
TAT
EM
EN
TS
ASMI STATUTORY ANNUAL REPORT 2016 | AT A GLANCE | 8A
BO
UT
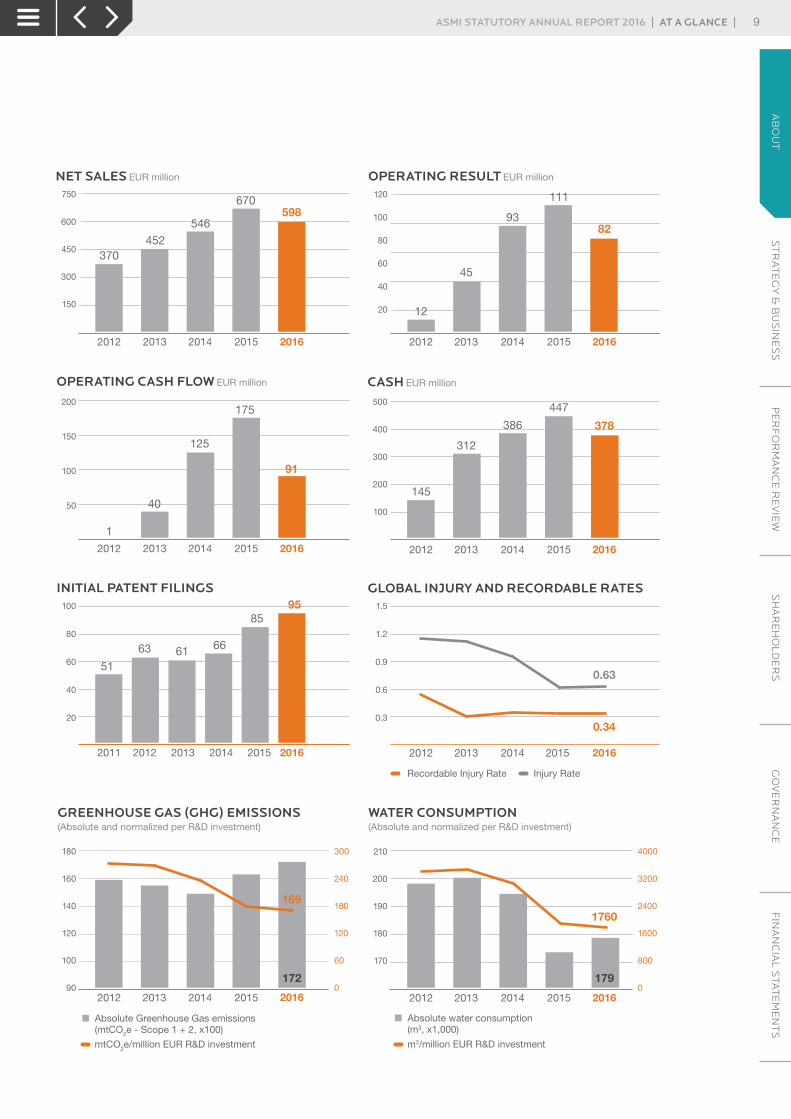
INITIAL PATENT FILINGS
61 6663
51
1760
9585
0
150
300
450
600
750
0
20
40
60
80
100
120
370452
598670
1
40
125
91
175
145
12
45
9382
111
378
447
312
546
386
20132012 2014 2015
20132012 2014 2015 20132012 2014 2015 2016
20132012 2014 2015 2016
20132012 2014 2015 2016
20132012 2014 2015 20132012 2014 2015 2016
180
160
140
120
100
90
300
240
180
120
60
0
210
200
190
180
170
4000
3200
2400
1600
800
0
120
100
80
60
40
20
750
600
450
300
150
200
150
100
50
500
400
300
200
100
100
80
60
40
20
1.5
1.2
0.9
0.6
0.3
169
179172
2016
2016
2016
0.34
0.63
GREENHOUSE GAS (GHG) EMISSIONS(Absolute and normalized per R&D investment)
WATER CONSUMPTION(Absolute and normalized per R&D investment)
OPERATING RESULT EUR million
CASH EUR million
NET SALES EUR million
OPERATING CASH FLOW EUR million
Global Injury and RECORDABLE RatEs
Absolute Greenhouse Gas emissions(mtCO2e - Scope 1 + 2, x100)
Absolute water consumption(m3, x1,000)
m3/million EUR R&D investmentmtCO2e/million EUR R&D investment
Injury RateRecordable Injury Rate
20132011 2012 2014 2015 2016
ST
RA
TE
GY
& B
US
INE
SS
PE
RF
OR
MA
NC
E R
EV
IEW
SH
AR
EH
OL
DE
RS
GO
VE
RN
AN
CE
FIN
AN
CIA
L S
TAT
EM
EN
TS
ASMI STATUTORY ANNUAL REPORT 2016 | AT A gLANcE | 9A
BO
UT

KEY FIGURES
EUR MILLION
(millions, except per share data and employees) 2012 2013 3) 2014 2015 2016
Operations:
Net sales
Front-end 370 452 546 670 598
Back-end 1,048 160 – – –
Result from operations:
Front-end 12 45 93 111 82
Back-end 87 (4) – – –
Net earnings (loss) from continuing operations 40 (343) 138 157 135
Net earnings (loss) from discontinued operations 1,405 3 – –
NET EARNINGS (LOSS) FROM OPERATIONS 40 1,062 141 157 135
Balance sheet:
Net working capital 1) 477 109 108 114 157
Total assets 1,500 1,608 1,889 2,076 2,148
Net cash 2) 230 312 386 447 378
Backlog:
Front-end 92 115 176 128 157
Back-end 198 – – – –
Number of staff:
Employees
Front-end 1,636 1,502 1,635 1,597 1,670
Back-end 15,768 – – – –
Per share data:
Net earnings (loss) on operations per share
Basic net earnings (loss) 0.28 16.81 2.23 2.53 2.23
Diluted net earnings (loss) 0.28 16.55 2.20 2.50 2.21
Weighted average number of shares used in
computing per share amounts (in thousands):
Basic 56,108 63,202 63,558 62,114 60,616
Diluted 56,767 64,196 64,707 62,928 61,253
1 Net working capital includes accounts receivable, inventories, other current assets, accounts payable, provision for warranty and accrued expenses and other.
2 Net cash includes cash and cash equivalents less long-term debt and notes payable to banks.3 ASMPT (Back-end) was deconsolidated as from March 15, 2013.
ST
RA
TE
GY
& B
US
INE
SS
PE
RF
OR
MA
NC
E R
EV
IEW
SH
AR
EH
OL
DE
RS
GO
VE
RN
AN
CE
FIN
AN
CIA
L S
TAT
EM
EN
TS
ASMI STATUTORY ANNUAL REPORT 2016 | AT A GLANCE | 10A
BO
UT
LETTER TO SHAREHOLDERS
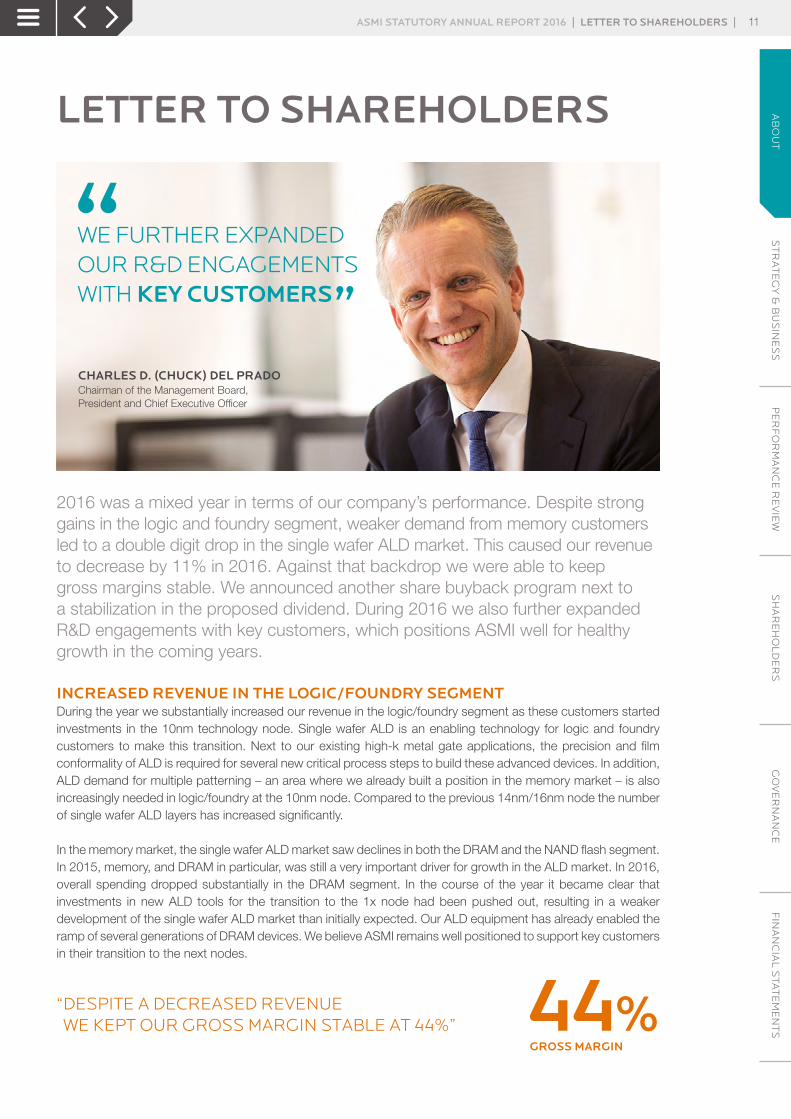
2016 was a mixed year in terms of our company’s performance. Despite strong gains in the logic and foundry segment, weaker demand from memory customers led to a double digit drop in the single wafer ALD market. This caused our revenue to decrease by 11% in 2016. Against that backdrop we were able to keep gross margins stable. We announced another share buyback program next to a stabilization in the proposed dividend. During 2016 we also further expanded R&D engagements with key customers, which positions ASMI well for healthy growth in the coming years.
INCREASED REVENUE IN THE LOGIC/FOUNDRY SEGMENTDuring the year we substantially increased our revenue in the logic/foundry segment as these customers started investments in the 10nm technology node. Single wafer ALD is an enabling technology for logic and foundry customers to make this transition. Next to our existing high-k metal gate applications, the precision and film conformality of ALD is required for several new critical process steps to build these advanced devices. In addition, ALD demand for multiple patterning – an area where we already built a position in the memory market – is also increasingly needed in logic/foundry at the 10nm node. Compared to the previous 14nm/16nm node the number of single wafer ALD layers has increased significantly.
In the memory market, the single wafer ALD market saw declines in both the DRAM and the NAND flash segment. In 2015, memory, and DRAM in particular, was still a very important driver for growth in the ALD market. In 2016, overall spending dropped substantially in the DRAM segment. In the course of the year it became clear that investments in new ALD tools for the transition to the 1x node had been pushed out, resulting in a weaker development of the single wafer ALD market than initially expected. Our ALD equipment has already enabled the ramp of several generations of DRAM devices. We believe ASMI remains well positioned to support key customers in their transition to the next nodes.
“ DESPITE A DECREASED REVENUE WE KEPT OUR GROSS MARGIN STABLE AT 44%”
44%
gross margin
CHARLES D. (CHUCK) DEL PRADOChairman of the Management Board,President and Chief Executive Officer
WE FURTHER EXPANDEDOUR R&D ENGAGEMENTSWITH KEY CUSTOMERS
ST
RA
TE
GY
& B
US
INE
SS
PE
RF
OR
MA
NC
E R
EV
IEW
SH
AR
EH
OL
DE
RS
GO
VE
RN
AN
CE
FIN
AN
CIA
L S
TAT
EM
EN
TS
ASMI STATUTORY ANNUAL REPORT 2016 | LETTER TO SHAREHOLDERS | 11A
BO
UT

“ OUR REVENUE IN THE FOUNDRY SEGMENT GREW SIGNIFICANTLY IN 2016”
As far as the NAND flash segment is concerned, 2016 was, as expected, a transition year for the ALD market. The mix of spending shifted almost completely from planar NAND to 3D NAND in the course of the year. In planar NAND we had a strong position with ALD for multiple patterning, which is, however, not an important requirement in 3D NAND. This meant that ALD demand for this application, which was still a healthy driver for our business in 2015, largely disappeared in 2016. At the same time, the need for new, non-patterning, single wafer ALD applications has so far been limited in this phase of the 3D NAND transition. As customers transition to more complex ‘higher stack’ devices we believe that single wafer ALD demand is increasing step by step. In the course of 2016 we booked our first orders for high volume manufacturing from a number of 3D NAND customers. As these customers ramp production we expect a growing contribution from 3D NAND, starting in 2017.
ALD MARKET BELIEVED TO RECOVER IN 2017The weaker development of the ALD market in 2016 follows on three consecutive years in which we grew revenue by more than 20% annually, as ALD moved into the mainstream of leading-edge semiconductor manufacturing. We believe the structural prospects for the single wafer ALD market in the coming years remain solid and we believe growth to resume again in 2017.
The broader wafer fab equipment market had a solid year with an estimated 10% year-over-year increase. For the market as a whole increases in logic/foundry and particularly 3D NAND offset declines in DRAM and planar NAND. The difference with the weaker development in the ALD market is explained by 3D NAND spending, which strongly boosted wafer fab equipment spending but was not yet a strong driver for the single wafer ALD market.
Despite the weaker revenue development we strengthened our company’s positioning in a number of strategic areas in 2016. We substantially expanded our presence in the foundry segment where we grew our revenue significantly from 2015 to 2016. In 3D NAND, we booked orders for high volume manufacturing for multiple new applications with a number of customers. We continue our strong focus to broaden our participation in the 3D NAND market. We expect these efforts to become more visible in our results in 2017.
Our other product lines, epitaxy, vertical furnace and PECVD, continued to have a decent contribution to the bottom line. In the past year, we have increased our R&D efforts in selected parts of these activities, which we expect will create growth opportunities in the coming year.
CONTINUED INVESTMENT IN STRATEGIC FOCUS AREASAs far as our operational performance is concerned, in 2016 we continued to invest in strategic focus areas which are contributing to the structural maturity of the company. In 2016 we executed well on key operational improvement projects, including the development and implementation of leading-edge enterprise systems to further support more effective and efficient product development and product delivery. Our overall progress in operational excellence is also recognized by our customers and positions us well to continue to compete effectively in the future.
One of the highlights during the year was Intel’s prestigious Preferred Quality Supplier (PQS) award which we were awarded, for the first time, in March of 2016. And in February 2017, we received as one of five equipment suppliers a Supplier Excellence award from TSMC for the innovation, performance and support of ASMI’s ALD equipment and technology during 2016.
ST
RA
TE
GY
& B
US
INE
SS
PE
RF
OR
MA
NC
E R
EV
IEW
SH
AR
EH
OL
DE
RS
GO
VE
RN
AN
CE
FIN
AN
CIA
L S
TAT
EM
EN
TS
ASMI STATUTORY ANNUAL REPORT 2016 | LETTER TO ShAREhOLDERS | 12A
BO
UT

FINANCIAL PERFORMANCEThe drop in the ALD market in 2016 caused our revenue to fall by 11%. We were able to keep gross margins stable at 44%, thanks to the measures taken in the last several years to increase the efficiency and flexibility of manufacturing and supply chain operations. The continued strong balance sheet and positive cash flow generation allowed our company to return again more cash to its shareholders. In October 2016, we announced a new share buyback program, the third consecutive program in the last three years. With the publication of our fourth quarter results we announced an increase in this program from €50 to €100 million. We will propose to the Annual General Meeting of Shareholders 2017 an ordinary dividend of €0.70 per share, which is stable compared to the dividend paid in 2016.
ARTHUR DEL PRADOSadly, 2016 was also the year that our company lost its founder and former CEO, Arthur del Prado, who passed away last September. I would like to thank our shareholders and other stakeholders for the many messages of support we received. Arthur’s strategic vision and steadfast focus on the long-term laid the foundation not only for the growth of ASMI, but of the entire European semiconductor equipment manufacturing sector. The best way we can remember Arthur is to continue the great work that he started.
CORPORATE RESPONSIBILITY This year marks the third year that we are releasing a Corporate responsibility (CR) report with this Annual report. Corporate responsibility continues to strengthen across ASMI and our value chain, and it’s recognized by our stakeholders. Our Transparency Benchmark Evaluation score (per the Dutch Ministry of Economic Affairs), which measures transparency in corporate social reporting, more than doubled from the previous year. With respect to water conservation we commenced with the construction of a water reuse plant at our Phoenix facility. This is a big step and will contribute to our sustainability. These are only a few examples of how we continue to strengthen and grow Corporate responsibility at ASMI.
ASMPTIn 2016, our 39% shareholding in ASMPT contributed solidly to our net earnings. Normalized result from investments, which includes the contribution from ASMPT, increased strongly by 52% to €68 million. ASMPT’s revenue rebounded by 10% in 2016. Apart from a recovery in the overall Back-end market, ASMPT’s growth was supported by strong developments in specific market segments such as equipment for CMOS image sensors and LED.
We believe the financial results reflect the success of a number of important strategic steps taken over the last few years. Importantly, the company entered new markets which enlarged its addressable market while offering potential for synergies with the existing activities. In Advanced Packaging ASMPT has built a solid and extensive product portfolio. In addition, profitability of both the semiconductor Back-end and SMT activities has markedly improved in the recent years.
“ RECEIVING INTEL’S PRESTIGIOUS PREFERRED QUALITY SUPPLIER AWARD WAS ONE OF THE HIGHLIGHTS THIS YEAR”
ST
RA
TE
GY
& B
US
INE
SS
PE
RF
OR
MA
NC
E R
EV
IEW
SH
AR
EH
OL
DE
RS
GO
VE
RN
AN
CE
FIN
AN
CIA
L S
TAT
EM
EN
TS
ASMI STATUTORY ANNUAL REPORT 2016 | LETTER TO SHAREHOLDERS | 13A
BO
UT
“ WE RECEIVED A SUPPLIER EXCELLENCE AWARD FROM TSMC FOR THE INNOVATION, PERFORMANCE AND SUPPORT OF ASMI’S ALD EQUIPMENT AND TECHNOLOGY DURING 2016.”
OUTLOOKOur industry has entered 2017 in good shape. Market watchers such as VLSI and Gartner expect again a mid-to-high single digit increase in Wafer Fab Equipment spending, while the increase in semiconductor end market is expected to accelerate from 2% growth in 2016 to 6% in 2017. Longer term, the outlook for our industry also looks favorable.
As our customers transition to the next technology nodes, the continuous improvements in speed, power efficiency and cost of semiconductor devices support massive increases in computing power, connectivity, data processing and storage capacity. This, in turn, helps our customers’ customers to develop new and potentially disruptive applications such as in the Internet of Things and Artificial Intelligence that will impact our everyday lives and the society at large.
The transition to the next nodes – Moore’s Law – is increasingly enabled by the introduction of new materials and complex chip architectures such as advanced FinFET technology. This plays to the strengths of ALD as more highly precise and conformal film deposition is required to manufacture the leading-edge semiconductor devices. As ALD will be used more and more for the critical process steps in leading-edge semiconductor manufacturing we expect the single wafer ALD market to grow as a percentage of the total deposition market. As a leader in ALD, our company continues to be well positioned.
We believe the single wafer ALD market will show a clear recovery in 2017. In logic/foundry ALD demand is likely to be supported by continued spending on the 10nm node and some early investments in 7nm. In NAND, we foresee a more meaningful contribution as single wafer ALD is used for more layers. In the DRAM segment demand for new ALD tools is believed to improve in the course of 2017, although overall spending is likely to remain relatively moderate compared to the spending levels in 2014/2015.
We would like to thank our employees for their continued dedication and hard work, our customers for their trust, and our shareholders for their continued support. ASMI remains committed to executing on the strategic plans that we believe will further create sustainable value for all our stakeholders.
March 9, 2017
Charles D. (Chuck) del Prado President and Chief Executive Officer
ST
RA
TE
GY
& B
US
INE
SS
PE
RF
OR
MA
NC
E R
EV
IEW
SH
AR
EH
OL
DE
RS
GO
VE
RN
AN
CE
FIN
AN
CIA
L S
TAT
EM
EN
TS
ASMI STATUTORY ANNUAL REPORT 2016 | LETTER TO SHAREHOLDERS | 14A
BO
UT
CORPORATE RESPONSIBILITYWe are a global supplier of semiconductor wafer processing equipment and process solutions, primarily for the semiconductor industry. Our customers include the world’s top semiconductor device manufacturers. Since 1968 we have helped the industry to create smaller, cheaper, and more powerful microchips. Our focus is on continuing to help our customers achieve their technology roadmap, by expanding our broad portfolio of innovative technologies and products.
Our corporate responsibility outlook is supported by our vision of ZERO HARM! This means we strive to (i) prevent all injuries to our employees and our customers’ employees, (ii) reduce our environmental impact, and (iii) make positive contributions to society. We help create value for society through our technological innovations, and we try to meet the expectations of our stakeholders by engaging with them on the issues that matter to them.
We believe that our focus on sustainability not only creates value for our company, our stakeholders, and society, but also strengthens our brand and creates stronger relationships with our customers, employees, and investors. These strengthened relationships further drive our ability to innovate and bolster our product portfolio.
PRODUCT STEWARDSHIP AND PRODUCT LIFE CYCLE MANAGEMENTFocusing on product stewardship and product life cycle (PLC) management involves taking responsibility to minimize the product’s environmental impact along its entire life cycle.
Ultimately, this approach enables our customers to be more efficient and productive. It also means ensuring that our products are safe to use throughout their life cycle.
To achieve this, we rely on our manufacturing, management controls, and robust product and process design practices to produce high quality, reliable and innovative products. We extend these processes to our supply chain partners, and work closely to develop and qualify them as strong partners.
To reduce the environmental impact during the manufacturing phase of our products, we look for ways to conserve energy, conserve water, reduce air emissions, and apply strict control and management of the use of chemicals and hazardous materials with our environmental management system. You can read more about how we manage the environmental impact of our product manufacturing in the Environment section of our Corporate responsibility report.
To further improve the safety of our products, in 2016 we reevaluated the way we design for safety throughout our product life cycle. As a consequence, we updated our Global Product Safety policy. This policy strengthens the requirements, processes, and roles and responsibilities that support ZERO HARM! in product safety.
Our product safety requirements are established at the start of product development. The requirements include EHS standards appropriate to our industry. The designs are continually assessed through design reviews and safety risk assessments to verify that safety requirements are being met. Independent third-party validations are done both at a sub-component and system level, at various product maturity levels. This helps ensure that our products are safe to operate and maintain, both at our own locations as well as those of our customers. You can read more about our product stewardship and safety in the Innovation and Product Stewardship section of our Corporate responsibility report.
ST
RA
TE
GY
& B
US
INE
SS
PE
RF
OR
MA
NC
E R
EV
IEW
SH
AR
EH
OL
DE
RS
GO
VE
RN
AN
CE
FIN
AN
CIA
L S
TAT
EM
EN
TS
ASMI STATUTORY ANNUAL REPORT 2016 | CORPORATE RESPONSIBILITY | 15A
BO
UT

OUR COMMITMENT AND APPROACH TO CRAs an integral member of the semiconductor industry value chain, many of our customers are members of the Electronic Industry Citizenship Coalition (EICC). We have adopted the Electronics Industry Citizenship Coalition (EICC) Code of Conduct, which is a set of standards on social, environmental, and ethical issues in the electronics industry supply chain. The EICC code references and principally follows multiple international expectations and standards including the OECD Guidelines for Multinational Enterprises, the Universal Declaration of Human Rights, the ILO International Labor Standards, and the International Organization for Standardization (ISO). Differences between the EICC code of conduct and the OECD Guidelines include business to consumer aspects which are not relevant for our business.
We have adopted the EICC risk assessment and framework for continuous improvement, and since 2012 have completed the self-assessment questionnaires (SAQ) for each of our engineering and manufacturing sites. In 2016 all our sites achieved a ‘low risk’ ranking, based on the EICC risk assessment criteria. This program is monitored by our governance body, the Global EICC Committee, and the results are reported to our senior management team several times every year.
As the EICC Code of Conduct is an industry standard, we have adopted it as our Supplier Code of Conduct, and have implemented a supporting risk assessment process with our critical suppliers.
You can read more about our Corporate responsibility commitment and approach in the Integrated Corporate responsibility strategy section of our Corporate responsibility report.
TAX PRINCIPLEPaying tax is one of our contributions to society and a part of our value creation business model. Our income is reported in the countries where value is created. We do not use artificial tax structures solely aimed at tax avoidance. Taxes are determined and paid in accordance with all relevant rules and regulations in the countries in which we operate. We aim to follow both the letter as well as the spirit of the law.
We apply the arm’s length principle to determine transfer prices in accordance with domestic and international rules and standards, such as the OECD (Organization for Economic Cooperation and Development) guidelines for Multinational Enterprises. Our disclosures are made in accordance with the relevant local and/or international regulations.
Our goal is to seek an open and constructive dialog with the tax authorities in the countries where we operate, and we aim to disclose all relevant facts and circumstances. We believe that this will enhance certainty on our respective tax position in view of the applicable tax rules and regulations.
LOOKING AHEADLooking ahead, we will continue to standardize and unify our socially responsible business practices, and integrate them into our business strategies. Specifically, we will focus on the following areas and strategies to strengthen our overall corporate responsibility performance: › Communicate and interact with our stakeholders and use their feedback as input to design an integrated strategy, and to help manage and measure our performance and product stewardship;
› Continue the progress we made in 2016 toward our 2020 Environmental Objectives; › Recruit and retain talent in technology development to maintain our technology leadership; › Strengthen our supply chain governance and assurance.
ST
RA
TE
GY
& B
US
INE
SS
PE
RF
OR
MA
NC
E R
EV
IEW
SH
AR
EH
OL
DE
RS
GO
VE
RN
AN
CE
FIN
AN
CIA
L S
TAT
EM
EN
TS
ASMI STATUTORY ANNUAL REPORT 2016 | CORPORATE RESPONSIBILITY | 16A
BO
UT

CHIP MAKING
Semiconductors are vital to modern life. From the way we communicate and travel, to the cities we inhabit; from our dishwashers, microwaves and TVs, to our smartphones, PCs, and tablets, the chips we take for granted drive the devices we have come to rely on. Their use has revolutionized how we live, work, and play, enabling us to understand, create, and share information faster and more easily. Today, we expect devices to become smaller and more powerful every year, without fully understanding how.
SEMICONDUCTOR DEVICE MANUFACTURINGThe process of manufacturing semiconductor devices on a wafer can be divided into three distinct parts: › wafer manufacturing; › transistor formation (known as Front-end of the line (FEOL) processing); › interconnect formation (known as Back-end of the line (BEOL) processing).
We develop, manufacture and sell equipment, and provide services used by semiconductor device manufacturers, at each stage.
WAFER PROCESSINGIn the wafer manufacturing process, a large single crystal of very pure silicon is grown from molten silicon. The crystal is then sliced into a large number of thin slices, or wafers, of single crystalline silicon. These slices are polished to an atomic-level flatness before the next steps are executed. For advanced applications, some layers are deposited on the wafer for later use, by either epitaxy or diffusion/oxidation. Epitaxial wafers are even flatter and contain fewer defects at the surface than polished wafers.
FROM WAFER TO DEVICESDuring FEOL and BEOL wafer processing, multiple thin films of either electrically insulating material, also called dielectrics, or conductive material are modified, grown, or deposited on a silicon wafer. This involves the following steps: › First, several material processing cycles are used in the FEOL to build the basic transistor and other components such as capacitors and resistors;
› Second, several processing cycles are used in the BEOL to electrically connect the large number of transistors and components, and to build additional passive components such as capacitors, inductors, and resistors. Patterning of deposited layers with lithography and etching (described below) creates the transistors, passive components, and connecting wires, which together make up the integrated circuit. Each integrated circuit is a single chip or a die on the wafer.
A finished wafer may contain several dozen to several thousand individual dies. Wafer processing is performed either one wafer at a time in single wafer processing systems or many wafers at a time in batch processing systems. Multiple deposition, and patterning processes are performed on the same wafer to complete a device.
PROCESS STEPSThe number and precise order of the process steps varies depending upon the complexity and design of the integrated circuit. The performance of the circuit is determined in part by the various electrical characteristics of the materials used in the layers of the circuit and the wafer. Simple circuits may have as few as ten layers, while complex circuits may have more than one hundred layers. The device manufacturing process is capital-intensive, requiring multiple units of several different production systems. Many different but complementary methods are used to modify, grow, or deposit materials on the wafers. The device manufacturing process on the wafer is complete when all of the layers have been deposited and patterned on the wafer.
ST
RA
TE
GY
& B
US
INE
SS
PE
RF
OR
MA
NC
E R
EV
IEW
SH
AR
EH
OL
DE
RS
GO
VE
RN
AN
CE
FIN
AN
CIA
L S
TAT
EM
EN
TS
ASMI STATUTORY ANNUAL REPORT 2016 | CHIP MAKING | 17A
BO
UT

CLEANROOMSThe introduction of even trace levels of foreign particles or material can make a circuit, or even an entire wafer, unusable. To reduce the level of foreign particles or material, wafer processing is performed in cleanrooms with ultra-low particle and contamination levels. The correct electrical functioning of the integrated circuits on each die is confirmed by probing. Non-functioning circuits are marked so they can later be discarded before money is spent on packaging the chip. The yield – or the percentage of known good die for a mature process – is usually well above 95%. For a process in development, the yield can be substantially smaller, and it is important to improve this as quickly as possible as it determines, to a large extent, the profitability of our customers.
FRONT-END AND BACK-END PROCESSINGThere are two basic segments of chip manufacturing to complete a final packaged chip product. We refer to them as wafer processing, and assembly and packaging. We are an equipment supplier for the Front-end part: wafer processing.
During wafer processing – the start of the manufacturing line – manufacturers process wafers made of silicon, on which the electrical components are formed. During assembly and packaging – the Back-end of the manufacturing line – the wafers are divided up into individual chips and tested before being assembled and packaged.
CHIP MAKING PROCESS
1
4
7 8 9
2
5
3
6
1. FROM SAND TO PURE SILICONIt all starts with one simple, common substance – sand. The silicon found in sand is in the form of silicon dioxide. To make chips, manufacturers need pure silicon, which means the first step in the process is to separate the silicon from the oxygen molecules. The pure silicon needed to make silicon chips can have only one foreign atom for every billion silicon atoms. It must also be in monocrystalline form. The way atoms are organized in this form of silicon is essential to some of the later processes.
ST
RA
TE
GY
& B
US
INE
SS
PE
RF
OR
MA
NC
E R
EV
IEW
SH
AR
EH
OL
DE
RS
GO
VE
RN
AN
CE
FIN
AN
CIA
L S
TAT
EM
EN
TS
ASMI STATUTORY ANNUAL REPORT 2016 | CHIP MAKING | 18A
BO
UT

2. WAFER BLANKSThe silicon is then extracted, or pulled, from liquid silicon in the form of long cylindrical ingots at around 1,400 degrees centigrade.
3. WAFERS ARE CUTWafers are then cut from the ingots before being polished to produce a smooth surface. They are then sent to chip manufacturers for processing. The following steps in wafer processing are then repeated many times to create the finished wafer containing chips.
4. COATING A WAFERThe wafer is put into a high-temperature furnace and exposed to oxygen, forming a layer of silicon dioxide on the surface. Then chemical vapor deposition (CVD) is used to add a layer or film of nitride.
5. CREATING MASKSOnce the circuit layout of the chips has been designed, glass plates or masks are created which help copy the design onto the surface of the wafer. Several masks are used in sequence to add more complexity to the chips.
6. ADDING A PATTERNNow comes the time to begin creating the design on the surface of the wafer using the masks as a guide. Photolithography, a type of optical printing, is used. The wafer is first coated with photoresist, which changes when exposed to ultraviolet (UV) light. The mask is placed above the wafer and precisely aligned with it. UV light shining above the mask reacts with the exposed parts of the photoresist, creating a pattern. The wafer is covered with a developing solution to develop these patterns, which are then etched, leaving the parts not exposed to UV light intact. The surface now contains ‘trenches’ that run across the surface.
DEPOSITIONA dielectric or insulating film is deposited in the trenches by one of a number of deposition technologies such as CVD or ALD or PEALD. Gates are formed between the trenches, creating parts of the many millions of transistors that may be created on a single chip. Gates can be switched to allow charge carriers, such as electrons, to flow or to prevent them from flowing. Contacts are formed by each gate to create a source and drain. Ion implantation is used to implant special elements into the wafer for the source and drain. The charge carrier enters a gate channel at the source contact and exits at the drain contact.
CONNECTOnce the basic chip components have been created, they need to be connected. The same processes of lithography, etching, and deposition, are used to form trenches filled with metal connections. These connections between components are created not just on one level, but on many. The finished wafer will contain up to several thousand individual chips in a space of 200mm to 300mm, and some chips can hold billions of transistors.
7. WAFERS SEPARATED INTO INDIVIDUAL CHIPSOnce wafer processing has been completed, the finished wafers are transported to another plant for cutting, assembly, and packaging. The individual wafers are cut into separate chips.
8. LEAD FRAMESThe chips are then placed in a lead frame, forming a protective housing.
9. TESTING PACKINGEach chip is then tested before being packaged to be sent for placement on circuit boards.
ST
RA
TE
GY
& B
US
INE
SS
PE
RF
OR
MA
NC
E R
EV
IEW
SH
AR
EH
OL
DE
RS
GO
VE
RN
AN
CE
FIN
AN
CIA
L S
TAT
EM
EN
TS
ASMI STATUTORY ANNUAL REPORT 2016 | CHIP MAKING | 19A
BO
UT
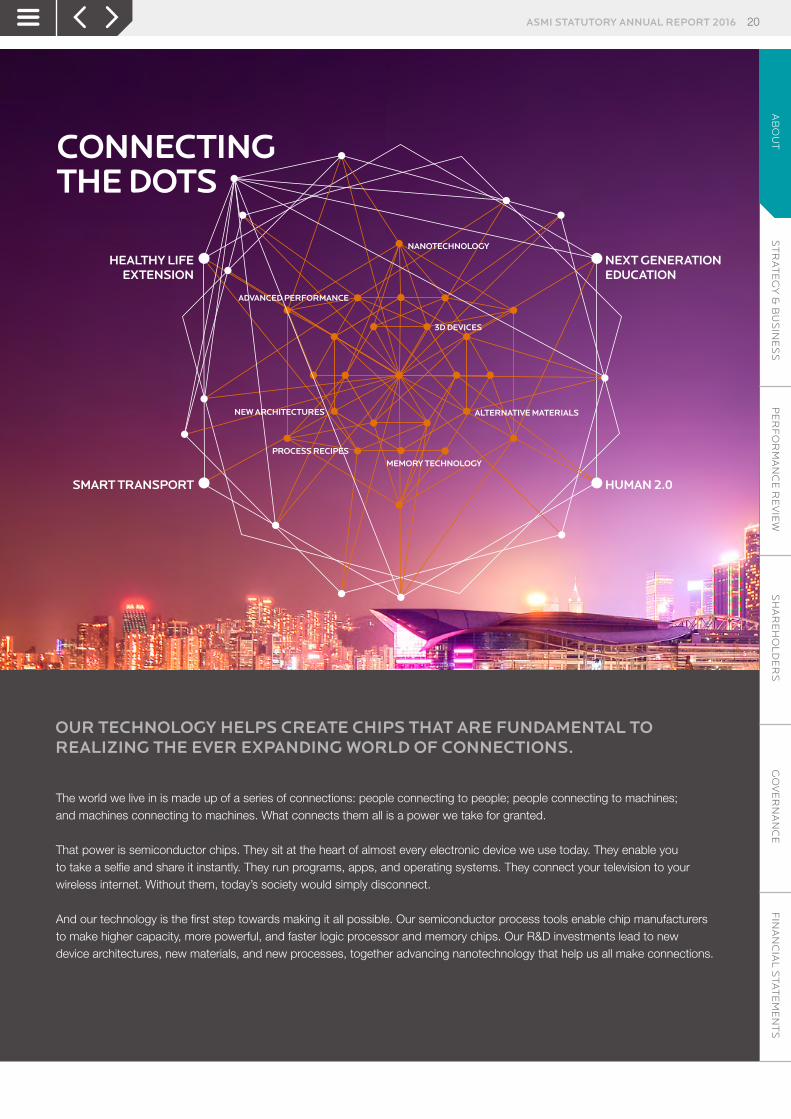
OUR TECHNOLOGY HELPS CREATE CHIPS THAT ARE FUNDAMENTAL TO REALIZING THE EVER EXPANDING WORLD OF CONNECTIONS.
The world we live in is made up of a series of connections: people connecting to people; people connecting to machines; and machines connecting to machines. What connects them all is a power we take for granted.
That power is semiconductor chips. They sit at the heart of almost every electronic device we use today. They enable you to take a selfie and share it instantly. They run programs, apps, and operating systems. They connect your television to your wireless internet. Without them, today’s society would simply disconnect.
And our technology is the first step towards making it all possible. Our semiconductor process tools enable chip manufacturers to make higher capacity, more powerful, and faster logic processor and memory chips. Our R&D investments lead to new device architectures, new materials, and new processes, together advancing nanotechnology that help us all make connections.
CONNECTINGTHE DOTS
NEXT GENERATIONEDUCATION
NANOTECHNOLOGY
3D DEVICES
NEW ARCHITECTURES ALTERNATIVE MATERIALS
MEMORY TECHNOLOGY
ADVANCED PERFORMANCE
PROCESS RECIPES
HEALTHY LIFEEXTENSION
HUMAN 2.0SMART TRANSPORT
Connecting the dotsConnecting the dots
AB
OU
TS
TR
AT
EG
Y &
BU
SIN
ES
SP
ER
FO
RM
AN
CE
RE
VIE
WS
HA
RE
HO
LD
ER
SG
OV
ER
NA
NC
EF
INA
NC
IAL
STA
TE
ME
NT
S20ASMI STATUTORY ANNUAL REPORT 2016
AB
OU
T

Cloud computing. Accessing your data or programs by connecting your computer to the Internet, wherever you are. Most of us recognize the convenience it brings. And it’s a trend that is growing fast.
With people increasingly using integrated mobile devices to operate and manage their lives, working from a fixed office is no longer always necessary. Vast server farms and data storage centers located around the world make connecting to your virtual office a reality, no matter where you are. But to work, cloud computing relies on the technology used to produce high performance, high capacity wireless networking chips.
Our equipment and process technology is a vital link, translating the underlying physics and chemistry into the processes needed to deposit the complex layers in precise locations. Our atomic layer deposition technology is critical for chip makers to produce high density devices using 3D memory and FinFET transistors. ASMI and cloud computing: it’s all connected.
THE INTEGRATED EXPERIENCE
CLOUD COMPUTING
CONNECTINGTHE DOTS
AB
OU
TS
TR
AT
EG
Y &
BU
SIN
ES
SP
ER
FO
RM
AN
CE
RE
VIE
WS
HA
RE
HO
LD
ER
SG
OV
ER
NA
NC
EF
INA
NC
IAL
STA
TE
ME
NT
S21ASMI STATUTORY ANNUAL REPORT 2016
AB
OU
T

The car has always been a symbol of independence and autonomy, enabling us to connect with each other across countries and across borders. But they are changing. Today’s cars are miracles of computing power and sensors. They produce vast amounts of data, helping to make them safer, more efficient, more convenient, and more capable. And as cars become more connected they will increasingly communicate with one another, improving road safety, driver awareness, and reducing their environmental impact.
Driving this forward is microprocessor technology. It’s also our innovations that are used to deposit the extremely precise, thin film layers that enable advanced solutions, such as double patterning technology, which make it possible to produce higher density memory chips. More bits per chip and faster data access time helps connected cars more quickly store and process data. We are working on the future, now.
DRIVEN BY BIG DATA
SMART CARS
CONNECTINGTHE DOTS
AB
OU
TS
TR
AT
EG
Y &
BU
SIN
ES
SP
ER
FO
RM
AN
CE
RE
VIE
WS
HA
RE
HO
LD
ER
SG
OV
ER
NA
NC
EF
INA
NC
IAL
STA
TE
ME
NT
S22ASMI STATUTORY ANNUAL REPORT 2016
AB
OU
T

As the devices we use every day become embedded with sensors and gain the ability to connect, our lives will change. We will enjoy greater functionality, efficiency, and freedom. Our homes will communicate with us and the outside world, helping fill the fridge before it’s empty or enabling us to conserve energy and cut costs.Known as the Internet of Things, this vast collection of connected devices will enable us to automate many of our daily tasks, increasing their uniformity and quality and saving us valuable time.
And the driver behind the Internet of Things? The ongoing advances being made in chip technology. And it’s also our thin-film deposition systems that are used to manufacture the complex sensors and wireless network controllers that make much of tomorrow’s machine-to-machine interaction possible.
THE FUTURE OF SMART LIVING
INTERNET OF THINGS
CONNECTINGTHE DOTS
AB
OU
TS
TR
AT
EG
Y &
BU
SIN
ES
SP
ER
FO
RM
AN
CE
RE
VIE
WS
HA
RE
HO
LD
ER
SG
OV
ER
NA
NC
EF
INA
NC
IAL
STA
TE
ME
NT
S23ASMI STATUTORY ANNUAL REPORT 2016
AB
OU
T

CONNECTINGTHE DOTS
Imagine a school where the lessons are optimized for each student, as the system ‘learns’ what the students need to focus on. Or your doctor was automatically notified if your blood pressure increased to an unsafe level. To make education and health care more effective, we will rely on artificial intelligence to connect the dots in the treasure trove of big data we will produce. But to make that possible, we will need computers powerful enough to make cognitive decisions based on connected inputs, observations and results.
Our deposition technology is used to create transistors at the world’s most advanced chip factories, enabling them to manufacture microprocessors containing billions of transistors, each only a few dozen atoms across. And through our ALD technology, transistors are now being built using a 3D vertical architecture, meaning even more transistors on each powerful chip.
NEXT LEVEL LEARNING SYSTEMS
ARTIFICIAL INTELLIGENCE
AB
OU
TS
TR
AT
EG
Y &
BU
SIN
ES
SP
ER
FO
RM
AN
CE
RE
VIE
WS
HA
RE
HO
LD
ER
SG
OV
ER
NA
NC
EF
INA
NC
IAL
STA
TE
ME
NT
S24ASMI STATUTORY ANNUAL REPORT 2016
AB
OU
T
STRATEGY & BUSINESS
OUR STRATEGY>>Mission, vision, strategy and focus areas
>>Value creation
OUR INNOVATION AT WORK>>Collaboration and innovation at work
>>Markets & products
>>Research & development
>>Breakthrough technologies
>>People
>>Patents and trademarks
AB
OU
TS
TR
AT
EG
Y &
BU
SIN
ES
SP
ER
FO
RM
AN
CE
RE
VIE
WS
HA
RE
HO
LD
ER
SG
OV
ER
NA
NC
EF
INA
NC
IAL
STA
TE
ME
NT
SASMI STATUTORY ANNUAL REPORT 2016 25
ST
RA
TE
GY
& B
US
INE
SS
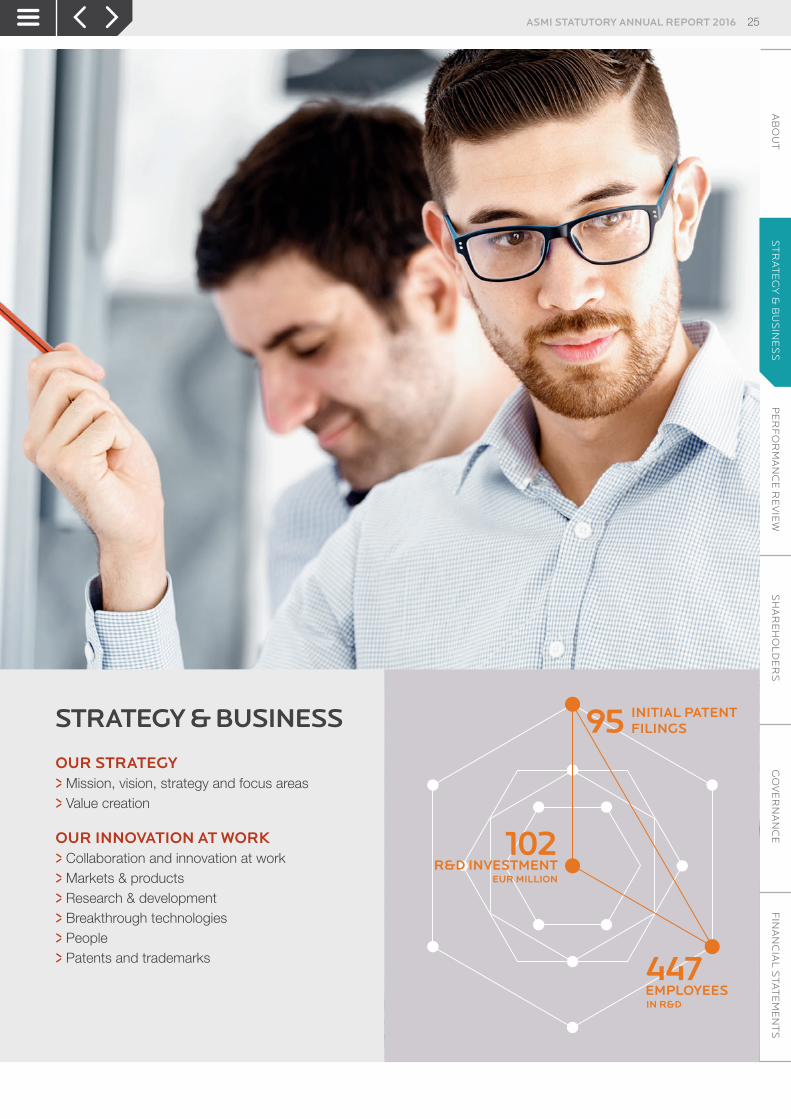
INITIAL PATENT FILINGS95
R&D INVESTMENT102
EUR MILLION
EMPLOYEES447IN R&D
MISSION, VISION, STRATEGY AND FOCUS AREASOur track record as an experienced innovation leader is the result of focusing on key issues and challenges within the semiconductor industry, enabling us to make a difference to our customers, employees, and company stakeholders. While issues may change over time, we will continue to transform the results of our breakthrough technologies into volume manufacturing, benefiting our customers.
MISSIONOur mission is to provide our customers with the most advanced, cost-effective, and reliable products, service, and global support network in the semiconductor industry and beyond. We advance the adoption of our deposition technology platforms by developing new materials and process applications that support our customers’ long-term technology roadmaps.
VISIONWe aim to delight our customers, employees, and shareholders by driving innovation with new technologies and delivering excellence with dependable products. By doing this, we will create new possibilities for everyone to learn, create, and share more of what they love.
STRATEGYOur strategic objective is to realize profitable, sustainable growth by capitalizing on our innovative strength in deposition technologies and our strong relationships with key customers. We act thereby as a responsible citizen.
The key elements of our strategy are:
› INNOVATIVE STRENGTHWe are recognized for our technology leadership. We provide leading thin film deposition technologies that support our customers in staying on the curve of Moore’s Law. Our innovative strength is what differentiates us in the marketplace, creates growth opportunities for our employees, and continues to be the cornerstone of our strategy. Apart from our internal R&D efforts, we are continuously expanding and deepening our strategic cooperation with key customers, suppliers, chemical manufacturers, and research institutes such as imec. Our suppliers manufacture advanced components and assemblies to the tightest of tolerances and are required to adhere to our stringent design specifications, quality systems, and corporate responsibility requirements. This approach enables us to remain innovative and swiftly meet the changing demands of our customers.
› LEADERSHIP IN DEPOSITIONWe create value through our advanced thin film deposition technologies, which help leading semiconductor and technology industry partners to deliver the world of tomorrow through advanced chips. One of these technologies is ALD, which is established as a mainstream technology in high-volume manufacturing, supporting virtually all of the leading customers in the semiconductor industry. As a leader in this space, ALD has turned into a key growth driver for our business. We expect that the trends of continued scaling and evolution towards 3D device structures will further expand the number of applications for ALD. We aim to maintain our leading position in ALD by leveraging on our strong expertise and established customer relationships, and by developing new applications in deposition technologies to support our customers with increasingly complex device node transitions.
OUR STRATEGY
AB
OU
TS
TR
AT
EG
Y &
BU
SIN
ES
SP
ER
FO
RM
AN
CE
RE
VIE
WS
HA
RE
HO
LD
ER
SG
OV
ER
NA
NC
EF
INA
NC
IAL
STA
TE
ME
NT
SASMI STATUTORY ANNUAL REPORT 2016 | MISSION, VISION, STRATEGY AND FOCUS AREAS | 26
ST
RA
TE
GY
& B
US
INE
SS
KEY ELEMENTS
HOW WE WILLDO THIS
THE IMPACT
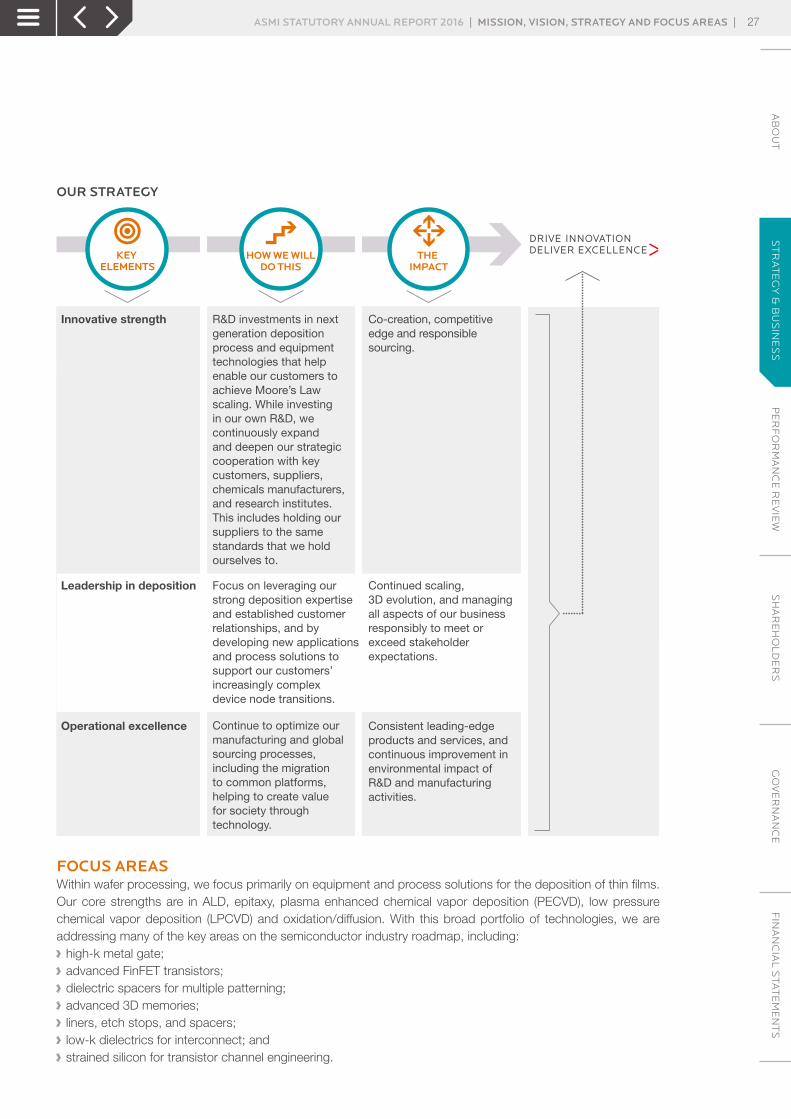
OUR STRATEGY
Continued scaling,3D evolution, and managing all aspects of our business responsibly to meet or exceed stakeholderexpectations.
Focus on leveraging our strong deposition expertise and established customer relationships, and bydeveloping new applications and process solutions to support our customers’ increasingly complexdevice node transitions.
Operational excellence Consistent leading-edge products and services, and continuous improvement in environmental impact of R&D and manufacturing activities.
Continue to optimize our manufacturing and global sourcing processes,including the migrationto common platforms, helping to create valuefor society throughtechnology.
Leadership in deposition
Innovative strength Co-creation, competitive edge and responsible sourcing.
R&D investments in next generation deposition process and equipment technologies that help enable our customers to achieve Moore’s Lawscaling. While investingin our own R&D, wecontinuously expandand deepen our strategiccooperation with key customers, suppliers, chemicals manufacturers, and research institutes. This includes holding our suppliers to the same standards that we hold ourselves to.
FOCUS AREASWithin wafer processing, we focus primarily on equipment and process solutions for the deposition of thin films. Our core strengths are in ALD, epitaxy, plasma enhanced chemical vapor deposition (PECVD), low pressure chemical vapor deposition (LPCVD) and oxidation/diffusion. With this broad portfolio of technologies, we are addressing many of the key areas on the semiconductor industry roadmap, including:
› high-k metal gate; › advanced FinFET transistors; › dielectric spacers for multiple patterning; › advanced 3D memories; › liners, etch stops, and spacers; › low-k dielectrics for interconnect; and › strained silicon for transistor channel engineering.
AB
OU
TS
TR
AT
EG
Y &
BU
SIN
ES
SP
ER
FO
RM
AN
CE
RE
VIE
WS
HA
RE
HO
LD
ER
SG
OV
ER
NA
NC
EF
INA
NC
IAL
STA
TE
ME
NT
SASMI STATUTORY ANNUAL REPORT 2016 | MISSION, VISION, STRATEGY AND FOCUS AREAS | 27
ST
RA
TE
GY
& B
US
INE
SS

Our breakthrough technologies enable the industry to move to smaller line widths and better transistors that use new materials. We focus on serving the top companies that produce logic chips and memory devices, which includes addressing the needs of top foundries. By serving the leading chipmakers, we maintain an understanding of the important requirements of the next generation of device roadmaps, enabling us to develop value-added solutions to the industry’s critical issues. In many cases, new films developed for one device type can be utilized for other device types with relatively limited additional development.
› OPERATIONAL EXCELLENCEWhile technology leadership remains crucial, we have a responsibility to our stakeholders to continue to focus on further improving the effectiveness of our organization and the efficiency of processes. We aim to provide our customers with dependable leading-edge products and services at a consistent quality level, providing the best cost of ownership. To help achieve this, we continue to optimize our manufacturing and global sourcing processes, including the migration to common product platforms. We are working with our suppliers to improve fundamental quality through statistical methods and process controls. Our employees are engaged in an improved product life cycle process and our Product Safety Council is focused on further improving product safety through fundamental design.
In addition to addressing the technology needs of our customers, we also focus on further increasing equipment throughput and equipment reliability, thereby lowering the cost per wafer of our wafer processing systems. Combined with our commitment to quality, we continuously strive to achieve industry-leading productivity. In addition, to enable further efficiencies in our manufacturing process, we exert significant effort on improving the level of standardization in our equipment portfolio by migrating to common platforms, sub-assemblies and components.
AB
OU
TS
TR
AT
EG
Y &
BU
SIN
ES
SP
ER
FO
RM
AN
CE
RE
VIE
WS
HA
RE
HO
LD
ER
SG
OV
ER
NA
NC
EF
INA
NC
IAL
STA
TE
ME
NT
SASMI STATUTORY ANNUAL REPORT 2016 | MISSION, VISION, STRATEGY AND FOCUS AREAS | 28
ST
RA
TE
GY
& B
US
INE
SS
VALUE CREATIONWe create value through our technologies by enabling leading semiconductor and technology industry partners to deliver the world of tomorrow through our innovative processing solutions and equipment. We partner with our customers and stakeholders to develop new materials, processes, and technologies that support their technology roadmaps that shape the world of the Internet of Things, smart cars, artificial intelligence, and cloud computing.
The chip-making process has entered the age of the nanometer, and we are now creating transistors that are only a small number of nanometers in width. But connecting billions of nanoscopic transistors on a single chip requires an astonishing degree of precision and control. As a leading supplier of equipment and process solutions to the semiconductor industry, our technology makes this possible.
GREATER PERFORMANCE, REDUCED ENERGY CONSUMPTIONDelivering excellence through advanced deposition technologies on dependable, cost-effective products enables us to realize the technology roadmaps we co-create with our customers. This leads to electronic devices that deliver ever-greater performance while reducing their energy consumption. Higher performance translates into more processing power, while lower energy requirements means smaller, longer-lasting, more efficient products. This enables our customers to further integrate smart technology into a wider range of their products.
The result is value creation not only for our customers, but for all of our stakeholders. For example, our employees enjoy the challenge of developing cutting-edge technology solutions, and have the opportunity for advancement. Our suppliers benefit from improved quality based on the use of statistical methods employed in our Supplier Process Control program.
10 NANOMETER DEVICESThe industry’s relentless push to follow Moore’s Law and the continuous demand for smaller, faster, and cheaper semiconductor components drives the technology advances in the semiconductor manufacturing process. As the transistors in an integrated circuit become smaller, the cost-per-component decreases. At the same time, the operating speed of the transistor increases. Thus, the minimum size of a single transistor in an integrated circuit is an important parameter.
Today, our customers manufacture semiconductor devices as small as 10 nanometers (one nanometer, or nm, is one billionth of a meter), sometimes in a vertical 3D transistor or FinFET architecture. Our customers are already qualifying and testing new critical processes to generate devices with line widths at or below 7nm. Simultaneously, in our customers’ laboratories and several collaborative research environments, advanced 5nm design rule devices and related materials are being developed. These next-generation technology nodes are increasing the demand for new materials and more complex process integration methods.
In developing faster and smaller devices, our customers’ major technology requirements are:
› introduction of new thin-film materials and device designs needed for continued scaling; › reliable manufacturing of taller and narrower 3D structures in devices; › lithography of ever-smaller feature sizes, now much smaller than the wavelength of visible light; › new manufacturing processes that reduce device variability and increase yield.
AB
OU
TS
TR
AT
EG
Y &
BU
SIN
ES
SP
ER
FO
RM
AN
CE
RE
VIE
WS
HA
RE
HO
LD
ER
SG
OV
ER
NA
NC
EF
INA
NC
IAL
STA
TE
ME
NT
SASMI STATUTORY ANNUAL REPORT 2016 | VALUE CREATION | 29
ST
RA
TE
GY
& B
US
INE
SS
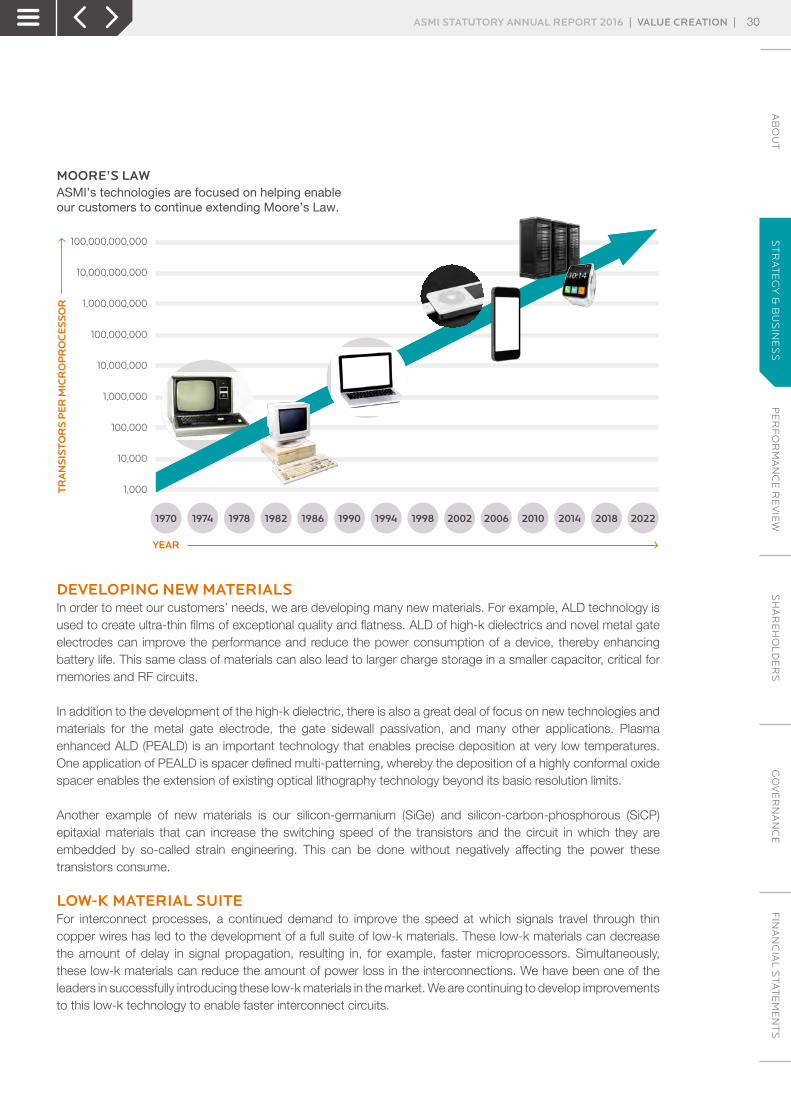
ASMI’s technologies are focused on helping enableour customers to continue extending Moore’s Law.
1970
100,000,000,000
10,000,000,000
TRA
NS
ISTO
RS
PE
R M
ICR
OP
RO
CE
SS
OR
YEAR
1,000,000,000
1978 1986 1994 2002 2010 20181974 1982 1990 1998 2006 2014 2022
100,000,000
10,000,000
1,000,000
100,000
MOORE’S LAW
10,000
1,000
DEVELOPING NEW MATERIALSIn order to meet our customers’ needs, we are developing many new materials. For example, ALD technology is used to create ultra-thin films of exceptional quality and flatness. ALD of high-k dielectrics and novel metal gate electrodes can improve the performance and reduce the power consumption of a device, thereby enhancing battery life. This same class of materials can also lead to larger charge storage in a smaller capacitor, critical for memories and RF circuits.
In addition to the development of the high-k dielectric, there is also a great deal of focus on new technologies and materials for the metal gate electrode, the gate sidewall passivation, and many other applications. Plasma enhanced ALD (PEALD) is an important technology that enables precise deposition at very low temperatures. One application of PEALD is spacer defined multi-patterning, whereby the deposition of a highly conformal oxide spacer enables the extension of existing optical lithography technology beyond its basic resolution limits.
Another example of new materials is our silicon-germanium (SiGe) and silicon-carbon-phosphorous (SiCP) epitaxial materials that can increase the switching speed of the transistors and the circuit in which they are embedded by so-called strain engineering. This can be done without negatively affecting the power these transistors consume.
LOW-K MATERIAL SUITEFor interconnect processes, a continued demand to improve the speed at which signals travel through thin copper wires has led to the development of a full suite of low-k materials. These low-k materials can decrease the amount of delay in signal propagation, resulting in, for example, faster microprocessors. Simultaneously, these low-k materials can reduce the amount of power loss in the interconnections. We have been one of the leaders in successfully introducing these low-k materials in the market. We are continuing to develop improvements to this low-k technology to enable faster interconnect circuits.
AB
OU
TS
TR
AT
EG
Y &
BU
SIN
ES
SP
ER
FO
RM
AN
CE
RE
VIE
WS
HA
RE
HO
LD
ER
SG
OV
ER
NA
NC
EF
INA
NC
IAL
STA
TE
ME
NT
SASMI STATUTORY ANNUAL REPORT 2016 | VALUE CREATION | 30
ST
RA
TE
GY
& B
US
INE
SS
HIGH PRODUCTIVITYIn addition to addressing the technology needs of our customers, the relentless drive of the industry to reduce cost corresponds to significant spending on development programs that further increase throughput, equipment reliability, and yield in our customers’ line, and further lower the cost per wafer of the wafer processing systems.
An excellent example of high productivity is our XP8 platform, on which we offer PEALD and PECVD processes. The XP8 incorporates eight process chambers in a compact configuration around one central handling platform. Two wafers are moved simultaneously into DCM, or dual chamber modules, which generally doubles the throughput compared to single wafer movements. Eagle XP8 PEALD tools and Dragon XP8 PECVD tools are in volume manufacturing at logic and memory fabs worldwide, and demonstrate reliable advanced performance with high productivity.
ALD AT ASMIALD is one of the newest technologies to deposit ultra-thin films of exceptional flatness and uniformity. This technology was brought into ASMI in 1999 with the acquisition of Microchemistry, who first developed the thermal ALD technology. Plasma enhanced ALD, PEALD, is an extension of this original ALD technology that uses plasma, which was brought into ASMI in 2001 through a partnership with Genitech, and a subsequent acquisition in 2004 and formation of ASM Genitech Korea.
The use of plasma enables us to deposit high-quality films at very low temperatures. ALD is a very versatile technology that can be used to deposit high-k insulating materials, conductors, silicon oxide, silicon nitride, and other materials. We expect the trends of continued scaling, and evolution towards 3D device structures for both logic and memory devices, to play into the strength of our ALD position. We offer ALD/PEALD processes on several of our product platforms, including single wafer and batch systems, and for multiple wafer sizes.
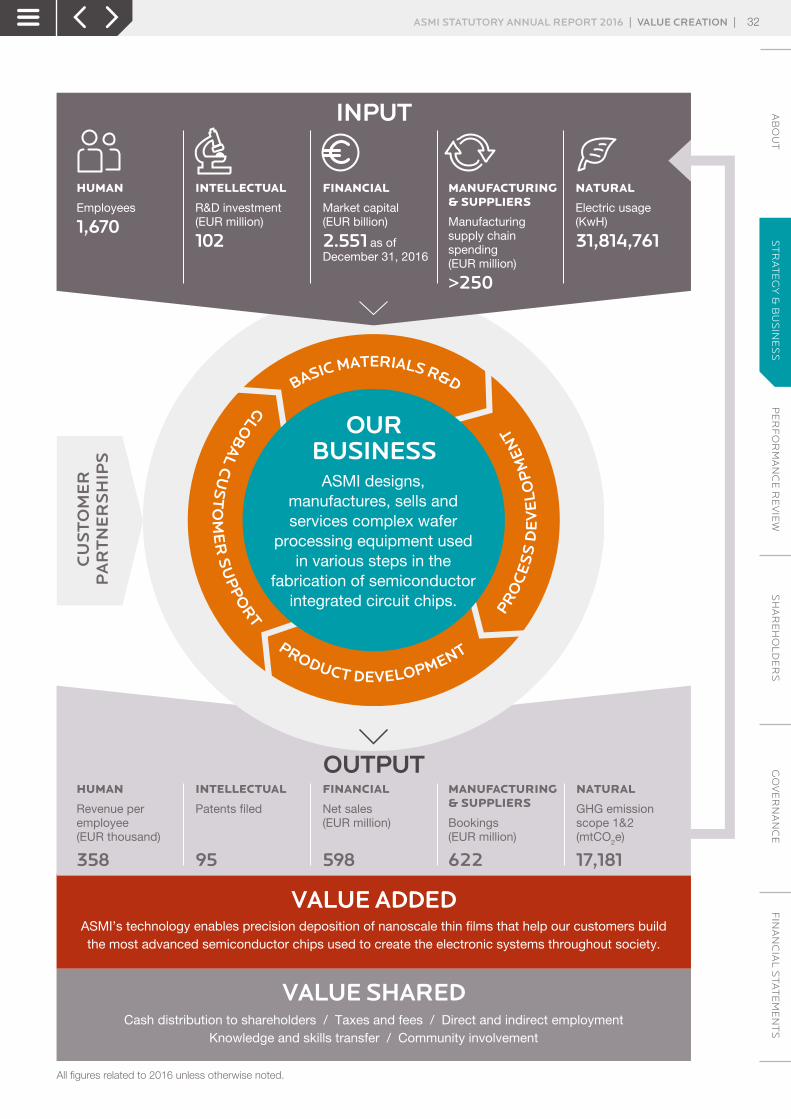
OUR BUSINESS MODELOur technology enables precision deposition of thin films in various steps in the fabrication of semiconductor chips, helping our customers build the most advanced chips used in the electronics systems throughout society.
Our business model enables us to create value for the company and all of our stakeholders. We achieve this by working with our customers to develop innovative solutions, while constantly looking at what is best for our investors, our people, society, and other stakeholders. Fundamental to our model is R&D investment, including basic chemical, materials and feasibility research, followed by process and product developments. We endeavor to continuously employ experts in the semiconductor process and equipment technology fields, and support them with new patent filings. We cooperate with research institutes and our customers to understand the technology roadmap challenges and to develop the appropriate process and equipment solutions required. Our manufacturing facility allows us to deliver high-quality systems on schedule so that our customers can ramp their fabrication plants. We support our customers globally with process and equipment service, and spare parts.
AB
OU
TS
TR
AT
EG
Y &
BU
SIN
ES
SP
ER
FO
RM
AN
CE
RE
VIE
WS
HA
RE
HO
LD
ER
SG
OV
ER
NA
NC
EF
INA
NC
IAL
STA
TE
ME
NT
SASMI STATUTORY ANNUAL REPORT 2016 | VALUE CREATION | 31
ST
RA
TE
GY
& B
US
INE
SS
OUTPUT
VALUE ADDED
INPUT
ASMI’s technology enables precision deposition of nanoscale thin films that help our customers build the most advanced semiconductor chips used to create the electronic systems throughout society.
VALUE SHAREDCash distribution to shareholders / Taxes and fees / Direct and indirect employment
Knowledge and skills transfer / Community involvement
BASIC MATERIALS R&D
PRODUCT DEVELOPMENT
GLOB
AL C
US
TO
ME
R S
UP
PO
RT PR
OC
ES
S D
EV
ELO
PM
ENT
ASMI designs, manufactures, sells and services complex wafer
processing equipment used in various steps in the
fabrication of semiconductorintegrated circuit chips.
OURBUSINESS
HUMAN
Employees
1,670
CU
ST
OM
ER
PA
RT
NE
RS
HIP
S
INTELLECTUAL
R&D investment(EUR million)
102
FINANCIAL
Market capital (EUR billion)
2.551 as ofDecember 31, 2016
MANUFACTURING & SUPPLIERS
Manufacturing supply chainspending(EUR million)
>250
HUMAN
Revenue peremployee(EUR thousand)
INTELLECTUAL
Patents filed
FINANCIAL
Net sales(EUR million)
MANUFACTURING& SUPPLIERS
Bookings (EUR million)
NATURAL
Electric usage(KwH)
31,814,761
NATURAL
GHG emissionscope 1&2(mtCO2e)
358 95 598 622 17,181
All figures related to 2016 unless otherwise noted.All figures related to 2016 unless otherwise noted.
AB
OU
TS
TR
AT
EG
Y &
BU
SIN
ES
SP
ER
FO
RM
AN
CE
RE
VIE
WS
HA
RE
HO
LD
ER
SG
OV
ER
NA
NC
EF
INA
NC
IAL
STA
TE
ME
NT
SASMI STATUTORY ANNUAL REPORT 2016 | VALUE CREATION | 32
ST
RA
TE
GY
& B
US
INE
SS
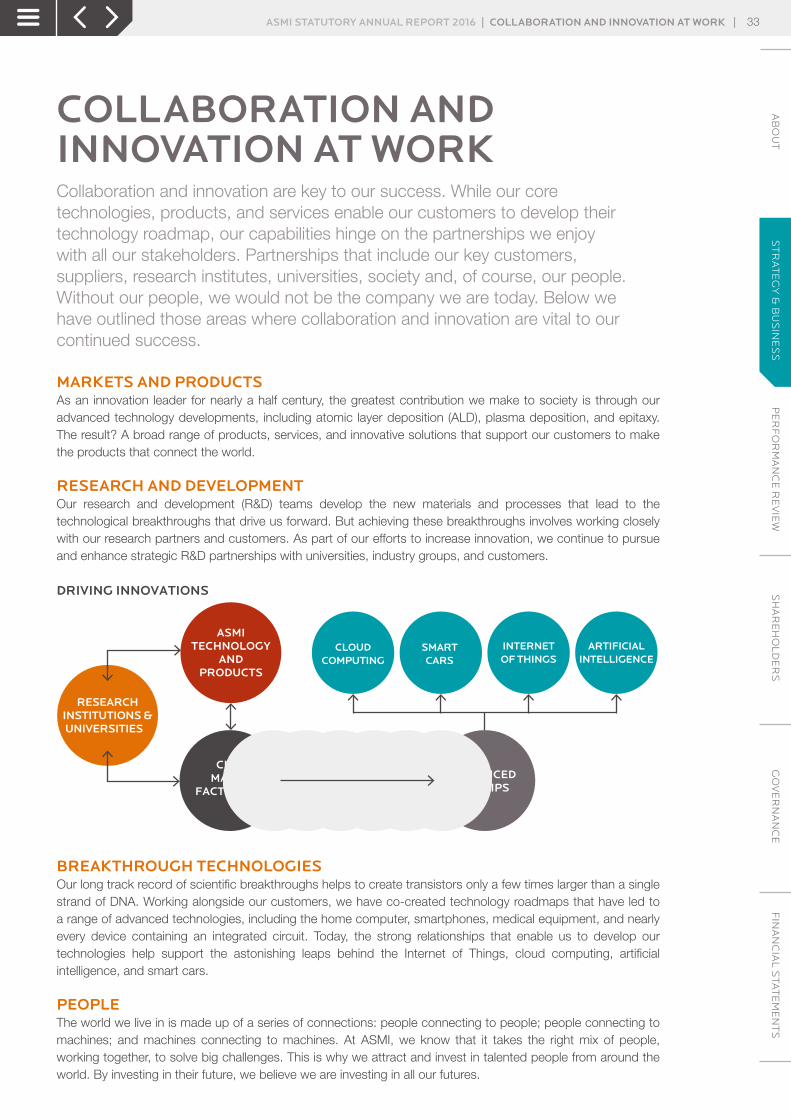
COLLABORATION AND INNOVATION AT WORK Collaboration and innovation are key to our success. While our core technologies, products, and services enable our customers to develop their technology roadmap, our capabilities hinge on the partnerships we enjoy with all our stakeholders. Partnerships that include our key customers, suppliers, research institutes, universities, society and, of course, our people. Without our people, we would not be the company we are today. Below we have outlined those areas where collaboration and innovation are vital to our continued success.
MARKETS AND PRODUCTSAs an innovation leader for nearly a half century, the greatest contribution we make to society is through our advanced technology developments, including atomic layer deposition (ALD), plasma deposition, and epitaxy. The result? A broad range of products, services, and innovative solutions that support our customers to make the products that connect the world.
RESEARCH AND DEVELOPMENTOur research and development (R&D) teams develop the new materials and processes that lead to the technological breakthroughs that drive us forward. But achieving these breakthroughs involves working closely with our research partners and customers. As part of our efforts to increase innovation, we continue to pursue and enhance strategic R&D partnerships with universities, industry groups, and customers.
Driving innovations
RESEARCHINSTITUTIONS &UNIVERSITIES
ASMITECHNOLOGY
ANDPRODUCTS
CHIPMANU-
FACTURERS
CLOUDCOMPUTING
SMARTCARS
INTERNETOF THINGS
ARTIFICIALINTELLIGENCE
ADVANCEDIC CHIPS
BREAKTHROUGH TECHNOLOGIES Our long track record of scientific breakthroughs helps to create transistors only a few times larger than a single strand of DNA. Working alongside our customers, we have co-created technology roadmaps that have led to a range of advanced technologies, including the home computer, smartphones, medical equipment, and nearly every device containing an integrated circuit. Today, the strong relationships that enable us to develop our technologies help support the astonishing leaps behind the Internet of Things, cloud computing, artificial intelligence, and smart cars.
PEOPLEThe world we live in is made up of a series of connections: people connecting to people; people connecting to machines; and machines connecting to machines. At ASMI, we know that it takes the right mix of people, working together, to solve big challenges. This is why we attract and invest in talented people from around the world. By investing in their future, we believe we are investing in all our futures.
OUR INNOVATION AT WORK
AB
OU
TS
TR
AT
EG
Y &
BU
SIN
ES
SP
ER
FO
RM
AN
CE
RE
VIE
WS
HA
RE
HO
LD
ER
SG
OV
ER
NA
NC
EF
INA
NC
IAL
STA
TE
ME
NT
SASMI STATUTORY ANNUAL REPORT 2016 | COLLABORATION AND INNOVATION AT WORK | 33
ST
RA
TE
GY
& B
US
INE
SS
MARKETS & PRODUCTSThe semiconductor capital equipment market is composed of three major market segments: wafer processing equipment, assembly and packaging equipment, and test equipment. We operate in the semiconductor wafer processing equipment market, primarily for deposition equipment.
MARKETSIn 2016 the semiconductor industry was driven by a US$1.94 trillion global electronics industry (VLSI Research Chip Insider, February 14, 2017) that required approximately US$290 billion of semiconductors. In turn, the semiconductor industry supported the approximately US$54.4 billion semiconductor capital equipment industry, which supplies the required production systems and services.
We serve the wafer processing equipment segment, which is part of the capital equipment segment. This is worth approximately US$35.2 billion annually. Demand for semiconductor capital equipment is driven both by growth in the market for semiconductor devices and the new technology needed to realize the next generation of devices.
In 2016 the semiconductor industry increased by about 2.1%, driving the equipment business up 11.4%. The equipment segment was driven mostly by capacity expansion in 3D NAND memory fabs and new technology generation investments in logic and foundry fabs.
LOGIC, FOUNDRY AND MEMORY MARKETS › Our semiconductor wafer processing business supplies equipment to the leading semiconductor manufacturers in the logic, foundry, and memory markets, primarily for the deposition of thin films.
› The logic market is made up of manufacturers who create chips that are used to process data. Known as the central processing unit (CPU), this microprocessor is the ‘brains’ of a computer system, and can be found in smartphones, laptops, and computers.
› The foundry market consists of businesses that operate semiconductor fabrication plants to manufacture the designs of other so-called fabless semiconductor companies.
› The memory market covers manufacturers who make chips that store information either temporarily, such as Random Access Memory (RAM), or permanently, such as NAND non-volatile memory. The NAND memory market has evolved to include 3D NAND chips, which are designed for the vertical stacking of memory cells to increase bit density.
ANALOG DEVICE MARKETSWe also supply equipment to leading manufacturers of analog semiconductor devices, which are important for enabling the increasing semiconductor content used in most products worldwide.
The analog market includes a wide array of chip types, including: › power management; › signal processing; › MEMS; › sensors; › discretes; and others.
The industry recently adopted the phrase called ‘More than Moore’, to identify and acknowledge a strongly-growing market of various types of analog chips which are not driven by the same Moore’s Law technology scaling inflections of mainstream logic and memory chips.
AB
OU
TS
TR
AT
EG
Y &
BU
SIN
ES
SP
ER
FO
RM
AN
CE
RE
VIE
WS
HA
RE
HO
LD
ER
SG
OV
ER
NA
NC
EF
INA
NC
IAL
STA
TE
ME
NT
SASMI STATUTORY ANNUAL REPORT 2016 | MARKETS & PRODUCTS | 34
ST
RA
TE
GY
& B
US
INE
SS
PRODUCTSMARKET COVERAGE The semiconductor capital equipment market is composed of three major market segments: › wafer processing equipment; › assembly and packaging equipment; › test equipment.
We are active in the wafer processing segment. Within wafer processing equipment, the major segments are: › lithography; › CMP; › ion implant; › deposition; › etch & clean; and › process diagnostics.
The principal market segment in which we participate is deposition and related tools. According to VLSI, the deposition segment was worth approximately US$8.8 billion in 2016.
Within the deposition market, the major equipment technology segments are: › chemical vapor deposition (CVD); › physical vapor deposition (PVD); › atomic layer deposition (ALD); › rapid thermal processing (RTP); › epitaxy; and › diffusion/furnace.
OUR PRODUCTS Our products include wafer processing deposition systems for CVD, ALD, epitaxy, and diffusion/furnace. We make two types of process tools: single wafer and batch. The majority of our business comes from single wafer tools, which are designed to process an individual wafer in each processing chamber on the tool. In contrast, a batch tool is designed such that a large number of wafers are processed simultaneously in a larger processing chamber. Batch tools typically achieve a higher throughput compared to single wafer tools. Single wafer tools typically achieve a higher level of process performance and control, especially for complex, critical applications. We work closely with our customers to meet their demands, and in recent years we have developed single wafer tools with multiple chambers configured together in a compact way on a single platform. This approach offers the best of both worlds, combining high productivity and a high level of performance.
Our XP platform is a high-productivity common 300mm single wafer platform that can be configured with up to four process modules. The XP platform enables high-volume multi-chamber parallel processing or integration of sequential process steps on one platform. The XP common platform benefits our customers through reduced operating costs, as many of our products use the same parts and consumables, and a common control architecture improves ease of use.
Our XP8 platform follows the basic architectural standards of the XP, but provides even higher productivity with up to eight chambers integrated on a single wafer platform with a small footprint.
AB
OU
TS
TR
AT
EG
Y &
BU
SIN
ES
SP
ER
FO
RM
AN
CE
RE
VIE
WS
HA
RE
HO
LD
ER
SG
OV
ER
NA
NC
EF
INA
NC
IAL
STA
TE
ME
NT
SASMI STATUTORY ANNUAL REPORT 2016 | MARKETS & PRODUCTS | 35
ST
RA
TE
GY
& B
US
INE
SS
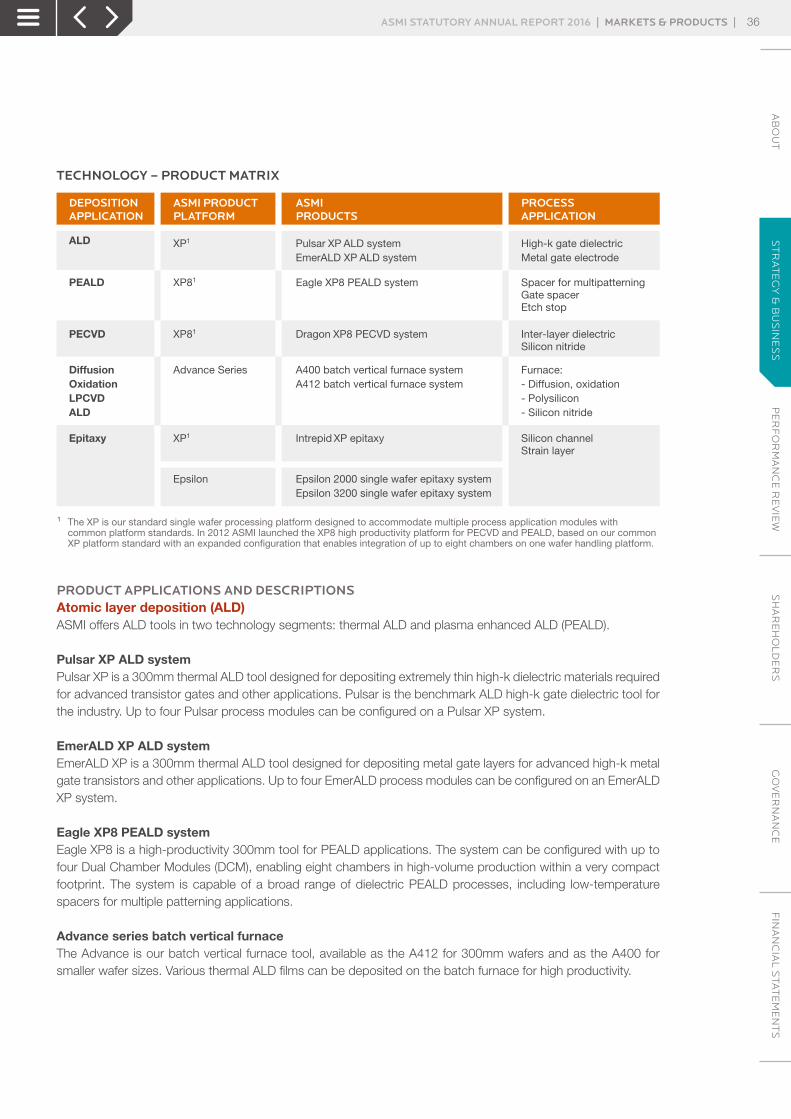
DEPOSITIONAPPLICATION
ASMI PRODUCTPLATFORM
ASMI PRODUCTS
TECHNOLOGY – PRODUCT MATRIX
ALD
PEALD
PECVD
DiffusionOxidationLPCVDALD
Epitaxy
XP1
XP81
XP81
Advance Series
XP1
Epsilon
Pulsar XP ALD systemEmerALD XP ALD system
Dragon XP8 PECVD system
A400 batch vertical furnace systemA412 batch vertical furnace system
Intrepid XP epitaxy
Epsilon 2000 single wafer epitaxy systemEpsilon 3200 single wafer epitaxy system
PROCESS APPLICATION
High-k gate dielectricMetal gate electrode
Spacer for multipatterningGate spacerEtch stop
Eagle XP8 PEALD system
Inter-layer dielectricSilicon nitride
Furnace:- Diffusion, oxidation- Polysilicon- Silicon nitride
Silicon channelStrain layer
1 The XP is our standard single wafer processing platform designed to accommodate multiple process application modules with common platform standards. In 2012 ASMI launched the XP8 high productivity platform for PECVD and PEALD, based on our common XP platform standard with an expanded configuration that enables integration of up to eight chambers on one wafer handling platform.
PRODUCT APPLICATIONS AND DESCRIPTIONSAtomic layer deposition (ALD)ASMI offers ALD tools in two technology segments: thermal ALD and plasma enhanced ALD (PEALD).
Pulsar XP ALD systemPulsar XP is a 300mm thermal ALD tool designed for depositing extremely thin high-k dielectric materials required for advanced transistor gates and other applications. Pulsar is the benchmark ALD high-k gate dielectric tool for the industry. Up to four Pulsar process modules can be configured on a Pulsar XP system.
EmerALD XP ALD systemEmerALD XP is a 300mm thermal ALD tool designed for depositing metal gate layers for advanced high-k metal gate transistors and other applications. Up to four EmerALD process modules can be configured on an EmerALD XP system.
Eagle XP8 PEALD systemEagle XP8 is a high-productivity 300mm tool for PEALD applications. The system can be configured with up to four Dual Chamber Modules (DCM), enabling eight chambers in high-volume production within a very compact footprint. The system is capable of a broad range of dielectric PEALD processes, including low-temperature spacers for multiple patterning applications.
Advance series batch vertical furnaceThe Advance is our batch vertical furnace tool, available as the A412 for 300mm wafers and as the A400 for smaller wafer sizes. Various thermal ALD films can be deposited on the batch furnace for high productivity.
AB
OU
TS
TR
AT
EG
Y &
BU
SIN
ES
SP
ER
FO
RM
AN
CE
RE
VIE
WS
HA
RE
HO
LD
ER
SG
OV
ER
NA
NC
EF
INA
NC
IAL
STA
TE
ME
NT
SASMI STATUTORY ANNUAL REPORT 2016 | MARKETS & PRODUCTS | 36
ST
RA
TE
GY
& B
US
INE
SS

Chemical Vapor Deposition (CVD)ASMI offers two types of CVD tools: single wafer plasma enhanced CVD (PECVD) and batch low pressure CVD (LPCVD).
Dragon XP8 PECVD systemDragon XP8 is a high-productivity 300mm tool for PECVD applications. The system can be configured with up to four Dual Chamber Modules (DCM), enabling eight chambers in high-volume production within a very compact footprint. Processes include a broad range of dielectric PECVD films for applications such as interconnect dielectrics layers, passivation layers, and etch stop layers.
Advance series batch vertical furnaceThe Advance is our batch vertical furnace tool, available as the A412 for 300mm thermal LPCVD and as the A400 for LPCVD on smaller wafer sizes. CVD applications on the furnace include polysilicon, silicon nitride and silicon oxide.
EpitaxyWe offer two families of Epitaxy tools: Intrepid and Epsilon.
Intrepid XP epitaxy systemIntrepid XP is a 300mm epitaxy tool designed for critical transistor strain and channel layers. Processes include silicon (Si), silicon-germanium (SiGe), silicon-carbon (SiC), and other silicon-based compounds. Up to four Intrepid process modules can be configured on an Intrepid XP system.
EpsilonThe Epsilon series is a single wafer, single chamber tool that deposits silicon-based materials for many applications, ranging from high-temperature silicon for wafer manufacturing, to low-temperature silicon, silicon-germanium (SiGe), silicon-carbon (SiC), and other silicon-based compounds. Epsilon is the market leader for epitaxy applications in the analog and power devices market.
DiffusionWe offer batch vertical furnace tools for diffusion and oxidation applications.
Advance series batch vertical furnaceThe Advance is our batch vertical furnace tool series, available as the A412 for 300mm and as the A400 for smaller wafer sizes. Atmospheric thermal applications on the furnace include diffusion to introduce dopants in materials in controlled amounts, annealing to affect material properties by heating to a specific temperature and oxidation to form silicon oxide.
Service and spare partsService and spare parts are important product offerings for ASMI’s business. ASMI provides service support to our customers with technical service personnel who are trained to maintain our systems at customers’ fabrication plants around the world. Our service team is located globally at regional and local service centers to assure prompt availability.
We sell spare parts for our equipment from parts stocks located at global distribution centers.
AB
OU
TS
TR
AT
EG
Y &
BU
SIN
ES
SP
ER
FO
RM
AN
CE
RE
VIE
WS
HA
RE
HO
LD
ER
SG
OV
ER
NA
NC
EF
INA
NC
IAL
STA
TE
ME
NT
SASMI STATUTORY ANNUAL REPORT 2016 | MARKETS & PRODUCTS | 37
ST
RA
TE
GY
& B
US
INE
SS

We have been an innovation leader for nearly 50 years. We are not only contributing to the remarkable advance of the semiconductor industry, we are shaping the industry itself. This success, and our future success, is largely dependent on our ability to develop new products and processes and to improve the features of existing products. Achieving this requires a large commitment to research and development (R&D). In 2015 and 2016, our R&D investment were €95.3 million and €101.5 million respectively. As of year-end 2016, 447 employees were employed in R&D, representing 27% of our total staff.
GLOBAL RESEARCHAs a global company, we carry out R&D on different continents, giving us access to some of the smartest professionals working in the semiconductor sector today. In our research centers in Finland, the United States, Japan, South Korea, the Netherlands, and Belgium we are active at all stages of our innovations’ life cycle, from developing the basic chemistry to implementing solutions on our equipment at our customers’ production sites. We also work with specialists across a wide array of disciplines to develop our research goals, including scientists from research institutes, universities, and suppliers.
REGIONAL EXPERTISEWith our R&D activities chiefly conducted in the principal semiconductor markets of the world, we are able to draw on innovative and technical capabilities internationally. Each geographical center provides expertise for specific products or technologies. This approach, combined with the interactions between the individual centers, enables efficient allocation of technical resources and customer interaction during development.
Under the umbrella of global product development policies, our local activities are directed both towards expanding and improving present product lines to incorporate technology advances and reduce product cost, as well as developing new products for existing and new markets. These activities require the application of physics, chemistry, materials science, chemical engineering, electrical engineering, precision mechanical engineering, software engineering, and systems engineering.
CUSTOMER COLLABORATIONHowever, the most important collaborations we have are those with our global customers, with whom we co-create and jointly develop our technology roadmaps, and enabling new technologies and processes at the time our customers need them. The diversity in collaborations ranging from research and suppliers to customers means that we can bring together the best minds in the world to create new breakthroughs.
RESEARCH & DEVELOPMENT AB
OU
TS
TR
AT
EG
Y &
BU
SIN
ES
SP
ER
FO
RM
AN
CE
RE
VIE
WS
HA
RE
HO
LD
ER
SG
OV
ER
NA
NC
EF
INA
NC
IAL
STA
TE
ME
NT
SASMI STATUTORY ANNUAL REPORT 2016 | RESEARCH & DEVELOPMENT | 38
ST
RA
TE
GY
& B
US
INE
SS
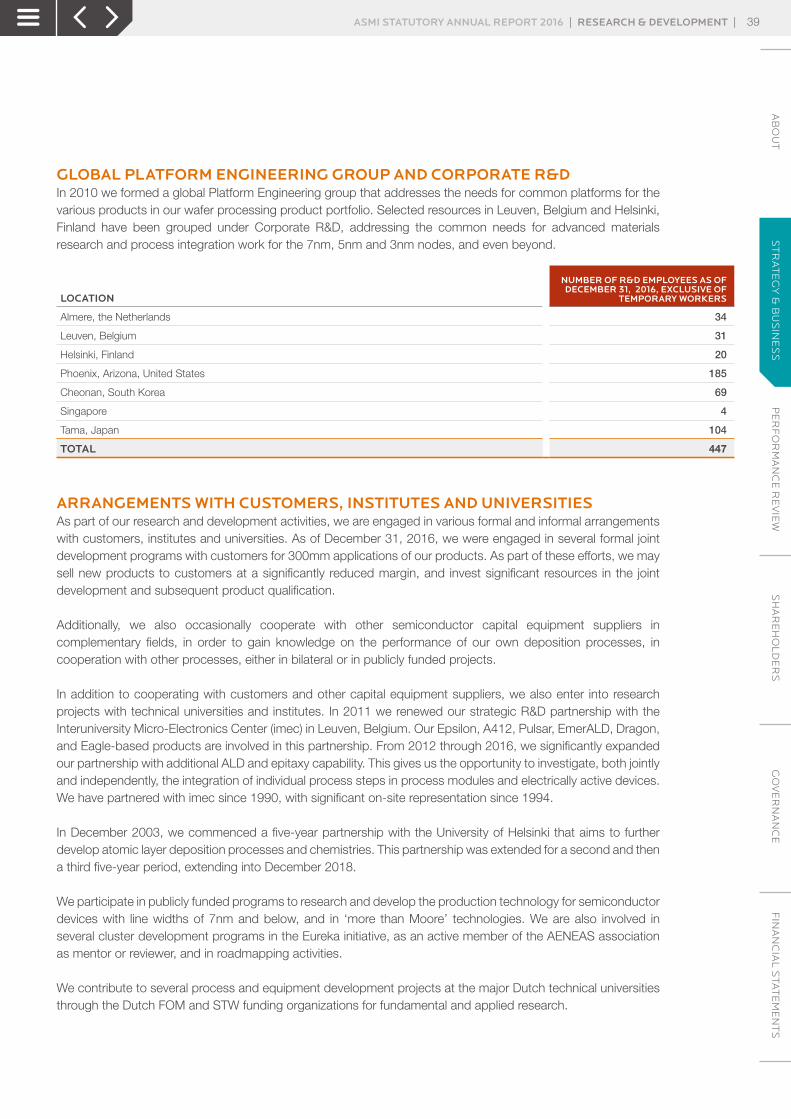
GLOBAL PLATFORM ENGINEERING GROUP AND CORPORATE R&DIn 2010 we formed a global Platform Engineering group that addresses the needs for common platforms for the various products in our wafer processing product portfolio. Selected resources in Leuven, Belgium and Helsinki, Finland have been grouped under Corporate R&D, addressing the common needs for advanced materials research and process integration work for the 7nm, 5nm and 3nm nodes, and even beyond.
LOCATION
NUMBER OF R&D EMPLOYEES AS OF DECEMBER 31, 2016, EXCLUSIVE OF
TEMPORARY WORKERS
Almere, the Netherlands 34
Leuven, Belgium 31
Helsinki, Finland 20
Phoenix, Arizona, United States 185
Cheonan, South Korea 69
Singapore 4
Tama, Japan 104
TOTAL 447
ARRANGEMENTS WITH CUSTOMERS, INSTITUTES AND UNIVERSITIESAs part of our research and development activities, we are engaged in various formal and informal arrangements with customers, institutes and universities. As of December 31, 2016, we were engaged in several formal joint development programs with customers for 300mm applications of our products. As part of these efforts, we may sell new products to customers at a significantly reduced margin, and invest significant resources in the joint development and subsequent product qualification.
Additionally, we also occasionally cooperate with other semiconductor capital equipment suppliers in complementary fields, in order to gain knowledge on the performance of our own deposition processes, in cooperation with other processes, either in bilateral or in publicly funded projects.
In addition to cooperating with customers and other capital equipment suppliers, we also enter into research projects with technical universities and institutes. In 2011 we renewed our strategic R&D partnership with the Interuniversity Micro-Electronics Center (imec) in Leuven, Belgium. Our Epsilon, A412, Pulsar, EmerALD, Dragon, and Eagle-based products are involved in this partnership. From 2012 through 2016, we significantly expanded our partnership with additional ALD and epitaxy capability. This gives us the opportunity to investigate, both jointly and independently, the integration of individual process steps in process modules and electrically active devices. We have partnered with imec since 1990, with significant on-site representation since 1994.
In December 2003, we commenced a five-year partnership with the University of Helsinki that aims to further develop atomic layer deposition processes and chemistries. This partnership was extended for a second and then a third five-year period, extending into December 2018.
We participate in publicly funded programs to research and develop the production technology for semiconductor devices with line widths of 7nm and below, and in ‘more than Moore’ technologies. We are also involved in several cluster development programs in the Eureka initiative, as an active member of the AENEAS association as mentor or reviewer, and in roadmapping activities.
We contribute to several process and equipment development projects at the major Dutch technical universities through the Dutch FOM and STW funding organizations for fundamental and applied research.
AB
OU
TS
TR
AT
EG
Y &
BU
SIN
ES
SP
ER
FO
RM
AN
CE
RE
VIE
WS
HA
RE
HO
LD
ER
SG
OV
ER
NA
NC
EF
INA
NC
IAL
STA
TE
ME
NT
SASMI STATUTORY ANNUAL REPORT 2016 | RESEARCH & DEVELOPMENT | 39
ST
RA
TE
GY
& B
US
INE
SS

BREAKTHROUGH TECHNOLOGIESWe are the leading supplier of atomic layer deposition (ALD) equipment and process solutions for the semiconductor industry, and were one of the first companies to recognize ALD’s potential for the industry. Today, our ALD process technology delivers the highest performance available to support the next generation of semiconductor devices.
Precursor
Byproduct
ByproductOxidant
PURGE
ALD CYCLE
PURGE
ATOMIC LAYER DEPOSITION
21
34
INCREDIBLE PRECISIONALD allows us to deposit thin films atom-by-atom on silicon wafers, meaning we can deliver atomic-scale thickness control, high-quality deposition film properties and large area uniformity.
With such precision, we can use materials that previously could not be considered, and develop 3D structures that are vital to the future of electronics. 3D technology provides a number of real benefits, including saving space while delivering chips with higher performance and consuming less power.
ALD IN VOLUME MANUFACTURINGOur ALD technology is being used to build ICs for a wide range of leading-edge products, including high-performance computers and smartphones. The results of ALD are everywhere in the world around us.
ALD is also our basic platform for the development of a wide range of new materials. Our research centers across the globe are working on ALD, and we are conducting joint research projects with Europe’s largest independent research institute, imec. Taken together, this helps make ALD one of the principal drivers for future growth in microelectronics.
ALD – A DRIVER OF FUTURE GROWTHUsing ALD, we can deposit new materials several atoms thick on semiconductor wafers, producing ultra-thin films of exceptional quality and uniformity.
In PEALD, plasma is used to provide the reaction energy for the process, enabling us to use lower temperatures for low-thermal budget applications. This technology was introduced in DRAM and planar NAND flash manufacturing in the 3x nm node, for spacer-defined double patterning (SDDP), a technique that can reduce device dimensions, postponing the need for new lithography technologies.
AB
OU
TS
TR
AT
EG
Y &
BU
SIN
ES
SP
ER
FO
RM
AN
CE
RE
VIE
WS
HA
RE
HO
LD
ER
SG
OV
ER
NA
NC
EF
INA
NC
IAL
STA
TE
ME
NT
SASMI STATUTORY ANNUAL REPORT 2016 | BREAKTHROUGH TECHNOLOGIES | 40
ST
RA
TE
GY
& B
US
INE
SS
Using ALD technology, we can scale devices to smaller dimensions while reducing the power consumption of transistors, all of which helps the industry follow Moore’s Law and create smaller, more powerful semiconductors. For advanced 3D memory applications, where devices are stacked vertically in high densities, ALD is critical for uniformly depositing films in deep trenches and over complicated features. Many new applications are emerging where ALD is the technology of choice, and in a number of cases the only solution that meets the challenging technology requirements.
We expect ALD to be one of the principal drivers of growth in microelectronics over the coming decade. In addition, we expect growth in other deposition technologies, including epitaxy for advanced transistors and PECVD for creating improved interconnects. Looking ahead, we will continue to develop the huge potential of our deposition technologies in support of the semiconductor industry, enabling the industry to support the future demands of consumers and businesses.
AB
OU
TS
TR
AT
EG
Y &
BU
SIN
ES
SP
ER
FO
RM
AN
CE
RE
VIE
WS
HA
RE
HO
LD
ER
SG
OV
ER
NA
NC
EF
INA
NC
IAL
STA
TE
ME
NT
SASMI STATUTORY ANNUAL REPORT 2016 | BREAKTHROUGH TECHNOLOGIES | 41
ST
RA
TE
GY
& B
US
INE
SS
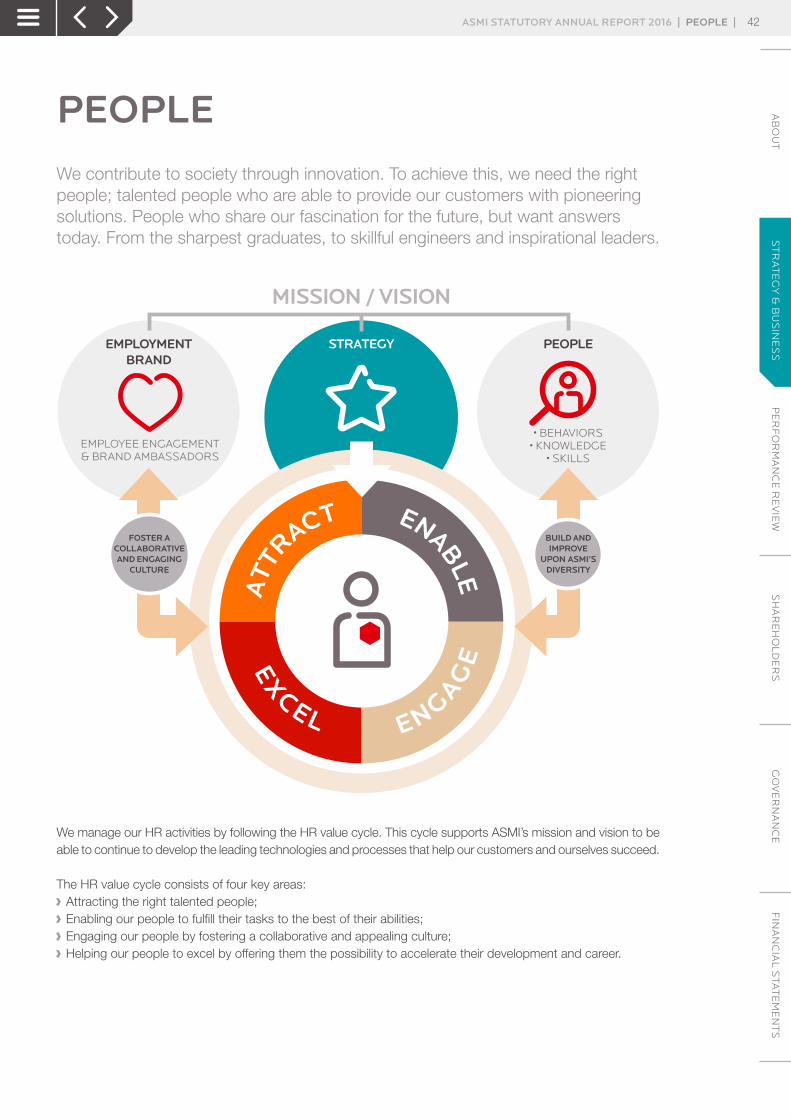
PEOPLEWe contribute to society through innovation. To achieve this, we need the right people; talented people who are able to provide our customers with pioneering solutions. People who share our fascination for the future, but want answers today. From the sharpest graduates, to skillful engineers and inspirational leaders.
STRATEGY
MISSION / VISION
PEOPLE
EMPLOYMENTBRAND
EMPLOYEE ENGAGEMENT& BRAND AMBASSADORS
• BEHAVIORS• KNOWLEDGE
• SKILLS
FOSTER A COLLABORATIVEAND ENGAGING
CULTURE
BUILD ANDIMPROVE
UPON ASMI’SDIVERSITY
att
ract ENABLE
ENGAGEE
XCEL
We manage our HR activities by following the HR value cycle. This cycle supports ASMI’s mission and vision to be able to continue to develop the leading technologies and processes that help our customers and ourselves succeed.
The HR value cycle consists of four key areas: › Attracting the right talented people; › Enabling our people to fulfill their tasks to the best of their abilities; › Engaging our people by fostering a collaborative and appealing culture; › Helping our people to excel by offering them the possibility to accelerate their development and career.
AB
OU
TS
TR
AT
EG
Y &
BU
SIN
ES
SP
ER
FO
RM
AN
CE
RE
VIE
WS
HA
RE
HO
LD
ER
SG
OV
ER
NA
NC
EF
INA
NC
IAL
STA
TE
ME
NT
SASMI STATUTORY ANNUAL REPORT 2016 | PEOPLE | 42
ST
RA
TE
GY
& B
US
INE
SS
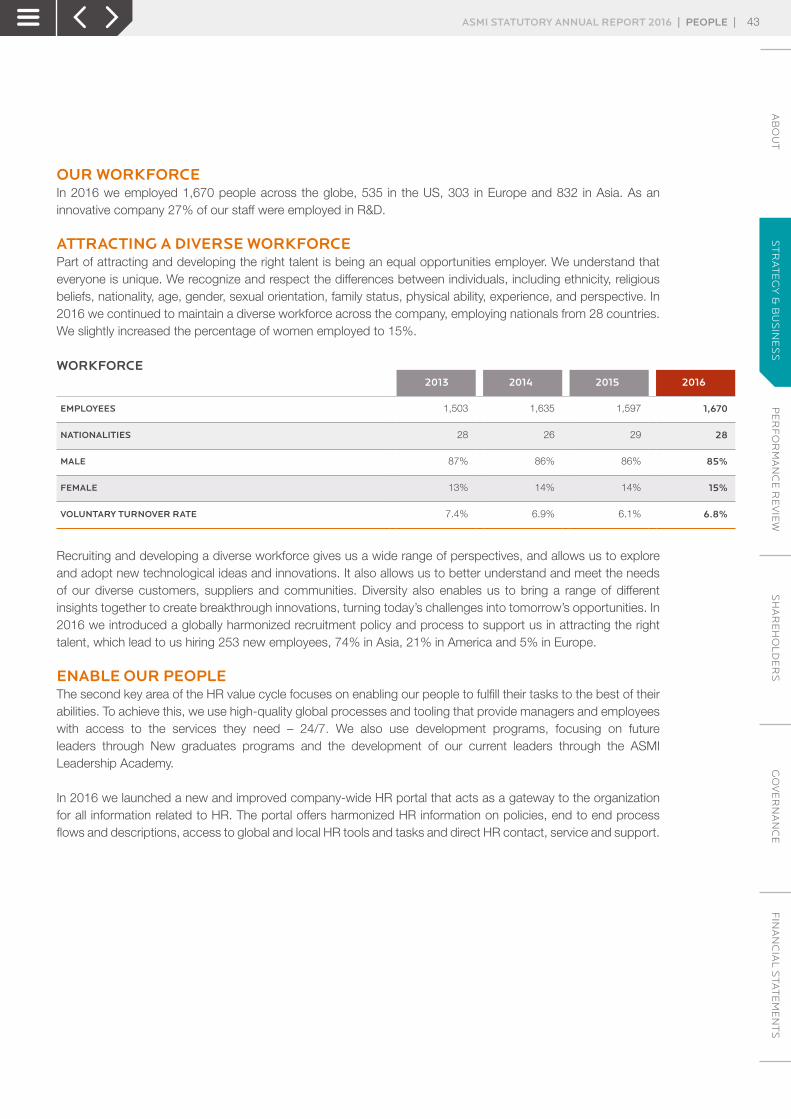
OUR WORKFORCEIn 2016 we employed 1,670 people across the globe, 535 in the US, 303 in Europe and 832 in Asia. As an innovative company 27% of our staff were employed in R&D.
ATTRACTING A DIVERSE WORKFORCEPart of attracting and developing the right talent is being an equal opportunities employer. We understand that everyone is unique. We recognize and respect the differences between individuals, including ethnicity, religious beliefs, nationality, age, gender, sexual orientation, family status, physical ability, experience, and perspective. In 2016 we continued to maintain a diverse workforce across the company, employing nationals from 28 countries. We slightly increased the percentage of women employed to 15%.
WORKFORCE2013 2014 2015 2016
EMPLOYEES 1,503 1,635 1,597 1,670
NATIONALITIES 28 26 29 28
MALE 87% 86% 86% 85%
FEMALE 13% 14% 14% 15%
VOLUNTARY TURNOVER RATE 7.4% 6.9% 6.1% 6.8%
Recruiting and developing a diverse workforce gives us a wide range of perspectives, and allows us to explore and adopt new technological ideas and innovations. It also allows us to better understand and meet the needs of our diverse customers, suppliers and communities. Diversity also enables us to bring a range of different insights together to create breakthrough innovations, turning today’s challenges into tomorrow’s opportunities. In 2016 we introduced a globally harmonized recruitment policy and process to support us in attracting the right talent, which lead to us hiring 253 new employees, 74% in Asia, 21% in America and 5% in Europe.
ENABLE OUR PEOPLEThe second key area of the HR value cycle focuses on enabling our people to fulfill their tasks to the best of their abilities. To achieve this, we use high-quality global processes and tooling that provide managers and employees with access to the services they need – 24/7. We also use development programs, focusing on future leaders through New graduates programs and the development of our current leaders through the ASMI Leadership Academy.
In 2016 we launched a new and improved company-wide HR portal that acts as a gateway to the organization for all information related to HR. The portal offers harmonized HR information on policies, end to end process flows and descriptions, access to global and local HR tools and tasks and direct HR contact, service and support.
AB
OU
TS
TR
AT
EG
Y &
BU
SIN
ES
SP
ER
FO
RM
AN
CE
RE
VIE
WS
HA
RE
HO
LD
ER
SG
OV
ER
NA
NC
EF
INA
NC
IAL
STA
TE
ME
NT
SASMI STATUTORY ANNUAL REPORT 2016 | PEOPLE | 43
ST
RA
TE
GY
& B
US
INE
SS

THE ASMI NEW COLLEGE GRADUATE PROGRAMTo help attract and develop the brightest minds and future leaders, we have established the ASMI New College Graduate (NCG) program. We focus on top graduates with advanced degrees in physics, physical chemistry, chemistry, materials science, and engineering. Working with a select list of universities that focus on the education and training that fit our technology needs, we participate in career events, partnerships and projects that give us the opportunity to showcase the company. Following their training period, they begin working at the cutting edge of technology, alongside experienced innovators. Their goal is to resolve some of our toughest scientific challenges. During the first few years of their careers, they are based at one of our innovation centers in Helsinki, Finland, or Leuven, Belgium, before being given the opportunity to apply their knowledge in different product areas at one of our global facilities. In 2016 a number of NCGs transferred to our business and service units, while we hired a number of talented graduates to start their careers at our R&D facilities in Helsinki and Leuven.
THE ASMI LEADERSHIP ACADEMYOnce we have attracted the right people, we work hard to ensure they engage with the company and its strategic goals, and provide an enabling environment that allows them to excel and turn today’s challenges into tomorrow’s opportunities. One example is the ASMI Leadership Academy, which offers our people different leadership programs. In 2016 we continued to enhance the ASMI Leadership Academy. Employees at different levels participated in an intensive training week, including course curriculum, team dynamics, and a real-time ASMI business case. Our Leadership Academy helps managers and leaders from all levels of the organization to foster a collaborative and engaging culture and build upon the diversity of their teams. Bringing managers and leaders together in these programs, while using consistent content, has also led to increased understanding and greater cross-cultural and business collaboration.
HELPING OUR PEOPLE ENGAGE AND EXCELThe third and fourth key areas of the HR value cycle focus on engaging our people. We achieve this by fostering a collaborative and engaging culture to motivate them to give the best of themselves, while offering the possibility to excel by accelerating their development and career.
TALENT MANAGEMENT: ACCELERATING DEVELOPMENT AND CAREERTalent Management (TM) is critical in developing and retaining the right talent, and a key factor in managing risks associated with our business operations. To successfully manage talent, we focus on attracting the right people and ensuring they are familiarized with the tools, processes and skills required to work successfully within the company. By helping them understand our strategic objectives and establish productive collaborations across the organization, we enable them to realize their professional ambitions, helping them to achieve excellent business performance. Successful Talent Management means having inclusive and relevant processes and tools in place across the company, ensuring that they are accessible to all cultures.
In 2016 we continued with our global Succession and Talent reviews. For all critical organizational areas, we identified the specific and unique organizational capabilities that are required and critical for executing the business strategies. For each organizational area we defined concrete action plans to enhance or build those capabilities. For those positions that are identified as pivotal to develop the capabilities, we defined the required talent related actions to ensure timely succession and support. All outcomes of the Succession and Talent reviews are captured in a Global Talent Database, supporting line managers in identifying talent early, developing their people, and building an internal succession pipeline to manage business risk, and safeguard the people side of their business strategies.
AB
OU
TS
TR
AT
EG
Y &
BU
SIN
ES
SP
ER
FO
RM
AN
CE
RE
VIE
WS
HA
RE
HO
LD
ER
SG
OV
ER
NA
NC
EF
INA
NC
IAL
STA
TE
ME
NT
SASMI STATUTORY ANNUAL REPORT 2016 | PEOPLE | 44
ST
RA
TE
GY
& B
US
INE
SS

PATENTS AND TRADEMARKSWe strive to maintain a culture of innovation at every level of the organization. We attract and retain creative people from around the world, who help us create a steady stream of innovations that we bring to volume manufacturing through close cooperation with our customers. It is this focus on innovation and collaboration that enables us to file an average of between 50 and 100 new utility patent applications each year.
CAPTURING IDEAS EFFICIENTLYIntellectual Property (IP) managers work at all of our major global R&D sites, where they capture all patentable material resulting from our R&D activities. We now have nearly 1,500 patents in force worldwide, with many hundreds of those relating specifically to the ALD process technology platform. We expect new deposition technologies and chemistries to be a major driver for new IP in the future.
Patents protect our discoveries and enable us to speak more openly about our inventions and share ideas in the marketplace that benefit our customers. Our patents are usually registered in the principal countries where semiconductor devices or equipment are manufactured and/or sold.
Our vision is to increase our value to our customers and shareholders by using our IP in a way that differentiates our products, influences the market, and provides additional monetization opportunities. We seek to minimize IP risk for our products and R&D activities through strategic IP positioning and safeguarding technical know-how to preserve and grow our intrinsic value.
PATENTS IN FORCEINITIAL PATENT FILINGS
61 6663
51
9585
1,166 1,2661,0811,050
1,4901,395
2,000
1,600
1,200
800
400
100
80
60
40
20
20132011 2012 2014 2015 201620132011 2012 2014 2015 2016
TRADEMARK LIST AS OF JANUARY 1, 2017We have registered a number of trademarks covering our product portfolio in the principal countries.
ASM, the ASM International logo, Advance, Aurora, Dragon, Eagle, EmerALD, Epsilon, Horizon, Intrepid, Medallion, Polygon, Previum, Pulsar and Silcore are registered trademarks of ASM International NV. A400, A412, ALCVD, the ASM Qualified Licensed Supplier logo, Atomic Layer CVD, Axis, Loadstar, NCP, PEALD, Synergis, XP, and XP8 are our trademarks. ‘The Switch Is On’ and ‘Drive Innovation. Deliver Excellence.’ are our service marks.
AB
OU
TS
TR
AT
EG
Y &
BU
SIN
ES
SP
ER
FO
RM
AN
CE
RE
VIE
WS
HA
RE
HO
LD
ER
SG
OV
ER
NA
NC
EF
INA
NC
IAL
STA
TE
ME
NT
SASMI STATUTORY ANNUAL REPORT 2016 | PATENTS AND TRADEMARKS | 45
ST
RA
TE
GY
& B
US
INE
SS
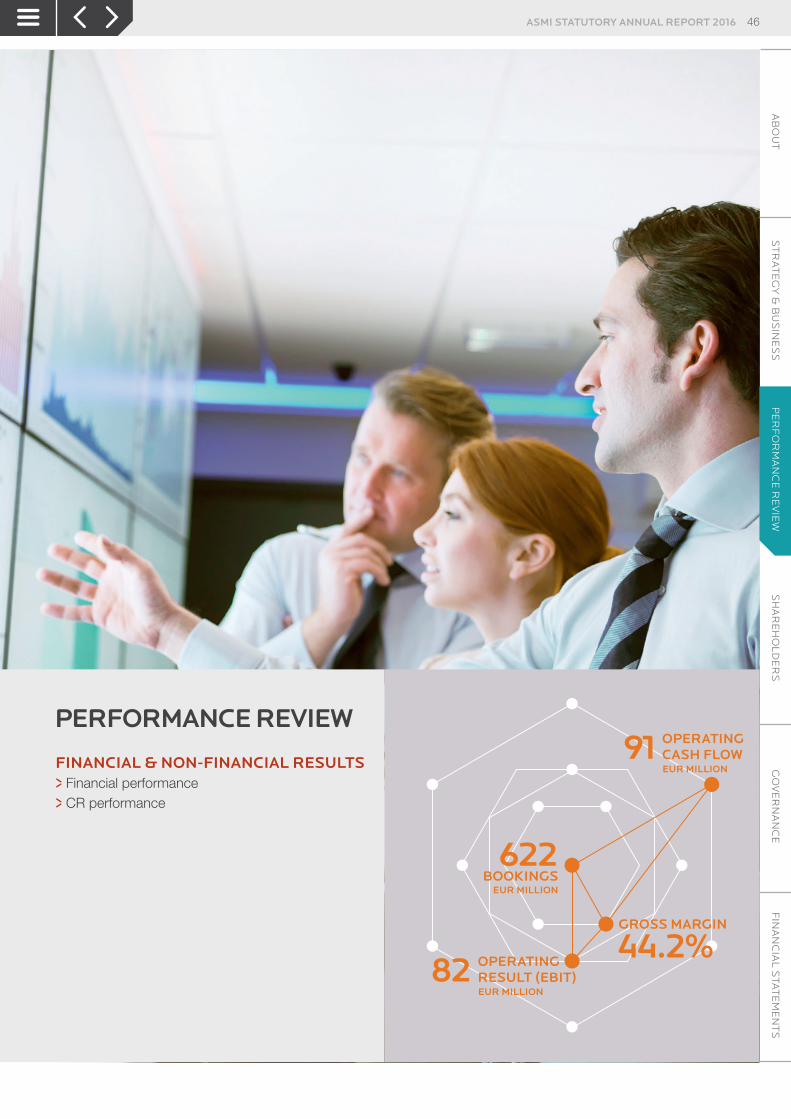
PERFORMANCE REVIEW
FINANCIAL & NON-FINANCIAL RESULTS>>Financial performance
>>CR performance
ASMI STATUTORY ANNUAL REPORT 2016 46A
BO
UT
ST
RA
TE
GY
& B
US
INE
SS
PE
RF
OR
MA
NC
E R
EV
IEW
SH
AR
EH
OL
DE
RS
GO
VE
RN
AN
CE
FIN
AN
CIA
L S
TAT
EM
EN
TS
PE
RF
OR
MA
NC
E R
EV
IEW
GROSS MARGIN
44.2%EUR MILLION
OPERATINGRESULT (EBIT)82
BOOKINGS622
EUR MILLION
EUR MILLION
OPERATINGCASH FLOW91
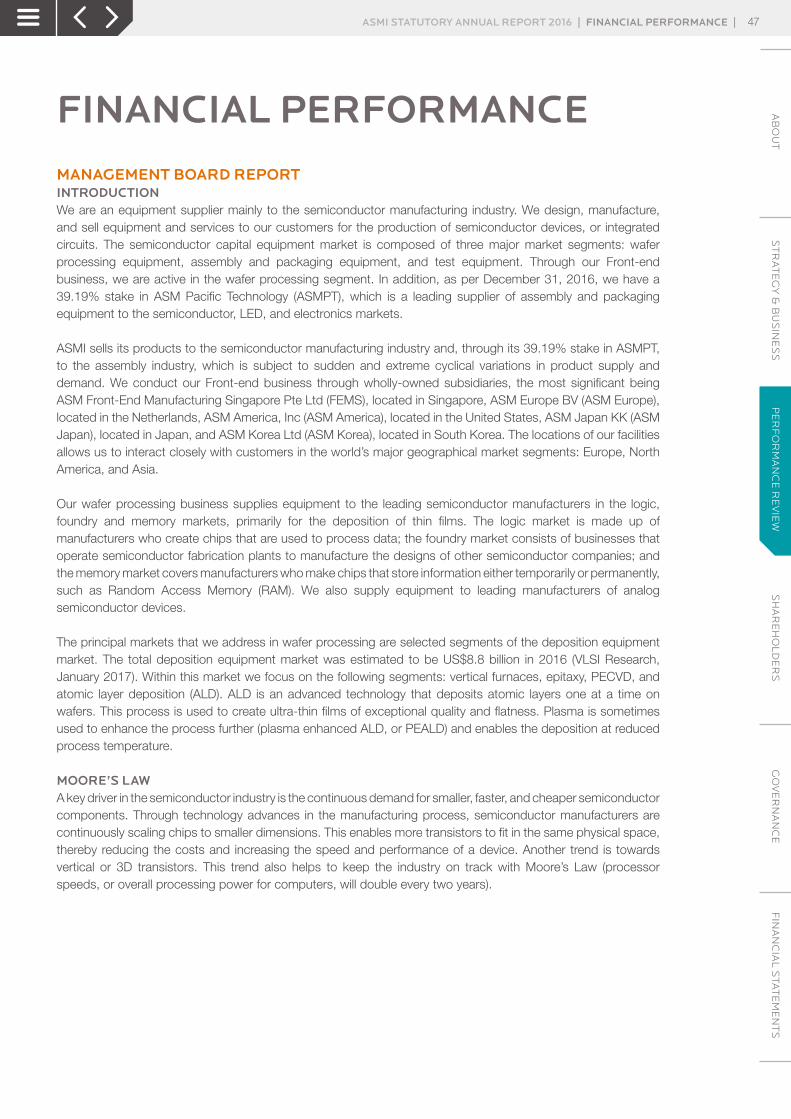
FINANCIAL PERFORMANCEMANAGEMENT BOARD REPORT INTRODUCTION We are an equipment supplier mainly to the semiconductor manufacturing industry. We design, manufacture, and sell equipment and services to our customers for the production of semiconductor devices, or integrated circuits. The semiconductor capital equipment market is composed of three major market segments: wafer processing equipment, assembly and packaging equipment, and test equipment. Through our Front-end business, we are active in the wafer processing segment. In addition, as per December 31, 2016, we have a 39.19% stake in ASM Pacific Technology (ASMPT), which is a leading supplier of assembly and packaging equipment to the semiconductor, LED, and electronics markets.
ASMI sells its products to the semiconductor manufacturing industry and, through its 39.19% stake in ASMPT, to the assembly industry, which is subject to sudden and extreme cyclical variations in product supply and demand. We conduct our Front-end business through wholly-owned subsidiaries, the most significant being ASM Front-End Manufacturing Singapore Pte Ltd (FEMS), located in Singapore, ASM Europe BV (ASM Europe), located in the Netherlands, ASM America, Inc (ASM America), located in the United States, ASM Japan KK (ASM Japan), located in Japan, and ASM Korea Ltd (ASM Korea), located in South Korea. The locations of our facilities allows us to interact closely with customers in the world’s major geographical market segments: Europe, North America, and Asia.
Our wafer processing business supplies equipment to the leading semiconductor manufacturers in the logic, foundry and memory markets, primarily for the deposition of thin films. The logic market is made up of manufacturers who create chips that are used to process data; the foundry market consists of businesses that operate semiconductor fabrication plants to manufacture the designs of other semiconductor companies; and the memory market covers manufacturers who make chips that store information either temporarily or permanently, such as Random Access Memory (RAM). We also supply equipment to leading manufacturers of analog semiconductor devices.
The principal markets that we address in wafer processing are selected segments of the deposition equipment market. The total deposition equipment market was estimated to be US$8.8 billion in 2016 (VLSI Research, January 2017). Within this market we focus on the following segments: vertical furnaces, epitaxy, PECVD, and atomic layer deposition (ALD). ALD is an advanced technology that deposits atomic layers one at a time on wafers. This process is used to create ultra-thin films of exceptional quality and flatness. Plasma is sometimes used to enhance the process further (plasma enhanced ALD, or PEALD) and enables the deposition at reduced process temperature.
MOORE’S LAW A key driver in the semiconductor industry is the continuous demand for smaller, faster, and cheaper semiconductor components. Through technology advances in the manufacturing process, semiconductor manufacturers are continuously scaling chips to smaller dimensions. This enables more transistors to fit in the same physical space, thereby reducing the costs and increasing the speed and performance of a device. Another trend is towards vertical or 3D transistors. This trend also helps to keep the industry on track with Moore’s Law (processor speeds, or overall processing power for computers, will double every two years).
FINANCIAL & NON-FINANCIAL RESULTS
ASMI STATUTORY ANNUAL REPORT 2016 | FINANCIAL PERFORMANCE | 47A
BO
UT
ST
RA
TE
GY
& B
US
INE
SS
PE
RF
OR
MA
NC
E R
EV
IEW
SH
AR
EH
OL
DE
RS
GO
VE
RN
AN
CE
FIN
AN
CIA
L S
TAT
EM
EN
TS
PE
RF
OR
MA
NC
E R
EV
IEW
Advanced deposition techniquesThe manufacture of ever-smaller and more complex devices requires more advanced and precise deposit techniques. ALD offers the precision needed to deposit ultra-thin and highly conformal films, even on challenging 3D surfaces. Our portfolio of ALD products is an enabling technology for our customers, helping them to manufacture semiconductor devices at smaller line widths with new materials and 3D architectures. Our technologies support our customers in their roadmap towards chips with a higher performance and reduced energy consumption, which in turn enable the introduction of new and more advanced products ranging from high-end servers to smartphones, wearable devices, and automotive electronics.
BACK-END OPERATIONSOur investment in ASM Pacific Technology represents the Back-end business. The Back-end operations are conducted through facilities in Hong Kong, the People’s Republic of China, Singapore, Malaysia, and Germany. On March 15, 2013, we reduced our shareholding in ASMPT from 52% to around 40%. The sale of the 12% stake in ASMPT caused and required the deconsolidation of ASMPT. Since that date, our share of the net result of ASMPT is reported on the line share in income of investments in associates.
STRATEGY Our strategic objective is to realize profitable, sustainable growth by capitalizing on our innovative strength in deposition technologies and our strong relationships with key customers.
The key elements of our strategy are:Innovative strengthWe are recognized for our technology leadership. We provide leading thin film deposition technologies that support our customers in staying on the curve of Moore’s Law. Our innovative strength is what differentiates us in the marketplace, creates growth opportunities for our employees, and continues to be the cornerstone of our strategy. Apart from our internal R&D efforts, we are continuously expanding and deepening our strategic cooperation with key customers, suppliers, chemical manufacturers, and research institutes such as imec. Our suppliers manufacture advanced components and assemblies to the tightest of tolerances and are required to adhere to our stringent design specifications, and quality systems. This approach enables us to remain innovative and swiftly meet the changing demands of our customers.
Leadership in depositionWe create value through our advanced thin film deposition technologies, which help leading semiconductor and technology industry partners to deliver the world of tomorrow through advanced chips. One of these technologies is ALD, which is established as a mainstream technology in high-volume manufacturing, supporting virtually all of the leading customers in the semiconductor industry. As a leader in this space, ALD has turned into a key growth driver for our business. We expect that the trends of continued scaling and evolution towards 3D device structures will further expand the number of applications for ALD. We aim to maintain our leading position in ALD by leveraging on our strong expertise and established customer relationships, and by developing new applications in deposition technologies to support our customers with increasingly complex device node transitions.
Our strategic objective is to realize profitable, sustainable growth by capitalizing on our innovative strength, operational excellence, and our leadership in ALD and other business segments we are active in.
Operational excellenceWhile technology leadership remains crucial, we have a responsibility to our stakeholders to continue to focus on further improving the effectiveness of our organization and the efficiency of processes. We aim to provide our customers with dependable leading-edge products and services at a consistent quality level, providing the best cost of ownership. To help achieve this, we continue to optimize our manufacturing and global sourcing processes, including the migration to common product platforms. We are working with our suppliers to improve fundamental quality through statistical methods and process controls. Our employees are engaged in an improved product life
ASMI STATUTORY ANNUAL REPORT 2016 | FINANCIAL PERFORMANCE | 48A
BO
UT
ST
RA
TE
GY
& B
US
INE
SS
PE
RF
OR
MA
NC
E R
EV
IEW
SH
AR
EH
OL
DE
RS
GO
VE
RN
AN
CE
FIN
AN
CIA
L S
TAT
EM
EN
TS
PE
RF
OR
MA
NC
E R
EV
IEW

cycle process and our Product Safety Council is focused on further improving product safety through fundamental design.
In addition to addressing the technology needs of our customers, we also focus on further increasing equipment throughput and equipment reliability, thereby lowering the cost per wafer of our wafer processing systems. Combined with our commitment to quality, we continuously strive to achieve industry-leading productivity. In addition, to enable further efficiencies in our manufacturing process, we exert significant effort on improving the level of standardization in our equipment portfolio by migrating to common platforms, sub-assemblies and components.
CORPORATE RESPONSIBILITYOur corporate responsibility outlook is supported by our vision of ZERO HARM! This means we strive to (i) prevent all injuries to our employees and our customers’ employees, (ii) reduce our environmental impact, and (iii) make positive contributions to society. We help create value for society through our technological innovations, and we try to meet the expectations of our stakeholders by engaging with them on the issues that matter to them.
We believe that our focus on sustainability not only creates value for our company, our stakeholders, and society, but also strengthens our brand and creates stronger relationships with our customers, employees, and investors. These strengthened relationships further drive our ability to innovate and bolster our product portfolio.
OPERATIONSThe broader semiconductor wafer fab equipment market showed a considerably solid performance with an estimated 10% year-over-year increase in 2016. Both the memory and the logic/foundry segments of the WFE market increased. Within memory capital spending in the DRAM segment dropped but this was offset by higher spending in the NAND flash segment. The single wafer ALD market, however, showed a contraction in 2016. Following strong double-digit growth in 2015, the single wafer ALD market dropped by more than 10% in 2016. Spending by logic and foundry customers increased strongly during the year, as customers started the ramp of the 10nm technology node. The increase in logic/foundry was, however, not enough to offset a considerable drop in the memory segment, which was still the key driver behind the growth in the single wafer ALD market in 2015. Within the memory market, both DRAM and NAND flash saw lower spending on single wafer ALD equipment.
Revenue impacted by contraction in single wafer ALD marketOur revenue dropped by 11% in 2016 which is mainly explained by the contraction in the single wafer ALD market during the year. After a moderation in the second half of 2015, sales remained stable at a quarterly level of around €140 million in the first quarters of 2016. In the fourth quarter of 2016, sales increased to €173 million. In terms of customer segments, for the year as a whole, sales were led by foundry, followed by logic. In 2015, sales were led by memory. In the first quarter of 2016, sales were still led by memory, building on the strength in 2015, but in the rest of the year, foundry and logic led the revenue stream.
The 11% drop in our total revenue in 2016 was mainly explained by lower ALD tool sales. While single wafer ALD demand went through a softer patch in 2016, our company made further progress, in cooperation with customers, to expand the number of ALD process steps and applications for the most advanced technology nodes. ALD is now firmly established as a key enabling technology. In logic, foundry, and memory, the leading customers have already ramped several technology generations based on our ALD equipment. Our ALD equipment is an enabling technology for spacer-defined multiple patterning and used by virtually all of the memory customers. In the logic and foundry sector, ALD is a core technology for high-k metal gate and advanced FinFET applications.
ASMI STATUTORY ANNUAL REPORT 2016 | FINANCIAL PERFORMANCE | 49A
BO
UT
ST
RA
TE
GY
& B
US
INE
SS
PE
RF
OR
MA
NC
E R
EV
IEW
SH
AR
EH
OL
DE
RS
GO
VE
RN
AN
CE
FIN
AN
CIA
L S
TAT
EM
EN
TS
PE
RF
OR
MA
NC
E R
EV
IEW
Broadening the customer baseIn recent years, we have further broadened our customer base. While in 2015 our total revenue growth was to a large extent driven by an increased contribution from the top four to ten customers, in 2016 the contribution from the top three customers increased again, driven by logic/foundry. Following several years of steady growth in customer deployment and the development of new applications, ALD has turned into a key growth driver for our company. Despite a decrease in sales, our ALD product lines continued to accounted for clearly more than half of total equipment revenue in 2016.
For the year in total, our new bookings increased by 2% in 2016 to €622 million. The book-to-bill as measured by orders divided by sales increased from 0.9 in 2015 to 1.0 in 2016. After a moderation in the second half of 2015 bookings increased to a quarterly level of approximately €160 million in the first half of 2016. In the third quarter of 2016 bookings dropped to €123 million but finished the year strongly with a new record high of €177 million in the fourth quarter of 2016. Equipment bookings in 2016 for ASMI as a whole were led by the foundry segment, followed by logic and memory. Logic was the leading customer segment in the first quarter of 2016, and foundry in the rest of the year. We finished the year with an order backlog of €157 million, an increase of 23% compared to the end of 2015.
Gross profit marginThe gross profit margin was relatively steady at 44.2% in 2016 compared to 44.1% in 2015. In the first three quarters of 2016, the gross margin was stable at around the 44% level, and increased to almost 45% in the fourth quarter of the year. Most of the quarter-by-quarter fluctuations can be explained by changes in the sales mix. Gross margins were stable in 2016 despite the drop in revenue. This reflects the impact from the programs that have been implemented in the recent years to further improve the efficiency and flexibility of our manufacturing and supply chain operations. These measures included new outsourcing initiatives, a stronger focus on sourcing of complete subassemblies and the migration of a major part of our supply base to Asia. Over time, these measures have contributed to a reduction in the fixed costs part of total costs of goods sold.
ExpensesSelling, general and administrative expenses, including restructuring expenses, dropped by 4% in 2016 and as a percentage of sales increased from 14% in 2015 to 15% in 2016. Research and development (R&D) expenses excluding impairment charges on capitalized development costs increased from 11% to 15% of sales. The impairment charges in 2015 were mainly related to the write-off of the remaining 450mm assets. The increase in R&D excluding impairment charges was the result of an increase in customer requests for new applications.
Operating profitOperating profit decreased to €82.2 million from €111.1 million in 2015 and the operating profit margin decreased to 13.8% from 16.6%.
Results from investmentsResults from investments, which primarily reflects our 39.19% shareholding in ASMPT, increased to €67.7 million from €44.2 million in 2015. These exclude the amortization of intangible assets related to ASMPT. ASMPT’s revenue increased by 10% in 2016 in Hong Kong dollars, following a 9% decrease in 2015. In 2015, particularly in the second half of that year, the market for assembly and packaging equipment went through a downturn but in 2016 market conditions clearly improved. ASMPT still recorded a slight year-on-year decrease in revenue in the first half of 2016, but returned to strong double digit growth in the second half of the year. Assembly equipment showed a revenue increase of more than 20% in 2016. Apart from a recovery in the overall Back-end market, ASMPT’s growth was supported by strong developments in specific market segments such as equipment for CMOS image sensors and LED. For SMT Solutions revenue still dropped for the full year, although this business also returned to year-on-year growth in the second half of 2016. ASMPT increased the gross margin to 37.6%.
ASMI STATUTORY ANNUAL REPORT 2016 | FINANCIAL PERFORMANCE | 50A
BO
UT
ST
RA
TE
GY
& B
US
INE
SS
PE
RF
OR
MA
NC
E R
EV
IEW
SH
AR
EH
OL
DE
RS
GO
VE
RN
AN
CE
FIN
AN
CIA
L S
TAT
EM
EN
TS
PE
RF
OR
MA
NC
E R
EV
IEW
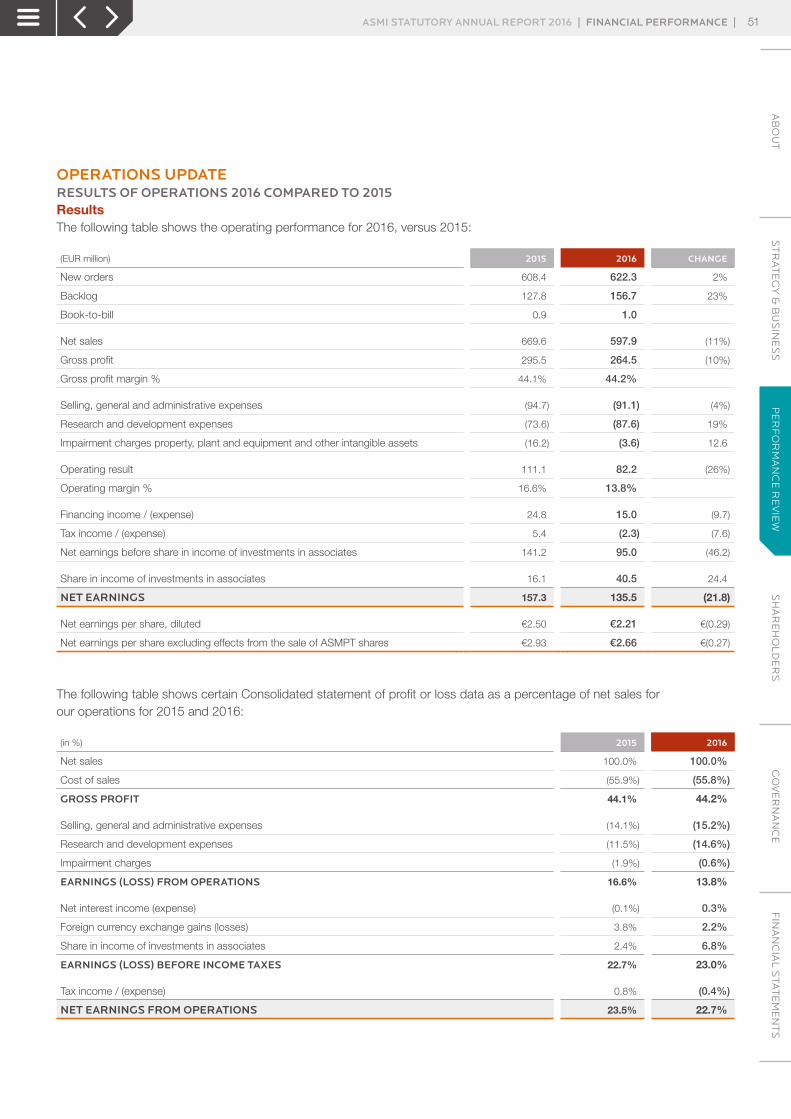
OPERATIONS UPDATE RESULTS OF OPERATIONS 2016 COMPARED TO 2015 ResultsThe following table shows the operating performance for 2016, versus 2015:
(EUR million) 2015 2016 CHANGE
New orders 608.4 622.3 2%
Backlog 127.8 156.7 23%
Book-to-bill 0.9 1.0
Net sales 669.6 597.9 (11%)
Gross profit 295.5 264.5 (10%)
Gross profit margin % 44.1% 44.2%
Selling, general and administrative expenses (94.7) (91.1) (4%)
Research and development expenses (73.6) (87.6) 19%
Impairment charges property, plant and equipment and other intangible assets (16.2) (3.6) 12.6
Operating result 111.1 82.2 (26%)
Operating margin % 16.6% 13.8%
Financing income / (expense) 24.8 15.0 (9.7)
Tax income / (expense) 5.4 (2.3) (7.6)
Net earnings before share in income of investments in associates 141.2 95.0 (46.2)
Share in income of investments in associates 16.1 40.5 24.4
NET EARNINGS 157.3 135.5 (21.8)
Net earnings per share, diluted €2.50 €2.21 €(0.29)
Net earnings per share excluding effects from the sale of ASMPT shares €2.93 €2.66 €(0.27)
The following table shows certain Consolidated statement of profit or loss data as a percentage of net sales for our operations for 2015 and 2016:
(in %) 2015 2016
Net sales 100.0% 100.0%
Cost of sales (55.9%) (55.8%)
GROSS PROFIT 44.1% 44.2%
Selling, general and administrative expenses (14.1%) (15.2%)
Research and development expenses (11.5%) (14.6%)
Impairment charges (1.9%) (0.6%)
EARNINGS (LOSS) FROM OPERATIONS 16.6% 13.8%
Net interest income (expense) (0.1%) 0.3%
Foreign currency exchange gains (losses) 3.8% 2.2%
Share in income of investments in associates 2.4% 6.8%
EARNINGS (LOSS) BEFORE INCOME TAXES 22.7% 23.0%
Tax income / (expense) 0.8% (0.4%)
NET EARNINGS FROM OPERATIONS 23.5% 22.7%
ASMI STATUTORY ANNUAL REPORT 2016 | FINANCIAL PERFORMANCE | 51A
BO
UT
ST
RA
TE
GY
& B
US
INE
SS
PE
RF
OR
MA
NC
E R
EV
IEW
SH
AR
EH
OL
DE
RS
GO
VE
RN
AN
CE
FIN
AN
CIA
L S
TAT
EM
EN
TS
PE
RF
OR
MA
NC
E R
EV
IEW
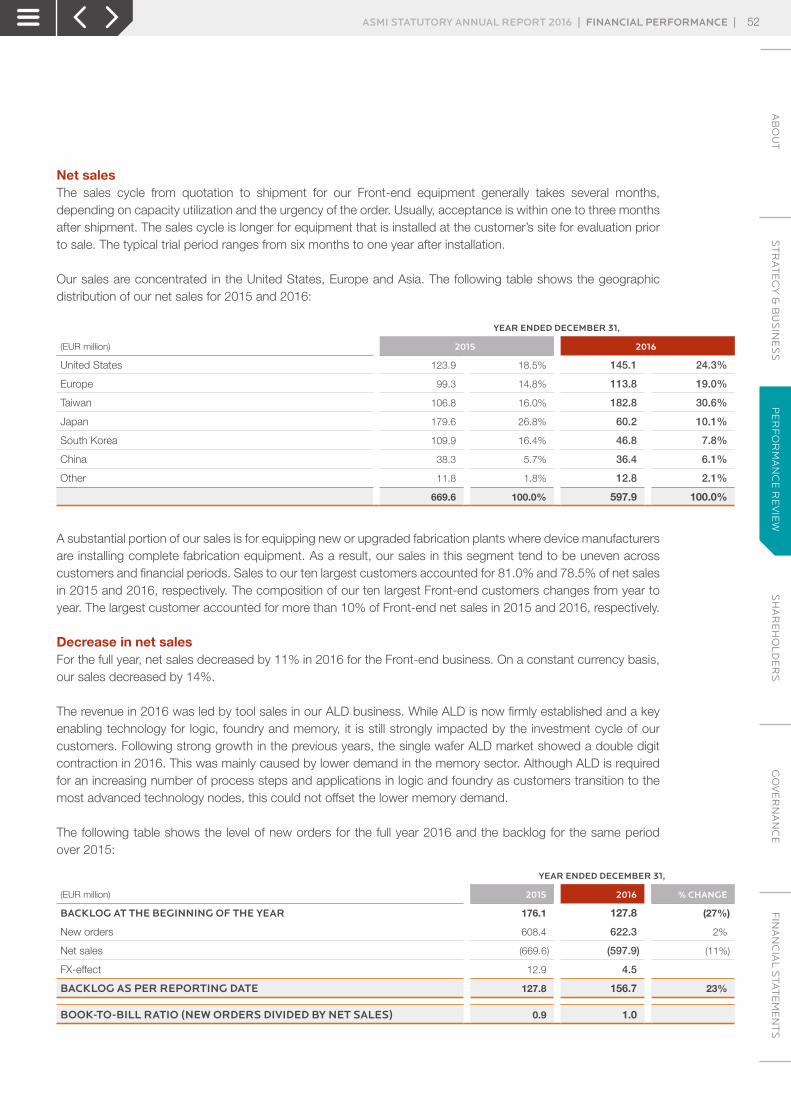
Net salesThe sales cycle from quotation to shipment for our Front-end equipment generally takes several months, depending on capacity utilization and the urgency of the order. Usually, acceptance is within one to three months after shipment. The sales cycle is longer for equipment that is installed at the customer’s site for evaluation prior to sale. The typical trial period ranges from six months to one year after installation.
Our sales are concentrated in the United States, Europe and Asia. The following table shows the geographic distribution of our net sales for 2015 and 2016:
YEAR ENDED DECEMBER 31,
(EUR million) 2015 2016
United States 123.9 18.5% 145.1 24.3%
Europe 99.3 14.8% 113.8 19.0%
Taiwan 106.8 16.0% 182.8 30.6%
Japan 179.6 26.8% 60.2 10.1%
South Korea 109.9 16.4% 46.8 7.8%
China 38.3 5.7% 36.4 6.1%
Other 11.8 1.8% 12.8 2.1%
669.6 100.0% 597.9 100.0%
A substantial portion of our sales is for equipping new or upgraded fabrication plants where device manufacturers are installing complete fabrication equipment. As a result, our sales in this segment tend to be uneven across customers and financial periods. Sales to our ten largest customers accounted for 81.0% and 78.5% of net sales in 2015 and 2016, respectively. The composition of our ten largest Front-end customers changes from year to year. The largest customer accounted for more than 10% of Front-end net sales in 2015 and 2016, respectively.
Decrease in net salesFor the full year, net sales decreased by 11% in 2016 for the Front-end business. On a constant currency basis, our sales decreased by 14%.
The revenue in 2016 was led by tool sales in our ALD business. While ALD is now firmly established and a key enabling technology for logic, foundry and memory, it is still strongly impacted by the investment cycle of our customers. Following strong growth in the previous years, the single wafer ALD market showed a double digit contraction in 2016. This was mainly caused by lower demand in the memory sector. Although ALD is required for an increasing number of process steps and applications in logic and foundry as customers transition to the most advanced technology nodes, this could not offset the lower memory demand.
The following table shows the level of new orders for the full year 2016 and the backlog for the same period over 2015:
YEAR ENDED DECEMBER 31,
(EUR million) 2015 2016 % CHANGE
BACKLOG AT THE BEGINNING OF THE YEAR 176.1 127.8 (27%)
New orders 608.4 622.3 2%
Net sales (669.6) (597.9) (11%)
FX-effect 12.9 4.5
BACKLOG AS PER REPORTING DATE 127.8 156.7 23%
BOOK-TO-BILL RATIO (NEW ORDERS DIVIDED BY NET SALES) 0.9 1.0
ASMI STATUTORY ANNUAL REPORT 2016 | FINANCIAL PERFORMANCE | 52A
BO
UT
ST
RA
TE
GY
& B
US
INE
SS
PE
RF
OR
MA
NC
E R
EV
IEW
SH
AR
EH
OL
DE
RS
GO
VE
RN
AN
CE
FIN
AN
CIA
L S
TAT
EM
EN
TS
PE
RF
OR
MA
NC
E R
EV
IEW
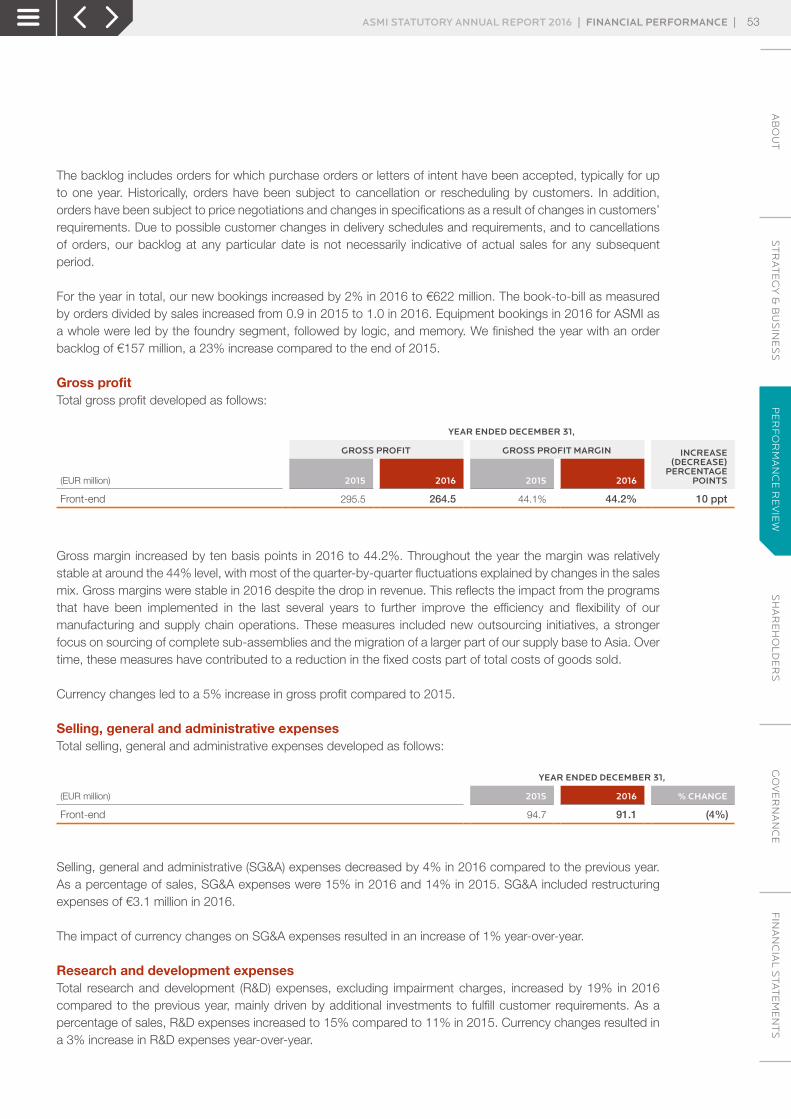
The backlog includes orders for which purchase orders or letters of intent have been accepted, typically for up to one year. Historically, orders have been subject to cancellation or rescheduling by customers. In addition, orders have been subject to price negotiations and changes in specifications as a result of changes in customers’ requirements. Due to possible customer changes in delivery schedules and requirements, and to cancellations of orders, our backlog at any particular date is not necessarily indicative of actual sales for any subsequent period.
For the year in total, our new bookings increased by 2% in 2016 to €622 million. The book-to-bill as measured by orders divided by sales increased from 0.9 in 2015 to 1.0 in 2016. Equipment bookings in 2016 for ASMI as a whole were led by the foundry segment, followed by logic, and memory. We finished the year with an order backlog of €157 million, a 23% increase compared to the end of 2015.
Gross profitTotal gross profit developed as follows:
YEAR ENDED DECEMBER 31,
GROSS PROFIT GROSS PROFIT MARGIN INCREASE (DECREASE)
PERCENTAGE POINTS(EUR million) 2015 2016 2015 2016
Front-end 295.5 264.5 44.1% 44.2% 10 ppt
Gross margin increased by ten basis points in 2016 to 44.2%. Throughout the year the margin was relatively stable at around the 44% level, with most of the quarter-by-quarter fluctuations explained by changes in the sales mix. Gross margins were stable in 2016 despite the drop in revenue. This reflects the impact from the programs that have been implemented in the last several years to further improve the efficiency and flexibility of our manufacturing and supply chain operations. These measures included new outsourcing initiatives, a stronger focus on sourcing of complete sub-assemblies and the migration of a larger part of our supply base to Asia. Over time, these measures have contributed to a reduction in the fixed costs part of total costs of goods sold.
Currency changes led to a 5% increase in gross profit compared to 2015.
Selling, general and administrative expensesTotal selling, general and administrative expenses developed as follows:
YEAR ENDED DECEMBER 31,
(EUR million) 2015 2016 % CHANGE
Front-end 94.7 91.1 (4%)
Selling, general and administrative (SG&A) expenses decreased by 4% in 2016 compared to the previous year. As a percentage of sales, SG&A expenses were 15% in 2016 and 14% in 2015. SG&A included restructuring expenses of €3.1 million in 2016.
The impact of currency changes on SG&A expenses resulted in an increase of 1% year-over-year.
Research and development expensesTotal research and development (R&D) expenses, excluding impairment charges, increased by 19% in 2016 compared to the previous year, mainly driven by additional investments to fulfill customer requirements. As a percentage of sales, R&D expenses increased to 15% compared to 11% in 2015. Currency changes resulted in a 3% increase in R&D expenses year-over-year.
ASMI STATUTORY ANNUAL REPORT 2016 | FINANCIAL PERFORMANCE | 53A
BO
UT
ST
RA
TE
GY
& B
US
INE
SS
PE
RF
OR
MA
NC
E R
EV
IEW
SH
AR
EH
OL
DE
RS
GO
VE
RN
AN
CE
FIN
AN
CIA
L S
TAT
EM
EN
TS
PE
RF
OR
MA
NC
E R
EV
IEW
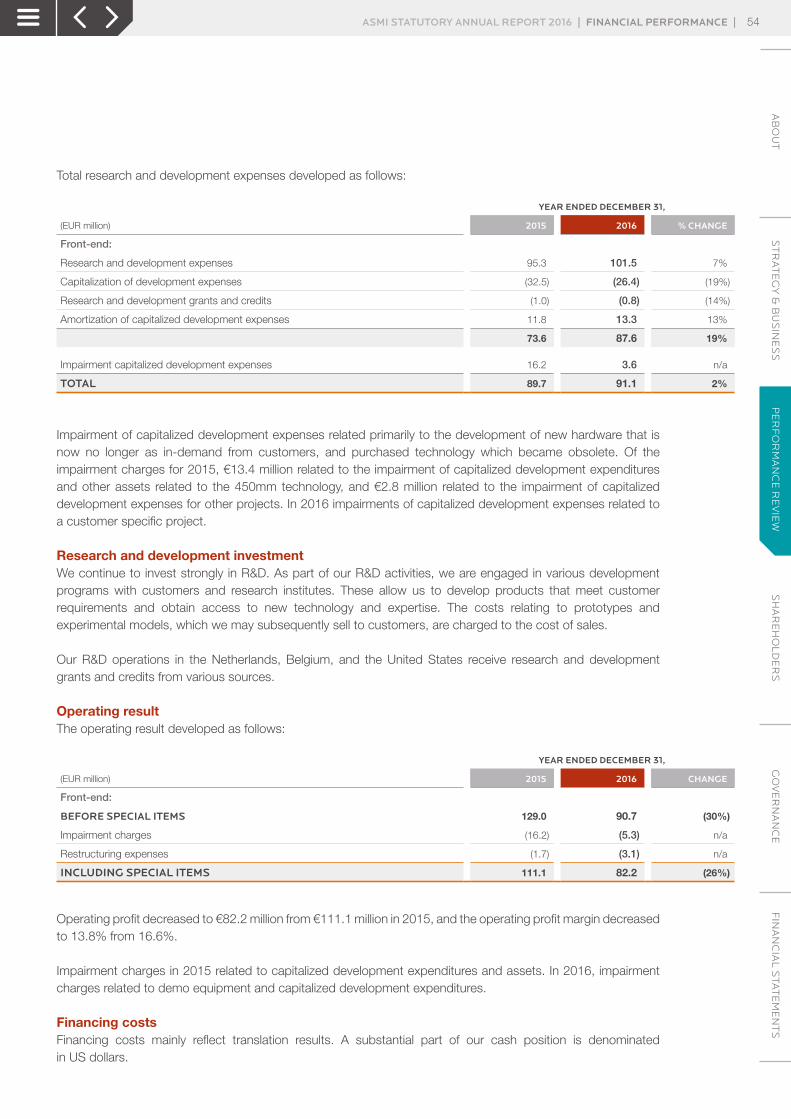
Total research and development expenses developed as follows:
YEAR ENDED DECEMBER 31,
(EUR million) 2015 2016 % CHANGE
Front-end:
Research and development expenses 95.3 101.5 7%
Capitalization of development expenses (32.5) (26.4) (19%)
Research and development grants and credits (1.0) (0.8) (14%)
Amortization of capitalized development expenses 11.8 13.3 13%
73.6 87.6 19%
Impairment capitalized development expenses 16.2 3.6 n/a
TOTAL 89.7 91.1 2%
Impairment of capitalized development expenses related primarily to the development of new hardware that is now no longer as in-demand from customers, and purchased technology which became obsolete. Of the impairment charges for 2015, €13.4 million related to the impairment of capitalized development expenditures and other assets related to the 450mm technology, and €2.8 million related to the impairment of capitalized development expenses for other projects. In 2016 impairments of capitalized development expenses related to a customer specific project.
Research and development investmentWe continue to invest strongly in R&D. As part of our R&D activities, we are engaged in various development programs with customers and research institutes. These allow us to develop products that meet customer requirements and obtain access to new technology and expertise. The costs relating to prototypes and experimental models, which we may subsequently sell to customers, are charged to the cost of sales.
Our R&D operations in the Netherlands, Belgium, and the United States receive research and development grants and credits from various sources.
Operating resultThe operating result developed as follows:
YEAR ENDED DECEMBER 31,
(EUR million) 2015 2016 CHANGE
Front-end:
BEFORE SPECIAL ITEMS 129.0 90.7 (30%)
Impairment charges (16.2) (5.3) n/a
Restructuring expenses (1.7) (3.1) n/a
INCLUDING SPECIAL ITEMS 111.1 82.2 (26%)
Operating profit decreased to €82.2 million from €111.1 million in 2015, and the operating profit margin decreased to 13.8% from 16.6%.
Impairment charges in 2015 related to capitalized development expenditures and assets. In 2016, impairment charges related to demo equipment and capitalized development expenditures.
Financing costsFinancing costs mainly reflect translation results. A substantial part of our cash position is denominated in US dollars.
ASMI STATUTORY ANNUAL REPORT 2016 | FINANCIAL PERFORMANCE | 54A
BO
UT
ST
RA
TE
GY
& B
US
INE
SS
PE
RF
OR
MA
NC
E R
EV
IEW
SH
AR
EH
OL
DE
RS
GO
VE
RN
AN
CE
FIN
AN
CIA
L S
TAT
EM
EN
TS
PE
RF
OR
MA
NC
E R
EV
IEW
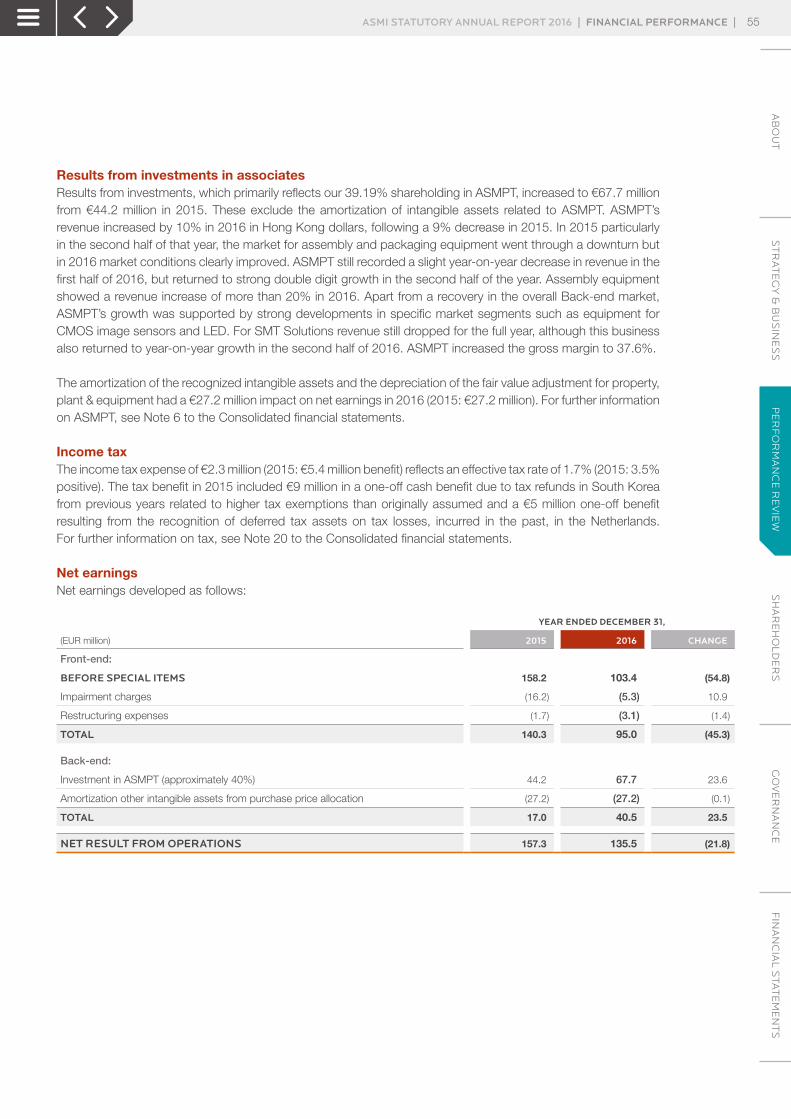
Results from investments in associatesResults from investments, which primarily reflects our 39.19% shareholding in ASMPT, increased to €67.7 million from €44.2 million in 2015. These exclude the amortization of intangible assets related to ASMPT. ASMPT’s revenue increased by 10% in 2016 in Hong Kong dollars, following a 9% decrease in 2015. In 2015 particularly in the second half of that year, the market for assembly and packaging equipment went through a downturn but in 2016 market conditions clearly improved. ASMPT still recorded a slight year-on-year decrease in revenue in the first half of 2016, but returned to strong double digit growth in the second half of the year. Assembly equipment showed a revenue increase of more than 20% in 2016. Apart from a recovery in the overall Back-end market, ASMPT’s growth was supported by strong developments in specific market segments such as equipment for CMOS image sensors and LED. For SMT Solutions revenue still dropped for the full year, although this business also returned to year-on-year growth in the second half of 2016. ASMPT increased the gross margin to 37.6%.
The amortization of the recognized intangible assets and the depreciation of the fair value adjustment for property, plant & equipment had a €27.2 million impact on net earnings in 2016 (2015: €27.2 million). For further information on ASMPT, see Note 6 to the Consolidated financial statements.
Income taxThe income tax expense of €2.3 million (2015: €5.4 million benefit) reflects an effective tax rate of 1.7% (2015: 3.5% positive). The tax benefit in 2015 included €9 million in a one-off cash benefit due to tax refunds in South Korea from previous years related to higher tax exemptions than originally assumed and a €5 million one-off benefit resulting from the recognition of deferred tax assets on tax losses, incurred in the past, in the Netherlands. For further information on tax, see Note 20 to the Consolidated financial statements.
Net earningsNet earnings developed as follows:
YEAR ENDED DECEMBER 31,
(EUR million) 2015 2016 CHANGE
Front-end:
BEFORE SPECIAL ITEMS 158.2 103.4 (54.8)
Impairment charges (16.2) (5.3) 10.9
Restructuring expenses (1.7) (3.1) (1.4)
TOTAL 140.3 95.0 (45.3)
Back-end:
Investment in ASMPT (approximately 40%) 44.2 67.7 23.6
Amortization other intangible assets from purchase price allocation (27.2) (27.2) (0.1)
TOTAL 17.0 40.5 23.5
NET RESULT FROM OPERATIONS 157.3 135.5 (21.8)
ASMI STATUTORY ANNUAL REPORT 2016 | FINANCIAL PERFORMANCE | 55A
BO
UT
ST
RA
TE
GY
& B
US
INE
SS
PE
RF
OR
MA
NC
E R
EV
IEW
SH
AR
EH
OL
DE
RS
GO
VE
RN
AN
CE
FIN
AN
CIA
L S
TAT
EM
EN
TS
PE
RF
OR
MA
NC
E R
EV
IEW

Cash flowThe following table shows the cash flow statement:
(EUR million) 2015 2016
NET EARNINGS FROM OPERATIONS 157.3 135.5
Adjustments to cash from operating activities:
Depreciation, amortization and impairments 54.3 51.7
Income tax (5.4) 2.3
Share in income of investments in associates (16.1) (40.5)
Share-based compensation 8.2 8.4
Non-cash financing costs (17.1) (2.5)
Changes in other assets and liabilities:
Accounts receivable (2.8) (43.4)
Inventories 13.4 (9.5)
Accounts payable and accrued expenses (3.0) 7.0
Other assets and liabilities (4.9) (10.2)
Income tax paid (9.2) (7.4)
NET CASH FROM OPERATING ACTIVITIES 174.8 91.4
Capital expenditures (33.2) (25.7)
Capitalized development expenditure (30.2) (27.3)
Purchase of intangible assets (7.2) (7.0)
Dividend received from associates 42.9 22.1
Other (0.9) –
NET CASH USED IN INVESTING ACTIVITIES (28.6) (38.0)
Purchase treasury shares (79.1) (97.0)
Debt issuance fees paid – (0.8)
Proceeds from shares issued 11.3 14.7
Dividend paid to shareholders ASMI (37.2) (42.7)
NET CASH USED IN FINANCING ACTIVITIES (104.9) (125.8)
TOTAL NET CASH PROVIDED / (USED) 41.3 (72.4)
Statement of financial positionWorking capital at December 31, 2016 was €157 million (2015: €114 million). Working capital consists of: inventories, accounts receivable, other current assets, accounts payable, provision for warranty and accrued expenses, and other payables. The number of outstanding days of working capital, measured against quarterly sales, increased from 69 days at December 31, 2015 to 82 days at December 31, 2016. This was mainly due to a different mix in sales during the last quarter of 2016, leading to high accounts receivables at the end of the year.
ASMI STATUTORY ANNUAL REPORT 2016 | FINANCIAL PERFORMANCE | 56A
BO
UT
ST
RA
TE
GY
& B
US
INE
SS
PE
RF
OR
MA
NC
E R
EV
IEW
SH
AR
EH
OL
DE
RS
GO
VE
RN
AN
CE
FIN
AN
CIA
L S
TAT
EM
EN
TS
PE
RF
OR
MA
NC
E R
EV
IEW
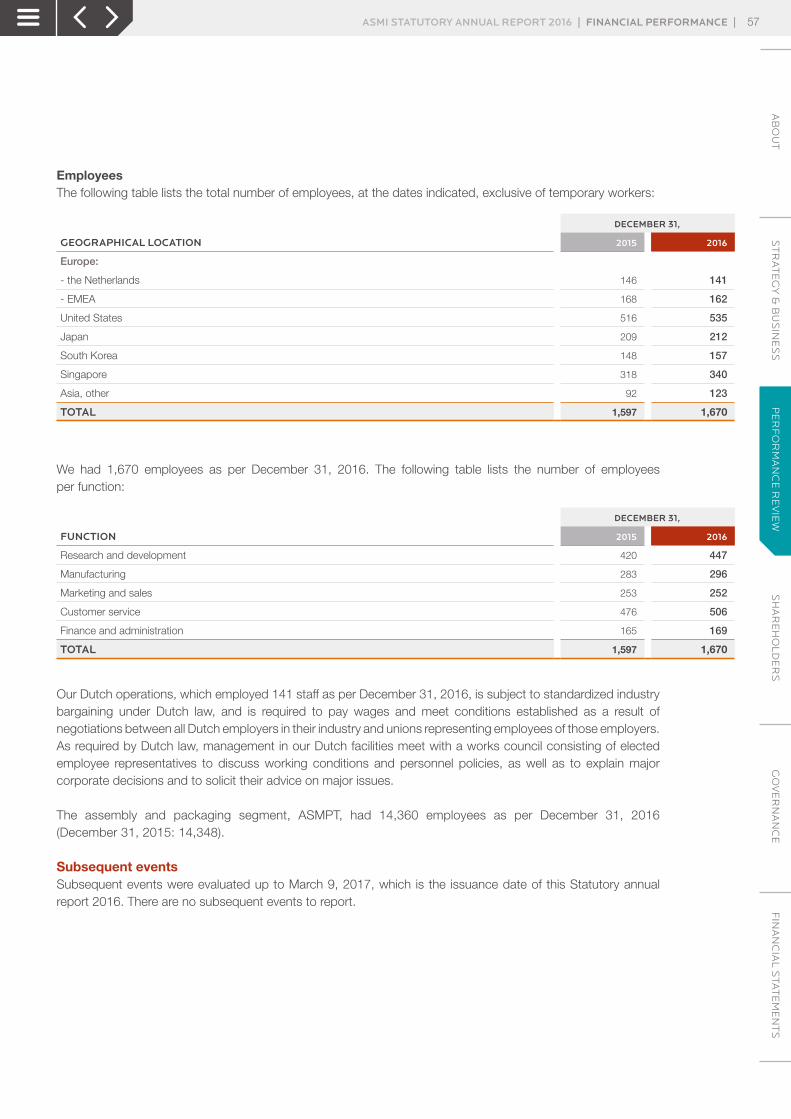
EmployeesThe following table lists the total number of employees, at the dates indicated, exclusive of temporary workers:
DECEMBER 31,
GEOGRAPHICAL LOCATION 2015 2016
Europe:
- the Netherlands 146 141
- EMEA 168 162
United States 516 535
Japan 209 212
South Korea 148 157
Singapore 318 340
Asia, other 92 123
TOTAL 1,597 1,670
We had 1,670 employees as per December 31, 2016. The following table lists the number of employees per function:
DECEMBER 31,
FUNCTION 2015 2016
Research and development 420 447
Manufacturing 283 296
Marketing and sales 253 252
Customer service 476 506
Finance and administration 165 169
TOTAL 1,597 1,670
Our Dutch operations, which employed 141 staff as per December 31, 2016, is subject to standardized industry bargaining under Dutch law, and is required to pay wages and meet conditions established as a result of negotiations between all Dutch employers in their industry and unions representing employees of those employers. As required by Dutch law, management in our Dutch facilities meet with a works council consisting of elected employee representatives to discuss working conditions and personnel policies, as well as to explain major corporate decisions and to solicit their advice on major issues.
The assembly and packaging segment, ASMPT, had 14,360 employees as per December 31, 2016 (December 31, 2015: 14,348).
Subsequent eventsSubsequent events were evaluated up to March 9, 2017, which is the issuance date of this Statutory annual report 2016. There are no subsequent events to report.
ASMI STATUTORY ANNUAL REPORT 2016 | FINANCIAL PERFORMANCE | 57A
BO
UT
ST
RA
TE
GY
& B
US
INE
SS
PE
RF
OR
MA
NC
E R
EV
IEW
SH
AR
EH
OL
DE
RS
GO
VE
RN
AN
CE
FIN
AN
CIA
L S
TAT
EM
EN
TS
PE
RF
OR
MA
NC
E R
EV
IEW
LIQUIDITY AND CAPITAL RESOURCESLIQUIDITY Our liquidity is affected by many factors, some of which are related to our ongoing operations while others are related to the semiconductor and semiconductor equipment industries, and to the economies of the countries in which we operate. Although our cash requirements fluctuate based on the timing and extent of these factors, we believe that cash generated by operations, together with the liquidity provided by our existing cash resources and our financing arrangements, will be sufficient to fund working capital, capital expenditures and other ongoing business requirements for at least the next twelve months.
On December 31, 2016, our principal sources of liquidity consisted of €378 million in cash and cash equivalents and €150 million in undrawn bank lines.
For the most part, our cash and cash equivalents are not guaranteed by any governmental agency. We place our cash and cash equivalents with high-quality financial institutions to limit our credit risk exposure.
CASH FLOW We generated cash from operating activities of €91.4 million in 2016 (2015: €174.8 million). We invested €38.0 million (2015: €28.6 million), and used €125.8 million (2015: €104.9 million) in financing activities.
DEBT We were debt-free as of December 31, 2016.
In December 2016, we finalized the renewal of our current standby revolving credit facility. The security of the previous credit agreement has been released. The maturity date of the new credit commitment of €150 million is December 16, 2021 with an extension option for up to two years. As per December 31, 2016 this facility was undrawn.
The credit facility of €150 million includes two financial covenants: › Minimum consolidated tangible net worth; and › Consolidated total net debt/total equity ratio.
These financial covenants are measured twice each year, on June 30 and December 31. We were in compliance with these financial covenants as per December 31, 2016.
See Notes 10, 15 and 16 to the Consolidated financial statements for more on our funding, treasury policies and our long-term debt.
ASMPTThe assembly and packaging segment of our business is organized in ASM Pacific Technology Ltd (ASMPT). Net cash of our 39.19%-owned associate was €262 million on December 31, 2016. The cash resources and borrowing capacity of ASMPT are not available to our wafer processing equipment segment.
Although certain directors of ASMI are directors of ASMPT, ASMPT is under no obligation to declare dividends to shareholders or enter into transactions that are beneficial to us. As a substantial shareholder, we can participate in the shareholders’ approval of the payment of dividends, but cannot compel their payment or size. Cash dividends received from ASMPT during 2015 and 2016 were €42.9 million and €22.1 million, respectively.
The market value of our 39.19% investment ASMPT was approximately €1,608 million as per December 31, 2016.
ASMI STATUTORY ANNUAL REPORT 2016 | FINANCIAL PERFORMANCE | 58A
BO
UT
ST
RA
TE
GY
& B
US
INE
SS
PE
RF
OR
MA
NC
E R
EV
IEW
SH
AR
EH
OL
DE
RS
GO
VE
RN
AN
CE
FIN
AN
CIA
L S
TAT
EM
EN
TS
PE
RF
OR
MA
NC
E R
EV
IEW
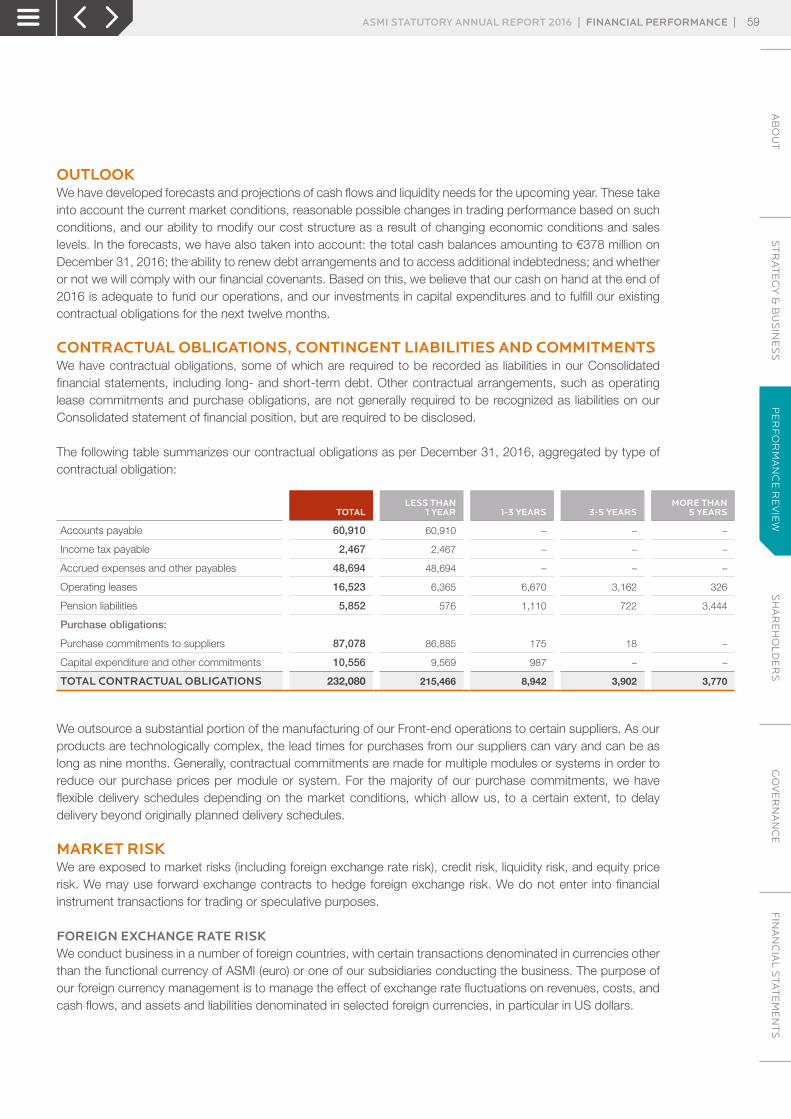
OUTLOOKWe have developed forecasts and projections of cash flows and liquidity needs for the upcoming year. These take into account the current market conditions, reasonable possible changes in trading performance based on such conditions, and our ability to modify our cost structure as a result of changing economic conditions and sales levels. In the forecasts, we have also taken into account: the total cash balances amounting to €378 million on December 31, 2016; the ability to renew debt arrangements and to access additional indebtedness; and whether or not we will comply with our financial covenants. Based on this, we believe that our cash on hand at the end of 2016 is adequate to fund our operations, and our investments in capital expenditures and to fulfill our existing contractual obligations for the next twelve months.
CONTRACTUAL OBLIGATIONS, CONTINGENT LIABILITIES AND COMMITMENTS We have contractual obligations, some of which are required to be recorded as liabilities in our Consolidated financial statements, including long- and short-term debt. Other contractual arrangements, such as operating lease commitments and purchase obligations, are not generally required to be recognized as liabilities on our Consolidated statement of financial position, but are required to be disclosed.
The following table summarizes our contractual obligations as per December 31, 2016, aggregated by type of contractual obligation:
TOTALLESS THAN
1 YEAR 1-3 YEARS 3-5 YEARSMORE THAN
5 YEARS
Accounts payable 60,910 60,910 – – –
Income tax payable 2,467 2,467 – – –
Accrued expenses and other payables 48,694 48,694 – – –
Operating leases 16,523 6,365 6,670 3,162 326
Pension liabilities 5,852 576 1,110 722 3,444
Purchase obligations:
Purchase commitments to suppliers 87,078 86,885 175 18 –
Capital expenditure and other commitments 10,556 9,569 987 – –
TOTAL CONTRACTUAL OBLIGATIONS 232,080 215,466 8,942 3,902 3,770
We outsource a substantial portion of the manufacturing of our Front-end operations to certain suppliers. As our products are technologically complex, the lead times for purchases from our suppliers can vary and can be as long as nine months. Generally, contractual commitments are made for multiple modules or systems in order to reduce our purchase prices per module or system. For the majority of our purchase commitments, we have flexible delivery schedules depending on the market conditions, which allow us, to a certain extent, to delay delivery beyond originally planned delivery schedules.
MARKET RISKWe are exposed to market risks (including foreign exchange rate risk), credit risk, liquidity risk, and equity price risk. We may use forward exchange contracts to hedge foreign exchange risk. We do not enter into financial instrument transactions for trading or speculative purposes.
FOREIGN EXCHANGE RATE RISK We conduct business in a number of foreign countries, with certain transactions denominated in currencies other than the functional currency of ASMI (euro) or one of our subsidiaries conducting the business. The purpose of our foreign currency management is to manage the effect of exchange rate fluctuations on revenues, costs, and cash flows, and assets and liabilities denominated in selected foreign currencies, in particular in US dollars.
ASMI STATUTORY ANNUAL REPORT 2016 | FINANCIAL PERFORMANCE | 59A
BO
UT
ST
RA
TE
GY
& B
US
INE
SS
PE
RF
OR
MA
NC
E R
EV
IEW
SH
AR
EH
OL
DE
RS
GO
VE
RN
AN
CE
FIN
AN
CIA
L S
TAT
EM
EN
TS
PE
RF
OR
MA
NC
E R
EV
IEW
The majority of revenues and costs of our wafer processing equipment segment are denominated in US dollars, Singapore dollars, Korean won and Japanese yen. Since foreign currency exposure on our trading positions is not significant, no forward exchange contracts are used. The effect of exchange rate fluctuations on revenues, costs, and cash flows, and assets and liabilities denominated in foreign currencies is reviewed periodically.
Forward contractsWe may use forward exchange contracts to hedge foreign exchange risk of anticipated sales or purchase transactions in the normal course of business, which occur within the next twelve months, for which we have a firm commitment from a customer or to a supplier. The terms of these contracts are consistent with the timing of the transactions being hedged. The hedges related to forecasted transactions are designated and documented at the inception of the hedge as cash flow hedges, and are evaluated for effectiveness quarterly. The effective portion of the gain or loss on these hedges is reported as a component of accumulated other comprehensive income in Shareholders’ Equity, and is reclassified into earnings when the hedged transaction affects earnings. As per December 31, 2016, we had no foreign exchange contracts in place.
The majority of revenues and costs of our assembly and packaging segment are denominated in Hong Kong dollars, Chinese yuan, and US dollars. The functional currency of our assembly and packaging segment (Hong Kong dollar) is linked to the US dollar.
As we did not use forward exchange contracts, no unrealized gains were included in accumulated other comprehensive income as per December 31, 2016.
Derivative instrumentsFurthermore, we may manage the currency exposure of certain receivables and payables using derivative instruments, such as forward exchange contracts (fair value hedges) and currency swaps, and non-derivative instruments, such as debt borrowings in foreign currencies. The gains or losses on these instruments provide an offset to the gains or losses recorded on receivables and payables denominated in foreign currencies. The derivative instruments are recorded at fair value and changes in fair value are recorded in earnings under foreign currency exchange gains (losses) in the Consolidated statement of profit or loss. Receivables and payables denominated in foreign currencies are recorded at the exchange rate at the balance sheet date, and gains and losses as a result of changes in exchange rates are recorded in earnings under foreign currency exchange gains (losses) in the Consolidated statement of profit or loss.
To the extent that foreign currency fluctuations affect the value of our investments in our foreign affiliates, they are not hedged. The cumulative effect of these fluctuations is separately reported in Consolidated Shareholders’ Equity. For the year ended December 31, 2016, we recorded a favorable movement of €41 million (year-end December 31, 2015: €137 million). See Note 11 to our Consolidated financial statements.
The following tables analyze our sensitivity to a hypothetical 10% strengthening and 10% weakening of the US dollar, Singapore dollar, Hong Kong dollar, Korean won or Japanese yen against the euro as per December 31, 2015 and December 31, 2016.
ASMI STATUTORY ANNUAL REPORT 2016 | FINANCIAL PERFORMANCE | 60A
BO
UT
ST
RA
TE
GY
& B
US
INE
SS
PE
RF
OR
MA
NC
E R
EV
IEW
SH
AR
EH
OL
DE
RS
GO
VE
RN
AN
CE
FIN
AN
CIA
L S
TAT
EM
EN
TS
PE
RF
OR
MA
NC
E R
EV
IEW
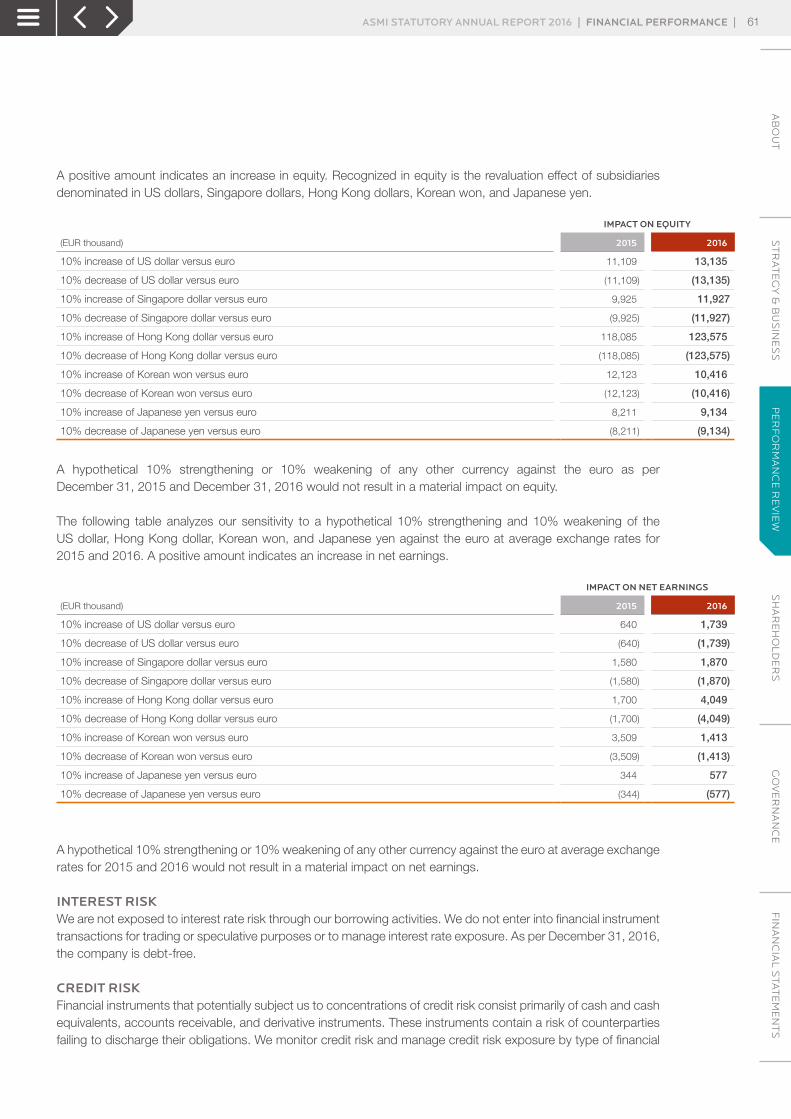
A positive amount indicates an increase in equity. Recognized in equity is the revaluation effect of subsidiaries denominated in US dollars, Singapore dollars, Hong Kong dollars, Korean won, and Japanese yen.
IMPACT ON EQUITY
(EUR thousand) 2015 2016
10% increase of US dollar versus euro 11,109 13,135
10% decrease of US dollar versus euro (11,109) (13,135)
10% increase of Singapore dollar versus euro 9,925 11,927
10% decrease of Singapore dollar versus euro (9,925) (11,927)
10% increase of Hong Kong dollar versus euro 118,085 123,575
10% decrease of Hong Kong dollar versus euro (118,085) (123,575)
10% increase of Korean won versus euro 12,123 10,416
10% decrease of Korean won versus euro (12,123) (10,416)
10% increase of Japanese yen versus euro 8,211 9,134
10% decrease of Japanese yen versus euro (8,211) (9,134)
A hypothetical 10% strengthening or 10% weakening of any other currency against the euro as per December 31, 2015 and December 31, 2016 would not result in a material impact on equity.
The following table analyzes our sensitivity to a hypothetical 10% strengthening and 10% weakening of the US dollar, Hong Kong dollar, Korean won, and Japanese yen against the euro at average exchange rates for 2015 and 2016. A positive amount indicates an increase in net earnings.
IMPACT ON NET EARNINGS
(EUR thousand) 2015 2016
10% increase of US dollar versus euro 640 1,739
10% decrease of US dollar versus euro (640) (1,739)
10% increase of Singapore dollar versus euro 1,580 1,870
10% decrease of Singapore dollar versus euro (1,580) (1,870)
10% increase of Hong Kong dollar versus euro 1,700 4,049
10% decrease of Hong Kong dollar versus euro (1,700) (4,049)
10% increase of Korean won versus euro 3,509 1,413
10% decrease of Korean won versus euro (3,509) (1,413)
10% increase of Japanese yen versus euro 344 577
10% decrease of Japanese yen versus euro (344) (577)
A hypothetical 10% strengthening or 10% weakening of any other currency against the euro at average exchange rates for 2015 and 2016 would not result in a material impact on net earnings.
INTEREST RISK We are not exposed to interest rate risk through our borrowing activities. We do not enter into financial instrument transactions for trading or speculative purposes or to manage interest rate exposure. As per December 31, 2016, the company is debt-free.
CREDIT RISK Financial instruments that potentially subject us to concentrations of credit risk consist primarily of cash and cash equivalents, accounts receivable, and derivative instruments. These instruments contain a risk of counterparties failing to discharge their obligations. We monitor credit risk and manage credit risk exposure by type of financial
ASMI STATUTORY ANNUAL REPORT 2016 | FINANCIAL PERFORMANCE | 61A
BO
UT
ST
RA
TE
GY
& B
US
INE
SS
PE
RF
OR
MA
NC
E R
EV
IEW
SH
AR
EH
OL
DE
RS
GO
VE
RN
AN
CE
FIN
AN
CIA
L S
TAT
EM
EN
TS
PE
RF
OR
MA
NC
E R
EV
IEW

instrument by assessing the creditworthiness of counterparties. We do not anticipate nonperformance by counterparties given their high creditworthiness.
Our customers are semiconductor device manufacturers located throughout the world. We perform ongoing credit evaluations of our customers’ financial condition. We take additional measures to mitigate credit risk when considered appropriate by means of down payments or letters of credit. We generally do not require collateral or other security to support financial instruments with credit risk.
Concentrations of credit risk (whether on- or off-balance sheet) that arise from financial instruments exist for groups of customers or counterparties when they have similar economic characteristics that would cause their ability to meet contractual obligations to be similarly affected by changes in economic or other conditions.
Small number of large clientsWe derive a significant percentage of our revenue from a small number of large customers. Our three largest customers accounted each for more than 7.5% of net sales in 2016. The ten largest customers accounted for approximately 78.5% of net sales in 2016 (2015: 81.0%). Sales to these large customers also may fluctuate significantly from time to time depending on the timing and level of purchases by these customers. Significant orders from such customers may expose us to a concentration of credit risk and difficulties in collecting amounts due, which could harm our financial results. At December 31, 2016, one customer accounted for 30.0% of total accounts receivable.
We invest our cash and cash equivalents in short-term deposits and derivative instruments with high-rated financial institutions. We only enter into transactions with a limited number of major financial institutions that have high credit ratings, and we closely monitor the creditworthiness of our counterparties. Concentration risk is mitigated by not limiting the exposure to a single counter party.
The maximum credit exposure is equal to the carrying values of cash and cash equivalent, and accounts receivable.
EQUITY PRICE RISK The ASMPT investment is accounted for under the equity method on a go-forward basis. Equity method investments are tested for prolonged decline in value. The determination of whether an investment is impaired is made at the individual security level in each reporting period.
If the fair value of an investment is less than its carrying value at the balance sheet date, we determine whether the impairment is temporary or prolonged. The amount per share recognized on December 31, 2016 under equity accounting amounts to HKD63.14, whereas the level 1 fair value per share (being the market price of a share on the Hong Kong Stock Exchange) was HKD82.15 on December 31, 2016. Management concluded that based on quantitative analysis, no impairment of our share in ASMPT existed as of December 31, 2016.
ASMI STATUTORY ANNUAL REPORT 2016 | FINANCIAL PERFORMANCE | 62A
BO
UT
ST
RA
TE
GY
& B
US
INE
SS
PE
RF
OR
MA
NC
E R
EV
IEW
SH
AR
EH
OL
DE
RS
GO
VE
RN
AN
CE
FIN
AN
CIA
L S
TAT
EM
EN
TS
PE
RF
OR
MA
NC
E R
EV
IEW
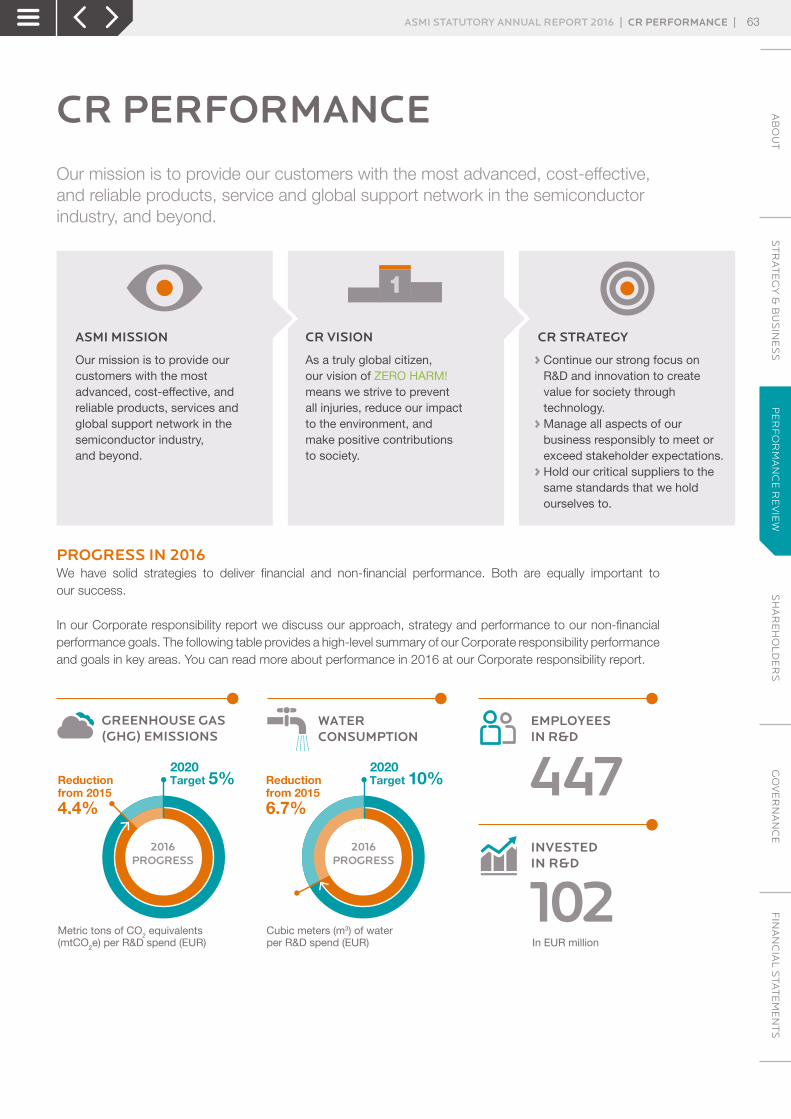
CR PERFORMANCEOur mission is to provide our customers with the most advanced, cost-effective, and reliable products, service and global support network in the semiconductor industry, and beyond.
› Continue our strong focus on R&D and innovation to create value for society through technology.
› Manage all aspects of our business responsibly to meet or exceed stakeholder expectations.
› Hold our critical suppliers to the same standards that we hold ourselves to.
CR STRATEGY
Our mission is to provide our customers with the most advanced, cost-effective, and reliable products, services and global support network in the semi conductor industry, and beyond.
ASMI MISSION
As a truly global citizen, our vision of ZERO HARM! means we strive to prevent all injuries, reduce our impact to the environment, and make positive contributions to society.
CR VISION
PROGRESS IN 2016We have solid strategies to deliver financial and non-financial performance. Both are equally important to our success.
In our Corporate responsibility report we discuss our approach, strategy and performance to our non-financial performance goals. The following table provides a high-level summary of our Corporate responsibility performance and goals in key areas. You can read more about performance in 2016 at our Corporate responsibility report.
WATERCONSUMPTION
EMPLOYEESIN R&D
447InvESTEDIN R&D
102In EUR million
GREENHOUSE GAS (GHG) EMISSIONS
Reductionfrom 2015 4.4%
Metric tons of CO2 equivalents(mtCO2e) per R&D spend (EUR)
Target 5%
2016PROGRESS
2020
Cubic meters (m3) of waterper R&D spend (EUR)
Reductionfrom 2015 6.7%
Target 10%
2016PROGRESS
2020
ASMI STATUTORY ANNUAL REPORT 2016 | CR PERFORMANCE | 63A
BO
UT
ST
RA
TE
GY
& B
US
INE
SS
PE
RF
OR
MA
NC
E R
EV
IEW
SH
AR
EH
OL
DE
RS
GO
VE
RN
AN
CE
FIN
AN
CIA
L S
TAT
EM
EN
TS
PE
RF
OR
MA
NC
E R
EV
IEW

REPORT 2016 PROGRESS TARGET
INNOVATION › We filed 95 patents and retained a total of 1,490 patents in force
› R&D investments of EUR 102 million
› Retain our technology leadership position in semiconductor equipment and processes with R&D investment and Intellectual Property (IP) protection
PRODUCT STEWARDSHIP AND PRODUCT LIFE CYCLE
› We are making good progress in Product Life Cycle Management. We significantly strengthened our Product Safety Design team organization and standards
› We continue to minimize chemical consumption needs during use of our products through design
› We have a goal of ZERO HARM!, which is not only during the design and manufacturing of our products, but also for the customers who use our product
› We strive for ZERO HARM! throughout our product life cycle
PEOPLE/SOCIAL › Retained number of employees, with increase in percent of employee in R&D
› 92.5% of all employees completed ethics training requirement
› Our Recordable Injury Rate remains flat to prior years’ performance at 0.34/100 employees
› Establish talent management competency at all ASMI locations worldwide
› Develop leadership pipeline and build high-performing teams
› Lower than industry turnover rate
› ZERO HARM! to our employees
ENVIRONMENT › We exceeded our water and greenhouse gas goals and made progress in our landfill diversion goal
› Our electricity usage is 31,814,761 kwh, our water consumption 178.7 (m3 x 1,000), and non-hazardous landfill diversion rate is 72% which is up from the previous year
› Our 2020 environmental goals are to drive reductions in normalized greenhouse gas emissions and water usage per R&D investment, and to increase our non-hazardous waste landfill diversion rate. See the Environmental Section of our Corporate responsibility report for full details
SUPPLY CHAIN › We are integrating our corporate responsibility requirements into our supply chain management system including contracts, scorecard and business reviews
› >90% of our critical suppliers acknowledged their commitment to our Supplier Code of Conduct and 86% of them completed the Self-Assessment Questionnaire
› Our goal is for critical suppliers to acknowledge their commitment to the supplier code and develop their own management system to ensure supply chain conformance to labor, ethics and EHS standards, principles and policies, which supports us in having a resilient supply chain
20132012 2014 2015
Global Injury and RECORDABLE RatEs
2016
1.5
1.2
0.9
0.6
0.3
Injury RateRecordable Injury Rate
0.34
0.63 4959 57
6572
In %
20132012 2014 2015 2016
LANDFILL DIVERSION RATE100
80
60
40
20
ASMI STATUTORY ANNUAL REPORT 2016 | CR PERFORMANCE | 64A
BO
UT
ST
RA
TE
GY
& B
US
INE
SS
PE
RF
OR
MA
NC
E R
EV
IEW
SH
AR
EH
OL
DE
RS
GO
VE
RN
AN
CE
FIN
AN
CIA
L S
TAT
EM
EN
TS
PE
RF
OR
MA
NC
E R
EV
IEW
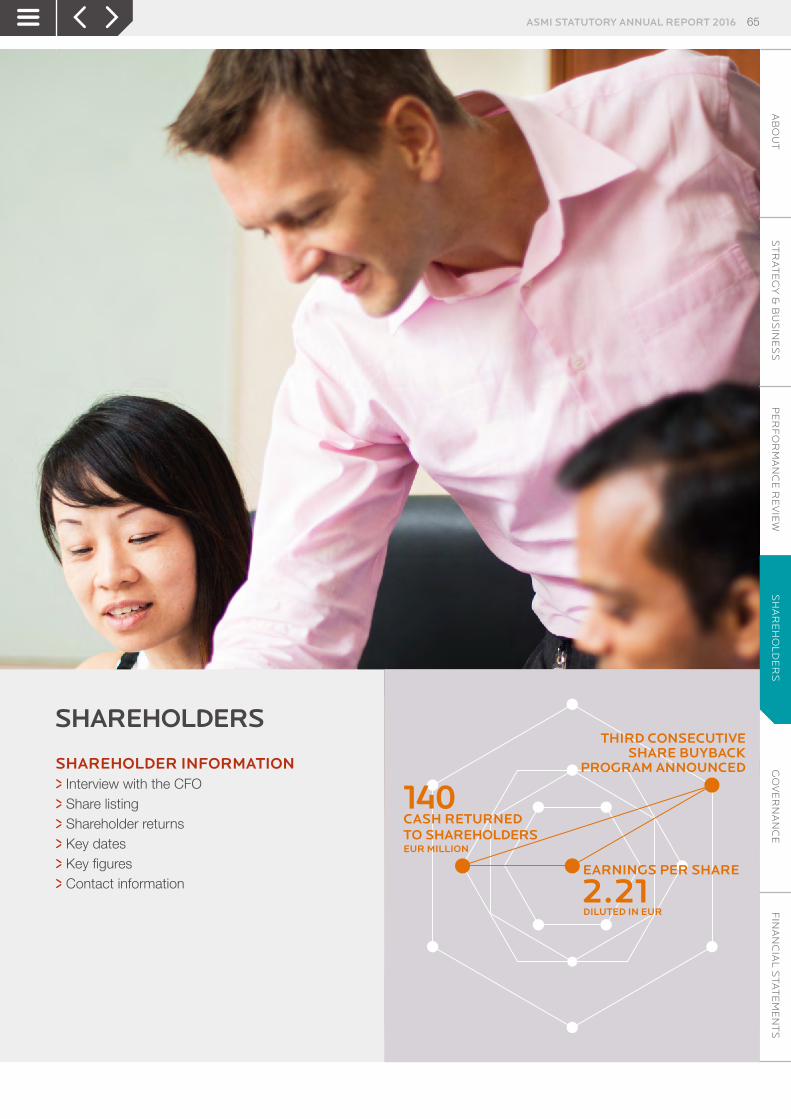
ASMI STATUTORY ANNUAL REPORT 2016 65A
BO
UT
ST
RA
TE
GY
& B
US
INE
SS
PE
RF
OR
MA
NC
E R
EV
IEW
SH
AR
EH
OL
DE
RS
GO
VE
RN
AN
CE
FIN
AN
CIA
L S
TAT
EM
EN
TS
SH
AR
EH
OL
DE
RS
SHAREHOLDERS
SHAREHOLDER INFORMATION >Interview with the CFO
>Share listing
>Shareholder returns
>Key dates
>Key figures
>Contact information
THIRD CONSECUTIVESHARE BUYBACK
PROGRAM ANNOUNCED
EARNINGS PER SHARE
2.21DILUTED IN EUR
CASH RETURNED TO SHAREHOLDERS
140EUR MILLION
INTERVIEW WITH THE CFO
SHAREHOLDER INFORMATION
PETER A.M. VAN BOMMELMember of the Management Boardand Chief Financial Officer
WE ARE COMMITTEDTO USING EXCESSCASH FOR THEBENEFIT OF OURSHAREHOLDERS
Although the drop off in the single wafer ALD market affected ASMI’s financial performance in 2016, Chief Financial Officer Peter A.M. Van Bommel expects this market to recover again in 2017. In the following interview he discusses some of the key financial topics that impacted the company in 2016, and explains the importance of maintaining a strong balance sheet to continue investing in the growth of the business.
HOW WOULD YOU DESCRIBE ASMI’S FINANCIAL PERFORMANCE IN 2016?After years of strong growth, the single wafer ALD market suffered a double-digit drop, due to lower spending in the memory segment. Even though we expect the single wafer ALD market to recover again in 2017, this slowdown impacted our financial performance last year. Our revenue was down 11% compared to the record level we saw in 2015. Gross margins were stable and operating expenses remained under control. SG&A expenses, excluding restructuring expenses were 5% lower. R&D expenses rose slightly which was the balance of an increase driven by customer requests for new applications and lower impairment charges compared to 2015. Operating margins remained comfortably in double digits at 13.8% (2015: 16.6%). Results from investments – reflecting our 39% share of ASMPT’s net profits – showed a strong increase of 52% to €68 million. In total, normalized net profits decreased by 22% to €163 million.
FREE CASH FLOW DROPPED IN 2016. WHAT FACTORS CAUSED THIS?On the back of structural improvements in the gross margins and working capital levels, over the last few years we have consistently generated positive free cash flow. In 2016 the free cash flow dropped to €31 million, down from a record high of €104 million in 2015. Next to lower profitably, this was the result of cash used by working capital. While the quality and the underlying level of working capital remained healthy, this increase was impacted by the back-half weighted character of sales in the fourth quarter of 2016, as well as a rise in inventories in anticipation of increasing shipments in the forthcoming quarters.
ASMI STATUTORY ANNUAL REPORT 2016 | INTERVIEW WITH THE CFO | 66A
BO
UT
ST
RA
TE
GY
& B
US
INE
SS
PE
RF
OR
MA
NC
E R
EV
IEW
SH
AR
EH
OL
DE
RS
GO
VE
RN
AN
CE
FIN
AN
CIA
L S
TAT
EM
EN
TS
SH
AR
EH
OL
DE
RS
WHAT ARE YOUR EXPECTATIONS FOR GROSS MARGINS GOING FORWARD?We kept gross margins stable at approximately 44% in 2016, despite the drop in revenue. This solid performance reflects the impact from the programs that we implemented over the last several years to further improve the efficiency and flexibility of our manufacturing and supply chain operations. These measures included new outsourcing initiatives and a stronger focus on sourcing of complete subassemblies. Over time, we have further reduced the fixed costs part of our total costs of goods sold, which means that our gross margins are not impacted as much by short-term fluctuations in activity levels. Another example is the migration of a larger part of our supply base to Asia. With an ongoing strong cost focus throughout our organization, we expect to maintain gross margins within a percentage range of low-to-mid 40s, barring a downturn in the semiconductor equipment market. On a quarterly basis, gross margins will continue to be impacted by factors such as revenue mix and utilization.
ASMI ANNOUNCED ANOTHER SHARE BUYBACK PROGRAM LAST YEAR. CAN YOU SAY MORE ABOUT YOUR POLICY WITH RESPECT TO EXCESS CASH AND SHAREHOLDER REMUNERATION? Our key priority is to maintain a strong balance sheet that enables us to continue investing in the growth of our business. With free cash flow consistently positive, over the past few years our cash position has remained above our minimum target level of around €300 million. Our commitment is to use excess cash for the benefit of our shareholders. We aim to pay a sustainable dividend. After an increase of 17% in 2016, we will propose a stable dividend of €0.70 per share to the AGM 2017. In addition, since 2014 we have announced three consecutive share buyback programs. Last October we announced a new buyback program for an amount of €50 million, which was 13% complete by the end of December 2016. As our financial position continues to be solid, we have announced early March an increase in the size of the current share buyback program from €50 million to €100 million. In total, we spent approximately €140 million on dividends and share buybacks during 2016, up 20% from €116 million in 2015.
ASMI STATUTORY ANNUAL REPORT 2016 | INTERVIEW WITH THE CFO | 67A
BO
UT
ST
RA
TE
GY
& B
US
INE
SS
PE
RF
OR
MA
NC
E R
EV
IEW
SH
AR
EH
OL
DE
RS
GO
VE
RN
AN
CE
FIN
AN
CIA
L S
TAT
EM
EN
TS
SH
AR
EH
OL
DE
RS

SHARE LISTINGOur strategy aims to create sustainable value for all our stakeholders. As part of this strategy, we are committed to creating long-term shareholder value. This chapter provides information that is particularly relevant for shareholders and investors, including information related to the share listing and share price performance, dividends, and share buybacks.
ASMI’s shares are listed on the NYSE Euronext Amsterdam exchange (symbol: ASM) where ASMI is included in the Midcap index.
On December 31, 2016, we had 59,815,843 outstanding common shares, with 3,039 registered with us in the Netherlands; 59,409,659 registered with our transfer agent in the Netherlands, ABN AMRO Bank NV; and 403,145 registered with our transfer agent in the United States, Citibank, NA, New York.
MARKET CAPITALIZATIONAt year-end, ASMI had a total of 59,815,843 shares outstanding. The market capitalization of ASMI at year-end was €2,551 million, based on the closing share price of €42.64 at Euronext Amsterdam on December 30, 2016. At year-end 2015, the market capitalization was €2,231 million.
The graph below provides an overview of the shareholders’ structure. Further details on the largest reported shareholders can be found in the Corporate Governance chapter on page 91.
VOTING RIGHTS ASMI
Rest of Shareholders
Eminence Capital, LLC
Norges Bank
Schroders Plc
Massachusetts Financial Services Company
Goldman Sachs Group Inc.
Stichting ADP
J.P. Morgan Chase & Co
16
15
8
63 33
46
VOLUNTARY DELISTING FROM NASDAQOn July 29, 2015, we announced that we would apply for the voluntary delisting from the Nasdaq market. This was due to the low and declining trading volume of our NY Registry Shares on Nasdaq, which at that time accounted for less than 1% of the worldwide trading volume of our shares. On August 21, 2015, we announced that the delisting from Nasdaq had become effective. Since that date, our NY Registry Shares have been eligible for trading on the over-the-counter (OTC) market in the United States under the symbol ASMIY (www.otcmarkets.com).
ASMI STATUTORY ANNUAL REPORT 2016 | SHARE LISTING | 68A
BO
UT
ST
RA
TE
GY
& B
US
INE
SS
PE
RF
OR
MA
NC
E R
EV
IEW
SH
AR
EH
OL
DE
RS
GO
VE
RN
AN
CE
FIN
AN
CIA
L S
TAT
EM
EN
TS
SH
AR
EH
OL
DE
RS
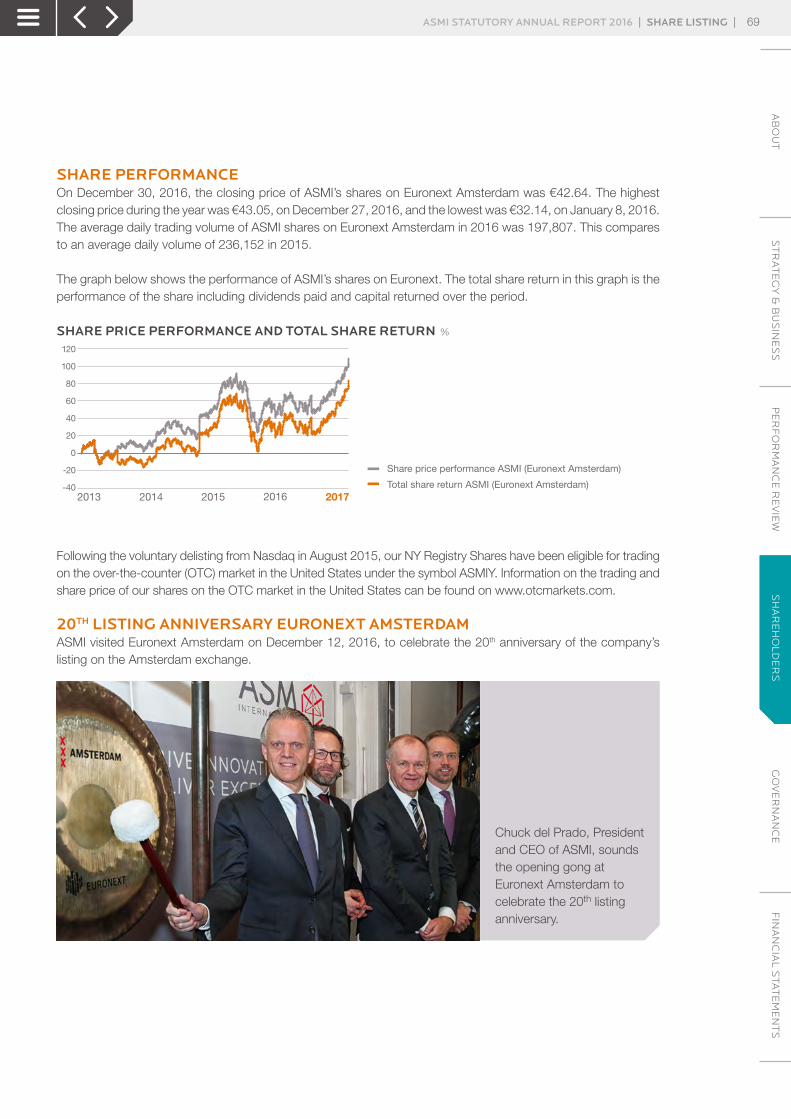
SHARE PERFORMANCEOn December 30, 2016, the closing price of ASMI’s shares on Euronext Amsterdam was €42.64. The highest closing price during the year was €43.05, on December 27, 2016, and the lowest was €32.14, on January 8, 2016. The average daily trading volume of ASMI shares on Euronext Amsterdam in 2016 was 197,807. This compares to an average daily volume of 236,152 in 2015.
The graph below shows the performance of ASMI’s shares on Euronext. The total share return in this graph is the performance of the share including dividends paid and capital returned over the period.
2013 2014 2015 2017
SHARE PRICE PERFORMANCE AND TOTAL SHARE RETURN %
2016
Share price performance ASMI (Euronext Amsterdam)
Total share return ASMI (Euronext Amsterdam)
120
100
80
60
40
20
0
-20
-40
Following the voluntary delisting from Nasdaq in August 2015, our NY Registry Shares have been eligible for trading on the over-the-counter (OTC) market in the United States under the symbol ASMIY. Information on the trading and share price of our shares on the OTC market in the United States can be found on www.otcmarkets.com.
20TH LISTING ANNIVERSARY EURONEXT AMSTERDAM ASMI visited Euronext Amsterdam on December 12, 2016, to celebrate the 20th anniversary of the company’s listing on the Amsterdam exchange.
Chuck del Prado, President and CEO of ASMI, sounds the opening gong at Euronext Amsterdam to celebrate the 20th listing anniversary.
ASMI STATUTORY ANNUAL REPORT 2016 | SHARE LISTING | 69A
BO
UT
ST
RA
TE
GY
& B
US
INE
SS
PE
RF
OR
MA
NC
E R
EV
IEW
SH
AR
EH
OL
DE
RS
GO
VE
RN
AN
CE
FIN
AN
CIA
L S
TAT
EM
EN
TS
SH
AR
EH
OL
DE
RS
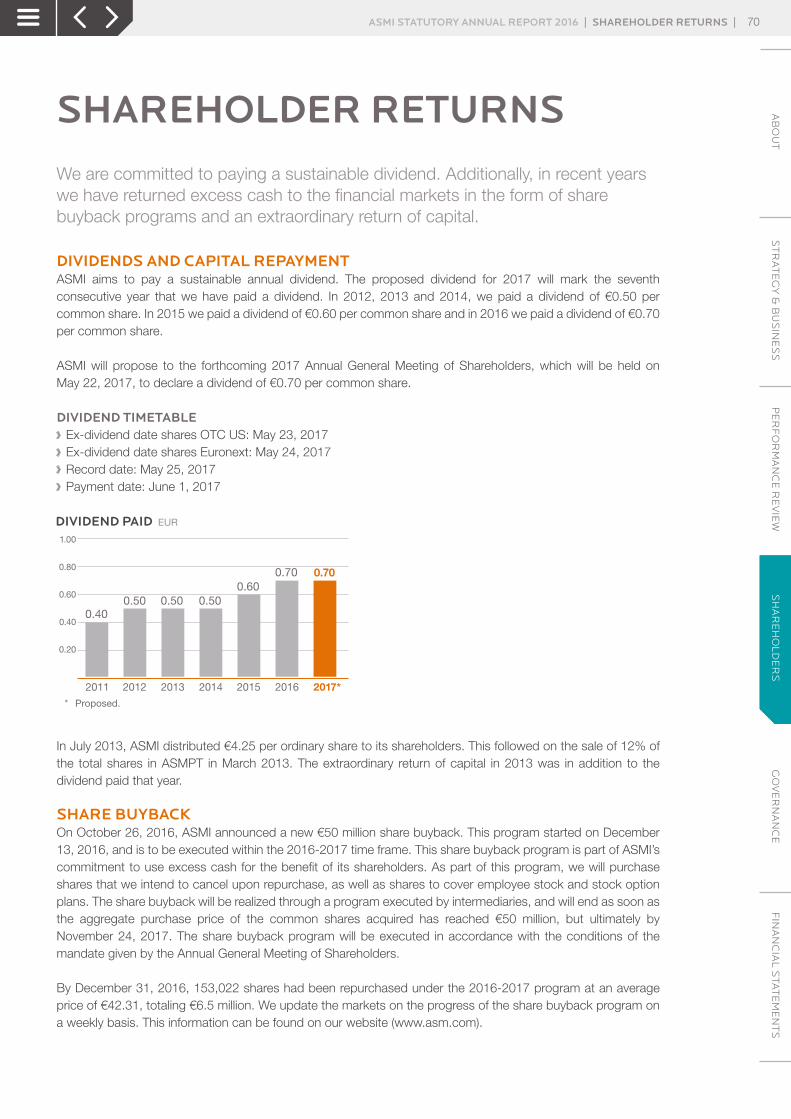
SHAREHOLDER RETURNSWe are committed to paying a sustainable dividend. Additionally, in recent years we have returned excess cash to the financial markets in the form of share buyback programs and an extraordinary return of capital.
DIVIDENDS AND CAPITAL REPAYMENTASMI aims to pay a sustainable annual dividend. The proposed dividend for 2017 will mark the seventh consecutive year that we have paid a dividend. In 2012, 2013 and 2014, we paid a dividend of €0.50 per common share. In 2015 we paid a dividend of €0.60 per common share and in 2016 we paid a dividend of €0.70 per common share.
ASMI will propose to the forthcoming 2017 Annual General Meeting of Shareholders, which will be held on May 22, 2017, to declare a dividend of €0.70 per common share.
DIVIDEND TIMETABLE › Ex-dividend date shares OTC US: May 23, 2017 › Ex-dividend date shares Euronext: May 24, 2017 › Record date: May 25, 2017 › Payment date: June 1, 2017
DIVIDEND PAID EUR
0.500.40
0.50 0.50
0.700.700.60
201320122011 2014 2015 2016 2017*
1.00
0.80
0.60
0.40
0.20
* Proposed.
In July 2013, ASMI distributed €4.25 per ordinary share to its shareholders. This followed on the sale of 12% of the total shares in ASMPT in March 2013. The extraordinary return of capital in 2013 was in addition to the dividend paid that year.
SHARE BUYBACKOn October 26, 2016, ASMI announced a new €50 million share buyback. This program started on December 13, 2016, and is to be executed within the 2016-2017 time frame. This share buyback program is part of ASMI’s commitment to use excess cash for the benefit of its shareholders. As part of this program, we will purchase shares that we intend to cancel upon repurchase, as well as shares to cover employee stock and stock option plans. The share buyback will be realized through a program executed by intermediaries, and will end as soon as the aggregate purchase price of the common shares acquired has reached €50 million, but ultimately by November 24, 2017. The share buyback program will be executed in accordance with the conditions of the mandate given by the Annual General Meeting of Shareholders.
By December 31, 2016, 153,022 shares had been repurchased under the 2016-2017 program at an average price of €42.31, totaling €6.5 million. We update the markets on the progress of the share buyback program on a weekly basis. This information can be found on our website (www.asm.com).
ASMI STATUTORY ANNUAL REPORT 2016 | SHAREHOLDER RETURNS | 70A
BO
UT
ST
RA
TE
GY
& B
US
INE
SS
PE
RF
OR
MA
NC
E R
EV
IEW
SH
AR
EH
OL
DE
RS
GO
VE
RN
AN
CE
FIN
AN
CIA
L S
TAT
EM
EN
TS
SH
AR
EH
OL
DE
RS
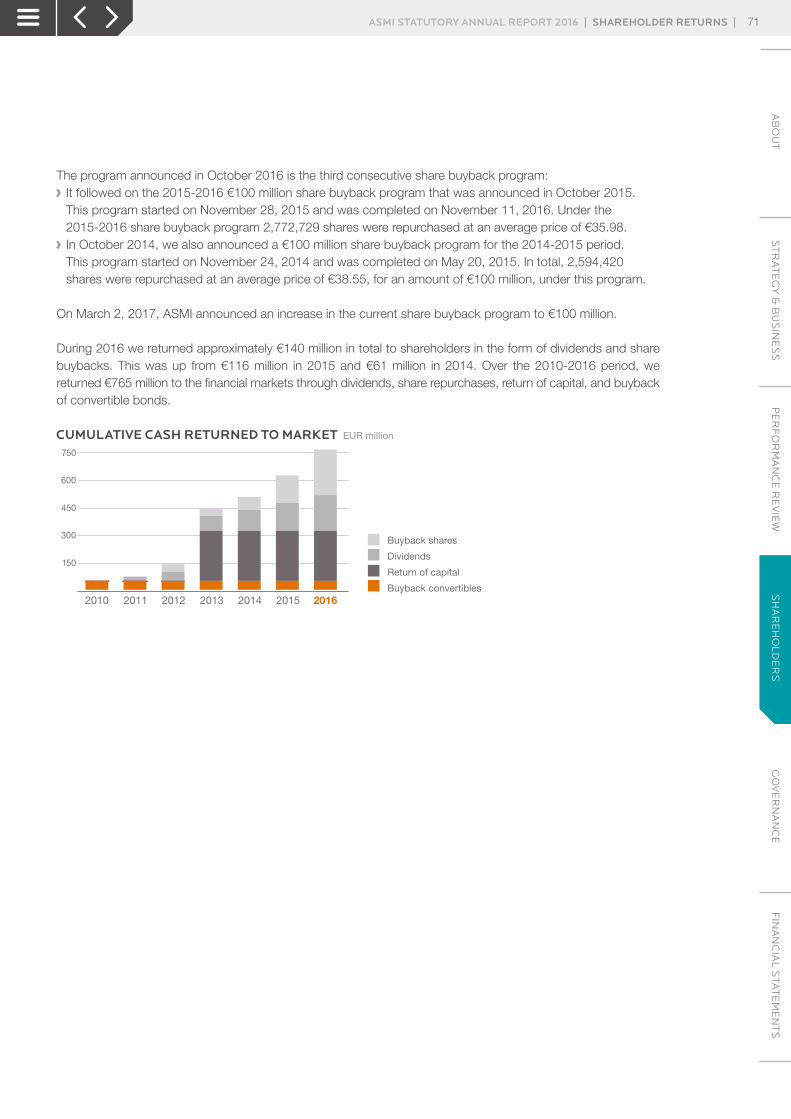
The program announced in October 2016 is the third consecutive share buyback program: › It followed on the 2015-2016 €100 million share buyback program that was announced in October 2015. This program started on November 28, 2015 and was completed on November 11, 2016. Under the 2015-2016 share buyback program 2,772,729 shares were repurchased at an average price of €35.98.
› In October 2014, we also announced a €100 million share buyback program for the 2014-2015 period. This program started on November 24, 2014 and was completed on May 20, 2015. In total, 2,594,420 shares were repurchased at an average price of €38.55, for an amount of €100 million, under this program.
On March 2, 2017, ASMI announced an increase in the current share buyback program to €100 million.
During 2016 we returned approximately €140 million in total to shareholders in the form of dividends and share buybacks. This was up from €116 million in 2015 and €61 million in 2014. Over the 2010-2016 period, we returned €765 million to the financial markets through dividends, share repurchases, return of capital, and buyback of convertible bonds.
CUMULATIVE CASH RETURNED TO MARKET EUR million
201320112010 2012 2014 2015 2016
750
600
450
300
150
Buyback shares
Dividends
Return of capital
Buyback convertibles
ASMI STATUTORY ANNUAL REPORT 2016 | SHAREHOLDER RETURNS | 71A
BO
UT
ST
RA
TE
GY
& B
US
INE
SS
PE
RF
OR
MA
NC
E R
EV
IEW
SH
AR
EH
OL
DE
RS
GO
VE
RN
AN
CE
FIN
AN
CIA
L S
TAT
EM
EN
TS
SH
AR
EH
OL
DE
RS
KEY DATESOur key investor dates are listed below. An up-to-date investor calendar is available on our website.
ANNUAL GENERAL MEETING OF SHAREHOLDERSThe Annual General Meeting of Shareholders will be held on May 22, 2017.
APRIL 20, 2017Announcement of first quarter results 2017
JULY 25, 2017Announcement of second quarter results 2017
OCTOBER 31, 2017Announcement of third quarter results 2017
ASMI STATUTORY ANNUAL REPORT 2016 | KEY DATES | 72A
BO
UT
ST
RA
TE
GY
& B
US
INE
SS
PE
RF
OR
MA
NC
E R
EV
IEW
SH
AR
EH
OL
DE
RS
GO
VE
RN
AN
CE
FIN
AN
CIA
L S
TAT
EM
EN
TS
SH
AR
EH
OL
DE
RS
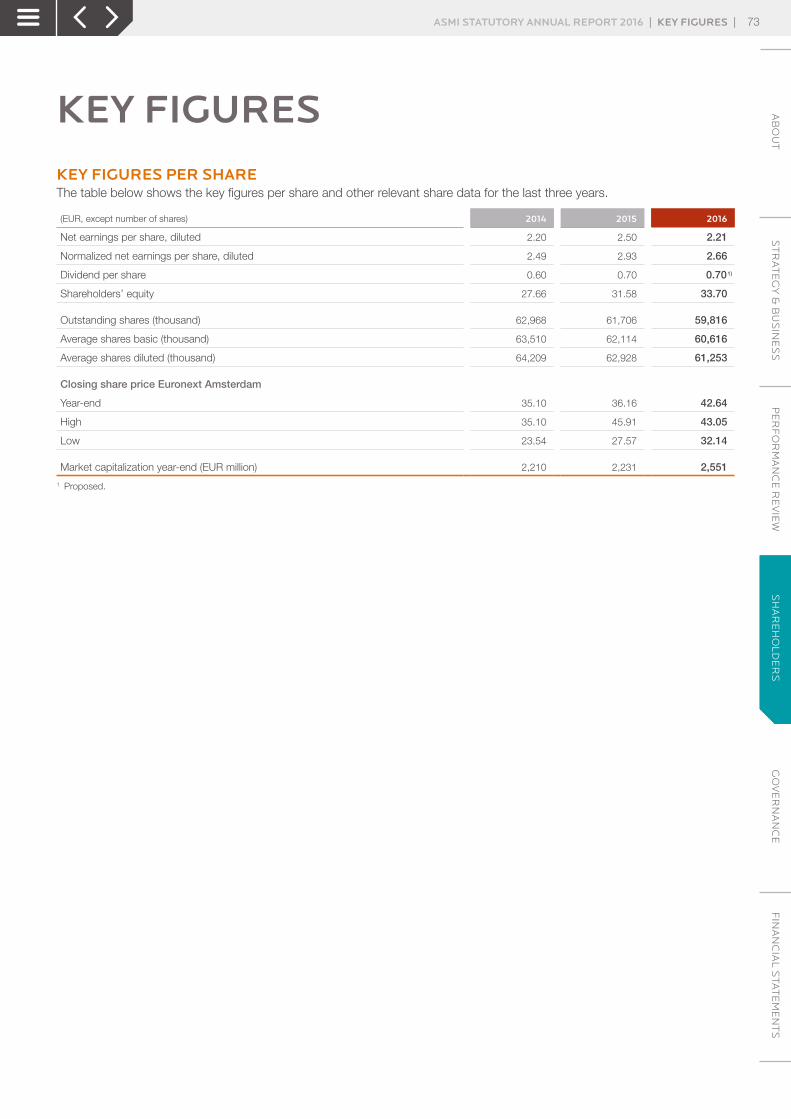
KEY FIGURESKEY FIGURES PER SHARE The table below shows the key figures per share and other relevant share data for the last three years.
(EUR, except number of shares) 2014 2015 2016
Net earnings per share, diluted 2.20 2.50 2.21
Normalized net earnings per share, diluted 2.49 2.93 2.66
Dividend per share 0.60 0.70 0.70 1)
Shareholders’ equity 27.66 31.58 33.70
Outstanding shares (thousand) 62,968 61,706 59,816
Average shares basic (thousand) 63,510 62,114 60,616
Average shares diluted (thousand) 64,209 62,928 61,253
Closing share price Euronext Amsterdam
Year-end 35.10 36.16 42.64
High 35.10 45.91 43.05
Low 23.54 27.57 32.14
Market capitalization year-end (EUR million) 2,210 2,231 2,551
1 Proposed.
ASMI STATUTORY ANNUAL REPORT 2016 | KEY FIGURES | 73A
BO
UT
ST
RA
TE
GY
& B
US
INE
SS
PE
RF
OR
MA
NC
E R
EV
IEW
SH
AR
EH
OL
DE
RS
GO
VE
RN
AN
CE
FIN
AN
CIA
L S
TAT
EM
EN
TS
SH
AR
EH
OL
DE
RS
CONTACT INFORMATIONOPEN DIALOG AND TIMELY INFORMATIONWe maintain an open dialog with our shareholders and investors. We provide the financial markets with accurate and timely information through, amongst others, press releases, our annual reports, quarterly earnings calls and webcasts and investor meetings. Investors can find up-to-date and comprehensive information about the company and our shares on our website.
VICTOR BAREÑOAlmere, the NetherlandsT: +31 88 100 8500E: [email protected]
ASMI STATUTORY ANNUAL REPORT 2016 | CONTACT INFORMATION | 74A
BO
UT
ST
RA
TE
GY
& B
US
INE
SS
PE
RF
OR
MA
NC
E R
EV
IEW
SH
AR
EH
OL
DE
RS
GO
VE
RN
AN
CE
FIN
AN
CIA
L S
TAT
EM
EN
TS
SH
AR
EH
OL
DE
RS

ASMI STATUTORY ANNUAL REPORT 2016 75A
BO
UT
ST
RA
TE
GY
& B
US
INE
SS
PE
RF
OR
MA
NC
E R
EV
IEW
SH
AR
EH
OL
DE
RS
GO
VE
RN
AN
CE
FIN
AN
CIA
L S
TAT
EM
EN
TS
GOVERNANCE
GO
VE
RN
AN
CE
CORPORATE GOVERNANCE >Corporate governance principles
>Management Board
>Supervisory Board
>Supervisory Board report
>Shares and shareholders’ rights
>External auditor
>Declarations
RISK MANAGEMENT >Risk management approach
>Risk categories and factors
BOARDS
RISK
VALUES
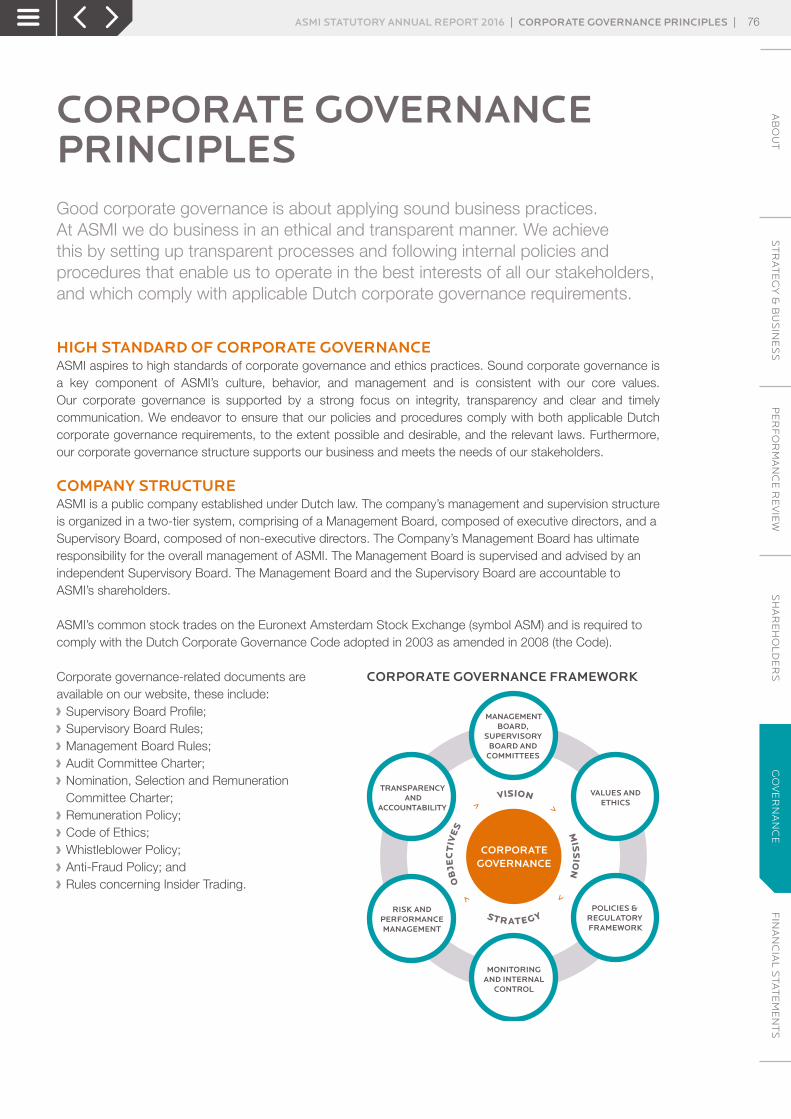
CORPORATE GOVERNANCE PRINCIPLESGood corporate governance is about applying sound business practices. At ASMI we do business in an ethical and transparent manner. We achieve this by setting up transparent processes and following internal policies and procedures that enable us to operate in the best interests of all our stakeholders, and which comply with applicable Dutch corporate governance requirements.
HIGH STANDARD OF CORPORATE GOVERNANCEASMI aspires to high standards of corporate governance and ethics practices. Sound corporate governance is a key component of ASMI’s culture, behavior, and management and is consistent with our core values. Our corporate governance is supported by a strong focus on integrity, transparency and clear and timely communication. We endeavor to ensure that our policies and procedures comply with both applicable Dutch corporate governance requirements, to the extent possible and desirable, and the relevant laws. Furthermore, our corporate governance structure supports our business and meets the needs of our stakeholders.
COMPANY STRUCTUREASMI is a public company established under Dutch law. The company’s management and supervision structure is organized in a two-tier system, comprising of a Management Board, composed of executive directors, and a Supervisory Board, composed of non-executive directors. The Company’s Management Board has ultimate responsibility for the overall management of ASMI. The Management Board is supervised and advised by an independent Supervisory Board. The Management Board and the Supervisory Board are accountable to ASMI’s shareholders.
ASMI’s common stock trades on the Euronext Amsterdam Stock Exchange (symbol ASM) and is required to comply with the Dutch Corporate Governance Code adopted in 2003 as amended in 2008 (the Code).
Corporate governance-related documents are available on our website, these include:
› Supervisory Board Profile; › Supervisory Board Rules; › Management Board Rules; › Audit Committee Charter; › Nomination, Selection and Remuneration Committee Charter;
› Remuneration Policy; › Code of Ethics; › Whistleblower Policy; › Anti-Fraud Policy; and › Rules concerning Insider Trading.
> MIS
SIO
N
>
OB
JEC
TIV
ES
>
VISION
STRATEGY
>
MANAGEMENT BOARD,
SUPERVISORY BOARD AND
COMMITTEES
VALUES AND ETHICS
CORPORATEGOVERNANCE
POLICIES & REGULATORY FRAMEWORK
MONITORING AND INTERNAL
CONTROL
RISK AND PERFORMANCE MANAGEMENT
TRANSPARENCY AND
ACCOUNTABILITY
CORPORATE GOVERNANCE FRAMEWORK
CORPORATE GOVERNANCE
ASMI STATUTORY ANNUAL REPORT 2016 | CORPORATE GOVERNANCE PRINCIPLES | 76A
BO
UT
ST
RA
TE
GY
& B
US
INE
SS
PE
RF
OR
MA
NC
E R
EV
IEW
SH
AR
EH
OL
DE
RS
GO
VE
RN
AN
CE
FIN
AN
CIA
L S
TAT
EM
EN
TS
GO
VE
RN
AN
CE

MANAGEMENT BOARD
The Management Board, supervised and advised by the Supervisory Board, manages ASMI’s strategic, commercial, financial, and organizational matters, and appoints senior managers. The Supervisory Board supervises and advises the Board of Management in the execution of its tasks and responsibilities and establishes their individual remuneration within the boundaries of the remuneration policies approved by the General Meeting of Shareholders and the recommendations by the Nomination, Selection and Remuneration Committee.
COMPOSITION OF THE MANAGEMENT BOARDCHARLES D. (CHUCK) DEL PRADO – CEOMr del Prado was appointed as a member of the Management Board in May 2006 and President and Chief Executive Officer on March 1, 2008. Mr del Prado was reappointed on May 21, 2014 for a period of four years. Between 1989 and 1996, Mr del Prado held several marketing and sales positions at IBM Nederland NV. From 1996 to 2001 he worked in various management positions at ASML, in manufacturing and sales in Taiwan and the Netherlands. He was appointed as Director Marketing, Sales & Service of ASM Europe in March 2001. From 2003 to 2007, he was President and General Manager of ASM America. From January 1, 2008 to February 29, 2008, he acted as Executive Vice President Front-end Operations at ASM America. He holds a Master’s of Science degree in Industrial Engineering and Technology Management from the University of Twente, the Netherlands. Mr del Prado is a Dutch national.
PETER A.M. VAN BOMMEL – CFOMr van Bommel was appointed as a member of the Management Board on July 1, 2010 and became Chief Financial Officer on September 1, 2010. Mr van Bommel was reappointed on May 21, 2014 for a period of four years. Mr van Bommel has more than twenty years of experience in the electronics and semiconductor industry. He spent most of his career at Philips, which he joined in 1979. From the mid-1990s until 2005, he acted as CFO of several business units of the Philips group. Between 2006 and 2008, he was CFO at NXP, formerly Philips Semiconductors. He was CFO of Odersun AG, a manufacturer of thin-film solar cells and modules until August 31, 2010. He holds a Master’s degree in Economics from the Erasmus University Rotterdam, the Netherlands. Mr van Bommel is a Dutch national.
On April 13, 2016 Mr van Bommel was reappointed for period of four years as a member of the Supervisory Board of Royal KPN NV. He also became the Chairman of the Audit Committee as per that day. On April 16, 2015, Mr Van Bommel was appointed as a member of the Supervisory Board of Neways Electronics International NV.
CHARLES D. (CHUCK) DEL PRADO Chairman of the Management Board, President and Chief Executive Officer
PETER A.M. VAN BOMMELMember of the Management Board and Chief Financial Officer
ASMI STATUTORY ANNUAL REPORT 2016 | MANAGEMENT BOARD | 77A
BO
UT
ST
RA
TE
GY
& B
US
INE
SS
PE
RF
OR
MA
NC
E R
EV
IEW
SH
AR
EH
OL
DE
RS
GO
VE
RN
AN
CE
FIN
AN
CIA
L S
TAT
EM
EN
TS
GO
VE
RN
AN
CE
THE IMPORTANCE OF DIVERSITYWe recognize the advantages of diversity. Diversity in our view consists of gender, but also relate to specific knowledge, background, (technical) experience, and skills. For the selection of future members of the Management Board, the criteria will therefore include a wide range of diversity aspects, and gender will be one of these.
RESPONSIBILITIESIn addition to the duties of the Management Board stipulated by law and our Articles of Association, the Management Board has the following responsibilities: › Achieving the aims, strategy, policy and results of the Company; › Managing the risks associated with the activities of the Company; › Ensuring proper financing of the Company; › Establishing and maintaining disclosure controls and procedures that ensure that all major financial information is known to the Management Board in order to ensure that the external financial reporting is achieved in a timely, complete and accurate manner;
› Determining relevant aspects and achieving aims relating to corporate social responsibility and sustainability.
The Management Board is guided by the interests of the Company taking the interests of all stakeholders into consideration.
The members of the Management Board are collectively responsible for managing the Company. They are collectively and individually accountable to the Supervisory Board and the Annual General Meeting of Shareholders for executing the Management Board’s responsibilities. The Management Board has the general authority to enter into binding agreements with third parties.
The Management Board held various meetings throughout the year 2016. At least once a month, the Management Board meets to discuss and review the performance of the company.
RISK MANAGEMENT AND CONTROL FRAMEWORKThe Management Board ensures that the Company has an adequately functioning Internal Risk Management and Control Framework. A comprehensive Risk Management and Control Framework, based on the ‘three lines of defense model’, has been established that allows the Audit Committee and the Management Board a clear overview of the effectiveness of internal controls and risk management. This is explained in more detail in the Risk Management chapter.
The Management Board periodically discusses the internal risk management and control systems with the Supervisory Board and the Audit Committee. The Management Board provides the Supervisory Board with all information required for the fulfillment of their obligations and the exercise of their powers.
The Management Board provides the General Meeting of Shareholders with all information required for the fulfillment of its obligations and the exercise of its powers in a timely fashion. The Management Board is responsible for the quality and completeness of financial and other reports that are publicly disclosed by or on behalf of the Company, including all reports and documents the Company is required to file.
CONFLICTS OF INTERESTEach Management Board member shall immediately report any potential conflict of interest to the Chairman of the Supervisory Board and to the other Management Board members. In such cases, a Management Board member shall provide the Chairman of the Supervisory Board and the other Management Board members with all information relevant to the conflict and follow the procedures as set out in the Management Board Rules.
ASMI STATUTORY ANNUAL REPORT 2016 | MANAGEMENT BOARD | 78A
BO
UT
ST
RA
TE
GY
& B
US
INE
SS
PE
RF
OR
MA
NC
E R
EV
IEW
SH
AR
EH
OL
DE
RS
GO
VE
RN
AN
CE
FIN
AN
CIA
L S
TAT
EM
EN
TS
GO
VE
RN
AN
CE
APPOINTMENT, SUSPENSION, AND DISMISSALThe General Meeting of Shareholders appoints a Management Board member based on a binding nomination drawn up by the Supervisory Board. The General Meeting of Shareholders may set aside a binding nomination by a resolution taken with an absolute majority of the votes cast, representing at least one third of the share capital. If such a binding nomination is set aside, a new binding nomination will be drawn up by the Supervisory Board and submitted to a newly called General Meeting of Shareholders. If this binding nomination is set aside, the General Meeting of Shareholders is free to appoint a Management Board member, but only with an absolute majority of the votes cast representing at least one third of our issued capital.
A Management Board member may be suspended at any time by the Supervisory Board. A Management Board member may, in accordance with a proposal by the Supervisory Board, be dismissed by the General Meeting of Shareholders through a majority vote. A resolution to suspend or to dismiss a member of the Management Board, other than in accordance with a proposal of the Supervisory Board, shall require the affirmative vote of a majority of the votes cast at a meeting. The affirmative votes must represent at least one third of the issued capital.
REMUNERATIONThe remuneration of individual members of the Management Board is decided upon by the Supervisory Board, based on the recommendations by the Nomination, Selection and Remuneration (NSR) Committee of the Supervisory Board and on the Company’s Remuneration Policy. Our Remuneration Policy was last adopted by the General Meeting of Shareholders in 2014. The remuneration structure includes five components: a fixed (base) salary component; a variable component (annual bonus or short-term incentive); a long-term component (performance shares and stock options); pension provisions and fringe benefits. The remuneration structure reflects short-term and long-term elements of the responsibilities of members of the Management Board.
The principal revisions of the Remuneration Policy are the following: › The annual bonus for the CEO is set at up to 100% of the annual fixed salary for on-target performance and up to a maximum of 150% in the case of out-performance;
› The annual bonus for other members of the Management Board is set at up to 75% of the annual fixed salary for on-target performance and up to a maximum of 125% in the case of out-performance;
› Performance shares are introduced as part of the long-term component for the Management Board; › The total value of stock options and performance shares for the CEO will be 133% of the annual base salary for on-target performance and up to a maximum of 200% of annual fixed salary in the case of out-performance;
› The total value of stock options and performance shares for other members of the Management Board will be 100% of the annual base salary for on-target performance and up to a maximum of 150% of annual fixed salary in the case of out-performance;
› Performance shares will become unconditional after three years depending on the achievement of pre-determined financial targets for those three years;
› Members of the Management Board are required to hold the vested performance shares for an additional two years after vesting.
The relevant targets will be set annually by the Supervisory Board upon the recommendation of the NSR Committee. These targets will be pre-determined, assessable, influenceable, and supportive of the Company’s long-term strategy in accordance with the best practices of the Dutch Corporate Governance Code.
For further information regarding the remuneration of the Management Board, please see the Remuneration Policy which is posted on our website, the Remuneration report 2016, the report of the Supervisory Board 2016, which is included in our Statutory annual report 2016, and Note 24 of the Consolidated financial statements.
ASMI STATUTORY ANNUAL REPORT 2016 | MANAGEMENT BOARD | 79A
BO
UT
ST
RA
TE
GY
& B
US
INE
SS
PE
RF
OR
MA
NC
E R
EV
IEW
SH
AR
EH
OL
DE
RS
GO
VE
RN
AN
CE
FIN
AN
CIA
L S
TAT
EM
EN
TS
GO
VE
RN
AN
CE

LIMITING SHARE DILUTIONIn order to limit potential dilution of the long-term incentive to be awarded to the Management Board and the restricted shares to be awarded to other employees, the Supervisory Board reduced the maximum previously applicable dilution percentage of 7.5% of the issued ordinary share capital of ASMI to 5% of the issued ordinary share capital of ASMI. This previous applied dilution limit of 7.5% was applicable to the number of outstanding (vested and non-vested) stock options granted to the Management Board and other employees up to and including 2014. In order to facilitate the transition to the new share- and option-based program, and to attain this dilution limit of 5%, the Supervisory Board will apply a transition period of maximum four years, during which the potential dilution may exceed 5% but will not exceed 7.5%. In addition, ASMI may repurchase outstanding shares in order to mitigate possible dilution.
ASMI STATUTORY ANNUAL REPORT 2016 | MANAGEMENT BOARD | 80A
BO
UT
ST
RA
TE
GY
& B
US
INE
SS
PE
RF
OR
MA
NC
E R
EV
IEW
SH
AR
EH
OL
DE
RS
GO
VE
RN
AN
CE
FIN
AN
CIA
L S
TAT
EM
EN
TS
GO
VE
RN
AN
CE
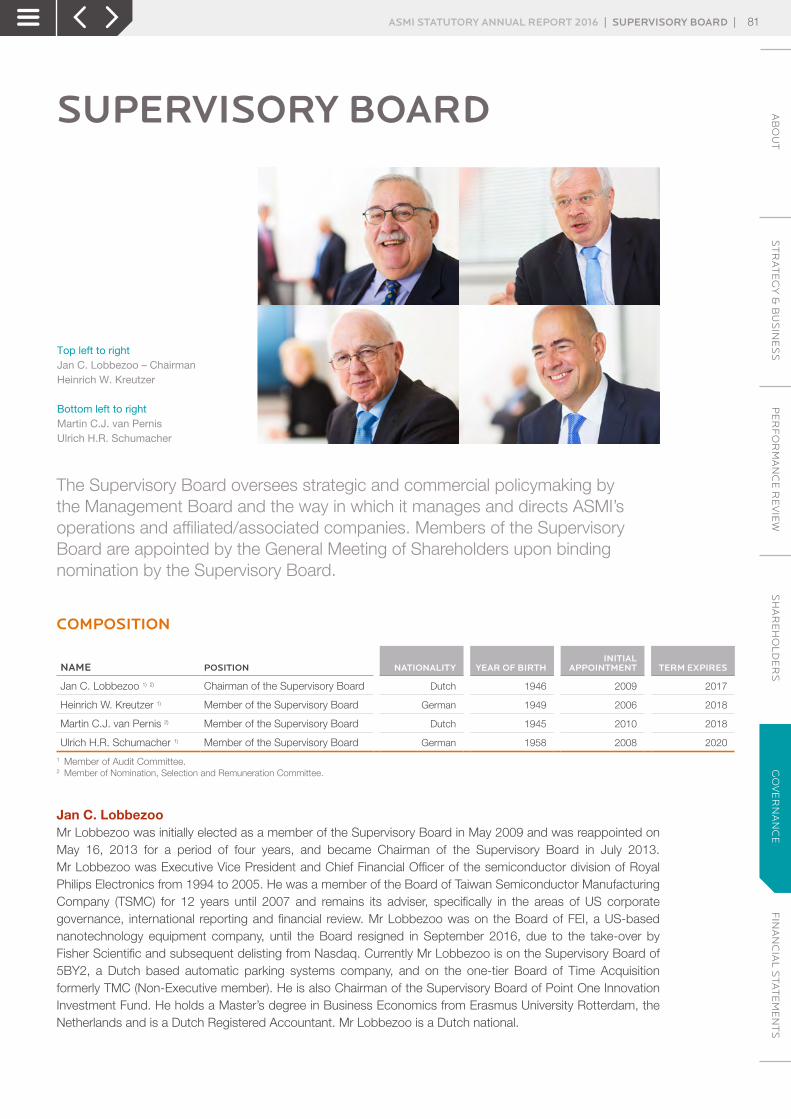
SUPERVISORY BOARD
The Supervisory Board oversees strategic and commercial policymaking by the Management Board and the way in which it manages and directs ASMI’s operations and affiliated/associated companies. Members of the Supervisory Board are appointed by the General Meeting of Shareholders upon binding nomination by the Supervisory Board.
COMPOSITION
NAME POSITION NATIONALITY YEAR OF BIRTHINITIAL
APPOINTMENT TERM EXPIRES
Jan C. Lobbezoo 1) 2) Chairman of the Supervisory Board Dutch 1946 2009 2017
Heinrich W. Kreutzer 1) Member of the Supervisory Board German 1949 2006 2018
Martin C.J. van Pernis 2) Member of the Supervisory Board Dutch 1945 2010 2018
Ulrich H.R. Schumacher 1) Member of the Supervisory Board German 1958 2008 2020
1 Member of Audit Committee. 2 Member of Nomination, Selection and Remuneration Committee.
Jan C. LobbezooMr Lobbezoo was initially elected as a member of the Supervisory Board in May 2009 and was reappointed on May 16, 2013 for a period of four years, and became Chairman of the Supervisory Board in July 2013. Mr Lobbezoo was Executive Vice President and Chief Financial Officer of the semiconductor division of Royal Philips Electronics from 1994 to 2005. He was a member of the Board of Taiwan Semiconductor Manufacturing Company (TSMC) for 12 years until 2007 and remains its adviser, specifically in the areas of US corporate governance, international reporting and financial review. Mr Lobbezoo was on the Board of FEI, a US-based nanotechnology equipment company, until the Board resigned in September 2016, due to the take-over by Fisher Scientific and subsequent delisting from Nasdaq. Currently Mr Lobbezoo is on the Supervisory Board of 5BY2, a Dutch based automatic parking systems company, and on the one-tier Board of Time Acquisition formerly TMC (Non-Executive member). He is also Chairman of the Supervisory Board of Point One Innovation Investment Fund. He holds a Master’s degree in Business Economics from Erasmus University Rotterdam, the Netherlands and is a Dutch Registered Accountant. Mr Lobbezoo is a Dutch national.
Top left to rightJan C. Lobbezoo – ChairmanHeinrich W. Kreutzer
Bottom left to rightMartin C.J. van Pernis Ulrich H.R. Schumacher
ASMI STATUTORY ANNUAL REPORT 2016 | SUPERVISORY BOARD | 81A
BO
UT
ST
RA
TE
GY
& B
US
INE
SS
PE
RF
OR
MA
NC
E R
EV
IEW
SH
AR
EH
OL
DE
RS
GO
VE
RN
AN
CE
FIN
AN
CIA
L S
TAT
EM
EN
TS
GO
VE
RN
AN
CE
Heinrich W. KreutzerMr Kreutzer was initially elected as a member of the Supervisory Board in November 2006 and was reappointed on May 21, 2014 for a period of four years. Between 1999 and 2003, Mr Kreutzer was a member of the Management Board as Chief Operating Officer and Chief Technology Officer of Alcatel Germany. From 2004 to 2006, he was Managing Director of Kabel Deutschland GmbH in Munich, Germany. Prior to that he worked at several companies including General Telephone & Electronics in Waltham, US and Alcatel in Stuttgart, Germany. Mr Kreutzer was on the Board of Directors of Micronas Semiconductor AG (Chairman) in Zurich, Switzerland, Micronas Semiconductor GmbH (Chairman) in Freiburg, Germany until March 2016, and is currently on the Board of BKtel Communications GmbH (Chairman), Germany. He holds a Master’s degree in Engineering and a Master’s degree in Economics, and studied at the Technical University of Berlin and the University of Hagen, Germany. Mr Kreutzer is a German national.
Martin C.J. van PernisMr van Pernis was initially elected as a member of the Supervisory Board in May 2010 and was reappointed on May 21, 2014 for a period of four years. Mr van Pernis joined Siemens in 1971 and retired from the Siemens Group at the end of 2009 as Chairman of the Management Board of Siemens Nederland NV. Mr van Pernis is on the Supervisory Board of Batenburg Techniek NV (Chairman), Aalberts Industries NV (Vice Chairman), Rotterdams Philharmonisch Orkest - RPhO (Chairman), and Member of the Advisory Board of G4S. Mr van Pernis is a Dutch national.
Ulrich H.R. SchumacherMr Schumacher was initially elected as a member of the Supervisory Board in May 2008 and was reappointed on May 25, 2016 for a period of four years. Mr Schumacher is Chairman of the Executive Board and CEO of Zumtobel Group AG. From 1986 to 1999, he held various engineering and management positions at Siemens AG. Between 1996 and 1999, he was CEO and President of Siemens Semiconductor Group, and became President and CEO of Infineon Technologies AG after the spin-off from Siemens Semiconductor Group in 1999. From 2004 to 2007, he was a Partner at Francisco Partners, a private equity investment company based in the US. Between 2007 and 2016, he was the CEO and President of Grace Semiconductor Manufacturing Corporation. He holds a PhD in Electrical Engineering from the University of Aachen, Germany, and has completed further education in Business Administration. Mr Schumacher is a German national.
ASMI STATUTORY ANNUAL REPORT 2016 | SUPERVISORY BOARD | 82A
BO
UT
ST
RA
TE
GY
& B
US
INE
SS
PE
RF
OR
MA
NC
E R
EV
IEW
SH
AR
EH
OL
DE
RS
GO
VE
RN
AN
CE
FIN
AN
CIA
L S
TAT
EM
EN
TS
GO
VE
RN
AN
CE
RESPONSIBILITIESThe supervision over the policies of our Management Board and the general course of our business, and the related management actions, is entrusted to the Supervisory Board. In our two-tier structure under applicable Dutch law, the Supervisory Board is a separate body independent from the Management Board.
The Supervisory Board supervises and advises the Management Board in executing its responsibilities, particularly regarding: › achievement of the Company’s objectives; › corporate strategy and the risks inherent in the business activities; › structure and operation of the internal risk management and control systems; › financial reporting process; › compliance with legislation and regulations; › relation of the Company to its shareholders; and › relevant aspects of corporate social responsibility.
The Supervisory Board is responsible for monitoring and assessing its own performance.
CONFLICTS OF INTERESTA Supervisory Board member facing a conflict of interest shall, in accordance with Article 13 of our Supervisory Board Rules, inform the Chairman of the Supervisory Board immediately. The Chairman shall, if possible in consultation with the other members of the Supervisory Board, determine the course of action to be taken.
APPOINTMENTIn accordance with Dutch law and the Code, the Supervisory Board has drawn up a profile for its own composition. This Supervisory Board Profile is available on our website. The Supervisory Board shall consist of at least three members. The members should operate independently of each other and within a good relationship of mutual trust. They should be experienced in the management of an international, publicly listed company, and have sufficient time available to fulfill the function of a Supervisory Board member. The Supervisory Board members appoint a Chairman from among themselves.
The Supervisory Board is currently composed of four members after the retirement of Mr Danneels in May 2016. All members of the Supervisory Board meet the profile. Supervisory Board members serve a four-year term and may be re-elected twice. Pursuant to section III.3.5 of the Code 2008, a Supervisory Board member can serve for a maximum period of three four-year terms.
THE IMPORTANCE OF DIVERSITYWe recognize the advantage of diversity. Diversity in our view consists of gender, but also relate to specific knowledge, background, (technical) experience, and skills. For the selection of future members of the Supervisory Board, the criteria will therefore include a wide range of diversity aspects, and gender will be one of these.
Any appointment or reappointment to the Supervisory Board shall be based on the candidate’s match with the Supervisory Board Profile. For reappointment, the candidate’s performance during the previous period shall be taken into account. A Supervisory Board member who is available for reappointment must be interviewed by the Chairman of the Nomination, Selection and Remuneration Committee. The Chairman of the Nomination, Selection and Remuneration Committee must be interviewed by the Chairman of the Supervisory Board. All members of the Supervisory Board follow an introduction program after their first appointment, in which financial and legal aspects as well as financial reporting and specific features of ASMI are discussed.
ASMI STATUTORY ANNUAL REPORT 2016 | SUPERVISORY BOARD | 83A
BO
UT
ST
RA
TE
GY
& B
US
INE
SS
PE
RF
OR
MA
NC
E R
EV
IEW
SH
AR
EH
OL
DE
RS
GO
VE
RN
AN
CE
FIN
AN
CIA
L S
TAT
EM
EN
TS
GO
VE
RN
AN
CE

REMUNERATIONThe remuneration of the members of the Supervisory Board is not dependent on our financial results. No member of the Supervisory Board personally maintains a business relationship with ASMI other than as a member of the Supervisory Board. The Nomination, Selection and Remuneration Committee is responsible for reviewing and, if appropriate, recommending changes to the remuneration of the Supervisory Board. Any recommended changes to the remuneration of the members of the Supervisory Board must be submitted to the General Meeting of Shareholders for approval.
The remuneration of the Supervisory Board was approved by the shareholders in the 2011 Annual General Meeting of Shareholders. The Supervisory Board’s annual remuneration has been fixed as follows:
(Amount in euros)
Base remuneration:
Chairman of the Supervisory Board 60,000
Member of the Supervisory Board (other than the Chairman) 45,000
Additional remuneration:
Chairman of the Audit Committee 7,500
Member of the Audit Committee (other than the Chairman) 5,000
Chairman of the Nomination, Selection and Remuneration Committee 7,500
Member of the Nomination, Selection and Remuneration Committee (other than the Chairman) 5,000
INDEPENDENCEThe Supervisory Board is of the opinion that its current members are all independent as defined by the Code. Neither the Chairman nor any other member of the Supervisory Board is a former member of ASMI’s Management Board, or has another relationship with ASMI which can be judged ‘not independent’ of ASMI.
COMMITTEESIn order to more efficiently fulfill its role and in compliance with the Code, the Supervisory Board has created two committees: the Audit Committee and the Nomination, Selection and Remuneration Committee.
AUDIT COMMITTEEThe Audit Committee assists the Supervisory Board in its responsibility to oversee ASMI’s financing, financial statements, financial reporting process, and system of internal business controls and risk management. The Audit Committee is responsible for the nomination of the external auditor of the Company.
The Audit Committee consists of: › Heinrich Kreutzer (Chairman); › Jan Lobbezoo; and › Ulrich Schumacher.
ASMI STATUTORY ANNUAL REPORT 2016 | SUPERVISORY BOARD | 84A
BO
UT
ST
RA
TE
GY
& B
US
INE
SS
PE
RF
OR
MA
NC
E R
EV
IEW
SH
AR
EH
OL
DE
RS
GO
VE
RN
AN
CE
FIN
AN
CIA
L S
TAT
EM
EN
TS
GO
VE
RN
AN
CE
The Audit Committee supervises the activities of the Management Board with respect to: › the structure and operation of the internal risk management and control systems, including supervision of the enforcement of the relevant legislation and regulations;
› role and functioning of Internal Audit; › policy on tax planning; › the applications of information and communication technology; › financing of the Company; › compliance with recommendations and observations of internal and external auditors; › release of financial information; and › relations with the external auditor, including, in particular, its independence, remuneration, and any non-audit services performed for the Company.
The Audit Committee meets periodically to: › consider the adequacy of the internal control procedures; › review the operating results with management and the independent auditors; › review the scope and results of the audit with the independent auditors; › review the scope and results of internal audits with Internal Audit; › review performance evaluations relating to the auditor’s independence; › review performance and services of the external auditor; and › review adequateness of the financing structure and tax planning of the Company.
The Chief Executive Officer, Chief Financial Officer, Director Internal Audit, Director External Reporting & Treasury, and representatives of the external auditor are invited to, and also attend, the Audit Committee meetings.
Mr Lobbezoo, Chairman of the Supervisory Board and member of the Audit Committee, is the Supervisory Board’s financial expert, taking into consideration his extensive financial background and experience.
NOMINATION, SELECTION AND REMUNERATION COMMITTEEThe Nomination, Selection and Remuneration Committee (NSR Committee) advises the Supervisory Board on matters relating to the selection and nomination of the members of the Management Board and Supervisory Board. The Committee further monitors and evaluates the Remuneration Policy for the Management Board.
The NSR Committee consists of: › Martin van Pernis (Chairman); and › Jan Lobbezoo.
The objective of the Remuneration Policy is two-fold: › To create a remuneration structure that will allow ASMI to attract, reward and retain qualified executives who will lead ASMI in achieving its strategic objectives;
› To provide and motivate these executives with a balanced and competitive remuneration.
The remuneration structure includes five elements: › base salary; › annual incentive (bonus); › long-term share-based incentive; › pension; and › fringe benefits.
ASMI STATUTORY ANNUAL REPORT 2016 | SUPERVISORY BOARD | 85A
BO
UT
ST
RA
TE
GY
& B
US
INE
SS
PE
RF
OR
MA
NC
E R
EV
IEW
SH
AR
EH
OL
DE
RS
GO
VE
RN
AN
CE
FIN
AN
CIA
L S
TAT
EM
EN
TS
GO
VE
RN
AN
CE
This remuneration structure reflects short-term and long-term elements of the responsibilities of members of the Management Board.
The NSR Committee ensures that a competitive remuneration structure is provided by benchmarking with other multinational companies of comparable size and complexity operating in comparable geographical and industrial markets. The NSR Committee evaluates the achievement of performance criteria specified per Management Board member. After the evaluation, it recommends the level of remuneration to the Supervisory Board.
On an annual basis, the NSR Committee reports to the Supervisory Board on the application of the Remuneration Policy in the previous year and recommends the Remuneration Policy for the following years.
The Chief Executive Officer and the Vice President Global Human Resource are invited to, and also attend, the Nomination, Selection and Remuneration Committee meetings.
ASMI STATUTORY ANNUAL REPORT 2016 | SUPERVISORY BOARD | 86A
BO
UT
ST
RA
TE
GY
& B
US
INE
SS
PE
RF
OR
MA
NC
E R
EV
IEW
SH
AR
EH
OL
DE
RS
GO
VE
RN
AN
CE
FIN
AN
CIA
L S
TAT
EM
EN
TS
GO
VE
RN
AN
CE
SUPERVISORY BOARD REPORTDuring the year under review, the Supervisory Board performed its duties in accordance with applicable legislation and the Articles of Association of ASM International NV and supervised and advised the Management Board on an ongoing basis.
FINANCIAL STATEMENTSWe present the ASMI 2016 Statutory annual report in accordance with IFRS, as prepared by the Management Board and reviewed by the Supervisory Board. Our independent auditors, KPMG Accountants NV, have audited these financial statements and issued an unqualified opinion. Their report appears on pages 166 to 173 of the Financial statements.
All of the members of the Supervisory Board have signed the financial statements in respect of the financial year 2016.
SUPERVISIONSupervision of the Management Board, its policy decisions and actions are entrusted to the Supervisory Board. In accordance with Dutch law, the Supervisory Board is a separate body, independent of the Management Board. The Supervisory Board supervises and advises the Management Board in executing its responsibilities. The profile of the Supervisory Board describes the range of expertises that should be represented within the Board. The procedures of the Supervisory Board and the division of its duties are laid down in the Supervisory Board Rules. Both documents are available on our website www.asm.com.
MEETINGS OF THE SUPERVISORY BOARDDuring 2016, the Supervisory Board met with the Management Board on five occasions. Jan Lobbezoo, Heinrich Kreutzer, and Martin van Pernis attended all Supervisory Board meetings with the Management Board, while Ulrich Schumacher attended all meetings except two. In these meetings, the Boards discussed strategy progress, operations, business risks, product and market developments, the Company’s organization, management and financial structure, and performance, including further profitability improvements. One of those meetings was specifically earmarked to discuss with Management the long-term strategy of the company, the planned implementation of it, and the risks attached to its realization.
In addition, the Supervisory Board discussed the functioning of the Supervisory Board and its individual members, the relationship between the Supervisory Board and the Management Board, the composition of the Management Board, its performance, and the performance of its individual members without the members of the Management Board attending.
CORPORATE GOVERNANCEIncluded in the responsibilities of the Supervisory Board is to oversee the Company’s compliance with corporate governance standards and best practices. The Supervisory Board is of the opinion that the Company complies with the Dutch Corporate Governance Code.
SHAREHOLDERSAlso in 2016, the Company announced a share buyback program of €50 million with the announcement of the third-quarter results. This is in line with the earlier communicated message that the Company uses excess cash for the benefit of its shareholders.
SUPERVISORY BOARD COMPOSITIONThe Supervisory Board is composed of four members. In 2016 the term of Mr Danneels expired and he left the Supervisory Board after serving for 16 years. All four members are independent, in line with the Corporate Governance Code.
ASMI STATUTORY ANNUAL REPORT 2016 | SUPERVISORY BOARD REPORT | 87A
BO
UT
ST
RA
TE
GY
& B
US
INE
SS
PE
RF
OR
MA
NC
E R
EV
IEW
SH
AR
EH
OL
DE
RS
GO
VE
RN
AN
CE
FIN
AN
CIA
L S
TAT
EM
EN
TS
GO
VE
RN
AN
CE

MANAGEMENT BOARD COMPOSITIONThe Management Board remains composed of two members. During 2016 no changes have taken place in its composition.
DIVERSITYWe recognize the advantages of diversity. Diversity in our view consists of gender, but also relate to specific knowledge, background, (technical) experience, and skills. For the selection of future members of the Boards, the criteria will therefore also include a wide range of diversity aspects, and gender will be one of them.
SUPERVISORY BOARD COMMITTEESAudit CommitteeThe role of the Audit Committee is described in its charter, which is available on the Company’s website (www.asm.com). The Audit Committee consists of Messrs. Heinrich Kreutzer (Chairman), Jan Lobbezoo and Ulrich Schumacher. During the year, the Audit Committee met with the Management Board and KPMG Accountants, the Company’s independent auditors, on four occasions, and in one conference call. Audit Committee discussions included: the Company’s financial reporting including the application of accounting principles; the Company’s financial position and financing programs, and tax planning; the Company’s internal risk management systems; effectiveness of internal controls; the audit performed and its findings, the annual report and financial statements; and the budget and the quarterly progress reports prepared by the Management Board. The internal auditor participated in all four Audit Committee meetings presenting her own actions and findings.
On several occasions, the Audit Committee met with KPMG Accountants, without the members of the Management Board present, to discuss the risk of fraud. Furthermore, the Audit Committee discussed the auditor’s performance with the Management Board without KPMG Accountants present.
Nomination, Selection and Remuneration CommitteeThe role of the Nomination, Selection and Remuneration Committee is described in its charter, which is available on the Company’s website, www.asm.com. In general, the Committee advises the Supervisory Board on matters relating to the selection and nomination of new Management Board members, as well as the remuneration of the members of the Management Board. This Committee consists of Messrs. Martin van Pernis (Chairman), and Jan Lobbezoo.
In 2016 the Nomination, Selection and Remuneration Committee held one meeting and one conference call. The topics discussed included the remuneration of the individual members of the Management Board. During the meetings of the Committee, the Chief Executive Officer was present, except on the occasion when his own remuneration was discussed.
The remuneration of the members of the Management Board is disclosed in Note 24 on the financial statements of the Statutory annual report. The remuneration of the members of the Management Board during 2016 is fully in accordance with the Remuneration Policy.
WORD OF THANKSWe extend gratitude and appreciation to ASMI employees worldwide for their many contributions and enduring commitment to the Company. It is their commitment and determination that enabled us to make substantial progress in 2016. We recognize that the cumulative efforts of our workforce are truly creating real value for all of our stakeholders.
SUPERVISORY BOARDJ.C. Lobbezoo, ChairmanH.W. KreutzerM.C.J. van PernisU.H.R. Schumacher
Almere, the NetherlandsMarch 9, 2017
ASMI STATUTORY ANNUAL REPORT 2016 | SUPERVISORY BOARD REPORT | 88A
BO
UT
ST
RA
TE
GY
& B
US
INE
SS
PE
RF
OR
MA
NC
E R
EV
IEW
SH
AR
EH
OL
DE
RS
GO
VE
RN
AN
CE
FIN
AN
CIA
L S
TAT
EM
EN
TS
GO
VE
RN
AN
CE
SHARES AND SHAREHOLDERS’ RIGHTSGENERAL MEETING OF SHAREHOLDERSASMI shareholders exercise their rights through Annual and Extraordinary General Meetings of Shareholders. ASMI is required to convene an Annual General Meeting of Shareholders in the Netherlands each year, no later than six months after the end of the Company’s financial year. Additional Extraordinary General Meetings of Shareholders may be convened at any time by the Supervisory Board or the Management Board.
The convocation date is legally set at 42 days prior to the date of the General Meeting of Shareholders.
The record date is legally set at 28 days prior to the date of the General Meeting of Shareholders. Those who are registered as shareholders at the record date are entitled to attend the meeting and to exercise other shareholder rights. Shareholders may be represented by written proxy.
PUBLICATION IN ENGLISHThe Statutory annual report, the Financial statements and other regulated information such as defined in the Dutch Act on Financial Supervision (Wet op het Financieel Toezicht), will solely be published in English on the Company’s website (www.asm.com).
The draft minutes of the General Meeting of Shareholders are available on the Company’s website no later than three months after the meeting. Shareholders may provide their comments in the subsequent three months. Thereafter, the minutes are adopted.
2016 AGM OF ASMIOn May 25, 2016, ASMI held its Annual General Meeting of Shareholders in Amsterdam, the Netherlands. The attendance rate was 66.9% of the total issued share capital of ASMI as per the registration date. In line with the ASMI Boards’ recommendations, the shareholders approved all resolutions as proposed to the Annual General Meeting of Shareholders.
The main resolutions were as follows: › The Financial statements for the year 2015 were adopted and the shareholders granted discharge to the members of the Management Board and the Supervisory Board from liability in relation to the exercise of their duties in the financial year 2015;
› The shareholders voted in favor of the dividend payment of €0.70 per ordinary share.
VOTING RIGHTSIn the General Meeting of Shareholders, each ordinary share with a nominal value of €0.04 entitles the holder to cast one vote, each financing preferred share with a nominal value of €40.00 entitles the holder to cast one thousand votes and each preferred share with a nominal value of €40.00 entitles the holder to cast one thousand votes. Presently, there are no preferred shares and financing preferred shares outstanding. Treasury shares held by the Company cannot be voted on.
The authorized capital of the Company amounts to 110,000,000 shares of €0.04 par value common shares, 118,000 shares of €40 par value preferred shares and 8,000 shares of €40 par value financing preferred shares, of which 59,815,843 common shares, no preferred and no financing preferred shares were outstanding as at December 31, 2016. All per December 31, 2016 outstanding common shares were fully paid.
Of our 59,815,843 outstanding common shares at December 31, 2016, excluding treasury shares, 3,039 are registered with us in the Netherlands, 59,409,659 are registered with our transfer agent in the Netherlands, and 403,145 are registered with our transfer agent in the United States.
ASMI STATUTORY ANNUAL REPORT 2016 | SHARES AND SHAREHOLDERS’ RIGHTS | 89A
BO
UT
ST
RA
TE
GY
& B
US
INE
SS
PE
RF
OR
MA
NC
E R
EV
IEW
SH
AR
EH
OL
DE
RS
GO
VE
RN
AN
CE
FIN
AN
CIA
L S
TAT
EM
EN
TS
GO
VE
RN
AN
CE

Financing preferred shares are designed to allow ASMI to finance equity with an instrument paying a preferred dividend, linked to EURIBOR loans and government loans, without the dilutive effects of issuing additional common shares.
PREFERRED SHARESPreferred and financing preferred shares are issued in registered form only and are subject to transfer restrictions. Essentially, a preferred or financing preferred shareholder must obtain the approval of the Company’s Supervisory Board to transfer shares. If the approval is denied, the Supervisory Board will provide a list of acceptable prospective buyers who are willing to purchase the shares at a cash price to be fixed by consent of the Supervisory Board and seller within two months after the approval is denied. If the transfer is approved, the shareholder must complete the transfer within three months, at which time the approval expires.
Preferred shares are entitled to a cumulative preferred dividend based on the amount paid-up on such shares. Financing preferred shares are entitled to a cumulative dividend based on the par value and share premium paid on such shares.
STICHTING AGREEMENTASMI is party to an agreement with Stichting Continuïteit ASM International (Stichting), pursuant to which Stichting is granted an option to acquire up to a number of our preferred shares corresponding with a total par value equal to 50% of the par value of our common shares issued and outstanding at the date of the exercise of the option. Stichting is a non-membership organization organized under Dutch law. The objective of Stichting is to serve the interests of the Company. For that objective, Stichting may, amongst others, acquire, own, and vote our preferred shares in order to maintain our independence and/or continuity and/or identity.
The members of the board of Stichting are: › Dick Bouma, Retired Chairman Board Pels Rijcken & Droogleever Fortuijn; › Rob Ruijter, Chairman Supervisory Board Delta Lloyd; and › Rinze Veenenga Kingma, President Archeus Consulting BV.
The purpose of above mentioned option is to protect the independence, the continuity and the identity of ASMI against influences that are contrary to the interests of ASMI, its enterprise and the enterprises of its subsidiaries and all stakeholders.
ASMI STATUTORY ANNUAL REPORT 2016 | SHARES AND SHAREHOLDERS’ RIGHTS | 90A
BO
UT
ST
RA
TE
GY
& B
US
INE
SS
PE
RF
OR
MA
NC
E R
EV
IEW
SH
AR
EH
OL
DE
RS
GO
VE
RN
AN
CE
FIN
AN
CIA
L S
TAT
EM
EN
TS
GO
VE
RN
AN
CE

POWERSThe powers of the General Meeting of Shareholders are defined in our Articles of Association. The main powers of the shareholders are to: › appoint, suspend, and dismiss members of the Management Board and Supervisory Board; › adopt the financial statements; › declare dividends; › discharge the Management Board and Supervisory Board from responsibility for the performance of their respective duties for the previous financial year;
› appoint the external auditors; › adopt amendments to the Articles of Association; › issue shares and grant subscriptions for shares; › authorize the Management Board to issue shares and grant subscriptions for shares; › withdraw pre-emptive rights of shareholders upon issuance of shares; › authorize the Management Board to withdraw pre-emptive rights of shareholders upon issuance of shares; and
› authorize the Management Board to repurchase or cancel outstanding shares.
MAJOR SHAREHOLDERSPursuant to the Dutch Financial Supervision Act (“Wet op het financieel toezicht” or WFT), legal entities as well as natural persons must immediately notify the Dutch Authority for the Financial Markets (AFM) when a shareholding equals or exceeds 3% of the issued capital. The AFM must be notified again when this shareholding subsequently reaches, exceeds or falls below a threshold. This can be caused by the acquisition or disposal of shares by the shareholder or because the issued capital of the issuing institution is increased or decreased. Thresholds are: 3%, 5%, 10%, 15%, 20%, 25%, 30%, 40%, 50%, 60%, 75%, and 95%. The AFM incorporates the notifications in the public register, which is available on its website. Failure to disclose the shareholding qualifies as an offense, and may result in civil penalties, including suspension.
The following table sets forth information with respect to the ownership of our common shares as of February 1, 2017, by each beneficial owner known to us of more than 3% of our common shares:
NUMBER OF SHARES PERCENT
NUMBER OF VOTING RIGHTS PERCENT 1)
J.P. Morgan Chase & Co 2) 9,628,500 16.1% 9,628,500 16.1%
Stichting ADP 3) 8,707,323 14.6% 8,707,323 14.6%
Eminence Capital LP 4) 5,134,627 8.6% 1,910,167 3.2%
Goldman Sachs Group Inc. 5) 4,529,018 7.6% 4,529,018 7.6%
Massachusetts Financial Services Company 6) 3,096,673 5.2% 3,587,647 6.0%
Norges Bank 7) 1,921,275 3.2% 1,921,275 3.2%
Schroders Plc 8) – – 2,049,027 3.4%
1 Calculated on the basis of 59,827,101 common shares outstanding as of February 1, 2017, and without regard to options.2 Of the share capital interest and voting rights held by J.P. Morgan Chase & Co, 407,161 shares are indirectly actual and 9,221,339 are
indirectly potential. Based on the notification filed with the AFM on January 13, 2017.3 The total capital interest of Stichting ADP is held indirectly actual, while of the 8,707,323 voting rights 8,704,284 are held indirectly actual
and 3,039 are held indirectly potential. Based on the AFM notification dated September 9, 2016.4 Of the share capital interest that Eminence Capital LP holds, 1,910,167 shares are directly actual and 3,224,460 are directly potential.
Based on the AFM notification dated May 29, 2015.5 Of the 4,529,018 shares and voting rights held by Goldman Sachs Group Inc. 2,105,332 are held indirectly actual and 2,423,686 indirectly
potential. Based on the AFM notification dated November 9, 2016.6 Massachusetts Financial Services Company’s capital interest amounts to 3,022,833 shares held directly actual and 73,840 shares indirectly
actual. Of the voting rights, 3,201,169 are held directly actual and 386,478 indirectly actual. Based on the notification filed with the AFM on July 6, 2016.
7 Of the share capital interest and voting rights held by Norges Bank, 1,907,726 shares are directly actual and 13,549 are directly potential. Based on the notification filed with the AFM on February 1, 2017.
8 All of the 2,049,027 voting rights held by Schroders Plc are indirectly actual. Based on the notification filed with the AFM on May 3, 2016.
ASMI STATUTORY ANNUAL REPORT 2016 | SHARES AND SHAREHOLDERS’ RIGHTS | 91A
BO
UT
ST
RA
TE
GY
& B
US
INE
SS
PE
RF
OR
MA
NC
E R
EV
IEW
SH
AR
EH
OL
DE
RS
GO
VE
RN
AN
CE
FIN
AN
CIA
L S
TAT
EM
EN
TS
GO
VE
RN
AN
CE
BENEFICIAL OWNERSA ‘beneficial owner’ of a security includes any person who, directly or indirectly, through any contract, arrangement, understanding, relationship, or otherwise has or shares (i) voting power which includes the power to vote, or to direct the voting of, such security and/or (ii) investment power which includes the power to dispose, or to direct the disposition, of such security. In addition, a person shall be deemed to be the beneficial owner of a security if that person has the right to acquire beneficial ownership of such security, as defined above, within 60 days, including but not limited to any right to acquire: (i) through the exercise of any option, warrant or right; (ii) through the conversion of a security; or (iii) pursuant to the power to revoke, or pursuant to the automatic termination of, a trust, discretionary account, or similar arrangement.
DIVIDENDASMI aims to pay a sustainable annual dividend. Annually, the Supervisory Board, upon proposal of the Management Board, will assess the amount of dividend that will be proposed to the Annual General Meeting of Shareholders. The decision that a dividend be proposed to the Annual General Meeting of Shareholders will be subject to the availability of distributable profits as well as retained earnings and may be affected by our potential future funding requirements. Accordingly, dividend payments may fluctuate and could decline or be omitted in any year.
In 2016 we paid a dividend of €0.70 per common share. In 2015 we paid a dividend of €0.60 per common share, and from 2012 to 2014 we paid €0.50 per common share and in July 2013 we paid €4.25 per common share as an extraordinary capital repayment subsequent to the realized gain on the sale of a 12% share in our associate ASMPT. We will propose to the forthcoming 2017 Annual General Meeting of Shareholders to declare a dividend of €0.70 per share.
ASMI STATUTORY ANNUAL REPORT 2016 | SHARES AND SHAREHOLDERS’ RIGHTS | 92A
BO
UT
ST
RA
TE
GY
& B
US
INE
SS
PE
RF
OR
MA
NC
E R
EV
IEW
SH
AR
EH
OL
DE
RS
GO
VE
RN
AN
CE
FIN
AN
CIA
L S
TAT
EM
EN
TS
GO
VE
RN
AN
CE
EXTERNAL AUDITORIn accordance with Dutch law, ASMI’s external auditor is appointed by the General Meeting of Shareholders and is nominated for appointment by the Supervisory Board upon advice from the Audit Committee and the Management Board. Our current external auditor, KPMG, was reappointed as external auditor by the 2016 Annual General Meeting of Shareholders for the reporting year 2016.
The external auditor is present at our Annual General Meeting of Shareholders to respond to questions, if any, from the shareholders about the auditor’s report on the financial statements.
The Audit Committee has determined that the provision of services by KPMG and its member firms is compatible with maintaining KPMG’s independence. All audit and permitted non-audit services provided by KPMG and its member firms during 2016 were pre-approved by the Audit Committee.
AUDIT COMMITTEE POLICIES AND PROCEDURESThe Audit Committee has adopted the following policies and procedures for pre-approval of all audit and permitted non-audit services provided by our external auditor:
AUDIT SERVICES Management submits to the Audit Committee for pre-approval the scope and estimated fees for specific services directly related to performing the independent audit of our statutory and Consolidated financial statements for the current year.
AUDIT-RELATED SERVICES The Audit Committee may pre-approve expenditures up to a specified amount for services included in identified service categories that are related extensions of audit services and are logically performed by the auditors. Additional services exceeding the specified pre-approved limits require specific Audit Committee approval.
TAX SERVICES The Audit Committee may pre-approve expenditures up to a specified amount per engagement and in total for identified services related to tax matters. Additional services exceeding the specified pre-approved limits, or involving service types not included in the pre-approved list, require specific Audit Committee approval.
OTHER SERVICES In the case of specified services for which utilizing our external auditor creates efficiencies, minimizes disruption or preserves confidentiality, or for which management has determined that our external auditor possesses unique or superior qualifications to provide such services, the Audit Committee may pre-approve expenditures up to a specified amount per engagement and in total. Additional services exceeding the specified pre-approved limits, or involving service types not included in the pre-approved list, require specific Audit Committee approval.
ASMI STATUTORY ANNUAL REPORT 2016 | EXTERNAL AUDITOR | 93A
BO
UT
ST
RA
TE
GY
& B
US
INE
SS
PE
RF
OR
MA
NC
E R
EV
IEW
SH
AR
EH
OL
DE
RS
GO
VE
RN
AN
CE
FIN
AN
CIA
L S
TAT
EM
EN
TS
GO
VE
RN
AN
CE

DECLARATIONSCOMPLIANCE WITH DUTCH CORPORATE GOVERNANCE CODEThe Dutch Corporate Governance Code was last amended on December 8, 2016. In 2017, Dutch listed companies are still required to report on compliance with the Code 2008 for the 2016 financial year. As of 2018, Dutch listed companies will report for the first time on compliance with the revised Code. The full text of the Dutch Corporate Governance Code can be found on the website of the Monitoring Commission Corporate Governance Code (www.mccg.nl).
ASMI applies the relevant principles and best practices of the Code 2008 applicable to the Company, to the Management Board, and to the Supervisory Board, in the manner set out in this Corporate Governance section, as long as it does not entail disclosure of commercially sensitive information, as accepted under the Code.
ASMI agrees with rule II.2.8 of the Code that in most circumstances a maximum severance payment of one year for Management Board members is appropriate. However, we want to reserve the right to agree to different amounts in case we deem this to be required by the circumstances. Any deviations will be disclosed.
RESPONSIBILITY STATEMENTThe members of the Management Board state that, to the best of their knowledge, the statutory financial statements prepared in accordance with IFRS-EU and Title 9 of part 2 of the Dutch Civil Code as included in this Statutory annual report 2016 provide a true and fair view of the assets, liabilities, financial position, and results of the Company and its subsidiaries included in the Consolidated statements and that the management report provides a true and fair view of the position and the business of the Company and its subsidiaries, and the Statutory annual report 2016 provides a description of the principal risks and uncertainties that the Company faces.
CORPORATE GOVERNANCE STATEMENTAccording to the Corporate Governance Code, the Company is required to publish a statement on corporate governance. This statement has to report on compliance with the Code. Furthermore, a description must be included of the main characteristics of the internal risk management and control systems connected with the Company’s financial reporting process. The corporate governance statement must also provide information on the functioning of the General Meeting of Shareholders, including its main rights, the composition of the Management Board and the Supervisory Board, including its committees.
The Management Board states that the information required by the December 23, 2004 (as lastly amended on December 10, 2008) decree is included in this Corporate Governance chapter and in the Risk Management chapter.
Corporate governance-related documents are available on our website. These include the Supervisory Board Profile, Supervisory Board Rules, Management Board Rules, the Audit Committee Charter, the Nomination, Selection and Remuneration Committee Charter, the Code of Ethics, the Whistleblower Policy, the Anti-Fraud Policy, the Rules concerning Insider Trading, and the Remuneration Policy.
ARTICLE 10 EU TAKEOVER DIRECTIVE DECREEThe Management Board states that the information required under Article 10 of the EU Takeover Directive Decree is disclosed in this Corporate Governance chapter to the extent that it is applicable to ASMI.
ASMI STATUTORY ANNUAL REPORT 2016 | DECLARATIONS | 94A
BO
UT
ST
RA
TE
GY
& B
US
INE
SS
PE
RF
OR
MA
NC
E R
EV
IEW
SH
AR
EH
OL
DE
RS
GO
VE
RN
AN
CE
FIN
AN
CIA
L S
TAT
EM
EN
TS
GO
VE
RN
AN
CE

RISK MANAGEMENT APPROACHASMI can be adversely affected by a variety of business risks and economic developments. A structured risk management process helps management to better understand how risks might impact the Company and to take appropriate risk mitigation initiatives.
Doing business inherently involves taking risks. ASMI strives for a culture of openness and transparency in which identified risks are disclosed pro-actively and unexpected events are reported as soon as they occur. The following is an overview of ASMI’s approach to risk management and control systems. Also, we include an assessment of the key risks.
RISK MANAGEMENT APPROACHA comprehensive Risk Management and Control Framework, based on the ‘three lines of defense model’, has been established that allows the Audit Committee and the Management Board a clear overview of the effectiveness of internal controls and risk management. Within the framework, the Management Board is responsible for designing, implementing, and operating an adequately functioning Internal Risk Management and Control Framework in the Company. The objective of this framework is to identify and manage the strategic, operational, financial, financial reporting, and compliance risks to which the Company is exposed, to promote effectiveness and efficiency in the Company’s operations, to promote reliable financial reporting and to promote compliance with laws and regulations. The Management Board is aware that such a framework can neither provide absolute assurance that its objectives will be achieved, nor can it entirely prevent material errors, losses, fraud, and the violation of laws and regulations.
Supporting the Management Board are the following three pillars:
› Business & Operations management. These management functions own and manage risk, and are responsible for maintaining effective controls and for executing risk and control procedures on a daily basis. This involves identifying and assessing risks being undertaken and establishing appropriate controls to mitigate the risks. There are adequate management controls in place to monitor ongoing compliance and to highlight control breakdowns.
› Oversight functions. These management functions support Business & Operations management and help ensure that the risk and control procedures are operating as intended.
› Internal Audit. This function provides independent objective assurance on the effectiveness of governance, risk management and internal controls including the manner in which Business & Operations Management and the oversight functions manage and control risk. Internal audit brings a systematic, disciplined approach to evaluate and improve the effectiveness of risk management, control and governance processes.
Our Internal Risk Management and Control Framework is based on the Integrated Framework issued by the Committee of Sponsoring Organizations of the Treadway Commission (COSO). The Framework aims to provide reasonable assurance regarding effectiveness and efficiency of an entity’s operations, reliability of financial reporting, prevention of fraud, and compliance with laws and regulations.
RISK MANAGEMENT
ASMI STATUTORY ANNUAL REPORT 2016 | RISK MANAGEMENT APPROACH | 95A
BO
UT
ST
RA
TE
GY
& B
US
INE
SS
PE
RF
OR
MA
NC
E R
EV
IEW
SH
AR
EH
OL
DE
RS
GO
VE
RN
AN
CE
FIN
AN
CIA
L S
TAT
EM
EN
TS
GO
VE
RN
AN
CE
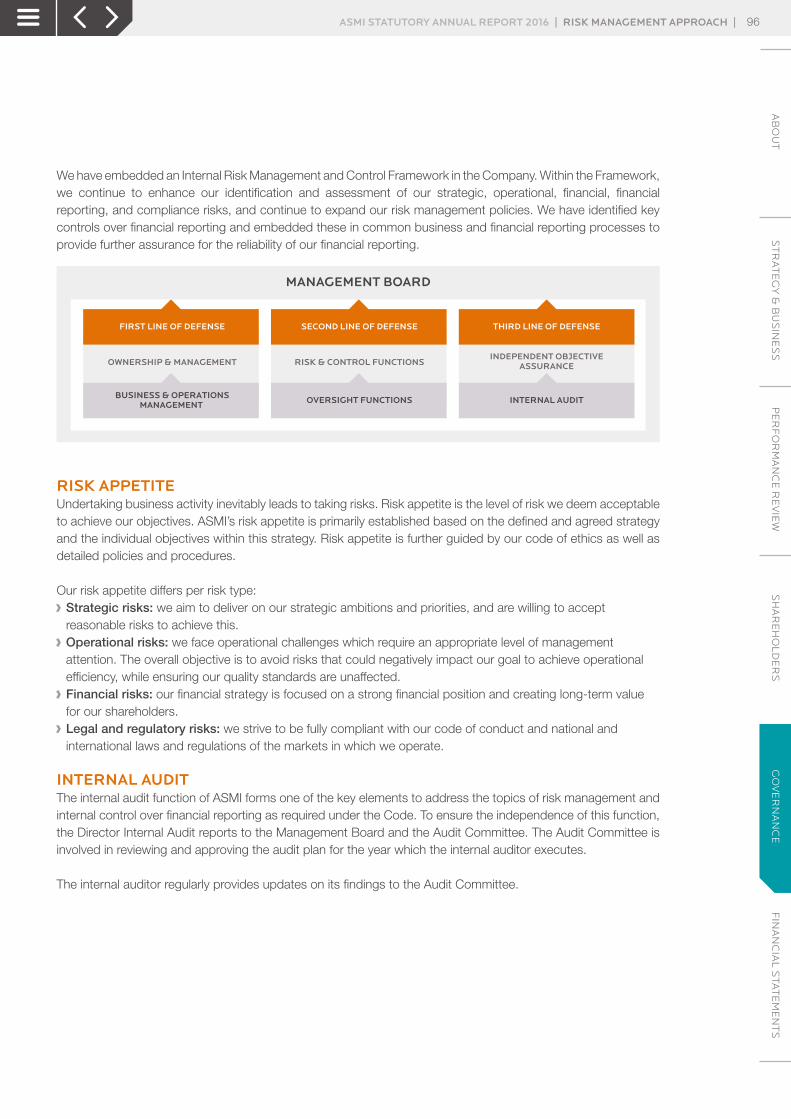
We have embedded an Internal Risk Management and Control Framework in the Company. Within the Framework, we continue to enhance our identification and assessment of our strategic, operational, financial, financial reporting, and compliance risks, and continue to expand our risk management policies. We have identified key controls over financial reporting and embedded these in common business and financial reporting processes to provide further assurance for the reliability of our financial reporting.
MANAGEMENT BOARD
FIRST LINE OF DEFENSE
OWNERSHIP & MANAGEMENT RISK & CONTROL FUNCTIONSINDEPENDENT OBJECTIVE
ASSURANCE
BUSINESS & OPERATIONSMANAGEMENT OVERSIGHT FUNCTIONS INTERNAL AUDIT
SECOND LINE OF DEFENSE THIRD LINE OF DEFENSE
RISK APPETITE Undertaking business activity inevitably leads to taking risks. Risk appetite is the level of risk we deem acceptable to achieve our objectives. ASMI’s risk appetite is primarily established based on the defined and agreed strategy and the individual objectives within this strategy. Risk appetite is further guided by our code of ethics as well as detailed policies and procedures.
Our risk appetite differs per risk type: › Strategic risks: we aim to deliver on our strategic ambitions and priorities, and are willing to accept reasonable risks to achieve this.
› Operational risks: we face operational challenges which require an appropriate level of management attention. The overall objective is to avoid risks that could negatively impact our goal to achieve operational efficiency, while ensuring our quality standards are unaffected.
› Financial risks: our financial strategy is focused on a strong financial position and creating long-term value for our shareholders.
› Legal and regulatory risks: we strive to be fully compliant with our code of conduct and national and international laws and regulations of the markets in which we operate.
INTERNAL AUDIT The internal audit function of ASMI forms one of the key elements to address the topics of risk management and internal control over financial reporting as required under the Code. To ensure the independence of this function, the Director Internal Audit reports to the Management Board and the Audit Committee. The Audit Committee is involved in reviewing and approving the audit plan for the year which the internal auditor executes.
The internal auditor regularly provides updates on its findings to the Audit Committee.
ASMI STATUTORY ANNUAL REPORT 2016 | RISK MANAGEMENT APPROACH | 96A
BO
UT
ST
RA
TE
GY
& B
US
INE
SS
PE
RF
OR
MA
NC
E R
EV
IEW
SH
AR
EH
OL
DE
RS
GO
VE
RN
AN
CE
FIN
AN
CIA
L S
TAT
EM
EN
TS
GO
VE
RN
AN
CE
CONTROL EFFECTIVENESS STATEMENTThe Management Board is responsible for ASMI’s Internal Risk Management and Control Framework. This system is designed to manage the main risks that may prevent ASMI from achieving its objectives. However, this system cannot provide absolute assurance that material misstatements, fraud, and violations of laws and regulations can be avoided. The Internal Risk Management and Control Framework and the evaluation of the effectiveness of our internal controls and areas for improvement are regularly discussed with the Audit Committee and KPMG Accountants, our external auditor. The Audit Committee reports on these matters to the Supervisory Board.
The Management Board conducted an evaluation of the effectiveness of our internal control over financial reporting based on the Internal Control Integrated Framework issued by the COSO. Based on this evaluation of the effectiveness of the Company’s internal control over financial reporting, all members of the Management Board concluded that, as of December 31, 2016, the Company’s internal control over financial reporting was effective and provides reasonable assurance for the reliability of financial reporting and the preparation of financial statements for external purposes in accordance with generally accepted accounting principles. In addition, to the best of the knowledge of the Management Board, the management report includes a fair review of the development and performance of the business and the position of the Company and the undertakings included in the consolidation as a whole, as well as a description of the principal risks and uncertainties that the Company faces. No changes to the Company’s internal control over financial reporting have occurred during 2016 that have materially affected, or are reasonably likely to materially affect, the Company’s internal control over financial reporting.
All internal control systems, no matter how well designed and implemented, have inherent limitations. Even systems determined to be effective may not prevent or detect misstatements or fraud, and can only provide reasonable assurance with respect to disclosure and financial statement presentation and reporting. Additionally, projections of any evaluation of effectiveness to future periods are subject to the risk that controls may become inadequate due to changed conditions and that the degree of compliance with the policies or procedures may deteriorate.
In view of all of the above, the Management Board believes that it complies with the requirements of best practice provision II.1.5 of the Code.
ASMI STATUTORY ANNUAL REPORT 2016 | RISK MANAGEMENT APPROACH | 97A
BO
UT
ST
RA
TE
GY
& B
US
INE
SS
PE
RF
OR
MA
NC
E R
EV
IEW
SH
AR
EH
OL
DE
RS
GO
VE
RN
AN
CE
FIN
AN
CIA
L S
TAT
EM
EN
TS
GO
VE
RN
AN
CE
RISK CATEGORIES AND FACTORSIn conducting our business, we face a number of risks that may interfere with our business objectives. Some of these risks relate to our operational processes, while others relate to our business environment. It is important to understand the nature of these risks and the impact they may have on our business, financial condition, and results of operations. Some of the more relevant risks are described below, which may not be in order of likelihood or materiality. These risks are not the only ones we face. Some risks may not yet be known to us and certain risks that we do not currently believe to be material could become material in the future.
STRATEGIC RISKS › The semiconductor industry is highly cyclical and is subject to rapid technological change. We face intense competition from companies which have greater resources than we do, and potential competition from new companies entering the market in which we compete. Therefore, we invest in research and development, in an effort to compete effectively. Our primary competitors for our wafer processing equipment include Applied Materials, LAM Research Corporation, Tokyo Electron, Hitachi Kokusai, Wonik IPS, and Jusung.
› We have to recruit or retain qualified personnel or integrate qualified personnel into our organization in order to avoid reduced sales, delayed product development, and diversion of management resources. Our business and future operating results depend in part upon our ability to attract and retain qualified management, technical, sales, and support personnel for our operations on a worldwide basis. Competition for qualified personnel is intense, and we cannot guarantee that we will be able to continue to attract and retain qualified personnel.
› The costs of semiconductor manufacturers for switching from one semiconductor equipment supplier to another can be high, therefore it may be more difficult to sell our products to customers having a competing installed base.
OPERATIONAL RISKS › The Company derives a significant percentage of its revenue from a small number of large customers. The ten largest customers accounted for approximately 78.5% of net sales in 2016 (2015: 81.0%). Reduction, rescheduling or cancellation of orders would reduce our revenues.
› Our products generally have long sales cycles and implementation periods, which increase our costs of obtaining orders and reduce the predictability of our earnings. Our products are technologically complex. Prospective customers generally must commit significant resources to test and evaluate our products and to install and integrate them into larger systems. In addition, customers often require a significant number of product presentations and demonstrations, in some instances evaluating equipment on site, before reaching a sufficient level of confidence in the product’s performance and compatibility with the customer’s requirements to place an order. As a result, our sales process is often subject to delays associated with lengthy approval processes that typically accompany the design and testing of new products.
› We outsource a significant portion of the manufacturing of our business to a limited number of suppliers. If our suppliers were unable or unwilling to deliver products in a timely manner to us in the quantities we require, we may be unable to fill customer orders on a timely basis, which could negatively affect our customer relationships and financial performance. We have shifted much of our operational activities to our Front-end Manufacturing Singapore (FEMS) facility. If this facility experiences a manufacturing disruption for any reason, our ability to timely meet our customers’ needs may be impaired, which would negatively affect our customer relationships and financial performance.
ASMI STATUTORY ANNUAL REPORT 2016 | RISK CATEGORIES AND FACTORS | 98A
BO
UT
ST
RA
TE
GY
& B
US
INE
SS
PE
RF
OR
MA
NC
E R
EV
IEW
SH
AR
EH
OL
DE
RS
GO
VE
RN
AN
CE
FIN
AN
CIA
L S
TAT
EM
EN
TS
GO
VE
RN
AN
CE
› Our internal information technology systems are a fundamental component of our business operations. In today’s world, these systems are subject to compromise by aging and other matters such as computer viruses, unauthorized access, and general system failures or unforeseen difficulties. Such incidents could result in business disruption and theft of confidential information. We focus on proactive measures to prevent and mitigate such risks.
LEGAL AND REGULATORY RISKS › Our success and ability to compete depend in large part upon protecting our proprietary technology. We rely on a combination of patent, trade secret, copyright and trademark laws, non-disclosure and other agreements, and technical measures to protect our proprietary rights and confidential information. These agreements and measures may turn out not to be sufficient. Our technology may be infringed by third parties. In addition, patents issued to us may be challenged, invalidated or circumvented, rights granted to us under patents may not provide competitive advantages to us. In addition, monitoring unauthorized use of our intellectual property is difficult and we cannot be certain that the steps we have taken will prevent unauthorized use of our technology. The laws of some countries in which our products are or may be developed, manufactured or sold, including various countries in Asia, may not protect our products or intellectual property rights to the same extent as do the laws of the Netherlands and the United States. In past years, there has been substantial litigation regarding patent and other intellectual property rights in our semiconductor and related technology industries. In the future, litigation may be necessary to enforce patents issued to us, to protect trade secrets or know-how owned by us or to defend us against claimed infringement of the rights of others and to determine the scope and validity of the proprietary rights of others. On the flip side a threat is be that third parties may assert that our products infringe their intellectual property.
› We are party from time to time to various legal proceedings and claims generally incidental to our business including without limitation intellectual property and product liability claims. For each of these proceedings and claims, our management evaluates, based on the relevant facts and legal principles, the likelihood of an unfavorable outcome and whether the amount of the loss can be reasonably estimated, in connection with our determination of whether or not to record a charge to earnings.
› Our operations are subject to many laws and regulations wherever we operate. To the extent such regulations or directives apply to our business throughout the world, such legislation may adversely affect our business; for example by forcing us or our suppliers to change production processes or use more costly or scarce materials. As with other companies engaged in similar activities, we face inherent risks of environmental liability in our current and historical manufacturing, R&D activities, and operations. Accordingly, costs and regulatory fines associated with such future environmental compliance or remediation obligations could adversely affect our business.
› Changes in taxation could affect our future profitability.
RISKS RELATED TO OUR INVESTMENT IN ASM PACIFIC TECHNOLOGYA significant portion of our total assets is composed of our interest in ASMPT. Prior to March 2013, we owned approximately 52% of the outstanding equity of ASMPT, and the assets and operating results of ASMPT were reported by us on a consolidated basis. On March 15, 2013, we disposed of a 12% stake in ASMPT, which reduced our ownership to approximately 40% of the outstanding equity. As a result of this, ASMPT ceased to be a consolidated subsidiary as of that date and our pro rata interest in the net earnings of ASMPT is reported in our Consolidated Statement of Profit or Loss. As per December 31, 2016, our interest in ASMPT is 39.19%. Although ASMPT operates in the same industry as ASMI, ASMPT addresses a different segment of the industry, which may involve different market dynamics and competitive factors from time to time, as well as different business risks unique to their operations. ASMPT is a public company traded on the Hong Kong Stock Exchange.
ASMI STATUTORY ANNUAL REPORT 2016 | RISK CATEGORIES AND FACTORS | 99A
BO
UT
ST
RA
TE
GY
& B
US
INE
SS
PE
RF
OR
MA
NC
E R
EV
IEW
SH
AR
EH
OL
DE
RS
GO
VE
RN
AN
CE
FIN
AN
CIA
L S
TAT
EM
EN
TS
GO
VE
RN
AN
CE
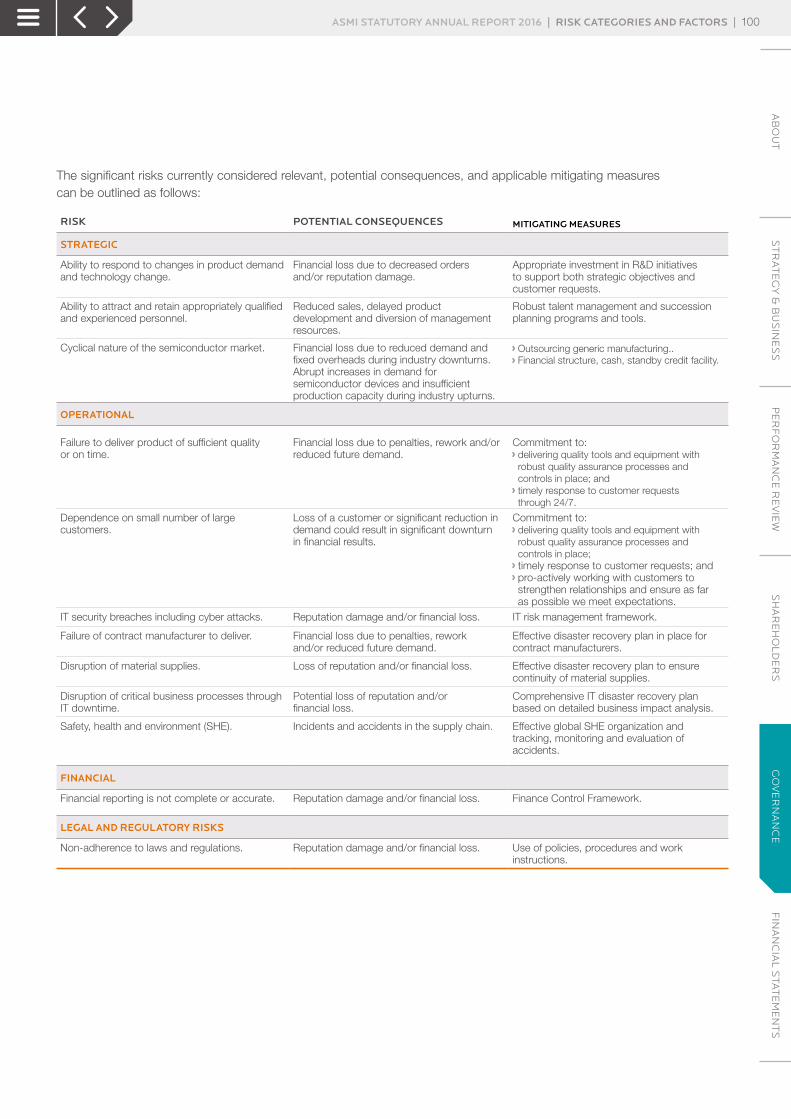
The significant risks currently considered relevant, potential consequences, and applicable mitigating measures can be outlined as follows:
RISK POTENTIAL CONSEQUENCES MITIGATING MEASURES
STRATEGIC
Ability to respond to changes in product demand and technology change.
Financial loss due to decreased orders and/or reputation damage.
Appropriate investment in R&D initiatives to support both strategic objectives and customer requests.
Ability to attract and retain appropriately qualified and experienced personnel.
Reduced sales, delayed product development and diversion of management resources.
Robust talent management and succession planning programs and tools.
Cyclical nature of the semiconductor market. Financial loss due to reduced demand and fixed overheads during industry downturns. Abrupt increases in demand for semiconductor devices and insufficient production capacity during industry upturns.
› Outsourcing generic manufacturing..› Financial structure, cash, standby credit facility.
OPERATIONAL
Failure to deliver product of sufficient quality or on time.
Financial loss due to penalties, rework and/or reduced future demand.
Commitment to:› delivering quality tools and equipment with robust quality assurance processes and controls in place; and
› timely response to customer requests through 24/7.
Dependence on small number of large customers.
Loss of a customer or significant reduction in demand could result in significant downturn in financial results.
Commitment to:› delivering quality tools and equipment with robust quality assurance processes and controls in place;
› timely response to customer requests; and› pro-actively working with customers to strengthen relationships and ensure as far as possible we meet expectations.
IT security breaches including cyber attacks. Reputation damage and/or financial loss. IT risk management framework.
Failure of contract manufacturer to deliver. Financial loss due to penalties, rework and/or reduced future demand.
Effective disaster recovery plan in place for contract manufacturers.
Disruption of material supplies. Loss of reputation and/or financial loss. Effective disaster recovery plan to ensure continuity of material supplies.
Disruption of critical business processes through IT downtime.
Potential loss of reputation and/or financial loss.
Comprehensive IT disaster recovery plan based on detailed business impact analysis.
Safety, health and environment (SHE). Incidents and accidents in the supply chain. Effective global SHE organization and tracking, monitoring and evaluation of accidents.
FINANCIAL
Financial reporting is not complete or accurate. Reputation damage and/or financial loss. Finance Control Framework.
LEGAL AND REGULATORY RISKS
Non-adherence to laws and regulations. Reputation damage and/or financial loss. Use of policies, procedures and work instructions.
ASMI STATUTORY ANNUAL REPORT 2016 | RISK CATEGORIES AND FACTORS | 100A
BO
UT
ST
RA
TE
GY
& B
US
INE
SS
PE
RF
OR
MA
NC
E R
EV
IEW
SH
AR
EH
OL
DE
RS
GO
VE
RN
AN
CE
FIN
AN
CIA
L S
TAT
EM
EN
TS
GO
VE
RN
AN
CE
AB
OU
TS
TR
AT
EG
Y &
BU
SIN
ES
SP
ER
FO
RM
AN
CE
RE
VIE
WS
HA
RE
HO
LD
ER
SG
OV
ER
NA
NC
EF
INA
NC
IAL
STA
TE
ME
NT
SASMI STATUTORY ANNUAL REPORT 2016 101
FIN
AN
CIA
L S
TAT
EM
EN
TS
FINANCIAL STATEMENTS
CONSOLIDATED FINANCIAL STATEMENTS>>Consolidated statement of profit or loss
>>Consolidated statement of comprehensive income
>>Consolidated statement of financial position
>>Consolidated statement of changes in equity
>>Consolidated statement of cash flows
>>Notes to the Consolidated financial statements
ASM INTERNATIONAL NV FINANCIAL STATEMENTS>>Company balance sheet
>>Company statement of profit or loss
>>Notes to the Company financial statements
INDEPENDENT AUDITOR’S REPORT
OTHER INFORMATION
AUDIT REPORT
IFRS
FINANCIALRESULTS

CONSOLIDATED STATEMENT OF PROFIT OR LOSS YEAR ENDED DECEMBER 31,
(EUR thousand, except per share data) NOTES 2015 2016
Net sales 19 669,621 597,930
Cost of sales (374,094) (333,430)
GROSS PROFIT 19 295,527 264,500
Operating expenses:
Selling, general and administrative 21 (94,729) (91,130)
Research and development 22 (89,735) (91,129)
TOTAL OPERATING EXPENSES (184,464) (182,259)
RESULT FROM OPERATIONS 19 111,063 82,241
Finance income 1,112 3,095
Finance expense (1,620) (1,096)
Foreign currency exchange gain, net 25,264 13,032
Share in income of investments in associates 6 16,108 40,488
RESULT BEFORE INCOME TAXES 151,927 137,760
Income taxes 20 5,350 (2,289)
NET EARNINGS FROM OPERATIONS, ATTRIBUTABLE TO COMMON SHAREHOLDERS 157,277 135,471
Per share data 23
Basic net earnings per share (EUR):
FROM OPERATIONS 2.53 2.23
Diluted net earnings per share (EUR):
FROM OPERATIONS 2.50 2.21
Weighted average number of shares (thousand):
Basic 62,114 60,616
Diluted 62,928 61,253
Consolidated financial statements
AB
OU
TS
TR
AT
EG
Y &
BU
SIN
ES
SP
ER
FO
RM
AN
CE
RE
VIE
WS
HA
RE
HO
LD
ER
SG
OV
ER
NA
NC
EF
INA
NC
IAL
STA
TE
ME
NT
SASMI STATUTORY ANNUAL REPORT 2016 | CONSOLIDATED STATEMENT OF PROFIT OR LOSS | 102
FIN
AN
CIA
L S
TAT
EM
EN
TS

CONSOLIDATED STATEMENT OF COMPREHENSIVE INCOME YEAR ENDED DECEMBER 31,
(EUR thousand) NOTES 2015 2016
NET EARNINGS FROM OPERATIONS, ATTRIBUTABLE TO COMMON SHAREHOLDERS 157,277 135,471Other comprehensive income, items that may be subsequently reclassified to profit or loss:
Foreign currency translation effect 136,744 40,731
Proportionate part in other comprehensive income (loss) investments in associates 567 (1,344)
TOTAL 137,311 39,387
Related tax – –
TOTAL COMPREHENSIVE INCOME, ATTRIBUTABLE TO COMMON SHAREHOLDERS 11 294,588 174,858
AB
OU
TS
TR
AT
EG
Y &
BU
SIN
ES
SP
ER
FO
RM
AN
CE
RE
VIE
WS
HA
RE
HO
LD
ER
SG
OV
ER
NA
NC
EF
INA
NC
IAL
STA
TE
ME
NT
SASMI STATUTORY ANNUAL REPORT 2016 | CONSOLIDATED STATEMENT OF COMPREHENSIVE INCOME | 103
FIN
AN
CIA
L S
TAT
EM
EN
TS
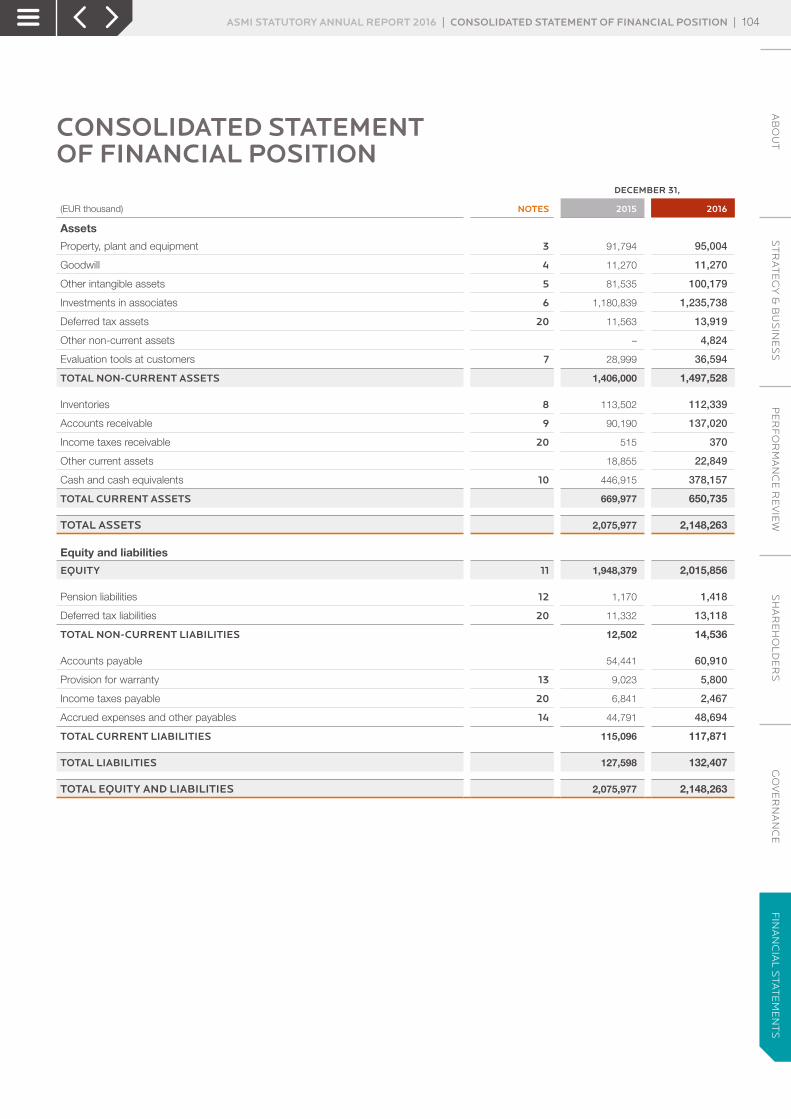
CONSOLIDATED STATEMENT OF FINANCIAL POSITION DECEMBER 31,
(EUR thousand) NOTES 2015 2016
Assets
Property, plant and equipment 3 91,794 95,004
Goodwill 4 11,270 11,270
Other intangible assets 5 81,535 100,179
Investments in associates 6 1,180,839 1,235,738
Deferred tax assets 20 11,563 13,919
Other non-current assets – 4,824
Evaluation tools at customers 7 28,999 36,594
TOTAL NON-CURRENT ASSETS 1,406,000 1,497,528
Inventories 8 113,502 112,339
Accounts receivable 9 90,190 137,020
Income taxes receivable 20 515 370
Other current assets 18,855 22,849
Cash and cash equivalents 10 446,915 378,157
TOTAL CURRENT ASSETS 669,977 650,735
TOTAL ASSETS 2,075,977 2,148,263
Equity and liabilities
EQUITY 11 1,948,379 2,015,856
Pension liabilities 12 1,170 1,418
Deferred tax liabilities 20 11,332 13,118
TOTAL NON-CURRENT LIABILITIES 12,502 14,536
Accounts payable 54,441 60,910
Provision for warranty 13 9,023 5,800
Income taxes payable 20 6,841 2,467
Accrued expenses and other payables 14 44,791 48,694
TOTAL CURRENT LIABILITIES 115,096 117,871
TOTAL LIABILITIES 127,598 132,407
TOTAL EQUITY AND LIABILITIES 2,075,977 2,148,263
AB
OU
TS
TR
AT
EG
Y &
BU
SIN
ES
SP
ER
FO
RM
AN
CE
RE
VIE
WS
HA
RE
HO
LD
ER
SG
OV
ER
NA
NC
EF
INA
NC
IAL
STA
TE
ME
NT
SASMI STATUTORY ANNUAL REPORT 2016 | CONSOLIDATED STATEMENT OF FINANCIAL POSITION | 104
FIN
AN
CIA
L S
TAT
EM
EN
TS
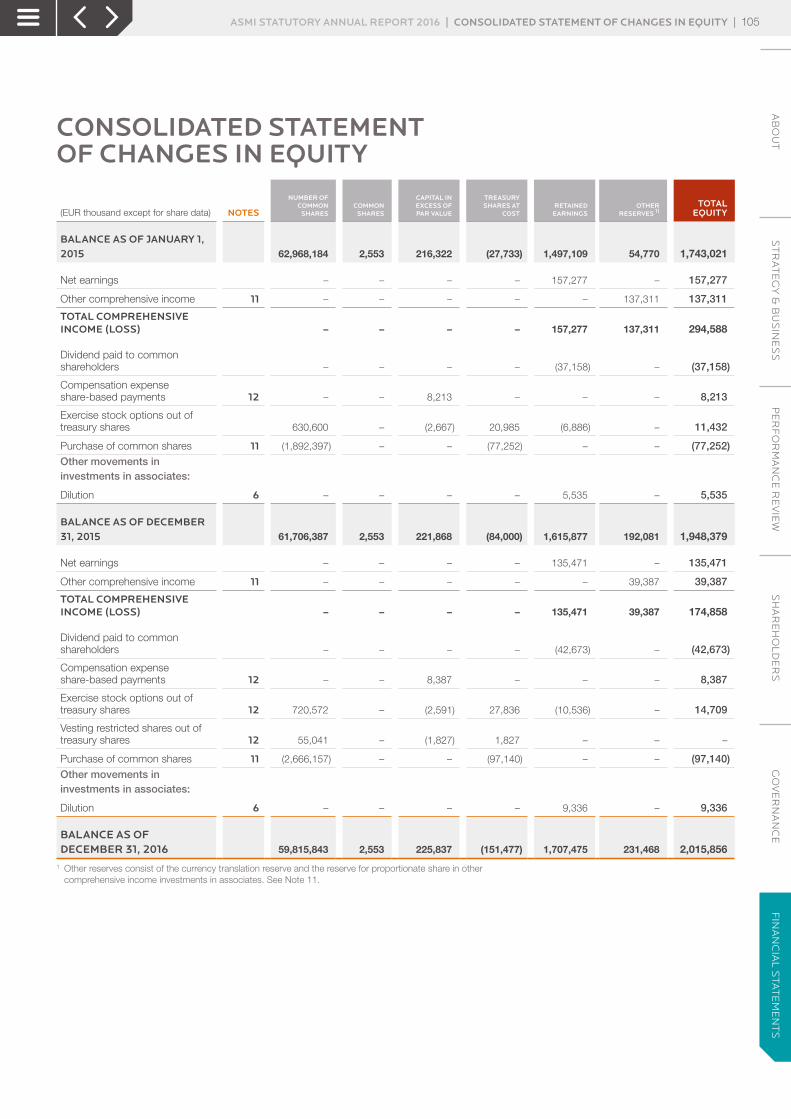
CONSOLIDATED STATEMENT OF CHANGES IN EQUITY
(EUR thousand except for share data) NOTES
NUMBER OF COMMON
SHARESCOMMON
SHARES
CAPITAL IN EXCESS OF PAR VALUE
TREASURY SHARES AT
COSTRETAINED
EARNINGSOTHER
RESERVES 1)TOTAL
EQUITY
BALANCE AS OF JANUARY 1, 2015 62,968,184 2,553 216,322 (27,733) 1,497,109 54,770 1,743,021
Net earnings – – – – 157,277 – 157,277
Other comprehensive income 11 – – – – – 137,311 137,311
TOTAL COMPREHENSIVE INCOME (LOSS) – – – – 157,277 137,311 294,588
Dividend paid to common shareholders – – – – (37,158) – (37,158)
Compensation expense share-based payments 12 – – 8,213 – – – 8,213
Exercise stock options out of treasury shares 630,600 – (2,667) 20,985 (6,886) – 11,432
Purchase of common shares 11 (1,892,397) – – (77,252) – – (77,252)Other movements in investments in associates:
Dilution 6 – – – – 5,535 – 5,535
BALANCE AS OF DECEMBER 31, 2015 61,706,387 2,553 221,868 (84,000) 1,615,877 192,081 1,948,379
Net earnings – – – – 135,471 – 135,471
Other comprehensive income 11 – – – – – 39,387 39,387
TOTAL COMPREHENSIVE INCOME (LOSS) – – – – 135,471 39,387 174,858
Dividend paid to common shareholders – – – – (42,673) – (42,673)
Compensation expense share-based payments 12 – – 8,387 – – – 8,387
Exercise stock options out of treasury shares 12 720,572 – (2,591) 27,836 (10,536) – 14,709
Vesting restricted shares out of treasury shares 12 55,041 – (1,827) 1,827 – – –
Purchase of common shares 11 (2,666,157) – – (97,140) – – (97,140)Other movements in investments in associates:
Dilution 6 – – – – 9,336 – 9,336
BALANCE AS OF DECEMBER 31, 2016 59,815,843 2,553 225,837 (151,477) 1,707,475 231,468 2,015,856
1 Other reserves consist of the currency translation reserve and the reserve for proportionate share in other comprehensive income investments in associates. See Note 11.
AB
OU
TS
TR
AT
EG
Y &
BU
SIN
ES
SP
ER
FO
RM
AN
CE
RE
VIE
WS
HA
RE
HO
LD
ER
SG
OV
ER
NA
NC
EF
INA
NC
IAL
STA
TE
ME
NT
SASMI STATUTORY ANNUAL REPORT 2016 | CONSOLIDATED STATEMENT OF CHANGES IN EQUITY | 105
FIN
AN
CIA
L S
TAT
EM
EN
TS

CONSOLIDATED STATEMENT OF CASH FLOWS YEAR ENDED DECEMBER 31,
(EUR thousand) NOTES 2015 2016
Cash flows from operating activities
Net earnings from operations 157,277 135,471
Adjustments to reconcile net earnings to net cash from operating activities
Depreciation, amortization and impairments 3,5 54,290 51,690
Share-based compensation 12 8,213 8,387
Non-cash financing costs (17,105) (2,483)
Share in income of investments in associates 6 (16,108) (40,488)
Income tax (5,350) 2,289
Changes in assets and liabilities
Accounts receivable (2,835) (43,352)
Inventories 13,436 (9,510)
Other current assets (4,860) (10,212)
Accounts payable and accrued expenses (2,976) 7,045
Income tax paid (9,165) (7,425)
NET CASH FROM OPERATING ACTIVITIES 174,817 91,412
Cash flows from investing activities
Capital expenditures 3 (33,576) (26,890)
Proceeds from sale of property, plant and equipment 3 411 1,147
Capitalized development expenditure 5 (30,178) (27,327)
Purchase of intangible assets 5 (7,215) (7,024)
Dividend received from associates 6 42,865 22,083
Investments in associates 6 (900) –
NET CASH USED IN INVESTING ACTIVITIES (28,593) (38,011)
Cash flows from financing activities
Debt issuance fees paid – (810)
Purchase of treasury shares ASMI 11 (79,076) (97,024)
Proceeds from issuance of shares and exercise of stock options 12 11,323 14,709
Dividends to common shareholders of ASMI (37,158) (42,673)
NET CASH USED IN FINANCING ACTIVITIES (104,911) (125,798)
FOREIGN CURRENCY TRANSLATION EFFECT ON CASH AND CASH EQUIVALENTS 19,825 3,639
NET INCREASE / (DECREASE) IN CASH AND CASH EQUIVALENTS 61,138 (68,758)
Cash and cash equivalents at beginning of year 10 385,777 446,915
CASH AND CASH EQUIVALENTS AT END OF YEAR 10 446,915 378,157
AB
OU
TS
TR
AT
EG
Y &
BU
SIN
ES
SP
ER
FO
RM
AN
CE
RE
VIE
WS
HA
RE
HO
LD
ER
SG
OV
ER
NA
NC
EF
INA
NC
IAL
STA
TE
ME
NT
SASMI STATUTORY ANNUAL REPORT 2016 | CONSOLIDATED STATEMENT OF CASH FLOWS | 106
FIN
AN
CIA
L S
TAT
EM
EN
TS

NOTES TO THE CONSOLIDATED FINANCIAL STATEMENTS
NOTE 1. GENERAL INFORMATION/SUMMARY OF SIGNFICANT ACCOUNTING POLICIES
GENERAL INFORMATIONASM International NV (ASMI, or the Company) is a Dutch public liability company domiciled in the Netherlands with its principal operations in Europe, the United States of America and Asia. The Company dedicates its resources to the research, development, manufacturing, marketing and servicing of equipment and materials used to produce mainly semiconductor devices. The Company is registered at Versterkerstraat 8, 1322 AP Almere, the Netherlands.
The Company’s shares are listed for trading on the Euronext Amsterdam Stock Exchange (symbol ASM).
The accompanying Consolidated financial statements include the financial statements of ASM International NV, and its consolidated subsidiaries (together referred to as ASMI, or the Company). ASMI’s subsidiaries are listed in Note 2, and associates are listed in Note 6.
BASIS FOR ACCOUNTINGThe Consolidated financial statements for the year ended December 2016 have been prepared in accordance with International Financial Reporting Standards (IFRS) as adopted by the European Union and also comply with the financial reporting requirements included in Section 362(9) of Part 9, Book 2 of the Dutch Civil Code.
The financial statements have been prepared by the Management Board of the Company and authorized for issue on March 9, 2017 and will be submitted for adoption to the Annual General Meeting of Shareholders (AGM) on May 22, 2017.
The financial statements will be filed at the Trade Register of the Chamber of Commerce in Almere, the Netherlands within eight days of adoption by the 2017 AGM.
FUNCTIONAL AND PRESENTATION CURRENCY The accompanying Consolidated financial statements are presented in thousands of euros (EUR), which is the Company’s functional currency. All financial information is presented in euros thousand unless stated otherwise, and has been rounded to the nearest thousand.
BASIS FOR MEASUREMENTThe Consolidated financial statements have been prepared under the historical cost convention, unless otherwise indicated. The Company applies the going concern basis in preparing its financial statements.
USE OF ESTIMATES AND JUDGMENTSThe preparation of the Company’s Consolidated financial statements requires management to make judgments, estimates and assumptions that affect the amounts reported in the financial statements and accompanying notes. Actual results could differ materially from those estimates. We evaluate our estimates and underlying assumptions on an ongoing basis. We base our estimates on historical experience and on various other assumptions that are believed to be reasonable, the results of which form the basis for making judgments about the carrying values of assets and liabilities. Revisions to accounting estimates are recognized in the period in which the estimates are revised and in any future periods affected.
AB
OU
TS
TR
AT
EG
Y &
BU
SIN
ES
SP
ER
FO
RM
AN
CE
RE
VIE
WS
HA
RE
HO
LD
ER
SG
OV
ER
NA
NC
EF
INA
NC
IAL
STA
TE
ME
NT
SASMI STATUTORY ANNUAL REPORT 2016 | NOTES TO THE CONSOLIDATED FINANCIAL STATEMENTS | 107
FIN
AN
CIA
L S
TAT
EM
EN
TS
Information about assumptions and estimation uncertainties that have a significant risk of resulting in a material adjustment within the next financial year are described below and other relevant disclosures are disclosed in the following notes:
› Notes 3, 4, 5, 6 and – Valuation of non-financial assets › Note 20 – Valuation of deferred tax assets
CRITICAL ACCOUNTING POLICIESA critical accounting policy is defined as one that is both material to the presentation of ASMI’s Consolidated financial statements and that requires management to make difficult, subjective or complex judgments that could have a material effect on ASMI’s financial condition or results of operations. Specifically, these policies have the following attributes: (1) ASMI is required to make assumptions about matters that are highly uncertain at the time of the estimate; and (2) different estimates ASMI could reasonably have used, or changes in the estimate that are reasonably likely to occur, could have a material effect on ASMI’s financial condition or results of operations.
Estimates and assumptions about future events and their effects cannot be determined with certainty. ASMI bases its estimates on historical experience and on various other assumptions believed to be applicable and reasonable under the circumstances. These estimates may change as new events occur, as additional information is obtained, and as ASMI’s operating environment changes. These changes have historically been minor and have been included in the Consolidated financial statements as soon as they became known. In addition, management is periodically faced with uncertainties, the outcomes of which are not within its control and will not be known for prolonged periods of time. Based on a critical assessment of its accounting policies and the underlying judgments and uncertainties affecting the application of those policies, management believes that ASMI’s Consolidated financial statements are fairly stated in accordance with IFRS, and provide a meaningful presentation of ASMI’s financial condition and results of operations. An analysis of specific sensitivity to changes of estimates and assumptions is included in the notes to the financial statement.
Management believes that the following are critical accounting policies:
› revenue recognition; › inventories; › evaluation of long-lived assets for impairment; › evaluation of investments in associates for impairment; › intangible assets; and › income taxes.
SUMMARY OF SIGNIFICANT ACCOUNTING POLICIESConsolidationThe Consolidated financial statements include the accounts of ASM International NV and all of its subsidiaries where ASMI holds a controlling interest. Non-controlling interest is disclosed separately, as appropriate, in the Consolidated financial statements.
Control exists when ASMI has: › the power over an investee; › exposure, or rights, to variable returns from its involvement with the investee; and › the ability to use its power over the investee to affect the amount of the investor’s returns.
As from the date that these criteria are met, the financial data of the relevant subsidiary are included in the consolidation. The financial data are deconsolidated from the date on which ASMI’s control ceases.
Loss of controlUpon the loss of control, ASMI derecognizes the assets and liabilities of the subsidiary, any non-controlling interests and the other components of equity related to the subsidiary. Any surplus or deficit arising on the loss of control is recognized in profit or loss. If ASMI retains any interest in the previous subsidiary, then such interest
AB
OU
TS
TR
AT
EG
Y &
BU
SIN
ES
SP
ER
FO
RM
AN
CE
RE
VIE
WS
HA
RE
HO
LD
ER
SG
OV
ER
NA
NC
EF
INA
NC
IAL
STA
TE
ME
NT
SASMI STATUTORY ANNUAL REPORT 2016 | NOTES TO THE CONSOLIDATED FINANCIAL STATEMENTS | 108
FIN
AN
CIA
L S
TAT
EM
EN
TS
is measured at fair value at the date on which control is lost. Subsequently, it is accounted for as an equity-accounted investee or as an available-for-sale financial asset, depending on the level of influence retained.
Foreign currency translationThe individual financial statements of each group entity are presented in their functional currency. For the purpose of the Consolidated financial statements, the results and financial position of each entity are expressed in euros, which is ASMI’s functional currency, and the presentation currency for the Consolidated financial statements.
In preparing the financial statements of the individual entities, transactions in foreign currencies are recorded at the rates of exchange prevailing on the date of the transactions. At each balance sheet date, monetary items denominated in foreign currencies are translated at the rates prevailing on the balance sheet date. Non-monetary items carried at fair value that are denominated in foreign currencies are translated at the rates prevailing on the date when the fair value was determined.
Exchange rate differences arising on the settlement of monetary items, and on the translation of monetary items, are recognized in the Consolidated statement of profit or loss in the period in which they arise. Exchange rate differences arising on the translation of non-monetary items carried at fair value are recognized in the Consolidated statement of profit or loss for the period except for differences arising on the translation of non-monetary items in respect of which gains and losses are recognized directly in equity.
For the purpose of presenting Consolidated financial statements, the assets and liabilities of our foreign subsidiaries (including comparatives) are expressed in euros using exchange rates prevailing on the balance sheet date. Income and cost items (including comparatives) are translated at the average exchange rates for the period. Exchange rate differences arising are classified as other comprehensive income in equity. Such translation differences are recognized in the Consolidated statement of profit or loss in the period in which the foreign operation is disposed. Currency differences on intercompany loans that have the nature of a long-term investment are also accounted for directly in equity.
Segment reportingThe Back-end segment is still reported as a separate segment after the Company ceased control on March 15, 2013, since the full results of the Back-end segment are continued to be reviewed by our Chief Operating Decision Maker (CODM).
The Company organizes its activities in two operating segments, Front-end and Back-end. Operating segments are reported in a manner consistent with the internal reporting provided to the Chief Executive Officer (CEO), which is the CODM. Operating segments are in line with the reporting segments.
Accordingly, the asset and profit/loss information regarding the operations that comprise the segment are disclosed. The full financial results are reviewed by the CODM, the external reporting of the segment is on an equity method investment basis. The total of all segments’ financial amounts are reconciled to the corresponding amounts reported in the Consolidated financial statements, eliminations are reflected in the reconciling column for amounts reported in excess of those amounts reflected in the Consolidated financial statements.
The Front-end segment manufactures and sells equipment used in wafer processing, encompassing the fabrication steps in which silicon wafers are layered with semiconductor devices. The segment is a product driven organizational unit comprised of manufacturing, service, and sales operations in Europe, the United States, Japan and Southeast Asia.
The Back-end segment manufactures and sells equipment and materials used in assembly and packaging, encompassing the processes in which silicon wafers are separated into individual circuits and subsequently assembled, packaged and tested. The segment is organized in ASM Pacific Technology Ltd, in which the Company holds a 39.19% interest, whilst the remaining shares are listed on the Stock Exchange of Hong Kong.
AB
OU
TS
TR
AT
EG
Y &
BU
SIN
ES
SP
ER
FO
RM
AN
CE
RE
VIE
WS
HA
RE
HO
LD
ER
SG
OV
ER
NA
NC
EF
INA
NC
IAL
STA
TE
ME
NT
SASMI STATUTORY ANNUAL REPORT 2016 | NOTES TO THE CONSOLIDATED FINANCIAL STATEMENTS | 109
FIN
AN
CIA
L S
TAT
EM
EN
TS
Fixed assetsFixed assets include goodwill, other intangible assets, property, plant and equipment, and evaluation tools at customers.
Property, plant and equipment are carried at cost, less accumulated depreciation and any impairment losses. Finance leased assets are recorded at the present value of future lease obligations. Depreciation is calculated using the straight-line method over the estimated useful lives. Leasehold improvements are depreciated over the lesser of the estimated useful life of the leasehold improvement or the term of the underlying lease. Any gain or loss on disposal of an item of property, plant and equipment is recognized in profit or loss.
Business combinations are accounted for under the acquisition method. The Company reviews its recorded goodwill and other intangible assets with indefinite lives for impairment each year on December 31 and whenever events or changes in circumstances indicate that the carrying amount of an asset may not be recoverable.
Goodwill represents the excess of the costs of an acquisition over the fair value of the amounts assigned to assets acquired and liabilities incurred or assumed of the acquired subsidiary at the date of acquisition. Goodwill on acquisition of subsidiaries is allocated to cash generating units (CGUs) for the purpose of impairment testing. The allocation is made to those CGUs that are expected to benefit from the business combination in which the goodwill arose. Goodwill is tested for impairment annually and whenever events or changes in circumstances indicate that the carrying amount of the goodwill may not be recoverable. If the recoverable amount of the CGU is less than the carrying amount of the unit, the impairment loss is recognized. An impairment loss recognized for goodwill is not reversed in a subsequent period. Goodwill is stated at cost less accumulated impairment losses.
Other intangible assets are carried at cost, less accumulated amortization and any impairment losses. Amortization is calculated using the straight-line method over the estimated useful lives.
In determining the capitalization of development expenses, the Company makes estimates and assumptions based on expected future economic benefits generated by products that are the result of these development expenses. Other important estimates and assumptions are the required internal rate of return, the distinction between research, development and high-volume manufacturing and the estimated useful life.
Development expenses are capitalized when all of the following criteria are demonstrated:
› the technical feasibility of completing the intangible asset so that it will be available for use or sale; › its intention to complete the intangible asset and use or sell it; › its ability to use or sell the intangible asset; › how the intangible asset will generate probable future economic benefits; › the availability of adequate technical, financial and other resources to complete the development and to use or sell the intangible asset; and
› its ability to reliably measure the expenditure attributable to the intangible asset during its development.
The Company capitalizes development expenses that meet the above-mentioned criteria in its Consolidated financial statements. Amortization of capitalized development expenses is calculated using the straight-line method over the estimated useful lives of the developed product. Amortization starts when the developed product is transferred to high-volume manufacturing. Other intangible assets with finite lives are amortized over the estimated useful lives using the straight-line method.
Evaluation tools at customers are systems generally delivered to customers under evaluation or a conditional purchase order and include substantial customization by our engineers and R&D staff in the field. Evaluation tools are recorded at cost and depreciated using the straight-line method over their estimated useful life of five years, or their shorter economic life. The depreciation expenses are reported as cost of sales.
On final acceptance of the system, the purchase consideration is recognized as revenue. The carrying value of the evaluation system at that point in time is recognized as cost of sales. In the circumstance that the system is
AB
OU
TS
TR
AT
EG
Y &
BU
SIN
ES
SP
ER
FO
RM
AN
CE
RE
VIE
WS
HA
RE
HO
LD
ER
SG
OV
ER
NA
NC
EF
INA
NC
IAL
STA
TE
ME
NT
SASMI STATUTORY ANNUAL REPORT 2016 | NOTES TO THE CONSOLIDATED FINANCIAL STATEMENTS | 110
FIN
AN
CIA
L S
TAT
EM
EN
TS
returned, at the end of the evaluation period, a detailed impairment review takes place, and future sales opportunities and additional costs are identified. It is only when the fair value is below the carrying value of the evaluation tool that an additional depreciation is recognized. The remaining carrying value is recognized as finished goods (inventory).
Impairment of fixed assetsEach year on December 31, the Company reviews the carrying amounts of its tangible and intangible assets (other than goodwill) to determine whether there is any indication that those assets have suffered an impairment loss. If any such indication exists, the recoverable amount of the asset is estimated in order to determine the extent of the impairment loss (if any).
If the recoverable amount of an asset is estimated to be less than its carrying amount, the carrying amount of the asset is reduced to its recoverable amount. An impairment loss is recognized immediately in the Consolidated Statement of Profit or Loss, unless the relevant asset is carried at a revalued amount, in which case the impairment loss is treated as a revaluation decrease.
Where an impairment loss is subsequently reversed, the carrying amount of the asset is increased to the revised estimate of its recoverable amount, but so that the increased carrying amount does not exceed the carrying amount that would have been determined had no impairment loss been recognized for the asset in prior years. A reversal of an impairment loss is recognized immediately in the Consolidated Statement of Profit or Loss, unless the relevant asset is carried at a revalued amount, in which case the reversal of the impairment loss is treated as a revaluation increase.
Equity accounted investeesEquity accounted investees are investments in entities in which ASMI can exert significant influence but which ASMI does not control, generally by ASMI having between 20% and 50% of the voting rights. These entities are accounted for using the equity method and are initially recognized at cost. Dividend income from the Company’s associated companies is recognized when the right to receive payment is established. Their carrying value includes goodwill identified upon acquisition, net of any accumulated impairment.
When ASMI’s share of losses in an associate equals or exceeds its interest in the associate, including any other receivables for which settlement is neither planned nor likely to occur in the foreseeable future, ASMI does not recognize further losses, unless ASMI has obligations to or made payments on behalf of the associate.
At each reporting date, the Company determines if there is any objective evidence that the associate is impaired. An impairment, being the difference between the recoverable amount of the associate and its carrying value, is recognized in the Consolidated Statement of Profit or Loss.
ASMI does not separately test associates’ underlying assets for impairment. However, ASMI recognizes its share of any impairment charge recorded by an investee and considers the effect, if any, of the impairment on the basis difference in the assets giving rise to the investee’s impairment charge. A loss in value of an investment which is significant or prolonged will be recognized. Significant is defined as at least 20% over an uninterrupted period of nine months, or more than 40% on the reporting date. Prolonged is defined as measured below cost for more than a year.
Equity method investments are tested for prolonged decline in value. If the fair value of an investment is less than its carrying value, the Company determines whether the decline in value is temporary or prolonged. A prolonged decline in value is measured as of a balance sheet date. If after a prior recognized impairment the fair value is more than its carrying value, this impairment is reversed. The determination of whether an investment is impaired is made at the individual security level in each reporting period.
AB
OU
TS
TR
AT
EG
Y &
BU
SIN
ES
SP
ER
FO
RM
AN
CE
RE
VIE
WS
HA
RE
HO
LD
ER
SG
OV
ER
NA
NC
EF
INA
NC
IAL
STA
TE
ME
NT
SASMI STATUTORY ANNUAL REPORT 2016 | NOTES TO THE CONSOLIDATED FINANCIAL STATEMENTS | 111
FIN
AN
CIA
L S
TAT
EM
EN
TS
InventoriesInventories are stated at the lower of cost or net realizable value. The cost of inventories is based on standard cost principle. In the case of manufactured inventories, cost includes an appropriate share of production overheads based on normal operating capacity. Costs include net prices paid for materials purchased, charges for freight and custom duties, production labor costs and factory overhead. Allowances are made for slow-moving, obsolete or unsellable inventory.
Allowances for obsolescence of inventory are determined based on the expected demand as well as the expected market value of the inventory. We regularly evaluate the value of our inventory of components and raw materials, work in progress and finished goods, based on a combination of factors including the following: forecasted sales, historical usage, product end of life cycle, estimated current and future market values, service inventory requirements and new product introductions, as well as other factors. Purchasing requirements and alternative uses for the inventory are explored within these processes to mitigate inventory exposure. We record write-downs for inventory based on the above factors and take into account worldwide quantities and demand into our analysis.
Accounts receivableAccounts receivable are measured at initial recognition at fair value, and are subsequently measured at amortized cost using the effective interest rate method.
A significant percentage of our accounts receivable is derived from sales to a limited number of large multinational semiconductor device manufacturers located throughout the world. In order to monitor potential credit losses, we perform ongoing credit evaluations of our customers’ financial condition. An allowance for doubtful accounts is maintained for potential credit losses based upon management’s assessment of the expected collectability of all accounts receivable. The allowance for doubtful accounts is reviewed periodically to assess the adequacy of the allowance. In making this assessment, management takes into consideration any circumstances of which we are aware regarding a customer’s inability to meet its financial obligations; and our judgments as to potential prevailing economic conditions in the industry and their potential impact on the Company’s customers.
The allowance is based on historical experience, credit evaluations, specific customer collection history and any customer-specific issues ASMI has identified. Changes in circumstances, such as an unexpected adverse material change in a major customer’s ability to meet its financial obligation to ASMI or its payment trends, may require us to further adjust our estimates of the recoverability of amounts due to ASMI, which could have an adverse material effect on ASMI’s financial condition and results of operations.
Cash and cash equivalentsCash and cash equivalents comprise of deposits held at call with banks, investments in money market funds that invest in debt securities of financial institutions and other short-term highly liquid investments with original maturity of three months or less. Bank overdrafts are included in notes payable to banks in current liabilities.
Accounts payableAccounts payable are measured at initial recognition at fair value, and are subsequently measured at amortized cost using the effective interest rate method.
Revenue recognitionThe Company recognizes revenue when persuasive evidence exists, usually in the form of an arrangement; that significant risks and rewards of ownership have been transferred to the buyer, there is no continuing managerial involvement with the goods sold, the amount of the revenue can be measured reliable, the recovery delivery has occurred or services have been rendered; seller’s price to buyer is fixed or determinable; and collectability is reasonably assured. The Company’s revenue includes revenue from contractual arrangements consisting of multiple deliverables, such as equipment and installation. The revenue for the total transaction is first allocated to its components, based on their relative selling prices. Then the revenue that was allocated to the undelivered component is deferred. The revenue from the undelivered element of the arrangement is deferred at their relative selling prices until delivery of the element.
AB
OU
TS
TR
AT
EG
Y &
BU
SIN
ES
SP
ER
FO
RM
AN
CE
RE
VIE
WS
HA
RE
HO
LD
ER
SG
OV
ER
NA
NC
EF
INA
NC
IAL
STA
TE
ME
NT
SASMI STATUTORY ANNUAL REPORT 2016 | NOTES TO THE CONSOLIDATED FINANCIAL STATEMENTS | 112
FIN
AN
CIA
L S
TAT
EM
EN
TS

A major portion of our revenue is derived from contractual arrangements with customers that have multiple deliverables, such as installation. The revenue relating to the undelivered elements of the arrangements, the installation, is deferred until delivery of these elements.
In general, the Company recognizes revenue from sales of equipment upon shipment of equipment, only if testing at the factory has proved that the equipment has met substantially all of the customer’s criteria and specifications.
The Company recognizes revenue from installation of equipment upon completion of installation at the customer’s site. At the time of shipment, the Company defers that portion of the sales price related to the installation. The relative selling price of the installation process is measured based upon the per-hour amounts charged by third parties for similar installation services. Installation is completed when testing at the customer’s site has proved that the equipment has met all of the customer’s criteria and specifications. The completion of installation is signed-off by the customer (final acceptance). The revenue relating to the undelivered elements of the arrangements is deferred at their relative selling prices until delivery of these elements.
We provide training and technical support service to customers. Revenue related to such services is recognized when the service is rendered. Revenue from the sale of spare parts and materials is recognized when the goods are shipped.
Revenue on royalties and licenses is recognized when due.
The Company’s sales frequently involve complex equipment, which may include customer-specific criteria, sales to new customers or equipment with new technology. For each sale, the decision whether to recognize revenue is, in addition to shipment and factory acceptance, based on the contractual agreement with a customer, the experience with a particular customer, the technology and the number of similarly configured equipment previously delivered. Instead of recognizing revenue, the Company could decide to defer revenue recognition until completion of installation at the customer’s site and obtaining final acceptance from the customer.
Freight charges billed to customers are recognized as revenue, the related costs are recognized as cost of sales. Revenues are recognized excluding the taxes levied on revenues.
Cost of salesCost of sales comprise direct costs such as labor, materials, cost of warranty, depreciation, shipping and handling costs and related overhead costs. Cost of sales also includes third party commission, depreciation expenses of evaluation tools at customers, royalty payments and costs relating to prototype and experimental products, which the Company may subsequently sell to customers. Costs of warranty include the cost of labor and material necessary to repair a product during the warranty period.
WarrantyWe provide maintenance on our systems during the warranty period, on average one year. Costs of warranty include the cost of labor and material necessary to repair a product during the warranty period. We accrue for the estimated cost of the warranty on products shipped in a provision for warranty, upon recognition of the sale of the product. The costs are estimated based on historical expenses incurred and on estimated future expenses related to current sales, and are updated periodically. Actual warranty costs are charged against the provision for warranty. The actual warranty costs may differ from estimated warranty costs, and we adjust our provision for warranty accordingly. Future warranty costs may exceed our estimates, which could result in an increase of our cost of sales.
Income taxIncome tax expense comprises current and deferred tax. It is recognized in the Statement of Profit or Loss except to the extent that it relates to a business combination, or items recognized directly in Equity or in Other Comprehensive Income.
AB
OU
TS
TR
AT
EG
Y &
BU
SIN
ES
SP
ER
FO
RM
AN
CE
RE
VIE
WS
HA
RE
HO
LD
ER
SG
OV
ER
NA
NC
EF
INA
NC
IAL
STA
TE
ME
NT
SASMI STATUTORY ANNUAL REPORT 2016 | NOTES TO THE CONSOLIDATED FINANCIAL STATEMENTS | 113
FIN
AN
CIA
L S
TAT
EM
EN
TS
Current taxThe current corporate income tax charge recognized in the Consolidated Statement of Profit or Loss is calculated in accordance with the prevailing tax regulations and rates, taking into account non-taxable income and non-deductible expenses. The current income tax expense reflects the amount for the current reporting period that the Company expects to recover from or pay to the tax authorities. Current income tax related to items recognized directly in equity is recorded in equity and not in the Consolidated Statement of Profit or Loss. ASMI’s management periodically evaluates positions taken in the tax returns regarding situations in which applicable tax regulations are subject to interpretation, and establishes provisions when deemed appropriate. Current tax also includes any tax arising from dividends.
Current tax assets and liabilities are offset only if certain criteria are met.
Deferred taxesDeferred income tax positions are recognized for temporary differences between the tax basis of assets and liabilities and their carrying values in ASMI’s Consolidated Statement of Financial Position.
Deferred tax assets are recognized for all deductible temporary differences, the carry forward of unused tax credits and any unused tax losses. Deferred tax assets are recognized only to the extent that it is probable that future taxable profits will be available against which the temporary differences can be utilized. Both the recognized and unrecognized deferred tax assets are reassessed at each reporting date. Deferred tax assets are recorded for deductible temporary differences associated with investments in subsidiaries and are recorded only to the extent that it is probable that the temporary differences will reverse in the foreseeable future and taxable profit will be available against which the temporary differences can be utilized.
Deferred tax liabilities are recognized for all taxable temporary differences except when they affect neither the profit or loss reported in the Consolidated Statement of Profit or Loss nor the taxable profit or loss. Also, no deferred tax liabilities are recorded for taxable temporary differences associated with investments in subsidiaries when the timing of the reversal of the temporary differences can be controlled and it is probable that the temporary differences will not reverse in the foreseeable future.
Deferred tax positions are stated at nominal value and are measured at the corporate income tax rates the Company expects to be applicable in the year when the asset is realized or liability is settled based on enacted or substantially enacted tax laws.
Deferred income tax assets and liabilities are netted if there is a legally enforceable right to set off current tax assets against current tax liabilities, deferred income tax assets and deferred income tax liabilities relate to income taxes levied by the same taxation authority on the same taxable entity, and there is an intention to settle on a net basis.
We recognize a liability for uncertain tax positions when it is probable that an outflow of economic resources will occur. Measurement of the liability for uncertain tax positions is based on management’s best estimate of the amount of tax benefit that will be lost.
Retirement benefit costsThe Company has retirement plans covering substantially all employees. The principal plans are defined contribution plans, except for the plans of the Company’s operations in the Netherlands and Japan. The Company’s employees in the Netherlands participate in a multi-employer defined benefit plan. Payments to defined contribution plans and the multi-employer plan are recognized as an expense in the Consolidated Statement of Profit or Loss as they fall due. The Company accounts for the multi-employer plan as if it were a defined contribution plan since the manager of the plan is not able to provide the Company with the required Company-specific information to enable the Company to account for the plan as a defined benefit plan.
AB
OU
TS
TR
AT
EG
Y &
BU
SIN
ES
SP
ER
FO
RM
AN
CE
RE
VIE
WS
HA
RE
HO
LD
ER
SG
OV
ER
NA
NC
EF
INA
NC
IAL
STA
TE
ME
NT
SASMI STATUTORY ANNUAL REPORT 2016 | NOTES TO THE CONSOLIDATED FINANCIAL STATEMENTS | 114
FIN
AN
CIA
L S
TAT
EM
EN
TS

The Company’s employees in Japan participate in defined benefit plans. Pension costs in respect to this defined benefit plan are determined using the projected unit credit method. These costs primarily represent the increase in the actuarial present value of the obligation for pension benefits based on employee service during the year and the interest on this obligation in respect to employee service in previous years, net of the expected return on plan assets.
For the defined benefit plan the Company recognizes in its Consolidated statement of financial position an asset or a liability for the plan’s over-funded status or underfunded status respectively. Actuarial gains and losses are recognized when incurred.
Obligations for contributions to defined contribution plans are expensed as the related service is provided. Prepaid contributions are recognized as an asset to the extent that a cash refund or a reduction in future payments is available.
Share-based paymentsThe costs relating to employee stock options and shares (compensation expense) are recognized based upon the grant date fair value of the stock options or the shares. The fair value at grant date of employee stock options is estimated using a Black-Scholes option valuation model. This model requires the use of assumptions including expected stock price volatility, the estimated life of each award and the estimated dividend yield. The risk-free interest rate used in the model is determined, based on a euro government bond with a life equal to the expected life of the options. The estimated fair value at grant date of shares is based on the share price of the ASMI share at grant date minus the discounted value of expected dividends during the vesting period.
The grant date fair value of the stock options and shares is expensed on a straight-line basis over the vesting period, based on the Company’s estimate of stock options and shares that will eventually vest. The impact of the true up of the estimates is recognized in the Consolidated statement of profit or loss in the period in which the revision is determined. The total estimated share-based compensation expense, determined under the fair value based method is amortized proportionally over the option vesting periods.
Operating leaseLeases in which the company is the lessee and in which substantially all risks and rewards of ownership are retained by the lessor are classified as operating leases. Payments made under operating leases (net of any incentives received from the lessor) are recognized in the Statement of Profit or Loss on a straight-line basis over the term of the lease.
Issuance of shares by an equity accounted investeeThe associate ASMPT yearly issues common shares pursuant to their Employee Share Incentive Scheme. The effect of these issuances is a dilution of the Company’s ownership in ASMPT. The Company recognizes the impact of these issuances directly into equity.
Commitments and contingenciesThe Company has various contractual obligations such as operating lease commitments, purchase commitments and commitments for capital expenditure. These obligations are generally not recognized as liabilities on the Company’s statement of financial position but are disclosed in the notes to the financial statements.
Comprehensive incomeComprehensive income consists of net earnings (loss) and other comprehensive income. Other comprehensive income includes gains and losses that are not included in net earnings, but are recorded directly in equity.
Transactions eliminated on consolidationIntra-group balances and transactions, and any unrealized income and expenses arising from intra-group transactions are eliminated. Unrealized gains arising from transactions with equity-accounted investees are eliminated against the investment to the extent of the Group’s interest in the investee. Unrealized losses are eliminated in the same way as unrealized gains, but only to the extent that there is no evidence of impairment.
AB
OU
TS
TR
AT
EG
Y &
BU
SIN
ES
SP
ER
FO
RM
AN
CE
RE
VIE
WS
HA
RE
HO
LD
ER
SG
OV
ER
NA
NC
EF
INA
NC
IAL
STA
TE
ME
NT
SASMI STATUTORY ANNUAL REPORT 2016 | NOTES TO THE CONSOLIDATED FINANCIAL STATEMENTS | 115
FIN
AN
CIA
L S
TAT
EM
EN
TS
ADOPTION OF NEW AND REVISED INTERNATIONAL FINANCIAL REPORTING STANDARDS AND INTERPRETATIONS EFFECTIVE IN 2016 OR THEREAFTERImplementation of new and revised IFRS-EU in 2016 did not have a material impact on the Company’s Consolidated financial statements.
At the date of authorization of these Consolidated financial statements, the following standards and interpretations have been issued, however they are not yet effective and/or have not yet been adopted by the EU and have not yet been adopted by us.
In July 2014, the IASB finalized the reform of financial instruments accounting and issued IFRS 9 (as revised in 2014), which will supersede IAS 39 Financial Instruments: Recognition and Measurement in its entirety (the IASB tentatively decided that the mandatory effective date of IFRS 9 will be no earlier than annual periods beginning on or after January 1, 2018). Compared to IFRS 9 (as revised in 2013), the 2014 version includes limited amendments to the classification and measurement requirements by introducing a ‘fair value through other comprehensive income’ measurement category for simple debt instruments. It also adds the impairment requirements relating to the accounting for an entity’s expected credit losses on its financial assets and commitments to extend credit. The completed IFRS 9 (as revised in 2014) contains the requirements for: a) the classification and measurement of financial assets and financial liabilities; b) impairment methodology; and c) general hedge accounting. The actual impact of adopting IFRS 9 on the Company’s Consolidated financial statements in 2018 is not known and cannot be reliably estimated because it will be dependent on the financial instruments that the Company holds and economic conditions at that time as well as accounting elections and judgments that it will make in the future. The new standard will require ASMI to revise its accounting processes and internal controls related to reporting financial instruments and these changes are not yet complete.
IFRS 15 Revenue from Contracts with Customers was issued in May 2014. In April 2015, the effective date of this standard was postponed to January 1, 2018, with additional clarifications to the standard being issued in April 2016. IFRS 15 introduces new guidance on the recognition and measurement requirements of revenues. The standard applies to revenue from contracts with customers and also provides a model for the sale of some non-financial assets that are not an output of a company’s ordinary business activities. IFRS 15 provides more detailed requirements than the current standards. We are currently reviewing the extent of the impact of this new standard. We have started an IFRS 15 implementation project comprising two phases: phase 1 involves a detailed analysis of the impact of the principles of the new standard on our major contracts with customers. Based on the contract analysis, a detailed concept will be developed for the transition of revenue recognition to the new principles, including the need for adjustments to existing processes and IT systems. The subsequent phase 2 of the project will serve particularly to implement the adjustments identified in phase 1. We are in the process of the contract assessment and the full qualitative impact analysis is yet to be finalized, however the timing of recognition for installation, conditional equipment sales and fixed fee royalties are expected to be impacted. At this moment, the quantitative impact of IFRS 15 is not yet known.
IFRS 16 Leases was issued in January 2016. The standard has an effective date of January 1, 2019. Endorsement has not been scheduled yet. IFRS 16 will replace IAS 17 and introduces on balance sheet accounting for (almost) all leases. Therefore, assets in use under an operating lease contract, reported as off balance sheet obligation under IAS 17, will be recognized on the balance sheet. Paid lease fees will no longer be part of operating expenses but will become part of depreciation and interest expenses. The standard will have an impact on our Consolidated statement of financial position due to the recognition of the leased assets and corresponding financial liabilities. Also, an impact is expected on our Consolidated statement of profit or loss. Result from operations is expected to increase, but the impact on income before income taxes is not expected to be material. We are currently reviewing the extent of the impact of this new standard.
AB
OU
TS
TR
AT
EG
Y &
BU
SIN
ES
SP
ER
FO
RM
AN
CE
RE
VIE
WS
HA
RE
HO
LD
ER
SG
OV
ER
NA
NC
EF
INA
NC
IAL
STA
TE
ME
NT
SASMI STATUTORY ANNUAL REPORT 2016 | NOTES TO THE CONSOLIDATED FINANCIAL STATEMENTS | 116
FIN
AN
CIA
L S
TAT
EM
EN
TS

Recognition of Deferred Tax Assets for Unrealized Losses (Amendments to IAS 12)The amendments clarify the accounting for deferred tax assets for unrealized losses on debt instruments measured at fair value. The amendments are effective for annual periods beginning on or after 1 January 2017, with early adoption permitted. The Group is assessing the potential impact on its Consolidated financial statements resulting from the amendments. So far, the Group does not expect any significant impact.
Disclosure Initiative (Amendments to IAS 7)The amendments require disclosures that enable users of financial statements to evaluate changes in liabilities arising from financing activities, including both changes arising from cash flow and non-cash changes.
The amendments are effective for annual periods beginning on or after 1 January 2017, with early adoption permitted. To satisfy the new disclosure requirements, the Group intends to present a reconciliation between the opening and closing balances for liabilities with changes arising from financing activities.
The following changes to Standards following Amendments by the IASB and the Annual Improvement Cycles are not expected to have a significant impact on the Company’s Consolidated financial statements.
› Classification and Measurement of Share-based Payment Transactions (Amendments to IFRS 2). › Sale or Contribution of Assets between an Investor and its Associate or Joint Venture (Amendments to IFRS 10 and IAS 28).
AB
OU
TS
TR
AT
EG
Y &
BU
SIN
ES
SP
ER
FO
RM
AN
CE
RE
VIE
WS
HA
RE
HO
LD
ER
SG
OV
ER
NA
NC
EF
INA
NC
IAL
STA
TE
ME
NT
SASMI STATUTORY ANNUAL REPORT 2016 | NOTES TO THE CONSOLIDATED FINANCIAL STATEMENTS | 117
FIN
AN
CIA
L S
TAT
EM
EN
TS
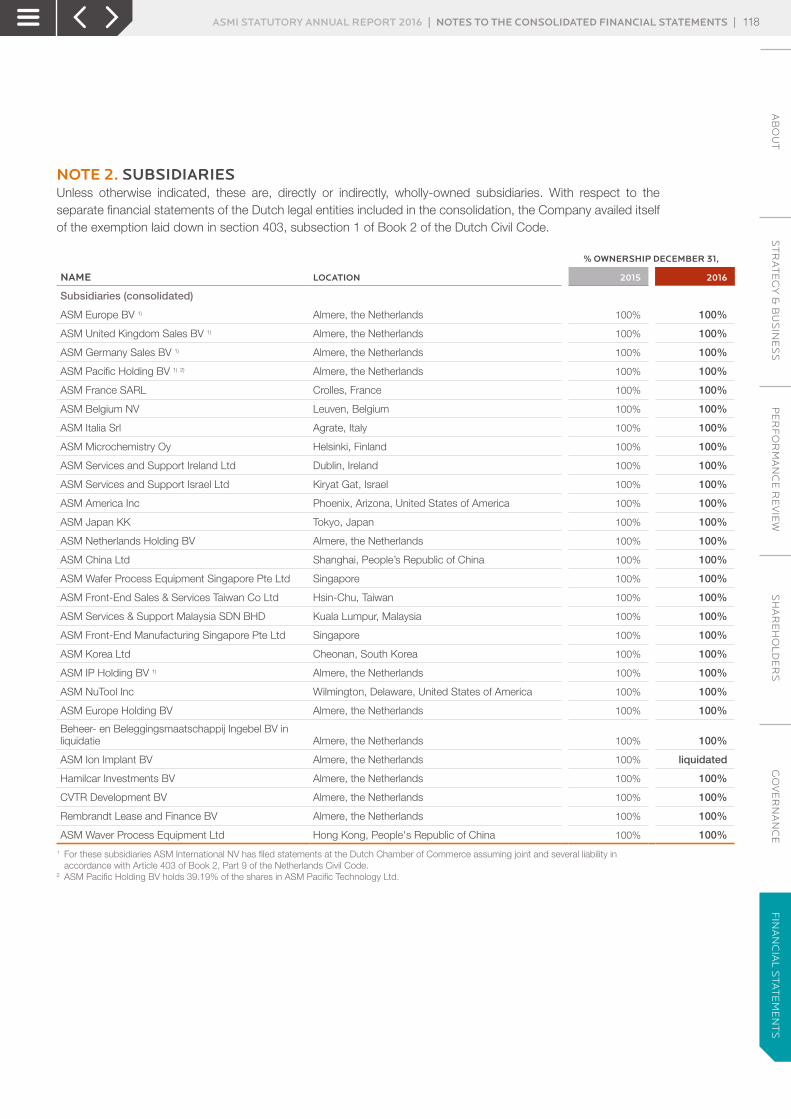
NOTE 2. SUBSIDIARIESUnless otherwise indicated, these are, directly or indirectly, wholly-owned subsidiaries. With respect to the separate financial statements of the Dutch legal entities included in the consolidation, the Company availed itself of the exemption laid down in section 403, subsection 1 of Book 2 of the Dutch Civil Code.
% OWNERSHIP DECEMBER 31,
NAME LOCATION 2015 2016
Subsidiaries (consolidated)
ASM Europe BV 1) Almere, the Netherlands 100% 100%
ASM United Kingdom Sales BV 1) Almere, the Netherlands 100% 100%
ASM Germany Sales BV 1) Almere, the Netherlands 100% 100%
ASM Pacific Holding BV 1) 2) Almere, the Netherlands 100% 100%
ASM France SARL Crolles, France 100% 100%
ASM Belgium NV Leuven, Belgium 100% 100%
ASM Italia Srl Agrate, Italy 100% 100%
ASM Microchemistry Oy Helsinki, Finland 100% 100%
ASM Services and Support Ireland Ltd Dublin, Ireland 100% 100%
ASM Services and Support Israel Ltd Kiryat Gat, Israel 100% 100%
ASM America Inc Phoenix, Arizona, United States of America 100% 100%
ASM Japan KK Tokyo, Japan 100% 100%
ASM Netherlands Holding BV Almere, the Netherlands 100% 100%
ASM China Ltd Shanghai, People’s Republic of China 100% 100%
ASM Wafer Process Equipment Singapore Pte Ltd Singapore 100% 100%
ASM Front-End Sales & Services Taiwan Co Ltd Hsin-Chu, Taiwan 100% 100%
ASM Services & Support Malaysia SDN BHD Kuala Lumpur, Malaysia 100% 100%
ASM Front-End Manufacturing Singapore Pte Ltd Singapore 100% 100%
ASM Korea Ltd Cheonan, South Korea 100% 100%
ASM IP Holding BV 1) Almere, the Netherlands 100% 100%
ASM NuTool Inc Wilmington, Delaware, United States of America 100% 100%
ASM Europe Holding BV Almere, the Netherlands 100% 100%
Beheer- en Beleggingsmaatschappij Ingebel BV in liquidatie Almere, the Netherlands 100% 100%
ASM Ion Implant BV Almere, the Netherlands 100% liquidated
Hamilcar Investments BV Almere, the Netherlands 100% 100%
CVTR Development BV Almere, the Netherlands 100% 100%
Rembrandt Lease and Finance BV Almere, the Netherlands 100% 100%
ASM Waver Process Equipment Ltd Hong Kong, People's Republic of China 100% 100%
1 For these subsidiaries ASM International NV has filed statements at the Dutch Chamber of Commerce assuming joint and several liability in accordance with Article 403 of Book 2, Part 9 of the Netherlands Civil Code.
2 ASM Pacific Holding BV holds 39.19% of the shares in ASM Pacific Technology Ltd.
AB
OU
TS
TR
AT
EG
Y &
BU
SIN
ES
SP
ER
FO
RM
AN
CE
RE
VIE
WS
HA
RE
HO
LD
ER
SG
OV
ER
NA
NC
EF
INA
NC
IAL
STA
TE
ME
NT
SASMI STATUTORY ANNUAL REPORT 2016 | NOTES TO THE CONSOLIDATED FINANCIAL STATEMENTS | 118
FIN
AN
CIA
L S
TAT
EM
EN
TS
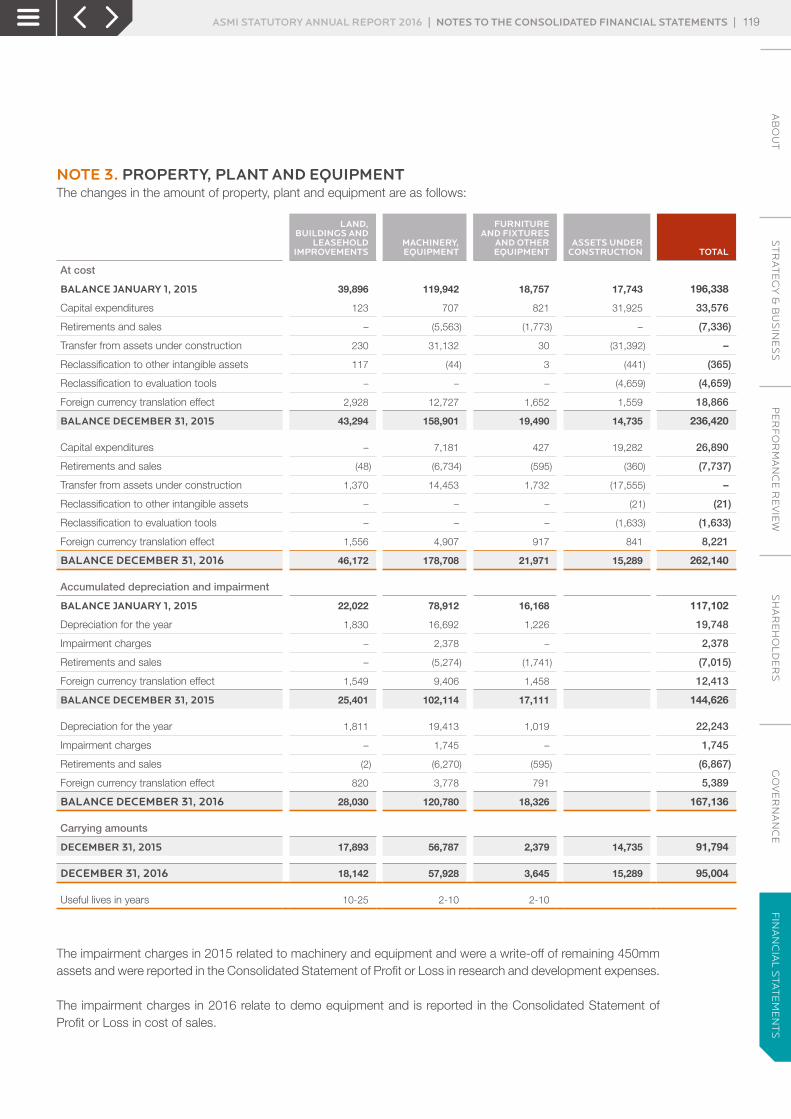
NOTE 3. PROPERTY, PLANT AND EQUIPMENTThe changes in the amount of property, plant and equipment are as follows:
LAND, BUILDINGS AND
LEASEHOLD IMPROVEMENTS
MACHINERY, EQUIPMENT
FURNITURE AND FIXTURES
AND OTHER EQUIPMENT
ASSETS UNDER CONSTRUCTION TOTAL
At cost
BALANCE JANUARY 1, 2015 39,896 119,942 18,757 17,743 196,338
Capital expenditures 123 707 821 31,925 33,576
Retirements and sales – (5,563) (1,773) – (7,336)
Transfer from assets under construction 230 31,132 30 (31,392) –
Reclassification to other intangible assets 117 (44) 3 (441) (365)
Reclassification to evaluation tools – – – (4,659) (4,659)
Foreign currency translation effect 2,928 12,727 1,652 1,559 18,866
BALANCE DECEMBER 31, 2015 43,294 158,901 19,490 14,735 236,420
Capital expenditures – 7,181 427 19,282 26,890
Retirements and sales (48) (6,734) (595) (360) (7,737)
Transfer from assets under construction 1,370 14,453 1,732 (17,555) –
Reclassification to other intangible assets – – – (21) (21)
Reclassification to evaluation tools – – – (1,633) (1,633)
Foreign currency translation effect 1,556 4,907 917 841 8,221
BALANCE DECEMBER 31, 2016 46,172 178,708 21,971 15,289 262,140
Accumulated depreciation and impairment
BALANCE JANUARY 1, 2015 22,022 78,912 16,168 117,102
Depreciation for the year 1,830 16,692 1,226 19,748
Impairment charges – 2,378 – 2,378
Retirements and sales – (5,274) (1,741) (7,015)
Foreign currency translation effect 1,549 9,406 1,458 12,413
BALANCE DECEMBER 31, 2015 25,401 102,114 17,111 144,626
Depreciation for the year 1,811 19,413 1,019 22,243
Impairment charges – 1,745 – 1,745
Retirements and sales (2) (6,270) (595) (6,867)
Foreign currency translation effect 820 3,778 791 5,389
BALANCE DECEMBER 31, 2016 28,030 120,780 18,326 167,136
Carrying amounts
DECEMBER 31, 2015 17,893 56,787 2,379 14,735 91,794
DECEMBER 31, 2016 18,142 57,928 3,645 15,289 95,004
Useful lives in years 10-25 2-10 2-10
The impairment charges in 2015 related to machinery and equipment and were a write-off of remaining 450mm assets and were reported in the Consolidated Statement of Profit or Loss in research and development expenses.
The impairment charges in 2016 relate to demo equipment and is reported in the Consolidated Statement of Profit or Loss in cost of sales.
AB
OU
TS
TR
AT
EG
Y &
BU
SIN
ES
SP
ER
FO
RM
AN
CE
RE
VIE
WS
HA
RE
HO
LD
ER
SG
OV
ER
NA
NC
EF
INA
NC
IAL
STA
TE
ME
NT
SASMI STATUTORY ANNUAL REPORT 2016 | NOTES TO THE CONSOLIDATED FINANCIAL STATEMENTS | 119
FIN
AN
CIA
L S
TAT
EM
EN
TS
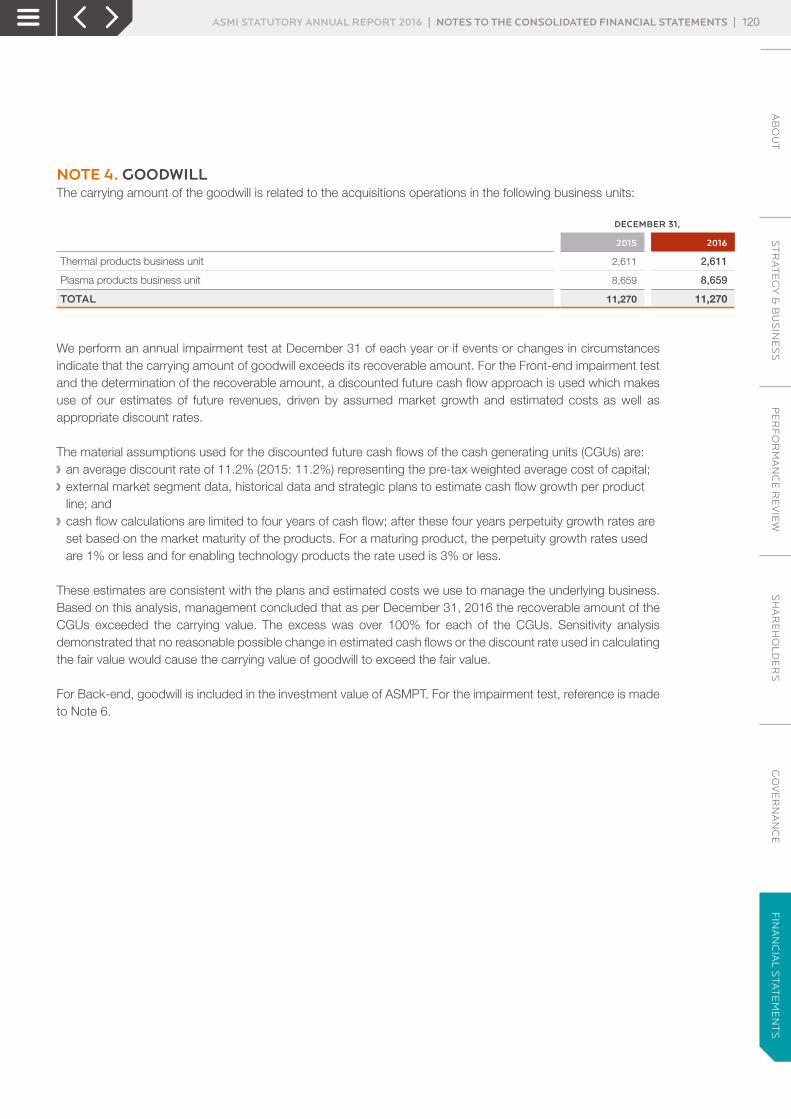
NOTE 4. GOODWILLThe carrying amount of the goodwill is related to the acquisitions operations in the following business units:
DECEMBER 31,
2015 2016
Thermal products business unit 2,611 2,611
Plasma products business unit 8,659 8,659
TOTAL 11,270 11,270
We perform an annual impairment test at December 31 of each year or if events or changes in circumstances indicate that the carrying amount of goodwill exceeds its recoverable amount. For the Front-end impairment test and the determination of the recoverable amount, a discounted future cash flow approach is used which makes use of our estimates of future revenues, driven by assumed market growth and estimated costs as well as appropriate discount rates.
The material assumptions used for the discounted future cash flows of the cash generating units (CGUs) are: › an average discount rate of 11.2% (2015: 11.2%) representing the pre-tax weighted average cost of capital; › external market segment data, historical data and strategic plans to estimate cash flow growth per product line; and
› cash flow calculations are limited to four years of cash flow; after these four years perpetuity growth rates are set based on the market maturity of the products. For a maturing product, the perpetuity growth rates used are 1% or less and for enabling technology products the rate used is 3% or less.
These estimates are consistent with the plans and estimated costs we use to manage the underlying business. Based on this analysis, management concluded that as per December 31, 2016 the recoverable amount of the CGUs exceeded the carrying value. The excess was over 100% for each of the CGUs. Sensitivity analysis demonstrated that no reasonable possible change in estimated cash flows or the discount rate used in calculating the fair value would cause the carrying value of goodwill to exceed the fair value.
For Back-end, goodwill is included in the investment value of ASMPT. For the impairment test, reference is made to Note 6.
AB
OU
TS
TR
AT
EG
Y &
BU
SIN
ES
SP
ER
FO
RM
AN
CE
RE
VIE
WS
HA
RE
HO
LD
ER
SG
OV
ER
NA
NC
EF
INA
NC
IAL
STA
TE
ME
NT
SASMI STATUTORY ANNUAL REPORT 2016 | NOTES TO THE CONSOLIDATED FINANCIAL STATEMENTS | 120
FIN
AN
CIA
L S
TAT
EM
EN
TS
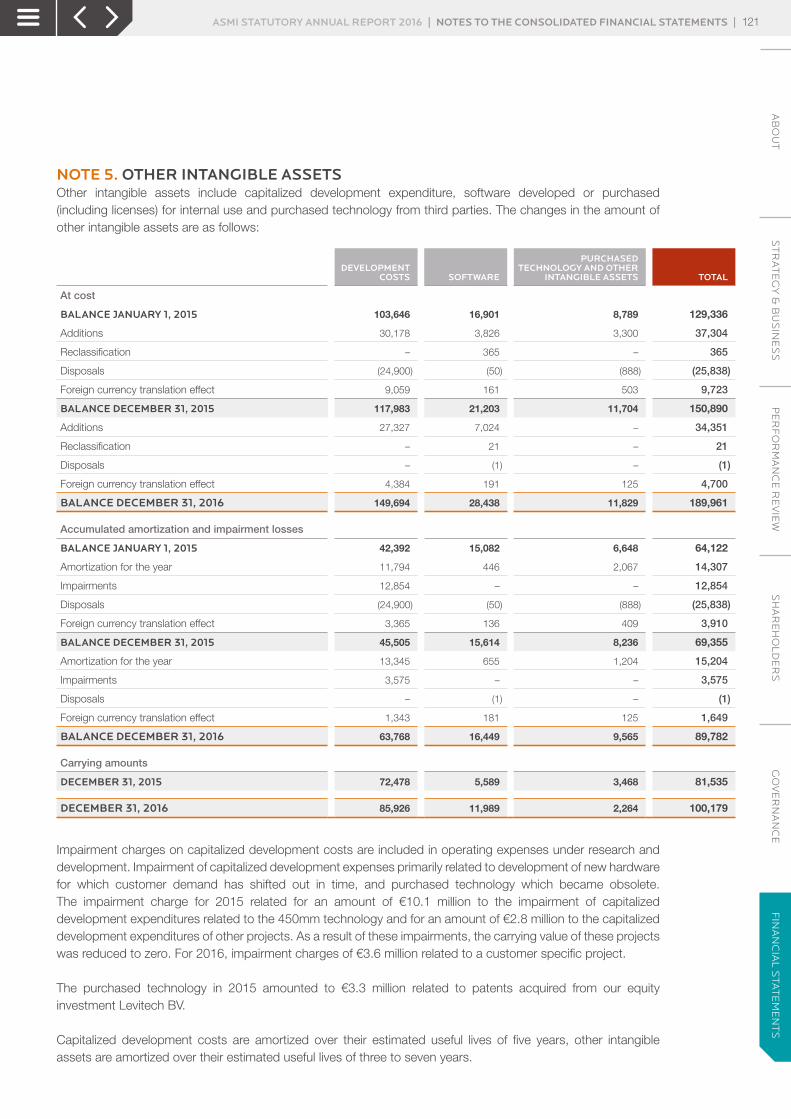
NOTE 5. OTHER INTANGIBLE ASSETSOther intangible assets include capitalized development expenditure, software developed or purchased (including licenses) for internal use and purchased technology from third parties. The changes in the amount of other intangible assets are as follows:
DEVELOPMENT COSTS SOFTWARE
PURCHASEDTECHNOLOGY AND OTHER
INTANGIBLE ASSETS TOTAL
At cost
BALANCE JANUARY 1, 2015 103,646 16,901 8,789 129,336
Additions 30,178 3,826 3,300 37,304
Reclassification – 365 – 365
Disposals (24,900) (50) (888) (25,838)
Foreign currency translation effect 9,059 161 503 9,723
BALANCE DECEMBER 31, 2015 117,983 21,203 11,704 150,890
Additions 27,327 7,024 – 34,351
Reclassification – 21 – 21
Disposals – (1) – (1)
Foreign currency translation effect 4,384 191 125 4,700
BALANCE DECEMBER 31, 2016 149,694 28,438 11,829 189,961
Accumulated amortization and impairment losses
BALANCE JANUARY 1, 2015 42,392 15,082 6,648 64,122
Amortization for the year 11,794 446 2,067 14,307
Impairments 12,854 – – 12,854
Disposals (24,900) (50) (888) (25,838)
Foreign currency translation effect 3,365 136 409 3,910
BALANCE DECEMBER 31, 2015 45,505 15,614 8,236 69,355
Amortization for the year 13,345 655 1,204 15,204
Impairments 3,575 – – 3,575
Disposals – (1) – (1)
Foreign currency translation effect 1,343 181 125 1,649
BALANCE DECEMBER 31, 2016 63,768 16,449 9,565 89,782
Carrying amounts
DECEMBER 31, 2015 72,478 5,589 3,468 81,535
DECEMBER 31, 2016 85,926 11,989 2,264 100,179
Impairment charges on capitalized development costs are included in operating expenses under research and development. Impairment of capitalized development expenses primarily related to development of new hardware for which customer demand has shifted out in time, and purchased technology which became obsolete. The impairment charge for 2015 related for an amount of €10.1 million to the impairment of capitalized development expenditures related to the 450mm technology and for an amount of €2.8 million to the capitalized development expenditures of other projects. As a result of these impairments, the carrying value of these projects was reduced to zero. For 2016, impairment charges of €3.6 million related to a customer specific project.
The purchased technology in 2015 amounted to €3.3 million related to patents acquired from our equity investment Levitech BV.
Capitalized development costs are amortized over their estimated useful lives of five years, other intangible assets are amortized over their estimated useful lives of three to seven years.
AB
OU
TS
TR
AT
EG
Y &
BU
SIN
ES
SP
ER
FO
RM
AN
CE
RE
VIE
WS
HA
RE
HO
LD
ER
SG
OV
ER
NA
NC
EF
INA
NC
IAL
STA
TE
ME
NT
SASMI STATUTORY ANNUAL REPORT 2016 | NOTES TO THE CONSOLIDATED FINANCIAL STATEMENTS | 121
FIN
AN
CIA
L S
TAT
EM
EN
TS
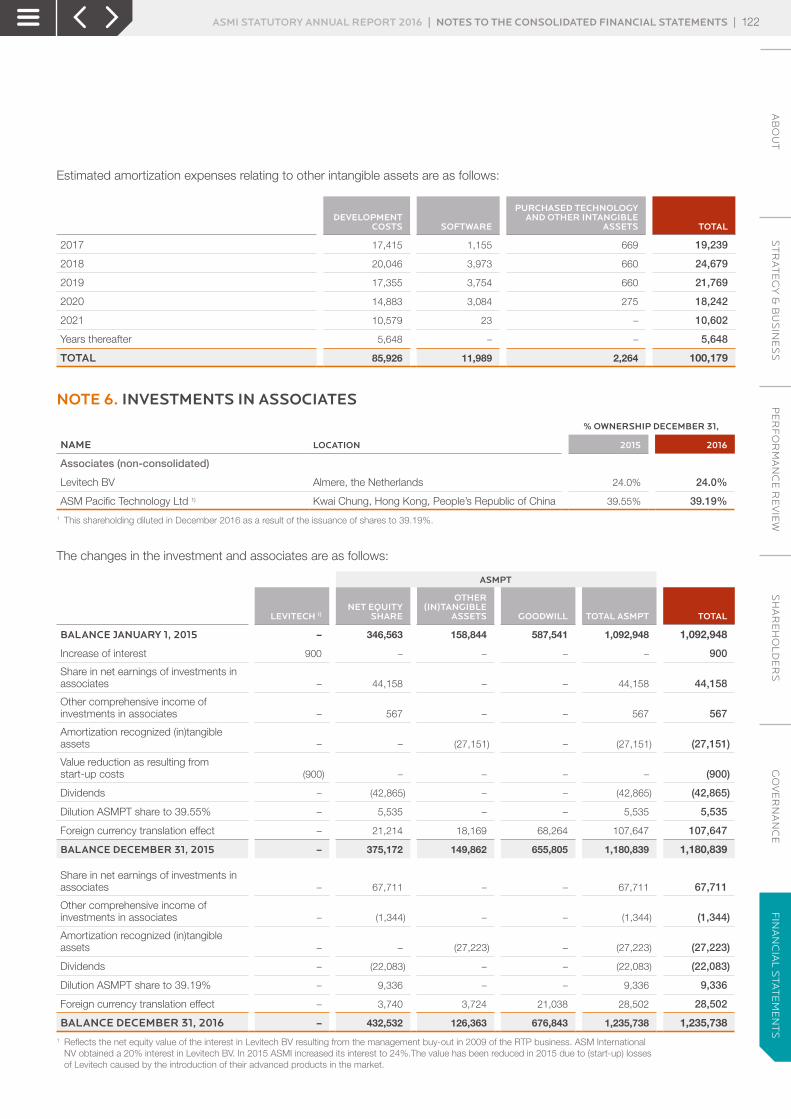
Estimated amortization expenses relating to other intangible assets are as follows:
DEVELOPMENT COSTS SOFTWARE
PURCHASED TECHNOLOGY AND OTHER INTANGIBLE
ASSETS TOTAL
2017 17,415 1,155 669 19,239
2018 20,046 3,973 660 24,679
2019 17,355 3,754 660 21,769
2020 14,883 3,084 275 18,242
2021 10,579 23 – 10,602
Years thereafter 5,648 – – 5,648
TOTAL 85,926 11,989 2,264 100,179
NOTE 6. INVESTMENTS IN ASSOCIATES
% OWNERSHIP DECEMBER 31,
NAME LOCATION 2015 2016
Associates (non-consolidated)
Levitech BV Almere, the Netherlands 24.0% 24.0%
ASM Pacific Technology Ltd 1) Kwai Chung, Hong Kong, People’s Republic of China 39.55% 39.19%
1 This shareholding diluted in December 2016 as a result of the issuance of shares to 39.19%.
The changes in the investment and associates are as follows:
ASMPT
LEVITECH 1)NET EQUITY
SHARE
OTHER (IN)TANGIBLE
ASSETS GOODWILL TOTAL ASMPT TOTAL
BALANCE JANUARY 1, 2015 – 346,563 158,844 587,541 1,092,948 1,092,948
Increase of interest 900 – – – – 900
Share in net earnings of investments in associates – 44,158 – – 44,158 44,158
Other comprehensive income of investments in associates – 567 – – 567 567
Amortization recognized (in)tangible assets – – (27,151) – (27,151) (27,151)
Value reduction as resulting from start-up costs (900) – – – – (900)
Dividends – (42,865) – – (42,865) (42,865)
Dilution ASMPT share to 39.55% – 5,535 – – 5,535 5,535
Foreign currency translation effect – 21,214 18,169 68,264 107,647 107,647
BALANCE DECEMBER 31, 2015 – 375,172 149,862 655,805 1,180,839 1,180,839
Share in net earnings of investments in associates – 67,711 – – 67,711 67,711
Other comprehensive income of investments in associates – (1,344) – – (1,344) (1,344)
Amortization recognized (in)tangible assets – – (27,223) – (27,223) (27,223)
Dividends – (22,083) – – (22,083) (22,083)
Dilution ASMPT share to 39.19% – 9,336 – – 9,336 9,336
Foreign currency translation effect – 3,740 3,724 21,038 28,502 28,502
BALANCE DECEMBER 31, 2016 – 432,532 126,363 676,843 1,235,738 1,235,7381 Reflects the net equity value of the interest in Levitech BV resulting from the management buy-out in 2009 of the RTP business. ASM International
NV obtained a 20% interest in Levitech BV. In 2015 ASMI increased its interest to 24%.The value has been reduced in 2015 due to (start-up) losses of Levitech caused by the introduction of their advanced products in the market.
AB
OU
TS
TR
AT
EG
Y &
BU
SIN
ES
SP
ER
FO
RM
AN
CE
RE
VIE
WS
HA
RE
HO
LD
ER
SG
OV
ER
NA
NC
EF
INA
NC
IAL
STA
TE
ME
NT
SASMI STATUTORY ANNUAL REPORT 2016 | NOTES TO THE CONSOLIDATED FINANCIAL STATEMENTS | 122
FIN
AN
CIA
L S
TAT
EM
EN
TS
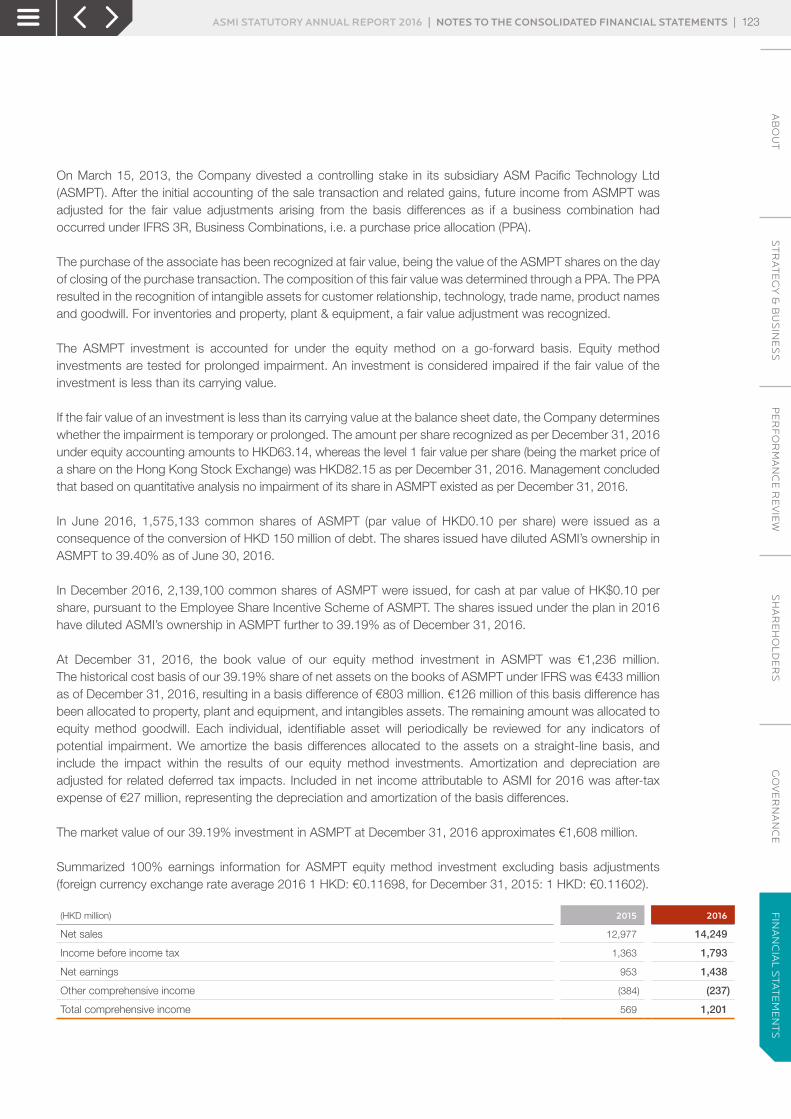
On March 15, 2013, the Company divested a controlling stake in its subsidiary ASM Pacific Technology Ltd (ASMPT). After the initial accounting of the sale transaction and related gains, future income from ASMPT was adjusted for the fair value adjustments arising from the basis differences as if a business combination had occurred under IFRS 3R, Business Combinations, i.e. a purchase price allocation (PPA).
The purchase of the associate has been recognized at fair value, being the value of the ASMPT shares on the day of closing of the purchase transaction. The composition of this fair value was determined through a PPA. The PPA resulted in the recognition of intangible assets for customer relationship, technology, trade name, product names and goodwill. For inventories and property, plant & equipment, a fair value adjustment was recognized.
The ASMPT investment is accounted for under the equity method on a go-forward basis. Equity method investments are tested for prolonged impairment. An investment is considered impaired if the fair value of the investment is less than its carrying value.
If the fair value of an investment is less than its carrying value at the balance sheet date, the Company determines whether the impairment is temporary or prolonged. The amount per share recognized as per December 31, 2016 under equity accounting amounts to HKD63.14, whereas the level 1 fair value per share (being the market price of a share on the Hong Kong Stock Exchange) was HKD82.15 as per December 31, 2016. Management concluded that based on quantitative analysis no impairment of its share in ASMPT existed as per December 31, 2016.
In June 2016, 1,575,133 common shares of ASMPT (par value of HKD0.10 per share) were issued as a consequence of the conversion of HKD 150 million of debt. The shares issued have diluted ASMI’s ownership in ASMPT to 39.40% as of June 30, 2016.
In December 2016, 2,139,100 common shares of ASMPT were issued, for cash at par value of HK$0.10 per share, pursuant to the Employee Share Incentive Scheme of ASMPT. The shares issued under the plan in 2016 have diluted ASMI’s ownership in ASMPT further to 39.19% as of December 31, 2016.
At December 31, 2016, the book value of our equity method investment in ASMPT was €1,236 million. The historical cost basis of our 39.19% share of net assets on the books of ASMPT under IFRS was €433 million as of December 31, 2016, resulting in a basis difference of €803 million. €126 million of this basis difference has been allocated to property, plant and equipment, and intangibles assets. The remaining amount was allocated to equity method goodwill. Each individual, identifiable asset will periodically be reviewed for any indicators of potential impairment. We amortize the basis differences allocated to the assets on a straight-line basis, and include the impact within the results of our equity method investments. Amortization and depreciation are adjusted for related deferred tax impacts. Included in net income attributable to ASMI for 2016 was after-tax expense of €27 million, representing the depreciation and amortization of the basis differences.
The market value of our 39.19% investment in ASMPT at December 31, 2016 approximates €1,608 million.
Summarized 100% earnings information for ASMPT equity method investment excluding basis adjustments (foreign currency exchange rate average 2016 1 HKD: €0.11698, for December 31, 2015: 1 HKD: €0.11602).
(HKD million) 2015 2016
Net sales 12,977 14,249
Income before income tax 1,363 1,793
Net earnings 953 1,438
Other comprehensive income (384) (237)
Total comprehensive income 569 1,201
AB
OU
TS
TR
AT
EG
Y &
BU
SIN
ES
SP
ER
FO
RM
AN
CE
RE
VIE
WS
HA
RE
HO
LD
ER
SG
OV
ER
NA
NC
EF
INA
NC
IAL
STA
TE
ME
NT
SASMI STATUTORY ANNUAL REPORT 2016 | NOTES TO THE CONSOLIDATED FINANCIAL STATEMENTS | 123
FIN
AN
CIA
L S
TAT
EM
EN
TS

Summarized 100% statement of financial position information for ASMPT equity method investment excluding basis adjustments (foreign currency exchange rate per December 31, 2016 was 1 HKD: €0.12232 for December 31, 2015: 1 HKD: €0.11852).
DECEMBER 31,
(HKD million) 2015 2016
Current assets 10,094 11,918
Non-current assets 3,774 3,721
Current liabilities 3,133 6,237
Non-current liabilities 2,699 376
Equity 8,036 9,026
Equity of ASMPT per December 31, 2016 translated into euros at a rate of 0.12232 was €1,104 million (our 39.19% share: €433 million).
The ASMPT Board is responsible for ongoing monitoring of the performance of the Back-end activities. The actual results of the Back-end operating unit are discussed with the ASMPT Audit Committee, which includes the representative of ASMI. The ASMI representative reports to the ASMI Management Board and the Audit Committee of ASMI on a quarterly basis.
Our share of income taxes incurred directly by the associates is reported in result from investments in associates and as such is not included in income taxes in our Consolidated financial statements.
NOTE 7. EVALUATION TOOLS AT CUSTOMERSThe changes in the amount of evaluation tools are as follows:
DECEMBER 31,
2015 2016
BALANCE AT BEGINNING OF YEAR 17,767 28,999
Evaluation tools shipped 15,651 28,490
Depreciation (5,003) (8,902)
Evaluation tools sold (6,313) (15,433)
Reclassification from assets under construction 4,659 1,633
Foreign currency translation effect 2,238 1,807
BALANCE AT END OF YEAR 28,999 36,594
Useful lives in years: 5
The gross carrying amount of the evaluation tools at customers per December 31, 2016 was €49,040 (2015: €38,631), accumulated depreciation per December 31, 2016 was €12,446 (2015: €9,632).
AB
OU
TS
TR
AT
EG
Y &
BU
SIN
ES
SP
ER
FO
RM
AN
CE
RE
VIE
WS
HA
RE
HO
LD
ER
SG
OV
ER
NA
NC
EF
INA
NC
IAL
STA
TE
ME
NT
SASMI STATUTORY ANNUAL REPORT 2016 | NOTES TO THE CONSOLIDATED FINANCIAL STATEMENTS | 124
FIN
AN
CIA
L S
TAT
EM
EN
TS

NOTE 8. INVENTORIESInventories consist of the following:
DECEMBER 31,
2015 2016
Components and raw materials 74,362 84,634
Work in process 30,627 30,614
Finished goods 27,863 12,618
TOTAL INVENTORIES, GROSS 132,852 127,866
Allowance for obsolescence (19,350) (15,527)
TOTAL INVENTORIES, NET 113,502 112,339
The changes in the allowance for obsolescence are as follows:
DECEMBER 31,
2015 2016
BALANCE AT BEGINNING OF YEAR (18,883) (19,350)
Charged to cost of sales (5,204) (6,120)
Reversals 3,859 5,012
Utilization of the provision 2,167 5,178
Foreign currency translation effect (1,289) (247)
BALANCE AT END OF YEAR (19,350) (15,527)
On December 31, 2016, our allowance for inventory obsolescence amounted to €15,527, which is 12.1% of total inventory. The major part of the allowance is related to components and raw materials. The addition for the years 2015 and 2016 mainly relate to inventory items which were ceased to be used due to technological developments and design changes which resulted in obsolescence of certain parts.
The cost of inventories recognized as costs and included in cost of sales amounted to €243.4 million (2015: €288.7 million).
NOTE 9. ACCOUNTS RECEIVABLEA significant percentage of our accounts receivable is derived from sales to a limited number of large multinational semiconductor device manufacturers located throughout the world. In order to monitor potential credit losses, we perform ongoing credit evaluations of our customers’ financial condition.
The carrying amount of accounts receivable is as follows:
DECEMBER 31,
2015 2016
Current 80,569 104,954
Overdue <30 days 3,046 7,152
Overdue 31-60 days 1,117 6,330
Overdue 61-120 days 3,443 12,531
Overdue >120 days 2,015 6,053
TOTAL 90,190 137,020
AB
OU
TS
TR
AT
EG
Y &
BU
SIN
ES
SP
ER
FO
RM
AN
CE
RE
VIE
WS
HA
RE
HO
LD
ER
SG
OV
ER
NA
NC
EF
INA
NC
IAL
STA
TE
ME
NT
SASMI STATUTORY ANNUAL REPORT 2016 | NOTES TO THE CONSOLIDATED FINANCIAL STATEMENTS | 125
FIN
AN
CIA
L S
TAT
EM
EN
TS

An allowance for doubtful accounts receivable is maintained for potential credit losses based upon management’s assessment of the expected collectability of all accounts receivable. The allowance for doubtful accounts is reviewed periodically to assess the adequacy of the allowance. In making this assessment, management takes into consideration any circumstances of which we are aware regarding a customer’s inability to meet its financial obligations, and our judgments as to potential prevailing economic conditions in the industry and their potential impact on the Company’s customers.
The changes in the allowance for doubtful accounts receivable are as follows:
DECEMBER 31,
2015 2016
BALANCE AT BEGINNING OF YEAR (19) (44)
Charged to selling, general and administrative expenses (22) (52)
Utilization of the provision – –
Foreign currency translation effect (3) 2
BALANCE AT END OF YEAR (44) (94)
Accounts receivable are impaired and provided for on an individual basis. As of December 31, 2016, accounts receivable of €32 million were past due but not impaired. These balances are still considered to be recoverable because they relate to customers for whom there is neither recent history of default nor expectation that this will incur.
For further information on credit risk see Note 16.
NOTE 10. CASH AND CASH EQUIVALENTSCash and cash equivalents at December 31, 2016 include deposits with financial institutions that have good credit ratings of €99 million (2015: €101 million), investments in money market funds that invest in debt securities of financial institutions that have good credit rating and governments of €24 million and interest-bearing bank accounts of €255 million (2015: €346 million). Our cash and cash equivalents are predominantly denominated in US dollars and partly in euros, Singapore dollars, Korean won, and Japanese Yen.
Bank guarantees exist for an amount of €827 at December 31, 2016 (€700 as per December 31, 2015).
Cash and cash equivalents have insignificant interest rate risk and remaining maturities of three months or less at the date of acquisition. Except for an amount of €3.7 million (2015: €3.7 million), no restrictions on usage of cash and cash equivalents exist. The carrying amount of these assets approximates to their fair value.
NOTE 11. EQUITYOur Management Board has the power to issue ordinary shares and (financing) preference shares insofar as the Management Board has been authorized to do so by the General Meeting of Shareholders. The Management Board requires the approval of the Supervisory Board for such an issue. The authorization by the General Meeting of Shareholders can only be granted for a certain period. In the case that the General Meeting of Shareholders has not authorized the Management Board to issue shares, the General Meeting of Shareholders shall have the power to issue shares.
COMMON SHARES, PREFERRED AND FINANCING PREFERRED SHARESThe authorized capital of the Company amounts to 110,000,000 common shares of €0.04 par value, 118,000 preferred shares of €40 par value and 8,000 financing preferred shares of €40 par value.
AB
OU
TS
TR
AT
EG
Y &
BU
SIN
ES
SP
ER
FO
RM
AN
CE
RE
VIE
WS
HA
RE
HO
LD
ER
SG
OV
ER
NA
NC
EF
INA
NC
IAL
STA
TE
ME
NT
SASMI STATUTORY ANNUAL REPORT 2016 | NOTES TO THE CONSOLIDATED FINANCIAL STATEMENTS | 126
FIN
AN
CIA
L S
TAT
EM
EN
TS

As at December 31, 2016, 63,797,394 ordinary shares with a nominal value of €0.04 each were issued and fully paid up, of which 3,981,551 ordinary shares are held by us in treasury. All shares have one vote per €0.04 par value. Treasury shares held by the Company cannot be voted on. Of our 59,815,843 outstanding common shares at December 31, 2016, 3,039 are registered with us in the Netherlands, 59,409,659 are registered with our transfer agent in the Netherlands, ABN AMRO Bank NV, and 403,145 are registered with our transfer agent in the United States, Citibank, NA, New York.
Financing preferred shares are designed to allow ASMI to finance equity with an instrument paying a preferred dividend, linked to EURIBOR loans and government loans, without the dilutive effects of issuing additional common shares.
Preferred and financing preferred shares are issued in registered form only and are subject to transfer restrictions. Essentially, a preferred or financing preferred shareholder must obtain the approval of the Company’s Supervisory Board to transfer shares. If approval is denied, the Supervisory Board will provide a list of acceptable prospective buyers who are willing to purchase the shares at a cash price to be fixed by consent of the Supervisory Board and seller within two months after the approval is denied. If the transfer is approved, the shareholder must complete the transfer within three months, at which time the approval expires.
Preferred shares are entitled to a cumulative preferred dividend based on the amount paid up on such shares. Financing preferred shares are entitled to a cumulative dividend based on the par value and share premium paid on such shares.
As per December 31, 2016 no preference shares are issued.
RETAINED EARNINGSDistributions to common shareholders are limited to the extent the total amount of shareholders’ equity exceeds the amounts of nominal paid-in share capital (exclusive any share premium) and any reserves to be formed pursuant to law or the Company’s articles of association. The amounts are derived from the Statutory financial statements of ASMI.
ASMI aims to pay a sustainable annual dividend. The Supervisory Board, upon proposal of the Management Board, will annually assess the amount of dividend that will be proposed to the Annual General Meeting of Shareholders. The decision that a dividend be proposed to the Annual General Meeting of Shareholders will be subject to the availability of distributable profits as well as retained earnings and may be affected by our potential future funding requirements. Accordingly, dividend payments may fluctuate and could decline or be omitted in any year.
In 2016, we paid a dividend of €0.70 per common share. We will propose to the forthcoming 2017 Annual General Meeting of Shareholders to declare a dividend of €0.70 per share.
Results on dilution of investments in associates are accounted for directly in equity. For 2016 and 2015, these dilution results were €9,336 and €5,535 respectively.
TREASURY SHARESOn October 26, 2016, ASMI announced a new €50 million share buyback program to be executed within the 2016-2017 time frame. The program started on December 13, 2016. On December 31, 2016, 12.9% of the program was effectuated.
On October 28, 2015, ASMI announced a share buyback program to purchase up to an amount of €100 million of its own shares within the 2015-2016 time frame. The program started on November 26, 2015, and was
AB
OU
TS
TR
AT
EG
Y &
BU
SIN
ES
SP
ER
FO
RM
AN
CE
RE
VIE
WS
HA
RE
HO
LD
ER
SG
OV
ER
NA
NC
EF
INA
NC
IAL
STA
TE
ME
NT
SASMI STATUTORY ANNUAL REPORT 2016 | NOTES TO THE CONSOLIDATED FINANCIAL STATEMENTS | 127
FIN
AN
CIA
L S
TAT
EM
EN
TS
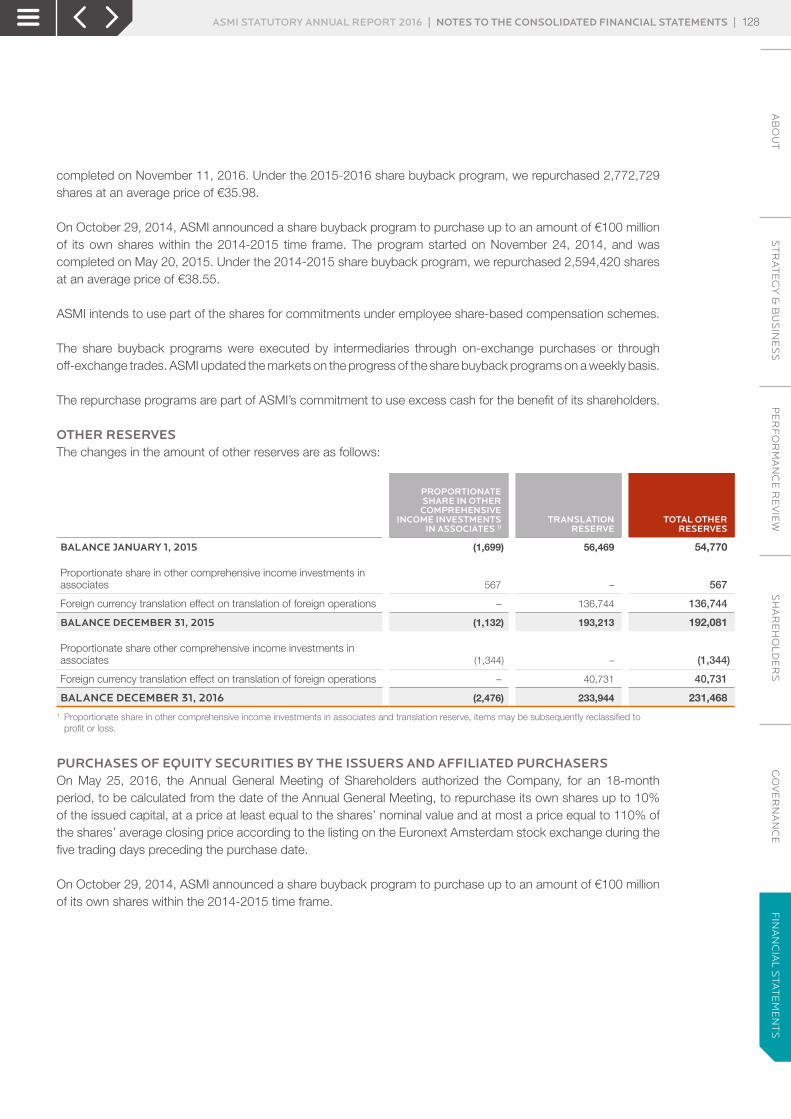
completed on November 11, 2016. Under the 2015-2016 share buyback program, we repurchased 2,772,729 shares at an average price of €35.98.
On October 29, 2014, ASMI announced a share buyback program to purchase up to an amount of €100 million of its own shares within the 2014-2015 time frame. The program started on November 24, 2014, and was completed on May 20, 2015. Under the 2014-2015 share buyback program, we repurchased 2,594,420 shares at an average price of €38.55.
ASMI intends to use part of the shares for commitments under employee share-based compensation schemes.
The share buyback programs were executed by intermediaries through on-exchange purchases or through off-exchange trades. ASMI updated the markets on the progress of the share buyback programs on a weekly basis.
The repurchase programs are part of ASMI’s commitment to use excess cash for the benefit of its shareholders.
OTHER RESERVESThe changes in the amount of other reserves are as follows:
PROPORTIONATE SHARE IN OTHER
COMPREHENSIVE INCOME INVESTMENTS
IN ASSOCIATES 1)TRANSLATION
RESERVETOTAL OTHER
RESERVES
BALANCE JANUARY 1, 2015 (1,699) 56,469 54,770
Proportionate share in other comprehensive income investments in associates 567 – 567
Foreign currency translation effect on translation of foreign operations – 136,744 136,744
BALANCE DECEMBER 31, 2015 (1,132) 193,213 192,081
Proportionate share other comprehensive income investments in associates (1,344) – (1,344)
Foreign currency translation effect on translation of foreign operations – 40,731 40,731
BALANCE DECEMBER 31, 2016 (2,476) 233,944 231,4681 Proportionate share in other comprehensive income investments in associates and translation reserve, items may be subsequently reclassified to
profit or loss.
PURCHASES OF EQUITY SECURITIES BY THE ISSUERS AND AFFILIATED PURCHASERSOn May 25, 2016, the Annual General Meeting of Shareholders authorized the Company, for an 18-month period, to be calculated from the date of the Annual General Meeting, to repurchase its own shares up to 10% of the issued capital, at a price at least equal to the shares’ nominal value and at most a price equal to 110% of the shares’ average closing price according to the listing on the Euronext Amsterdam stock exchange during the five trading days preceding the purchase date.
On October 29, 2014, ASMI announced a share buyback program to purchase up to an amount of €100 million of its own shares within the 2014-2015 time frame.
AB
OU
TS
TR
AT
EG
Y &
BU
SIN
ES
SP
ER
FO
RM
AN
CE
RE
VIE
WS
HA
RE
HO
LD
ER
SG
OV
ER
NA
NC
EF
INA
NC
IAL
STA
TE
ME
NT
SASMI STATUTORY ANNUAL REPORT 2016 | NOTES TO THE CONSOLIDATED FINANCIAL STATEMENTS | 128
FIN
AN
CIA
L S
TAT
EM
EN
TS
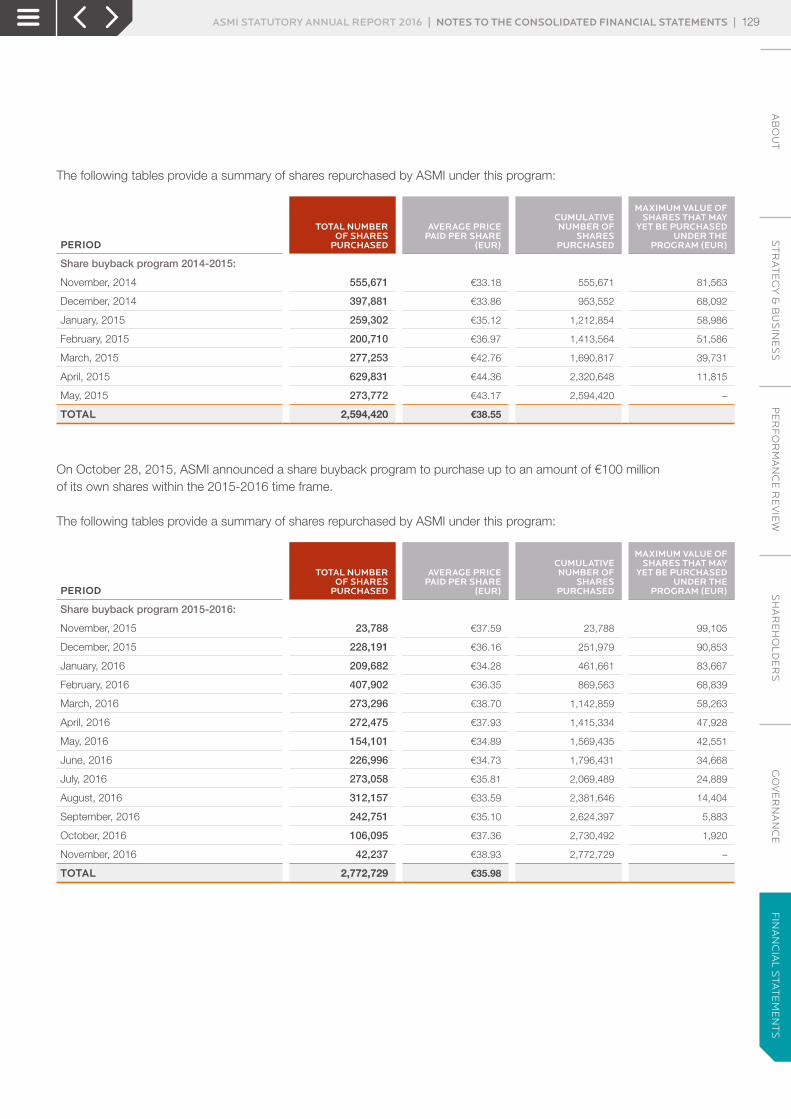
The following tables provide a summary of shares repurchased by ASMI under this program:
PERIOD
TOTAL NUMBER OF SHARES
PURCHASED
AVERAGE PRICE PAID PER SHARE
(EUR)
CUMULATIVE NUMBER OF
SHARES PURCHASED
MAXIMUM VALUE OF SHARES THAT MAY
YET BE PURCHASED UNDER THE
PROGRAM (EUR)
Share buyback program 2014-2015:
November, 2014 555,671 €33.18 555,671 81,563
December, 2014 397,881 €33.86 953,552 68,092
January, 2015 259,302 €35.12 1,212,854 58,986
February, 2015 200,710 €36.97 1,413,564 51,586
March, 2015 277,253 €42.76 1,690,817 39,731
April, 2015 629,831 €44.36 2,320,648 11,815
May, 2015 273,772 €43.17 2,594,420 –
TOTAL 2,594,420 €38.55
On October 28, 2015, ASMI announced a share buyback program to purchase up to an amount of €100 million of its own shares within the 2015-2016 time frame.
The following tables provide a summary of shares repurchased by ASMI under this program:
PERIOD
TOTAL NUMBER OF SHARES
PURCHASED
AVERAGE PRICE PAID PER SHARE
(EUR)
CUMULATIVE NUMBER OF
SHARES PURCHASED
MAXIMUM VALUE OF SHARES THAT MAY
YET BE PURCHASED UNDER THE
PROGRAM (EUR)
Share buyback program 2015-2016:
November, 2015 23,788 €37.59 23,788 99,105
December, 2015 228,191 €36.16 251,979 90,853
January, 2016 209,682 €34.28 461,661 83,667
February, 2016 407,902 €36.35 869,563 68,839
March, 2016 273,296 €38.70 1,142,859 58,263
April, 2016 272,475 €37.93 1,415,334 47,928
May, 2016 154,101 €34.89 1,569,435 42,551
June, 2016 226,996 €34.73 1,796,431 34,668
July, 2016 273,058 €35.81 2,069,489 24,889
August, 2016 312,157 €33.59 2,381,646 14,404
September, 2016 242,751 €35.10 2,624,397 5,883
October, 2016 106,095 €37.36 2,730,492 1,920
November, 2016 42,237 €38.93 2,772,729 –
TOTAL 2,772,729 €35.98
AB
OU
TS
TR
AT
EG
Y &
BU
SIN
ES
SP
ER
FO
RM
AN
CE
RE
VIE
WS
HA
RE
HO
LD
ER
SG
OV
ER
NA
NC
EF
INA
NC
IAL
STA
TE
ME
NT
SASMI STATUTORY ANNUAL REPORT 2016 | NOTES TO THE CONSOLIDATED FINANCIAL STATEMENTS | 129
FIN
AN
CIA
L S
TAT
EM
EN
TS
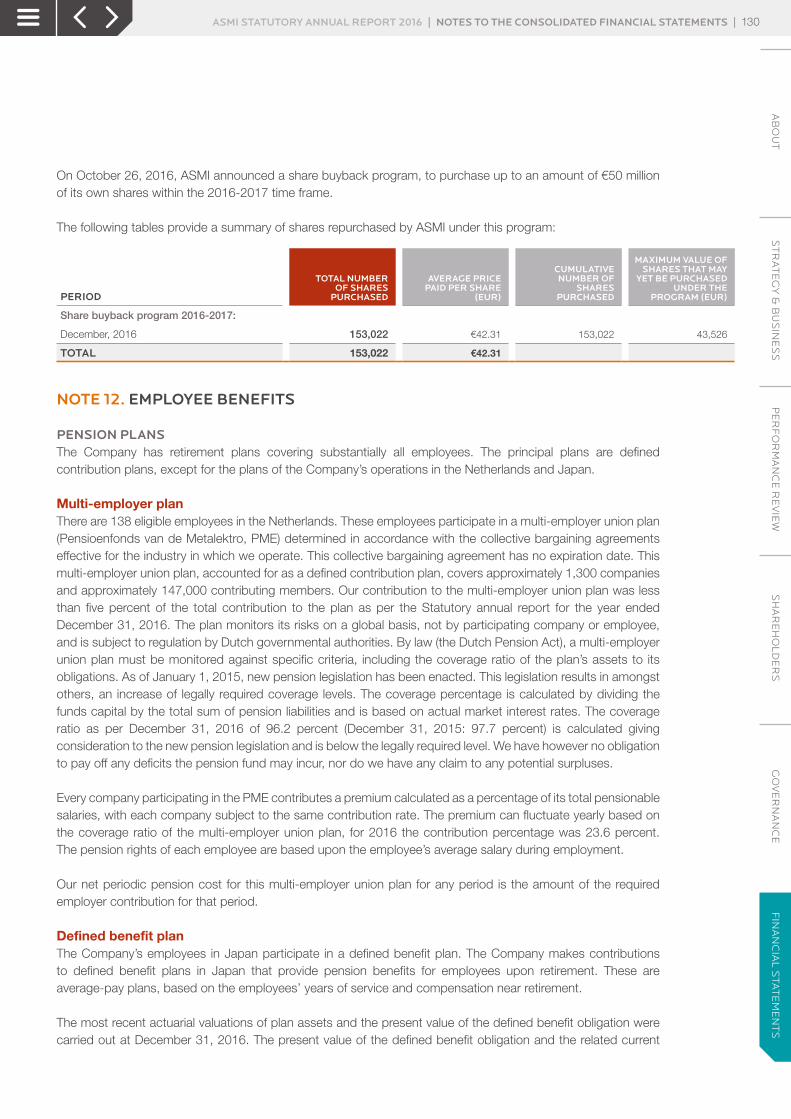
On October 26, 2016, ASMI announced a share buyback program, to purchase up to an amount of €50 million of its own shares within the 2016-2017 time frame.
The following tables provide a summary of shares repurchased by ASMI under this program:
PERIOD
TOTAL NUMBER OF SHARES
PURCHASED
AVERAGE PRICE PAID PER SHARE
(EUR)
CUMULATIVE NUMBER OF
SHARES PURCHASED
MAXIMUM VALUE OF SHARES THAT MAY
YET BE PURCHASED UNDER THE
PROGRAM (EUR)
Share buyback program 2016-2017:
December, 2016 153,022 €42.31 153,022 43,526
TOTAL 153,022 €42.31
NOTE 12. EMPLOYEE BENEFITS
PENSION PLANSThe Company has retirement plans covering substantially all employees. The principal plans are defined contribution plans, except for the plans of the Company’s operations in the Netherlands and Japan.
Multi-employer planThere are 138 eligible employees in the Netherlands. These employees participate in a multi-employer union plan (Pensioenfonds van de Metalektro, PME) determined in accordance with the collective bargaining agreements effective for the industry in which we operate. This collective bargaining agreement has no expiration date. This multi-employer union plan, accounted for as a defined contribution plan, covers approximately 1,300 companies and approximately 147,000 contributing members. Our contribution to the multi-employer union plan was less than five percent of the total contribution to the plan as per the Statutory annual report for the year ended December 31, 2016. The plan monitors its risks on a global basis, not by participating company or employee, and is subject to regulation by Dutch governmental authorities. By law (the Dutch Pension Act), a multi-employer union plan must be monitored against specific criteria, including the coverage ratio of the plan’s assets to its obligations. As of January 1, 2015, new pension legislation has been enacted. This legislation results in amongst others, an increase of legally required coverage levels. The coverage percentage is calculated by dividing the funds capital by the total sum of pension liabilities and is based on actual market interest rates. The coverage ratio as per December 31, 2016 of 96.2 percent (December 31, 2015: 97.7 percent) is calculated giving consideration to the new pension legislation and is below the legally required level. We have however no obligation to pay off any deficits the pension fund may incur, nor do we have any claim to any potential surpluses.
Every company participating in the PME contributes a premium calculated as a percentage of its total pensionable salaries, with each company subject to the same contribution rate. The premium can fluctuate yearly based on the coverage ratio of the multi-employer union plan, for 2016 the contribution percentage was 23.6 percent. The pension rights of each employee are based upon the employee’s average salary during employment.
Our net periodic pension cost for this multi-employer union plan for any period is the amount of the required employer contribution for that period.
Defined benefit planThe Company’s employees in Japan participate in a defined benefit plan. The Company makes contributions to defined benefit plans in Japan that provide pension benefits for employees upon retirement. These are average-pay plans, based on the employees’ years of service and compensation near retirement.
The most recent actuarial valuations of plan assets and the present value of the defined benefit obligation were carried out at December 31, 2016. The present value of the defined benefit obligation and the related current
AB
OU
TS
TR
AT
EG
Y &
BU
SIN
ES
SP
ER
FO
RM
AN
CE
RE
VIE
WS
HA
RE
HO
LD
ER
SG
OV
ER
NA
NC
EF
INA
NC
IAL
STA
TE
ME
NT
SASMI STATUTORY ANNUAL REPORT 2016 | NOTES TO THE CONSOLIDATED FINANCIAL STATEMENTS | 130
FIN
AN
CIA
L S
TAT
EM
EN
TS

service cost and past service cost were measured using the Projected Unit Credit Method. Significant actuarial assumptions for the determination of the defined obligation are discount rate, future general salary increases and future pension increases.
The net liability of the plan developed as follows:
DECEMBER 31,
2015 2016
Defined benefit obligations (9,800) (11,403)
Fair value of plan assets 8,630 9,985
NET LIABILITY FOR DEFINED BENEFIT PLANS (1,170) (1,418)
The changes in defined benefit obligations and fair value of plan assets are as follows:
DECEMBER 31,
2015 2016
Defined benefit obligations
BALANCE JANUARY 1 8,079 9,800
Current service cost 567 702
Interest on obligation 77 84
Remeasurement losses 236 736
Benefits paid (54) (497)
Foreign currency translation effect 895 578
BALANCE DECEMBER 31 9,800 11,403
Fair value of plan assets
BALANCE JANUARY 1 6,297 8,630
Interest income 65 80
Return on plan assets 294 (211)
Company contribution 1,306 1,473
Benefits paid (54) (497)
Foreign currency translation effect 722 510
BALANCE DECEMBER 31 8,630 9,985
The defined benefit cost consists of the following:
DECEMBER 31,
2015 2016
Current service cost 567 702
Net interest costs 12 4
NET DEFINED BENEFIT COST 579 706
AB
OU
TS
TR
AT
EG
Y &
BU
SIN
ES
SP
ER
FO
RM
AN
CE
RE
VIE
WS
HA
RE
HO
LD
ER
SG
OV
ER
NA
NC
EF
INA
NC
IAL
STA
TE
ME
NT
SASMI STATUTORY ANNUAL REPORT 2016 | NOTES TO THE CONSOLIDATED FINANCIAL STATEMENTS | 131
FIN
AN
CIA
L S
TAT
EM
EN
TS
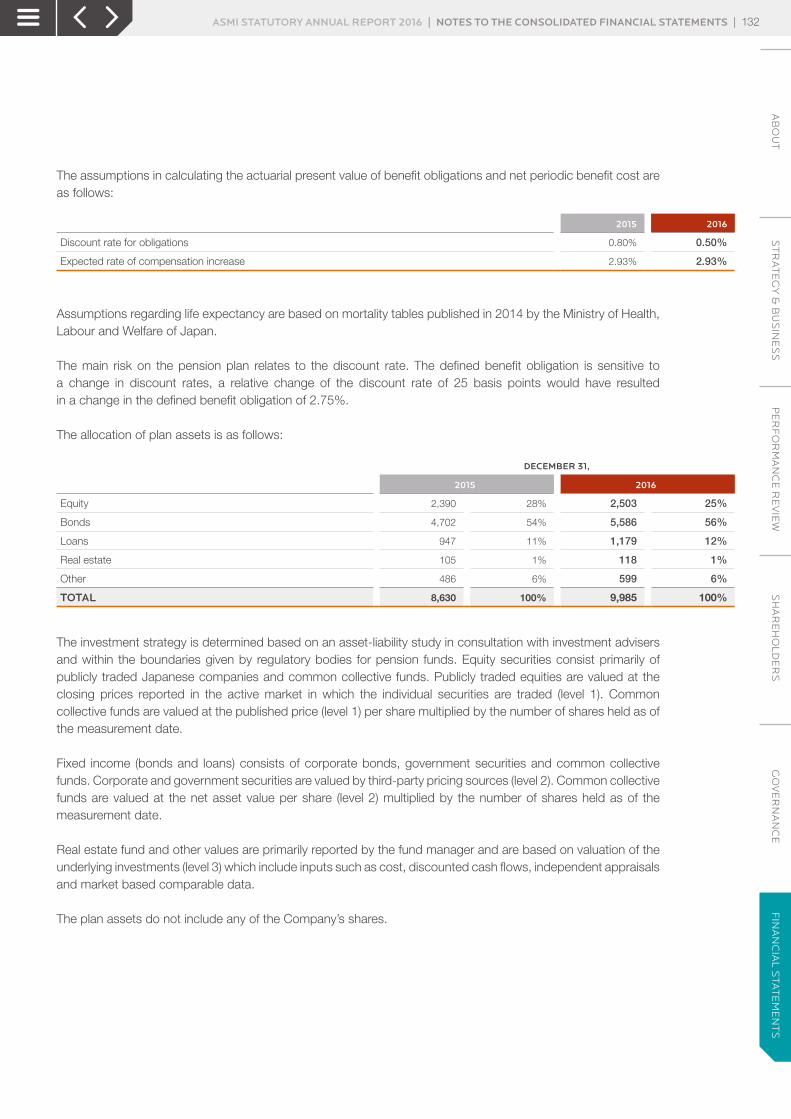
The assumptions in calculating the actuarial present value of benefit obligations and net periodic benefit cost are as follows:
2015 2016
Discount rate for obligations 0.80% 0.50%
Expected rate of compensation increase 2.93% 2.93%
Assumptions regarding life expectancy are based on mortality tables published in 2014 by the Ministry of Health, Labour and Welfare of Japan.
The main risk on the pension plan relates to the discount rate. The defined benefit obligation is sensitive to a change in discount rates, a relative change of the discount rate of 25 basis points would have resulted in a change in the defined benefit obligation of 2.75%.
The allocation of plan assets is as follows:
DECEMBER 31,
2015 2016
Equity 2,390 28% 2,503 25%
Bonds 4,702 54% 5,586 56%
Loans 947 11% 1,179 12%
Real estate 105 1% 118 1%
Other 486 6% 599 6%
TOTAL 8,630 100% 9,985 100%
The investment strategy is determined based on an asset-liability study in consultation with investment advisers and within the boundaries given by regulatory bodies for pension funds. Equity securities consist primarily of publicly traded Japanese companies and common collective funds. Publicly traded equities are valued at the closing prices reported in the active market in which the individual securities are traded (level 1). Common collective funds are valued at the published price (level 1) per share multiplied by the number of shares held as of the measurement date.
Fixed income (bonds and loans) consists of corporate bonds, government securities and common collective funds. Corporate and government securities are valued by third-party pricing sources (level 2). Common collective funds are valued at the net asset value per share (level 2) multiplied by the number of shares held as of the measurement date.
Real estate fund and other values are primarily reported by the fund manager and are based on valuation of the underlying investments (level 3) which include inputs such as cost, discounted cash flows, independent appraisals and market based comparable data.
The plan assets do not include any of the Company’s shares.
AB
OU
TS
TR
AT
EG
Y &
BU
SIN
ES
SP
ER
FO
RM
AN
CE
RE
VIE
WS
HA
RE
HO
LD
ER
SG
OV
ER
NA
NC
EF
INA
NC
IAL
STA
TE
ME
NT
SASMI STATUTORY ANNUAL REPORT 2016 | NOTES TO THE CONSOLIDATED FINANCIAL STATEMENTS | 132
FIN
AN
CIA
L S
TAT
EM
EN
TS

Retirement plan costsASMI contributed €1,473 to the defined benefit plan in 2016. The Company expects to pay benefits for years subsequent to December 31, 2016 as follows:
EXPECTED CONTRIBUTION DEFINED BENEFIT PLAN
2017 576
2018 510
2019 600
2020 335
2021 387
Aggregate for the years 2022-2026 3,444
TOTAL 5,852
Retirement plan costs consist of the following:
DECEMBER 31,
2015 2016
Defined contribution plans 3,407 3,395
Multi-employer plans 1,465 1,443
Defined benefit plans 579 706
TOTAL RETIREMENT PLAN COSTS 5,451 5,544
The Company does not provide for any significant post-retirement benefits other than pensions.
MANAGEMENT BOARD AND EMPLOYEE AND LONG-TERM INCENTIVE PLANThe Company has adopted various share plans (e.g. stock option plans, a restricted share plan and a performance share plan) and has entered into share agreements with the Management Board and various employees. Under the stock option plans, the Management Board and employees may purchase per the vesting date a specific number of shares of the Company’s common stock at a certain price. Options are priced at market value in euros or US dollars on the date of grant. Under the restricted share plan, employees receive per the vesting date a specific number of shares of the Company’s common stock. Under the performance share plan, the Management Board receives per the vesting date, and provided the performance criteria have been met, a specific number of shares of the Company’s common stock.
Authority to issue options and sharesBy resolution of the Annual General Meeting of Shareholders (AGM) of May 25, 2016, the formal authority to issue options and shares was allocated to the Management Board subject to the approval of the Supervisory Board. This authority is valid for 18 months and needs to be refreshed by the 2017 AGM to allow the continued application of the Long-Term Incentive (LTI) Plans beyond November 20, 2017.
The ASM International NV 2014 Long-Term Incentive Plan for Employees (ELTI) is principally administered by the Management Board and the ASM International NV 2014 Long-Term Incentive Plan for members of the Management Board (MLTI) is principally administered by the Supervisory Board. This complies with applicable corporate governance standards. However, the Supervisory Board has no power to represent the Company. For external purposes the Management Board remains the competent body under both LTI plans. The LTI plans envisage that the Supervisory Board, or in the case of the ELTI the Management Board with the approval of the Supervisory Board, will determine the number of options and shares to be granted to the Management Board members and to employees.
AB
OU
TS
TR
AT
EG
Y &
BU
SIN
ES
SP
ER
FO
RM
AN
CE
RE
VIE
WS
HA
RE
HO
LD
ER
SG
OV
ER
NA
NC
EF
INA
NC
IAL
STA
TE
ME
NT
SASMI STATUTORY ANNUAL REPORT 2016 | NOTES TO THE CONSOLIDATED FINANCIAL STATEMENTS | 133
FIN
AN
CIA
L S
TAT
EM
EN
TS
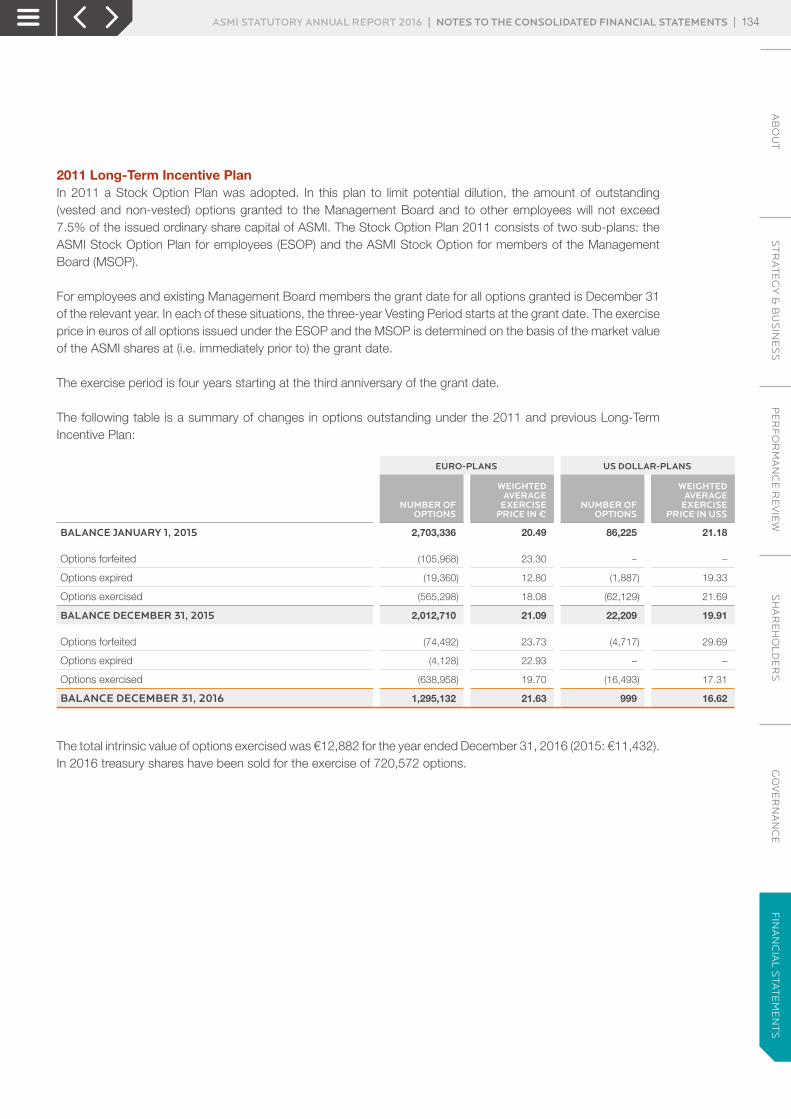
2011 Long-Term Incentive PlanIn 2011 a Stock Option Plan was adopted. In this plan to limit potential dilution, the amount of outstanding (vested and non-vested) options granted to the Management Board and to other employees will not exceed 7.5% of the issued ordinary share capital of ASMI. The Stock Option Plan 2011 consists of two sub-plans: the ASMI Stock Option Plan for employees (ESOP) and the ASMI Stock Option for members of the Management Board (MSOP).
For employees and existing Management Board members the grant date for all options granted is December 31 of the relevant year. In each of these situations, the three-year Vesting Period starts at the grant date. The exercise price in euros of all options issued under the ESOP and the MSOP is determined on the basis of the market value of the ASMI shares at (i.e. immediately prior to) the grant date.
The exercise period is four years starting at the third anniversary of the grant date.
The following table is a summary of changes in options outstanding under the 2011 and previous Long-Term Incentive Plan:
EURO-PLANS US DOLLAR-PLANS
NUMBER OF OPTIONS
WEIGHTED AVERAGE
EXERCISE PRICE IN €
NUMBER OF OPTIONS
WEIGHTED AVERAGE
EXERCISE PRICE IN US$
BALANCE JANUARY 1, 2015 2,703,336 20.49 86,225 21.18
Options forfeited (105,968) 23.30 – –
Options expired (19,360) 12.80 (1,887) 19.33
Options exercised (565,298) 18.08 (62,129) 21.69
BALANCE DECEMBER 31, 2015 2,012,710 21.09 22,209 19.91
Options forfeited (74,492) 23.73 (4,717) 29.69
Options expired (4,128) 22.93 – –
Options exercised (638,958) 19.70 (16,493) 17.31
BALANCE DECEMBER 31, 2016 1,295,132 21.63 999 16.62
The total intrinsic value of options exercised was €12,882 for the year ended December 31, 2016 (2015: €11,432). In 2016 treasury shares have been sold for the exercise of 720,572 options.
AB
OU
TS
TR
AT
EG
Y &
BU
SIN
ES
SP
ER
FO
RM
AN
CE
RE
VIE
WS
HA
RE
HO
LD
ER
SG
OV
ER
NA
NC
EF
INA
NC
IAL
STA
TE
ME
NT
SASMI STATUTORY ANNUAL REPORT 2016 | NOTES TO THE CONSOLIDATED FINANCIAL STATEMENTS | 134
FIN
AN
CIA
L S
TAT
EM
EN
TS
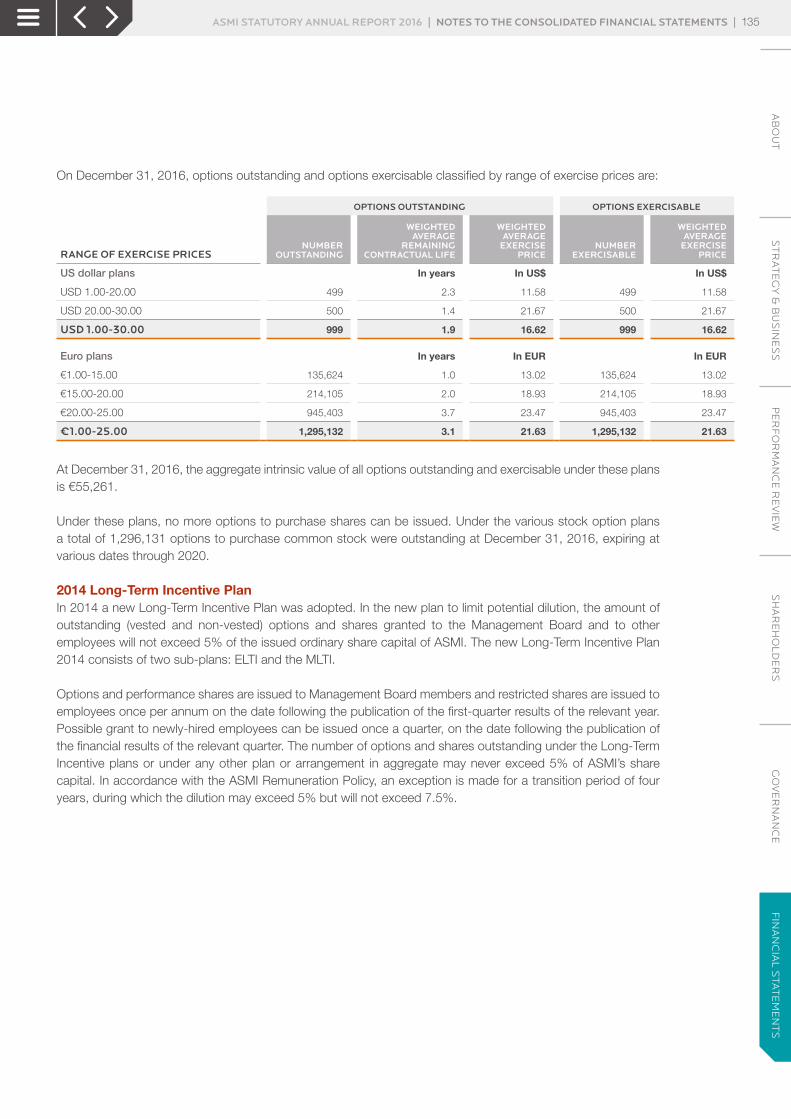
On December 31, 2016, options outstanding and options exercisable classified by range of exercise prices are:
OPTIONS OUTSTANDING OPTIONS EXERCISABLE
RANGE OF EXERCISE PRICESNUMBER
OUTSTANDING
WEIGHTED AVERAGE
REMAINING CONTRACTUAL LIFE
WEIGHTED AVERAGE
EXERCISE PRICE
NUMBER EXERCISABLE
WEIGHTED AVERAGE
EXERCISE PRICE
US dollar plans In years In US$ In US$
USD 1.00-20.00 499 2.3 11.58 499 11.58
USD 20.00-30.00 500 1.4 21.67 500 21.67
USD 1.00-30.00 999 1.9 16.62 999 16.62
Euro plans In years In EUR In EUR
€1.00-15.00 135,624 1.0 13.02 135,624 13.02
€15.00-20.00 214,105 2.0 18.93 214,105 18.93
€20.00-25.00 945,403 3.7 23.47 945,403 23.47
€1.00-25.00 1,295,132 3.1 21.63 1,295,132 21.63
At December 31, 2016, the aggregate intrinsic value of all options outstanding and exercisable under these plans is €55,261.
Under these plans, no more options to purchase shares can be issued. Under the various stock option plans a total of 1,296,131 options to purchase common stock were outstanding at December 31, 2016, expiring at various dates through 2020.
2014 Long-Term Incentive PlanIn 2014 a new Long-Term Incentive Plan was adopted. In the new plan to limit potential dilution, the amount of outstanding (vested and non-vested) options and shares granted to the Management Board and to other employees will not exceed 5% of the issued ordinary share capital of ASMI. The new Long-Term Incentive Plan 2014 consists of two sub-plans: ELTI and the MLTI.
Options and performance shares are issued to Management Board members and restricted shares are issued to employees once per annum on the date following the publication of the first-quarter results of the relevant year. Possible grant to newly-hired employees can be issued once a quarter, on the date following the publication of the financial results of the relevant quarter. The number of options and shares outstanding under the Long-Term Incentive plans or under any other plan or arrangement in aggregate may never exceed 5% of ASMI’s share capital. In accordance with the ASMI Remuneration Policy, an exception is made for a transition period of four years, during which the dilution may exceed 5% but will not exceed 7.5%.
AB
OU
TS
TR
AT
EG
Y &
BU
SIN
ES
SP
ER
FO
RM
AN
CE
RE
VIE
WS
HA
RE
HO
LD
ER
SG
OV
ER
NA
NC
EF
INA
NC
IAL
STA
TE
ME
NT
SASMI STATUTORY ANNUAL REPORT 2016 | NOTES TO THE CONSOLIDATED FINANCIAL STATEMENTS | 135
FIN
AN
CIA
L S
TAT
EM
EN
TS
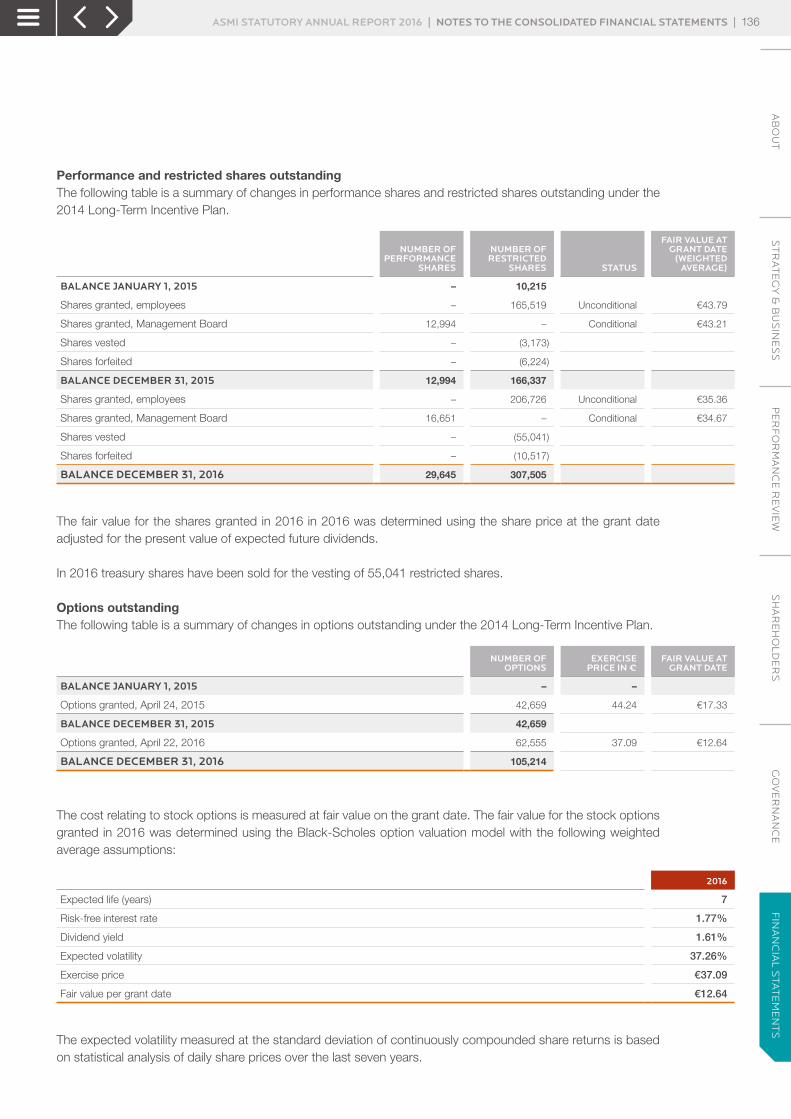
Performance and restricted shares outstandingThe following table is a summary of changes in performance shares and restricted shares outstanding under the 2014 Long-Term Incentive Plan.
NUMBER OF PERFORMANCE
SHARES
NUMBER OF RESTRICTED
SHARES STATUS
FAIR VALUE AT GRANT DATE
(WEIGHTED AVERAGE)
BALANCE JANUARY 1, 2015 – 10,215
Shares granted, employees – 165,519 Unconditional €43.79
Shares granted, Management Board 12,994 – Conditional €43.21
Shares vested – (3,173)
Shares forfeited – (6,224)
BALANCE DECEMBER 31, 2015 12,994 166,337
Shares granted, employees – 206,726 Unconditional €35.36
Shares granted, Management Board 16,651 – Conditional €34.67
Shares vested – (55,041)
Shares forfeited – (10,517)
BALANCE DECEMBER 31, 2016 29,645 307,505
The fair value for the shares granted in 2016 in 2016 was determined using the share price at the grant date adjusted for the present value of expected future dividends.
In 2016 treasury shares have been sold for the vesting of 55,041 restricted shares.
Options outstandingThe following table is a summary of changes in options outstanding under the 2014 Long-Term Incentive Plan.
NUMBER OF OPTIONS
EXERCISE PRICE IN €
FAIR VALUE AT GRANT DATE
BALANCE JANUARY 1, 2015 – –
Options granted, April 24, 2015 42,659 44.24 €17.33
BALANCE DECEMBER 31, 2015 42,659
Options granted, April 22, 2016 62,555 37.09 €12.64
BALANCE DECEMBER 31, 2016 105,214
The cost relating to stock options is measured at fair value on the grant date. The fair value for the stock options granted in 2016 was determined using the Black-Scholes option valuation model with the following weighted average assumptions:
2016
Expected life (years) 7
Risk-free interest rate 1.77%
Dividend yield 1.61%
Expected volatility 37.26%
Exercise price €37.09
Fair value per grant date €12.64
The expected volatility measured at the standard deviation of continuously compounded share returns is based on statistical analysis of daily share prices over the last seven years.
AB
OU
TS
TR
AT
EG
Y &
BU
SIN
ES
SP
ER
FO
RM
AN
CE
RE
VIE
WS
HA
RE
HO
LD
ER
SG
OV
ER
NA
NC
EF
INA
NC
IAL
STA
TE
ME
NT
SASMI STATUTORY ANNUAL REPORT 2016 | NOTES TO THE CONSOLIDATED FINANCIAL STATEMENTS | 136
FIN
AN
CIA
L S
TAT
EM
EN
TS
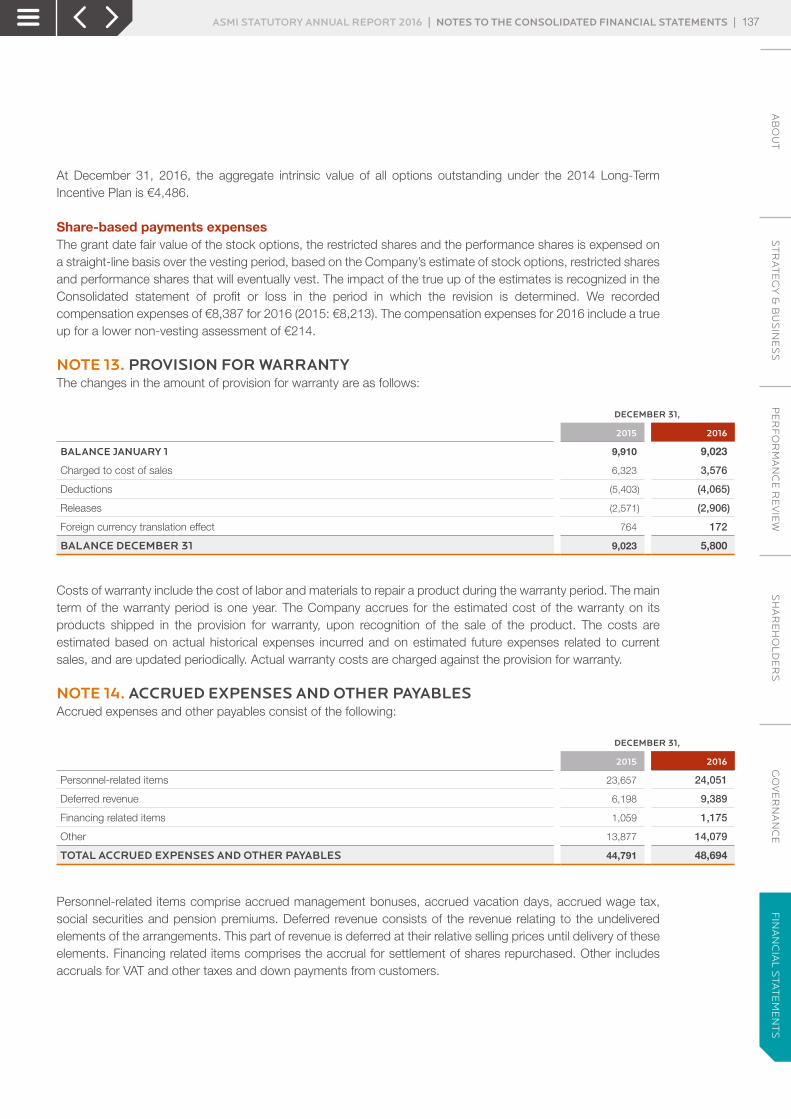
At December 31, 2016, the aggregate intrinsic value of all options outstanding under the 2014 Long-Term Incentive Plan is €4,486.
Share-based payments expensesThe grant date fair value of the stock options, the restricted shares and the performance shares is expensed on a straight-line basis over the vesting period, based on the Company’s estimate of stock options, restricted shares and performance shares that will eventually vest. The impact of the true up of the estimates is recognized in the Consolidated statement of profit or loss in the period in which the revision is determined. We recorded compensation expenses of €8,387 for 2016 (2015: €8,213). The compensation expenses for 2016 include a true up for a lower non-vesting assessment of €214.
NOTE 13. PROVISION FOR WARRANTYThe changes in the amount of provision for warranty are as follows:
DECEMBER 31,
2015 2016
BALANCE JANUARY 1 9,910 9,023
Charged to cost of sales 6,323 3,576
Deductions (5,403) (4,065)
Releases (2,571) (2,906)
Foreign currency translation effect 764 172
BALANCE DECEMBER 31 9,023 5,800
Costs of warranty include the cost of labor and materials to repair a product during the warranty period. The main term of the warranty period is one year. The Company accrues for the estimated cost of the warranty on its products shipped in the provision for warranty, upon recognition of the sale of the product. The costs are estimated based on actual historical expenses incurred and on estimated future expenses related to current sales, and are updated periodically. Actual warranty costs are charged against the provision for warranty.
NOTE 14. ACCRUED EXPENSES AND OTHER PAYABLESAccrued expenses and other payables consist of the following:
DECEMBER 31,
2015 2016
Personnel-related items 23,657 24,051
Deferred revenue 6,198 9,389
Financing related items 1,059 1,175
Other 13,877 14,079
TOTAL ACCRUED EXPENSES AND OTHER PAYABLES 44,791 48,694
Personnel-related items comprise accrued management bonuses, accrued vacation days, accrued wage tax, social securities and pension premiums. Deferred revenue consists of the revenue relating to the undelivered elements of the arrangements. This part of revenue is deferred at their relative selling prices until delivery of these elements. Financing related items comprises the accrual for settlement of shares repurchased. Other includes accruals for VAT and other taxes and down payments from customers.
AB
OU
TS
TR
AT
EG
Y &
BU
SIN
ES
SP
ER
FO
RM
AN
CE
RE
VIE
WS
HA
RE
HO
LD
ER
SG
OV
ER
NA
NC
EF
INA
NC
IAL
STA
TE
ME
NT
SASMI STATUTORY ANNUAL REPORT 2016 | NOTES TO THE CONSOLIDATED FINANCIAL STATEMENTS | 137
FIN
AN
CIA
L S
TAT
EM
EN
TS
NOTE 15. CREDIT FACILITYAs per December 31, 2016, ASMI is debt-free. ASMI may borrow under separate short-term lines of credit with banks under an unsecured €150 million standby credit facility with a consortium of banks.
Total short-term lines of credit amounted to €150 million at December 31, 2016. The amount outstanding at December 31, 2016 was nil, so the undrawn portion totaled €150 million. The undrawn portion represents the Company’s standby revolving credit facility of €150 million with a consortium of banks. The facility will be available through December 16, 2021, with an extension option for up to two years.
The credit facility of €150 million includes two financial covenants: › minimum consolidated tangible net worth; and › consolidated total net debt/total equity ratio.
These financial covenants are measured twice each year, at June 30 and December 31.
The minimum level of consolidated tangible net worth for the year ended December 31, 2016 required was €450 million, the consolidated tangible net worth as per that date was €1,101 million.
Consolidated tangible net worth is defined as the net assets, deducting any amount shown in respect of goodwill or other intangible assets (including any value arising from any valuation of ASMPT).
Total equity is defined as the aggregate of: › the amounts paid up on the issued common shares; › share capital in excess of par value; › retained earnings; › accumulated other comprehensive income and loss; and › deducting any amount shown in respect of goodwill or other intangible assets .
The net debt/total equity ratio should not exceed 1.5. For the year ended December 31, 2016, net cash was €378 million and total equity amounted to €2,016 million. The Company is in compliance with these financial covenants as of December 31, 2016.
ASMI does not provide guarantees for borrowings of ASMPT and there are no guarantees from ASMPT to secure indebtedness of ASMI. Under the rules of the Stock Exchange of Hong Kong, ASMPT is precluded from providing loans and advances other than trade receivables in the normal course of business, to ASMI or its non-ASMPT subsidiaries.
AB
OU
TS
TR
AT
EG
Y &
BU
SIN
ES
SP
ER
FO
RM
AN
CE
RE
VIE
WS
HA
RE
HO
LD
ER
SG
OV
ER
NA
NC
EF
INA
NC
IAL
STA
TE
ME
NT
SASMI STATUTORY ANNUAL REPORT 2016 | NOTES TO THE CONSOLIDATED FINANCIAL STATEMENTS | 138
FIN
AN
CIA
L S
TAT
EM
EN
TS

NOTE 16. FINANCIAL INSTRUMENTS AND FINANCIAL RISK MANAGEMENT
FINANCIAL INSTRUMENTSFinancial instruments include:
DECEMBER 31,
2015 2016
Financial assets:
Cash and cash equivalents 446,915 378,157
Accounts receivable 90,190 137,020
Financial liabilities:
Accounts payable 54,441 60,910
The carrying amounts of cash and cash equivalents, accounts receivable and accounts payable equal their fair values because of the short-term nature of these instruments.
Gains or losses related to financial instruments are as follows:
2015 2016
Interest income 1,112 3,095
Interest expense (1,620) (1,096)
Result from foreign currency exchange 25,264 13,032
Addition to allowance for doubtful accounts receivable (22) (52)
Fair value is the price that would be received to sell an asset or paid to transfer a liability in an orderly transaction between market participants at the measurement date. ASMI uses the following fair value hierarchy, which prioritizes the inputs to valuation techniques used to measure fair value into three levels and bases the categorization within the hierarchy upon the lowest level of input that is available and significant to the fair value measurement:
Level 1Quoted prices in active markets that are accessible at the measurement date for identical assets and liabilities.
Level 2Inputs other than Level 1 that are observable, either directly or indirectly, such as quoted prices for similar assets or liabilities, quoted prices in markets that are not active, or other inputs that are observable or can be corroborated by observable market data for substantially the full term of the assets or liabilities.
Level 3Unobservable inputs that are supported by little or no market activity and that are significant to the fair value of the assets or liabilities.
There were no transfers between levels during the years ended December 31, 2016 and December 31, 2015.
AB
OU
TS
TR
AT
EG
Y &
BU
SIN
ES
SP
ER
FO
RM
AN
CE
RE
VIE
WS
HA
RE
HO
LD
ER
SG
OV
ER
NA
NC
EF
INA
NC
IAL
STA
TE
ME
NT
SASMI STATUTORY ANNUAL REPORT 2016 | NOTES TO THE CONSOLIDATED FINANCIAL STATEMENTS | 139
FIN
AN
CIA
L S
TAT
EM
EN
TS
FINANCIAL RISK FACTORSASMI is exposed to a number of risk factors: market risks (including foreign exchange risk), credit risk, liquidity risk and equity price risk. The Company may use forward exchange contracts to hedge its foreign exchange risk. The Company does not enter into financial instrument transactions for trading or speculative purposes.
Foreign exchange riskASMI and its subsidiaries conduct business in a number of foreign countries, with certain transactions denominated in currencies other than the functional currency of the Company (euros) or one of its subsidiaries conducting the business. The purpose of the Company’s foreign currency management is to manage the effect of exchange rate fluctuations on income, expenses, cash flows and assets and liabilities denominated in selected foreign currencies, in particular denominated in US dollars.
We may use forward exchange contracts to hedge our foreign exchange risk of anticipated sales or purchase transactions in the normal course of business, which occur within the next twelve months, for which we have a firm commitment from a customer or to a supplier. The terms of these contracts are consistent with the timing of the transactions being hedged. The hedges related to forecasted transactions are designated and documented at the inception of the hedge as cash flow hedges, and are evaluated for effectiveness on a quarterly basis. The effective portion of the gain or loss on these hedges is reported as a component of accumulated other comprehensive income (loss) net of taxes in equity, and is reclassified into earnings when the hedged transaction affects earnings.
Changes in the fair value of derivatives that do not qualify for hedge treatment, as well as the ineffective portion of any hedges, are recognized in earnings. We record all derivatives, including forward exchange contracts, on the statement of financial position at fair value in accrued expenses and payables. Should contracts extend beyond one year, these are classified as long-term.
Furthermore, we might manage the currency exposure of certain receivables and payables using derivative instruments, such as forward exchange contracts (fair value hedges) and currency swaps, and non-derivative instruments, such as debt borrowings in foreign currencies. The gains or losses on these instruments provide an offset to the gains or losses recorded on receivables and payables denominated in foreign currencies. The derivative instruments are recorded at fair value and changes in fair value are recorded in earnings under foreign currency exchange gains (losses) in the Consolidated statement of profit or loss. Receivables and payables denominated in foreign currencies are recorded at the exchange rate at the balance sheet date and gains and losses as a result of changes in exchange rates are recorded in earnings under foreign currency exchange gains (losses) in the Consolidated statement of profit or loss.
We do not use forward exchange contracts for trading or speculative purposes. Financial assets and financial liabilities are recognized on the Company’s Consolidated statement of financial position when the Company becomes a party to the contractual provisions of the instrument.
To the extent that exchange rate fluctuations impact the value of the Company’s investments in its foreign subsidiaries, they are not hedged. The cumulative effect of these fluctuations is separately reported in Consolidated Equity. Reference is made to Note 11.
Per December 31, 2015 and December 31, 2016, there were no forward exchange contracts outstanding.
AB
OU
TS
TR
AT
EG
Y &
BU
SIN
ES
SP
ER
FO
RM
AN
CE
RE
VIE
WS
HA
RE
HO
LD
ER
SG
OV
ER
NA
NC
EF
INA
NC
IAL
STA
TE
ME
NT
SASMI STATUTORY ANNUAL REPORT 2016 | NOTES TO THE CONSOLIDATED FINANCIAL STATEMENTS | 140
FIN
AN
CIA
L S
TAT
EM
EN
TS
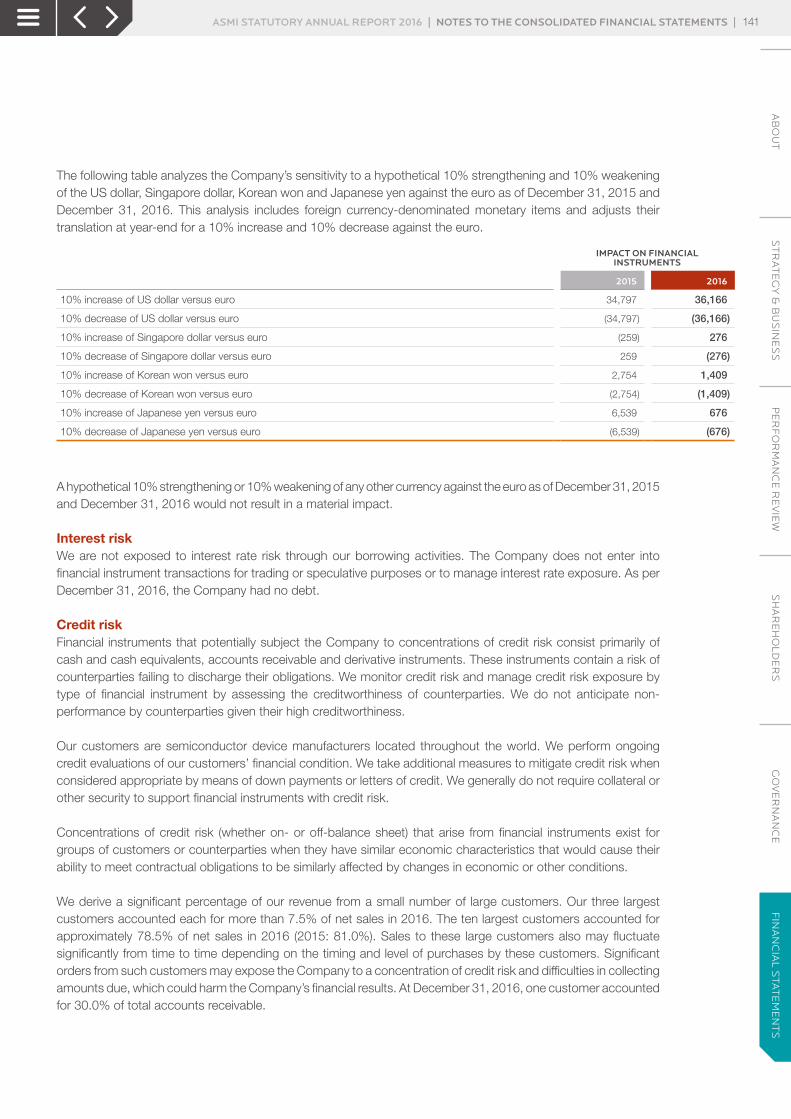
The following table analyzes the Company’s sensitivity to a hypothetical 10% strengthening and 10% weakening of the US dollar, Singapore dollar, Korean won and Japanese yen against the euro as of December 31, 2015 and December 31, 2016. This analysis includes foreign currency-denominated monetary items and adjusts their translation at year-end for a 10% increase and 10% decrease against the euro.
IMPACT ON FINANCIAL
INSTRUMENTS
2015 2016
10% increase of US dollar versus euro 34,797 36,166
10% decrease of US dollar versus euro (34,797) (36,166)
10% increase of Singapore dollar versus euro (259) 276
10% decrease of Singapore dollar versus euro 259 (276)
10% increase of Korean won versus euro 2,754 1,409
10% decrease of Korean won versus euro (2,754) (1,409)
10% increase of Japanese yen versus euro 6,539 676
10% decrease of Japanese yen versus euro (6,539) (676)
A hypothetical 10% strengthening or 10% weakening of any other currency against the euro as of December 31, 2015 and December 31, 2016 would not result in a material impact.
Interest riskWe are not exposed to interest rate risk through our borrowing activities. The Company does not enter into financial instrument transactions for trading or speculative purposes or to manage interest rate exposure. As per December 31, 2016, the Company had no debt.
Credit riskFinancial instruments that potentially subject the Company to concentrations of credit risk consist primarily of cash and cash equivalents, accounts receivable and derivative instruments. These instruments contain a risk of counterparties failing to discharge their obligations. We monitor credit risk and manage credit risk exposure by type of financial instrument by assessing the creditworthiness of counterparties. We do not anticipate non-performance by counterparties given their high creditworthiness.
Our customers are semiconductor device manufacturers located throughout the world. We perform ongoing credit evaluations of our customers’ financial condition. We take additional measures to mitigate credit risk when considered appropriate by means of down payments or letters of credit. We generally do not require collateral or other security to support financial instruments with credit risk.
Concentrations of credit risk (whether on- or off-balance sheet) that arise from financial instruments exist for groups of customers or counterparties when they have similar economic characteristics that would cause their ability to meet contractual obligations to be similarly affected by changes in economic or other conditions.
We derive a significant percentage of our revenue from a small number of large customers. Our three largest customers accounted each for more than 7.5% of net sales in 2016. The ten largest customers accounted for approximately 78.5% of net sales in 2016 (2015: 81.0%). Sales to these large customers also may fluctuate significantly from time to time depending on the timing and level of purchases by these customers. Significant orders from such customers may expose the Company to a concentration of credit risk and difficulties in collecting amounts due, which could harm the Company’s financial results. At December 31, 2016, one customer accounted for 30.0% of total accounts receivable.
AB
OU
TS
TR
AT
EG
Y &
BU
SIN
ES
SP
ER
FO
RM
AN
CE
RE
VIE
WS
HA
RE
HO
LD
ER
SG
OV
ER
NA
NC
EF
INA
NC
IAL
STA
TE
ME
NT
SASMI STATUTORY ANNUAL REPORT 2016 | NOTES TO THE CONSOLIDATED FINANCIAL STATEMENTS | 141
FIN
AN
CIA
L S
TAT
EM
EN
TS

We invest our cash and cash equivalents in short-term deposits, money market funds and derivative instruments with high-rated financial institutions. We only enter into transactions with a limited number of major financial institutions that have high credit ratings and we closely monitor the creditworthiness of our counterparties. Concentration risk is mitigated by not limiting the exposure to a single counter party.
The maximum credit exposure is equal to the carrying values of cash and cash equivalent, and accounts receivable.
Liquidity riskOur policy is to maintain a strong capital base so as to maintain investor, creditor and market confidence and to sustain future development of the business.
Our liquidity needs are affected by many factors, some of which are based on the normal on-going operations of the business, and others that relate to the uncertainties of the global economy and the semiconductor industry. Although our cash requirements fluctuate based on the timing and extent of these factors, we believe that cash generated from operations, together with our principal sources of liquidity are sufficient to satisfy our current requirements, including our expected capital expenditures in 2017.
We intend to return cash to our shareholders on a regular basis in the form of dividend payments and, subject to our actual and anticipated liquidity requirements and other relevant factors, share buybacks.
The following table summarizes the Company’s contractual and other obligations as at December 31, 2016.
TOTALLESS THAN
1 YEAR 1-3 YEARS 3-5 YEARSMORE THAN
5 YEARS
Accounts payable 60,910 60,910 – – –
Income tax payable 2,467 2,467 – – –
Accrued expenses and other payables 48,694 48,694 – – –
Operating leases 16,523 6,365 6,670 3,162 326
Pension liabilities 5,852 576 1,110 722 3,444
Purchase obligations:
Purchase commitments to suppliers 87,078 86,885 175 18 –
Capital expenditure and other commitments 10,556 9,569 987 – –
TOTAL CONTRACTUAL OBLIGATIONS 232,080 215,466 8,942 3,902 3,770
Total short-term lines of credit amounted to €150,000 at December 31, 2016. The amount outstanding at December 31, 2016 was nil and the undrawn portion totaled €150,000. The standby revolving credit facility of €150,000 with a consortium of banks will be available through December 16, 2021.
For the majority of purchase commitments, the Company has flexible delivery schedules depending on the market conditions, which allows the Company, to a certain extent, to delay delivery beyond originally planned delivery schedules.
Equity price riskThe shares of ASMPT, our 39.19% equity investment, are listed on the Hong Kong Stock Exchange. If the fair value of an investment is less than its carrying value at the balance sheet date, the Company determines whether the impairment is temporary or prolonged. The amount per share recognized as per December 31, 2016 under equity accounting amounts to HKD63.14, whereas the level 1 fair value per share (being the market price of a share on the Hong Kong Stock Exchange) was HKD82.15. Management concluded that, based on quantitative analysis no impairment of its share in ASMPT existed as per December 31, 2016.
AB
OU
TS
TR
AT
EG
Y &
BU
SIN
ES
SP
ER
FO
RM
AN
CE
RE
VIE
WS
HA
RE
HO
LD
ER
SG
OV
ER
NA
NC
EF
INA
NC
IAL
STA
TE
ME
NT
SASMI STATUTORY ANNUAL REPORT 2016 | NOTES TO THE CONSOLIDATED FINANCIAL STATEMENTS | 142
FIN
AN
CIA
L S
TAT
EM
EN
TS

NOTE 17. COMMITMENTS AND CONTINGENCIESAt December 31, 2016, operating leases having initial or remaining non-cancelable terms in excess of one year are as follows:
2017 6,365
2018 4,474
2019 2,196
2020 2,001
2021 1,161
Years thereafter 326
TOTAL 16,523
Operating lease obligations include leases of equipment and facilities. Lease payments recognized as an expense were €6,913 for the year ended December 31, 2016 (2015: €6,886). Per December 31, 2016, the Company had entered into purchase commitments with suppliers in the amount of €86,885 for purchases within the next 12 months. Commitments for capital expenditures and other commitments per December 31, 2016 were €10,556.
CHANGE OF CONTROL TRANSACTIONPursuant to our 1997 settlement agreement with Applied Materials, as amended and restated in 1998, if we desire to effect a change of control transaction, as defined in the settlement agreement which generally involves our operations and not our investment in ASMPT, with a competitor of Applied Materials, we must first offer the change of control transaction to Applied Materials on the same terms as we would be willing to accept from that competitor pursuant to a bona fide arm’s-length offer made by that competitor.
NOTE 18. LITIGATION ASMI is a party to various legal proceedings incidental to its business. As is the case with other companies in similar industries, the Company faces exposure from actual or potential claims and legal proceedings. Although the ultimate result of legal proceedings cannot be predicted with certainty, it is the opinion of the Company’s management that the outcome of any claim which is pending, either individually or on a combined basis, will not have a material effect on the financial position of the Company, its cash flows and result of operations.
NOTE 19. SEGMENT DISCLOSUREThe Company organizes its activities in two operating segments, Front-end and Back-end. Operating segments are reported in a manner consistent with the internal reporting provided to the Chief Executive Officer (CEO), which is the Chief Operating Decision Maker (CODM).
The Front-end segment manufactures and sells equipment used in wafer processing, encompassing the fabrication steps in which silicon wafers are layered with semiconductor devices. The segment is a product-driven organizational unit comprised of manufacturing, service, and sales operations in Europe, the United States, Japan, South Korea and Southeast Asia.
The Back-end segment manufactures and sells equipment and materials used in assembly and packaging, encompassing the processes in which silicon wafers are separated into individual circuits and subsequently assembled, packaged and tested. The segment is organized in ASM Pacific Technology Ltd, in which the Company holds a substantial share of 39.19% interest, whilst the remaining shares are listed on the Stock Exchange of Hong Kong. The segment’s main operations are located in Hong Kong, the People’s Republic of China, Singapore, Malaysia and Germany.
AB
OU
TS
TR
AT
EG
Y &
BU
SIN
ES
SP
ER
FO
RM
AN
CE
RE
VIE
WS
HA
RE
HO
LD
ER
SG
OV
ER
NA
NC
EF
INA
NC
IAL
STA
TE
ME
NT
SASMI STATUTORY ANNUAL REPORT 2016 | NOTES TO THE CONSOLIDATED FINANCIAL STATEMENTS | 143
FIN
AN
CIA
L S
TAT
EM
EN
TS
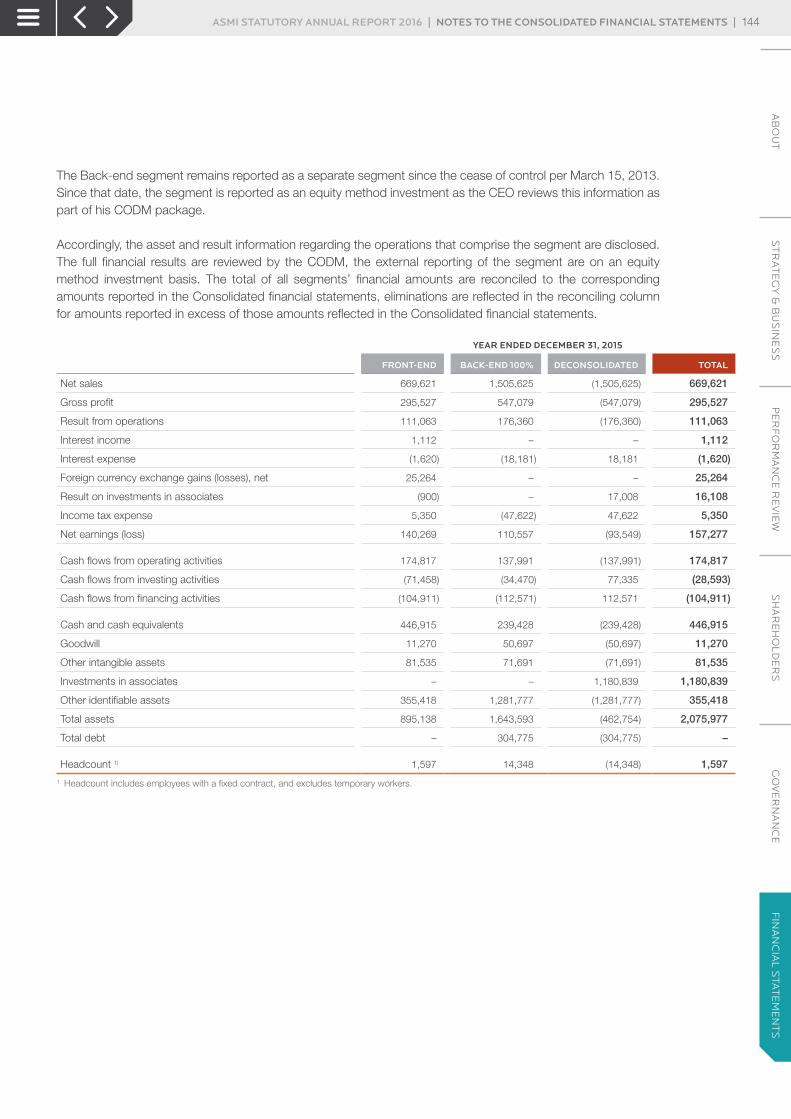
The Back-end segment remains reported as a separate segment since the cease of control per March 15, 2013. Since that date, the segment is reported as an equity method investment as the CEO reviews this information as part of his CODM package.
Accordingly, the asset and result information regarding the operations that comprise the segment are disclosed. The full financial results are reviewed by the CODM, the external reporting of the segment are on an equity method investment basis. The total of all segments’ financial amounts are reconciled to the corresponding amounts reported in the Consolidated financial statements, eliminations are reflected in the reconciling column for amounts reported in excess of those amounts reflected in the Consolidated financial statements.
YEAR ENDED DECEMBER 31, 2015
FRONT-END BACK-END 100% DECONSOLIDATED TOTAL
Net sales 669,621 1,505,625 (1,505,625) 669,621
Gross profit 295,527 547,079 (547,079) 295,527
Result from operations 111,063 176,360 (176,360) 111,063
Interest income 1,112 – – 1,112
Interest expense (1,620) (18,181) 18,181 (1,620)
Foreign currency exchange gains (losses), net 25,264 – – 25,264
Result on investments in associates (900) – 17,008 16,108
Income tax expense 5,350 (47,622) 47,622 5,350
Net earnings (loss) 140,269 110,557 (93,549) 157,277
Cash flows from operating activities 174,817 137,991 (137,991) 174,817
Cash flows from investing activities (71,458) (34,470) 77,335 (28,593)
Cash flows from financing activities (104,911) (112,571) 112,571 (104,911)
Cash and cash equivalents 446,915 239,428 (239,428) 446,915
Goodwill 11,270 50,697 (50,697) 11,270
Other intangible assets 81,535 71,691 (71,691) 81,535
Investments in associates – – 1,180,839 1,180,839
Other identifiable assets 355,418 1,281,777 (1,281,777) 355,418
Total assets 895,138 1,643,593 (462,754) 2,075,977
Total debt – 304,775 (304,775) –
Headcount 1) 1,597 14,348 (14,348) 1,597
1 Headcount includes employees with a fixed contract, and excludes temporary workers.
AB
OU
TS
TR
AT
EG
Y &
BU
SIN
ES
SP
ER
FO
RM
AN
CE
RE
VIE
WS
HA
RE
HO
LD
ER
SG
OV
ER
NA
NC
EF
INA
NC
IAL
STA
TE
ME
NT
SASMI STATUTORY ANNUAL REPORT 2016 | NOTES TO ThE CONSOLIDATED FINANCIAL STATEMENTS | 144
FIN
AN
CIA
L S
TAT
EM
EN
TS

YEAR ENDED DECEMBER 31, 2016
FRONT-END BACK-END 100% DECONSOLIDATED TOTAL
Net sales 597,930 1,666,859 (1,666,859) 597,930
Gross profit 264,500 626,717 (626,717) 264,500
Result from operations 82,241 231,794 (231,794) 82,241
Interest income 3,095 – – 3,095
Interest expense (1,096) (22,055) 22,055 (1,096)
Foreign currency exchange gains (losses), net 13,032 – – 13,032
Result on investments in associates – – 40,488 40,488
Income tax expense (2,289) (41,477) 41,477 (2,289)
Net earnings (loss) 94,983 168,262 (127,774) 135,471
Cash flows from operating activities 91,412 229,000 (229,000) 91,412
Cash flows from investing activities (60,094) (123,336) 145,419 (38,011)
Cash flows from financing activities (125,798) (65,054) 65,054 (125,798)
Cash and cash equivalents 378,157 261,629 (261,629) 378,157
Goodwill 11,270 52,359 (52,359) 11,270
Other intangible assets 100,179 69,909 (69,909) 100,179
Investments in associates – – 1,235,738 1,235,738
Other identifiable assets 422,919 1,529,060 (1,529,060) 422,919
Total assets 912,525 1,912,957 (677,219) 2,148,264
Total debt – 315,590 (315,590) –
Headcount 1) 1,670 14,360 (14,360) 1,670
1 Headcount includes employees with a fixed contract, and excludes temporary workers.
There are no inter-segment transactions, other than charges for corporate services, which are based on actual cost. The accounting policies used to measure the net earnings and total assets in each segment are consistent to those used in the Consolidated financial statements. The measurement methods used to determine reported segment earnings are consistently applied for all periods presented. There were no asymmetrical allocations to segments.
Geographical information is summarized as follows:
EUROPE
UNITED STATES OF
AMERICA JAPANSOUTH KOREA TAIWAN
OTHER ASIA CORPORATE CONSOLIDATED
Year ended December 31, 2015
Net sales 99,326 123,859 179,595 109,919 106,833 50,089 – 669,621
Property, plant and equipment 7,467 37,091 19,776 16,008 139 11,272 41 91,794
Year ended December 31, 2016
Net sales 113,833 145,119 60,219 46,789 182,808 49,162 – 597,930
Property, plant and equipment 6,957 38,648 25,239 13,210 132 10,627 191 95,004
For geographical reporting, net sales are attributed to the geographical location in which the customer’s facilities are located.
AB
OU
TS
TR
AT
EG
Y &
BU
SIN
ES
SP
ER
FO
RM
AN
CE
RE
VIE
WS
HA
RE
HO
LD
ER
SG
OV
ER
NA
NC
EF
INA
NC
IAL
STA
TE
ME
NT
SASMI STATUTORY ANNUAL REPORT 2016 | NOTES TO THE CONSOLIDATED FINANCIAL STATEMENTS | 145
FIN
AN
CIA
L S
TAT
EM
EN
TS
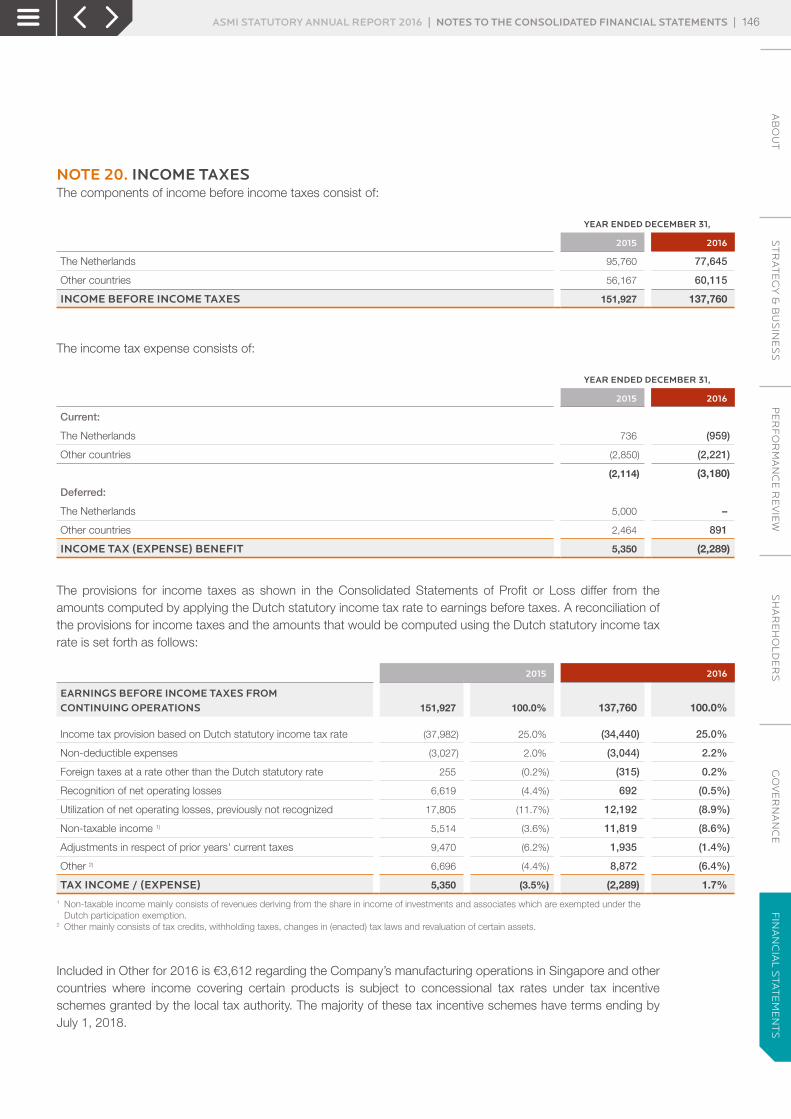
NOTE 20. INCOME TAXESThe components of income before income taxes consist of:
YEAR ENDED DECEMBER 31,
2015 2016
The Netherlands 95,760 77,645
Other countries 56,167 60,115
INCOME BEFORE INCOME TAXES 151,927 137,760
The income tax expense consists of:
YEAR ENDED DECEMBER 31,
2015 2016
Current:
The Netherlands 736 (959)
Other countries (2,850) (2,221)
(2,114) (3,180)
Deferred:
The Netherlands 5,000 –
Other countries 2,464 891
INCOME TAX (EXPENSE) BENEFIT 5,350 (2,289)
The provisions for income taxes as shown in the Consolidated Statements of Profit or Loss differ from the amounts computed by applying the Dutch statutory income tax rate to earnings before taxes. A reconciliation of the provisions for income taxes and the amounts that would be computed using the Dutch statutory income tax rate is set forth as follows:
2015 2016
EARNINGS BEFORE INCOME TAXES FROM CONTINUING OPERATIONS 151,927 100.0% 137,760 100.0%
Income tax provision based on Dutch statutory income tax rate (37,982) 25.0% (34,440) 25.0%
Non-deductible expenses (3,027) 2.0% (3,044) 2.2%
Foreign taxes at a rate other than the Dutch statutory rate 255 (0.2%) (315) 0.2%
Recognition of net operating losses 6,619 (4.4%) 692 (0.5%)
Utilization of net operating losses, previously not recognized 17,805 (11.7%) 12,192 (8.9%)
Non-taxable income 1) 5,514 (3.6%) 11,819 (8.6%)
Adjustments in respect of prior years' current taxes 9,470 (6.2%) 1,935 (1.4%)
Other 2) 6,696 (4.4%) 8,872 (6.4%)
TAX INCOME / (EXPENSE) 5,350 (3.5%) (2,289) 1.7%1 Non-taxable income mainly consists of revenues deriving from the share in income of investments and associates which are exempted under the
Dutch participation exemption.2 Other mainly consists of tax credits, withholding taxes, changes in (enacted) tax laws and revaluation of certain assets.
Included in Other for 2016 is €3,612 regarding the Company’s manufacturing operations in Singapore and other countries where income covering certain products is subject to concessional tax rates under tax incentive schemes granted by the local tax authority. The majority of these tax incentive schemes have terms ending by July 1, 2018.
AB
OU
TS
TR
AT
EG
Y &
BU
SIN
ES
SP
ER
FO
RM
AN
CE
RE
VIE
WS
HA
RE
HO
LD
ER
SG
OV
ER
NA
NC
EF
INA
NC
IAL
STA
TE
ME
NT
SASMI STATUTORY ANNUAL REPORT 2016 | NOTES TO THE CONSOLIDATED FINANCIAL STATEMENTS | 146
FIN
AN
CIA
L S
TAT
EM
EN
TS

On June 8, 2009, the Singapore Economic Development Board (EDB) granted a Pioneer Certificate to ASM Front-end Manufacturing Singapore Pte Ltd (FEMS), a principal subsidiary of the Group, to the effect that profits arising from certain manufacturing activities by FEMS of Front-end equipment will in principle be exempted from tax for a period of 10 years effective from July 1, 2008, subject to fulfillment of certain criteria during the period.
In Korea, a High Technology Tax Exemption has been granted to the effect that profits arising from certain equipment sales will in principle be partly exempted from tax in the period ending by 2016, subject to fulfillment of certain criteria during the period.
Since 2011, the Dutch statutory tax rate is 25%. Taxation for other jurisdictions is calculated at the rates prevailing in the relevant jurisdictions. The Company’s deferred tax assets and liabilities have been determined in accordance with these statutory income tax rates.
Deferred income taxes consist of the following:
JANUARY 1, 2015
CONSOLIDATED STATEMENT OF
PROFIT OR LOSS EQUITYEXCHANGE
DIFFERENCES DECEMBER 31, 2015
Deferred tax assets:
Reserves and allowances 2,109 (502) (4) 308 1,911
Depreciation 627 1,630 – 96 2,353
Recognition net operating losses – 6,619 – (74) 6,545
Other 481 230 – 43 754
DEFERRED TAX ASSETS 3,217 7,977 (4) 373 11,563
Deferred tax liabilities:
Capitalized development expenses (9,809) (607) – (866) (11,282)
Other (143) 93 – – (50)
DEFERRED TAX LIABILITIES (9,952) (514) – (866) (11,332)
NET DEFERRED INCOME TAXES (6,735) 7,463 (4) (493) 231
JANUARY 1, 2016
CONSOLIDATED STATEMENT OF
PROFIT OR LOSS EQUITYEXCHANGE
DIFFERENCES DECEMBER 31, 2016
Deferred tax assets:
Reserves and allowances 1,911 95 – 128 2,134
Depreciation 2,353 386 – 117 2,856
Recognition net operating losses 6,545 692 – 20 7,257
Other 754 925 – (7) 1,672
DEFERRED TAX ASSETS 11,563 2,098 – 258 13,919
Deferred tax liabilities:
Capitalized development expenses (11,282) (1,207) – (581) (13,070)
Other (50) – – 2 (48)
DEFERRED TAX LIABILITIES (11,332) (1,207) – (579) (13,118)
NET DEFERRED INCOME TAXES 231 891 – (321) 801
AB
OU
TS
TR
AT
EG
Y &
BU
SIN
ES
SP
ER
FO
RM
AN
CE
RE
VIE
WS
HA
RE
HO
LD
ER
SG
OV
ER
NA
NC
EF
INA
NC
IAL
STA
TE
ME
NT
SASMI STATUTORY ANNUAL REPORT 2016 | NOTES TO THE CONSOLIDATED FINANCIAL STATEMENTS | 147
FIN
AN
CIA
L S
TAT
EM
EN
TS

Based on tax filings, ASMI and its individual subsidiaries have net operating losses available at December 31, 2016 of €129,045 to reduce future income taxes, mainly in Europe. The Company believes that realization of its net deferred tax assets is dependent on the ability of the Company to generate taxable income in the future. Given the volatile nature of the semiconductor equipment industry, past experience, and the tax jurisdictions where the Company has net operating losses, the Company believes that there is currently sufficient evidence to recognize a deferred tax asset in the amount of €13,919. Deferred tax assets for temporary differences are recognized in Japan and South Korea.
The amounts and expiration dates of the net operating losses for tax purposes are as follows:
EXPIRATION YEAR
TOTAL OF NET OPERATING LOSSES FOR TAX PURPOSES
NET OPERATING LOSSES FOR TAX
PURPOSES THE NETHERLANDS
NET OPERATING LOSSES FOR TAX
PURPOSES OTHER COUNTRIES
2019 17,499 17,499 –
2020 202 – 202
2021 58,478 58,478 –
2022 26,815 26,815 –
2023 16 – 16
2025 9,328 – 9,328
2029 8,189 – 8,189
2030 4,944 – 4,944
2035 3,574 – 3,574
TOTAL 129,045 102,792 26,253
The Company has not provided for deferred foreign withholding taxes, if any, on undistributed earnings of its foreign subsidiaries. At December 31, 2016, the undistributed earnings of subsidiaries, subject to withholding taxes, were approximately €13,155. These earnings could become subject to foreign withholding taxes if they were remitted as dividends and/or if the Company should sell its interest in the subsidiaries.
A summary of open tax years by major jurisdiction is as follows:
JURISDICTION
Japan 2011-2016
The Netherlands 2013-2016
Singapore 2013-2016
United States of America 1997-2016
South Korea 2011-2016
The calculation of the Company’s tax liabilities involves dealing with uncertainties in the application of complex tax laws. The Company’s estimate for the potential outcome of any unrecognized tax benefits is highly judgmental. Settlement of unrecognized tax benefits in a manner inconsistent with the Company’s expectations could have a material impact on the Company’s financial position, net earnings and cash flows. The Company is subject to tax audits in its major tax jurisdictions, and local tax authorities may challenge the positions taken by the Company.
AB
OU
TS
TR
AT
EG
Y &
BU
SIN
ES
SP
ER
FO
RM
AN
CE
RE
VIE
WS
HA
RE
HO
LD
ER
SG
OV
ER
NA
NC
EF
INA
NC
IAL
STA
TE
ME
NT
SASMI STATUTORY ANNUAL REPORT 2016 | NOTES TO THE CONSOLIDATED FINANCIAL STATEMENTS | 148
FIN
AN
CIA
L S
TAT
EM
EN
TS
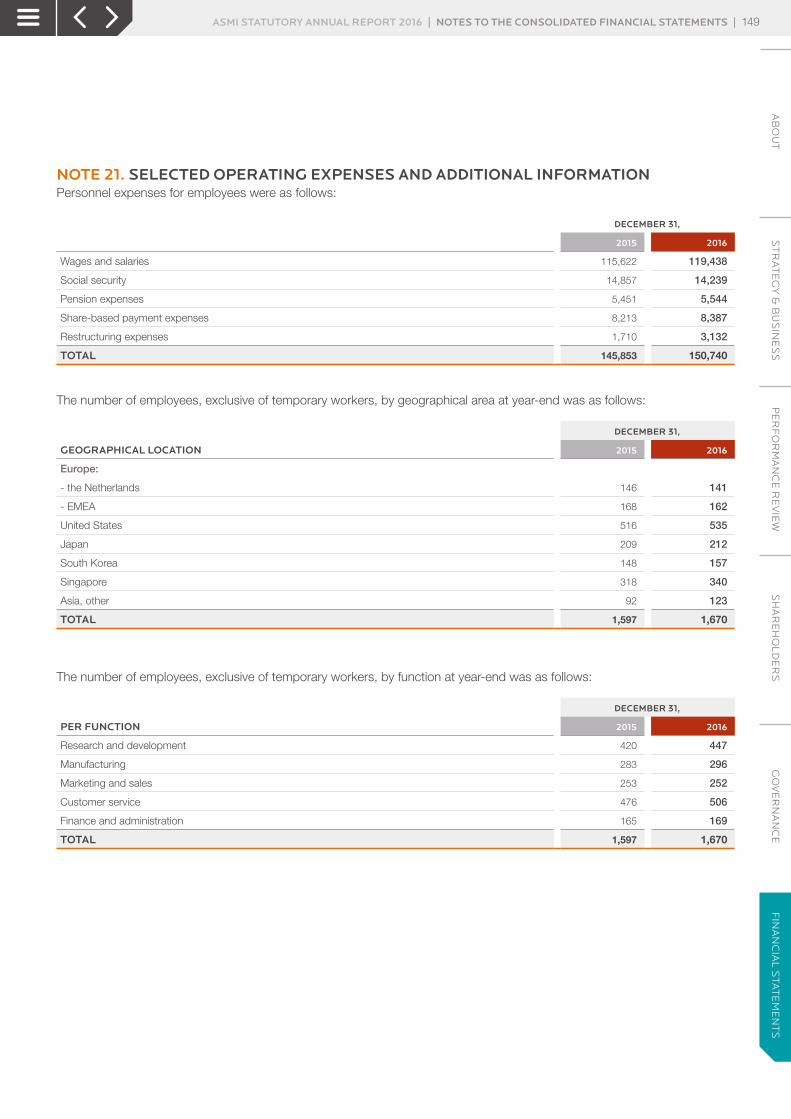
NOTE 21. SELECTED OPERATING EXPENSES AND ADDITIONAL INFORMATIONPersonnel expenses for employees were as follows:
DECEMBER 31,
2015 2016
Wages and salaries 115,622 119,438
Social security 14,857 14,239
Pension expenses 5,451 5,544
Share-based payment expenses 8,213 8,387
Restructuring expenses 1,710 3,132
TOTAL 145,853 150,740
The number of employees, exclusive of temporary workers, by geographical area at year-end was as follows:
DECEMBER 31,
GEOGRAPHICAL LOCATION 2015 2016
Europe:
- the Netherlands 146 141
- EMEA 168 162
United States 516 535
Japan 209 212
South Korea 148 157
Singapore 318 340
Asia, other 92 123
TOTAL 1,597 1,670
The number of employees, exclusive of temporary workers, by function at year-end was as follows:
DECEMBER 31,
PER FUNCTION 2015 2016
Research and development 420 447
Manufacturing 283 296
Marketing and sales 253 252
Customer service 476 506
Finance and administration 165 169
TOTAL 1,597 1,670
AB
OU
TS
TR
AT
EG
Y &
BU
SIN
ES
SP
ER
FO
RM
AN
CE
RE
VIE
WS
HA
RE
HO
LD
ER
SG
OV
ER
NA
NC
EF
INA
NC
IAL
STA
TE
ME
NT
SASMI STATUTORY ANNUAL REPORT 2016 | NOTES TO THE CONSOLIDATED FINANCIAL STATEMENTS | 149
FIN
AN
CIA
L S
TAT
EM
EN
TS

NOTE 22. RESEARCH AND DEVELOPMENTResearch and development consists of the following:
YEAR ENDED DECEMBER 31,
2015 2016
Research and development expenses, net of capitalized development expenses 62,772 75,052
Amortization of capitalized development expenses 11,794 13,345
Research and development grants and credits (985) (843)
TOTAL RESEARCH AND DEVELOPMENT EXPENSES 73,581 87,554
Impairment of research and development related assets 16,154 3,575
TOTAL 89,735 91,129
The impairment of capitalized development expenses in 2015 are primarily related to development of new hardware for which the customers demand has shifted out in time, and purchased technology which became obsolete. Of the impairment of capitalized development expenses an amount of €13.4 million related to the 450mm development. The impairment expenses in 2016 related to a customer specific project.
The Company’s operations in the Netherlands, Belgium and the United States receive research and development grants and credits from various sources.
NOTE 23. EARNINGS PER SHAREBasic net earnings per common share is calculated by dividing net income attributable to common shareholders by the weighted average number of common shares outstanding for that period. The dilutive effect is calculated using the treasury stock method. The calculation of diluted net income per share assumes the exercise of options issued under our stock option plans (and the issuance of shares under our share plans) for periods in which exercises (or issuances) would have a dilutive effect. The calculation of diluted net income per share does not assume exercise of options (or issuance of shares) when such exercises (or issuances) would be anti-dilutive.
The calculation of basic and diluted net income per share attributable to common shareholders is based on the following data:
DECEMBER 31,
2015 2016
Net earnings used for purposes of calculating net income per common share
NET EARNINGS FROM OPERATIONS 157,277 135,471
Basic weighted average number of shares outstanding during the year (thousands) 62,114 60,616
Effect of dilutive potential common shares from stock options and restricted shares 814 637
DILUTIVE WEIGHTED AVERAGE NUMBER OF SHARES OUTSTANDING 62,928 61,253
Basic net earnings per share:
from operations 2.53 2.23
Diluted net earnings per share:
from operations 2.50 2.21
AB
OU
TS
TR
AT
EG
Y &
BU
SIN
ES
SP
ER
FO
RM
AN
CE
RE
VIE
WS
HA
RE
HO
LD
ER
SG
OV
ER
NA
NC
EF
INA
NC
IAL
STA
TE
ME
NT
SASMI STATUTORY ANNUAL REPORT 2016 | NOTES TO THE CONSOLIDATED FINANCIAL STATEMENTS | 150
FIN
AN
CIA
L S
TAT
EM
EN
TS
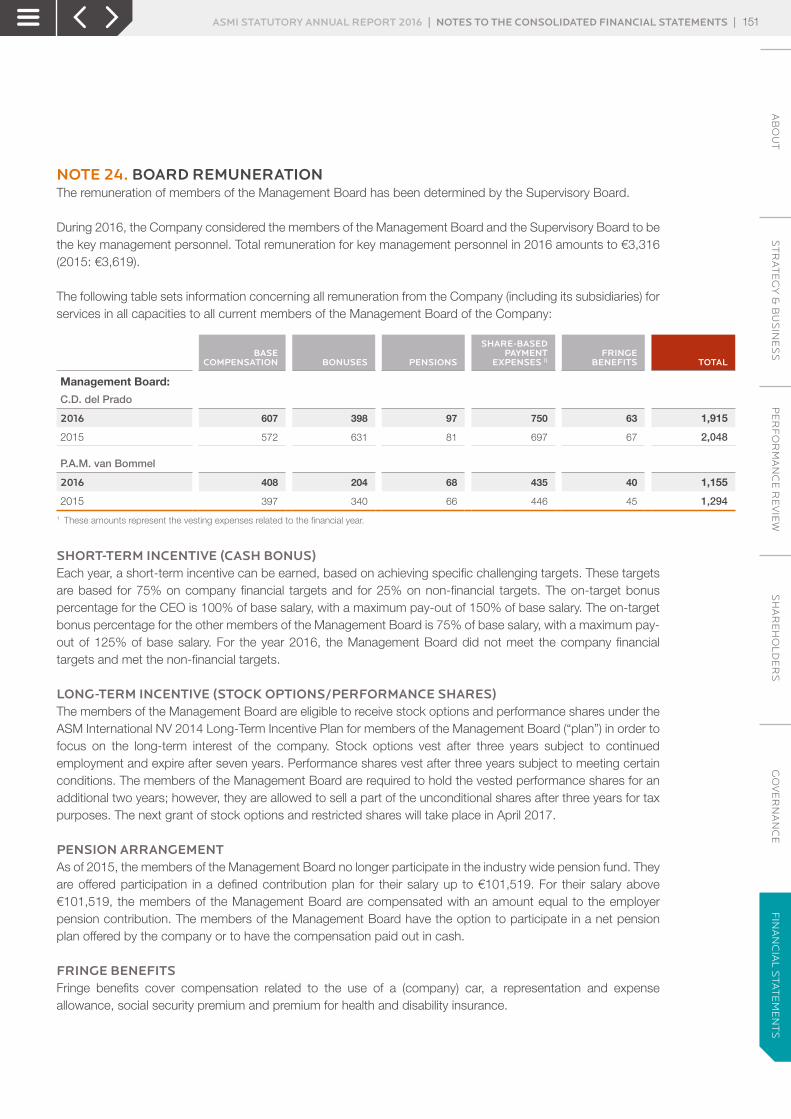
NOTE 24. BOARD REMUNERATION The remuneration of members of the Management Board has been determined by the Supervisory Board.
During 2016, the Company considered the members of the Management Board and the Supervisory Board to be the key management personnel. Total remuneration for key management personnel in 2016 amounts to €3,316 (2015: €3,619).
The following table sets information concerning all remuneration from the Company (including its subsidiaries) for services in all capacities to all current members of the Management Board of the Company:
BASE
COMPENSATION BONUSES PENSIONS
SHARE-BASED PAYMENT
EXPENSES 1)FRINGE
BENEFITS TOTAL
Management Board:
C.D. del Prado
2016 607 398 97 750 63 1,915
2015 572 631 81 697 67 2,048
P.A.M. van Bommel
2016 408 204 68 435 40 1,155
2015 397 340 66 446 45 1,294
1 These amounts represent the vesting expenses related to the financial year.
SHORT-TERM INCENTIVE (CASH BONUS)Each year, a short-term incentive can be earned, based on achieving specific challenging targets. These targets are based for 75% on company financial targets and for 25% on non-financial targets. The on-target bonus percentage for the CEO is 100% of base salary, with a maximum pay-out of 150% of base salary. The on-target bonus percentage for the other members of the Management Board is 75% of base salary, with a maximum pay-out of 125% of base salary. For the year 2016, the Management Board did not meet the company financial targets and met the non-financial targets.
LONG-TERM INCENTIVE (STOCK OPTIONS/PERFORMANCE SHARES)The members of the Management Board are eligible to receive stock options and performance shares under the ASM International NV 2014 Long-Term Incentive Plan for members of the Management Board (“plan”) in order to focus on the long-term interest of the company. Stock options vest after three years subject to continued employment and expire after seven years. Performance shares vest after three years subject to meeting certain conditions. The members of the Management Board are required to hold the vested performance shares for an additional two years; however, they are allowed to sell a part of the unconditional shares after three years for tax purposes. The next grant of stock options and restricted shares will take place in April 2017.
PENSION ARRANGEMENTAs of 2015, the members of the Management Board no longer participate in the industry wide pension fund. They are offered participation in a defined contribution plan for their salary up to €101,519. For their salary above €101,519, the members of the Management Board are compensated with an amount equal to the employer pension contribution. The members of the Management Board have the option to participate in a net pension plan offered by the company or to have the compensation paid out in cash.
FRINGE BENEFITSFringe benefits cover compensation related to the use of a (company) car, a representation and expense allowance, social security premium and premium for health and disability insurance.
AB
OU
TS
TR
AT
EG
Y &
BU
SIN
ES
SP
ER
FO
RM
AN
CE
RE
VIE
WS
HA
RE
HO
LD
ER
SG
OV
ER
NA
NC
EF
INA
NC
IAL
STA
TE
ME
NT
SASMI STATUTORY ANNUAL REPORT 2016 | NOTES TO THE CONSOLIDATED FINANCIAL STATEMENTS | 151
FIN
AN
CIA
L S
TAT
EM
EN
TS

OUTSTANDING OPTIONSThe following table shows the outstanding options to purchase ASM International NV common shares held by current members of the Management Board, and changes in such holdings during 2016:
YEAR OF
GRANTOUTSTANDING
JANUARY 1, 2016GRANTED
IN 2016EXERCISED
IN 2016 4)OUTSTANDING
DECEMBER 31, 2016EXERCISE
PRICE END DATE
C.D. del Prado 1) 2008 147,416 – (147,416) – €10.78 Mar 1, 2016
C.D. del Prado 2) 2009 58,967 – – 58,967 €12.79 Nov 30, 2017
C.D. del Prado 3) 2011 88,450 – – 88,450 €18.93 Dec 31, 2018
C.D. del Prado 3) 2012 70,760 – 70,760 €22.93 Dec 31, 2019
C.D. del Prado 3) 2013 75,000 – – 75,000 €23.73 Dec 31, 2020
C.D. del Prado 3) 2015 28,050 – – 28,050 €44.24 Apr 24, 2022
C.D. del Prado 3) 2016 – 41,589 – 41,589 €37.09 Apr 22, 2023
P.A.M. van Bommel 3) 2010 29,483 – – 29,483 €13.80 July 1, 2017
P.A.M. van Bommel 3) 2011 62,504 – – 62,504 €18.93 Dec 31, 2018
P.A.M. van Bommel 3) 2012 47,173 – – 47,173 €22.93 Dec 31, 2019
P.A.M. van Bommel 3) 2013 53,000 – – 53,000 €23.73 Dec 31, 2020
P.A.M. van Bommel 3) 2015 14,609 – – 14,609 €44.24 Apr 24, 2022
P.A.M. van Bommel 3) 2016 – 20,966 – 20,966 €37.09 Apr 22, 2023
TOTAL 675,412 62,555 (147,416) 590,5511 The vesting of these options was conditional. A percentage, not exceeding 150%, of the options which have been granted conditionally became
unconditional after three years, based on the total return of the Company’s shares for the three years after the options are granted compared to the average total return of the shares of a relevant number of companies which are similar to the Company during the same three-year period. The options are granted for a term of eight years.
2 Options are granted for a term of eight years, and become exercisable after a three year vesting period.3 Options are granted for a term of seven years and become exercisable after a three year vesting period.4 Options were exercised on February 26, 2016 at a share price of €37.64.
The fair value of options granted to current members of the Management Board was €12.64 in 2016.
In 2016, 147,416 options to purchase ASM International NV common shares were exercised and 147,416 treasury shares were sold for the exercise of these options.
OUTSTANDING PERFORMANCE SHARESThe following table shows the outstanding performance shares granted to members of the Management Board in 2016 and held by members of the Management Board per December 31, 2016:
GRANT DATE STATUS
NUMBER OF SHARES AT
GRANT DATEFAIR VALUE AT
GRANT DATE VESTING DATE
C.D. del Prado April 24, 2015 Conditional 8,544 €43.21 April 24, 2018
P.A.M. van Bommel April 24, 2015 Conditional 4,450 €43.21 April 24, 2018
C.D. del Prado April 22, 2016 Conditional 11,070 €34.67 April 22, 2019
P.A.M. van Bommel April 22, 2016 Conditional 5,581 €34.67 April 22, 2019
The shares will become unconditional after three years, depending on the achievement of predetermined targets. The financial targets to be achieved are measured over a three-year performance period and relate to a sales growth compared to market and an average EBIT percentage performance measure. The Management Board members will hold the unconditional shares for at least an additional two years; however, they are allowed to sell a part of the unconditional shares after three years for tax purposes.
AB
OU
TS
TR
AT
EG
Y &
BU
SIN
ES
SP
ER
FO
RM
AN
CE
RE
VIE
WS
HA
RE
HO
LD
ER
SG
OV
ER
NA
NC
EF
INA
NC
IAL
STA
TE
ME
NT
SASMI STATUTORY ANNUAL REPORT 2016 | NOTES TO THE CONSOLIDATED FINANCIAL STATEMENTS | 152
FIN
AN
CIA
L S
TAT
EM
EN
TS

The following table sets forth information concerning all remuneration (base compensation, no bonuses or pensions were paid) from the Company (including its subsidiaries) for services in all capacities to all current and former members of the Supervisory Board of the Company:
YEAR ENDED DECEMBER 31,
2015 2016
Supervisory Board:
J.C. Lobbezoo 70 70
J.M.R. Danneels 1) 50 20
H.W. Kreutzer 53 53
M.C.J. van Pernis 53 53
U.H.R. Schumacher 50 50
TOTAL 275 2451 Period January 1 to May 25, 2016
The remuneration of members of the Supervisory Board has been determined by the General Meeting of Shareholders.
No stock options or performance shares have been granted to members of the Supervisory Board.
NOTE 25. SHARE OWNERSHIP AND RELATED PARTY TRANSACTIONSThe ownership or controlling interest of outstanding common shares of ASM International NV by members of the Management Board and Supervisory Board or members of their immediate family are as follows:
DECEMBER 31, 2015 DECEMBER 31, 2016
SHARES OWNED
PERCENTAGE OF COMMON SHARES
OUTSTANDINGSHARES OWNED
PERCENTAGE OF COMMON SHARES
OUTSTANDING
A.H. del Prado 9,204,284 14.92% – –
C.D. del Prado (member of the Management Board) 132,945 0.22% 896,437 1.50%
Stichting Administratiekantoor ASMI 2,142,039 3.47% – –
Stichting Administratiekantoor ASMI is a trust that was controlled by Mr A.H. del Prado. The number of shares owned by Stichting Administratiekantoor ASMI included 713,000 common shares which were beneficially owned by Mr C.D. del Prado.
The Company has a related party relationship with its subsidiaries, equity accounted investees and members of the Supervisory Board and the Management Board. Related party transactions, if any, are conducted on an at arm’s length basis with terms comparable to transactions with third parties.
AB
OU
TS
TR
AT
EG
Y &
BU
SIN
ES
SP
ER
FO
RM
AN
CE
RE
VIE
WS
HA
RE
HO
LD
ER
SG
OV
ER
NA
NC
EF
INA
NC
IAL
STA
TE
ME
NT
SASMI STATUTORY ANNUAL REPORT 2016 | NOTES TO THE CONSOLIDATED FINANCIAL STATEMENTS | 153
FIN
AN
CIA
L S
TAT
EM
EN
TS
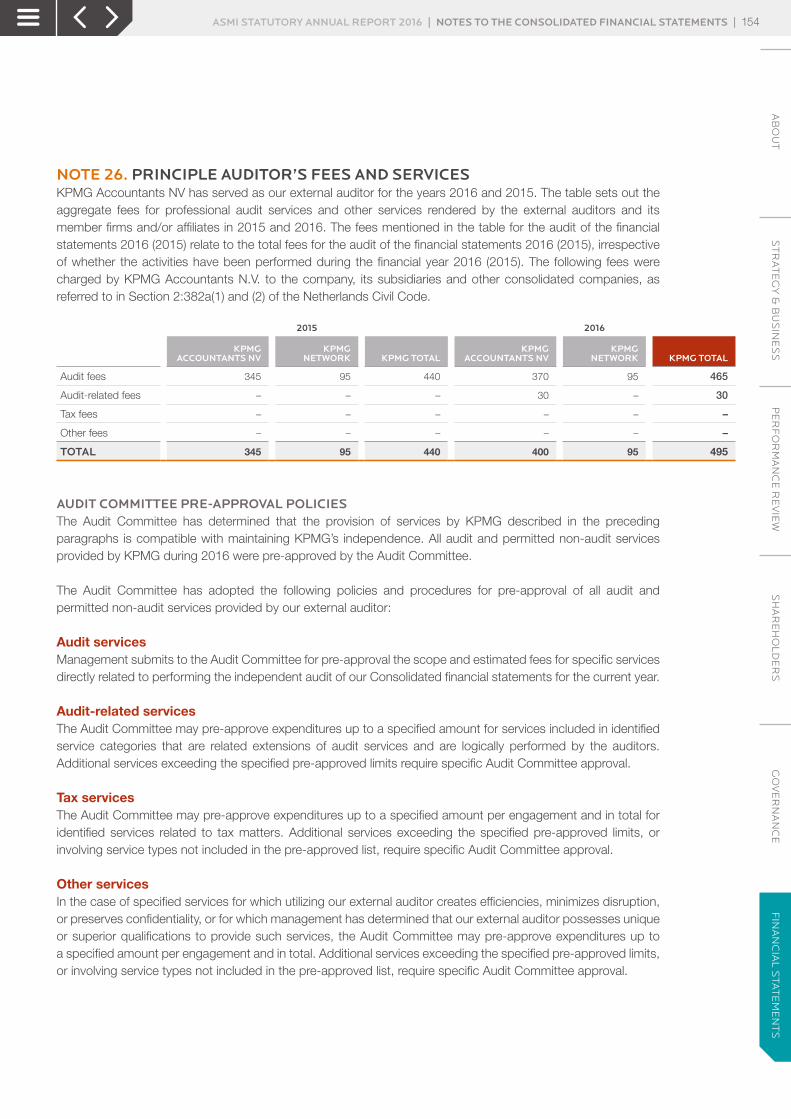
NOTE 26. PRINCIPLE AUDITOR’S FEES AND SERVICESKPMG Accountants NV has served as our external auditor for the years 2016 and 2015. The table sets out the aggregate fees for professional audit services and other services rendered by the external auditors and its member firms and/or affiliates in 2015 and 2016. The fees mentioned in the table for the audit of the financial statements 2016 (2015) relate to the total fees for the audit of the financial statements 2016 (2015), irrespective of whether the activities have been performed during the financial year 2016 (2015). The following fees were charged by KPMG Accountants N.V. to the company, its subsidiaries and other consolidated companies, as referred to in Section 2:382a(1) and (2) of the Netherlands Civil Code.
2015 2016
KPMG
ACCOUNTANTS NVKPMG
NETWORK KPMG TOTALKPMG
ACCOUNTANTS NVKPMG
NETWORK KPMG TOTAL
Audit fees 345 95 440 370 95 465
Audit-related fees – – – 30 – 30
Tax fees – – – – – –
Other fees – – – – – –
TOTAL 345 95 440 400 95 495
AUDIT COMMITTEE PRE-APPROVAL POLICIESThe Audit Committee has determined that the provision of services by KPMG described in the preceding paragraphs is compatible with maintaining KPMG’s independence. All audit and permitted non-audit services provided by KPMG during 2016 were pre-approved by the Audit Committee.
The Audit Committee has adopted the following policies and procedures for pre-approval of all audit and permitted non-audit services provided by our external auditor:
Audit servicesManagement submits to the Audit Committee for pre-approval the scope and estimated fees for specific services directly related to performing the independent audit of our Consolidated financial statements for the current year.
Audit-related servicesThe Audit Committee may pre-approve expenditures up to a specified amount for services included in identified service categories that are related extensions of audit services and are logically performed by the auditors. Additional services exceeding the specified pre-approved limits require specific Audit Committee approval.
Tax servicesThe Audit Committee may pre-approve expenditures up to a specified amount per engagement and in total for identified services related to tax matters. Additional services exceeding the specified pre-approved limits, or involving service types not included in the pre-approved list, require specific Audit Committee approval.
Other servicesIn the case of specified services for which utilizing our external auditor creates efficiencies, minimizes disruption, or preserves confidentiality, or for which management has determined that our external auditor possesses unique or superior qualifications to provide such services, the Audit Committee may pre-approve expenditures up to a specified amount per engagement and in total. Additional services exceeding the specified pre-approved limits, or involving service types not included in the pre-approved list, require specific Audit Committee approval.
AB
OU
TS
TR
AT
EG
Y &
BU
SIN
ES
SP
ER
FO
RM
AN
CE
RE
VIE
WS
HA
RE
HO
LD
ER
SG
OV
ER
NA
NC
EF
INA
NC
IAL
STA
TE
ME
NT
SASMI STATUTORY ANNUAL REPORT 2016 | NOTES TO THE CONSOLIDATED FINANCIAL STATEMENTS | 154
FIN
AN
CIA
L S
TAT
EM
EN
TS
NOTE 27. SUBSEQUENT EVENTSSubsequent events were evaluated up to March 9, 2017, which is the issuance date of this Statutory annual report 2016. There are no subsequent events to report.
SIGNINGAlmere
March 9, 2017
SUPERVISORY BOARDJ.C. LobbezooH.W. KreutzerM.C.J. van PernisU.H.R. Schumacher
MANAGEMENT BOARDC.D. del PradoP.A.M. van Bommel
AB
OU
TS
TR
AT
EG
Y &
BU
SIN
ES
SP
ER
FO
RM
AN
CE
RE
VIE
WS
HA
RE
HO
LD
ER
SG
OV
ER
NA
NC
EF
INA
NC
IAL
STA
TE
ME
NT
SASMI STATUTORY ANNUAL REPORT 2016 | NOTES TO THE CONSOLIDATED FINANCIAL STATEMENTS | 155
FIN
AN
CIA
L S
TAT
EM
EN
TS

COMPANY BALANCE SHEET
(before proposed appropriation of net earnings for the year)
DECEMBER 31,
(EUR thousand except per share data) NOTES 2015 2016
Non-current assets
Property, plant and equipment, net 5 41 191
Goodwill, net 4 11,270 11,270
Other intangible assets, net 3 8,628 13,584
Investments in subsidiaries 2 1,684,752 1,823,526
Loans to subsidiaries 2 48,958 50,565
Other non-current assets – 809
Deferred tax assets 6 5,000 5,000
TOTAL NON-CURRENT ASSETS 1,758,649 1,904,945
Current assets
Accounts receivable, net – –
Amounts due from subsidiaries 6,692 6,196
Other current assets 297 755
Cash and cash equivalents 189,234 111,984
TOTAL CURRENT ASSETS 196,223 118,935
TOTAL ASSETS 1,954,872 2,023,880
Equity
Common shares 2,553 2,553
Capital in excess of par value 221,868 225,837
Treasury shares (84,000) (151,477)
Legal reserves
Translation reserve 192,081 231,468
Other legal reserves 1,228,688 1,291,444
Accumulated net earnings 229,912 280,560
Net earnings current year 157,277 135,471
TOTAL EQUITY 7 1,948,379 2,015,856
Current liabilities
Amounts due to subsidiaries 654 2,104
Accrued expenses and other payables 8 5,665 5,743
Taxes and social securities 174 177
TOTAL CURRENT LIABILITIES 6,493 8,024
TOTAL EQUITY AND LIABILITIES 1,954,872 2,023,880
ASM International NV financial statements
AB
OU
TS
TR
AT
EG
Y &
BU
SIN
ES
SP
ER
FO
RM
AN
CE
RE
VIE
WS
HA
RE
HO
LD
ER
SG
OV
ER
NA
NC
EF
INA
NC
IAL
STA
TE
ME
NT
SASMI STATUTORY ANNUAL REPORT 2016 | COMPANY BALANCE SHEET | 156
FIN
AN
CIA
L S
TAT
EM
EN
TS
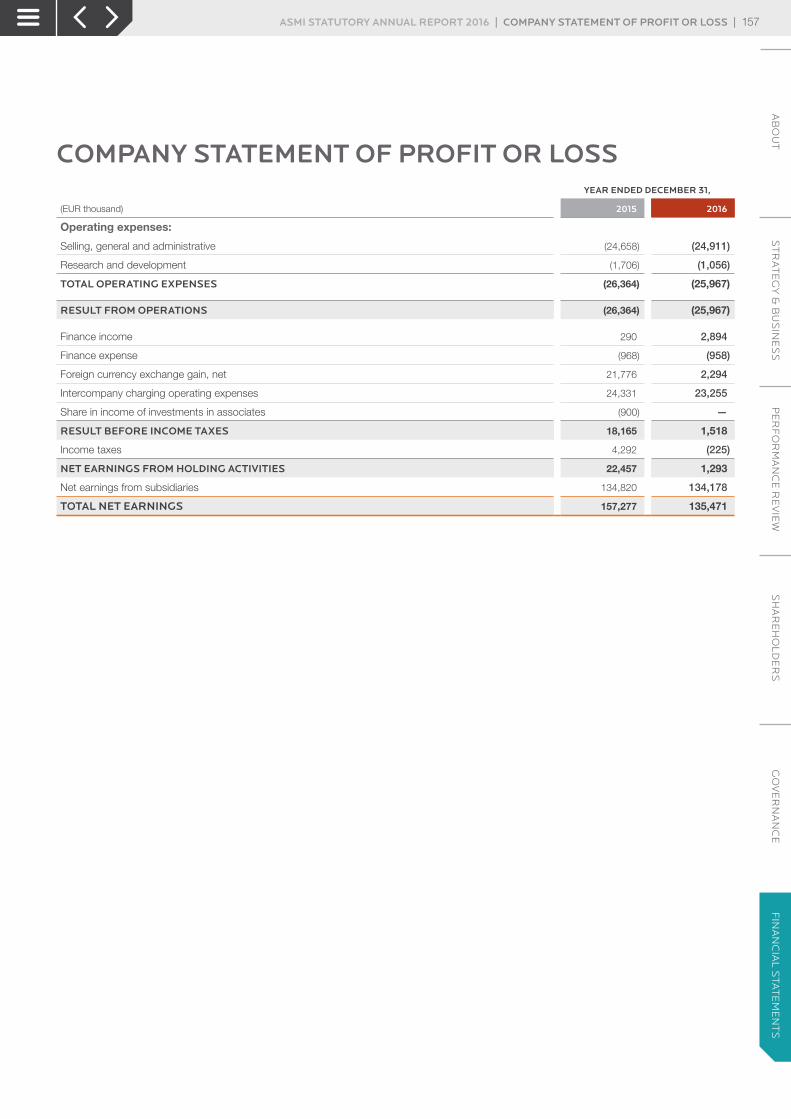
COMPANY STATEMENT OF PROFIT OR LOSSYEAR ENDED DECEMBER 31,
(EUR thousand) 2015 2016
Operating expenses:
Selling, general and administrative (24,658) (24,911)
Research and development (1,706) (1,056)
TOTAL OPERATING EXPENSES (26,364) (25,967)
RESULT FROM OPERATIONS (26,364) (25,967)
Finance income 290 2,894
Finance expense (968) (958)
Foreign currency exchange gain, net 21,776 2,294
Intercompany charging operating expenses 24,331 23,255
Share in income of investments in associates (900) —
RESULT BEFORE INCOME TAXES 18,165 1,518
Income taxes 4,292 (225)
NET EARNINGS FROM HOLDING ACTIVITIES 22,457 1,293
Net earnings from subsidiaries 134,820 134,178
TOTAL NET EARNINGS 157,277 135,471
AB
OU
TS
TR
AT
EG
Y &
BU
SIN
ES
SP
ER
FO
RM
AN
CE
RE
VIE
WS
HA
RE
HO
LD
ER
SG
OV
ER
NA
NC
EF
INA
NC
IAL
STA
TE
ME
NT
SASMI STATUTORY ANNUAL REPORT 2016 | COMPANY STATEMENT OF PROFIT OR LOSS | 157
FIN
AN
CIA
L S
TAT
EM
EN
TS
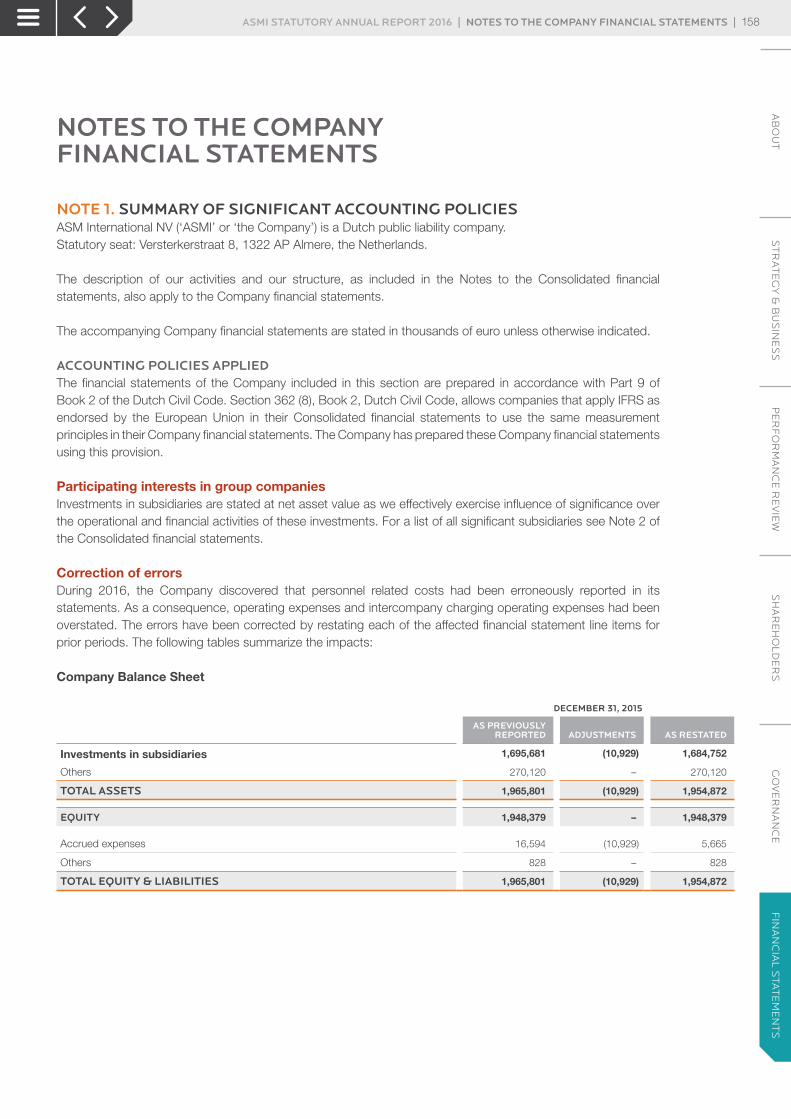
NOTES TO THE COMPANY FINANCIAL STATEMENTS
NOTE 1. SUMMARY OF SIGNIFICANT ACCOUNTING POLICIESASM International NV (‘ASMI’ or ‘the Company’) is a Dutch public liability company. Statutory seat: Versterkerstraat 8, 1322 AP Almere, the Netherlands.
The description of our activities and our structure, as included in the Notes to the Consolidated financial statements, also apply to the Company financial statements.
The accompanying Company financial statements are stated in thousands of euro unless otherwise indicated.
ACCOUNTING POLICIES APPLIEDThe financial statements of the Company included in this section are prepared in accordance with Part 9 of Book 2 of the Dutch Civil Code. Section 362 (8), Book 2, Dutch Civil Code, allows companies that apply IFRS as endorsed by the European Union in their Consolidated financial statements to use the same measurement principles in their Company financial statements. The Company has prepared these Company financial statements using this provision.
Participating interests in group companiesInvestments in subsidiaries are stated at net asset value as we effectively exercise influence of significance over the operational and financial activities of these investments. For a list of all significant subsidiaries see Note 2 of the Consolidated financial statements.
Correction of errorsDuring 2016, the Company discovered that personnel related costs had been erroneously reported in its statements. As a consequence, operating expenses and intercompany charging operating expenses had been overstated. The errors have been corrected by restating each of the affected financial statement line items for prior periods. The following tables summarize the impacts:
Company Balance Sheet
DECEMBER 31, 2015
AS PREVIOUSLYREPORTED ADJUSTMENTS AS RESTATED
Investments in subsidiaries 1,695,681 (10,929) 1,684,752
Others 270,120 – 270,120
TOTAL ASSETS 1,965,801 (10,929) 1,954,872
EQUITY 1,948,379 – 1,948,379
Accrued expenses 16,594 (10,929) 5,665
Others 828 – 828
TOTAL EQUITY & LIABILITIES 1,965,801 (10,929) 1,954,872
AB
OU
TS
TR
AT
EG
Y &
BU
SIN
ES
SP
ER
FO
RM
AN
CE
RE
VIE
WS
HA
RE
HO
LD
ER
SG
OV
ER
NA
NC
EF
INA
NC
IAL
STA
TE
ME
NT
SASMI STATUTORY ANNUAL REPORT 2016 | NOTES TO THE COMPANY FINANCIAL STATEMENTS | 158
FIN
AN
CIA
L S
TAT
EM
EN
TS
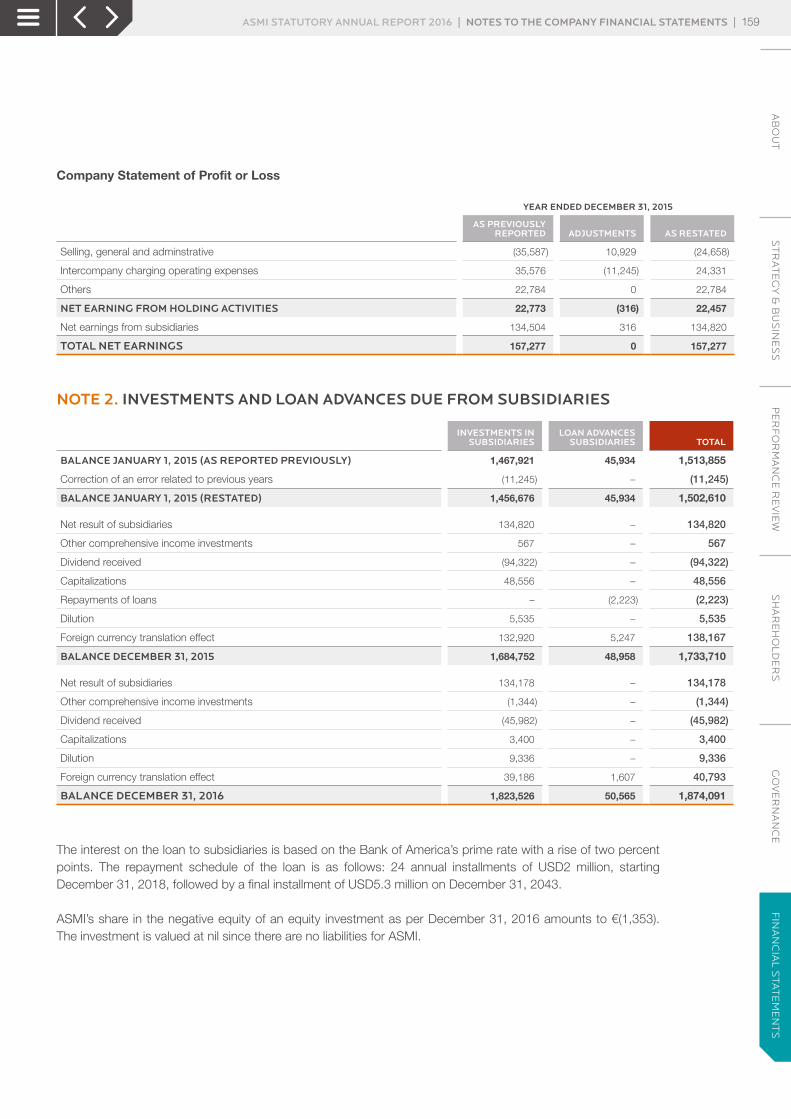
Company Statement of Profit or Loss
YEAR ENDED DECEMBER 31, 2015
AS PREVIOUSLYREPORTED ADJUSTMENTS AS RESTATED
Selling, general and adminstrative (35,587) 10,929 (24,658)
Intercompany charging operating expenses 35,576 (11,245) 24,331
Others 22,784 0 22,784
NET EARNING FROM HOLDING ACTIVITIES 22,773 (316) 22,457
Net earnings from subsidiaries 134,504 316 134,820
TOTAL NET EARNINGS 157,277 0 157,277
NOTE 2. INVESTMENTS AND LOAN ADVANCES DUE FROM SUBSIDIARIES
INVESTMENTS IN SUBSIDIARIES
LOAN ADVANCES SUBSIDIARIES TOTAL
BALANCE JANUARY 1, 2015 (AS REPORTED PREVIOUSLY) 1,467,921 45,934 1,513,855
Correction of an error related to previous years (11,245) – (11,245)
BALANCE JANUARY 1, 2015 (RESTATED) 1,456,676 45,934 1,502,610
Net result of subsidiaries 134,820 – 134,820
Other comprehensive income investments 567 – 567
Dividend received (94,322) – (94,322)
Capitalizations 48,556 – 48,556
Repayments of loans – (2,223) (2,223)
Dilution 5,535 – 5,535
Foreign currency translation effect 132,920 5,247 138,167
BALANCE DECEMBER 31, 2015 1,684,752 48,958 1,733,710
Net result of subsidiaries 134,178 – 134,178
Other comprehensive income investments (1,344) – (1,344)
Dividend received (45,982) – (45,982)
Capitalizations 3,400 – 3,400
Dilution 9,336 – 9,336
Foreign currency translation effect 39,186 1,607 40,793
BALANCE DECEMBER 31, 2016 1,823,526 50,565 1,874,091
The interest on the loan to subsidiaries is based on the Bank of America’s prime rate with a rise of two percent points. The repayment schedule of the loan is as follows: 24 annual installments of USD2 million, starting December 31, 2018, followed by a final installment of USD5.3 million on December 31, 2043.
ASMI’s share in the negative equity of an equity investment as per December 31, 2016 amounts to €(1,353). The investment is valued at nil since there are no liabilities for ASMI.
AB
OU
TS
TR
AT
EG
Y &
BU
SIN
ES
SP
ER
FO
RM
AN
CE
RE
VIE
WS
HA
RE
HO
LD
ER
SG
OV
ER
NA
NC
EF
INA
NC
IAL
STA
TE
ME
NT
SASMI STATUTORY ANNUAL REPORT 2016 | NOTES TO THE COMPANY FINANCIAL STATEMENTS | 159
FIN
AN
CIA
L S
TAT
EM
EN
TS
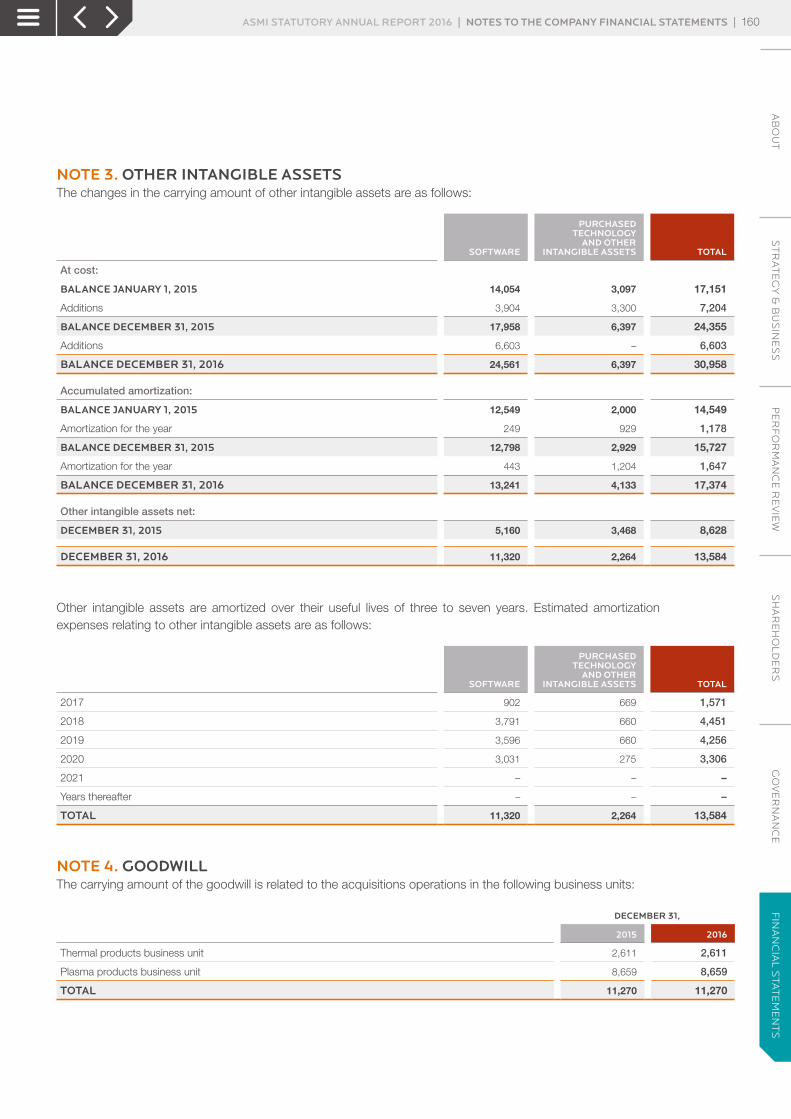
NOTE 3. OTHER INTANGIBLE ASSETSThe changes in the carrying amount of other intangible assets are as follows:
SOFTWARE
PURCHASED TECHNOLOGY
AND OTHER INTANGIBLE ASSETS TOTAL
At cost:
BALANCE JANUARY 1, 2015 14,054 3,097 17,151
Additions 3,904 3,300 7,204
BALANCE DECEMBER 31, 2015 17,958 6,397 24,355
Additions 6,603 – 6,603
BALANCE DECEMBER 31, 2016 24,561 6,397 30,958
Accumulated amortization:
BALANCE JANUARY 1, 2015 12,549 2,000 14,549
Amortization for the year 249 929 1,178
BALANCE DECEMBER 31, 2015 12,798 2,929 15,727
Amortization for the year 443 1,204 1,647
BALANCE DECEMBER 31, 2016 13,241 4,133 17,374
Other intangible assets net:
DECEMBER 31, 2015 5,160 3,468 8,628
DECEMBER 31, 2016 11,320 2,264 13,584
Other intangible assets are amortized over their useful lives of three to seven years. Estimated amortization expenses relating to other intangible assets are as follows:
SOFTWARE
PURCHASED TECHNOLOGY
AND OTHER INTANGIBLE ASSETS TOTAL
2017 902 669 1,571
2018 3,791 660 4,451
2019 3,596 660 4,256
2020 3,031 275 3,306
2021 – – –
Years thereafter – – –
TOTAL 11,320 2,264 13,584
NOTE 4. GOODWILLThe carrying amount of the goodwill is related to the acquisitions operations in the following business units:
DECEMBER 31,
2015 2016
Thermal products business unit 2,611 2,611
Plasma products business unit 8,659 8,659
TOTAL 11,270 11,270
AB
OU
TS
TR
AT
EG
Y &
BU
SIN
ES
SP
ER
FO
RM
AN
CE
RE
VIE
WS
HA
RE
HO
LD
ER
SG
OV
ER
NA
NC
EF
INA
NC
IAL
STA
TE
ME
NT
SASMI STATUTORY ANNUAL REPORT 2016 | NOTES TO THE COMPANY FINANCIAL STATEMENTS | 160
FIN
AN
CIA
L S
TAT
EM
EN
TS

NOTE 5. PROPERTY, PLANT AND EQUIPMENTThe changes in the amount of property, plant and equipment are as follows:
LAND, BUILDINGS AND LEASEHOLD IMPROVEMENTS
FURNITURE AND FIXTURES TOTAL
At cost:
BALANCE JANUARY 1, 2015 47 246 293
Additions – 30 30
BALANCE DECEMBER 31, 2015 47 276 323
Disposals – – –
Additions – 176 176
BALANCE DECEMBER 31, 2016 47 452 499
Accumulated depreciation:
BALANCE JANUARY 1, 2015 47 223 270
Depreciation for the year – 12 12
BALANCE DECEMBER 31, 2015 47 235 282
Disposal – – –
Depreciation for the year – 26 26
BALANCE DECEMBER 31, 2016 47 261 308
Property, plant and equipment, net:
DECEMBER 31, 2015 – 41 41
DECEMBER 31, 2016 – 191 191
USEFUL LIVES IN YEARS:
Land, buildings and leasehold improvements 10-25
Furniture and fixtures 2-10
NOTE 6. DEFERRED TAX ASSETSBased on tax filings, ASMI has net operating losses available at December 31, 2016 of €129,045 to reduce future income taxes. The Company believes that realization of its net deferred tax assets is dependent on the ability of the Company to generate taxable income in the future. Given the volatile nature of the semiconductor equipment industry and past experience, the Company believes that there is currently sufficient evidence to recognize a deferred tax asset in the amount of €5,000.
AB
OU
TS
TR
AT
EG
Y &
BU
SIN
ES
SP
ER
FO
RM
AN
CE
RE
VIE
WS
HA
RE
HO
LD
ER
SG
OV
ER
NA
NC
EF
INA
NC
IAL
STA
TE
ME
NT
SASMI STATUTORY ANNUAL REPORT 2016 | NOTES TO THE COMPANY FINANCIAL STATEMENTS | 161
FIN
AN
CIA
L S
TAT
EM
EN
TS

NOTE 7. EQUITYThe changes in equity are as follows:
LEGAL RESERVES
(EUR thousand except for share data)COMMON
SHARES
CAPITAL IN EXCESS OF PAR VALUE
TREASURY SHARES
ACCUMU-LATED NET EARNINGS
NET EARNINGS CURRENT
YEAR
TRANS-LATION
RESERVE
OTHER LEGAL
RESERVESTOTAL
EQUITY
BALANCE AS OF JANUARY 1, 2015 2,553 216,322 (27,733) 246,792 141,317 54,770 1,109,000 1,743,021
Appropriation of net earnings – – – 141,317 (141,317) – – –
Components of comprehensive income
Net earnings – – – – 157,277 – – 157,277
Other comprehensive income – – – – – 137,311 – 137,311
TOTAL COMPREHENSIVE INCOME (LOSS) – – – – 157,277 137,311 – 294,588
Compensation expense stock options – 8,213 – – – – – 8,213
Exercise stock options out of treasury shares – (2,667) 20,985 (6,886) – – – 11,432
Repurchase shares – – (77,252) – – – – (77,252)
Dividend paid to common shareholders – – – (37,158) – – – (37,158)
Increased retained earnings subsidiaries – – – (46,893) – – 46,893 –
Fair value accounting investments – – (61,571) – – 61,571 –
Capitalized development expenses subsidiaries – – – (11,224) – – 11,224 –Other movements in investments in associates:
Dilution – – – 5,535 – – – 5,535
BALANCE AS OF DECEMBER 31, 2015 2,553 221,868 (84,000) 229,912 157,277 192,081 1,228,688 1,948,379
Appropriation of net earnings – – – 157,277 (157,277) – – –
Components of comprehensive income
Net earnings – – – – 135,471 – – 135,471
Other comprehensive income – – – – – 39,387 – 39,387
TOTAL COMPREHENSIVE INCOME (LOSS) – – – – 135,471 39,387 – 174,858
Compensation expense stock options – 8,387 – – – – – 8,387
Exercise stock options out of treasury shares – (2,591) 27,836 (10,536) – – – 14,709
Vesting restricted shares out of treasury shares – (1,827) 1,827 – – – – –
Repurchase shares – – (97,140) – – – – (97,140)
Dividend paid to common shareholders – – – (42,673) – – – (42,673)
Increased retained earnings subsidiaries – – – (51,323) – – 51,323 –
Fair value accounting investments – – 2,015 – – (2,015) –
Capitalized development expenses subsidiaries – – – (13,448) – – 13,448 –Other movements in investments in associates:
Dilution – – – 9,336 – – – 9,336
BALANCE AS OF DECEMBER 31, 2016 2,553 225,837 (151,477) 280,560 135,471 231,468 1,291,444 2,015,856
AB
OU
TS
TR
AT
EG
Y &
BU
SIN
ES
SP
ER
FO
RM
AN
CE
RE
VIE
WS
HA
RE
HO
LD
ER
SG
OV
ER
NA
NC
EF
INA
NC
IAL
STA
TE
ME
NT
SASMI STATUTORY ANNUAL REPORT 2016 | NOTES TO THE COMPANY FINANCIAL STATEMENTS | 162
FIN
AN
CIA
L S
TAT
EM
EN
TS
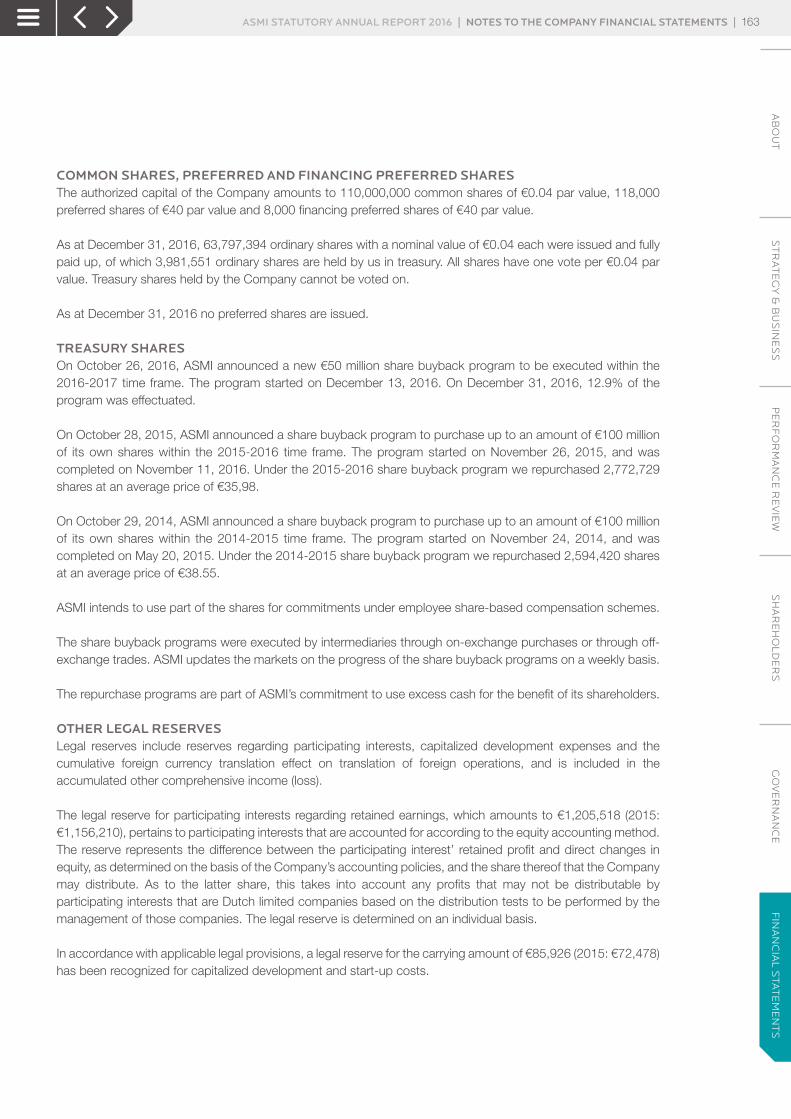
COMMON SHARES, PREFERRED AND FINANCING PREFERRED SHARESThe authorized capital of the Company amounts to 110,000,000 common shares of €0.04 par value, 118,000 preferred shares of €40 par value and 8,000 financing preferred shares of €40 par value.
As at December 31, 2016, 63,797,394 ordinary shares with a nominal value of €0.04 each were issued and fully paid up, of which 3,981,551 ordinary shares are held by us in treasury. All shares have one vote per €0.04 par value. Treasury shares held by the Company cannot be voted on.
As at December 31, 2016 no preferred shares are issued.
TREASURY SHARESOn October 26, 2016, ASMI announced a new €50 million share buyback program to be executed within the 2016-2017 time frame. The program started on December 13, 2016. On December 31, 2016, 12.9% of the program was effectuated.
On October 28, 2015, ASMI announced a share buyback program to purchase up to an amount of €100 million of its own shares within the 2015-2016 time frame. The program started on November 26, 2015, and was completed on November 11, 2016. Under the 2015-2016 share buyback program we repurchased 2,772,729 shares at an average price of €35,98.
On October 29, 2014, ASMI announced a share buyback program to purchase up to an amount of €100 million of its own shares within the 2014-2015 time frame. The program started on November 24, 2014, and was completed on May 20, 2015. Under the 2014-2015 share buyback program we repurchased 2,594,420 shares at an average price of €38.55.
ASMI intends to use part of the shares for commitments under employee share-based compensation schemes.
The share buyback programs were executed by intermediaries through on-exchange purchases or through off-exchange trades. ASMI updates the markets on the progress of the share buyback programs on a weekly basis.
The repurchase programs are part of ASMI’s commitment to use excess cash for the benefit of its shareholders.
OTHER LEGAL RESERVESLegal reserves include reserves regarding participating interests, capitalized development expenses and the cumulative foreign currency translation effect on translation of foreign operations, and is included in the accumulated other comprehensive income (loss).
The legal reserve for participating interests regarding retained earnings, which amounts to €1,205,518 (2015: €1,156,210), pertains to participating interests that are accounted for according to the equity accounting method. The reserve represents the difference between the participating interest’ retained profit and direct changes in equity, as determined on the basis of the Company’s accounting policies, and the share thereof that the Company may distribute. As to the latter share, this takes into account any profits that may not be distributable by participating interests that are Dutch limited companies based on the distribution tests to be performed by the management of those companies. The legal reserve is determined on an individual basis.
In accordance with applicable legal provisions, a legal reserve for the carrying amount of €85,926 (2015: €72,478) has been recognized for capitalized development and start-up costs.
AB
OU
TS
TR
AT
EG
Y &
BU
SIN
ES
SP
ER
FO
RM
AN
CE
RE
VIE
WS
HA
RE
HO
LD
ER
SG
OV
ER
NA
NC
EF
INA
NC
IAL
STA
TE
ME
NT
SASMI STATUTORY ANNUAL REPORT 2016 | NOTES TO THE COMPANY FINANCIAL STATEMENTS | 163
FIN
AN
CIA
L S
TAT
EM
EN
TS
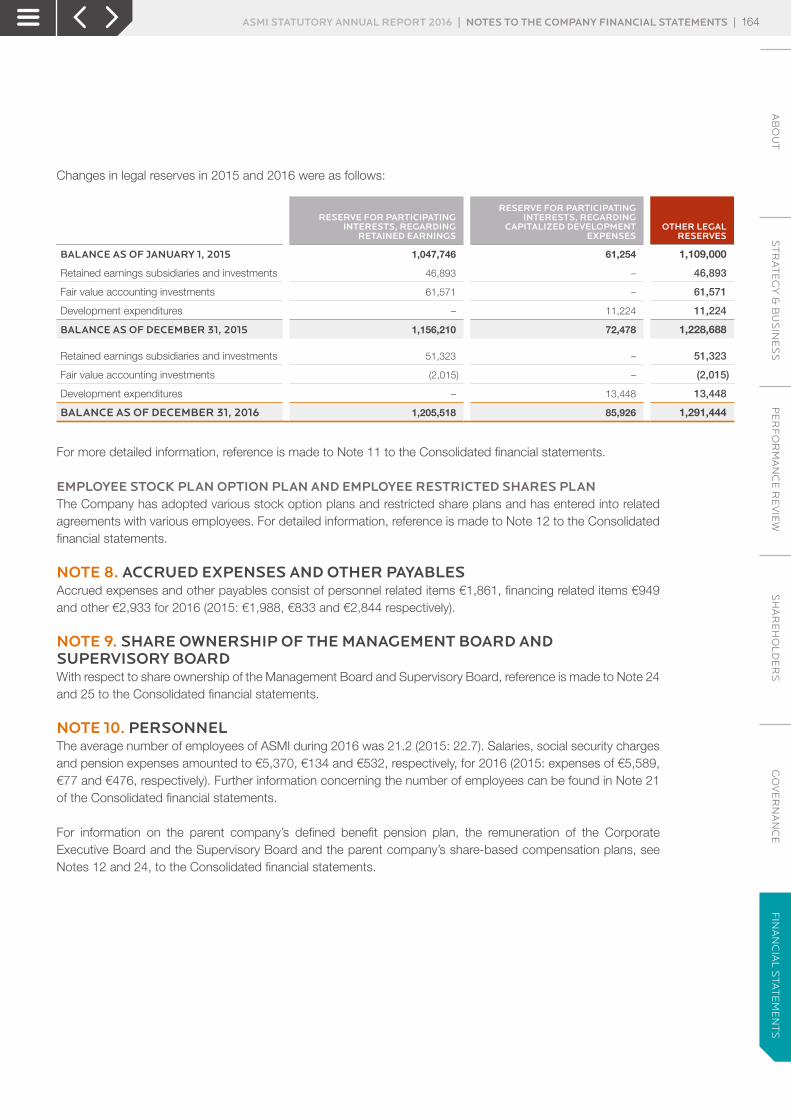
Changes in legal reserves in 2015 and 2016 were as follows:
RESERVE FOR PARTICIPATING INTERESTS, REGARDING
RETAINED EARNINGS
RESERVE FOR PARTICIPATING INTERESTS, REGARDING
CAPITALIZED DEVELOPMENT EXPENSES
OTHER LEGAL RESERVES
BALANCE AS OF JANUARY 1, 2015 1,047,746 61,254 1,109,000
Retained earnings subsidiaries and investments 46,893 – 46,893
Fair value accounting investments 61,571 – 61,571
Development expenditures – 11,224 11,224
BALANCE AS OF DECEMBER 31, 2015 1,156,210 72,478 1,228,688
Retained earnings subsidiaries and investments 51,323 – 51,323
Fair value accounting investments (2,015) – (2,015)
Development expenditures – 13,448 13,448
BALANCE AS OF DECEMBER 31, 2016 1,205,518 85,926 1,291,444
For more detailed information, reference is made to Note 11 to the Consolidated financial statements.
EMPLOYEE STOCK PLAN OPTION PLAN AND EMPLOYEE RESTRICTED SHARES PLANThe Company has adopted various stock option plans and restricted share plans and has entered into related agreements with various employees. For detailed information, reference is made to Note 12 to the Consolidated financial statements.
NOTE 8. ACCRUED EXPENSES AND OTHER PAYABLESAccrued expenses and other payables consist of personnel related items €1,861, financing related items €949 and other €2,933 for 2016 (2015: €1,988, €833 and €2,844 respectively).
NOTE 9. SHARE OWNERSHIP OF THE MANAGEMENT BOARD AND SUPERVISORY BOARDWith respect to share ownership of the Management Board and Supervisory Board, reference is made to Note 24 and 25 to the Consolidated financial statements.
NOTE 10. PERSONNELThe average number of employees of ASMI during 2016 was 21.2 (2015: 22.7). Salaries, social security charges and pension expenses amounted to €5,370, €134 and €532, respectively, for 2016 (2015: expenses of €5,589, €77 and €476, respectively). Further information concerning the number of employees can be found in Note 21 of the Consolidated financial statements.
For information on the parent company’s defined benefit pension plan, the remuneration of the Corporate Executive Board and the Supervisory Board and the parent company’s share-based compensation plans, see Notes 12 and 24, to the Consolidated financial statements.
AB
OU
TS
TR
AT
EG
Y &
BU
SIN
ES
SP
ER
FO
RM
AN
CE
RE
VIE
WS
HA
RE
HO
LD
ER
SG
OV
ER
NA
NC
EF
INA
NC
IAL
STA
TE
ME
NT
SASMI STATUTORY ANNUAL REPORT 2016 | NOTES TO THE COMPANY FINANCIAL STATEMENTS | 164
FIN
AN
CIA
L S
TAT
EM
EN
TS

NOTE 11. COMMITMENTS AND CONTINGENCIESAt December 31, 2016, operating leases having initial or remaining non-cancelable terms in excess of one year are as follows:
2017 170
2018 159
2019 95
2020 51
TOTAL 475
Lease payments recognized as an expense were €200 for the year ended December 31, 2016 (2015: €208).
With respect to certain Dutch subsidiaries, ASMI has assumed joint and several liability in accordance with Article 403, Part 9 of Book 2 of the Dutch Civil Code.
ASMI forms a fiscal unity (tax group for Corporate Income Tax purposes) together with its Dutch subsidiaries for purposes of Dutch tax laws and is as such jointly and severally liable for the tax debts of the unity. The tax unity consists of ASM International NV and the following subsidiaries: › ASM Europe BV (operational company) › ASM UK Sales BV (operational company) › ASM Germany Sales BV (operational company) › ASM Pacific Holding BV (holding company) › CVTR Development BV › Beheer- en Beleggingsmaatschappij Ingebel BV in liquidatie › Hamilcar Investments BV › Rembrandt Lease and Finance BV › ASM IP Holding BV (operational company) › ASM Netherlands Holding BV (holding company) › ASM Europe Holding BV(holding company)
NOTE 12. AUDITOR’S FEES AND SERVICESFor information regarding auditor’s fees and services we refer to Note 26 of the Consolidated financial statements.
NOTE 13. RELATED PARTY TRANSACTIONSIn 2016 corporate services of €19,558 (2015: €19,929) were charged to subsidiaries.
SIGNINGAlmere
March 9, 2017
SUPERVISORY BOARDJ.C. LobbezooH.W. KreutzerM.C.J. van PernisU.H.R. Schumacher
MANAGEMENT BOARDC.D. del PradoP.A.M. van Bommel
AB
OU
TS
TR
AT
EG
Y &
BU
SIN
ES
SP
ER
FO
RM
AN
CE
RE
VIE
WS
HA
RE
HO
LD
ER
SG
OV
ER
NA
NC
EF
INA
NC
IAL
STA
TE
ME
NT
SASMI STATUTORY ANNUAL REPORT 2016 | NOTES TO THE COMPANY FINANCIAL STATEMENTS | 165
FIN
AN
CIA
L S
TAT
EM
EN
TS
INDEPENDENT AUDITOR’S REPORT
To: the General Meeting of Shareholders and the Supervisory Board of ASM International N.V.
REPORT ON THE ACCOMPANYING FINANCIAL STATEMENTS 2016OUR OPINIONIn our opinion: › the accompanying consolidated financial statements give a true and fair view of the financial position of ASM International N.V. as at December 31, 2016, and of its result and its cash flows for 2016 in accordance with International Financial Reporting Standards as adopted by the European Union (EU-IFRS) and with Part 9 of Book 2 of the Netherlands Civil Code;
› the accompanying company financial statements give a true and fair view of the financial position of ASM International N.V. as at December 31, 2016, and of its result for 2016 in accordance with Part 9 of Book 2 of the Netherlands Civil Code.
WHAT WE HAVE AUDITEDWe have audited the financial statements 2016 of ASM International N.V. (ASMI), based in Almere. The financial statements include the consolidated financial statements and the company financial statements.
The consolidated financial statements comprise: › the consolidated statement of financial position as at December 31, 2016; › the following consolidated statements for 2016: the statement of profit or loss, the statements of comprehensive income, changes in equity and cash flows; and
› the notes comprising a summary of the significant accounting policies and other explanatory information.
The company financial statements comprise: › the company balance sheet as at December 31, 2016; › the company statement of profit or loss for 2016; and › the notes comprising a summary of the significant accounting policies and other explanatory information.
BASIS FOR OUR OPINIONWe conducted our audit in accordance with Dutch law, including the Dutch Standards on Auditing. Our responsibilities under those standards are further described in the ‘Our responsibilities for the audit of the financial statements’ section of our report.
We are independent of ASM International N.V. in accordance with the Verordening inzake de onafhankelijkheid van accountants bij assurance-opdrachten (ViO, Code of Ethics for Professional Accountants, a regulation with respect to independence) and other relevant independence regulations in the Netherlands. Furthermore, we have complied with the Verordening gedrags- en beroepsregels accountants (VGBA, Dutch Code of Ethics).
We believe that the audit evidence we have obtained is sufficient and appropriate to provide a basis for our opinion.
Independent auditor’s report
AB
OU
TS
TR
AT
EG
Y &
BU
SIN
ES
SP
ER
FO
RM
AN
CE
RE
VIE
WS
HA
RE
HO
LD
ER
SG
OV
ER
NA
NC
EF
INA
NC
IAL
STA
TE
ME
NT
SASMI STATUTORY ANNUAL REPORT 2016 | INDEPENDENT AUDITOR’S REPORT | 166
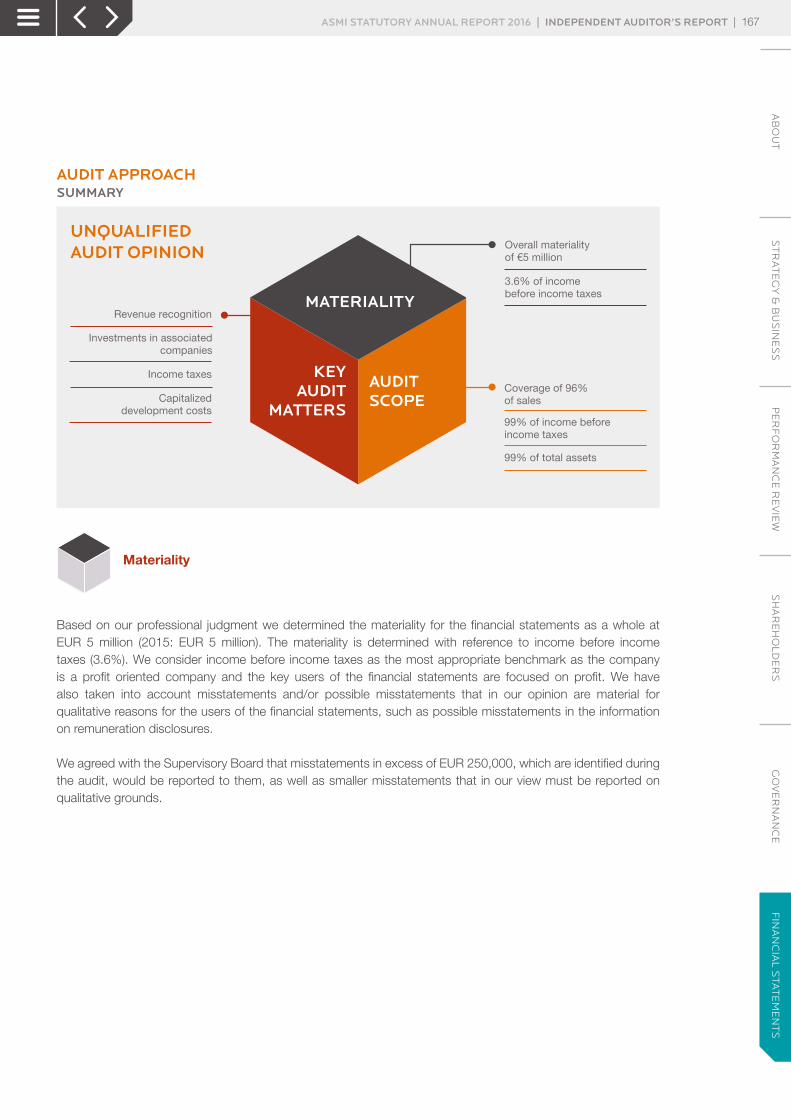
AUDIT APPROACH SUMMARY
MATERIALITY
KEYAUDIT
MATTERS
AUDITSCOPE
Overall materialityof €5 million
3.6% of income before income taxes
Coverage of 96%of sales
99% of income beforeincome taxes
99% of total assets
Revenue recognition
Investments in associatedcompanies
Income taxes
Capitalizeddevelopment costs
UNQUALIFIED AUDIT OPINION
Materiality
Based on our professional judgment we determined the materiality for the financial statements as a whole at EUR 5 million (2015: EUR 5 million). The materiality is determined with reference to income before income taxes (3.6%). We consider income before income taxes as the most appropriate benchmark as the company is a profit oriented company and the key users of the financial statements are focused on profit. We have also taken into account misstatements and/or possible misstatements that in our opinion are material for qualitative reasons for the users of the financial statements, such as possible misstatements in the information on remuneration disclosures.
We agreed with the Supervisory Board that misstatements in excess of EUR 250,000, which are identified during the audit, would be reported to them, as well as smaller misstatements that in our view must be reported on qualitative grounds.
AB
OU
TS
TR
AT
EG
Y &
BU
SIN
ES
SP
ER
FO
RM
AN
CE
RE
VIE
WS
HA
RE
HO
LD
ER
SG
OV
ER
NA
NC
EF
INA
NC
IAL
STA
TE
ME
NT
SASMI STATUTORY ANNUAL REPORT 2016 | INDEPENDENT AUDITOR’S REPORT | 167
FIN
AN
CIA
L S
TAT
EM
EN
TS
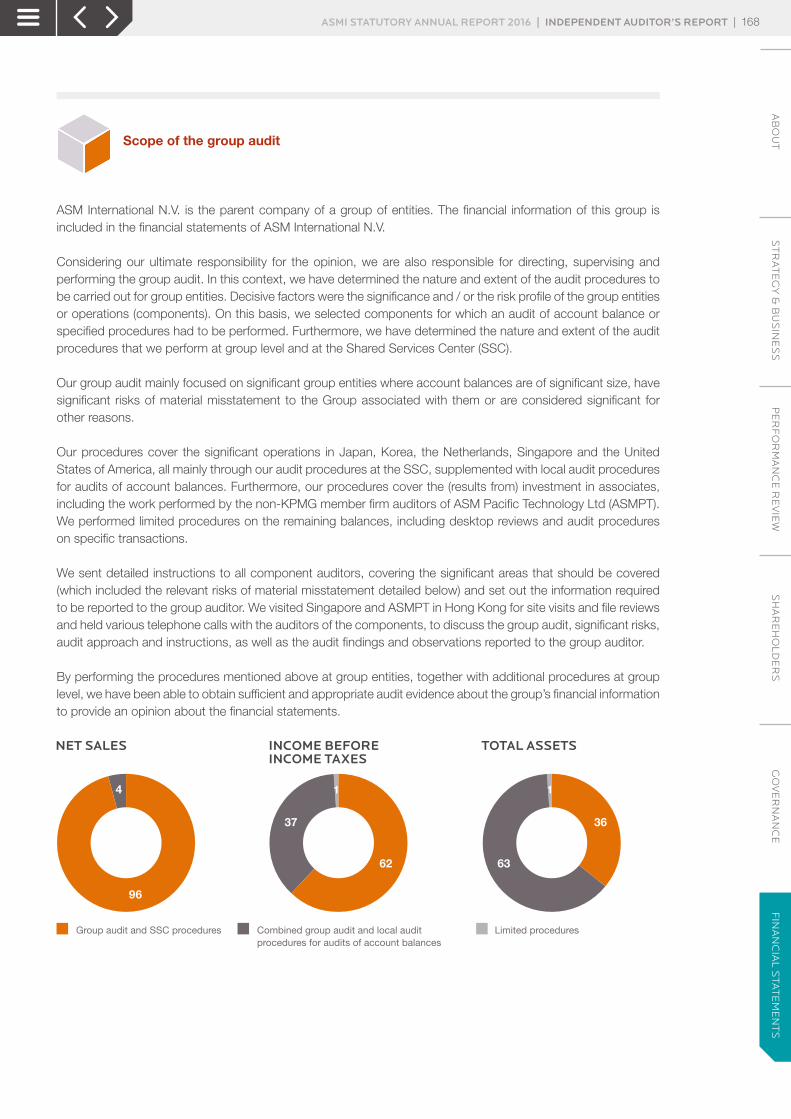
Scope of the group audit
ASM International N.V. is the parent company of a group of entities. The financial information of this group is included in the financial statements of ASM International N.V.
Considering our ultimate responsibility for the opinion, we are also responsible for directing, supervising and performing the group audit. In this context, we have determined the nature and extent of the audit procedures to be carried out for group entities. Decisive factors were the significance and / or the risk profile of the group entities or operations (components). On this basis, we selected components for which an audit of account balance or specified procedures had to be performed. Furthermore, we have determined the nature and extent of the audit procedures that we perform at group level and at the Shared Services Center (SSC).
Our group audit mainly focused on significant group entities where account balances are of significant size, have significant risks of material misstatement to the Group associated with them or are considered significant for other reasons.
Our procedures cover the significant operations in Japan, Korea, the Netherlands, Singapore and the United States of America, all mainly through our audit procedures at the SSC, supplemented with local audit procedures for audits of account balances. Furthermore, our procedures cover the (results from) investment in associates, including the work performed by the non-KPMG member firm auditors of ASM Pacific Technology Ltd (ASMPT). We performed limited procedures on the remaining balances, including desktop reviews and audit procedures on specific transactions.
We sent detailed instructions to all component auditors, covering the significant areas that should be covered (which included the relevant risks of material misstatement detailed below) and set out the information required to be reported to the group auditor. We visited Singapore and ASMPT in Hong Kong for site visits and file reviews and held various telephone calls with the auditors of the components, to discuss the group audit, significant risks, audit approach and instructions, as well as the audit findings and observations reported to the group auditor.
By performing the procedures mentioned above at group entities, together with additional procedures at group level, we have been able to obtain sufficient and appropriate audit evidence about the group’s financial information to provide an opinion about the financial statements.
63
36
1
37
62
1
96
4
NET SALES INCOME BEFORE INCOME TAXES
TOTAL ASSETS
Group audit and SSC procedures Combined group audit and local auditprocedures for audits of account balances
Limited procedures
AB
OU
TS
TR
AT
EG
Y &
BU
SIN
ES
SP
ER
FO
RM
AN
CE
RE
VIE
WS
HA
RE
HO
LD
ER
SG
OV
ER
NA
NC
EF
INA
NC
IAL
STA
TE
ME
NT
SASMI STATUTORY ANNUAL REPORT 2016 | INDEPENDENT AUDITOR’S REPORT | 168
FIN
AN
CIA
L S
TAT
EM
EN
TS
Our key audit matters
Key audit matters are those matters that, in our professional judgment, were of most significance in our audit of the financial statements. We have communicated the key audit matters to the Supervisory Board. The key audit matters are not a comprehensive reflection of all matters discussed. These matters were addressed in the context of our audit of the financial statements as a whole and in forming our opinion thereon, and we do not provide a separate opinion on these matters.
REVENUE RECOGNITION
DescriptionNet sales is measured taking into account multiple element arrangements, for example a single sales transaction that combines the delivery of goods and rendering of (installation) services, as contracts with customers typically include separately identifiable components that are recognized based on the relative selling price. Furthermore, net sales is recognized when the risk and rewards of products and services have been transferred to the customer. Due to the multitude and variety of contractual terms, the different pricing elements and the risk of management override of controls, revenue recognition is considered to be complex and involves management judgement as it relates to the allocation of revenue to the various elements in sales contracts.
Our response Our audit procedures included, among other things, assessing the appropriateness of ASMI’s revenue recognition accounting policy in line with IFRS. We tested the effectiveness of controls over the recognition of net sales. We also assessed the existence and accuracy of the sales recorded, based, among other things, on inspection of sales contracts, final acceptances, the allocation of revenue to the various elements in the sales contracts, reconciliation of cash received throughout the year for revenue recognized and sales transactions taking place before and after year-end to ensure that net sales was recognized in the correct period. We further assessed the adequacy of the net sales disclosures contained in Note 19, Segment disclosure.
ACCOUNTING FOR INVESTMENTS IN ASSOCIATED COMPANIES
DescriptionASM International N.V. holds 39.19% of the shares in ASM Pacific Technology Ltd, an entity listed on the Hong Kong Stock Exchange. The investments in associated companies are accounted for under the equity method and considered for impairment in case of a significant or prolonged decline in value. The accounting for the results of and investment in ASMPT is significant to our audit due to the share in ASMI’s net income, the book value of the investment, the fluctuating share price of ASMPT and judgment applied in determining if a decline in value is significant and temporary or prolonged.
As at December 31, 2016, the Investments and associates amounted to EUR 1,236 million whilst the share in income from investments and associates amounted to EUR 40 million.
Our responseOur audit procedures included, among other things, instructing the statutory auditor of ASMPT to perform an audit on the relevant financial information of ASMPT for the purpose of the consolidated financial statements of ASMI. During the year we discussed the risk assessment and audit strategy of the statutory auditor, as well as any significant developments. Subsequently we have performed a file review at the statutory auditor’s office.
We have further evaluated management’s considerations of the impairment indicators of the investment in ASMPT, including goodwill and other intangibles. In such consideration, the fair value of the listed shares of ASMPT is used as a starting point to assess whether any significant or prolonged and other than temporary decline in value exists, next to a qualitative assessment. We have, among other things, analyzed the trend in the share price of ASMPT to the Hong Kong Stock Exchange, compared the share price with external data used by analysts expectations, and evaluated the results of ASMPT for potential valuation issues for the investment in ASMPT. We also assessed the adequacy of the company’s disclosure in Note 6, Investments in associates.
AB
OU
TS
TR
AT
EG
Y &
BU
SIN
ES
SP
ER
FO
RM
AN
CE
RE
VIE
WS
HA
RE
HO
LD
ER
SG
OV
ER
NA
NC
EF
INA
NC
IAL
STA
TE
ME
NT
SASMI STATUTORY ANNUAL REPORT 2016 | INDEPENDENT AUDITOR’S REPORT | 169
FIN
AN
CIA
L S
TAT
EM
EN
TS
ACCOUNTING FOR INCOME TAX POSITIONS
DescriptionIncome tax positions are significant to our audit because the assessment process is complex, includes a certain level of estimation uncertainty and the amounts involved are material to the financial statements as a whole. ASMI’s operations are subject to income taxes in various jurisdictions which results in complexities of transfer pricing and the applicability of various tax legislation. Furthermore, the Company has significant unrecognized net operating losses.
As at December 31, 2016, the deferred tax assets amounted to EUR 14 million and the unrecognized net operating losses amounted to EUR 129 million.
Our response We have, among other things, performed audit procedures on the completeness, existence and accuracy of the amounts recognized as current and deferred tax, including the assessment of correspondence with tax authorities and the evaluation of tax exposures. In addition, in respect of deferred tax assets, we reviewed and tested management’s assumptions that substantiate the probability that deferred tax assets (un)recognized in the balance sheet will be recovered through taxable income in future years and available tax planning strategies. During our procedures, we challenged, among other things, budgets, forecasts and tax laws. In addition, we assessed the historical accuracy of management’s assumptions. In those components determined to be part of jurisdictions with significant tax risk, we involved tax specialists to analyze the tax positions and to challenge the assumptions used to determine the tax positions. We also assessed the adequacy of the company’s disclosure in Note 20, Income taxes.
ACCOUNTING FOR CAPITALIZED DEVELOPMENT COSTS
DescriptionCapitalized development costs of EUR 86 million is deemed significant to our audit, given the significance of the position per December 31, 2016, the rapid technological change in the industry, as well as the specific criteria that have to be met for capitalization. This involves management judgment, such as with respect to technical feasibility, intention and ability to complete the intangible asset, ability to use or sell the asset, generation of future economic benefits and the ability to measure the costs reliably. In addition, determining whether there is any indication of impairment of the carrying value of assets, requires management judgment and assumptions which are affected by future market or economic developments.
Our responseWe have performed audit procedures over the accuracy and valuation of amounts recognized. Our audit procedures included, among other things, assessing the recognition criteria for intangible assets, challenging the key assumptions used or estimates made in capitalizing development costs, the accuracy of costs included and the useful economic life attributed to the asset.
In addition, we considered whether any indicators of impairment were present by understanding the business rationale and by challenging management judgements and assumptions on future market or economic developments. We also assessed the adequacy of the company’s disclosure in Note 5, Other intangible assets.
AB
OU
TS
TR
AT
EG
Y &
BU
SIN
ES
SP
ER
FO
RM
AN
CE
RE
VIE
WS
HA
RE
HO
LD
ER
SG
OV
ER
NA
NC
EF
INA
NC
IAL
STA
TE
ME
NT
SASMI STATUTORY ANNUAL REPORT 2016 | INDEPENDENT AUDITOR’S REPORT | 170
FIN
AN
CIA
L S
TAT
EM
EN
TS
REPORT ON THE OTHER INFORMATION INCLUDED IN THE ANNUAL REPORTIn addition to the financial statements and our auditor’s report thereon, the annual report contains other information that consists of: › the Management Board’s report; › the Supervisory Board’s report; › other information pursuant to Part 9 of Book 2 of the Netherlands Civil Code.
Based on the below procedures performed, we conclude that the other information: › is consistent with the financial statements and does not contain material misstatements; › contains the information as required by Part 9 of Book 2 of the Netherlands Civil Code.
We have read the other information. Based on our knowledge and understanding obtained through our audit of the financial statements or otherwise, we have considered whether the other information contains material misstatements.
By performing these procedures, we comply with the requirements of Part 9 of Book 2 of the Netherlands Civil Code and the Dutch Standard 720. The scope of the procedures performed is substantially less than the scope of those performed in our audit of the financial statements.
Management is responsible for the preparation of the other information, including the management board’s report in accordance with Part 9 of Book 2 of the Netherlands Civil Code and other Information pursuant to Part 9 of Book 2 of the Netherlands Civil Code.
REPORT ON OTHER LEGAL AND REGULATORY REQUIREMENTSENGAGEMENTWe were engaged by the Annual General Meeting of Shareholders as auditor of ASM International N.V. on May 21, 2014, as of the audit for year 2015 and have operated as statutory auditor since then.
DESCRIPTION OF THE RESPONSIBILITIES FOR THE FINANCIAL STATEMENTSRESPONSIBILITIES OF MANAGEMENT BOARD AND SUPERVISORY BOARD FOR THE FINANCIAL STATEMENTSThe Management Board is responsible for the preparation and fair presentation of the financial statements in accordance with EU-IFRS and with Part 9 of Book 2 of the Netherlands Civil Code. Furthermore, the Management Board is responsible for such internal control as the Management Board determines is necessary to enable the preparation of the financial statements that are free from material misstatement, whether due to errors or fraud. As part of the preparation of the financial statements, the Management Board is responsible for assessing the company’s ability to continue as a going concern. Based on the financial reporting framework mentioned, the Management Board should prepare the financial statements using the going concern basis of accounting unless the Management Board either intends to liquidate the company or to cease operations, or has no realistic alternative but to do so. The Management Board should disclose events and circumstances that may cast significant doubt on the company’s ability to continue as a going concern in the financial statements.
The Supervisory Board is responsible for overseeing the company’s financial reporting process.
AB
OU
TS
TR
AT
EG
Y &
BU
SIN
ES
SP
ER
FO
RM
AN
CE
RE
VIE
WS
HA
RE
HO
LD
ER
SG
OV
ER
NA
NC
EF
INA
NC
IAL
STA
TE
ME
NT
SASMI STATUTORY ANNUAL REPORT 2016 | INDEPENDENT AUDITOR’S REPORT | 171
FIN
AN
CIA
L S
TAT
EM
EN
TS
OUR RESPONSIBILITIES FOR THE AUDIT OF FINANCIAL STATEMENTSOur objective is to plan and perform the audit to obtain sufficient and appropriate audit evidence for our opinion. Our audit has been performed with a high, but not absolute, level of assurance, which means we may not have detected all material errors and fraud during the audit.
Misstatements can arise from fraud or error and are considered material if, individually or in aggregate, they could reasonably be expected to influence the economic decisions of users taken on the basis of these financial statements. The materiality affects the nature, timing and extent of our audit procedures and the evaluation of the effect of identified misstatements on our opinion.
For a further description of our responsibilities in respect of an audit of financial statements we refer to the appendix.
Amstelveen, March 9, 2017
KPMG Accountants N.V.R.P. Kreukniet RA
AB
OU
TS
TR
AT
EG
Y &
BU
SIN
ES
SP
ER
FO
RM
AN
CE
RE
VIE
WS
HA
RE
HO
LD
ER
SG
OV
ER
NA
NC
EF
INA
NC
IAL
STA
TE
ME
NT
SASMI STATUTORY ANNUAL REPORT 2016 | INDEPENDENT AUDITOR’S REPORT | 172
FIN
AN
CIA
L S
TAT
EM
EN
TS
APPENDIXWe have exercised professional judgment and have maintained professional skepticism throughout the audit, in accordance with Dutch Standards on Auditing, ethical requirements and independence requirements. Our audit included e.g.: › Identifying and assessing the risks of material misstatement of the financial statements, whether due to fraud or error, designing and performing audit procedures responsive to those risks, and obtaining audit evidence that is sufficient and appropriate to provide a basis for our opinion. The risk of not detecting a material misstatement resulting from fraud is higher than for one resulting from error, as fraud may involve collusion, forgery, intentional omissions, misrepresentations, or the override of internal control;
› Obtaining an understanding of internal control relevant to the audit in order to design audit procedures that are appropriate in the circumstances, but not for the purpose of expressing an opinion on the effectiveness of the company’s internal control;
› Evaluating the appropriateness of accounting policies used and the reasonableness of accounting estimates and related disclosures made by the Management Board;
› Concluding on the appropriateness of the Management Board’s use of the going concern basis of accounting, and based on the audit evidence obtained, whether a material uncertainty exists related to events or conditions that may cast significant doubt on the company’s ability to continue as a going concern. If we conclude that a material uncertainty exists, we are required to draw attention in our auditor’s report to the related disclosures in the financial statements or, if such disclosures are inadequate, to modify our opinion. Our conclusions are based on the audit evidence obtained up to the date of our auditor’s report. However, future events or conditions may cause a company to cease to continue as a going concern;
› Evaluating the overall presentation, structure and content of the financial statements, including the disclosures; and
› Evaluating whether the financial statements represent the underlying transactions and events in a manner that achieves fair presentation.
Because we are ultimately responsible for the opinion, we are also responsible for directing, supervising and performing the group audit. In this respect we have determined the nature and extent of the audit procedures to be carried out for group entities. Decisive were the size and/or the risk profile of the group entities or operations. On this basis, we selected group entities for which an audit or review had to be carried out on the complete set of financial information or specific items.
We communicate with the Supervisory Board regarding, among other matters, the planned scope and timing of the audit and significant audit findings, including any significant findings in internal control that we identify during our audit.
We provide the Supervisory Board with a statement that we have complied with relevant ethical requirements regarding independence, and to communicate with them all relationships and other matters that may reasonably be thought to bear on our independence, and where applicable, related safegards.
From the matters communicated with the Supervisory Board, we determine key audit matters: those matters that were of most significance in the audit of the financial statements. We describe these matters in our auditor’s report unless law or regulation precludes public disclosure about the matter or when, in extremely rare circumstances, not communicating the matter is in the public interest.
AB
OU
TS
TR
AT
EG
Y &
BU
SIN
ES
SP
ER
FO
RM
AN
CE
RE
VIE
WS
HA
RE
HO
LD
ER
SG
OV
ER
NA
NC
EF
INA
NC
IAL
STA
TE
ME
NT
SASMI STATUTORY ANNUAL REPORT 2016 | INDEPENDENT AUDITOR’S REPORT | 173
FIN
AN
CIA
L S
TAT
EM
EN
TS
OTHER INFORMATION
The additional information below includes a brief summary of the most significant provisions of our Articles of Association.
INFORMATION ON THE PROVISIONS IN THE ARTICLE OF ASSOCIATION RELATING TO THE APPROPRIATION OF PROFITThe Articles of Association of ASM International NV (the Company) provides the following with regard to distribution of profit and can be summarized as follows:
› From the profits, distributions shall in the first place, if possible, be made on the preferred shares equal to the EURIBOR-rate for six months’ loans, increased by one and a half, on the paid-up amount which had to be paid on the preferred shares, weighted to the number of days to which this was applicable. If profits are insufficient, the dividend will be paid from the reserves with priority over any dividends. If the reserves are insufficient, the dividend deficit has to be made up in future years;
› Second, a dividend, if possible, is distributed on financing preferred shares. The dividend is a percentage of the par value, plus share premium paid, on the financing preferred shares. The percentage is determined by the Management Board, subject to approval of the Supervisory Board. The percentage is related to the average effective yield on government loans with a weighted average remaining term of no more than ten years, if necessary increased or decreased by no more than three percent, subject to the then prevailing market conditions. If profits are insufficient, the dividend shall be paid from the reserves. If the reserves are insufficient, the dividend deficit has to be made up in future years;
› With the approval of the Supervisory Board, the Management Board will determine which part of the profit remaining after adoption of the provisions of the previous paragraphs will be reserved. The profit after reserving will be at the disposal of the General Meeting of Shareholders;
› The Company may only make distributions to the shareholders and other persons entitled to profit insofar as its equity exceeds the amount of the paid-up and called amounts of the share capital increased with the reserves that must be kept by virtue of law;
Article 33, para 3 of the Articles of Association provides that dividend claims expire after the lapse of five years.
THE PROPOSED APPROPRIATION OF THE RESULTIt is proposed that net earnings for the year 2016 are carried to the accumulated deficit/net earnings.
SPECIAL STATUTORY CONTROL RIGHTSArticle 27 of the Articles of Association provides that each common share gives the right to cast one vote, each preferred financing share to cast one thousand votes, and each preferred share to cast one thousand votes.
Article 29 of the Articles of Association provides that meetings of holders of preferred shares or of financing preferred shares shall be convened as often and insofar as a decision of the meeting of holders of preferred shares or financing shares desires this, and furthermore as often as the Management Board and or the Supervisory Board shall decide to hold such a meeting. At the meeting, resolutions will be passed with an absolute majority of the votes. In the event that there is a tie of votes, no resolution will take effect.
The following resolutions and actions can only be taken on a proposal by the Management Board and the Supervisory Board: › the amendment of the Articles of the Company; and › the dissolution of the Company.
Other information
AB
OU
TS
TR
AT
EG
Y &
BU
SIN
ES
SP
ER
FO
RM
AN
CE
RE
VIE
WS
HA
RE
HO
LD
ER
SG
OV
ER
NA
NC
EF
INA
NC
IAL
STA
TE
ME
NT
SASMI STATUTORY ANNUAL REPORT 2016 | OTHER INFORMATION | 174
STICHTING CONTINUÏTEIT ASM INTERNATIONALThe objective of Stichting Continuïteit ASM International (Stichting) is to serve the interests of the Company. To that objective Stichting may, amongst others, acquire, own and vote on our preferred shares in order to maintain our independence and/or continuity and/or identity.
The members of the board of Stichting are: › Dick Bouma, retired Chairman Board Pels Rijcken & Droogleever Fortuijn; › Rob Ruijter, Chairman Supervisory Board Delta Lloyd; › Rinze Veenenga Kingma, President Archeus Consulting BV.
LIST OF SUBSIDIARIES AND OFFICESThe subsidiaries and offices of the Company are listed on page 176 of the Statutory annual report.
SUBSEQUENT EVENTSSubsequent events were evaluated up to March 9, 2017, which is the issuance date of this Statutory annual report 2016. There are no subsequent events to report.
STATUTORY ANNUAL REPORTThe Statutory annual report, prepared in accordance with International Financial Reporting Standards (IFRS), is available free of charge by writing to our corporate offices, sending an email to [email protected] or downloading the file through our website.
AB
OU
TS
TR
AT
EG
Y &
BU
SIN
ES
SP
ER
FO
RM
AN
CE
RE
VIE
WS
HA
RE
HO
LD
ER
SG
OV
ER
NA
NC
EF
INA
NC
IAL
STA
TE
ME
NT
SASMI STATUTORY ANNUAL REPORT 2016 | OTHER INFORMATION | 175
LOCATIONS WORLDWIDE
EUROPE
THE NETHERLANDSASM International NV (HEADQUARTERS)Versterkerstraat 81322 AP AlmereT: +31 88 100 8810F: +31 88 100 8830
ASM Europe BVVersterkerstraat 81322 AP AlmereT: +31 36 540 6711F: +31 36 540 6710
ASM IP Holding BVVersterkerstraat 81322 AP AlmereT: +31 88 100 8810F: +31 88 100 8830
BELGIUMASM Belgium NVKapeldreef 753001 LeuvenT: +32 16 28 1639
FINLANDASM Microchemistry OyPietari Kalmin katu 1 F 200560 HelsinkiT: +358 9 525 540F: +358 9 525 54600
FRANCEASM France SARL223 Rue des Bécasses38920 CrollesT: +33 4 7692 2824F: +33 4 3892 0472
GERMANYASM Germany Sales BVBretonischer Ring 1685630 GrasbrunnT: +49 89 462 3650F: +49 89 462 36566
IRELANDASM Services & Support Ireland LtdUnit 23, Hills Industrial EstateLucan, Co DublinT: +353 1 621 9100F: +353 1 628 0206
ISRAELASM Services & Support Israel LtdC/o 2 Hazaron StKiryat-Gat 82109T: +972 8 6123077
NORTH AMERICA
UNITED STATESASM America, Inc3440 East University DrivePhoenix, AZ 85034-7200T: +1 602 470 5700
Regional Sales/Service Office97 East Brokaw RoadSuite 100San Jose, CA 95112-4209T: +1 408 451 0830
Regional Service Office2500 NW 229th AvenueSuite 100Hillsboro, OR 97124-7114T: +1 503 629 1360
ASIA
CHINAASM China LtdA/N, 15F, No 720 Pudong AvenueShanghai 200120T: +86 21 50 368588F: +86 21 50 368878
JAPANASM Japan KK23-1, 6-chome NagayamaTama-shiTokyo 206-0025T: +81 42 337 6311F: +81 42 389 7555
Daini Technology Center7-2, 2-chome, KurigiAsao-ku, Kawasaki-shiKanagawa 215-0033T: +81 44 712 3681F: +81 44 712 3682
Kumamoto Service Center3F, Mayfair-Suizenji21-30, 1-chome, SuizenjiChuo-ku, Kumamoto-shiKumamoto, 862-0950T: +81 96 387 7300
Nagaoka Factory392-1 MishimashimboNagaoka-shiNiigata 940-2311T: +81 258 42 2400F: +81 258 41 2490
Yokkaichi Service Center3F, Kosco-Yokkaichi-Nishiura Building5-10, 1-chome, Yasujima, Yokkaichi-shiMie 510-0075T: +81 59 340 6100F: +81 59 340 6099
MALAYSIAASM Services & Support Malaysia Sdn BhdSuite 17 and 18, First FloorIncubator Block, Kulim Techno CentreKulim Hi-Tech Park09000, KulimKedah Darul AmanT: +604 403 9330F: +604 403 9330
AB
OU
TS
TR
AT
EG
Y &
BU
SIN
ES
SP
ER
FO
RM
AN
CE
RE
VIE
WS
HA
RE
HO
LD
ER
SG
OV
ER
NA
NC
EF
INA
NC
IAL
STA
TE
ME
NT
SASMI STATUTORY ANNUAL REPORT 2016 | LOCATIONS WORLDWIDE | 176

SINGAPOREASM Front-End Manufacturing Singapore Pte Ltd543 Yishun Industrial Park ASingapore 768765T: +65 6512 2922F: +65 6512 2966
ASM Wafer Process Equipment Singapore Pte Ltd543 Yishun Industrial Park ASingapore 768765T: +65 6512 2962F: +65 6512 2961
SOUTH KOREAASM Korea LtdHead OfficeSungKong-kwan 1 DongCheonan Valley, ChungNam Techno Park136, Jiksan-ro, Jiksan-eupSeobuk-ku, Cheonan-si, Chungcheongnam-do, 31035T: +82 70 7596 7800F: +82 41 5890 201
ASM Korea LtdBunDang Branch Office10F, 1-Dong, 17, 228 St Pankyo-ro Bundang-ku, Sungnam-siGyeonggi-do, 13487T: +82 70 7596 7788F: +82 31 8016 9970
TAIWANASM Front-End Sales & Services Taiwan Co, LtdHsin-Chu Office2F-5, No 1, Jinshan 8th StEast Dist, Hsinchu City 300T: +886 3 666 7722F: +886 3 564 8899
ASM Front-End Sales & Services Taiwan Co, LtdLin-Kuo Office2F, No 50, Fuxing 3rd RdGuishan Dist, Taoyuan City 333T: +886 3 211 5279F: +886 3 328 5358
ASM Front-End Sales & Services Taiwan Co, LtdTai-Chung OfficeNo 20-2, Ln 1230, Sec 4, Taiwan BlvdXitun Dist, Taichung City 407T: +886 4 2465 1086F: +886 4 2463 3707
ASM Front-End Sales & Services Taiwan Co, LtdTai-Nan OfficeRm 612, 6F, No 13, Guoji RdXinshi Dist, Tainan City 744T: +886 6 589 2368F: +886 6 589 2710
AB
OU
TS
TR
AT
EG
Y &
BU
SIN
ES
SP
ER
FO
RM
AN
CE
RE
VIE
WS
HA
RE
HO
LD
ER
SG
OV
ER
NA
NC
EF
INA
NC
IAL
STA
TE
ME
NT
SASMI STATUTORY ANNUAL REPORT 2016 | LOCATIONS WORLDWIDE | 177
SAFE HARBOR STATEMENT
In addition to historical information, some of the information posted or referenced on this website contains statements relating to our future business and/or results, including, among others, statements regarding future revenue, sales, income, expenditures, sufficiency of cash generated from operations, maintenance of interest in ASM Pacific Technology Ltd, business strategy, product development, product acceptance, market penetration, market demand, return on investment in new products, facility completion dates and product shipment dates, corporate transactions, restructurings, liquidity and financing matters, outlooks, and any other non-historical information. These statements include certain projections and business trends, which are ‘forward-looking’. We caution readers that no forward-looking statement is a guarantee of future performance and that actual results could differ materially from those contained in the forward-looking statements.
You can identify forward looking statements by the use of words like ‘may’, ‘could’, ‘should’, ‘project’, ‘believe’, ‘anticipate’, ‘expect’, ‘plan’, ‘estimate’, ‘forecast’, ‘potential’, ‘intend’, ‘continue’, and variations of these words or comparable words.
Forward-looking statements do not guarantee future performance and involve risks and uncertainties. You should be aware that our actual results may differ materially from those contained in the forward-looking statements as a result of certain risks and uncertainties. These risks and uncertainties include, but are not limited to, economic conditions and trends in the semiconductor industry and the duration of industry downturns, currency fluctuations, the timing of significant orders, market acceptance of new products, competitive factors, litigation involving intellectual property, shareholder or other issues, commercial and economic disruption due to natural disasters, terrorist activity, armed conflict or political instability, epidemics and other risks indicated in our most recently filed Statutory annual report and other filings from time to time. The risks described are not the only ones. Some risks are not yet known and some that we do not currently believe to be material could later become material. Each of these risks could materially affect our business, revenues, income, assets, liquidity, and capital resources. All statements are made as of the date of posting unless otherwise noted, and we assume no obligation to update or revise any forward-looking statements to reflect future developments or circumstances.
AB
OU
TS
TR
AT
EG
Y &
BU
SIN
ES
SP
ER
FO
RM
AN
CE
RE
VIE
WS
HA
RE
HO
LD
ER
SG
OV
ER
NA
NC
EF
INA
NC
IAL
STA
TE
ME
NT
SASMI STATUTORY ANNUAL REPORT 2016 | SAFE HARBOR STATEMENT | 178