Embed Size (px)
Citation preview
Connecting “the D’s” to Vehicle Miles Traveled in the Sacramento Region
Presentation toSB375 Regional Targets Advisory Committee
February 3, 2009
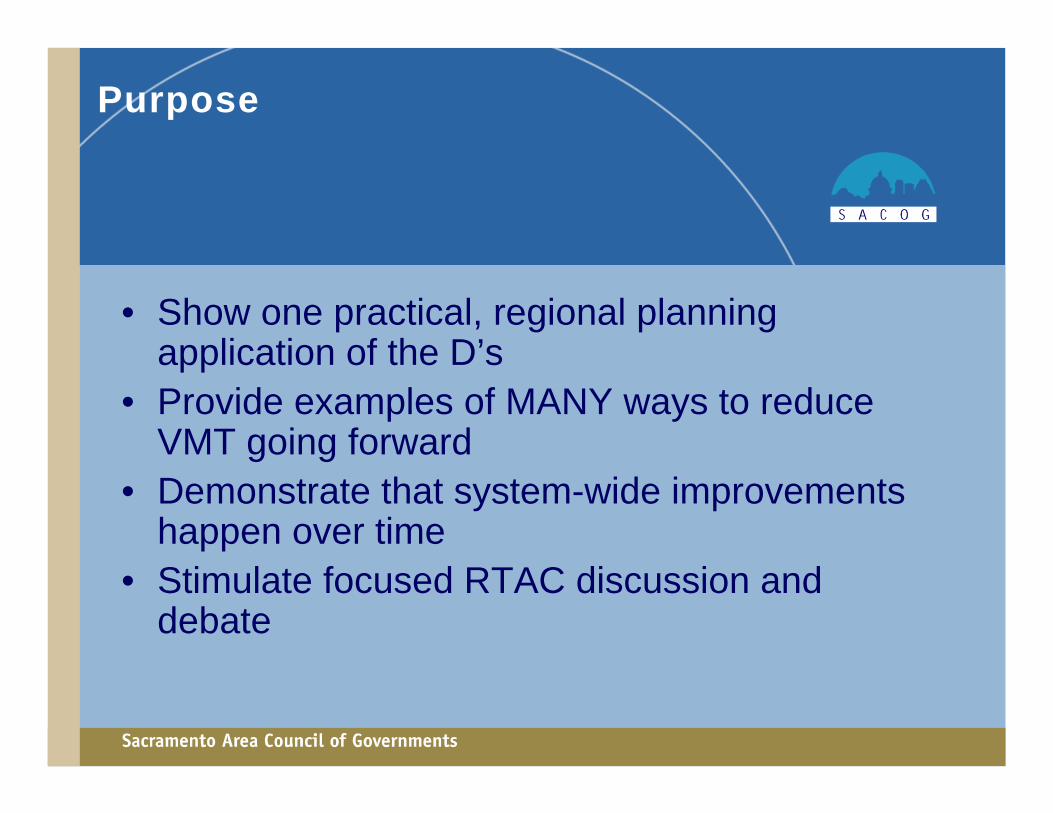
Purpose
• Show one practical, regional planning application of the D’s
• Provide examples of MANY ways to reduce VMT going forward
• Demonstrate that system-wide improvements happen over time
• Stimulate focused RTAC discussion and debate
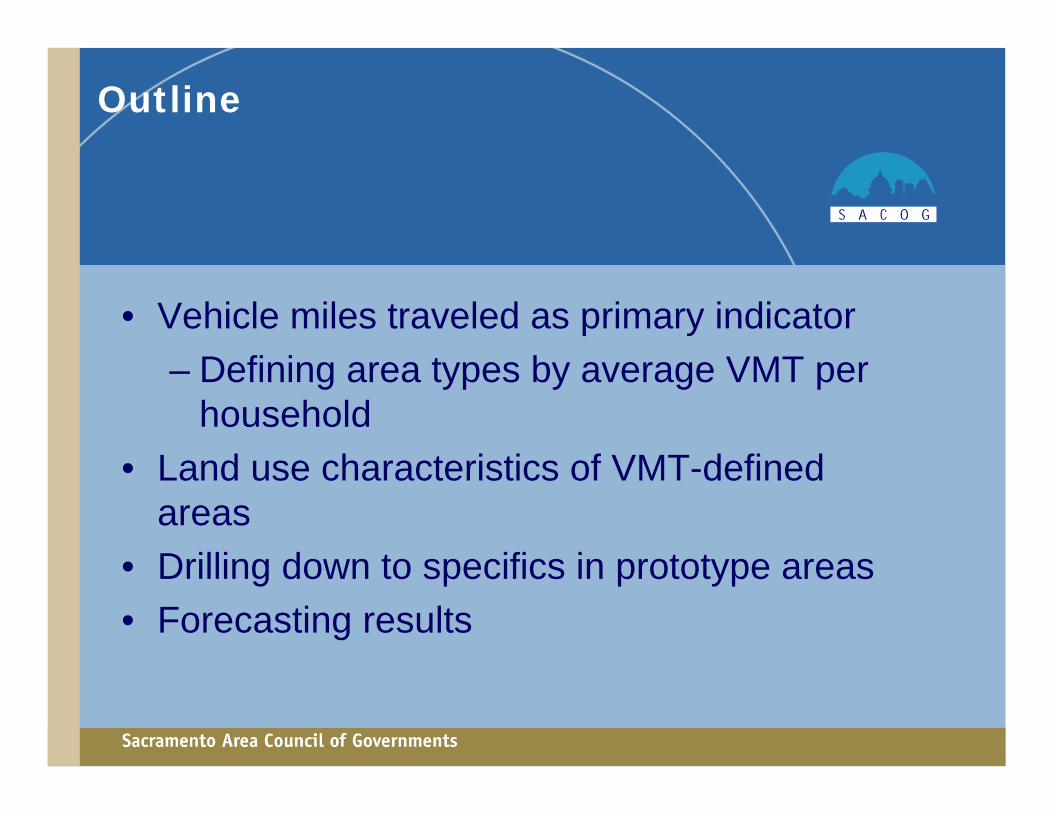
Outline
• Vehicle miles traveled as primary indicator– Defining area types by average VMT per
household• Land use characteristics of VMT-defined
areas• Drilling down to specifics in prototype areas• Forecasting results
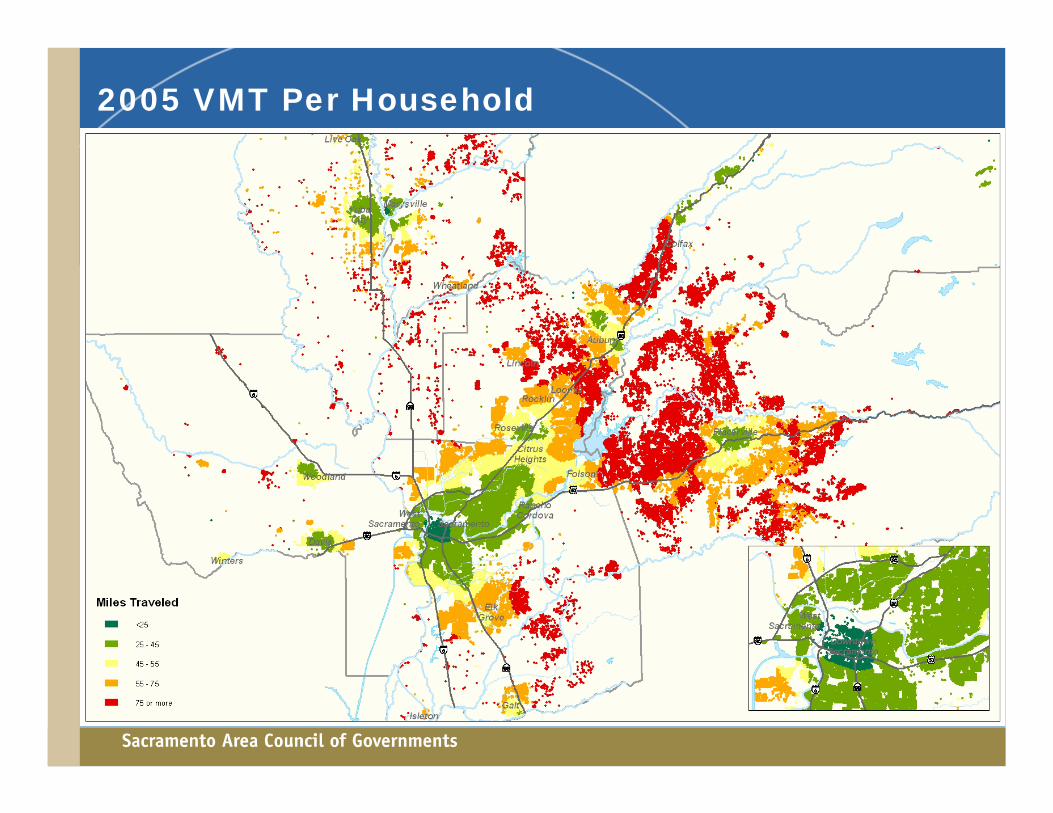
2005 VMT Per Household
2005 VMT Per Household
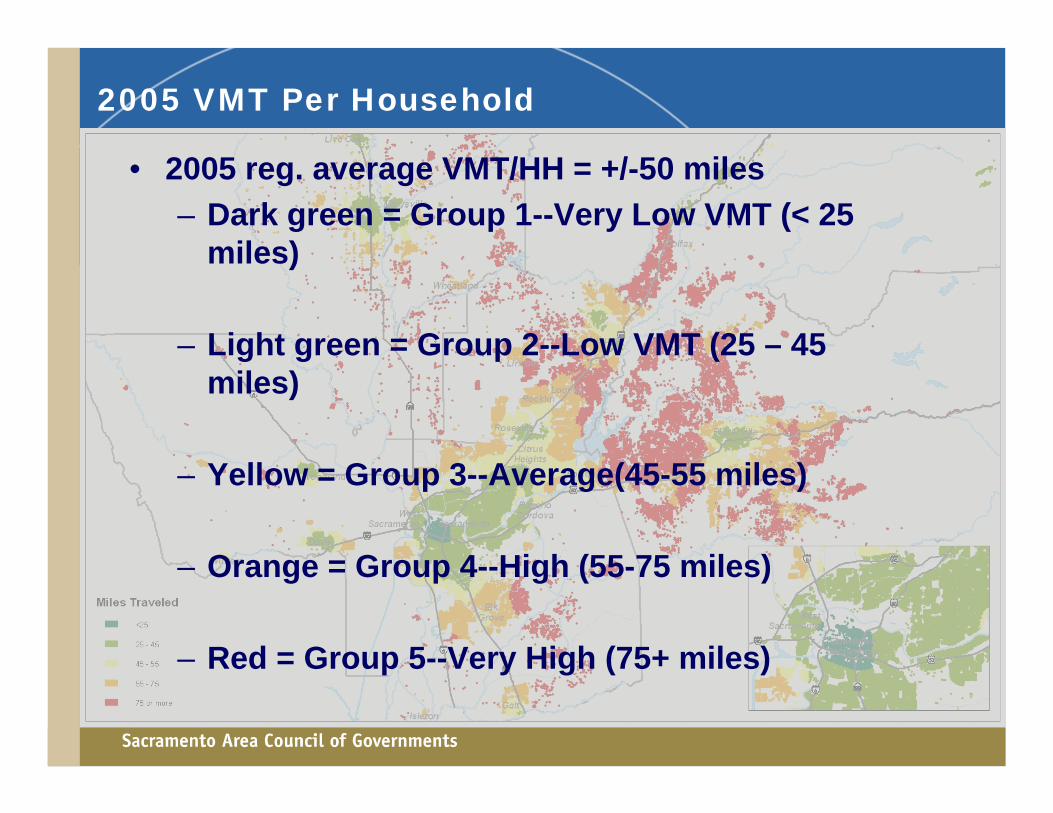
• 2005 reg. average VMT/HH = +/-50 miles– Dark green = Group 1--Very Low VMT (< 25
miles)
– Light green = Group 2--Low VMT (25 – 45 miles)
– Yellow = Group 3--Average(45-55 miles)
– Orange = Group 4--High (55-75 miles)
– Red = Group 5--Very High (75+ miles)
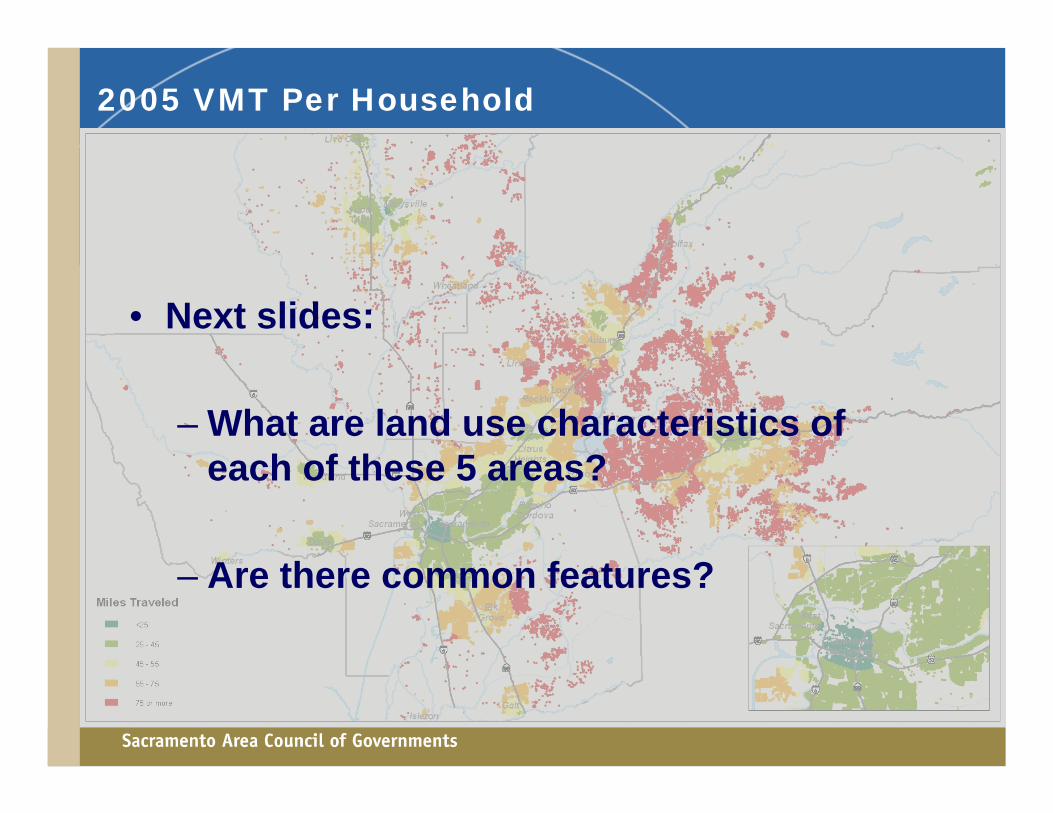
2005 VMT Per Household
• Next slides:
– What are land use characteristics of each of these 5 areas?
– Are there common features?
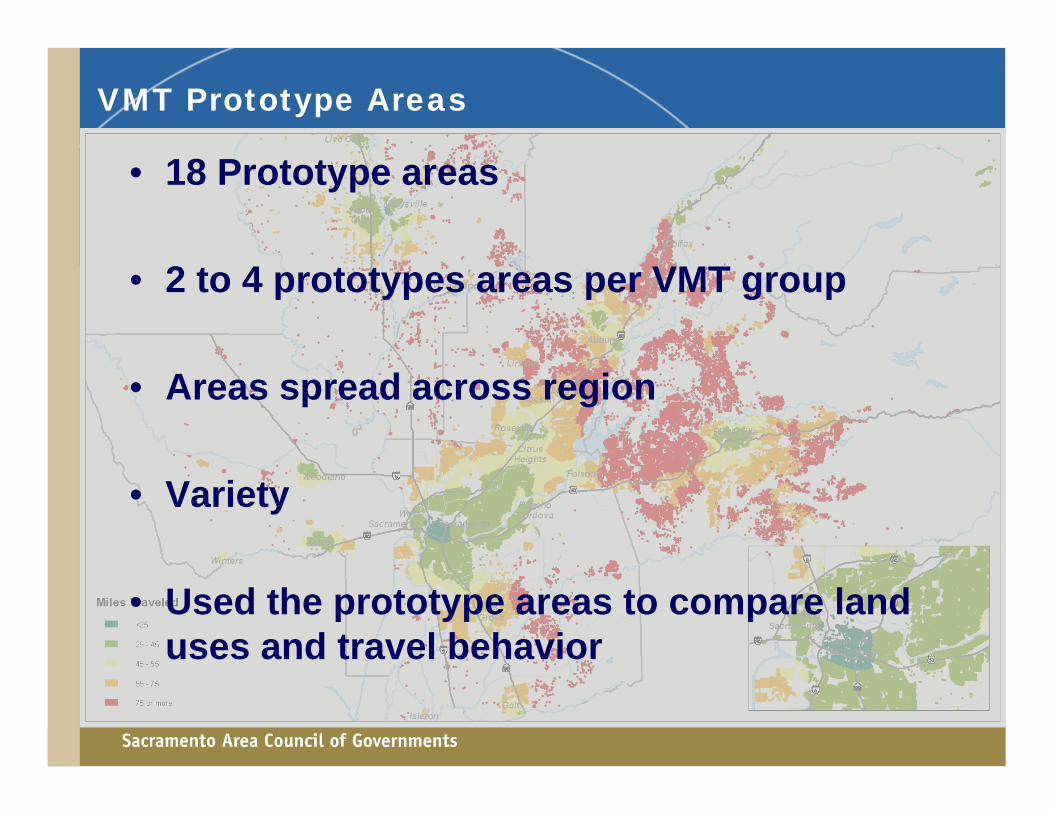
VMT Prototype Areas
• 18 Prototype areas
• 2 to 4 prototypes areas per VMT group
• Areas spread across region
• Variety
• Used the prototype areas to compare land uses and travel behavior
B
A
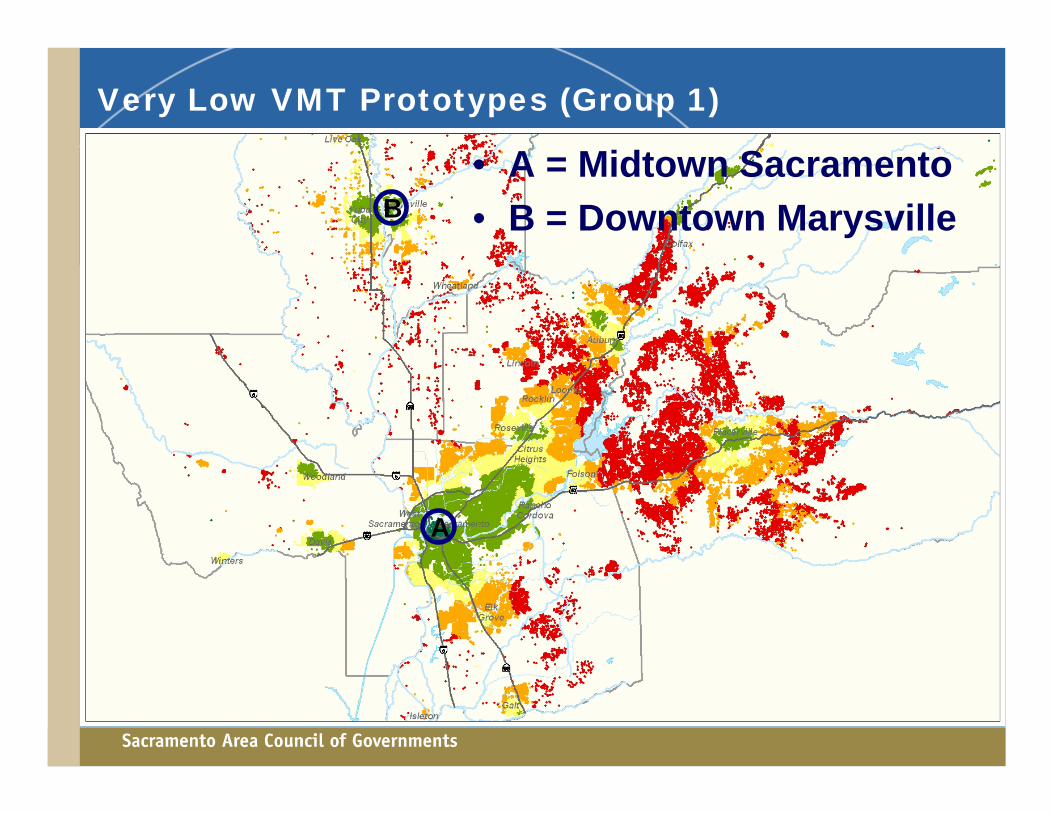
Very Low VMT Prototypes (Group 1)
• A = Midtown Sacramento• B = Downtown Marysville
A
CD
B
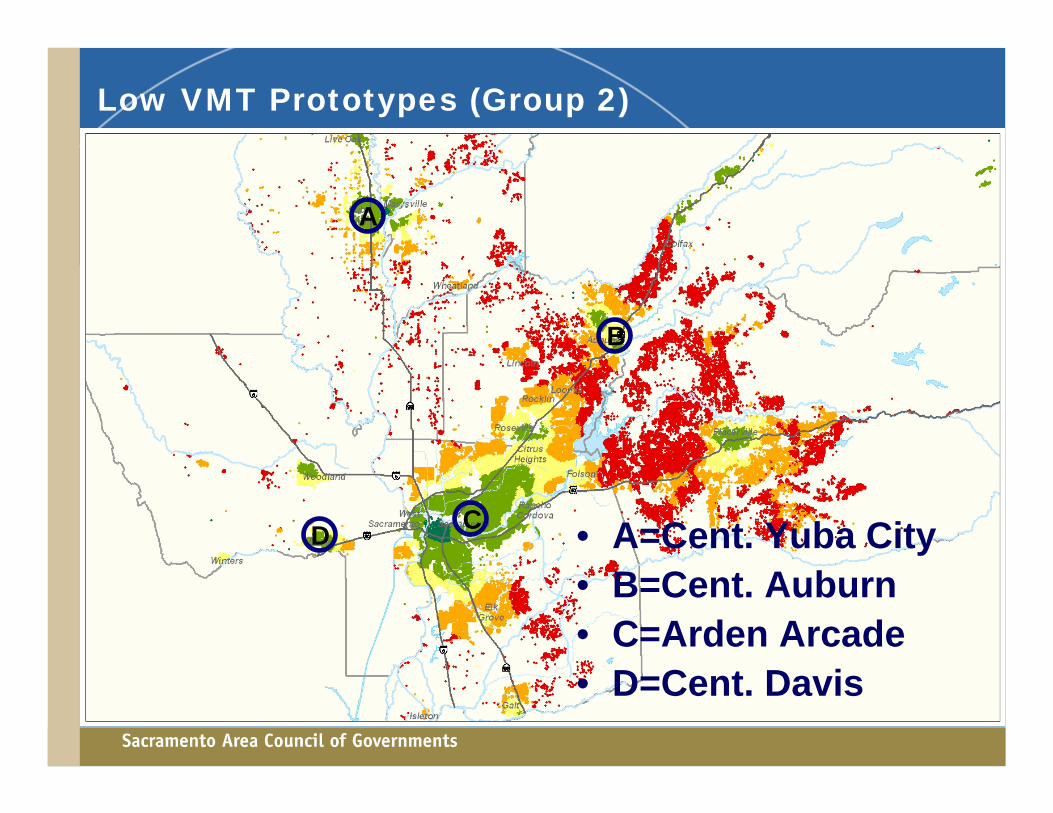
Low VMT Prototypes (Group 2)
• A=Cent. Yuba City• B=Cent. Auburn• C=Arden Arcade• D=Cent. Davis
DC
AB
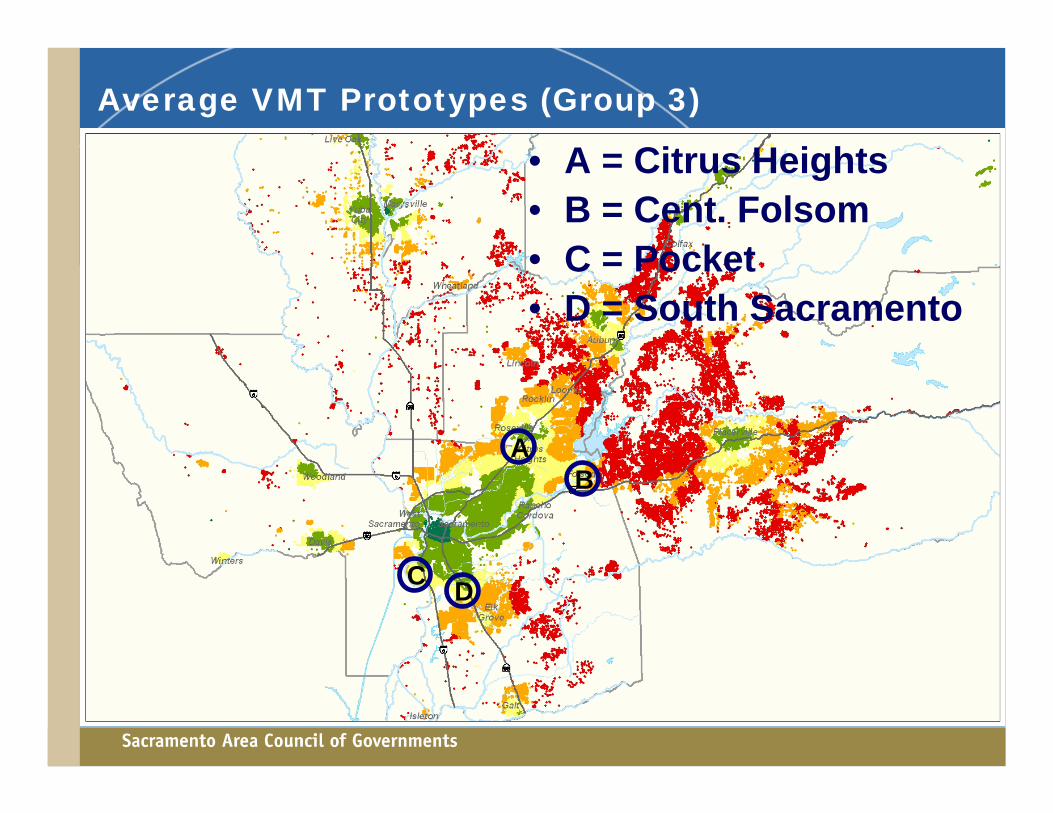
Average VMT Prototypes (Group 3)
• A = Citrus Heights• B = Cent. Folsom• C = Pocket• D = South Sacramento
B
D
C
A
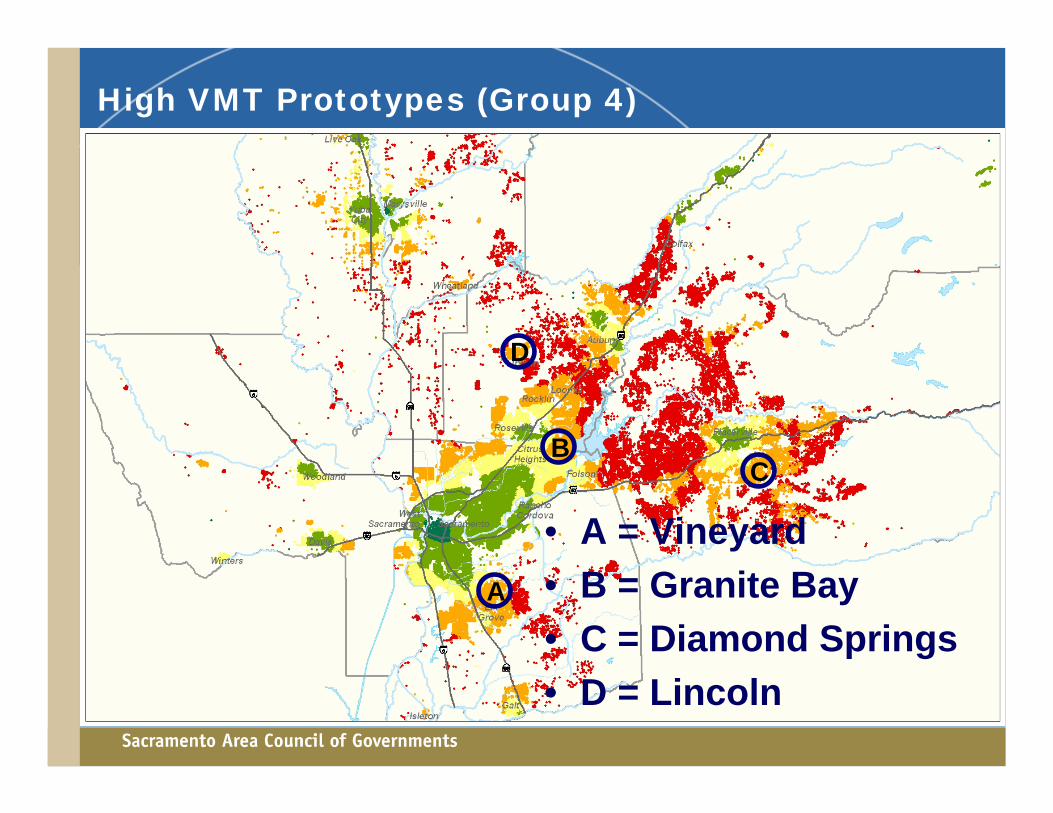
High VMT Prototypes (Group 4)
• A = Vineyard• B = Granite Bay• C = Diamond Springs• D = Lincoln
D
AC
B
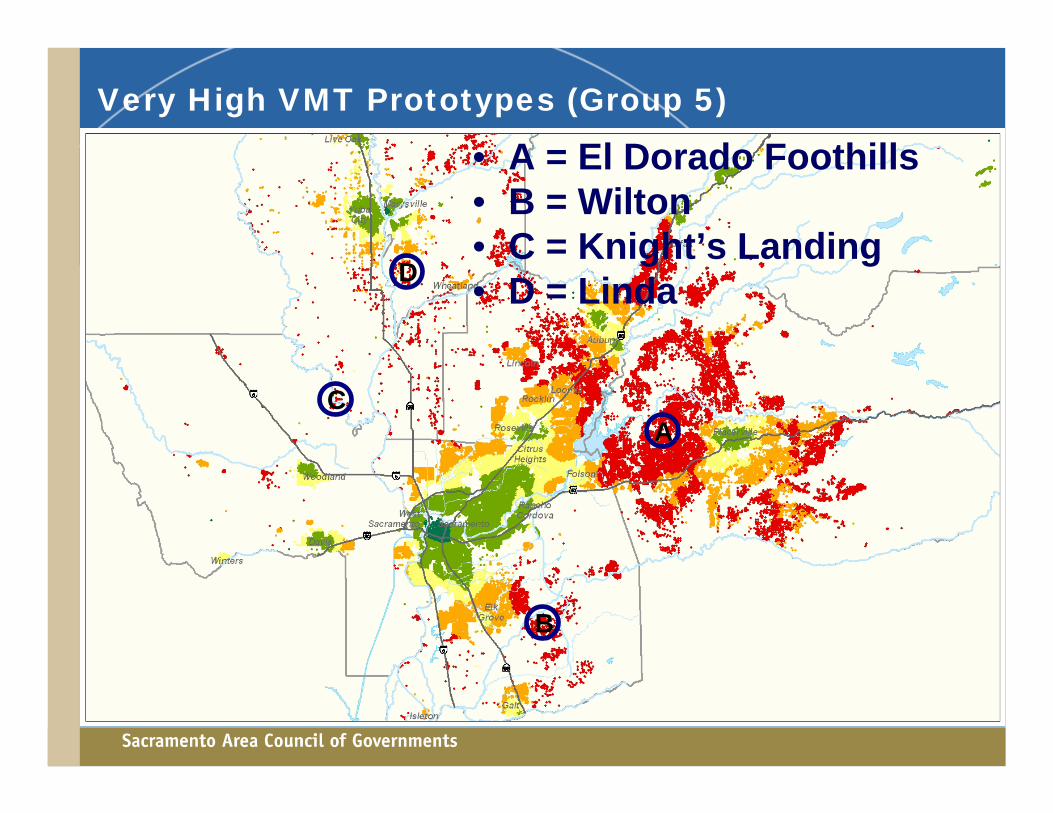
Very High VMT Prototypes (Group 5)
• A = El Dorado Foothills• B = Wilton• C = Knight’s Landing• D = Linda
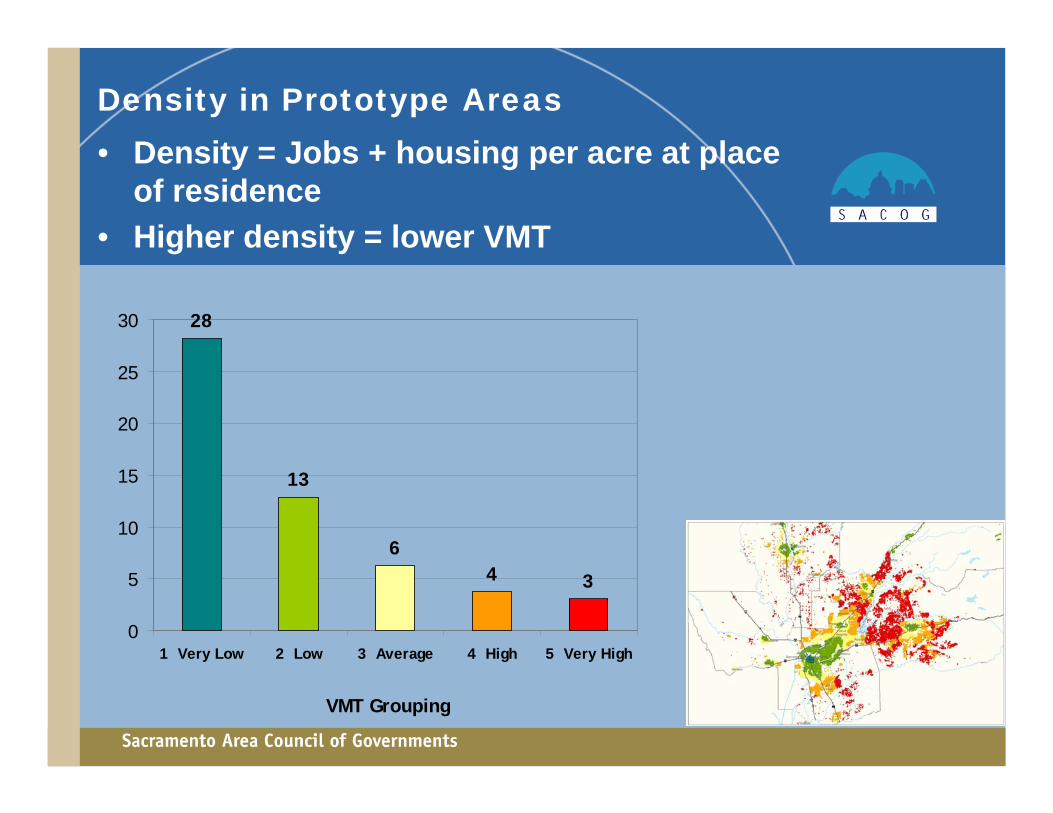
Density in Prototype Areas• Density = Jobs + housing per acre at place
of residence• Higher density = lower VMT
28
13
64 3
0
5
10
15
20
25
30
1 Very Low 2 Low 3 Average 4 High 5 Very High
VMT Grouping
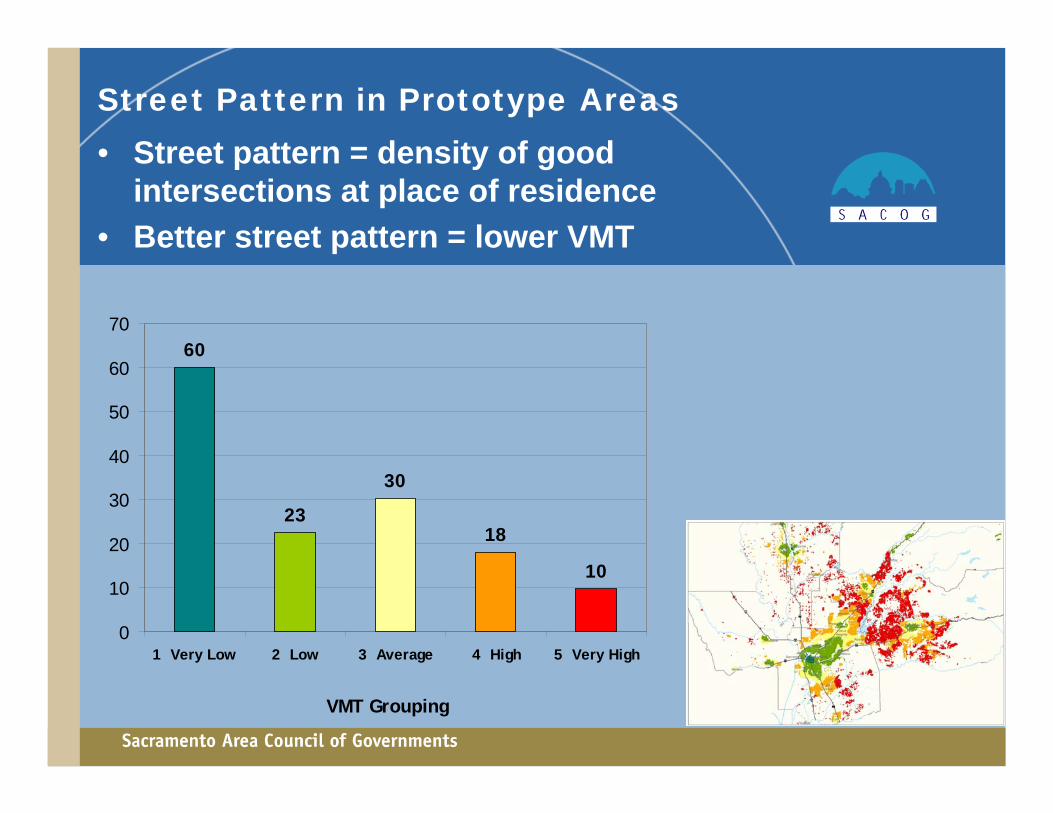
Street Pattern in Prototype Areas• Street pattern = density of good
intersections at place of residence• Better street pattern = lower VMT
60
23
30
18
10
0
10
20
30
40
50
60
70
1 Very Low 2 Low 3 Average 4 High 5 Very High
VMT Grouping
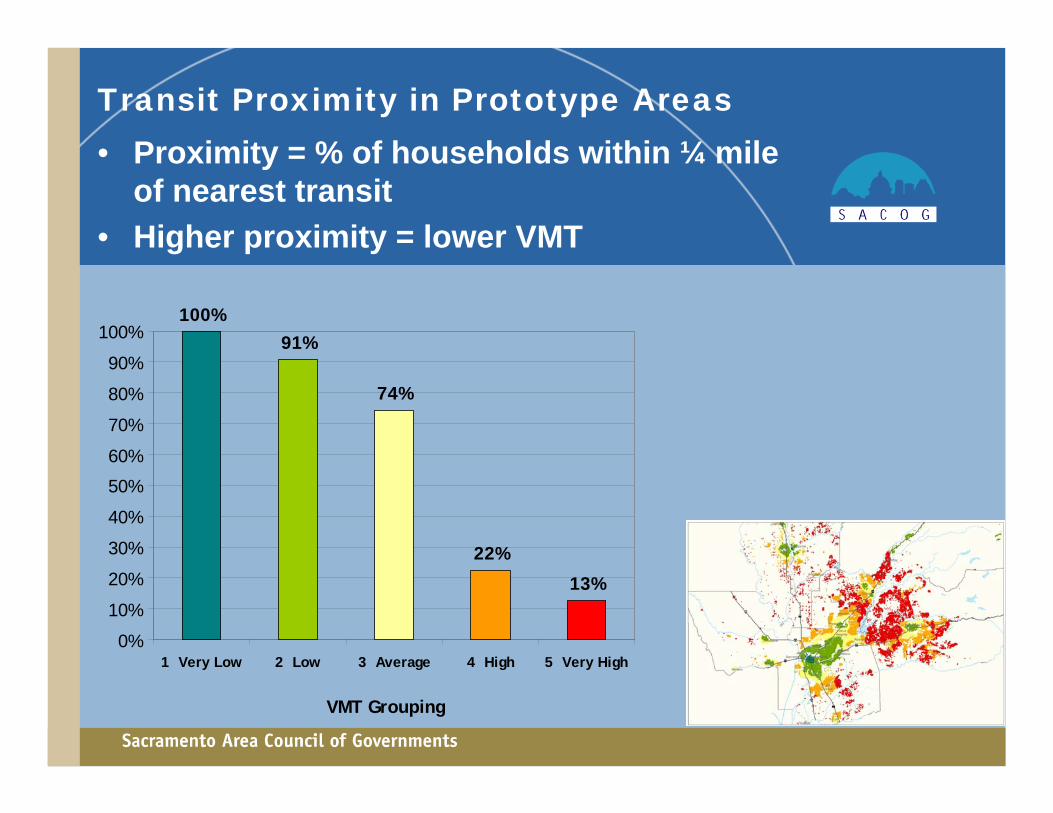
Transit Proximity in Prototype Areas• Proximity = % of households within ¼ mile
of nearest transit• Higher proximity = lower VMT
100%91%
74%
22%
13%
0%
10%
20%
30%
40%
50%
60%
70%
80%
90%
100%
1 Very Low 2 Low 3 Average 4 High 5 Very High
VMT Grouping
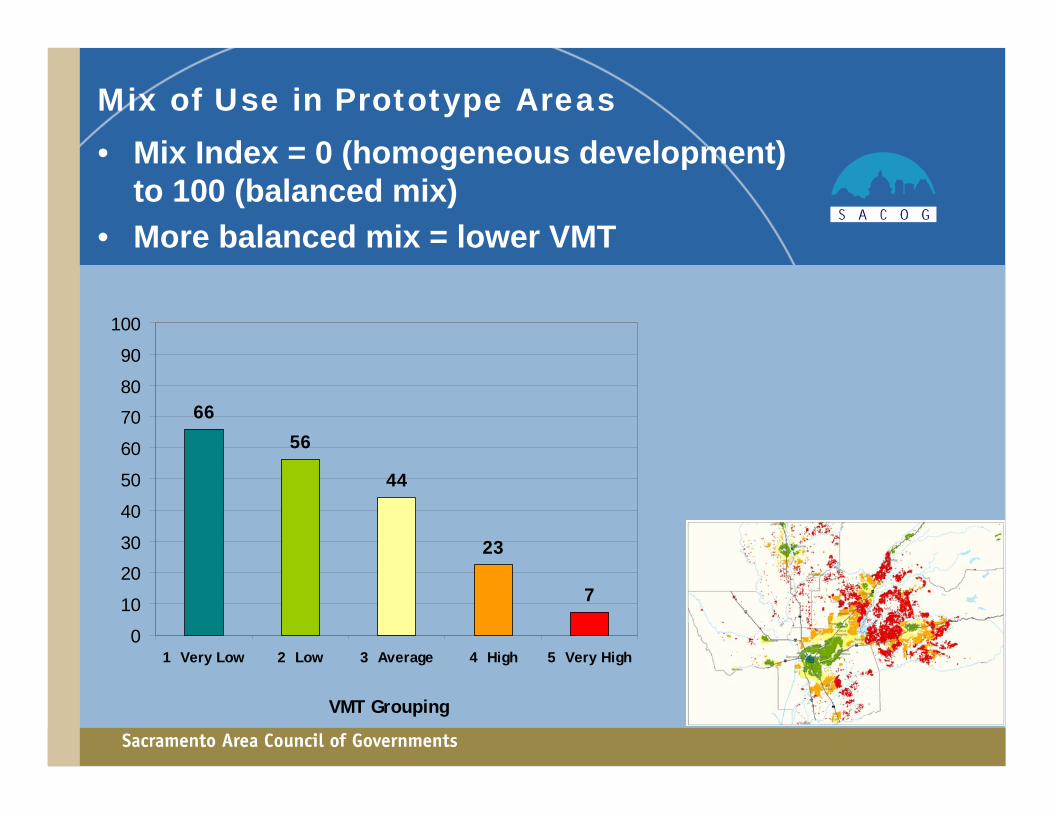
Mix of Use in Prototype Areas• Mix Index = 0 (homogeneous development)
to 100 (balanced mix)• More balanced mix = lower VMT
66
56
44
23
7
0
10
20
30
40
50
60
70
80
90
100
1 Very Low 2 Low 3 Average 4 High 5 Very High
VMT Grouping
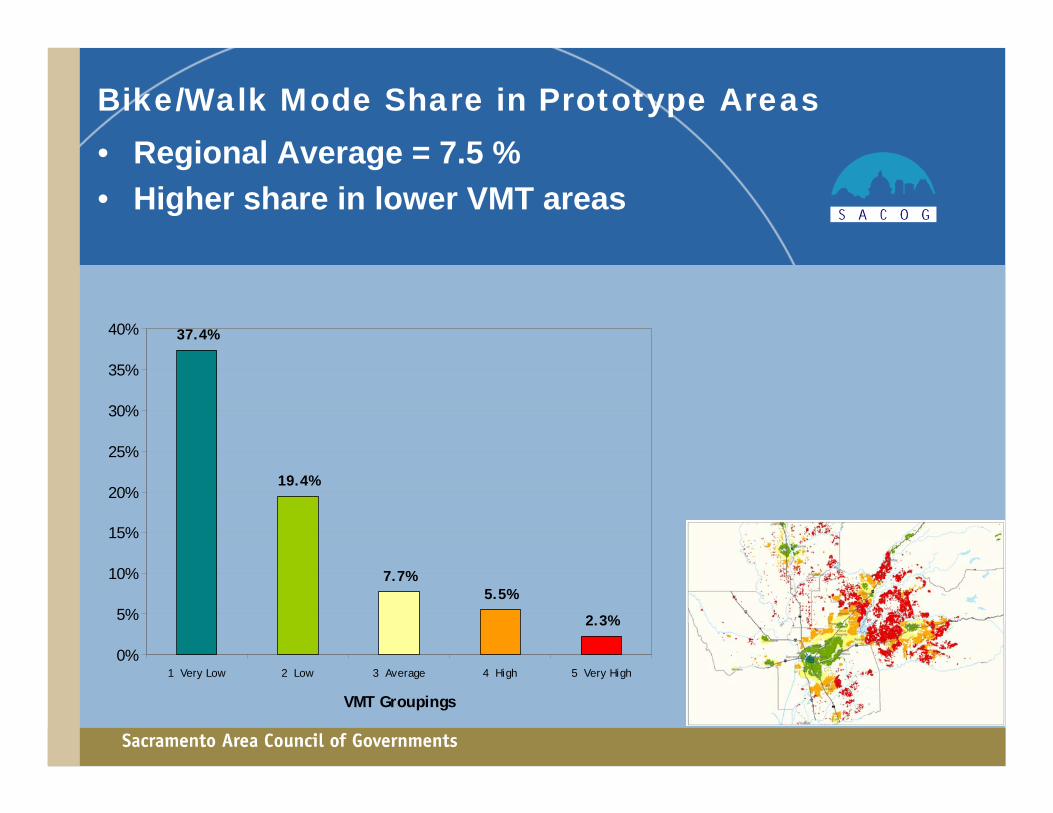
Bike/Walk Mode Share in Prototype Areas• Regional Average = 7.5 %• Higher share in lower VMT areas
37.4%
19.4%
7.7%5.5%
2.3%
0%
5%
10%
15%
20%
25%
30%
35%
40%
1 Very Low 2 Low 3 Average 4 High 5 Very High
VMT Groupings
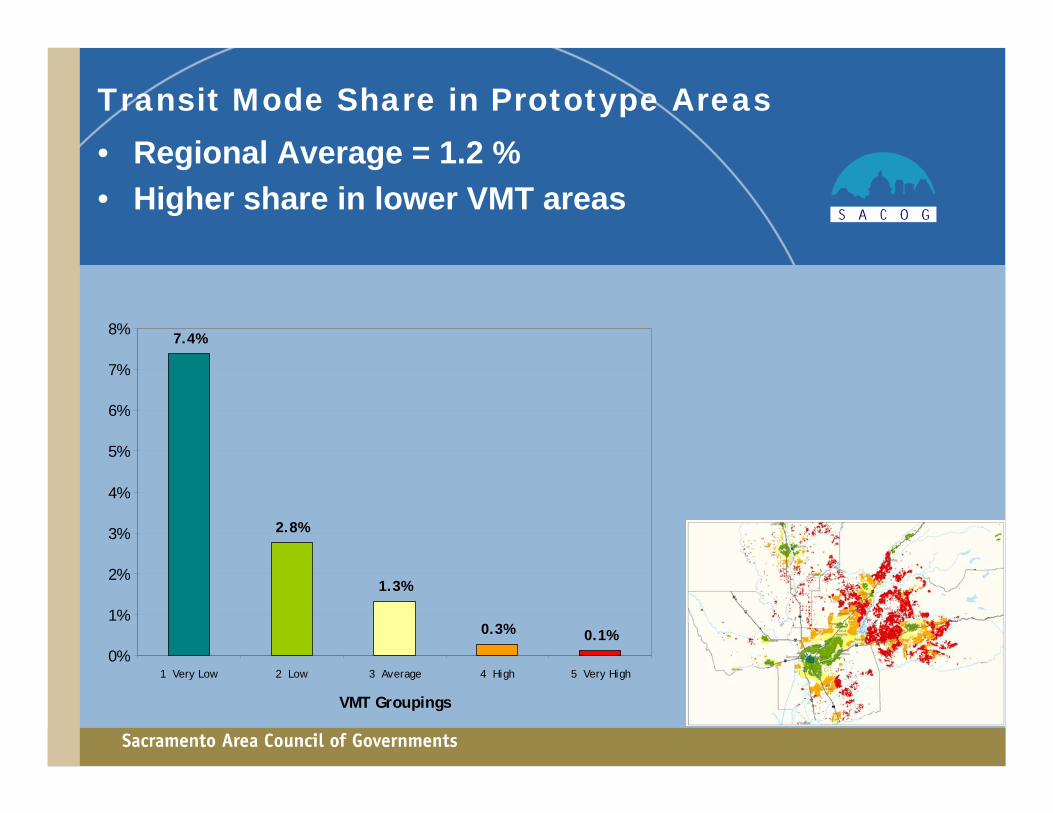
Transit Mode Share in Prototype Areas• Regional Average = 1.2 %• Higher share in lower VMT areas
7.4%
2.8%
1.3%
0.3% 0.1%0%
1%
2%
3%
4%
5%
6%
7%
8%
1 Very Low 2 Low 3 Average 4 High 5 Very High
VMT Groupings
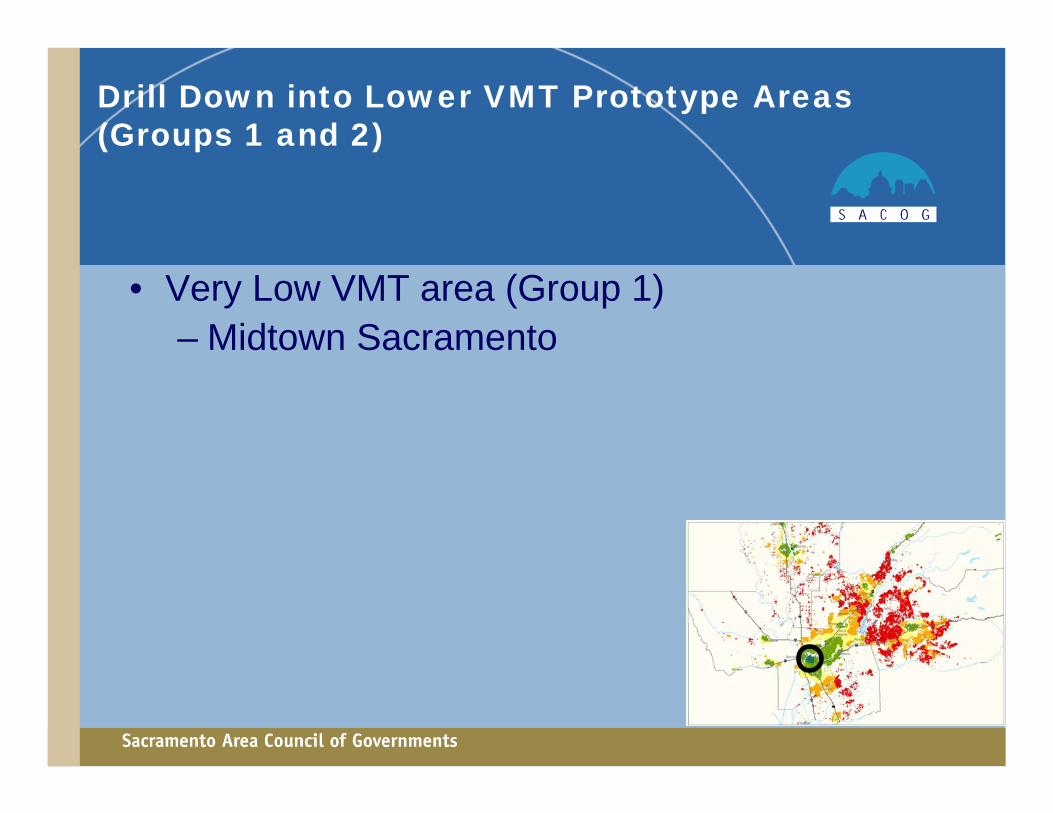
Drill Down into Lower VMT Prototype Areas (Groups 1 and 2)
• Very Low VMT area (Group 1)– Midtown Sacramento
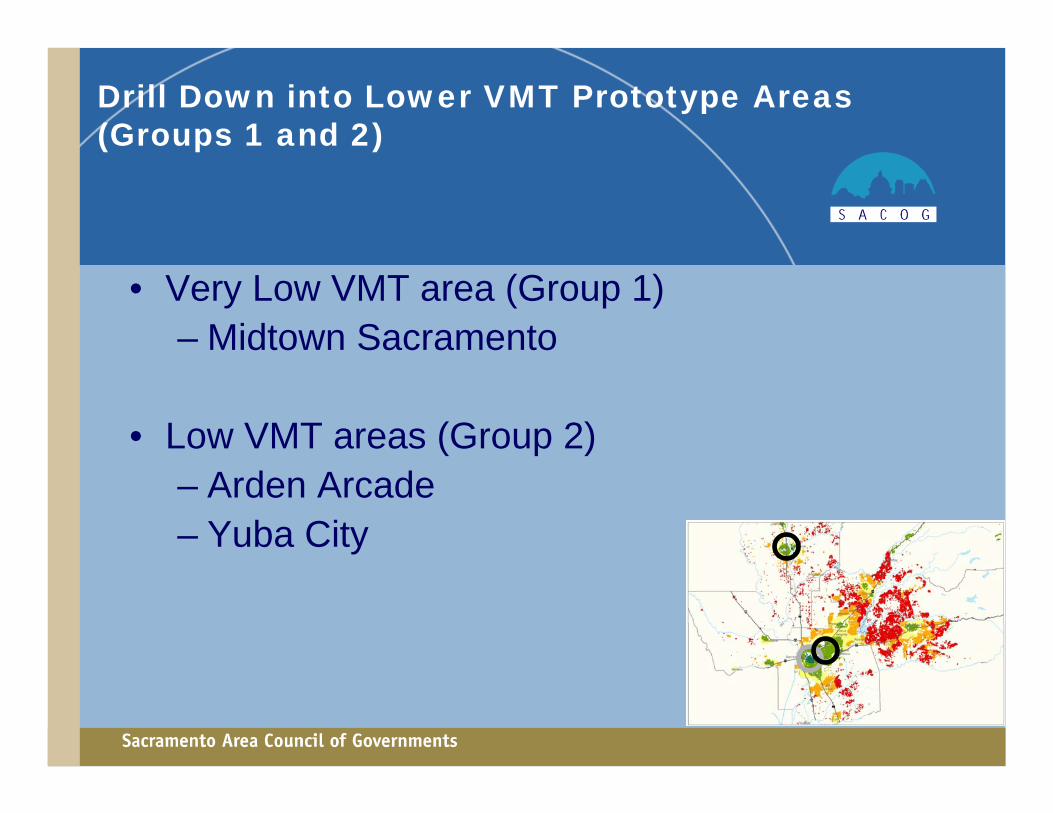
Drill Down into Lower VMT Prototype Areas (Groups 1 and 2)
• Very Low VMT area (Group 1)– Midtown Sacramento
• Low VMT areas (Group 2)– Arden Arcade– Yuba City
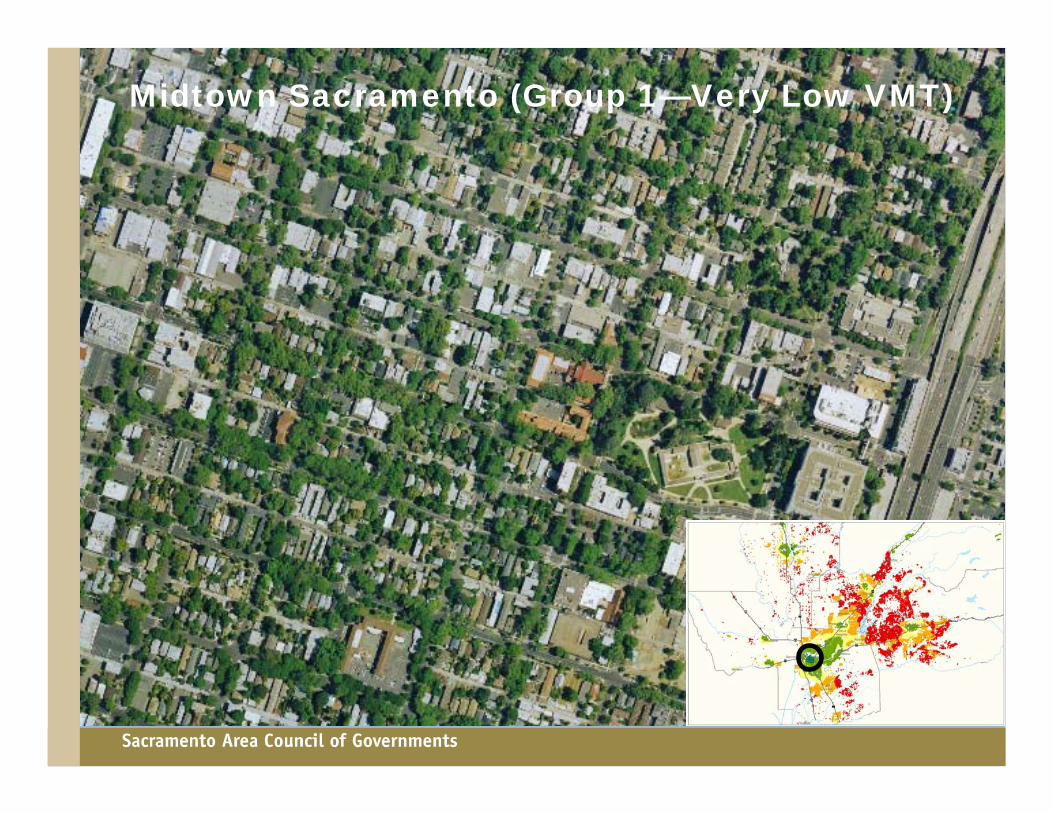
Midtown Sacramento (Group 1—Very Low VMT)
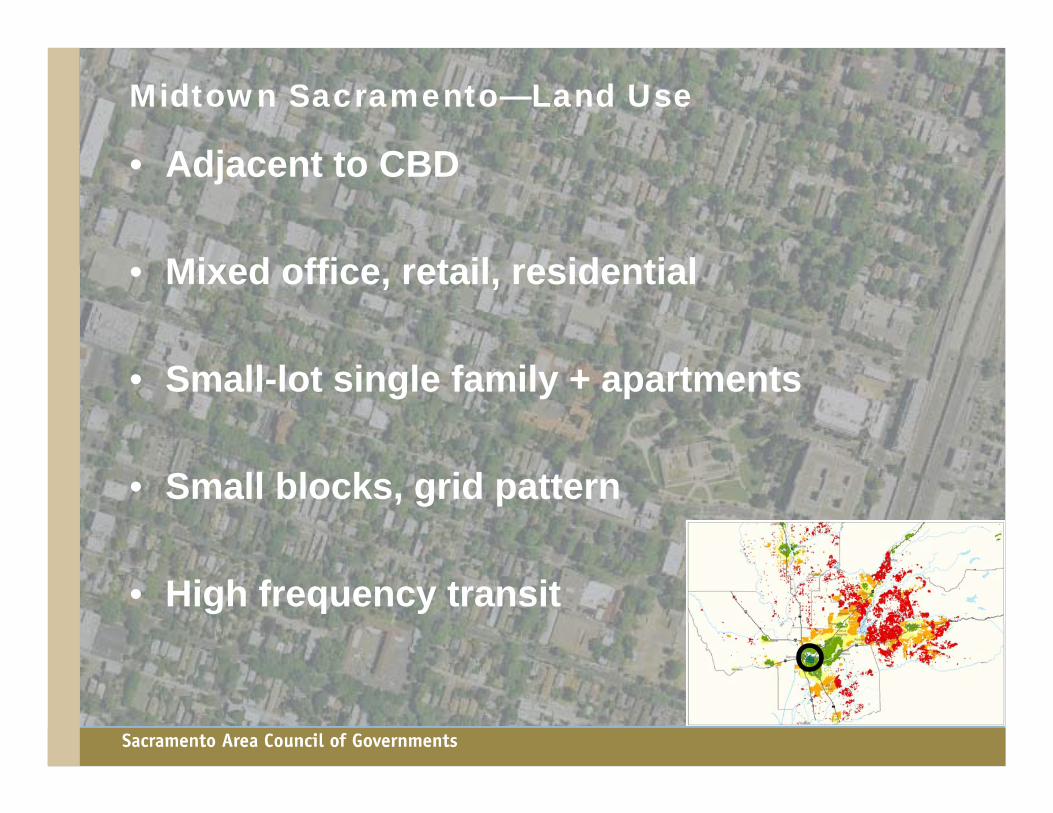
Midtown Sacramento—Land Use
• Adjacent to CBD
• Mixed office, retail, residential
• Small-lot single family + apartments
• Small blocks, grid pattern
• High frequency transit
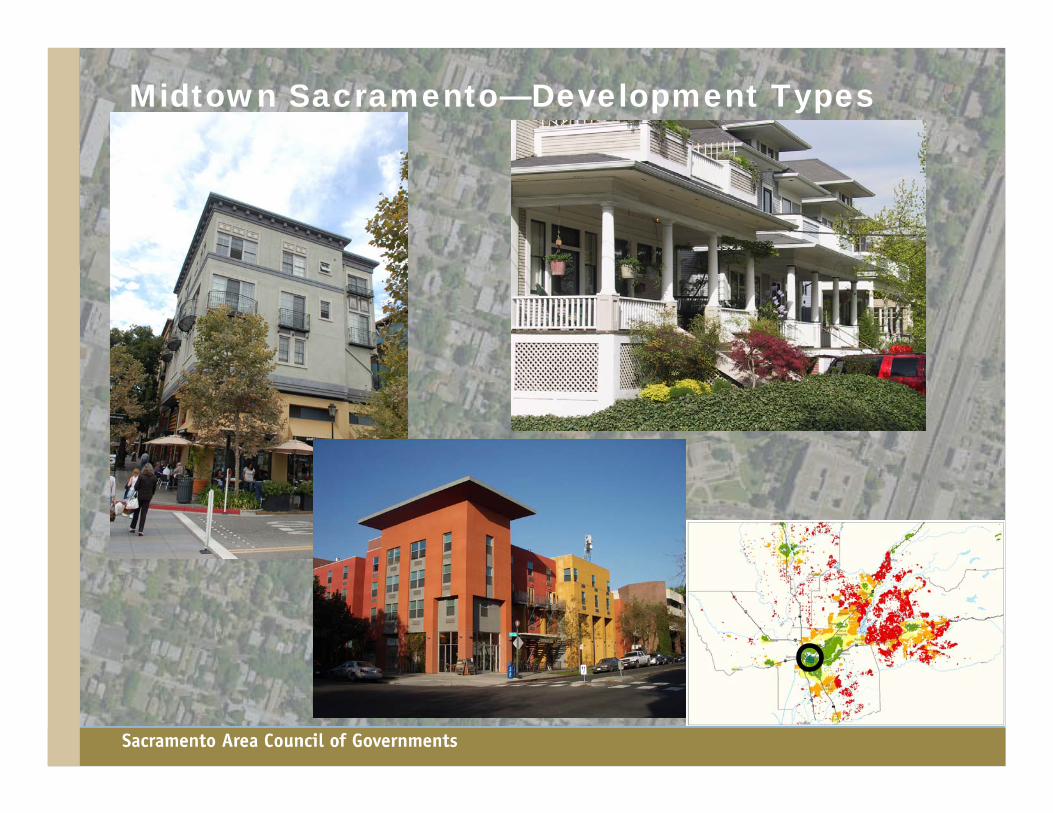
Midtown Sacramento—Development Types
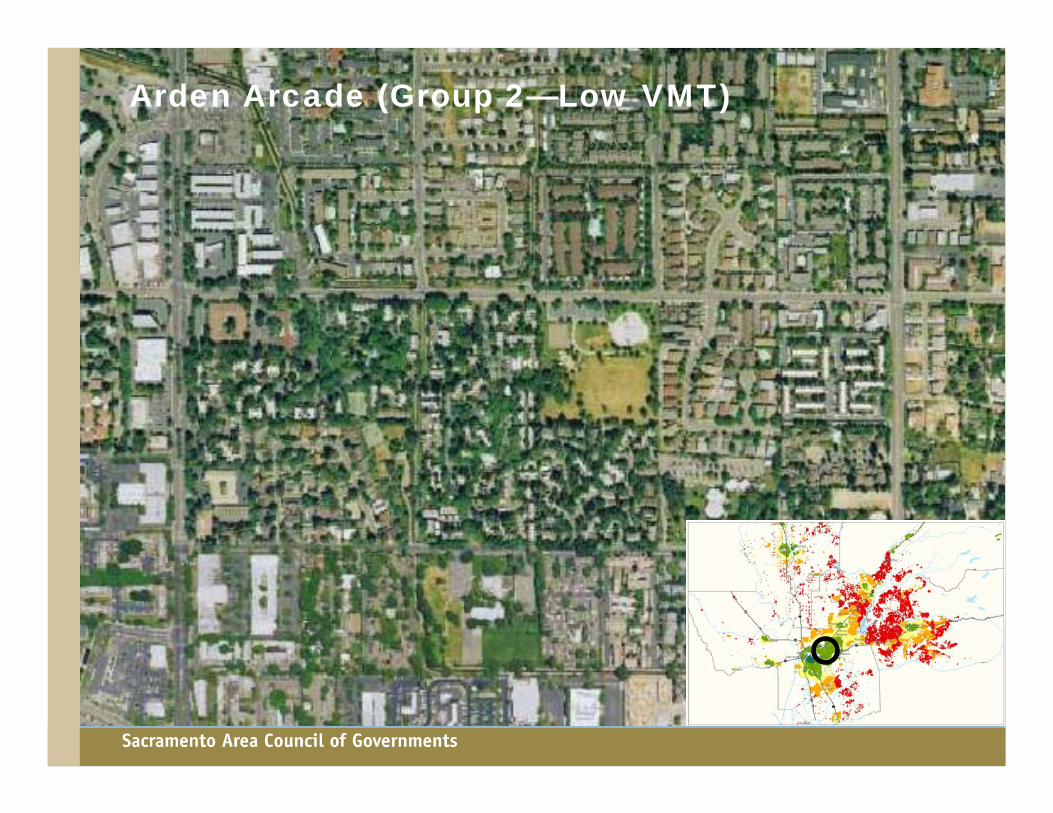
Arden Arcade (Group 2—Low VMT)
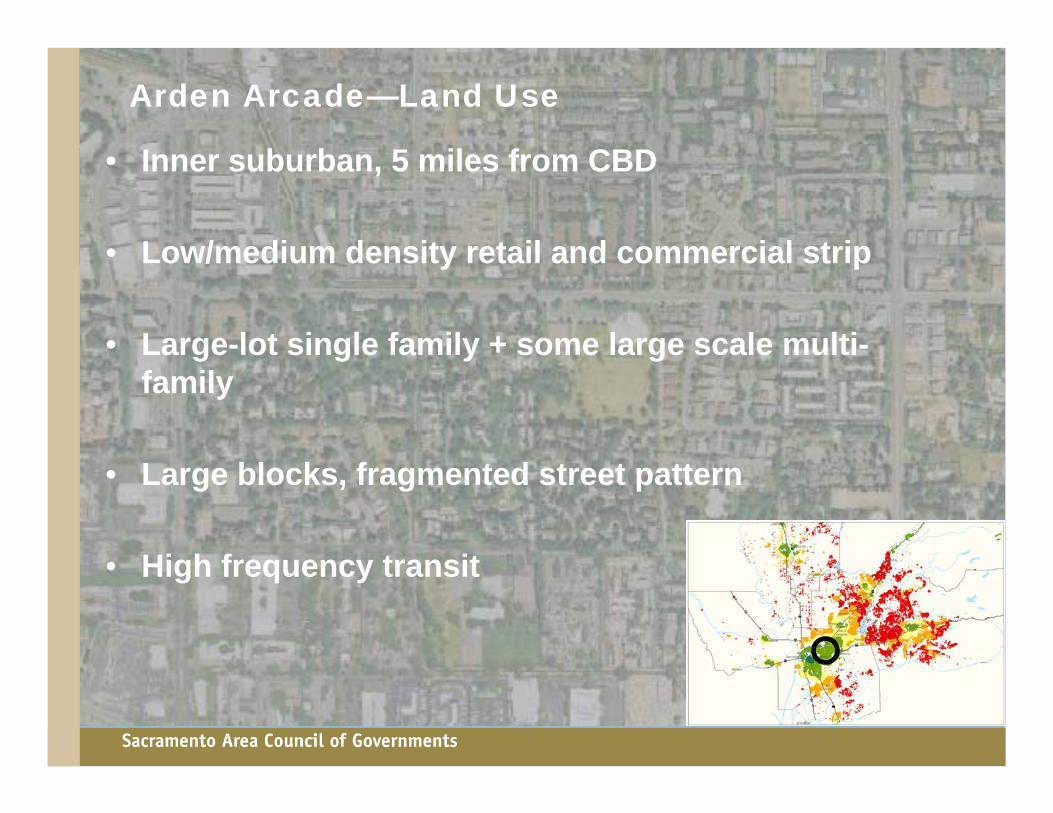
Arden Arcade—Land Use
• Inner suburban, 5 miles from CBD
• Low/medium density retail and commercial strip
• Large-lot single family + some large scale multi-family
• Large blocks, fragmented street pattern
• High frequency transit
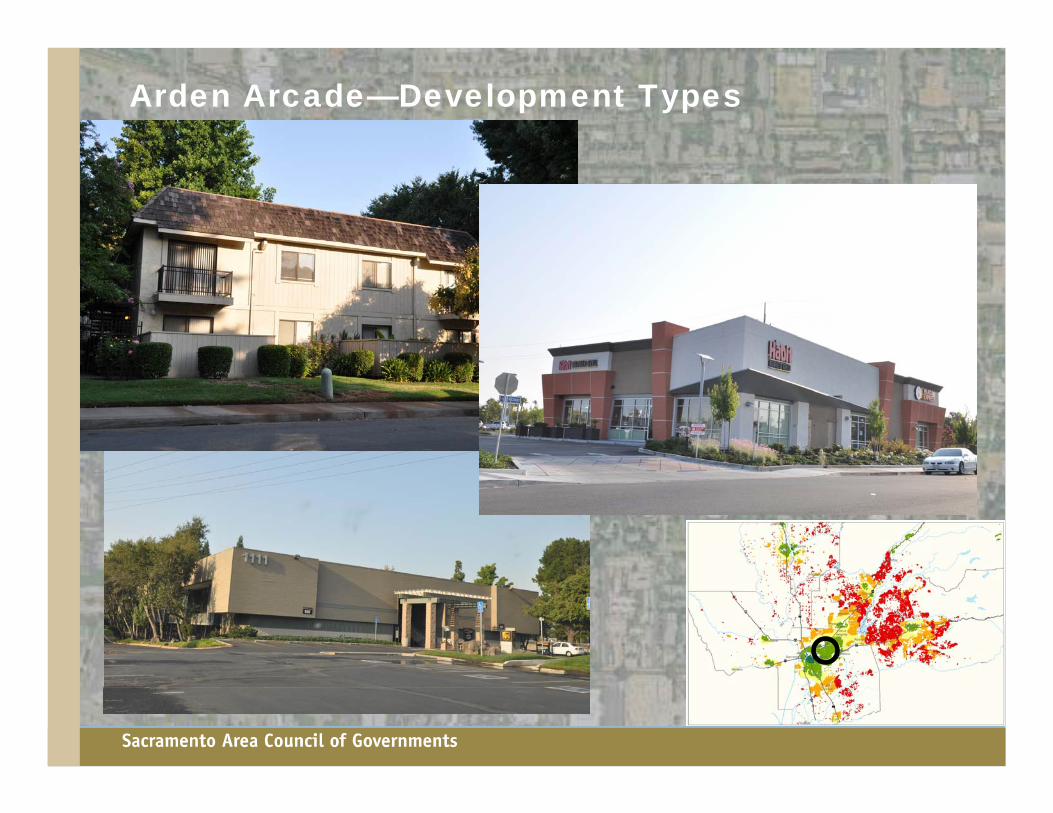
Arden Arcade—Development Types
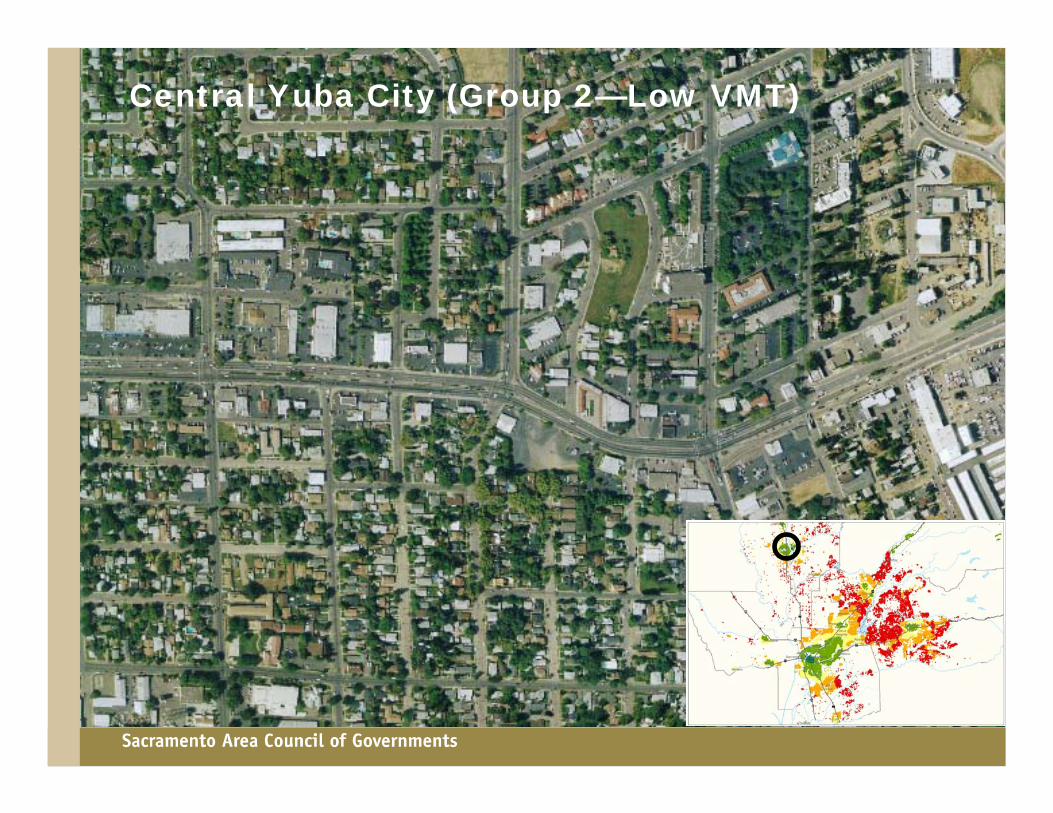
Central Yuba City (Group 2—Low VMT)
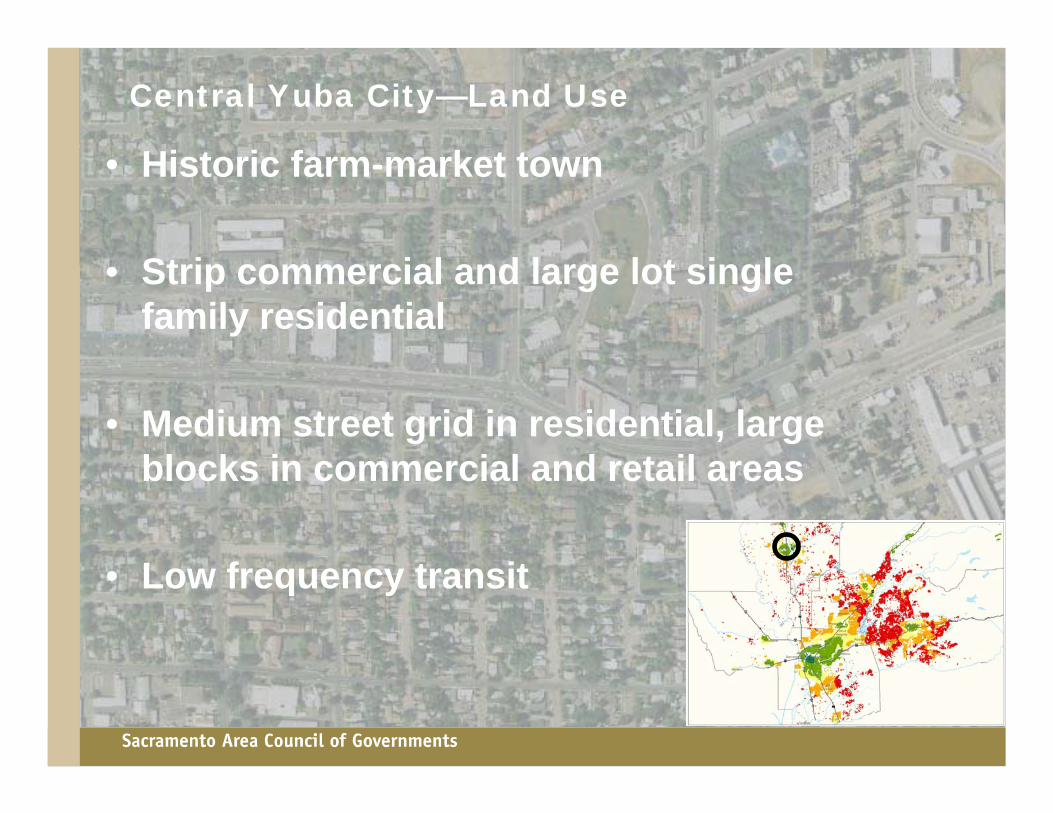
Central Yuba City—Land Use
• Historic farm-market town
• Strip commercial and large lot single family residential
• Medium street grid in residential, large blocks in commercial and retail areas
• Low frequency transit
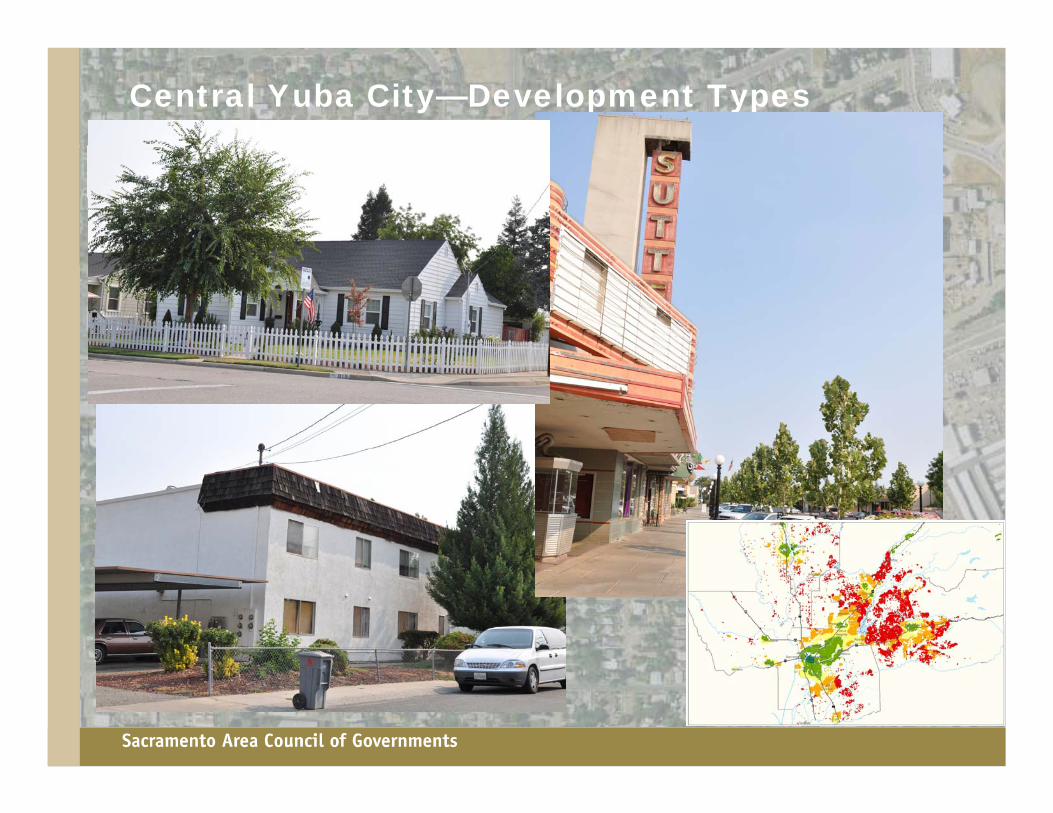
Central Yuba City—Development Types

2005 VMT Per Household

Areas of Improvement: 2005 VMT / HH
Roseville/Rocklin/Lincoln:
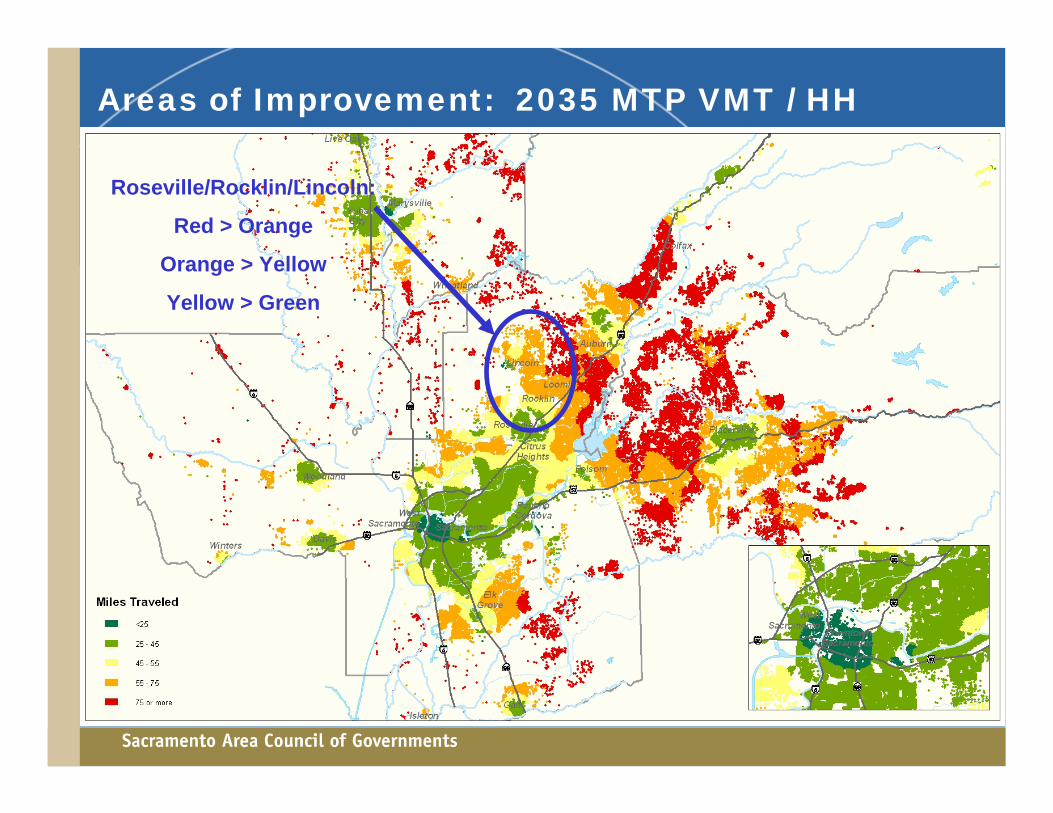
Areas of Improvement: 2035 MTP VMT / HH
Roseville/Rocklin/Lincoln:
Red > Orange
Orange > Yellow
Yellow > Green
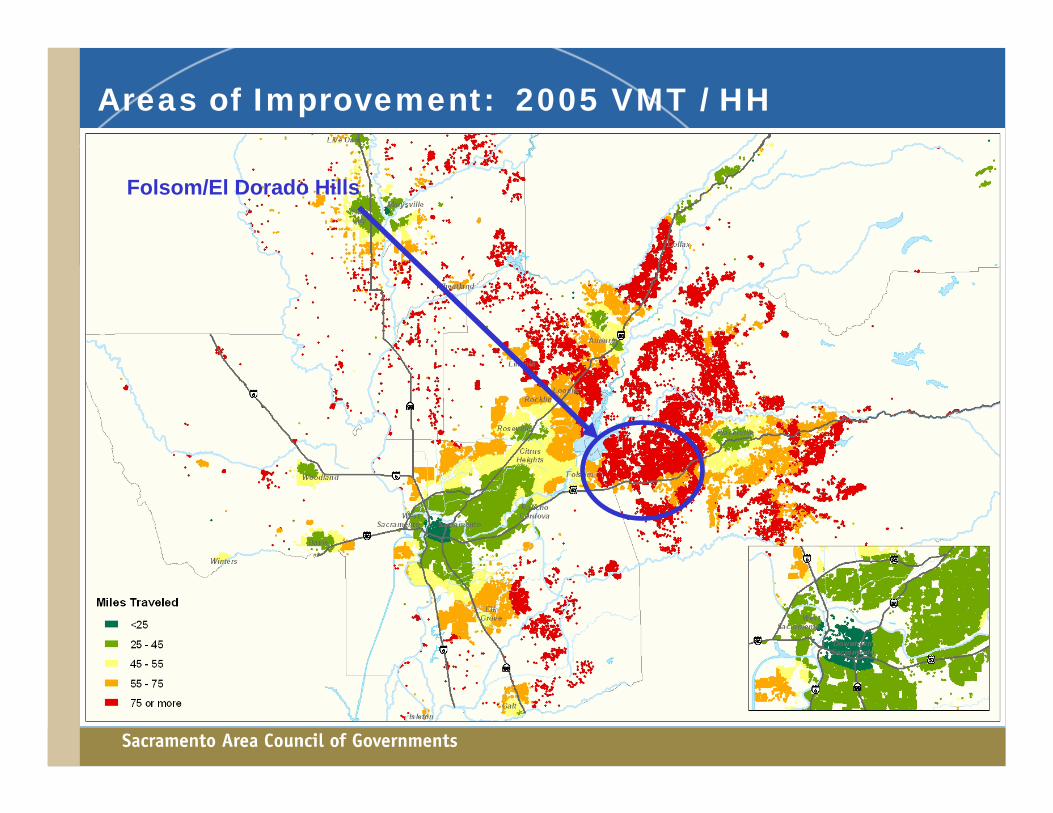
Areas of Improvement: 2005 VMT / HH
Folsom/El Dorado Hills

Areas of Improvement: 2035 MTP VMT / HH
Folsom/El Dorado Hills
Red > Orange
Orange > Yellow
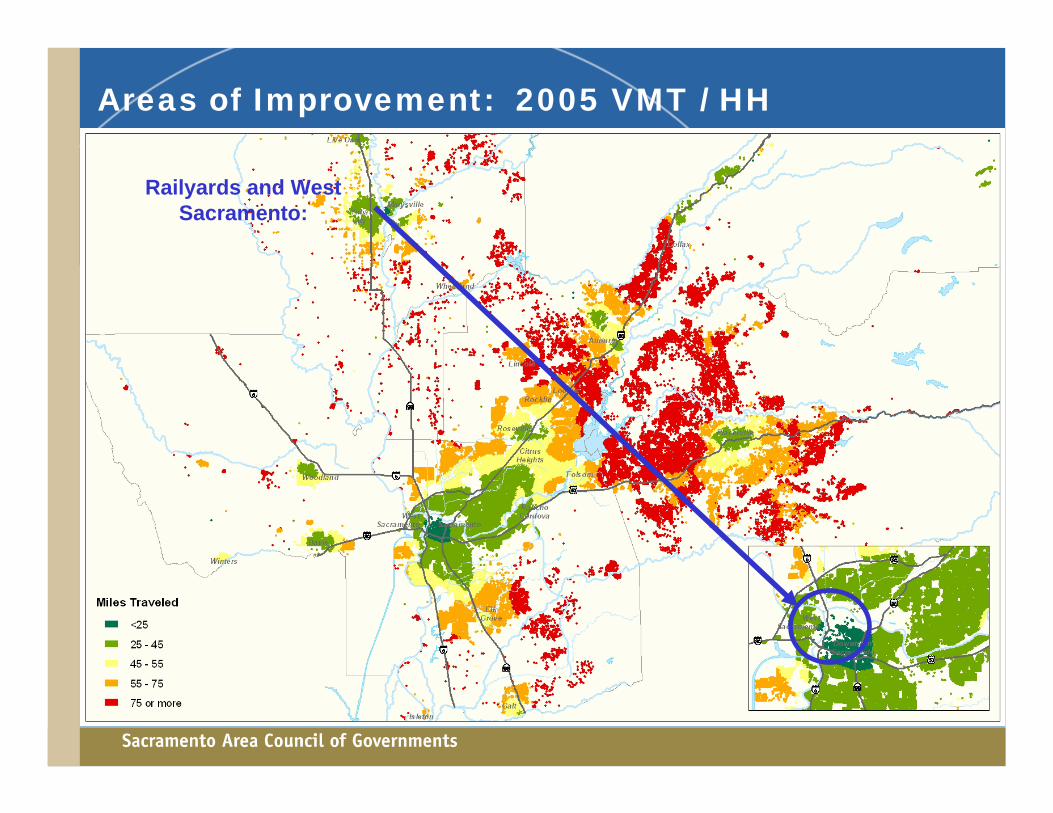
Areas of Improvement: 2005 VMT / HH
Railyards and West Sacramento:
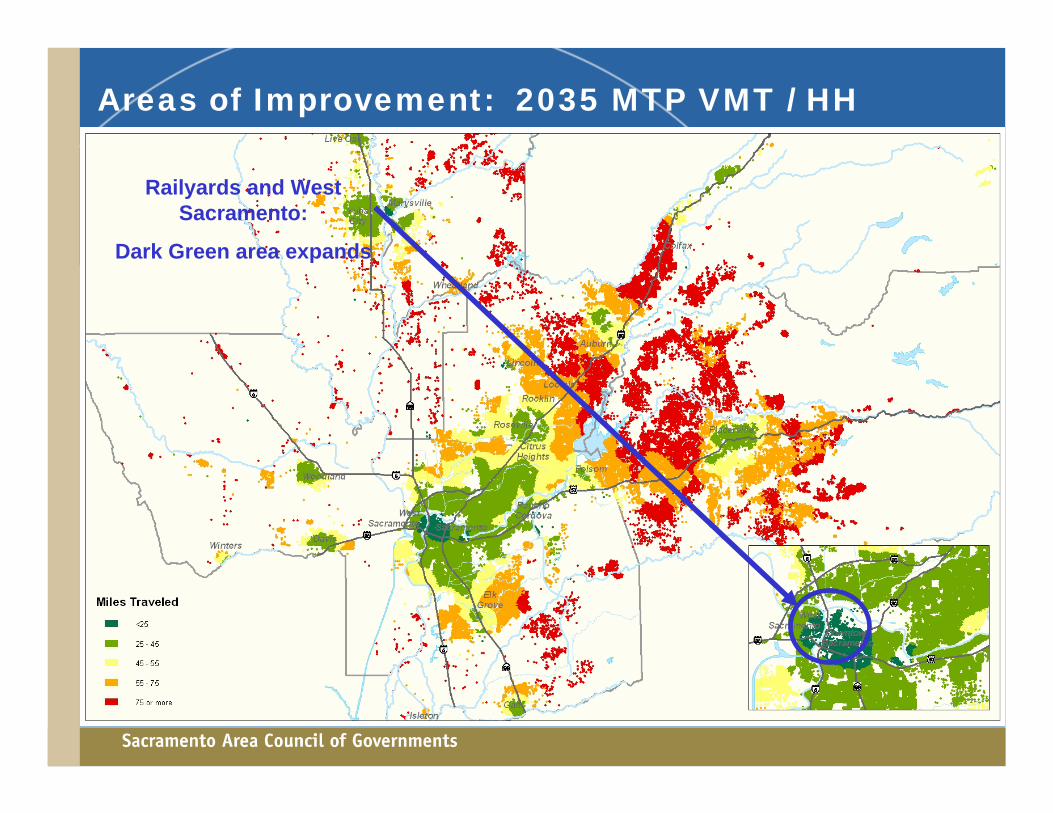
Areas of Improvement: 2035 MTP VMT / HH
Railyards and West Sacramento:
Dark Green area expands
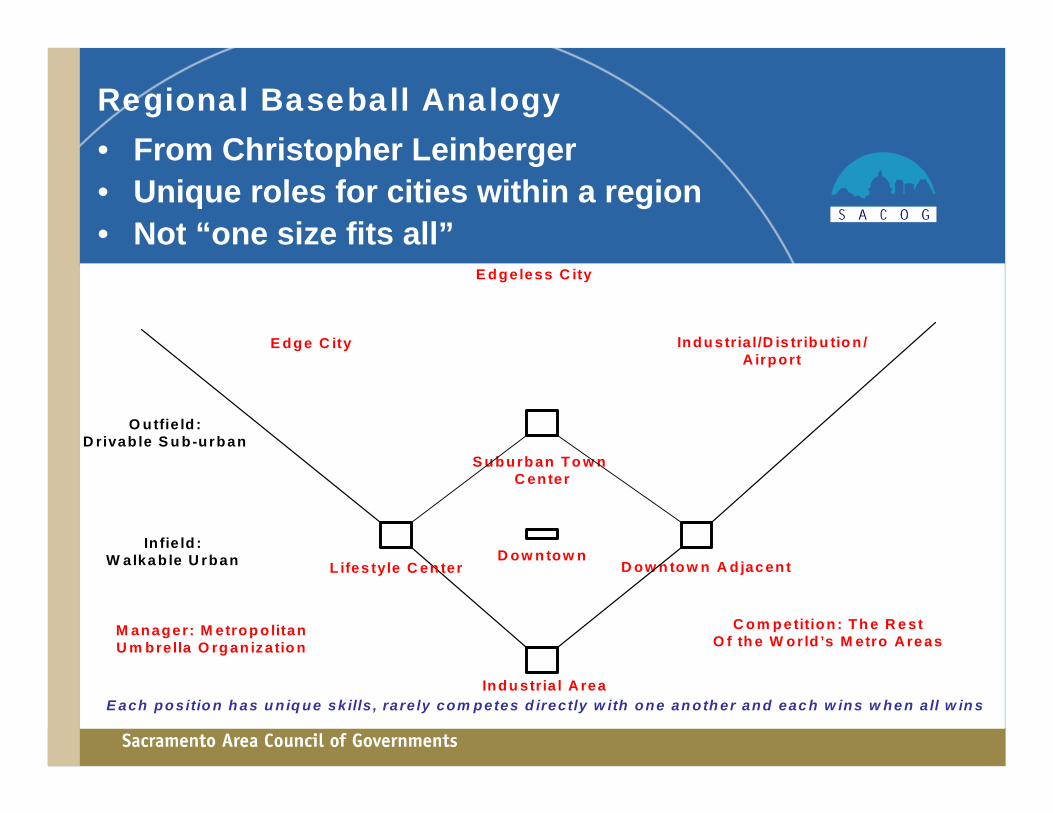
Regional Baseball Analogy • From Christopher Leinberger• Unique roles for cities within a region• Not “one size fits all”
D ow n tow n
Indu stria l A rea
D ow n tow n A d jac en t
S uburban To w n C enter
L ifes tyle C en ter
E dgeless C ity
E dge C ity Indu stria l/D is tribu tio n /A irport
M anager: M etrop o litanU m bre lla O rg an iz a tio n
C om pe tition : Th e R e stO f th e W orld ’s M etro A re as
O utfie ld :D rivab le S u b-urban
In fie ld :W alka b le U rban
E ach positio n h as u n iq ue sk ills , ra re ly com petes d irectly w ith one an oth er and eac h w ins w he n a ll w in s