Embed Size (px)
Citation preview

UBC TEAM REPORT: TEAM 2018-07
Timber Engineering and Applied Mechanics (TEAM) Laboratory
#1901 - 2424 Main Mall, Vancouver, B.C. Canada V6T 1Z4; Tel: (604) 822-8137 Fax: (604) 822-9159
Connection and performance of two-way CLT plates
Phase II
by
Chao (Tom) Zhang
Julian Asselstine
George Lee
Dr. Frank Lam
Prepared for
Forestry Innovation Investment
1130 W Pender St, Vancouver
BC V6E 4A4
Timber Engineering and Applied Mechanics
(TEAM) Laboratory
Department of Wood Science
Faculty of Forestry
University of British Columbia
Vancouver, B.C., Canada
March 25, 2019

UBC TEAM REPORT: TEAM 2018-07
UBC TEAM REPORT: TEAM 2018-07 PAGE 2/31
EXECUTIVE SUMMARY
In Phase I of Developing Large Span Two Way CLT Floor System (2017-18) we studied
the performance of a steel plate connection system for the minor direction of CLT plates.
The connected specimens had higher stiffness and strength compared to intact members
under bending. In Phase II (2018-19) we designed and tested another connector based on
Laminated Veneer Lumber (LVL). The bending stiffness of a joint was evaluated by the
slip modulus between the connector plate and CLT under shear. The LVL based connector
had 87% of the stiffness compared to the steel plate connector tested in Phase I, while
performed much better at the initial period of the loading. Considering other factors,
including manufacturing cost, assembly time, structural integrity, and fire protection, the
LVL connection was found to be a good solution for joining the minor direction of CLT
plates. An analytical model was proposed to establish the relationship between the slip
modulus and the joint stiffness.
The connectors were loaded under in-plane shear to investigate the diaphragm behavior.
The result indicated that two stiffness stages occurred: a high stiffness in the beginning
(56.8 kN/mm) and after reaching a transitional load, a prolonged low stiffness region (4.3
kN/mm). The stiffness associated with the initial period was recommended for use in
design. The joined panel remained fairly rigid as a two way plate under most
circumstances, due to the high in-plane stiffness at the joint.
In Phase I and Phase II, four CLT panels were tested to measure the deflections in two way
bending action. The single panel had a size of 3.66 m by 1.83 m, while the joined panels
were 3.66 m by 3.66 m. By doubling the length in the minor direction, the maximum
deflection at the center also doubled, from 5.87 mm to 12 mm. At the same time, the
principle deflection changed from the major direction to the minor direction. Attaching two
Parallel Strand Lumber (PSL) rim beams along the minor direction reduced the maximum
deflection from 12.00 mm to 9.49 mm, a reduction of 21%, which corresponded
approximately to the amount of EI increased in the minor direction. If the maximum load
applied was uniformly distributed over the joined panel, the pressure was 3.45 kPa while
the maximum deflection was 1/280 of the span (1/354 for the panel with rim beams).
A model using the crossing beam method was developed to estimate the two way panel
deflection with column supports. The estimated deflection was in the range of 87-108% of
the measure value. The model predicted the contribution of the rim beams with good
accuracy. Ongoing study is being conducted using Finite Element Method to simulate the
two way action. Other issues related to the application of continuous two way CLT plate
were also discussed, including working with concrete topping, installation procedure,
lifting technique, and connection with other structural elements. The preliminary results of
some ongoing work were presented briefly with future work recommended.
UBC TEAM REPORT: TEAM 2018-07
UBC TEAM REPORT: TEAM 2018-07 PAGE 3/31
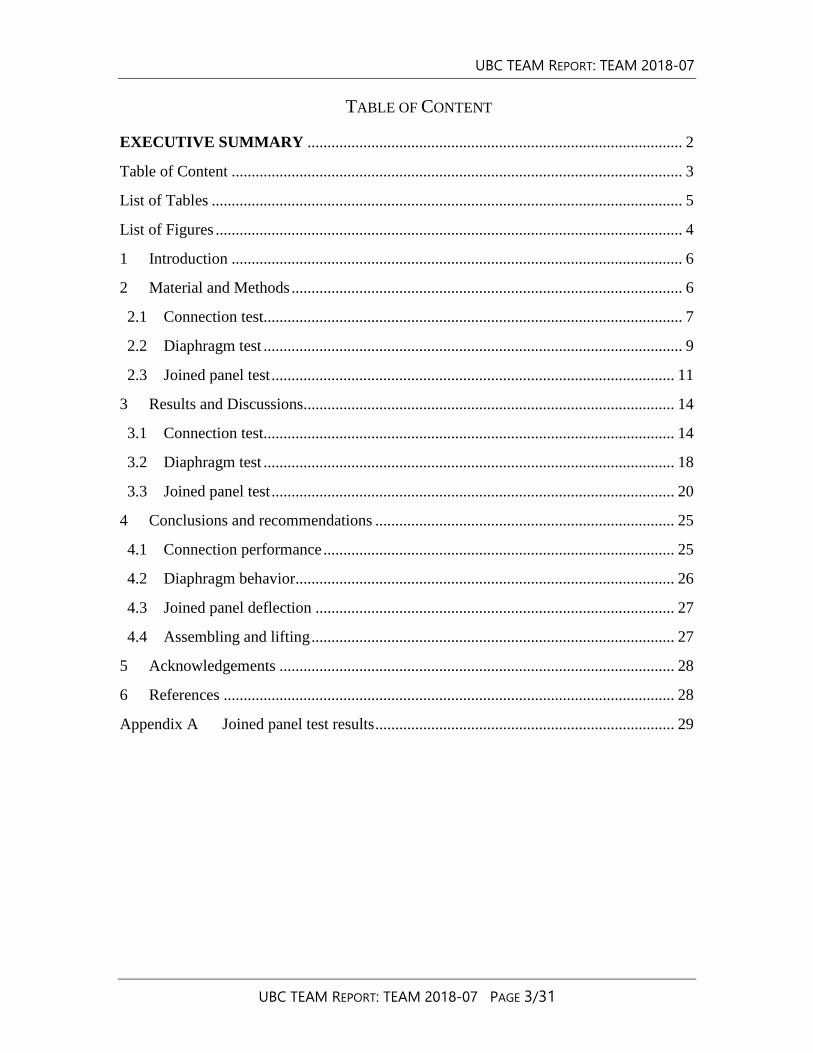
TABLE OF CONTENT
EXECUTIVE SUMMARY .............................................................................................. 2
Table of Content ................................................................................................................. 3
List of Tables ...................................................................................................................... 5
List of Figures ..................................................................................................................... 4
1 Introduction ................................................................................................................. 6
2 Material and Methods .................................................................................................. 6
2.1 Connection test......................................................................................................... 7
2.2 Diaphragm test ......................................................................................................... 9
2.3 Joined panel test ..................................................................................................... 11
3 Results and Discussions............................................................................................. 14
3.1 Connection test....................................................................................................... 14
3.2 Diaphragm test ....................................................................................................... 18
3.3 Joined panel test ..................................................................................................... 20
4 Conclusions and recommendations ........................................................................... 25
4.1 Connection performance ........................................................................................ 25
4.2 Diaphragm behavior............................................................................................... 26
4.3 Joined panel deflection .......................................................................................... 27
4.4 Assembling and lifting ........................................................................................... 27
5 Acknowledgements ................................................................................................... 28
6 References ................................................................................................................. 28
Appendix A Joined panel test results ........................................................................... 29

UBC TEAM REPORT: TEAM 2018-07
UBC TEAM REPORT: TEAM 2018-07 PAGE 4/31
LIST OF FIGURES
Figure 1 Moment applied on a steel plate based connection .............................................. 8
Figure 2 Moment applied on an LVL based connection ..................................................... 8
Figure 3 H-block test for joint connections ........................................................................ 9
Figure 4 Diaphragm performance of a joined panel ......................................................... 10
Figure 5 Setup for diaphragm test ..................................................................................... 10
Figure 6 Joined CLT panel and the lifting platform ......................................................... 11
Figure 7 Transducer locations for the joined panel test .................................................... 12
Figure 8 Loading of the joined panel ................................................................................ 13
Figure 9 Rim beam attached to the edge of the joined panel ............................................ 13
Figure 10 Screws to attach rim beams to the panel .......................................................... 13
Figure 11 CLT failure in the H-block connection test ...................................................... 15
Figure 12 Beam deformation under bending .................................................................... 16
Figure 13 Deformation at the joint under bending ............................................................ 16
Figure 14 Analytical model of deformation at the joint ................................................... 17
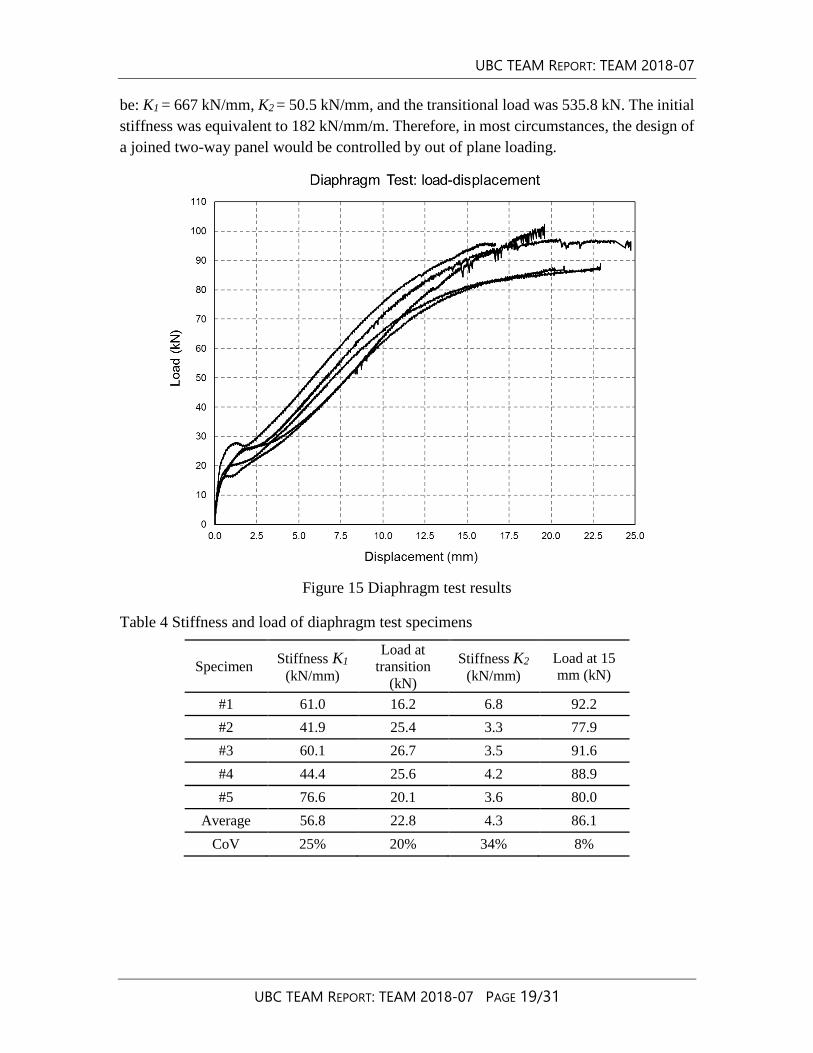
Figure 15 Diaphragm test results ...................................................................................... 19
Figure 16 Deformation of connectors in diaphragm test .................................................. 20
Figure 17 Comparison of displacement in the major direction......................................... 21
Figure 18 Comparison of displacement in the minor direction ........................................ 22
Figure 19 Center displacement for four panels tested ...................................................... 22
Figure 20 Principle and non-principle directions under loading ...................................... 23
Figure 21 Beam strip and column strips for deflection calculation .................................. 24
Figure A- 1 Displacement of the joined panel in the major direction .............................. 29
Figure A- 2 Displacement of the joined panel in the minor direction .............................. 29
Figure A- 3 Displacement of the joined panel with rim beams in the major direction..... 30
Figure A- 4 Displacement of the joined panel with rim beams in the minor direction .... 30
UBC TEAM REPORT: TEAM 2018-07
UBC TEAM REPORT: TEAM 2018-07 PAGE 5/31
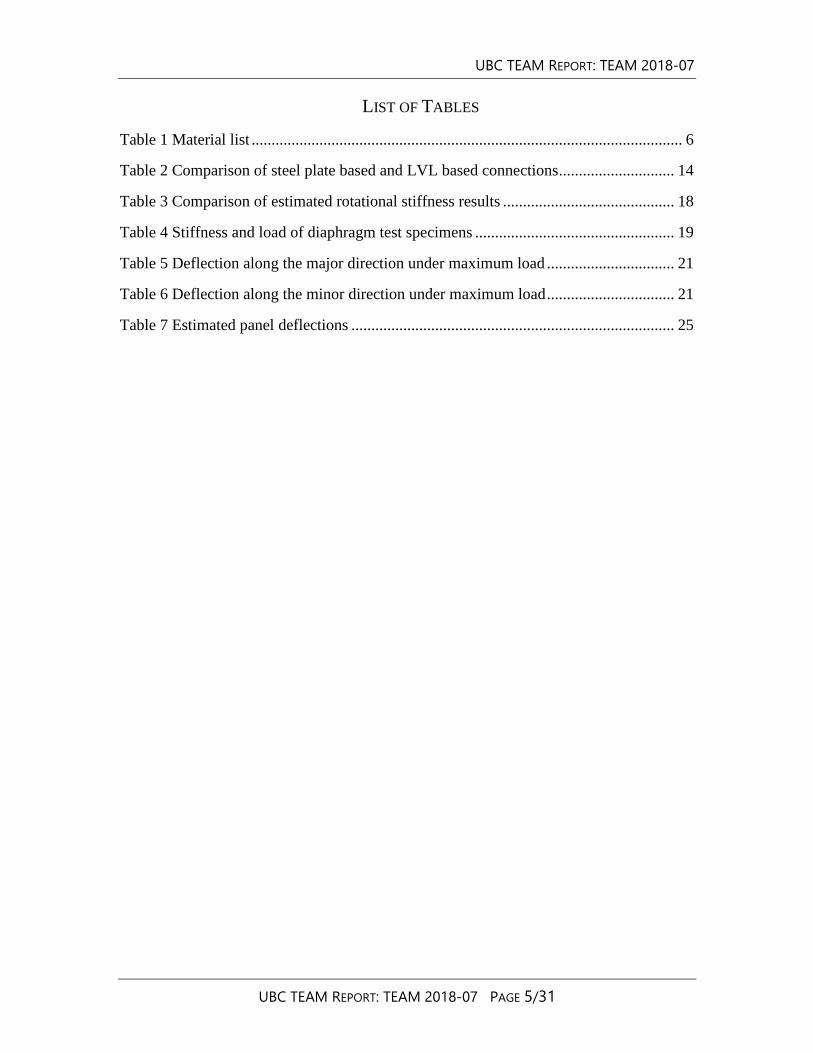
LIST OF TABLES
Table 1 Material list ............................................................................................................ 6
Table 2 Comparison of steel plate based and LVL based connections ............................. 14
Table 3 Comparison of estimated rotational stiffness results ........................................... 18
Table 4 Stiffness and load of diaphragm test specimens .................................................. 19
Table 5 Deflection along the major direction under maximum load ................................ 21
Table 6 Deflection along the minor direction under maximum load ................................ 21
Table 7 Estimated panel deflections ................................................................................. 25
UBC TEAM REPORT: TEAM 2018-07
UBC TEAM REPORT: TEAM 2018-07 PAGE 6/31
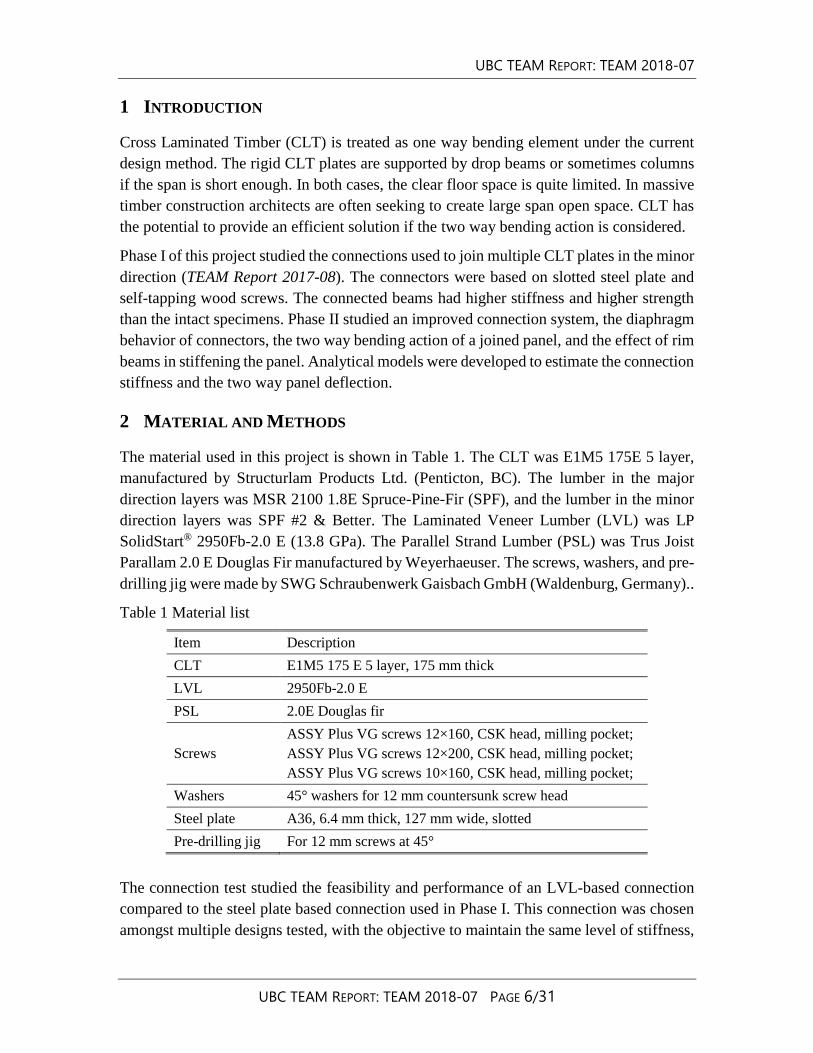
1 INTRODUCTION
Cross Laminated Timber (CLT) is treated as one way bending element under the current
design method. The rigid CLT plates are supported by drop beams or sometimes columns
if the span is short enough. In both cases, the clear floor space is quite limited. In massive
timber construction architects are often seeking to create large span open space. CLT has
the potential to provide an efficient solution if the two way bending action is considered.
Phase I of this project studied the connections used to join multiple CLT plates in the minor
direction (TEAM Report 2017-08). The connectors were based on slotted steel plate and
self-tapping wood screws. The connected beams had higher stiffness and higher strength
than the intact specimens. Phase II studied an improved connection system, the diaphragm
behavior of connectors, the two way bending action of a joined panel, and the effect of rim
beams in stiffening the panel. Analytical models were developed to estimate the connection
stiffness and the two way panel deflection.
2 MATERIAL AND METHODS
The material used in this project is shown in Table 1. The CLT was E1M5 175E 5 layer,
manufactured by Structurlam Products Ltd. (Penticton, BC). The lumber in the major
direction layers was MSR 2100 1.8E Spruce-Pine-Fir (SPF), and the lumber in the minor
direction layers was SPF #2 & Better. The Laminated Veneer Lumber (LVL) was LP
SolidStart® 2950Fb-2.0 E (13.8 GPa). The Parallel Strand Lumber (PSL) was Trus Joist
Parallam 2.0 E Douglas Fir manufactured by Weyerhaeuser. The screws, washers, and pre-
drilling jig were made by SWG Schraubenwerk Gaisbach GmbH (Waldenburg, Germany)..
Table 1 Material list
Item Description
CLT E1M5 175 E 5 layer, 175 mm thick
LVL 2950Fb-2.0 E
PSL 2.0E Douglas fir
Screws
ASSY Plus VG screws 12×160, CSK head, milling pocket;
ASSY Plus VG screws 12×200, CSK head, milling pocket;
ASSY Plus VG screws 10×160, CSK head, milling pocket;
Washers 45° washers for 12 mm countersunk screw head
Steel plate A36, 6.4 mm thick, 127 mm wide, slotted
Pre-drilling jig For 12 mm screws at 45°
The connection test studied the feasibility and performance of an LVL-based connection
compared to the steel plate based connection used in Phase I. This connection was chosen
amongst multiple designs tested, with the objective to maintain the same level of stiffness,
UBC TEAM REPORT: TEAM 2018-07
UBC TEAM REPORT: TEAM 2018-07 PAGE 7/31
but at a lower cost as well as shorter installation time compared to the steel solution in
Phase I. The diaphragm test investigated the behavior of the connection under in-plane
loading, which was also a critical issue for the continuous two way panel. Then two CLT
plates were joined together with LVL-based connections and supported at the four corners.
Concentrated load was applied at the center of the joint panel and its deflection measured
at different loading levels. Two configurations were compared: one without rim beams,
and the other with two rim beams installed at the edge along its minor direction.
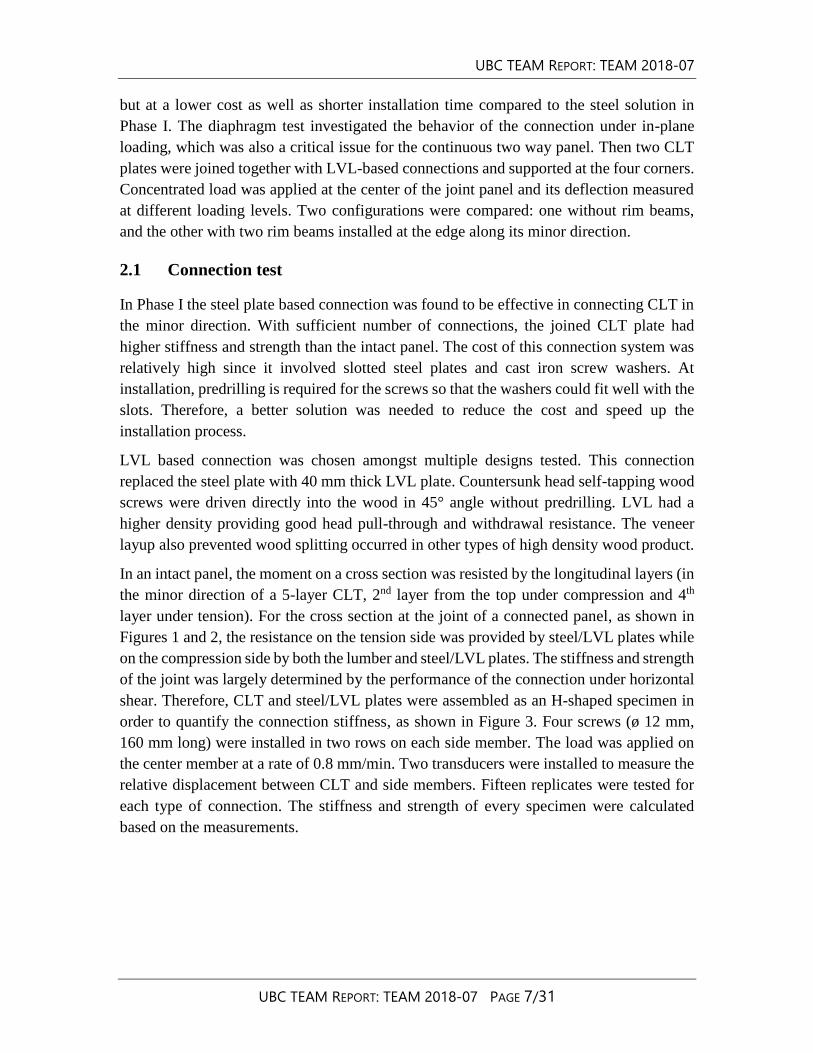
2.1 Connection test
In Phase I the steel plate based connection was found to be effective in connecting CLT in
the minor direction. With sufficient number of connections, the joined CLT plate had
higher stiffness and strength than the intact panel. The cost of this connection system was
relatively high since it involved slotted steel plates and cast iron screw washers. At
installation, predrilling is required for the screws so that the washers could fit well with the
slots. Therefore, a better solution was needed to reduce the cost and speed up the
installation process.
LVL based connection was chosen amongst multiple designs tested. This connection
replaced the steel plate with 40 mm thick LVL plate. Countersunk head self-tapping wood
screws were driven directly into the wood in 45° angle without predrilling. LVL had a
higher density providing good head pull-through and withdrawal resistance. The veneer
layup also prevented wood splitting occurred in other types of high density wood product.
In an intact panel, the moment on a cross section was resisted by the longitudinal layers (in
the minor direction of a 5-layer CLT, 2nd layer from the top under compression and 4th
layer under tension). For the cross section at the joint of a connected panel, as shown in
Figures 1 and 2, the resistance on the tension side was provided by steel/LVL plates while
on the compression side by both the lumber and steel/LVL plates. The stiffness and strength
of the joint was largely determined by the performance of the connection under horizontal
shear. Therefore, CLT and steel/LVL plates were assembled as an H-shaped specimen in
order to quantify the connection stiffness, as shown in Figure 3. Four screws (ø 12 mm,
160 mm long) were installed in two rows on each side member. The load was applied on
the center member at a rate of 0.8 mm/min. Two transducers were installed to measure the
relative displacement between CLT and side members. Fifteen replicates were tested for
each type of connection. The stiffness and strength of every specimen were calculated
based on the measurements.

UBC TEAM REPORT: TEAM 2018-07
UBC TEAM REPORT: TEAM 2018-07 PAGE 8/31
Figure 1 Moment applied on a steel plate based connection
Figure 2 Moment applied on an LVL based connection

UBC TEAM REPORT: TEAM 2018-07
UBC TEAM REPORT: TEAM 2018-07 PAGE 9/31
Figure 3 H-block test for joint connections
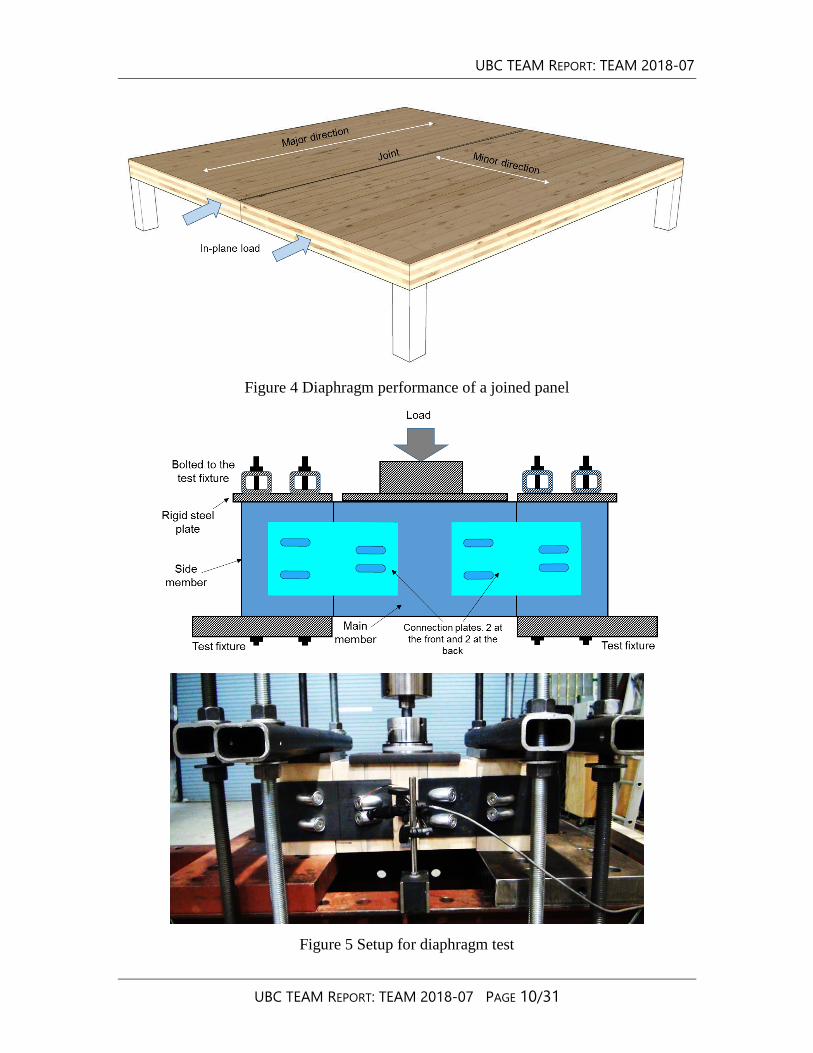
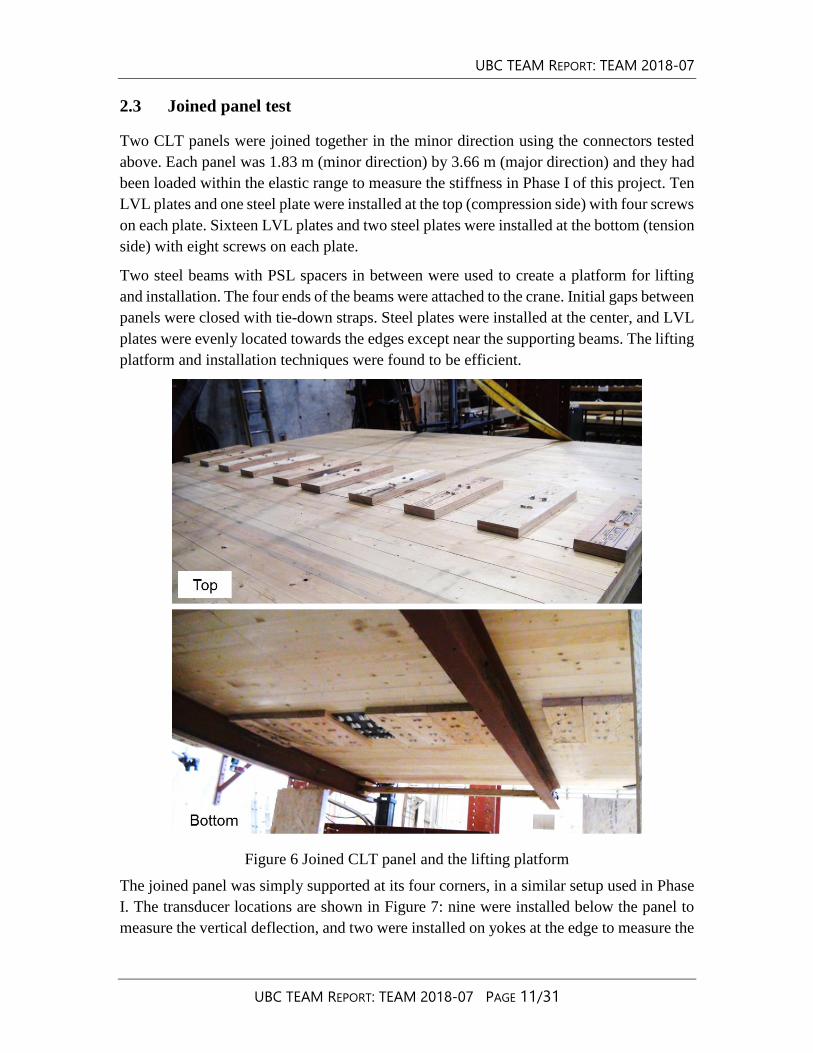
2.2 Diaphragm test
The diaphragm performance of a large span CLT plate is critical in a two way action,
especially when supported by columns only. For a joined panel, the connectors had to resist
the shear force along the joined edge created by the in-plane load transferred from adjacent
structural components (beams or columns), as shown in Figure 4. The loading condition
on the connector could be simulated by the test setup shown in Figure 5. The main member
was loaded in the in-plane direction while the two side members were clamped to test
fixtures to prevent rotation. Each side member was connected to the main member by two
steel plates with four screws per plate. The screws were installed in 45° to the CLT surface.
Two transducers were mounted on the main member to measure its displacement relative
to the side members. The loading rate was 1.5 mm/min and five replicates were tested.
UBC TEAM REPORT: TEAM 2018-07
UBC TEAM REPORT: TEAM 2018-07 PAGE 10/31
Figure 4 Diaphragm performance of a joined panel
Figure 5 Setup for diaphragm test
UBC TEAM REPORT: TEAM 2018-07
UBC TEAM REPORT: TEAM 2018-07 PAGE 11/31
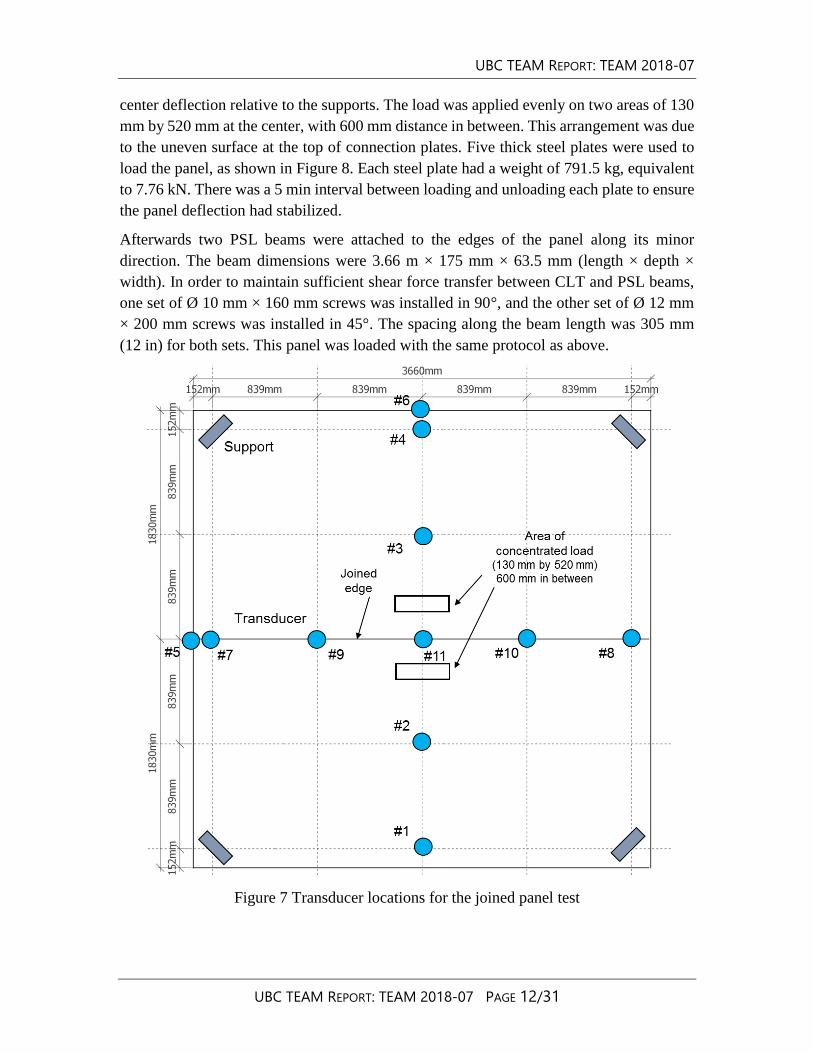
2.3 Joined panel test
Two CLT panels were joined together in the minor direction using the connectors tested
above. Each panel was 1.83 m (minor direction) by 3.66 m (major direction) and they had
been loaded within the elastic range to measure the stiffness in Phase I of this project. Ten
LVL plates and one steel plate were installed at the top (compression side) with four screws
on each plate. Sixteen LVL plates and two steel plates were installed at the bottom (tension
side) with eight screws on each plate.
Two steel beams with PSL spacers in between were used to create a platform for lifting
and installation. The four ends of the beams were attached to the crane. Initial gaps between
panels were closed with tie-down straps. Steel plates were installed at the center, and LVL
plates were evenly located towards the edges except near the supporting beams. The lifting
platform and installation techniques were found to be efficient.
Figure 6 Joined CLT panel and the lifting platform
The joined panel was simply supported at its four corners, in a similar setup used in Phase
I. The transducer locations are shown in Figure 7: nine were installed below the panel to
measure the vertical deflection, and two were installed on yokes at the edge to measure the
UBC TEAM REPORT: TEAM 2018-07
UBC TEAM REPORT: TEAM 2018-07 PAGE 12/31
center deflection relative to the supports. The load was applied evenly on two areas of 130
mm by 520 mm at the center, with 600 mm distance in between. This arrangement was due
to the uneven surface at the top of connection plates. Five thick steel plates were used to
load the panel, as shown in Figure 8. Each steel plate had a weight of 791.5 kg, equivalent
to 7.76 kN. There was a 5 min interval between loading and unloading each plate to ensure
the panel deflection had stabilized.
Afterwards two PSL beams were attached to the edges of the panel along its minor
direction. The beam dimensions were 3.66 m × 175 mm × 63.5 mm (length × depth ×
width). In order to maintain sufficient shear force transfer between CLT and PSL beams,
one set of Ø 10 mm × 160 mm screws was installed in 90°, and the other set of Ø 12 mm
× 200 mm screws was installed in 45°. The spacing along the beam length was 305 mm
(12 in) for both sets. This panel was loaded with the same protocol as above.
Figure 7 Transducer locations for the joined panel test

UBC TEAM REPORT: TEAM 2018-07
UBC TEAM REPORT: TEAM 2018-07 PAGE 13/31
Figure 8 Loading of the joined panel
Figure 9 Rim beam attached to the edge of the joined panel
Figure 10 Screws to attach rim beams to the panel

UBC TEAM REPORT: TEAM 2018-07
UBC TEAM REPORT: TEAM 2018-07 PAGE 14/31
3 RESULTS AND DISCUSSIONS
3.1 Connection test
The H-block test results for the steel plate connections and LVL connections are shown in
Table 2. The slip modulus K (in kN/mm) was calculated as the slope of load-displacement
curve between 15% and 50% of the peak load. This was a measurement of the relative
displacement between CLT and the connection plate under shear. The coefficient of
variation was in the same range: 23-24% for slip modulus and 7-9% for peak load. The
average K of the LVL connections was 92.5 kN/mm, 87% of the average K of the steel
connections. The difference of peak load was greater, with the LVL connection at 70% of
the steel connection capacity. Most steel plate connections had a low stiffness range at the
initial period of loading, probably due to closing the existing gaps between washers and
slots. LVL connection engaged the load immediately from the start. Since the large span
panel design was deflection controlled, the LVL connection was found to be a good
alternative to steel connections.
The two types of connections failed in the same way, as shown in Figure 11, involving
wood failure under tension perpendicular to grain, and glueline failure at the corner of a
laminae. This observation corresponded to the failure mode found in the bending test in
Phase I.
Table 2 Comparison of steel plate based and LVL based connections
Item Slip modulus K0 (kN/mm) Peak load (kN)
Configuration LVL K0l Steel K0s Ratio LVL Steel Ratio
Average 92.5 106.5 87% 143.0 203.9 70%
Stdev 21.0 25.2 83% 10.6 17.9 59%
CV 23% 24% 96% 7% 9% 85%
Max 142.2 157.6 90% 161.3 238.9 68%
Min 63.9 61.9 103% 121.1 166.8 73%
Replicates 15 15 15 15 15 15

UBC TEAM REPORT: TEAM 2018-07
UBC TEAM REPORT: TEAM 2018-07 PAGE 15/31
Figure 11 CLT failure in the H-block connection test
An analytical model based on simple beam theory was developed to compare the rotational
stiffness of intact panels and joined panels. The part of beam investigated was the section
with steel/LVL connectors (length lc).
Figure 12 shows the deformation of a portion of beam under bending moment M. The angle
between the two end sections is θ. The radius of curvature for this arch is defined as ρ. The
relationship between θ and M can be expressed as:
θ = ∫1
𝜌
𝑥2
𝑥1
𝑑𝑥 = ∫𝑀
𝐸𝐼
𝑥2
𝑥1
𝑑𝑥 (1)
where: EI=(EI)eff , the effective stiffness of the cross section.
Since M and EI are uniform in the portion of beam considered (shear free zone), Equation
(1) could be simplified as:
θ = 𝑀
𝐸𝐼× 𝑙𝑐 (2)
where: lc is the length of the steel plate working in the longitudinal (effective) layer.
The rotational stiffness for the intact panel, ki (in kN m/rad), was estimated to be:

UBC TEAM REPORT: TEAM 2018-07
UBC TEAM REPORT: TEAM 2018-07 PAGE 16/31
𝑘𝑖 =M
𝜃=
𝐸𝐼
𝑙𝑐 (3)
Figure 12 Beam deformation under bending
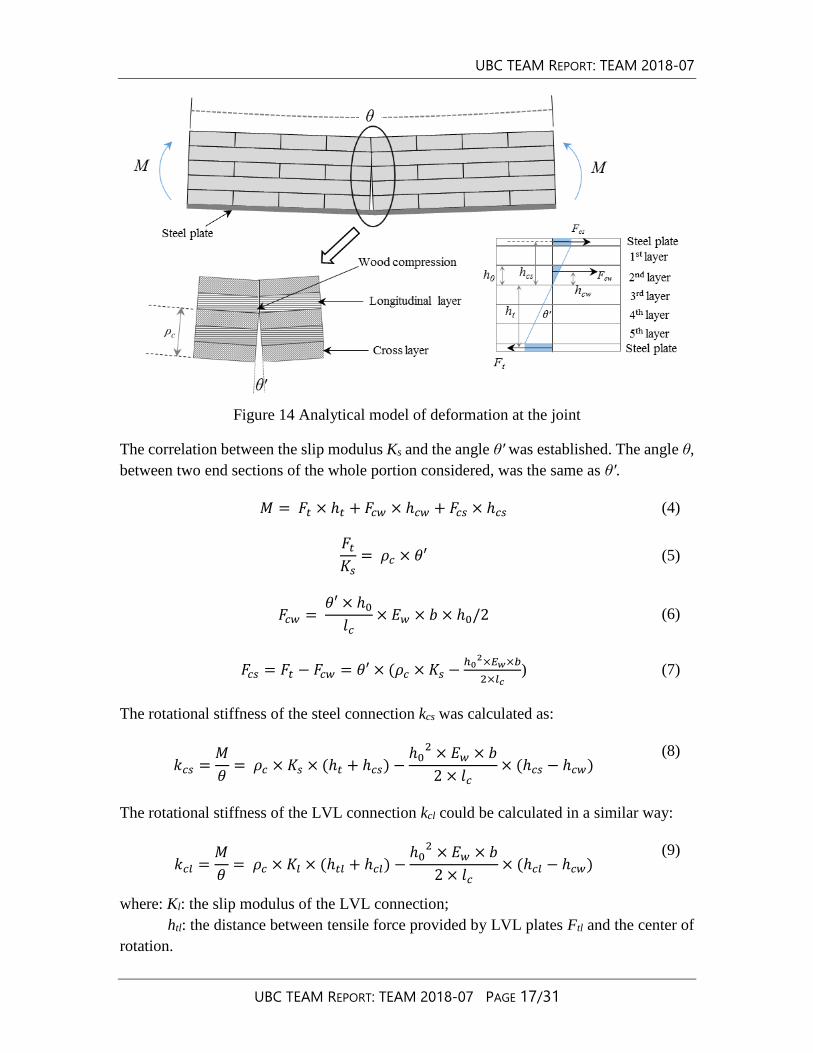
The deformation of a joint under bending is shown in Figure 13. The end surfaces of the
longitudinal layers at the top (2nd layer from the top) firmly contacted, and wood was
compressed. The only tension resistance came from the steel plate. As the steel plate shifted
away from the CLT under shear, the angle between the two joined surfaces, θ′, increased,
and it only occurred through the bottom three layers. The steel plate behaved as a spring
with a stiffness of Ks (calculated from the slip modulus in Section 3.1). Based on these
assumptions, an analytical model for the joint deformation is shown in Figure 14:
Fcs: compressive force provided by the top steel plate;
Fcw: the compressive force provided by the longitudinal lumber;
Ft: the tensile force provided by the bottom steel plate;
ht: the distance between Ft and the center of rotation;
Ew: the modulus of elasticity for longitudinal lumber.
Figure 13 Deformation at the joint under bending
UBC TEAM REPORT: TEAM 2018-07
UBC TEAM REPORT: TEAM 2018-07 PAGE 17/31
Figure 14 Analytical model of deformation at the joint
The correlation between the slip modulus Ks and the angle θ′ was established. The angle θ,
between two end sections of the whole portion considered, was the same as θ′.
𝑀 = 𝐹𝑡 × ℎ𝑡 + 𝐹𝑐𝑤 × ℎ𝑐𝑤 + 𝐹𝑐𝑠 × ℎ𝑐𝑠 (4)
𝐹𝑡
𝐾𝑠= 𝜌𝑐 × 𝜃′ (5)
𝐹𝑐𝑤 = 𝜃′ × ℎ0
𝑙𝑐× 𝐸𝑤 × 𝑏 × ℎ0/2 (6)
𝐹𝑐𝑠 = 𝐹𝑡 − 𝐹𝑐𝑤 = 𝜃′ × (𝜌𝑐 × 𝐾𝑠 −ℎ0
2×𝐸𝑤×𝑏
2×𝑙𝑐) (7)
The rotational stiffness of the steel connection kcs was calculated as:
𝑘𝑐𝑠 =𝑀
𝜃= 𝜌𝑐 × 𝐾𝑠 × (ℎ𝑡 + ℎ𝑐𝑠) −
ℎ02 × 𝐸𝑤 × 𝑏
2 × 𝑙𝑐× (ℎ𝑐𝑠 − ℎ𝑐𝑤)
(8)
The rotational stiffness of the LVL connection kcl could be calculated in a similar way:
𝑘𝑐𝑙 =𝑀
𝜃= 𝜌𝑐 × 𝐾𝑙 × (ℎ𝑡𝑙 + ℎ𝑐𝑙) −
ℎ02 × 𝐸𝑤 × 𝑏
2 × 𝑙𝑐× (ℎ𝑐𝑙 − ℎ𝑐𝑤)
(9)
where: Kl: the slip modulus of the LVL connection;
htl: the distance between tensile force provided by LVL plates Ftl and the center of
rotation.

UBC TEAM REPORT: TEAM 2018-07
UBC TEAM REPORT: TEAM 2018-07 PAGE 18/31
hcl: the distance between compressive force provided by LVL plates Fcl and the
center of rotation.
The slip modulus K0 in Table 2 was measured for 8 screws in the same direction. The
connected panel used 16 screws at the tension side (with two steel plates or LVL plates).
Therefore:
𝐾𝑠 =𝐾0𝑠
2⁄ (10)
𝐾𝑙 =𝐾0𝑙
2⁄ (11)
The estimated rotational stiffness results based on Equations (8) and (9) are shown in Table
3. The steel plate connection had a rotational stiffness of 782 kN m/rad, 98% of the stiffness
of an intact panel. The LVL plate connection had a lower stiffness, but still maintained at
a level of 92% compared to the full panel. The analytical model above did not consider the
reinforcing effect of screws to the wood, which would further strengthen the connected
portion and lead to a higher actual stiffness than predicted, as found in Phase I.
Table 3 Comparison of estimated rotational stiffness results
Specimen Intact panel Steel plate
connection
LVL
connection
k (kN m/rad) 801 782 734
% of the intact panel 100% 98% 92%
3.2 Diaphragm test
Diaphragm test investigated the performance of connectors under in-plane loading. There
were four connection plates on each specimen (two at the front and two at the back), with
four screws on each plate. The test results are shown in Figure 15 and Table 4. The
displacement was the average relative movement between the center member and side
members. The five specimens behaved in a similar manner, with a high stiffness phase in
the beginning (K1) and then changing to a prolonged low stiffness (K2) period. The load at
the transition and the load at 15 mm displacement are also shown in Table 4. The average
stiffness K1 was 56.8 kN/mm, and the average K1 was 4.3 kN/mm. This decreasing of
stiffness was quite drastic.
The deformation of the connectors is shown in Figure 16. The load on the screw was
perpendicular to its shank and the reaction was mainly provided by the compression of
wood. If higher stiffness is needed, the screws could be set in 45° in order to engage the
withdrawal stiffness.
For a joined panel with the same number of connectors as used in Section 2.3, the stiffness
of the connection under in-plane loading was estimated (other factors not considered) to
UBC TEAM REPORT: TEAM 2018-07
UBC TEAM REPORT: TEAM 2018-07 PAGE 19/31
be: K1 = 667 kN/mm, K2 = 50.5 kN/mm, and the transitional load was 535.8 kN. The initial
stiffness was equivalent to 182 kN/mm/m. Therefore, in most circumstances, the design of
a joined two-way panel would be controlled by out of plane loading.
Figure 15 Diaphragm test results
Table 4 Stiffness and load of diaphragm test specimens
Specimen Stiffness K1
(kN/mm)
Load at
transition
(kN)
Stiffness K2
(kN/mm)
Load at 15
mm (kN)
#1 61.0 16.2 6.8 92.2
#2 41.9 25.4 3.3 77.9
#3 60.1 26.7 3.5 91.6
#4 44.4 25.6 4.2 88.9
#5 76.6 20.1 3.6 80.0
Average 56.8 22.8 4.3 86.1
CoV 25% 20% 34% 8%

UBC TEAM REPORT: TEAM 2018-07
UBC TEAM REPORT: TEAM 2018-07 PAGE 20/31
Figure 16 Deformation of connectors in diaphragm test
3.3 Joined panel test
This test measured the deflection of the joined panels under out of plane concentrated
loading, in order to quantify the stiffness and to provide data for further modeling. The
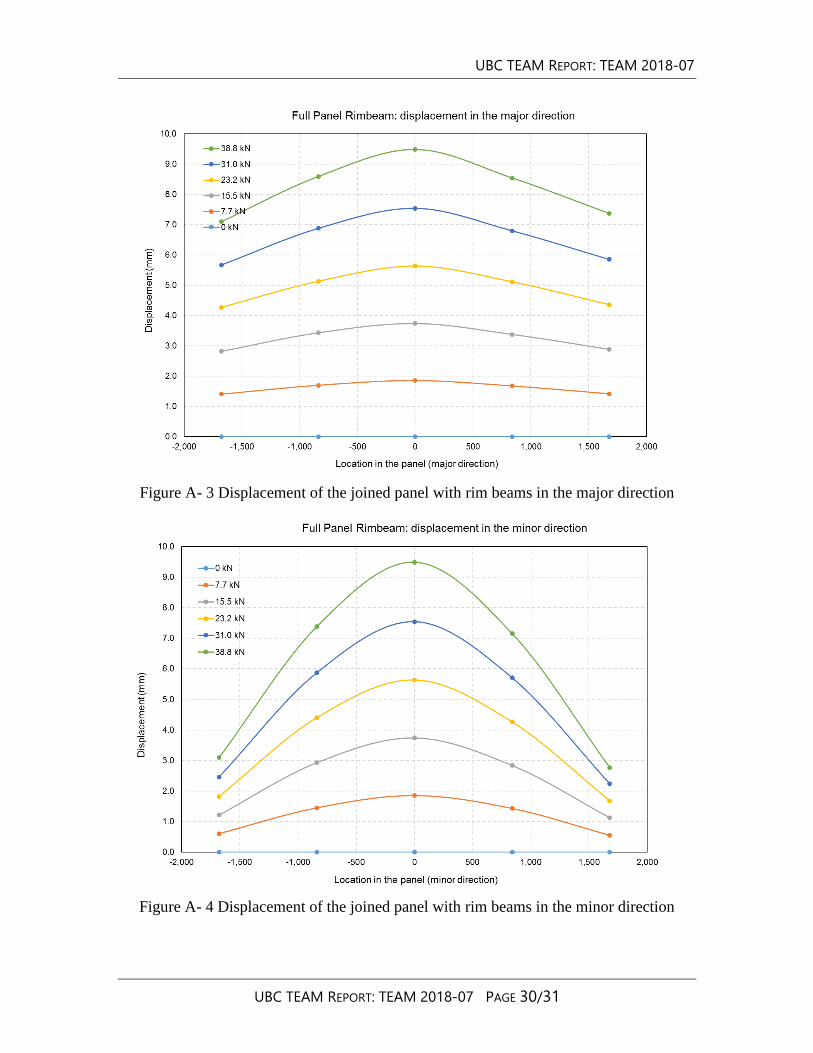
deflections at different locations under applied load levels are shown in Appendix A. The
maximum deflections (at the center) of the panels tested in Phase I and Phase II are
compared in Tables 5-6 and Figures 17-18. The four specimens had the same length in the
major direction. The length of the single panels in the minor direction was half of the length
of the joined panels.
The deflection of the joined panel at the center was about two times of the deflection in a
single panel. The difference was greater towards the edges. Adding rim beams increased
the stiffness and reduced the deflection by about 21%. The reduction corresponded
approximately to the amount of increasing in EI in the minor direction. The maximum
deflection of the joined panel was 12.0 mm, equivalent to 1/280 of the span, while the
maximum deflection of the joined panel with rim beams was equivalent to 1/354 of the
span. If the concentrated load was uniformly distributed over the panel, the load pressure
would be 3.45 kPa and the corresponding deflection would become smaller than the above.
The center displacements for the four panels under different loading levels are shown in
Figure 19. The joined panel had a slope of 3.23 kN/mm, and the joined panel with rim
beams had a slope of 4.10 kN/mm (27% higher). The slope of the two single panels was in
the range of 6.37-6.69 kN/mm.

UBC TEAM REPORT: TEAM 2018-07
UBC TEAM REPORT: TEAM 2018-07 PAGE 21/31
Table 5 Deflection along the major direction under maximum load
Panel tested Location along the major direction
Edge Quarter Center Quarter Edge
Single panel #1 1.85 4.32 5.76 3.93 0.53
Single panel #2 2.07 4.58 5.98 4.07 0.63
Joined panel (A) 10.13 11.22 12.00 11.19 10.55
Joined panel with rim beams (B) 7.10 8.60 9.49 8.55 7.37
Ratio: B/A 70% 77% 79% 76% 70%
Table 6 Deflection along the minor direction under maximum load
Panel tested Location along the minor direction
Edge Quarter Center Quarter Edge
Single panel #1 4.76 5.42 5.76 5.42 4.90
Single panel #2 4.75 5.43 5.98 5.59 5.24
Joined panel (A) 3.85 9.27 12.00 8.93 3.38
Joined panel with rim beams (B) 3.09 7.38 9.49 7.16 2.77
Ratio: B/A 80% 80% 79% 80% 82%
Figure 17 Comparison of displacement in the major direction

UBC TEAM REPORT: TEAM 2018-07
UBC TEAM REPORT: TEAM 2018-07 PAGE 22/31
Figure 18 Comparison of displacement in the minor direction
Figure 19 Center displacement for four panels tested
An ongoing study is being conducted using Finite Element Method to simulate the above
connections as well as the two-way behavior of CLT panels. Here an analytical model was
proposed to estimate the panel deflection based on the crossing beam method (works best

UBC TEAM REPORT: TEAM 2018-07
UBC TEAM REPORT: TEAM 2018-07 PAGE 23/31
for uniformly distributed load over the panel). The support and loading conditions were the
same as used in the test: column support at four corners with 38.5 kN loaded at the center.
The joined panel had the same EI as the intact panel in the minor direction, based on results
found in Phase I and Section 3.1.
The deflection of a beam under concentrated loads was a function of span l and stiffness
EI:
∆ ∝ 𝛽 =𝑙3
𝐸𝐼 (12)
The β values for the major direction (βa) and minor direction (βb) can be calculated, and
the ratio γ is defined as:
γ = 1/𝛽𝑎
1/𝛽𝑏 (13)
γ estimates the ratio of actual bending stiffness (P/Δ) in the two directions. This ratio could
determine the principle direction, in which the main deflection occurred. For example, for
the single panel in Table 5, γs = 0.16, meaning the main deflection occurred in the major
direction. While for the joined panel, γj = 3.79, meaning the principle direction was the
minor direction. The two directions are shown in Figure 20. Due to the large difference of
P/Δ in the two directions (4-6 times), the panel could be treated as a long and narrow plate
with a load applied in the center.
Figure 20 Principle and non-principle directions under loading
First the panel was assumed as a beam strip in the principle direction simply supported at
the edges, and then the reaction at the edges was applied on two column strips, which were
also considered as simply support beams, as shown in Figure 21. Due to the narrow width
of the beam strip, the load was considered as uniformly distributed along its width. The

UBC TEAM REPORT: TEAM 2018-07
UBC TEAM REPORT: TEAM 2018-07 PAGE 24/31
reaction load was assumed to be uniformly distributed on the surface of the column strip.
The width of the column strip was estimated by the stiffness ratio γ:
𝑏𝑐𝑠 = 𝑏 × 𝛾𝑠 𝑜𝑟 𝑏/𝛾𝑗 (14)
where: b is the width of length along the principle direction.
The effective stiffness EI were (EI)a.eff and (EI)b.eff for the major direction and minor
direction, respectively. The center deflections of the beam strip and column strip can be
calculated, as Δbs and Δcs, respectively:
∆𝑏𝑠=𝑤𝑏𝑠𝑙𝑏𝑠
4
𝛼1(𝐸𝐼)𝑏𝑠 (15)
∆𝑐𝑠=𝑤𝑐𝑠𝑙𝑐𝑠
4
𝛼2(𝐸𝐼)𝑐𝑠 (16)
where: α1 and α2 are constants depending on the load distribution pattern;
(EI)bs is the effective stiffness of the beam strip;
(EI)cs is the effective stiffness of the column strip.
Figure 21 Beam strip and column strips for deflection calculation
For the joined panel with rim beams, the column strip had a higher EI since it was
reinforced by the attached PSL.
The deflection at the center of the panel was:
∆= ∆𝑏𝑠 + ∆𝑐𝑠 (17)

UBC TEAM REPORT: TEAM 2018-07
UBC TEAM REPORT: TEAM 2018-07 PAGE 25/31
The estimated maximum deflections under an applied load of 38.5 kN are shown in Table
7. The largest discrepancy occurred in the joined panel without rim beams, with 13%
difference. It captured the strengthening effect of the rim beams, yielding a reduction of
18% in deflection. This analytical model was a first step to establish a design approach for
two-way CLT panels. Further optimization is needed in combination with the Finite
Element Method results.
Table 7 Estimated panel deflections
Specimen Single panel
#1
Single panel
#2 Joined panel
Joined panel
with rim beams
Estimated (mm) 6.20 6.20 10.42 8.58
Measured (mm) 5.76 5.98 12.0 9.49
Difference 108% 104% 87% 90%
4 CONCLUSIONS AND RECOMMENDATIONS
4.1 Connection performance
An improved connection based on the one used in Phase I was proposed and tested, with
an objective to reduce the manufacturing cost and to speed up the installation process. Since
the moment at the joint cross section was transformed into horizontal shear force between
CLT and connecting plates. The performance of the two types of connectors was quantified
and compared using an H-block test setup. Its shear resistance was represented by a slip
modulus K. The LVL connectors had an average slip modulus of 92.5 kN/mm, at 87% of
the steel plate connectors. The LVL connectors performed better at the initial part of the
loading since they engaged the load immediately while the steel connectors took some time
to close the existing gaps within. Although LVL connections had a lower peak load, it
would not be a controlling factor in the design since the large span panel was mostly
governed by deflection not by strength. The cost of a LVL connection is a fraction of the
steel plate connection cost. It does not require predrilling and has a greater tolerance of
inaccurate screw angles, leading to faster installation. In practice a large LVL plate could
be used instead of many small plates, providing better structural integrity and fire
protection. If a clean surface finish is needed, the connectors can be countersunk into the
wood, as the surface layer of the minor direction is not counted as part of the effective cross
section. Considering all the factors above, the LVL connection was found to be a better
option thus recommended for future applications.
An analytical model was proposed to estimate the rotational stiffness at the connection, in
order to compare a joined section with an intact section. The model was based on simple
beam theory and the assumption that the rotation of a connected section was created by the
slippage of tension plates relative to CLT. The slip modulus measured above was used to
predict the rotational stiffness. The steel plate connection had a stiffness of 782 kN m/rad,
UBC TEAM REPORT: TEAM 2018-07
UBC TEAM REPORT: TEAM 2018-07 PAGE 26/31
98% of the stiffness of an intact panel. The LVL plate connection had a lower stiffness, but
still maintained at a level of 92% compared to the full panel. The model did not consider
the reinforcing effect of screws to the wood, which strengthened the joint and also changed
the failure mode, as observed in Phase I. The framework used in the model may also work
with similar joints, like glued-in rods, for beam connections.
In the H-block test, screws were perpendicular to the grain of the surface layers. As the
screws were pulled out in withdrawal mode, tension perpendicular to grain failure occurred
in the surface layer, and the glueline between the surface layer and second layer
delaminated. This phenomenon requires further study since this screw arrangement is not
uncommon in practice. The effects of screw diameter, screw length, screw angle, screw
arrangement, and washer types are under further investigation. Preliminary results showed
that a smaller angle, for example 30° compared to 45°, led to a higher stiffness.
Since the connection could achieve the same level of stiffness in the minor direction as an
intact panel, concrete topping (if necessary) will be designed using the common method.
Bringing the concrete topping into resisting the bending moment, by providing additional
compressive reaction and changing the location of the neutral axis, may be useful to certain
extent. But first that leads to greater demand on the shear transfer between CLT and
concrete layer. More importantly, the tension resistance remains to be solely supplied by
the steel/LVL plates at the bottom. The improvement may not be significant enough to
justify this approach.
4.2 Diaphragm behavior
The diaphragm test evaluated the performance of connectors under in-plane shear loading.
The stiffness of the connectors was measured as the force applied to create a unit
displacement between two adjacent CLT plates. There were two stiffness stages: the initial
stage with a high stiffness, 56.8 kN/mm on average; and it transited to a prolonged low
stiffness period with an average of 4.3 kN/mm. The transitional load was at the level of 16-
27 kN. This trend was also found in some other cases with screws under lateral load at 90°
to the loading direction. The high stiffness region is recommended for design use. Due to
the number of connectors over per unit length of joint, the continuous CLT plate remains
to be a fairly rigid plate with little energy dissipation in the plate plane. The damper devices
tested in TEAM Report 2018-08 may be employed to mitigate that problem.
The critical part in the design may not be within the diaphragm itself, but between the
diaphragm and other structural members, especially if column supported. Under lateral
loading, the connection between the column and CLT plate will govern the design as a
result of the high rigidity of the plate. As the size of the panel increases, the bearing
capacity of CLT at the top of beams or columns will also become a major concern since
that is controlled by the compressive strength perpendicular to grain. Special bearing plates
and local reinforcements are necessary to address these issues.

UBC TEAM REPORT: TEAM 2018-07
UBC TEAM REPORT: TEAM 2018-07 PAGE 27/31
4.3 Joined panel deflection
In Phase I and Phase II, four two way CLT panels were tested to measure the deflection at
different locations. They had the same length in the major direction, and the single panels
had half of the length of the joined panels in the minor direction. The panels were column
supported at the four corners, with the out of plane load applied at the center. By doubling
the length in the minor direction, the maximum deflection at the center also doubled, from
an average of 5.87 mm to 12.00 mm. The principle deflection changed from the major
direction to the minor direction. Attaching two PSL rim beams along the minor direction
reduced the maximum deflection from 12.00 mm to 9.49 mm, a reduction of 21%, which
corresponded to the increment of EI in the minor direction. If the concentrated load was
uniformly distributed over the surface, the equivalent pressure would be 3.45 kPa. The
deflection/span ratio was 1/280 for the joined panel, and 1/354 for the joined panel with
rim beams.
A model using the crossing beam method was proposed to estimate the panel deflection at
the center under a concentrated load. The principle direction, in which the main deflection
occurred, was identified by comparing the (EI)eff and span of the two directions. The beam
strip was in the principle direction, and the column strip was in the non-principle direction.
The deflection was calculated using simple beam theory. The total deflection was the sum
of the deflection in the two directions. The estimated deflection was in the range of 87-
108% of the measured deflection. It also predicted the effect of rim beams well. Due to the
limited number of tests, the model based on crossing beam method requires further
validation by considering other length/width ratios and loading conditions. This method
works better for uniformly distributed load than for concentrated load, according to its
application in concrete two way slabs. Although uniformly distributed load is the common
design condition, concentrated load is often used in the testing as limited by the panel size.
An ongoing work is using Finite Element Method to simulate the deflection of two way
continuous CLT plates. The data collected in Phase I and Phase II of this project was used
to validate the model. Preliminary results indicated the model could predict the deflection
of single panels within 5% of the measured values, but the current model was too sensitive
to the support parameters and needed more adjustments.
4.4 Assembling and lifting
The dimensions of a large continuous two way CLT plate often exceed the size limit for
common transportation, which means the connections have to be installed on site. The
technique used in this project could be scaled up for that purpose, involving the following
procedures:
1. A rigid platform is built from steel beams or glulam with spacers in between. The
beams shall be parallel to the minor direction of the panels. The single CLT plates are then
UBC TEAM REPORT: TEAM 2018-07
UBC TEAM REPORT: TEAM 2018-07 PAGE 28/31
placed on the platform which sits on a leveled surface. The ends of the beams are attached
to the crane.
2. The gaps between CLT plates are closed using tie-straps, clamps or similar devices.
Although the connectors have a capacity to pull the plates together, large gaps shall be
avoided since that would compromise the joint stiffness.
3. Half of the connectors at the top (evenly spaced over the length) are installed first,
then all the bottom connections, and in the end the other half at the top. Finishing one side
at once may cause the joined panel to bow towards the other direction. The tie-straps or
clamps shall remain in position until all connectors are installed.
4. The joined panel can be lifted to its structural position using this platform or common
CLT lifting devices.
5 ACKNOWLEDGEMENTS
This project was financially supported by Forestry Innovation Investment. The material
support from Structurlam Products Ltd. is gratefully acknowledged.
6 REFERENCES
TEAM Report 2017-08 Connection and performance of two-way CLT plate. C Zhang, G
Lee, and F Lam. Report submitted to Forestry Innovation Investment BC. April 6, 2018.
TEAM Report 2018-08 Connections for stackable heavy timber modules in midrise to tall
wood buildings. C Zhang, G Lee, and F Lam. Report submitted to Forestry Innovation
Investment BC. March 31, 2019.

UBC TEAM REPORT: TEAM 2018-07
UBC TEAM REPORT: TEAM 2018-07 PAGE 29/31
Appendix A Joined panel test results
Figure A- 1 Displacement of the joined panel in the major direction
Figure A- 2 Displacement of the joined panel in the minor direction
UBC TEAM REPORT: TEAM 2018-07
UBC TEAM REPORT: TEAM 2018-07 PAGE 30/31
Figure A- 3 Displacement of the joined panel with rim beams in the major direction
Figure A- 4 Displacement of the joined panel with rim beams in the minor direction

UBC TEAM REPORT: TEAM 2018-07
UBC TEAM REPORT: TEAM 2018-07 PAGE 31/31
THE END