Embed Size (px)
Citation preview

ORIGINAL ARTICLE
Connectivity between the central nucleus of the amygdalaand the bed nucleus of the stria terminalis in the non-humanprimate: neuronal tract tracing and developmental neuroimagingstudies
Jonathan A. Oler1,7 • Do P. M. Tromp1,7 • Andrew S. Fox1,2,7 • Rothem Kovner1,7 •
Richard J. Davidson1,2 • Andrew L. Alexander1,3 • Daniel R. McFarlin1,7 • Rasmus M. Birn1,3 •
Benjamin E. Berg4 • Danielle M. deCampo5 • Ned H. Kalin1,2,7 • Julie L. Fudge5,6
Received: 6 August 2015 / Accepted: 30 January 2016
� Springer-Verlag Berlin Heidelberg 2016
Abstract The lateral division of the bed nucleus of the
stria terminalis (BSTL) and central nucleus of the amygdala
(Ce) form the two poles of the ‘central extended amygdala’,
a theorized subcortical macrostructure important in threat-
related processing. Our previous work in nonhuman pri-
mates, and humans, demonstrating strong resting fMRI
connectivity between the Ce and BSTL regions, provides
evidence for the integrated activity of these structures. To
further understand the anatomical substrates that underlie
this coordinated function, and to investigate the integrity of
the central extended amygdala early in life, we examined the
intrinsic connectivity between the Ce and BSTL in non-
human primates using ex vivo neuronal tract tracing, and
in vivo diffusion-weighted imaging and resting fMRI
techniques. The tracing studies revealed that BSTL receives
strong input from Ce; however, the reciprocal pathway is
less robust, implying that the primate Ce is a major modu-
lator of BSTL function. The sublenticular extended amyg-
dala (SLEAc) is strongly and reciprocally connected to both
Ce and BSTL, potentially allowing the SLEAc to modulate
information flow between the two structures. Longitudinal
early-life structural imaging in a separate cohort of monkeys
revealed that extended amygdala white matter pathways are
in place as early as 3 weeks of age. Interestingly, resting
functional connectivity between Ce and BSTL regions
increases in coherence from 3 to 7 weeks of age. Taken
together, these findings demonstrate a time period during
which information flow between Ce and BSTL undergoes
postnatal developmental changes likely via direct
Ce ? BSTL and/or Ce $ SLEAc $ BSTL projections.
Keywords Sublenticular extended amygdala � Bed
nucleus of the stria terminalis � Central nucleus � Fear �Anxiety � DTI � Functional connectivity
Abbreviations
Ac Anterior commissure
ABmc Accessory basal nucleus, magnocellular
subdivision
Astr Amygdalostriatal transition zone
Bi Basal nucleus, intermediate subdivision
Bmc Basal nucleus, magnocellular subdivision
Bpc Basal nucleus, parvicellular subdivision
BST Bed nucleus of the stria terminalis
BSTL Lateral bed nucleus of the stria terminalis
BSTLc Lateral bed nucleus of the stria terminalis,
capsular subdivision
BSTLcn Lateral bed nucleus of the stria terminalis,
central subdivision
J. A. Oler and D. P. M. Tromp contributed equally to this manuscript.
J. L. Fudge and N. H. Kalin share senior authorship.
& Jonathan A. Oler
1 Department of Psychiatry, University of Wisconsin School of
Medicine and Public Health, Madison, USA
2 Department of Psychology, University of Wisconsin-
Madison, Madison, USA
3 Department of Medical Physics, University of Wisconsin
School of Medicine and Public Health, Madison, USA
4 Allegheny College, Meadville, USA
5 Department of Neuroscience, University of Rochester
Medical Center, Rochester, USA
6 Department of Psychiatry, University of Rochester Medical
Center, Rochester, USA
7 HealthEmotions Research Institute, Wisconsin Psychiatric
Institute and Clinics, 6001 Research Park Blvd., Madison,
WI 53719, USA
123
Brain Struct Funct
DOI 10.1007/s00429-016-1198-9

BSTLj Lateral bed nucleus of the stria terminalis,
juxtacapsular subdivision
BSTLP Lateral bed nucleus of the stria terminalis,
posterior subdivision
C Caudate nucleus
Ce Central nucleus
CeLcn Central nucleus, lateral central subdivision
CeLc Central nucleus, lateral capsular subdivision
CeM Central nucleus, medial subdivision
EAc Central extended amygdala
GP Globus pallidus
GPe Globus pallidus, pars externa
GPi Globus pallidus, pars interna
H Hippocampus
Ic Internal capsule
L Lateral nucleus
M Medial nucleus
NBM Nucleus basalis of Meynert
P Putamen
S Shell of the ventral striatum
SLEAc Sublenticular extended amygdala, central
subdivision
ST Stria terminalis
V Ventricle
VA Ventral amygdalofugal pathway
VP Ventral pallidum
Introduction
Using a combination of imaging, tract tracing, and lesion
techniques, we have focused on the roles for the amygdala
and the bed nucleus of the stria terminalis (BST) in the
expression of primate anxiety (deCampo and Fudge 2013;
Fox and Kalin 2014). Many neuroanatomists consider the
central nucleus of the amygdala (Ce), the lateral subnuclei
of the BST (BSTL), and the cell columns in the basal
forebrain that bridge them (the central division of the
sublenticular extended amygdala, SLEAc) to be compo-
nents of a ‘central extended amygdala’ (EAc)
macrostructure (Alheid and Heimer 1988; de Olmos and
Ingram 1972; Heimer et al. 1991; Johnston 1923;
McDonald 2003), although this concept is not accepted by
other groups (Bienkowski and Rinaman 2013; Swanson
2003; Swanson and Petrovich 1998). The EAc arises from
the ‘sub-pallial’ ganglionic eminence in the embryo (Bu-
pesh et al. 2011), is intimately linked to amygdala proper
(Freese and Amaral 2009; Yilmazer-Hanke 2012),
hypothesized to play an important role in neuropsychiatric
disorders (Heimer et al. 1997) and recognized as a key site
for threat-monitoring behaviors (Fox et al. 2015). Classic
studies, mostly performed in rodents, define the EAc in
part, by: (1) ‘symmetric’ organization of the BSTL and Ce
subdivisions in terms of neuropeptide and transmitter
markers (Alheid and Heimer 1988; McDonald 2003); (2)
robust connections among the BSTL, Ce and SLEAc
(Grove 1988a, b); and (3) many common afferent and
efferent projections (Gray and Magnuson 1987, 1992;
McDonald et al. 1999; Moga et al. 1990; Nagy and Pare
2008; Reynolds and Zahm 2005; Rinaman et al. 2000;
Wallace et al. 1992). These anatomical features, together
with functional imaging studies (Birn et al. 2014; Oler et al.
2012; Torrisi et al. 2015) suggest that the EAc is both a
structural and functional unit. However, few anatomic data
exist to validate these concepts in primates.
The amygdala is connected to the BST via two major fiber
bundles (see Fig. 1), the ventral amygdalofugal pathway
(VA, also called the ansa peduncularis) and the stria termi-
nalis (ST) (Nauta 1961). VA fibers project through the
SLEAc region of the basal forebrain, directly connecting the
Ce and other amygdalar nuclei with the BST (Heimer and
Van Hoesen 2006; Novotny 1977). The ST, on the other
hand, exits the caudal amygdala, arching dorsally and ros-
trally over the thalamus carrying with it efferent fibers from
Ce and other amygdalar nuclei, which terminate in the BSTL
and also pass through it en route to deeper brain structures
that mediate the neuroendocrine and somatomotor responses
to stress (Amaral et al. 1992; Klingler and Gloor 1960).
Using fMRI, we demonstrated strong ‘resting-state’
functional connectivity between the Ce and the BST in
both monkeys and humans (Birn et al. 2014; Oler et al.
2012), and several studies have used diffusion tensor
imaging (DTI) to visualize the structural connectivity of
the ST and VA fiber pathways (Avery et al. 2014; Kruger
et al. 2015; Mori and Aggarwal 2014; Veraart et al. 2011).
Importantly, such in vivo techniques provide the opportu-
nity to repeatedly examine the structure and function of the
EAc in living individuals over time. However, DTI does
not allow for the determination of the directionality of
projections, nor discrimination between passing fiber tracts
and those giving rise to terminating axonal fields. There-
fore, we now present data from neuronal tract tracing
techniques in nonhuman primates to assess the direction-
ality of Ce-BSTL projections, and to visualize, at a
microscopic level, local circuitry within the EAc.
We also previously found that around 2 months of age,
infant monkeys develop the ability to adaptively modulate
their threat-related defensive behaviors, which likely involve
the EAc (Kalin et al. 1991). Therefore, in the current study
we used in vivo imaging to complement the tract tracing,
and to characterize the structural and functional integrity of
the EAc longitudinally at 3 weeks and 7 weeks of age.
Together with the detailed ex vivo tract tracing studies, the
developmental imaging studies provide insights into the
organization of the EAc, and its ontogeny early in life.
Brain Struct Funct
123

Materials and materials
Imaging studies and methods
Subjects
MRI Twenty-eight preadolescent rhesus monkeys (Macaca
mulatta, mean age; 636 days [standard deviation;
227 days], 12 females) were first used to delineate the
white matter tracts connecting the Ce and BST regions. To
study extended amygdala connectivity early in life, an
additional six neonatal rhesus monkeys (three male and
three female) were used. MRIs for the neonate cohort were
acquired at two developmental time points. Mean age at
first MR scan was 21 days (range 20–23 days); mean age at
second MR scan was 49 days (range 48–50 days). Only 5
of the 6 baby monkeys had usable fMRI data from both
time points. The monkeys were born and reared at the
Wisconsin National Primate Research Center (WNPRC)
and the Harlow Center for Biological Psychology. Animals
A
B
C
Ventralamygdalofugalpathway
Striaterminalis
posterior
anterior
Ventralamygdalofugalpathway
Fig. 1 The EAc and its white
matter pathways. a Left a
schematic of the extended
amygdala concept as proposed
by Heimer and
colleagues (Heimer et al. 1999),
and right a plate from a rhesus
monkey brain atlas (Paxinos
et al. 2009) highlighting the
location of the BST (purple) and
Ce (green). b Left mid-sagittal
and right rotated coronal MRI
slices through a rhesus monkey
brain template with an overlaid
rendering of the deterministic
tractography results showing the
pathways connecting the BST
and Ce. Also depicted are the
waypoint ROIs used in the
analysis to define the BST
(purple) and Ce (green). Note
that the ST in the sagittal view
is projected in 3D out in front of
the MRI slice. The ST is
occluded in the tilted coronal
view, traveling caudally behind
the MRI slice then arching
dorsally and rostrally back out
in front of the MRI slice, into
the BST waypoint. c Left a
classic drawing (Roberts 1992)
of the major axonal pathways
leaving the amygdala, and right
a 3D tractography rendering of
bilateral ST/VA pathways
Brain Struct Funct
123
were typically pair housed in a standard primate cage; the
neonates were housed with their mothers. Animals were
fed twice daily and water was available ad libitum. Animal
housing room lights were on a 12-h light–dark cycle.
MRI acquisition
Preadolescent cohort MRI images were acquired after the
animals received ketamine 15 mg/kg and dexmedeto-
midine 15 lg/kg prior to scan. The animal was then placed
in a stereotactic device while heart rate and oxygen satu-
ration were monitored. Dextrose solution was administered
as needed. Animals received a ketamine- 2.5 mg/kg
booster before the last scan sequence, and atipamezole
150 lg/kg immediately following scan. MRI scans were
obtained using a GE SIGNA 750 3.0 T scanner (General
Electrics, Milwaukee, WI, USA) with a quadrature
extremity radio-frequency (RF) coil in which the stereo-
taxic frame fit in the center of the coil.
Infant cohort For both scan acquisitions, the neonatal
animals were initially anesthetized with ketamine HCL
(20 mg/kg). All animals were given atropine sulfate
(0.04 mg/kg) while three animals also received ketoprofen
(0.02 ml). Animals were then transported to the MRI suite,
fitted with an endotracheal tube and sedated using isoflu-
rane anesthesia. Sedation was maintained using less than
1.5 % isoflurane. Animals were then placed in a stereotaxic
device while heart rate, respiration, and oxygen saturation
were monitored continuously throughout the procedure.
Body temperature and glucose were assessed before and
after scanning. All scanning procedures were performed
using protocols approved by the University of Wisconsin
Institutional Animal Care and Use Committee (IACUC).
For both pre-adolescent and neonatal animals, whole-
brain anatomical images were acquired using an axial T1-
weighted 3D inversion recovery prepared fast spoiled gra-
dient recalled scan [IR-fSPGR; repetition time
(TR) = 11.448 ms, echo time (TE) = 5.412 ms, inversion
time (TI) = 600 ms, flip angle a = 10�, number of excita-
tions (NEX) = 2, field of view (FOV) = 140 9 140 mm,
matrix = 256 9 256 interpolated to 512 9 512, in-plane
resolution = 0.27 mm, slice thickness/gap = 0.5/0 mm,
248 slices]. Resting-state functional MRI’s were acquired
using a T2*-weighted echo planar imaging (EPI) sequence
(TR/TE/Flip/FOV/Matrix: 2000 ms/25 ms/90�/140 mm/
64 9 64; 26 9 3.1-mm axial slices; gap: 0.5-mm). For the
infants, three consecutive repetitions were run of this scan.
Diffusion weighted imaging (DWI) was performed using a
two-dimensional, echo-planar, spin-echo sequence [TR/
TE = 10000/85.3 ms, a = 90�, NEX = 1, FOV = 144 9
144 mm, matrix = 128 9 128 interpolated to 256 9 256,
in-plane resolution = 0.5625 mm, slice thick-
ness/gap = 1.3/0 mm, 68 interleaved slices, echo-planar
spacing = 816 ls. DWI (b = 1000 s/mm2) was performed
in 72 non-collinear directions with 6 non-diffusion weighted
images]. Images were acquired in the coronal plane through
the entire monkey brain. A co-planar field map was also
obtained using a gradient echo with images at two echo
times: TE1 = 7 ms, TE2 = 10 ms.
DTI analysis and tractography
Diffusion weighted images were corrected for eddy current
distortions using FMRIB Software Library (FSL)’s tools
for rigid registration (Woolrich et al. 2009). To account for
the movement of individual volumes after this registration
the b-vector files were adjusted for the applied registration
parameters during the eddy correction. The co-planar field
maps were manually skull stripped and then applied to the
DWI’s using FSL’s FUGUE to account for local field
inhomogeneities that were encountered in the scanner.
Additional methods were applied to counter increased
noise due to the small size of the rhesus primate brain.
Voxels with extreme intensities were removed by applying
a mask that excluded the upper 1 % of the apparent dif-
fusion coefficient, lower 1 % of the diffusion-weighted
map and lower 1 % of the b0 maps. Raw DWI’s were
smoothed in plane with 0.5 mm smoothing kernel.
The influence of local noise on the tensor calculation
was reduced by using a method for robust estimation of
tensors by outlier rejection (RESTORE, as implemented in
Camino software; Cook et al. 2006). This method uses an
average noise estimation to determine which diffusion
measurements are extreme outliers and will exclude those
values from the computation of the three-dimensional dif-
fusion estimation. This method has been proven to increase
reliability of the tensor estimation in particularly noisy
datasets (Chang et al. 2005). Fractional anisotropy (FA)
measures were calculated to quantify local diffusion mea-
sures after fitting the tensors. A population-averaged T1-
weighted image was registered to the FA to be used for
anatomical reference using FSL’s linear registration tool
(FLIRT).
Deterministic fiber tractography was run to model white
matter fiber pathways from the measured local diffusion
directions. Whole-brain fiber tractography was performed
using Camino software (Cook et al. 2006) that imple-
mented a tensor deflection (TEND) algorithm for optimal
estimation of the fiber tracking directions (Basser et al.
2000; Lazar et al. 2003). Fiber tracking was terminated in
voxels where FA was below 0.15. Visualization software
(Wang et al. 2007) was used to iteratively delineate the
fiber pathway of interest using anatomically defined way-
points. This study aimed to delineate the tracts connecting
the dorsal amygdala to the BSTL by placing a waypoint in
the region of the posterior dorsal amygdala (containing the
Brain Struct Funct
123
Ce, at the rostrocaudal level where the amygdala-hip-
pocampal junction is best seen Fig. 1), and a second
waypoint in the region surrounding the anterior commis-
sure just lateral to the midline that contained the BSTL (see
Fig. 1). Since the fornix travels in parallel and in close
proximity to the ST, ‘‘NOT’’ points were also used to
exclude fornical fibers originating in the hippocampus;
additional ‘‘NOT’’ points were used to exclude crossing
fibers and fibers of the longitudinal fasciculus. Intra-indi-
vidual images at 3-weeks and 7-weeks were spatially reg-
istered together using tensor based normalization methods
(DTI-TK; Zhang et al. 2006). The ST/VA tracts were
converted to a binary mask, mean FA for the entire tract
was extracted, and paired-sample t tests were used to
examine differences across developmental time points.
Resting state data analysis
Dorsal amygdala (Ce region) functional connectivity in the
infant monkeys was assessed with methods previously used in
adolescent humans (Oler et al. 2012), and a large sample of
preadolescent monkeys (Birn et al. 2014; Oler et al. 2012).
fMRI scans were performed using methods modified from
prior work demonstrating the reliability of collecting resting
fMRI data in anesthetized rhesus monkeys (Vincent et al.
2007). All processing steps were carried out in AFNI (Cox
1996), unless otherwise indicated. Anatomical scans were
manually skull stripped with SPAMALIZE (http://psyphz.
psych.wisc.edu/*oakes/spam/spam_frames.htm). The skull
stripped anatomical scans were registered to a rhesus macaque
template made from 592 pre-adolescent monkeys (0.625 mm
isotropic voxels) utilizing AFNI’s nonlinear registration pro-
gram 3dQwarp with a minimum patch size for warp searching
set at the minimum of 9 mm, and the ‘‘workhard’’ option,
which allows for more iterations, and is helpful in cases when
the volumes are hard to align, as is the case in these infant
scans. Resting state scans (collected in three 5-min runs) were
slice timing and motion corrected, had the first 4 frames
removed, and were adjusted for field inhomogeneities with a
field map correction. The preprocessed resting state scans
were warped into the standard space with the warps calculated
from the anatomical scans, and up-sampled to anatomical
resolution. In order to reduce the influence of non-neuronal
fluctuations on functional connectivity estimates, average
signal intensity time courses from the white matter (WM) and
cerebral spinal fluid (CSF) were regressed out of the EPI time
series (Jo et al. 2010). The residualized resting state signal was
further processed with a 4 mm Gaussian blur and temporal
bandpass filtering (low = 0.01 Hz, high = 0.1 Hz). Analysis
of the group level connectivity was performed with AFNI’s
3dGroupInCorr, by placing a 2 mm seed ROI in the right
dorsal amygdala region. A temporal correlation analysis was
run with the seed mean time-series using all available data,
while controlling for age and subject. The resulting connec-
tivity data was corrected for multiple comparisons testing with
false detection rate (FDR) methods (q = 0.05). As in the
previously published study (Oler et al. 2012), the current
analysis was restricted to examine the connectivity of a right
dorsal amygdala seed. To examine developmental changes in
extended amygdala functional connectivity, the Fisher’s
Z transformed connectivity values were extracted from the
right BSTL cluster resulting from the FDR corrected main-
effects connectivity map. A linear mixed effects model was
used to examine the influence of age (3 vs. 7 weeks) on the
extracted mean connectivity values from all available pairs of
scan data, while taking the within-subjects and by scan vari-
ance into account. In addition we ran a non-parametric Wil-
coxon rank sum test to examine changes in Ce-BST
connectivity between 3 and 7 weeks. This test does not
assume normally distributed data, which is an assumption that
might get violated in tests with a small sample size.
Tract tracing studies and methods
Subjects
Eight adolescent male primates (Macaca fascicularis and
Macaca nemestrina) (2–3 years old) weighing between 2.5
and 4.9 kg were used at the University of Rochester (World
Wide Primates, Tallahassee, FL, USA; Three Springs
Laboratories, Pekaski, PA, USA; Labs of Virginia,
Yemassee, SC, USA; Alpha Genesis, Yemassee, SC,
USA). All experiments were carried out in accordance with
National Institute of Health guidelines. Experimental
design and techniques were aimed at minimizing animal
use and suffering and were reviewed by the University of
Rochester Committee on Animal Research.
Defining the central extended amygdala regions
in primates
In human and nonhuman primates, the BSTL and Ce have
several subdivisions that have been described using various
terminologies (de Olmos 2004; Freedman and Shi 2001;
Gaspar et al. 1987; Heimer et al. 1999; Kaufmann et al.
1997; Lesur et al. 1989; Martin et al. 1991; Walter et al.
1991). Our immunostaining results are consistent with pre-
vious work and we use the terminology of de Olmos (1990)
and Heimer et al. (1999) for all subregions. Sets of subdi-
visions in the primate BSTL ‘mirror’ others in the Ce. The
BSTL and Ce each have transition zones with the striatum,
which like the striatum, are demarcated by relatively higher
levels of acetylcholinesterase (AChE) staining; these include
the juxtacapsular subdivision of the BSTL (BSTLj), ‘mir-
rored’ by the lateral amygdalostriatal transition zone (Astr)
flanking the Ce, and the thin capsular regions of the BSTL
Brain Struct Funct
123
and Ce (BSTLc and CeLc, respectively). In contrast, the
BSTLcn and CeLcn are most easily visualized based on
relatively low AChE staining in each, and very strong
staining for several neuropeptides, including somatostatin
and enkephalin (see deCampo and Fudge 2013 for details).
Surrounding the BSTLcn and CeLcn in some sections, are
smaller islands, separated by fibers of the passing ST. These
are presumed to be parts of the BSTLcn and CeLcn that are
divided away from the main subnucleus by the passing fiber
bundles. Finally, the BSTLP and the CeM are both com-
posed of heterogeneous cell types, demonstrate moderate
AChE staining, and are largely continuous with the SLEAc
(Martin et al. 1991). Importantly, the BSTLP, CeM and
SLEAc—along with cholinergic cell islands—are all pierced
by the VA fiber tract as it courses along the basal forebrain.
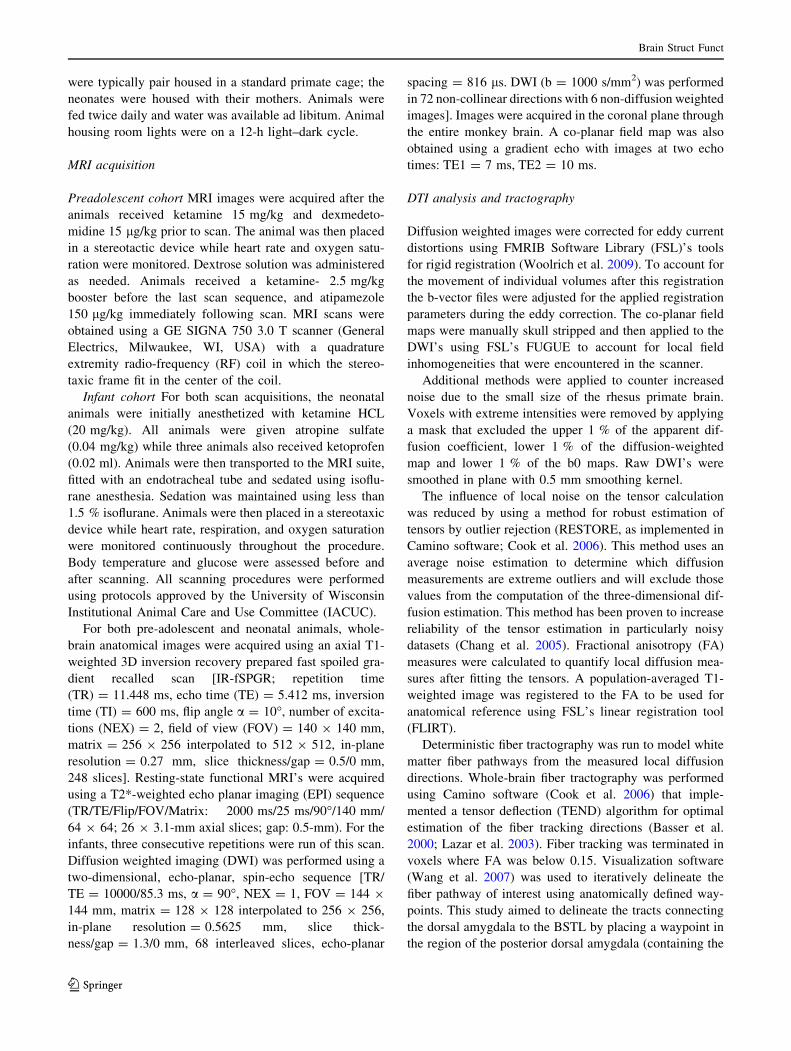
Injection sites
To determine BSTL-SLEAc-Ce connectivity in the same
animal, we (JF, BB and DdC) employed a strategy using
bidirectional tracer injections into the BSTL and Ce ‘poles’
of the EAc (Fig. 2). Small injections (40 nL) of the bidi-
rectional tracers, Lucifer yellow conjugated to dextran
amine (LY; 10 %, Molecular Probes, Eugene, OR, USA),
tetramethylrhodamine, conjugated to dextran amine (‘flu-
oruby’, FR; 4 %, Molecular Probes), and fluorescein con-
jugated to dextran amine (FS; 10 %, Molecular Probes)
were stereotactically injected into the BSTL and Ce.
Additionally, several injections of the tracer wheat-germ
agglutinin-horse radish peroxidase (WGA; 10 %, Sigma,
St. Louis, MO, USA), which has retrograde but not
anterograde properties in primate, were also made for
comparison. Control injections of all tracers were placed in
the nearby striatum. Previous studies from the Fudge lab-
oratory have indicated that there is no cross-reactivity of
antibodies to FR, FS, WGA and LY. In our hands, FR, FS,
and LY have similar anterograde and retrograde properties,
and are sensitive indicators of terminal fields when survival
is between 10 and 14 days (Cho et al. 2013; Haber et al.
2000). WGA results in relatively more labeled cells com-
pared to a similar-sized injection of FR, FS, and LY,
however, the distribution of labeled cells is the same. The
location and extent of Ce and BSTL tracer injections
examined in this study are presented in Fig. 2 and Table 1.
Technical considerations for tracing studies
Several limitations of these tract-tracing studies should be
mentioned. Together, retrograde and anterograde studies
are powerful tools to analyze neural pathways at a cellular
level. Retrograde studies provide a sensitive overview of
afferent sub-structures that can influence specific brain
regions. Anterograde studies are critical for interpretation
of the retrograde data, since the density of retrogradely
labeled cells does not necessarily correspond to the density
of the terminal field. However, issues such as encroach-
ment of tracer on nearby structures, and the possibility of
tracer uptake and transport by ‘fibers of passage’ and axon
collaterals, leading to false-positive results, are concerns
for all types of tracers (Halperin and LaVail 1975; Nance
and Burns 1990). These issues are particularly relevant for
injections in structures such as the BSTL and Ce, which are
small and lie in, or near, passing fiber tracts. To minimize
these problems, we used very slow injections of tracer
(Nance and Burns 1990; Schmued et al. 1990; Vercelli
et al. 2000), and eliminated cases where there was non-
J26 FS
C
J28FS
J28 FR
C
C
ic
GPP
ac
ic
J28 LY
P
J29 FR
C
ac GP
ic
J29 WGAJ28 WGA
A BSTL injections
J24 FRJ24FS
J31FR
icGP
GP
GP
ic
ic
ic
ac
ac
C
P
C
P
C
P
ac
BSTLJ
BSTLJ
BSTLJ
BSTLcn
BSTLcn
BSTLcn
BSTLc
BSTLc
BSTLP
BSTLP
SLEAc
SLEAc
CeLcnCeM
J9LYJ1FR
J1LYJ9FS
CeLcnCeM
CeLc
CeLc
J9FR
J4WGA
V
P
P
Bmc
P
P
Bi
Bi
Bpc
Bpc
ABmc
L
L
M
M
H
GP
GPi GPe
B Ce injections
Astr
Astr
Fig. 2 Top a BSTL injection sites. Schematized drawings of various
injection sites in the BSTL with control injections in or encroaching
on the striatum in light yellow. To the right are acetylcholinesterase
(AChE) stained sections at similar levels showing BSTL subregions.
Bottom b Ce injection sites. Schematized drawings of various
injection sites in the Ce with control injections in the amygdalostriatal
transition zone and striatum in light yellow. AChE stained sections to
the right show the Ce subregions. Scale bar 1 mm
Brain Struct Funct
123

specific labeling. We analyzed remaining cases by their
inputs and outputs to other structures. For example, fibers
leaving the amygdala and ‘passing through’ the BSTL and
Ce go on to innervate the cortex and mediodorsal thalamus
(Aggleton and Mishkin 1984; Miyashita et al. 2007; Por-
rino et al. 1981; Russchen et al. 1987). While we noted
retrogradely labeled cells in the cortex, their distribution
was confined to areas previously noted to innervate the
BSTL (Freedman et al. 2000; Ghashghaei and Barbas
2001) and Ce (Stefanacci and Amaral 2002), rather than
the broader cortical regions that innervate the basal and
accessory basal nuclei (Cho et al. 2013). Additionally,
there were few to no labeled cells or fibers in the
mediodorsal thalamus, indicating that uptake by fibers en
route to the basal and accessory basal nuclei was minimal
(Aggleton and Mishkin 1984; Porrino et al. 1981; Russchen
et al. 1987). Similarly we found that injection sites that
included the BSTLcn, BSTLP, CeM, and CeLcn resulted in
retrogradely labeled cells in the parabrachial nucleus
(Pritchard et al. 2000), whereas injections outside of these
areas in the BSTLJ or the striatum did not. Injection sites
spreading into the striatum invariably resulted in labeled
fibers in the globus pallidus or retrogradely labeled cells in
mediodorsal thalamus (Russchen et al. 1987).
Surgery
To minimize animal use, many injections were performed
as parts of other studies (deCampo and Fudge 2013; Fudge
et al. 2004, 2012; Fudge and Tucker 2009). Stereotaxic
coordinates were determined prior to injection using MRI
imaging (3 T, coronal sections, 0.8 mm thick, 0.1 mm
apart), using previously described techniques (deCampo
and Fudge 2013).
Two weeks after surgery, animals were deeply anes-
thetized and euthanized by perfusion through the heart with
0.9 % saline containing 0.5 ml of heparin sulfate (200 ml/
min for 10 min), followed by cold 4 % paraformaldehyde
in a 0.1 M phosphate buffer/30 % sucrose solution
(100 ml/min for 1 h). The brain was extracted from the
skull, placed in a fixative overnight, and then put through
increasing gradients of sucrose (10, 20, and 30 %). Brains
were cut on a freezing microtome (40 lm) and all sections
were stored in cryoprotectant solution (30 % ethylene
glycol and 30 % sucrose in 0.1 M phosphate buffer) at
-20 �C (Rosene et al. 1986).
Immunocytochemistry
1:8 sections through the brain were immunostained for
tracer. Sections were rinsed in 0.1 M phosphate buffer (pH
7.2) with 0.3 Triton-X (PB-TX) and treated with peroxi-
dase inhibitor for 5 min, followed by more rinses in
0.1 M PB-TX. Sections were then preincubated in a
blocking solution of 10 % normal goat serum (NGS) in
0.1 M PB-TX for 30 min. Tissue was placed in primary
antisera to LY (1:2000, Molecular Probes, rabbit), FS
(1:2000, Molecular Probes, rabbit), FR (1:1000, Molecular
Probes, rabbit), and WGA (1:2000, Sigma, rabbit) for 96 h
at 4 �C. After thorough rinsing with 0.1 M PB-TX, and
preincubation with 10 % NGS-PB-TX, sections were
incubated in biotinylated secondary anti-rabbit antibody.
Tracers were visualized using avidin–biotin reaction
(Vector ABC Standard kit, Burlingame, CA, USA). Addi-
tional compartments for each case were processed for tra-
cer, nickel intensified, and counterstained with AChE,
cresyl violet, or calcium binding protein immunoreactivity
(CaBP-IR). Detection of these tracer molecules in tract
tracing has been extensively documented (see ‘‘Technical
considerations for tracing studies’’, ‘‘Discussion’’).
Histological analysis
Injection sites
The relative position of each injection site within subdi-
visions of the BSTL or Ce was confirmed by charting 1:8
sections through the basal forebrain, with reference to
adjacent sections immunostained for various peptide
markers, and AChE. Injection sites that encroached on the
globus pallidus, internal capsule or other fiber tracts were
eliminated from the analysis. We also analyzed the
Table 1 Relative placement of tracer injections into BSTL and Ce
subdivisions and adjacent striatum
BSTLcn BSTLP BSTLJ/BSTLc Striatum
J24FS ??? ? ?
J28WGA ??? ? ??
J29WGA ??? ? ?
J31FR ? ??? ? ???
J28LY ? ? ?
J28FS ???
J28FR ??? ??
J29FR ??? ???
J26FS ???
J24FR ???
CeLcn CeM CeLc/Astr Striatum
J1LY ???
J1FR ??? ??
J9FS ??? ?
J9LY ???
J9FR ??? ?
J4WGA ???
Brain Struct Funct
123
accuracy of injection site placement by inspecting the
pattern of projections to or from other brain regions based
on the literature. Injection sites were classified as being in
the BSTL or Ce if they resulted in labeled cells and fibers
in the parabrachial nucleus and the midline thalamic nuclei
(Price and Amaral 1981; Pritchard et al. 2000), but did not
result in labeled fibers in the globus pallidus (Haber et al.
1990), subthalamic nucleus (Carpenter et al. 1981), and
mediodorsal thalamus (Price and Amaral 1981). Injection
sites that encroached on the striatum or globus pallidus
invariably had labeled fibers terminating, respectively, in
the CaBP-IR globus pallidus or subthalamic nucleus.
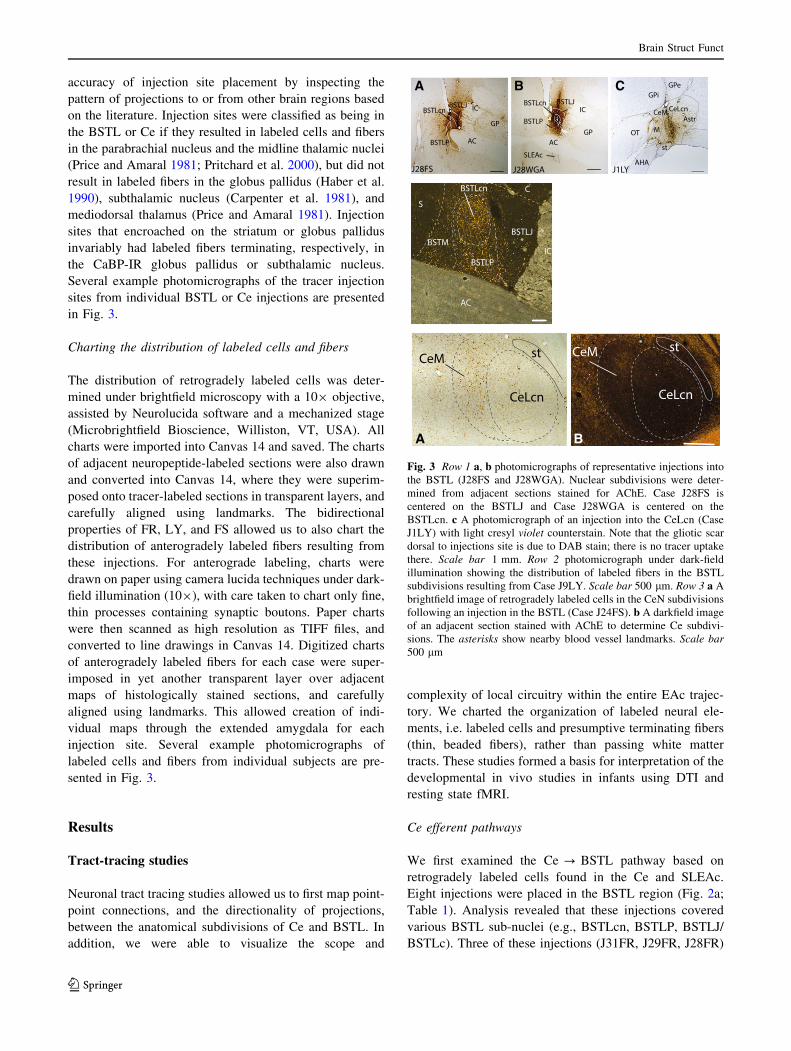
Several example photomicrographs of the tracer injection
sites from individual BSTL or Ce injections are presented
in Fig. 3.
Charting the distribution of labeled cells and fibers
The distribution of retrogradely labeled cells was deter-
mined under brightfield microscopy with a 109 objective,
assisted by Neurolucida software and a mechanized stage
(Microbrightfield Bioscience, Williston, VT, USA). All
charts were imported into Canvas 14 and saved. The charts
of adjacent neuropeptide-labeled sections were also drawn
and converted into Canvas 14, where they were superim-
posed onto tracer-labeled sections in transparent layers, and
carefully aligned using landmarks. The bidirectional
properties of FR, LY, and FS allowed us to also chart the
distribution of anterogradely labeled fibers resulting from
these injections. For anterograde labeling, charts were
drawn on paper using camera lucida techniques under dark-
field illumination (109), with care taken to chart only fine,
thin processes containing synaptic boutons. Paper charts
were then scanned as high resolution as TIFF files, and
converted to line drawings in Canvas 14. Digitized charts
of anterogradely labeled fibers for each case were super-
imposed in yet another transparent layer over adjacent
maps of histologically stained sections, and carefully
aligned using landmarks. This allowed creation of indi-
vidual maps through the extended amygdala for each
injection site. Several example photomicrographs of
labeled cells and fibers from individual subjects are pre-
sented in Fig. 3.
Results
Tract-tracing studies
Neuronal tract tracing studies allowed us to first map point-
point connections, and the directionality of projections,
between the anatomical subdivisions of Ce and BSTL. In
addition, we were able to visualize the scope and
complexity of local circuitry within the entire EAc trajec-
tory. We charted the organization of labeled neural ele-
ments, i.e. labeled cells and presumptive terminating fibers
(thin, beaded fibers), rather than passing white matter
tracts. These studies formed a basis for interpretation of the
developmental in vivo studies in infants using DTI and
resting state fMRI.
Ce efferent pathways
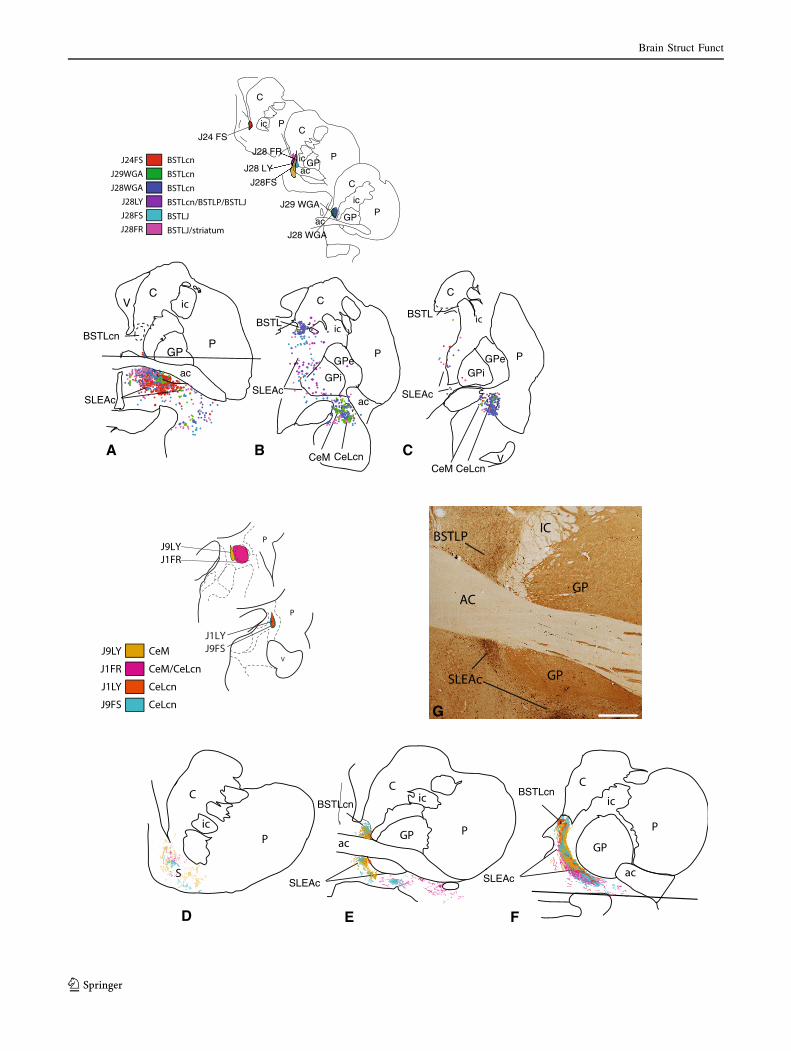
We first examined the Ce ? BSTL pathway based on
retrogradely labeled cells found in the Ce and SLEAc.
Eight injections were placed in the BSTL region (Fig. 2a;
Table 1). Analysis revealed that these injections covered
various BSTL sub-nuclei (e.g., BSTLcn, BSTLP, BSTLJ/
BSTLc). Three of these injections (J31FR, J29FR, J28FR)
BSTLcnBSTLJ
BSTLP AC
IC
GP
GPiGPe
OT
st
AHA
MAstr
CeM CeLcn
J28FS
BSTLcn BSTLJ
BSTLP
AC
IC
SLEAc
GP
J28WGA J1LY
BSTLJ
CBSTLcn
BSTLP
S
BSTM
AC
IC
A B C
*
*
A
CeLcn
CeM st*
*
B
CeLcn
CeM st
Fig. 3 Row 1 a, b photomicrographs of representative injections into
the BSTL (J28FS and J28WGA). Nuclear subdivisions were deter-
mined from adjacent sections stained for AChE. Case J28FS is
centered on the BSTLJ and Case J28WGA is centered on the
BSTLcn. c A photomicrograph of an injection into the CeLcn (Case
J1LY) with light cresyl violet counterstain. Note that the gliotic scar
dorsal to injections site is due to DAB stain; there is no tracer uptake
there. Scale bar 1 mm. Row 2 photomicrograph under dark-field
illumination showing the distribution of labeled fibers in the BSTL
subdivisions resulting from Case J9LY. Scale bar 500 lm. Row 3 a A
brightfield image of retrogradely labeled cells in the CeN subdivisions
following an injection in the BSTL (Case J24FS). b A darkfield image
of an adjacent section stained with AChE to determine Ce subdivi-
sions. The asterisks show nearby blood vessel landmarks. Scale bar
500 lm
Brain Struct Funct
123

straddled the striatum and BSTL. Comparison injections in
the ventral striatum (case J26FS) and ventral caudate
nucleus (case J24FR) were also examined (results not
shown).
Injections that included the BSTL resulted in retrogradely
labeled cells in Ce and SLEAc. All BSTL injections resulted
in labeled cells in the CeM, which formed a continuous
stream into the SLEAc (Fig. 4a–c). Injections involving the
BSTLcn subdivision (J24FS, red, J29WGA green, and
J28WGA, blue) resulted in additional labeled cells in the
CeLcn. Retrogradely labeled cells in the SLEAc were
mainly CaBP-negative medium-sized neurons (i.e. non-
cholinergic neurons). A control injection into the shell of the
ventral striatum also resulted in labeled cells (not shown in
Fig. 4) in the CeM and SLEAc consistent with previous
results, and suggesting a ‘transitional’ role for the shell of
the nucleus accumbens between striatopallidal and EAc
systems (deCampo and Fudge 2013; Fudge et al. 2002).
Anterogradely labeled fibers in the BSTL and SLEAc
resulting from injections in the Ce confirmed the retrograde
results. Five injections were placed in the region of the Ce
(Fig. 2b; Table 1). Of these, one injection (J9FR) straddled
the striatum and CeLc/Astr. All injection sites involving the
Ce resulted in patches of anterogradely labeled fibers in the
SLEAc, BSTL and shell of the ventral stratum (Fig. 4d–f).
Labeled fibers in the SLEAc consisted mostly of very fine,
beaded fibers that avoided the globus pallidus (Fig. 4g),
although thick non-varicose passing fibers (i.e. non-termi-
nating fibers comprising the VA bundle, not charted) were
also present. Most finely beaded fibers avoided the cholin-
ergic cell bodies, which are also embedded in the fibers of the
VA bundle, and terminated densely in the surrounding neu-
ropil, suggesting contacts on the broad dendritic arbors of the
cholinergic system. Injections that included the CeM (J9LY
and J1FR) resulted in the most labeled fibers in the SLEAc
and in all BSTL subdivisions, whereas injections confined to
the CeLcn had a lighter concentration of labeled fibers. Cases
J1LY and J9FS, which were confined to the CeLcn had the
lightest distribution of the labeled fibers that overlapped the
BSTLcn, and spread into the BSTLP and contiguous SLEAc.
Control injections into the caudal ventral striatum (case
J9FR) did not reach the SLEAc, and instead overlapped the
caudal ventral globus pallidus (not shown), indicating that
they are excluded from EAc intrinsic circuits.
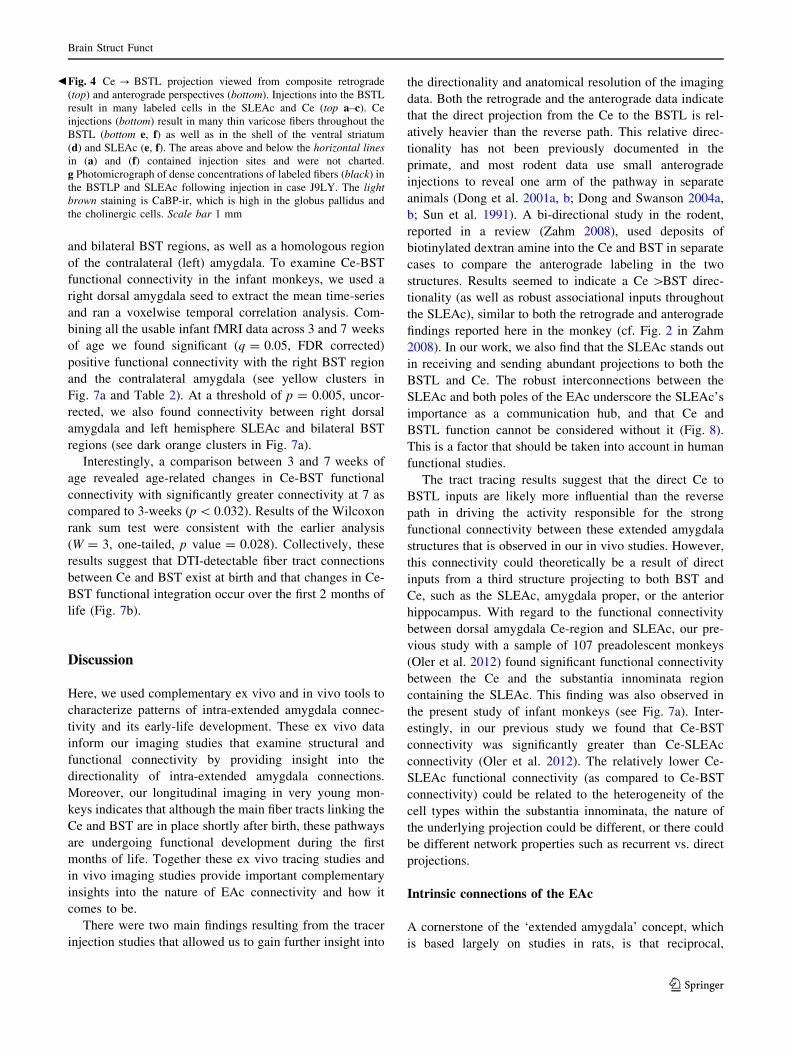
BSTL efferent pathways
We next examined the opposite pathway, first charting the
distribution of retrogradely labeled cells in the BSTL and
SLEAc that resulted from the Ce injections described
above. Surprisingly, there were almost no labeled cells in
the BSTL following all Ce injections (Fig. 5a–c); the few
that were found were in the BSTLP. In contrast, there were
many labeled cells in the SLEAc after all injections, which
flowed in a continuum from the CeM. The highest numbers
of labeled cells in the SLEAc resulted from the injections
that included the CeM, supporting the concept of the
continuity of these areas found in cytoarchitectural and
histochemical work.
In the anterograde direction, all BSTL injections
involving bi-directional tracer resulted in dense, discon-
tinuous patches of labeled thin, highly beaded fibers in the
SLEAc (Fig. 5d–f). The densest patches of labeled fibers
frequently surrounded, rather than directly overlapped, the
cholinergic cell islands (not shown). However, individual
labeled fibers could be seen in close apposition to proximal
dendrites of the large cholinergic neurons. The density of
anterogradely labeled fibers tapered off sharply at caudal
levels, leaving a relatively light concentration of labeled
fibers in the Ce, based on both composite analyses and
when examining individual cases (see Fig. 5g). For
example, the injection in case J31FR resulted in relatively
more labeled fibers in the Ce compared to other BSTL
injections, but the overall density of labeled fibers was still
relatively sparse, and largely restricted to the CeM
(Fig. 5g). The injection into the shell of the ventral striatum
(case J26FS) also resulted in labeled fibers in the SLEAc,
which extended into the CaBP-positive globus pallidus, but
did not extend into the Ce (not shown). As expected, a
control injection into caudate nucleus (case J24FR) only
resulted in labeled fibers in the globus pallidus (not shown).
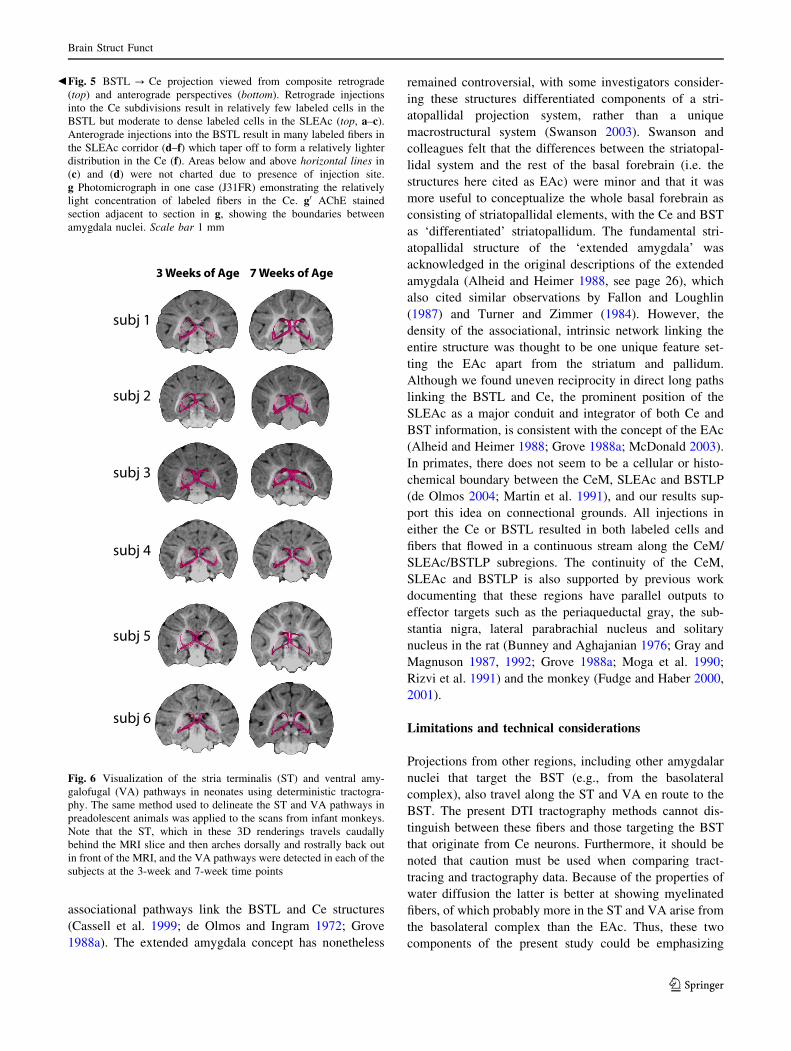
Development of white matter tracts using DTI
in infant monkeys
Deterministic tractography in preadolescent monkeys
demonstrates the ability of DTI to detect the white matter
pathways connecting the dorsal amygdala Ce-region to the
BSTL region (Fig. 1). Employing similar methods used to
delineate the VA and ST pathways in the sample of
preadolescent monkeys, Fig. 6 presents the deterministic
tractography of the VA and ST at 3 and 7 weeks of age.
The results confirm that these pathways are present very
early in life, as the VA and the ST are observed coursing
through and linking extended amygdala subregions in each
infant subject at both time points. Paired-samples t tests did
not detect any significant differences between 3 and
7 weeks of age in mean FA, or mean diffusivity measures,
extracted from the tracts (p’s[ 0.60).
Development of Ce-BST functional connectivity
(fMRI) in infant monkeys
Our previously published data in a large sample of older
preadolescent monkeys (Oler et al. 2012) demonstrated
highly significant functional connectivity between right Ce
Brain Struct Funct
123
J28FS
J28 FR
CJ24 FS
C
Pic
GPP
acic
J28 LY
P
C
ac GP
icJ29 WGA
J28 WGA
ac
SLEAc
GP
BSTLcnP
CV ic C
C
P PGPe GPe
GPi GPi
acSLEAc SLEAc
CeM CeLcnCeM CeLcn
V
BSTLBSTL
icic
J29WGA
J24FS
J28LY
BSTLcn
J28WGABSTLcn
BSTLcn
BSTLcn/BSTLP/BSTLJJ28FS
J28FR
BSTLJ
BSTLJ/striatum
BSTLcnBSTLcn
SLEAc SLEAc
J1FR
J1LY
CeM
CeM/CeLcn
CeLcn
S
C
P
ac
GP
C
Pac
GP
C
Pic
ic ic
CeLcnJ9FS
J9LYV
J9LYJ1FR
J1LYJ9FS
P
P
A B C
D E F
GPAC
GP
BSTLP
SLEAc
IC
G
Brain Struct Funct
123
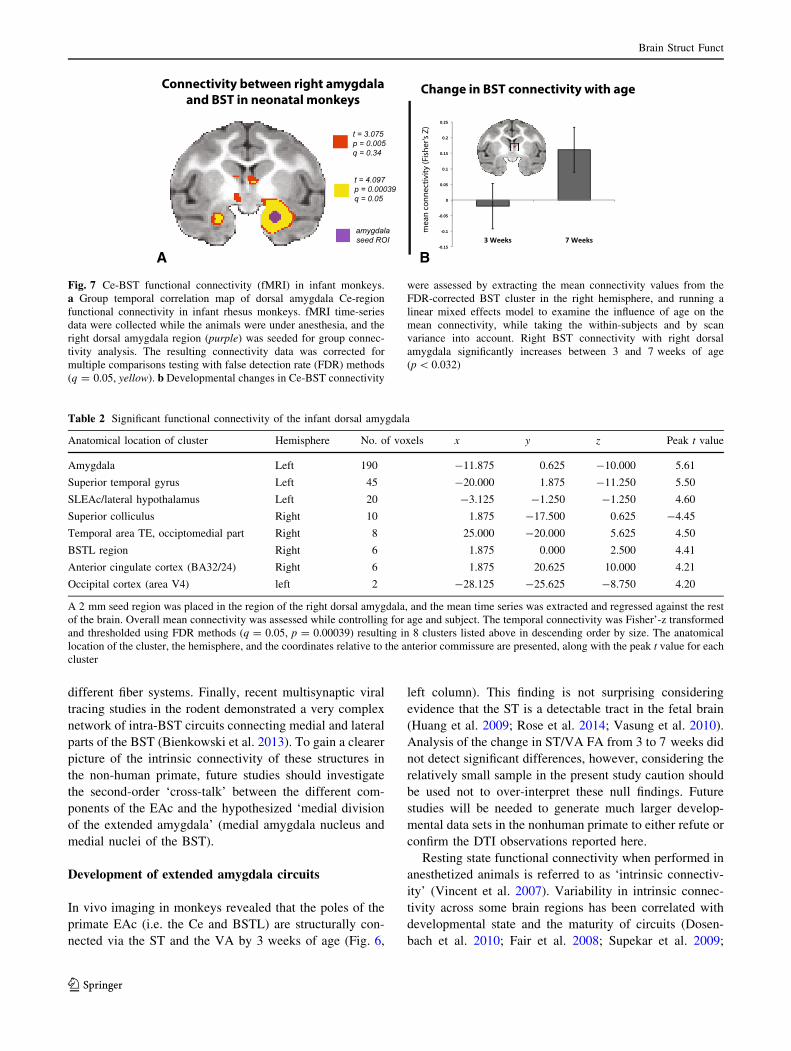
and bilateral BST regions, as well as a homologous region
of the contralateral (left) amygdala. To examine Ce-BST
functional connectivity in the infant monkeys, we used a
right dorsal amygdala seed to extract the mean time-series
and ran a voxelwise temporal correlation analysis. Com-
bining all the usable infant fMRI data across 3 and 7 weeks
of age we found significant (q = 0.05, FDR corrected)
positive functional connectivity with the right BST region
and the contralateral amygdala (see yellow clusters in
Fig. 7a and Table 2). At a threshold of p = 0.005, uncor-
rected, we also found connectivity between right dorsal
amygdala and left hemisphere SLEAc and bilateral BST
regions (see dark orange clusters in Fig. 7a).
Interestingly, a comparison between 3 and 7 weeks of
age revealed age-related changes in Ce-BST functional
connectivity with significantly greater connectivity at 7 as
compared to 3-weeks (p\ 0.032). Results of the Wilcoxon
rank sum test were consistent with the earlier analysis
(W = 3, one-tailed, p value = 0.028). Collectively, these
results suggest that DTI-detectable fiber tract connections
between Ce and BST exist at birth and that changes in Ce-
BST functional integration occur over the first 2 months of
life (Fig. 7b).
Discussion
Here, we used complementary ex vivo and in vivo tools to
characterize patterns of intra-extended amygdala connec-
tivity and its early-life development. These ex vivo data
inform our imaging studies that examine structural and
functional connectivity by providing insight into the
directionality of intra-extended amygdala connections.
Moreover, our longitudinal imaging in very young mon-
keys indicates that although the main fiber tracts linking the
Ce and BST are in place shortly after birth, these pathways
are undergoing functional development during the first
months of life. Together these ex vivo tracing studies and
in vivo imaging studies provide important complementary
insights into the nature of EAc connectivity and how it
comes to be.
There were two main findings resulting from the tracer
injection studies that allowed us to gain further insight into
the directionality and anatomical resolution of the imaging
data. Both the retrograde and the anterograde data indicate
that the direct projection from the Ce to the BSTL is rel-
atively heavier than the reverse path. This relative direc-
tionality has not been previously documented in the
primate, and most rodent data use small anterograde
injections to reveal one arm of the pathway in separate
animals (Dong et al. 2001a, b; Dong and Swanson 2004a,
b; Sun et al. 1991). A bi-directional study in the rodent,
reported in a review (Zahm 2008), used deposits of
biotinylated dextran amine into the Ce and BST in separate
cases to compare the anterograde labeling in the two
structures. Results seemed to indicate a Ce [BST direc-
tionality (as well as robust associational inputs throughout
the SLEAc), similar to both the retrograde and anterograde
findings reported here in the monkey (cf. Fig. 2 in Zahm
2008). In our work, we also find that the SLEAc stands out
in receiving and sending abundant projections to both the
BSTL and Ce. The robust interconnections between the
SLEAc and both poles of the EAc underscore the SLEAc’s
importance as a communication hub, and that Ce and
BSTL function cannot be considered without it (Fig. 8).
This is a factor that should be taken into account in human
functional studies.
The tract tracing results suggest that the direct Ce to
BSTL inputs are likely more influential than the reverse
path in driving the activity responsible for the strong
functional connectivity between these extended amygdala
structures that is observed in our in vivo studies. However,
this connectivity could theoretically be a result of direct
inputs from a third structure projecting to both BST and
Ce, such as the SLEAc, amygdala proper, or the anterior
hippocampus. With regard to the functional connectivity
between dorsal amygdala Ce-region and SLEAc, our pre-
vious study with a sample of 107 preadolescent monkeys
(Oler et al. 2012) found significant functional connectivity
between the Ce and the substantia innominata region
containing the SLEAc. This finding was also observed in
the present study of infant monkeys (see Fig. 7a). Inter-
estingly, in our previous study we found that Ce-BST
connectivity was significantly greater than Ce-SLEAc
connectivity (Oler et al. 2012). The relatively lower Ce-
SLEAc functional connectivity (as compared to Ce-BST
connectivity) could be related to the heterogeneity of the
cell types within the substantia innominata, the nature of
the underlying projection could be different, or there could
be different network properties such as recurrent vs. direct
projections.
Intrinsic connections of the EAc
A cornerstone of the ‘extended amygdala’ concept, which
is based largely on studies in rats, is that reciprocal,
bFig. 4 Ce ? BSTL projection viewed from composite retrograde
(top) and anterograde perspectives (bottom). Injections into the BSTL
result in many labeled cells in the SLEAc and Ce (top a–c). Ce
injections (bottom) result in many thin varicose fibers throughout the
BSTL (bottom e, f) as well as in the shell of the ventral striatum
(d) and SLEAc (e, f). The areas above and below the horizontal lines
in (a) and (f) contained injection sites and were not charted.
g Photomicrograph of dense concentrations of labeled fibers (black) in
the BSTLP and SLEAc following injection in case J9LY. The light
brown staining is CaBP-ir, which is high in the globus pallidus and
the cholinergic cells. Scale bar 1 mm
Brain Struct Funct
123

C
ac
P
ic
P
V
GP GPe
GPi
CeLcn
SLEAc SLEAc
C
CeM
B C
V
J9LYJ1FR
J1LYJ9FS
P
P
BSTLcn
BSTL
J28FS
J28 FR
CJ24 FS
C
Pic
GPP
acic
J28 LY
P
C
ac GP
ic
J29 WGA
J28 WGAJ24FS BSTLcn
J28LY BSTLcn/BSTLP/BSTLJ
J28FS BSTLJ
J28FR BSTLJ/striatum
C
P
ic
ac
GP
C
ac
P
icGPe
GPi
C
P
ic
GPe
GPi
Th
CeLcnCeLcn
BSTLcn
SLEAc SLEAc SLEAc
BSTL
BSTL
CeM CeM
ac
J31FR
J31FR BSTLcn/BSTLP/BSTLJ
/striatum
J1FRJ1LY
CeM
CeM/CeLcn
CeLcn
CeLcnJ9FS
J9LY
ic
D E F
BmcABmc
M
CeLcnCeM
st
L
CeLcnpc
G G'J31 AChE
C
Pic
V
ac
ac
GP
ic
SLEAc
A
BSTLcn
BSTPL
BSTPL
Brain Struct Funct
123
associational pathways link the BSTL and Ce structures
(Cassell et al. 1999; de Olmos and Ingram 1972; Grove
1988a). The extended amygdala concept has nonetheless
remained controversial, with some investigators consider-
ing these structures differentiated components of a stri-
atopallidal projection system, rather than a unique
macrostructural system (Swanson 2003). Swanson and
colleagues felt that the differences between the striatopal-
lidal system and the rest of the basal forebrain (i.e. the
structures here cited as EAc) were minor and that it was
more useful to conceptualize the whole basal forebrain as
consisting of striatopallidal elements, with the Ce and BST
as ‘differentiated’ striatopallidum. The fundamental stri-
atopallidal structure of the ‘extended amygdala’ was
acknowledged in the original descriptions of the extended
amygdala (Alheid and Heimer 1988, see page 26), which
also cited similar observations by Fallon and Loughlin
(1987) and Turner and Zimmer (1984). However, the
density of the associational, intrinsic network linking the
entire structure was thought to be one unique feature set-
ting the EAc apart from the striatum and pallidum.
Although we found uneven reciprocity in direct long paths
linking the BSTL and Ce, the prominent position of the
SLEAc as a major conduit and integrator of both Ce and
BST information, is consistent with the concept of the EAc
(Alheid and Heimer 1988; Grove 1988a; McDonald 2003).
In primates, there does not seem to be a cellular or histo-
chemical boundary between the CeM, SLEAc and BSTLP
(de Olmos 2004; Martin et al. 1991), and our results sup-
port this idea on connectional grounds. All injections in
either the Ce or BSTL resulted in both labeled cells and
fibers that flowed in a continuous stream along the CeM/
SLEAc/BSTLP subregions. The continuity of the CeM,
SLEAc and BSTLP is also supported by previous work
documenting that these regions have parallel outputs to
effector targets such as the periaqueductal gray, the sub-
stantia nigra, lateral parabrachial nucleus and solitary
nucleus in the rat (Bunney and Aghajanian 1976; Gray and
Magnuson 1987, 1992; Grove 1988a; Moga et al. 1990;
Rizvi et al. 1991) and the monkey (Fudge and Haber 2000,
2001).
Limitations and technical considerations
Projections from other regions, including other amygdalar
nuclei that target the BST (e.g., from the basolateral
complex), also travel along the ST and VA en route to the
BST. The present DTI tractography methods cannot dis-
tinguish between these fibers and those targeting the BST
that originate from Ce neurons. Furthermore, it should be
noted that caution must be used when comparing tract-
tracing and tractography data. Because of the properties of
water diffusion the latter is better at showing myelinated
fibers, of which probably more in the ST and VA arise from
the basolateral complex than the EAc. Thus, these two
components of the present study could be emphasizing
bFig. 5 BSTL ? Ce projection viewed from composite retrograde
(top) and anterograde perspectives (bottom). Retrograde injections
into the Ce subdivisions result in relatively few labeled cells in the
BSTL but moderate to dense labeled cells in the SLEAc (top, a–c).
Anterograde injections into the BSTL result in many labeled fibers in
the SLEAc corridor (d–f) which taper off to form a relatively lighter
distribution in the Ce (f). Areas below and above horizontal lines in
(c) and (d) were not charted due to presence of injection site.
g Photomicrograph in one case (J31FR) emonstrating the relatively
light concentration of labeled fibers in the Ce. g0 AChE stained
section adjacent to section in g, showing the boundaries between
amygdala nuclei. Scale bar 1 mm
subj 1
subj 2
subj 3
subj 4
subj 5
subj 6
3 Weeks of Age 7 Weeks of Age
Fig. 6 Visualization of the stria terminalis (ST) and ventral amy-
galofugal (VA) pathways in neonates using deterministic tractogra-
phy. The same method used to delineate the ST and VA pathways in
preadolescent animals was applied to the scans from infant monkeys.
Note that the ST, which in these 3D renderings travels caudally
behind the MRI slice and then arches dorsally and rostrally back out
in front of the MRI, and the VA pathways were detected in each of the
subjects at the 3-week and 7-week time points
Brain Struct Funct
123
different fiber systems. Finally, recent multisynaptic viral
tracing studies in the rodent demonstrated a very complex
network of intra-BST circuits connecting medial and lateral
parts of the BST (Bienkowski et al. 2013). To gain a clearer
picture of the intrinsic connectivity of these structures in
the non-human primate, future studies should investigate
the second-order ‘cross-talk’ between the different com-
ponents of the EAc and the hypothesized ‘medial division
of the extended amygdala’ (medial amygdala nucleus and
medial nuclei of the BST).
Development of extended amygdala circuits
In vivo imaging in monkeys revealed that the poles of the
primate EAc (i.e. the Ce and BSTL) are structurally con-
nected via the ST and the VA by 3 weeks of age (Fig. 6,
left column). This finding is not surprising considering
evidence that the ST is a detectable tract in the fetal brain
(Huang et al. 2009; Rose et al. 2014; Vasung et al. 2010).
Analysis of the change in ST/VA FA from 3 to 7 weeks did
not detect significant differences, however, considering the
relatively small sample in the present study caution should
be used not to over-interpret these null findings. Future
studies will be needed to generate much larger develop-
mental data sets in the nonhuman primate to either refute or
confirm the DTI observations reported here.
Resting state functional connectivity when performed in
anesthetized animals is referred to as ‘intrinsic connectiv-
ity’ (Vincent et al. 2007). Variability in intrinsic connec-
tivity across some brain regions has been correlated with
developmental state and the maturity of circuits (Dosen-
bach et al. 2010; Fair et al. 2008; Supekar et al. 2009;
-0.15
-0.1
-0.05
0
0.05
0.1
0.15
0.2
0.25
3 Weeks 7 Weeks
Connectivity between right amygdalaand BST in neonatal monkeys
A B
amygdalaseed ROI
Change in BST connectivity with age
t = 4.097p = 0.00039q = 0.05
t = 3.075p = 0.005q = 0.34
mea
n co
nnec
tivity
(Fis
her’s
Z)
Fig. 7 Ce-BST functional connectivity (fMRI) in infant monkeys.
a Group temporal correlation map of dorsal amygdala Ce-region
functional connectivity in infant rhesus monkeys. fMRI time-series
data were collected while the animals were under anesthesia, and the
right dorsal amygdala region (purple) was seeded for group connec-
tivity analysis. The resulting connectivity data was corrected for
multiple comparisons testing with false detection rate (FDR) methods
(q = 0.05, yellow). b Developmental changes in Ce-BST connectivity
were assessed by extracting the mean connectivity values from the
FDR-corrected BST cluster in the right hemisphere, and running a
linear mixed effects model to examine the influence of age on the
mean connectivity, while taking the within-subjects and by scan
variance into account. Right BST connectivity with right dorsal
amygdala significantly increases between 3 and 7 weeks of age
(p\ 0.032)
Table 2 Significant functional connectivity of the infant dorsal amygdala
Anatomical location of cluster Hemisphere No. of voxels x y z Peak t value
Amygdala Left 190 -11.875 0.625 -10.000 5.61
Superior temporal gyrus Left 45 -20.000 1.875 -11.250 5.50
SLEAc/lateral hypothalamus Left 20 -3.125 -1.250 -1.250 4.60
Superior colliculus Right 10 1.875 -17.500 0.625 -4.45
Temporal area TE, occiptomedial part Right 8 25.000 -20.000 5.625 4.50
BSTL region Right 6 1.875 0.000 2.500 4.41
Anterior cingulate cortex (BA32/24) Right 6 1.875 20.625 10.000 4.21
Occipital cortex (area V4) left 2 -28.125 -25.625 -8.750 4.20
A 2 mm seed region was placed in the region of the right dorsal amygdala, and the mean time series was extracted and regressed against the rest
of the brain. Overall mean connectivity was assessed while controlling for age and subject. The temporal connectivity was Fisher’-z transformed
and thresholded using FDR methods (q = 0.05, p = 0.00039) resulting in 8 clusters listed above in descending order by size. The anatomical
location of the cluster, the hemisphere, and the coordinates relative to the anterior commissure are presented, along with the peak t value for each
cluster
Brain Struct Funct
123

Uddin et al. 2010; Vergun et al. 2013). While structural
connections (as measured with deterministic tractography)
between BST and Ce appear relatively stable over this
early developmental time period, intrinsic connectivity
between dorsal amygdala Ce region and the BST region
was significantly greater at 7 weeks than at 3 weeks of age
(Fig. 7b). Taken together, the imaging data confirm that the
white matter pathways of the EAc are demonstrable early
in the life of a primate, and indicate that functional inte-
gration of this circuit continues during postnatal
development.
Implications for functional studies in humans
and monkeys
The present findings indicate that, in primates, direct inputs
from the Ce to BST dominate over the reverse pathway,
and that functional coupling of the Ce and the BST is
developing during infancy. The relative directionality of
projections suggests that conditioned stimuli that drive
behavioral responses via Ce also have strong, direct access
to the BSTL, with the potential to influence BST-dependent
responses over time. Consistent with their similar anatomic
features and structural interconnectivitiy, the BSTL and Ce
play related, but not identical, roles in mediating threat-
related responses (Lee and Davis 1997; Walker and Davis
1997). In rodents, the Ce, but not BST, is required for the
expression of short-lived, conditioned fear responses
(Davis and Whalen 2001). In contrast, the BST, but not Ce,
seems to be critical for threat-responses that are prolonged
(Davis et al. 2010). In addition, there are dissociations
between the Ce and BST in relation to threat conditioning,
such that the Ce mediates discrete cue-related fear
responses, whereas the BST is involved in mediating fear
responses elicited by broader contexts (Alvarez et al. 2011;
Fendt et al. 2003; Pego et al. 2008; Walker and Davis 2008;
Zimmerman and Maren 2011). Evidence from rats and
monkeys displaying anxiety-like behaviors (Duvarci et al.
2009; Fox et al. 2008; Jennings et al. 2013; Kalin et al.
2005; Kim et al. 2013), as well as from humans (Alvarez
et al. 2011; Boll et al. 2013; Hasler et al. 2007; LaBar et al.
1998; Mobbs et al. 2010; Somerville et al. 2010, 2013;
Straube et al. 2007), supports the idea that regions of the
EAc are involved in maintaining threat-preparedness and
initiating physiological and behavioral responses to threat.
The time course that we document for increased intrinsic
coupling between the Ce and BST is similar to that for the
development of young monkeys’ abilities to regulate their
capacity to respond to threat with context-appropriate
behaviors (Kalin et al. 1991). More specifically, context-
appropriate freezing behavior in response to the threat of a
human intruder begins to occur around 2-months of age
(Kalin et al. 1991), and we hypothesize that these new
found abilities for regulating the fear response may result
from the concomitant maturation of the EAc. Abundant and
complex intrinsic synaptic connections among the Ce,
BSTL, and SLEAc are likely being shaped between 3 and
7 weeks of age, and the associated developmental pro-
cesses of synaptogenesis and synaptic pruning may be the
source of neuronal change reflected in the maturation of
Ce-BST functional connectivity. Future studies of the
perinatal development of this system in a larger sample,
and the influence of early-life stress on its structural and
functional development, will be informative with respect to
the ontogeny of adaptive and maladaptive fear and anxiety
responses. The present study highlights the potential
importance of the primate SLEAc for understanding EAc
function in relation to adaptive and maladaptive anxiety.
These data provide new insights into the biology and
ontogenesis of the EAc, and build a foundation for
understanding how the coordinated function of the EAc
contributes to stress-related psychopathology.
Acknowledgments We gratefully acknowledge the technical
expertise of Ms. Nanette Alcock and thank the personnel of the
Harlow Center for Biological Psychology, the HealthEmotions
CCe
SLEAc
C
P
ic
ac
GP
Ce
BSTL
BSTLBSTL
SLESLEAc
Fig. 8 Overview of the intrinsic connections of the EAc. Direct long
connections favor the Ce ? BSTL direction over the BSTL ? Ce
path. However, the dense reciprocal innervation of the SLEAc, by
both the BSTL and Ce, reveals a substrate for recurrent connections
and underscores the SLEAc’s potential importance as a communica-
tion hub for extended amygdala information processing
Brain Struct Funct
123
Research Institute, the Waisman Laboratory for Brain Imaging and
Behavior, and the Wisconsin National Primate Research Center
(WNPRC). This research was conducted in part at a facility con-
structed with support from Research Facilities Improvement Program
Grant numbers RR15459-01 and RR020141-01. This work was sup-
ported by Grants from the National Institutes of Health:
P51OD011106 (WNPRC); R01-MH063291 (JLF); F30-MH096502
(DMD); R01-MH046729 (NHK); R01-MH081884 (NHK); P50-
MH100031 (RJD, NHK); T32 NS007-489-09 (LMC) and T32-
MH018931-25. The content is solely the responsibility of the authors
and does not necessarily represent the official views of the National
Institutes of Health.
Compliance with ethical standards
Conflict of interest Dr. Kalin has received honoraria from CME
Outfitters, Elsevier, and the Pritzker Neuropsychiatric Disorders
Research Consortium. He is on the Advisory Boards for Corcept
Therapeutics and Skyland Trail-George West Mental Health Foun-
dation. Dr. Kalin is a Stockholder in Corcept Therapeutics, and owns
several patents including: promoter sequences for corticotropin-re-
leasing factor alpha (U.S. Patent #7071323, issued on 07-04-06); a
method of identifying agents that alter the activity of the promoter
sequences (U.S. Patent #7531356 issued on 05-12-09); promoter
sequences for urocortin II and the use thereof (U.S. Patent #7087385
issued on 08-08-06); and promoter sequences for corticotropin-re-
leasing factor binding protein and use thereof (U.S. Patent #7122650,
issued on 10-17-06). All other authors declare no conflicts of interest.
References
Aggleton JP, Mishkin M (1984) Projections of the amygdala to the
thalamus in the cynomolgus monkey. J Comp Neurol 222:56–68
Alheid GF, Heimer L (1988) New perspectives in basal forebrain
organization of special relevance for neuropsychiatric disorders:
the striatopallidal, amygdaloid, and corticopetal components of
substantia innominata. Neuroscience 27:1–39
Alvarez RP, Chen G, Bodurka J, Kaplan R, Grillon C (2011) Phasic
and sustained fear in humans elicits distinct patterns of brain
activity. Neuroimage 55:389–400. doi:10.1016/j.neuroimage.
2010.11.057
Amaral DG, Price JL, Pitkanen A, Carmichael ST (1992) Anatomical
organization of the primate amygdaloid complex. In: Aggelton
JP (ed) The amygdala: neurobiological aspects of emotion,
memory, and mental dysfunction. Wiley-Liss, New York,
pp 1–66
Avery SN, Clauss JA, Winder DG, Woodward N, Heckers S,
Blackford JU (2014) BNST neurocircuitry in humans. Neuroim-
age 91:311–323. doi:10.1016/j.neuroimage.2014.01.017
Basser PJ, Pajevic S, Pierpaoli C, Duda J, Aldroubi A (2000) In vivo
fiber tractography using DT-MRI data. Magn Reson Med
44:625–632
Bienkowski MS, Rinaman L (2013) Common and distinct neural
inputs to the medial central nucleus of the amygdala and anterior
ventrolateral bed nucleus of stria terminalis in rats. Brain Struct
Funct 218:187–208. doi:10.1007/s00429-012-0393-6
Bienkowski MS, Wendel ES, Rinaman L (2013) Organization of
multisynaptic circuits within and between the medial and the
central extended amygdala. J Comp Neurol 521:3406–3431.
doi:10.1002/cne.23356
Birn RM et al (2014) Evolutionarily conserved prefrontal-amygdalar
dysfunction in early-life anxiety. Mol Psychiatry 19:915–922.
doi:10.1038/mp.2014.46
Boll S, Gamer M, Gluth S, Finsterbusch J, Buchel C (2013) Separate
amygdala subregions signal surprise and predictiveness during
associative fear learning in humans. Eur J Neurosci 37:758–767.
doi:10.1111/ejn.12094
Bunney BS, Aghajanian GK (1976) The precise localization of nigral
afferents in the rat as determined by a retrograde tracing
technique. Brain Res 117:423–435
Bupesh M, Abellan A, Medina L (2011) Genetic and experimental
evidence supports the continuum of the central extended
amygdala and a mutiple embryonic origin of its principal
neurons. J Comp Neurol 519:3507–3531. doi:10.1002/cne.22719
Carpenter MB, Carlton SC, Keller JT, Conte P (1981) Connections of
the subthalamic nucleus in the monkey. Brain Res 224:1–29
Cassell MD, Freedman LJ, Shi C (1999) The intrinsic organization of
the central extended amygdala. Ann N Y Acad Sci 877:217–241
Chang LC, Jones DK, Pierpaoli C (2005) RESTORE: robust
estimation of tensors by outlier rejection. Magn Reson Med
53:1088–1095. doi:10.1002/mrm.20426
Cho YT, Ernst M, Fudge JL (2013) Cortico-amygdala-striatal circuits
are organized as hierarchical subsystems through the primate
amygdala. J Neurosci 33:14017–14030. doi:10.1523/JNEUR
OSCI.0170-13.2013
Cook PA, Bai Y, Nedjati-Gilani S, Seunarine KK, Hall MG, Parker
GJ, Alexander DC (2006) Camino: open-source diffusion-MRI
reconstruction and processing. In: 14th scientific meeting of the
international society for magnetic resonance in medicine,
Seattle, p 2759
Cox RW (1996) AFNI: software for analysis and visualization of
functional magnetic resonance neuroimages. Comput Biomed
Res 29:162–173
Davis M, Whalen P (2001) The amygdala: vigilance and emotion.
Mol Psychiatry 6:13–34
Davis M, Walker DL, Miles L, Grillon C (2010) Phasic vs sustained
fear in rats and humans: role of the extended amygdala in fear vs
anxiety. Neuropsychopharmacology 35:105–135. doi:10.1038/
npp.2009.109
de Olmos JS (1990) Amygdala. In: Paxinos G (ed) The human
nervous system. Academic Press, San Diego, pp 583–710
de Olmos J (2004) The Amygdala. In: Paxinos G, Mai JK (eds) The
human nervous system, 2nd edn. Elsevier Academic Press, San
Diego
de Olmos JS, Ingram WR (1972) The projection field of the stria
terminalis in the rat brain. J Comp Neurol 146:303–333
deCampo DM, Fudge JL (2013) Amygdala projections to the lateral
bed nucleus of the stria terminalis in the macaque: comparison
with ventral striatal afferents. J Comp Neurol 521:3191–3216.
doi:10.1002/cne.23340
Dong HW, Swanson LW (2004a) Organization of axonal projections
from the anterolateral area of the bed nuclei of the stria
terminalis. J Comp Neurol 468:277–298. doi:10.1002/cne.10949
Dong HW, Swanson LW (2004b) Projections from bed nuclei of the
stria terminalis, posterior division: implications for cerebral
hemisphere regulation of defensive and reproductive behaviors
[erratum appears in J Comp Neurol. 2004 Jul 5;474(4):603–604].
J Comp Neurol 471:396–433
Dong HW, Petrovich GD, Swanson LW (2001a) Topography of
projections from amygdala to bed nuclei of the stria terminalis.
Brain Res Brain Res Rev 38:192–246
Dong HW, Petrovich GD, Watts AG, Swanson LW (2001b) Basic
organization of projections from the oval and fusiform nuclei of
the bed nuclei of the stria terminalis in adult rat brain. J Comp
Neurol 436:430–455
Dosenbach NU et al (2010) Prediction of individual brain maturity
using fMRI. Science 329:1358–1361. doi:10.1126/science.1194144
Brain Struct Funct
123
Duvarci S, Bauer EP, Pare D (2009) The bed nucleus of the stria
terminalis mediates inter-individual variations in anxiety and
fear. J Neurosci 29:10357–10361. doi:10.1523/JNEUROSCI.
2119-09.2009
Fair DA et al (2008) The maturing architecture of the brain’s default
network. Proc Natl Acad Sci USA 105:4028–4032. doi:10.1073/
pnas.0800376105
Fallon JH, Loughlin SE (1987) Monoamine innervation of cerebral
cortex and a theory of the role of monoamines in cerebral cortex
and basal ganglia. In: Jones EG, Peters A (eds) Cerebral cortex.
Plenum Press, New York, pp 41–109
Fendt M, Endres T, Apfelbach R (2003) Temporary inactivation of
the bed nucleus of the stria terminalis but not of the amygdala
blocks freezing induced by trimethylthiazoline, a component of
fox feces. J Neurosci 23:23–28
Fox AS, Kalin NH (2014) A translational neuroscience approach to
understanding the development of social anxiety disorder and its
pathophysiology. Am J Psychiatry. doi:10.1176/appi.ajp.2014.
14040449
Fox AS, Shelton SE, Oakes TR, Davidson RJ, Kalin NH (2008) Trait-
like brain activity during adolescence predicts anxious temper-
ament in primates. PLoS ONE 3:e2570. doi:10.1371/journal.
pone.0002570
Fox AS, Oler JA, Tromp DPM, Fudge JL, Kalin NH (2015)
Extending the amygdala in theories of threat processing. Trends
Neurosci (in Press)Freedman LJ, Shi C (2001) Monoaminergic innervation of the
macaque extended amygdala. Neuroscience 104:1067–1084
Freedman LJ, Insel TR, Smith Y (2000) Subcortical projections of
area 25 (subgenual cortex) of the macaque monkey. J Comp
Neurol 421:172–188
Freese JL, Amaral DG (2009) Neuroanatomy of the primate
amygdala. In: Whalen PJ, Phelps EA (eds) The human amyg-
dala. Guilford, NY, pp 3–42
Fudge JL, Haber SN (2000) The central nucleus of the amygdala
projection to dopamine subpopulations in primates. Neuro-
science 97:479–494
Fudge JL, Haber SN (2001) Bed nucleus of the stria terminalis and
extended amygdala inputs to dopamine subpopulations in
primates. Neuroscience 104:807–827
Fudge JL, Tucker T (2009) Amygdala projections to central
amygdaloid nucleus subdivisions and transition zones in the
primate. Neuroscience 159:819–841. doi:10.1016/j.neu
roscience.2009.01.013
Fudge JL, Kunishio K, Walsh P, Richard C, Haber SN (2002)
Amygdaloid projections to ventromedial striatal subterritories in
the primate. Neuroscience 110:257–275
Fudge JL, Breitbart MA, McClain C (2004) Amygdaloid inputs define
a caudal component of the ventral striatum in primates. J Comp
Neurol 476:330–347
Fudge JL, deCampo DM, Becoats KT (2012) Revisiting the
hippocampal-amygdala pathway in primates: association with
immature-appearing neurons. Neuroscience 212:104–119.
doi:10.1016/j.neuroscience.2012.03.040
Gaspar P, Berger B, Lesur A, Borsotti JP, Febvret A (1987)
Somatostatin 28 and neuropeptide Y innervation in the septal
area and related cortical and subcortical structures of the human
brain. Distribution, relationships and evidence for differential
coexistence. Neuroscience 22:49–73
Ghashghaei HT, Barbas H (2001) Neural interaction between the
basal forebrain and functionally distinct prefrontal cortices in the
rhesus monkey. Neuroscience 103:593–614
Gray TS, Magnuson DJ (1987) Neuropeptide neuronal efferents from
the bed nucleus of the stria terminalis and central amygdaloid
nucleus to the dorsal vagal complex in the rat. J Comp Neurol
262:365–374
Gray TS, Magnuson DJ (1992) Peptide immunoreactive neurons in
the amygdala and the bed nucleus of the stria terminalis
project to the midbrain central gray in the rat. Peptides
13:451–460
Grove EA (1988a) Efferent connections of the substantia innominata
in the rat. J Comp Neurol 277:347–364
Grove EA (1988b) Neural associations of the substantia innominata in
the rat: afferent connections. J Comp Neurol 277:315–346
Haber SN, Lynd E, Klein C, Groenewegen HJ (1990) Topographic
organization of the ventral striatal efferent projections in the
rhesus monkey: an anterograde tracing study. J Comp Neurol
293:282–298
Haber SN, Fudge JL, McFarland N (2000) Striatonigrostriatal
pathways in primates form an ascending spiral from the shell
to the dorsolateral striatum. J Neurosci 20(6):2369–2382
Halperin JJ, LaVail JH (1975) A study of the dynamics of retrograde
transport and accumulation of horseradish peroxidase in injured
neurons. Brain Res 100:253–269
Hasler G, Fromm S, Alvarez RP, Luckenbaugh DA, Drevets WC,
Grillon C (2007) Cerebral blood flow in immediate and sustained
anxiety. J Neurosci 27:6313–6319
Heimer L, Van Hoesen GW (2006) The limbic lobe and its output
channels: implications for emotional functions and adaptive
behavior. Neurosci Biobehav Rev 30:126–147. doi:10.1016/j.
neubiorev.2005.06.006
Heimer L, de Olmos J, Alheid GF, Zaborszky L (1991) ’’Perestroika’’
in the basal forebrain: opening the border between neurology and
psychiatry. Prog Brain Res 87:109–165
Heimer L, Harlan RE, Alheid GF, Garcia MM, de Olmos J (1997)
Substantia innominata: a notion which impedes clinical-anatom-
ical correlations in neuropsychiatric disorders. Neuroscience
76:957–1006
Heimer L et al (1999) The human basal forebrain. Part II. In: Bloom
FE, Bjorkland A, Hokfelt T (eds) Handbook of chemical
neuroanatomy, vol 15: the primate nervous system, part III.
Elsevier, Amsterdam, pp 57–226
Huang H et al (2009) Anatomical characterization of human fetal
brain development with diffusion tensor magnetic resonance
imaging. J Neurosci 29:4263–4273. doi:10.1523/JNEUROSCI.
2769-08.2009
Jennings JH, Sparta DR, Stamatakis AM, Ung RL, Pleil KE, Kash TL,
Stuber GD (2013) Distinct extended amygdala circuits for
divergent motivational states. Nature 496:224–228. doi:10.1038/
nature12041
Jo HJ, Saad ZS, Simmons WK, Milbury LA, Cox RW (2010)
Mapping sources of correlation in resting state FMRI, with
artifact detection and removal. Neuroimage 52:571–582. doi:10.
1016/j.neuroimage.2010.04.246
Johnston JB (1923) Further contributions to the study of the evolution
of the forebrain. J Comp Neurol 35:337–481
Kalin NH, Shelton SE, Takahashi LK (1991) Defensive behaviors in
infant rhesus monkeys: ontogeny and context-dependent selec-
tive expression. Child Dev 62:1175–1183
Kalin NH, Shelton SE, Fox AS, Oakes TR, Davidson RJ (2005) Brain
regions associated with the expression and contextual regulation
of anxiety in primates. Biol Psychiatry 58:796–804
Kaufmann WA, Barnas U, Maier J, Saria A, Alheid GF, Marksteiner J
(1997) Neurochemical compartments in the human forebrain:
evidence for a high density of secretoneurin-like immunoreac-
tivity in the extended amygdala. Synapse 26:114–130
Kim SY et al (2013) Diverging neural pathways assemble a
behavioural state from separable features in anxiety. Nature
496:219–223. doi:10.1038/nature12018
Klingler J, Gloor P (1960) The connections of the amygdala and of
the anterior temporal cortex in the human brain. J Comp Neurol
115:333–369
Brain Struct Funct
123
Kruger O, Shiozawa T, Kreifelts B, Scheffler K, Ethofer T (2015)
Three distinct fiber pathways of the bed nucleus of the stria
terminalis to the amygdala and prefrontal cortex. Cortex
66:60–68. doi:10.1016/j.cortex.2015.02.007
LaBar KS, Gatenby JC, Gore JC, LeDoux JE, Phelps EA (1998)
Human amygdala activation during conditioned fear acquisition
and extinction: a mixed-trial fMRI study. Neuron 20:937–945
Lazar M et al (2003) White matter tractography using diffusion tensor
deflection. Hum Brain Mapp 18:306–321. doi:10.1002/hbm.
10102
Lee Y, Davis M (1997) Role of the hippocampus, the bed nucleus of
the stria terminalis, and the amygdala in the excitatory effect of
corticotropin-releasing hormone on the acoustic startle reflex.
J Neurosci 17:6434–6446
Lesur A, Gaspar P, Alvarez C, Berger B (1989) Chemoanatomic
compartments in the human bed nucleus of the stria terminalis.
Neuroscience 32(1):181–194
Martin LJ, Powers RE, Dellovade TL, Price DL (1991) The bed
nucleus-amygdala continuum in human and monkey. J Comp
Neurol 309:445–485
McDonald AJ (2003) Is there an amygdala and how far does it
extend? An anatomical perspective. Ann N Y Acad Sci 985:1–21
McDonald AJ, Shammah-Lagnado SJ, Shi C, Davis M (1999)
Cortical afferents to the extended amygdala. Ann N Y Acad Sci
877:309–338
Miyashita T, Ichinohe N, Rockland KS (2007) Differential modes of
termination of amygdalothalamic and amygdalocortical projec-
tions in the monkey. J Comp Neurol 502:309–324. doi:10.1002/
cne.21304
Mobbs D, Yu R, Rowe JB, Eich H, FeldmanHall O, Dalgleish T
(2010) Neural activity associated with monitoring the oscillating
threat value of a tarantula. Proc Natl Acad Sci USA
107:20582–20586. doi:10.1073/pnas.1009076107
Moga MM, Herbert H, Hurley KM, Yasui Y, Gray TS, Saper CB
(1990) Organization of cortical, basal forebrain, and hypothala-
mic afferents to the parabrachial nucleus in the rat. J Comp
Neurol 295:624–661
Mori S, Aggarwal M (2014) In vivo magnetic resonance imaging of
the human limbic white matter. Front Aging Neurosci 6:321.
doi:10.3389/fnagi.2014.00321
Nagy FZ, Pare D (2008) Timing of impulses from the central
amygdala and bed nucleus of the stria terminalis to the brain
stem. J Neurophysiol 100:3429–3436. doi:10.1152/jn.90936.
2008
Nance DM, Burns J (1990) Fluorescent dextrans as sensitive
anterograde neuroanatomical tracers: applications and pitfalls.
Brain Res Bull 25:139–145
Nauta WJ (1961) Fibre degeneration following lesions of the
amygdaloid complex in the monkey. J Anat 95:515–531
Novotny GE (1977) A direct ventral connection between the bed
nucleus of the stria terminalis and the amygdaloid complex in the
monkey (Macaca fascicularis). J Hirnforsch 18:271–284
Oler JA et al (2012) Evidence for coordinated functional activity
within the extended amygdala of non-human and human
primates. Neuroimage 61:1059–1066. doi:10.1016/j.neuro
image.2012.03.045
Paxinos G, Huang X, Petrides M, Toga A (2009) The rhesus monkey
brain in stereotaxic coordinates, 2nd edn. Academic Press, San
Diego
Pego JM, Morgado P, Pinto LG, Cerqueira JJ, Almeida OF, Sousa N
(2008) Dissociation of the morphological correlates of stress-
induced anxiety and fear. Eur J Neurosci 27:1503–1516
Porrino LJ, Crane AM, Goldman-Rakic PS (1981) Direct and indirect
pathways from the amygdala to the frontal lobe in rhesus
monkeys. J Comp Neurol 198:121–136
Price JL, Amaral DG (1981) An autoradiographic study of the
projections of the central nucleus of the monkey amygdala.
J Neurosci 1:1242–1259
Pritchard TC, Hamilton RB, Norgren R (2000) Projections of the
parabrachial nucleus in the old world monkey. Exp Neurol
165:101–117
Reynolds SM, Zahm DS (2005) Specificity in the projections of
prefrontal and insular cortex to ventral striatopallidum and the
extended amygdala. J Neurosci 25:11757–11767
Rinaman L, Levitt P, Card JP (2000) Progressive postnatal assembly
of limbic-autonomic circuits revealed by central transneuronal
transport of pseudorabies virus. J Neurosci 20:2731–2741
Rizvi TA, Ennis M, Behbehani MM, Shipley MT (1991) Connections
between the central nucleus of the amygdala and the midbrain
periaqueductal gray: topography and reciprocity. J Comp Neurol
303:121–131
Roberts GW (1992) Neuropeptides: celluler morphology, major
pathways, and functional considerations. In: Aggelton JP (ed)
The amygdala: neurobiological aspects of emotion, memory, and
mental dysfunction. Wiley-Liss, New York, pp 115–142
Rose J, Vassar R, Cahill-Rowley K, Guzman XS, Stevenson DK,
Barnea-Goraly N (2014) Brain microstructural development at
near-term age in very-low-birth-weight preterm infants: an atlas-
based diffusion imaging study. Neuroimage 86:244–256. doi:10.
1016/j.neuroimage.2013.09.053
Rosene DL, Roy NJ, Davis BJ (1986) A cryoprotection method that
facilitates cutting frozen sections of whole monkey brains for
histological and histochemical processing without freezing
artifact. J Histochem Cytochem 34(10):1301–1315
Russchen FT, Amaral DG, Price JL (1987) The afferent input to the
magnocellular division of the mediodorsal thalamic nucleus in
the monkey, Macaca fascicularis. J Comp Neurol 256:175–210
Schmued L, Kyriakidis K, Heimer L (1990) In vivo anterograde and
retrograde axonal transport of the fluorescent rhodamine-dex-
tran-amine, Fluoro-Ruby, within the CNS. Brain Res
526:127–134
Somerville LH, Whalen PJ, Kelley WM (2010) Human bed nucleus of
the stria terminalis indexes hypervigilant threat monitoring. Biol
Psychiatry 68:416–424. doi:10.1016/j.biopsych.2010.04.002
Somerville LH, Wagner DD, Wig GS, Moran JM, Whalen PJ, Kelley
WM (2013) Interactions between transient and sustained neural
signals support the generation and regulation of anxious
emotion. Cereb Cortex 23:49–60. doi:10.1093/Cercor/Bhr373
Stefanacci L, Amaral DG (2002) Some observations on cortical inputs
to the macaque monkey amygdala: an anterograde tracing study.
J Comp Neurol 451:301–323
Straube T, Mentzel HJ, Miltner WH (2007) Waiting for spiders: brain
activation during anticipatory anxiety in spider phobics. Neu-
roimage 37:1427–1436. doi:10.1016/j.neuroimage.2007.06.023
Sun N, Roberts L, Cassell MD (1991) Rat central amygdaloid nucleus
projections to the bed nucleus of the stria terminalis. Brain Res
Bull 27:651–662
Supekar K, Musen M, Menon V (2009) Development of large-scale
functional brain networks in children. PLoS Biol 7:e1000157.
doi:10.1371/journal.pbio.1000157
Swanson LW (2003) The amygdala and its place in the cerebral
hemisphere. Ann N Y Acad Sci 985:174–184
Swanson LW, Petrovich GD (1998) What is the amygdala? Trends
Neurosci 21:323–331
Torrisi S et al (2015) Resting state connectivity of the bed nucleus of
the stria terminalis at ultra-high field. Hum Brain Mapp. doi:10.
1002/hbm.22899
Turner BH, Zimmer J (1984) The architecture and some of the
interconnections of the rat’s amygdala and lateral periallocortex.
J Comp Neurol 227:540–557
Brain Struct Funct
123
Uddin LQ, Supekar K, Menon V (2010) Typical and atypical
development of functional human brain networks: insights from
resting-state FMRI. Front Syst Neurosci 4:21. doi:10.3389/fnsys.
2010.00021
Vasung L, Huang H, Jovanov-Milosevic N, Pletikos M, Mori S,
Kostovic I (2010) Development of axonal pathways in the
human fetal fronto-limbic brain: histochemical characterization
and diffusion tensor imaging. J Anat 217:400–417. doi:10.1111/
j.1469-7580.2010.01260.x
Veraart J et al (2011) Population-averaged diffusion tensor imaging
atlas of the Sprague Dawley rat brain. Neuroimage 58:975–983.
doi:10.1016/j.neuroimage.2011.06.063
Vercelli A, Repici M, Garbossa D, Grimaldi A (2000) Recent
techniques for tracing pathways in the central nervous system of
developing and adult mammals. Brain Res Bull 51:11–28
Vergun S et al (2013) Characterizing functional connectivity differ-
ences in aging adults using machine learning on resting state
fMRI data. Front Comput Neurosci 7:38. doi:10.3389/fncom.
2013.00038
Vincent JL et al (2007) Intrinsic functional architecture in the
anaesthetized monkey brain. Nature 447:83–86. doi:10.1038/
nature05758
Walker DL, Davis M (1997) Double dissociation between the
involvement of the bed nucleus of the stria terminalis and the
central nucleus of the amygdala in startle increases produced by
conditioned versus unconditioned fear. J Neurosci 17:9375–9383
Walker DL, Davis M (2008) Role of the extended amygdala in short-
duration versus sustained fear: a tribute to Dr. Lennart Heimer.
Brain Struct Funct 213:29–42. doi:10.1007/s00429-008-0183-3
Wallace DM, Magnuson DJ, Gray TS (1992) Organization of
amygdaloid projections to brainstem dopaminergic,
noradrenergic, and adrenergic cell groups in the rat. Brain Res
Bull 28:447–454
Walter A, Mai JK, Lanta L, Gorcs T (1991) Differential distribution
of immunohistochemical markers in the bed nucleus of the stria
terminalis in the human brain. J Chem Neuroanat 4:281–298
Wang R, Benner T, Sorensen AG, Wedeen VJ (2007) Diffusion
toolkit: a software package for diffusion imaging data processing
and tractography. In: Paper presented at the Proc. Intl. Soc. Mag.
Reson. Med., Berlin, Germany, May 19th–25th
Woolrich MW et al (2009) Bayesian analysis of neuroimaging data in
FSL. Neuroimage 45:S173–S186. doi:10.1016/j.neuroimage.
2008.10.055
Yilmazer-Hanke DM (2012) Amygdala. In: Mai JK, Paxinos G (eds)
The human nervous system. Academic Press, San Diego,
pp 759–834
Zahm DS (2008) Accumbens in a functional-anatomical systems
context. In: David H (ed) The nucleus accumbens: neurotrans-
mitters and related behaviours. Transworld Research Network-
Research Signpost, Kerala, pp 1–37
Zhang H, Yushkevich PA, Alexander DC, Gee JC (2006) Deformable
registration of diffusion tensor MR images with explicit
orientation optimization. Med Image Anal 10:764–785. doi:10.
1016/j.media.2006.06.004
Zimmerman JM, Maren S (2011) The bed nucleus of the stria
terminalis is required for the expression of contextual but not
auditory freezing in rats with basolateral amygdala lesions.
Neurobiol Learn Mem 95:199–205. doi:10.1016/j.nlm.2010.11.
002
Brain Struct Funct
123


![Index [rd.springer.com]978-3-642-54195-7/1.pdf · Index accessory basal nucleus of amygdala (nucleus basalis acces-soriusamygdalae) 62,70,81,82,104,105,115,117,137,149 adhaesio interthalamica](https://img.pdfslide.net/doc/110x75/5c96f2bd09d3f26b0a8d36ee/index-rd-978-3-642-54195-71pdf-index-accessory-basal-nucleus-of-amygdala.jpg)