Embed Size (px)
Citation preview

CONOIL PLC
FINANCIAL STATEMENTS
FOR THE PERIOD ENDED 30 JUNE 2015

CONTENTS
2 Result at a glance
3 Unaudited Statement of comprehensive income
4 Unaudited Statement of financial position
5 Unaudited Statement of changes in equity
6 Unaudited Statement of cash flows
7 -40 Notes to the financial statements

CONOIL PLC
RESULTS AT A GLANCE
FOR THE PERIOD ENDED 30 JUNE 2015
N'000 N'000 %
Revenue 43,027,230 78,507,804 (45)
Profit/(loss) before taxation 528,548 1,488,107 (64)
Profit/(loss) after taxation 359,413 1,011,913 (64)
Share capital 346,976 346,976 0
N'000 N'000
Shareholders' Fund 16,455,460 16,096,047 2
PER SHARE DATA:
Based on 693,952,117 ordinary
shares of 50 kobo each
Earnings per 50k share (Naira)- Basic 52 120 (57)
Number of Staff 250 253
June 2015 June 2014 Change
June 2015 December 2014
2
CONOIL PLC
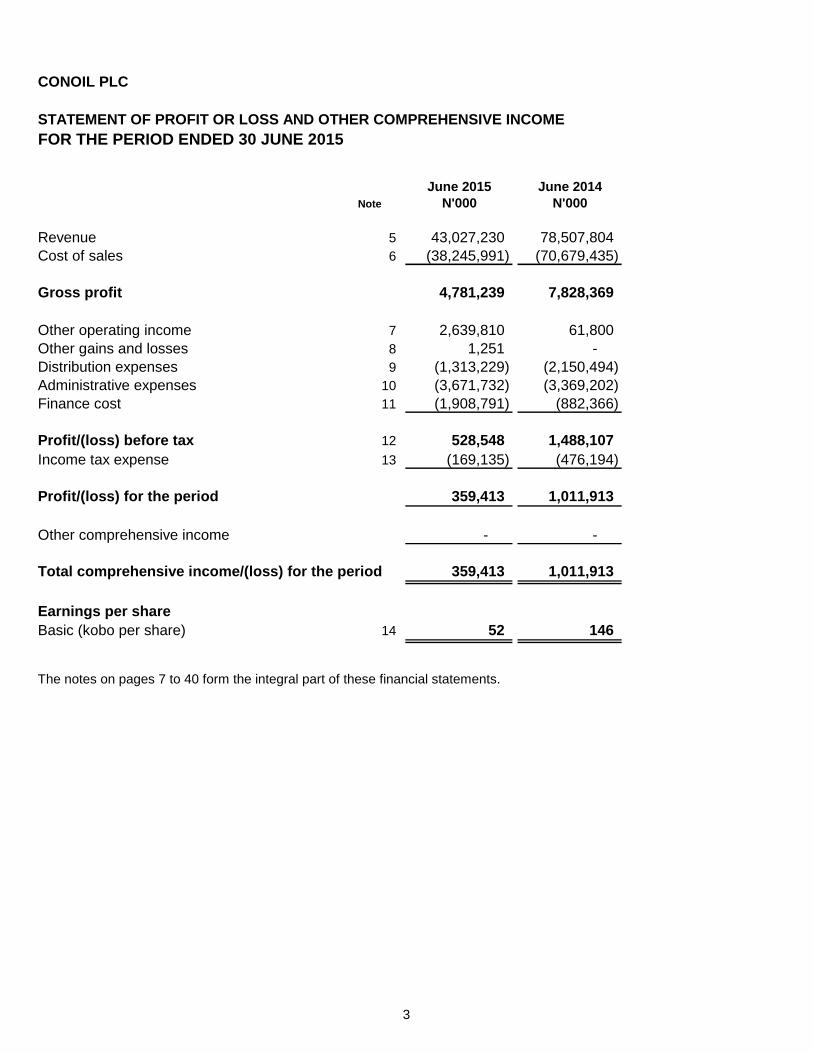
STATEMENT OF PROFIT OR LOSS AND OTHER COMPREHENSIVE INCOME
FOR THE PERIOD ENDED 30 JUNE 2015
June 2015 June 2014
Note N'000 N'000
Revenue 5 43,027,230 78,507,804
Cost of sales 6 (38,245,991) (70,679,435)
Gross profit 4,781,239 7,828,369
Other operating income 7 2,639,810 61,800
Other gains and losses 8 1,251 -
Distribution expenses 9 (1,313,229) (2,150,494)
Administrative expenses 10 (3,671,732) (3,369,202)
Finance cost 11 (1,908,791) (882,366)
Profit/(loss) before tax 12 528,548 1,488,107
Income tax expense 13 (169,135) (476,194)
Profit/(loss) for the period 359,413 1,011,913
Other comprehensive income - -
Total comprehensive income/(loss) for the period 359,413 1,011,913
Earnings per share
Basic (kobo per share) 14 52 146
The notes on pages 7 to 40 form the integral part of these financial statements.
3

CONOIL PLC
STATEMENT OF FINANCIAL POSITION
AS AT 30 JUNE 2015
June 2015 December 2014
Note N'000 N'000
Assets
Non-current assets
Property, plant and equipment 15 3,384,193 3,927,386
Investment property 17 422,025 446,850
Other intangible assets 16 79,601 84,908
Prepayments 19 100,359 100,359
Deferred tax assets 13 968,248 665,805
Other financial asset 18 10 10
Total non-current assets 4,954,436 5,225,318
Current assets
Inventories 20 6,314,474 5,516,195
Trade and other receivables 21 47,484,930 44,447,855
Prepayments 19 521,153 246,004
Cash and bank balances 22 24,493,300 31,158,085
Total current assets 78,813,857 81,368,139
Total assets 83,768,293 86,593,457
Equity and liabilities
Capital and reserves
Share capital 23 346,976 346,976
Share premium 23 3,824,770 3,824,770
Retained earnings 24 12,283,714 11,924,301
Total equity 16,455,460 16,096,047
Non-current liabilities
Distributors’ deposits 27 503,347 498,347
Deferred tax liabilities 13 - -
Decommissioning liability 28 32,511 32,511
Total non-current liabilities 535,858 530,858
Current liabilities
Borrowings 25 17,671,163 22,655,108
Trade and other payables 26 45,997,019 43,540,961
Current tax liabilities 13 3,108,793 3,770,483
Total current liabilities 66,776,975 69,966,552
Total liabilities 67,312,833 70,497,410
Total equity and liabilities 83,768,293 86,593,457
Akin Fabunmi Adeyinka Adebiyi
Finance Director Executive Director
FRC/2013/ICAN/00000003436 FRC/2014/IMN/00000008577
The notes on pages 7 to 40 form the integral part of these financial statements.
The financial statements on pages 2 to 40 were approved by the Board of Directors of the Company on 28
August 2015 and signed on its behalf by:
4

CONOIL PLC
STATEMENT OF CHANGES IN EQUITY
AS AT 30 JUNE 2015
N'000 N'000 N'000 N'000
Balance at 1 January 2014 346,976 3,824,770 13,865,688 18,037,434
Total comprehensive income for the year - - 834,421 834,421
Payment of dividend - - (2,775,808) (2,775,808)
Balance at 31 December 2014 346,976 3,824,770 11,924,301 16,096,047
Total comprehensive income/(loss) for the period - - 359,413 359,413
Payment of dividend - - - -
Balance at 30 June 2015 346,976 3,824,770 12,283,714 16,455,460
The notes on pages 7 to 40 form the integral part of these financial statements.
Share
capital
Share
premium
Retained
earnings Total equity
5

CONOIL PLC
STATEMENT OF CASH FLOWS
FOR THE PERIOD ENDED 30 JUNE 2015
Note June 2015 December 2014
N'000 N'000
Profit after tax 359,413 834,421
Adjustments to reconcile profit after tax to net cash provided
Depreciation 15-17 706,000 1,471,286
Interest payable and similar charges 11 1,908,791 2,307,767
Interest receivable and similar income 7 (2,544,932) (4,290)
Accretion for decomissioning liability - 4,842
Changes in assets and liabilities
(Increase)/decrease in debtors and prepayments (3,312,223) (6,269,830)
Decrease in stock (798,279) 5,119,231
(Decrease)/Increase in trade and other creditors 2,593,724 (5,050,204)
Increase in taxation 471,578 1,694,277
Increase in distributors' deposits 5,000 1,950
Decrease in deferred taxation (302,443) (1,018,715)
Cash generated from operations (913,371) (909,265)
Tax paid (1,133,268) (750,000)
Value added tax paid (137,666) (211,308)
Net cash (used in)/generated by operating activities (2,184,306) (1,870,573)
Cash flows from investing activities
Purchase of fixed assets 15 (132,675) (504,775) Purchase of software 16 - -
Interest received 7 2,544,932 4,290
Net cash generated by investing activities 2,412,257 (500,485)
Cash flows from financing activities
Dividend paid 24 - (2,775,808) Interest paid 11 (1,908,791) (2,307,767)
Net cash used in financing activities (1,908,791) (5,083,575)
Net (decrease) / increase in cash and cash equivalents (1,680,840) (7,454,633)
Cash and cash equivalents at 1 January 8,502,977 15,957,610
Cash and cash equivalents at 30 June / 31 December 22 6,822,137 8,502,977
The notes on pages 7 to 40 form the integral part of these financial statements.
6

CONOIL PLC
NOTES TO THE FINANCIAL STATEMENTS
FOR THE PERIOD ENDED 30 JUNE 2015
1. The Company
1.1 Composition of Financial Statements
The financial statements are drawn up in Nigerian Naira, the financial currency of Conoil Plc, in accordance with IFRS
accounting presentation. The financial statements comprise:
-Statement of profit or loss and other comprehensive income
-Statement of changes in equity
-Statement of cash flows
-Notes to the financial statements
Additional information provided by the management includes:
-Value added statement
-Five year financial summary
1.2 Financial period
2
2.1 Accounting standards and interpretations issued but not yet effective
Effective for the financial year commencing 1 January 2018
- IFRS 9 Financial Instruments
Defined Benefit Plans: Employee Contributions (Amendment to IAS 19)
IAS 16 and IAS 41 - Agriculture: Bearer plants
Conoil Plc (“The Company”) was incorporated in 1960. The Company's authorised share capital is 700,000,000 ordinary shares of
50k each.
The following revisions to accounting standards and pronouncements that are applicable to the Company were issued but are not yet
effective. Where IFRSs and IFRIC interpretations listed below permit early adoption, the Company has elected not to apply them in
the preparation of these financial statements.
The Company was established to engage in the marketing of refined petroleum products and the manufacturing and marketing of
lubricants, household and industrial chemicals.
Effective for the financial year commencing 1 January 2016- Disclosure Initiative (Amendments to IAS 1)
These financial statements cover the financial period from 1 January 2015 to 30 June 2015 with comparative figures for the financial
period from 1 January 2014 to 30 June 2014.
Adoption of new and revised International Financial Reporting Standards (IFRS) and Interpretations by the International
Financial Reporting Interpretations Committee (IFRIC)
- IFRS 15 Revenue from Contracts with Customers
All standards and interpretations will be adopted at their effective date and their implications on the Company are stated below:
Effective for the financial year commencing 1 January 2017
-Statement of financial position
Effective for the financial year commencing 1 January 2016
Effective for the financial year commencing 1 January 2018
7
CONOIL PLC
NOTES TO THE FINANCIAL STATEMENTS
FOR THE PERIOD ENDED 30 JUNE 2015
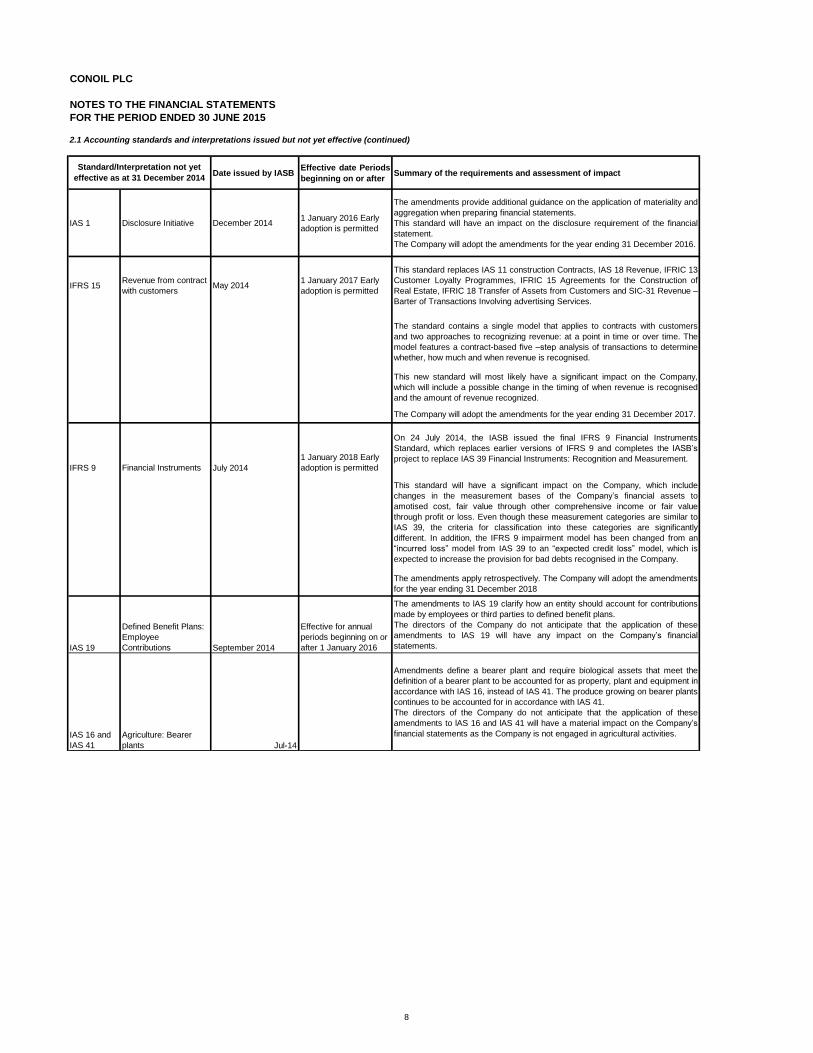
2.1 Accounting standards and interpretations issued but not yet effective (continued)
Date issued by IASBEffective date Periods
beginning on or afterSummary of the requirements and assessment of impact
IAS 1 Disclosure Initiative December 20141 January 2016 Early
adoption is permitted
The amendments provide additional guidance on the application of materiality and
aggregation when preparing financial statements.
This standard will have an impact on the disclosure requirement of the financial
statement.
The Company will adopt the amendments for the year ending 31 December 2016.
IFRS 15Revenue from contract
with customersMay 2014
1 January 2017 Early
adoption is permitted
This standard replaces IAS 11 construction Contracts, IAS 18 Revenue, IFRIC 13
Customer Loyalty Programmes, IFRIC 15 Agreements for the Construction of
Real Estate, IFRIC 18 Transfer of Assets from Customers and SIC-31 Revenue –
Barter of Transactions Involving advertising Services.
The standard contains a single model that applies to contracts with customers
and two approaches to recognizing revenue: at a point in time or over time. The
model features a contract-based five –step analysis of transactions to determine
whether, how much and when revenue is recognised.
This new standard will most likely have a significant impact on the Company,
which will include a possible change in the timing of when revenue is recognised
and the amount of revenue recognized.
The Company will adopt the amendments for the year ending 31 December 2017.
IFRS 9 Financial Instruments July 2014
1 January 2018 Early
adoption is permitted
On 24 July 2014, the IASB issued the final IFRS 9 Financial Instruments
Standard, which replaces earlier versions of IFRS 9 and completes the IASB’s
project to replace IAS 39 Financial Instruments: Recognition and Measurement.
This standard will have a significant impact on the Company, which include
changes in the measurement bases of the Company’s financial assets to
amotised cost, fair value through other comprehensive income or fair value
through profit or loss. Even though these measurement categories are similar to
IAS 39, the criteria for classification into these categories are significantly
different. In addition, the IFRS 9 impairment model has been changed from an
“incurred loss” model from IAS 39 to an “expected credit loss” model, which is
expected to increase the provision for bad debts recognised in the Company.
The amendments apply retrospectively. The Company will adopt the amendments
for the year ending 31 December 2018
IAS 19
Defined Benefit Plans:
Employee
Contributions September 2014
Effective for annual
periods beginning on or
after 1 January 2016
The amendments to lAS 19 clarify how an entity should account for contributions
made by employees or third parties to defined benefit plans.
The directors of the Company do not anticipate that the application of these
amendments to lAS 19 will have any impact on the Company’s financial
statements.
IAS 16 and
IAS 41
Agriculture: Bearer
plants Jul-14
Amendments define a bearer plant and require biological assets that meet the
definition of a bearer plant to be accounted for as property, plant and equipment in
accordance with IAS 16, instead of IAS 41. The produce growing on bearer plants
continues to be accounted for in accordance with IAS 41.
The directors of the Company do not anticipate that the application of these
amendments to lAS 16 and lAS 41 will have a material impact on the Company’s
financial statements as the Company is not engaged in agricultural activities.
Standard/Interpretation not yet
effective as at 31 December 2014
8

CONOIL PLC
NOTES TO THE FINANCIAL STATEMENTS
FOR THE PERIOD ENDED 30 JUNE 2015
2.2 Accounting standards and interpretations effective in the current year
Amendments to IFRS 10, IFRS 12 and IAS 27 Investment Entities
The following new standards and amendments to the existing standards issued by the international
Accounting standards Board and interpretations issued by the International Financial Reporting
Interpretations Committee are effective for the current year.
The amendments to IFRS 10 define an investment entity and require a reporting entity that meets the
definition of an investment entity not to consolidate its subsidiaries but instead to measure its
subsidiaries at fair value through profit or loss in its consolidated and separate financial statements.
The amendments to IAS 32 clarify the requirements relating to the the offset of financial assets and
financial liabilities. Specifically, the amendments clarify the meaning of 'currently has a legally
enforceable right of set-off' and 'simultaneous realisation and settlement'.
The amendments have been applied retrospectively. The Company does not have any financial
assets and financial liabilities that qualify for offset, the application of the amendments has had no
impact on the accounting policies, disclosure or on the amounts recognised in the company's financial
statements.
The amendments to IAS 36 remove the requirement to disclose the recoverable amount of a cash-
generating unit (CGU) to which goodwill or other intangible assets with indefinite useful lives had been
allocated when there has been no impairment or reversal of impairment of the related CGU.
Furthermore, the amendments introduce additional disclosure reqirements applicable to when the
recoverable amount of an asset or a CGU is measured at fair value less costs of disposal. These new
disclosures include the fair value hierarchy, key assumptions and valuation techniques used which are
in line with the disclosure required by IFRS 13 Fair Value Measurements.
Amendments have also been made to IFRS 12 and IAS 27 to introduce new disclosure requirements
for investment entities.
The Company is not an investment entity and has no subsidiary, hence the application of the
amendments has had no impact on the accounting policies, disclosures or the amounts recgnised in
the Company's financial statements.
Amendments to IAS 32 Offsetting Financial Assets and Financial Liabilities
Amendments to IAS 36 Recoverable Amount Disclosures for Non-Financial Assets
This Interpretation has no impact on the disclosures or on the amounts recognised in the Company
financial statements.
The application of these amendments has had no material impact on the disclosures in the
Company's financial statements.
Amendments to IAS 39 Novation of Derivatives and Continuation of Hedge AccountingThe amendments to IAS 39 provide relief from the requirement to discontinue hedge accounting when
a derivative designated as a hedging instrument is novated under certain circumstances. The
amendments also clarify that any change to the fair value of the derivative designated as s hedging
instrument arising from tha novation should be included in the assessment and measurement of
hedge effectiveness.
The interpretation defines a levy, and specifies that tha obligating event that gives rise to the liability is
the activity that triggers the payment of the levy, as identified by legislation. The interpretation provides
guidance on how different levy arrangements should be accounted for, in particular, it clarifies that
neither economic compulsion nor the going concern basis of financial statements preparation implies
that an entity has a present obligation to pay a levy that will be triggered by operating in a future
period.
The Company does not have any derivatives that are subject to novation, the amendments have no
impact on the disclosures or on the amounts recognised in the Company's financial statements.
IFRIC 21 Levies
9

CONOIL PLC
NOTES TO THE FINANCIAL STATEMENTS
FOR THE PERIOD ENDED 30 JUNE 2015
3 SIGNIFICANT ACCOUNTING POLICIES
3.1 Compliance with applicable law and IFRS
3.2 Accounting principles and policies
3.3 Revenue recognition
3.3.1 Sale of goods
-the costs incurred or to be incurred in respect of the transaction can be measured reliably
3.3.2 Interest revenue
Interest income is recognised when it is probable that the economic benefits will flow to the Company
and the amount of revenue can be measured reliably. Interest income is accrued on a time basis, by
reference to the principal outstanding and at the effective interest rate applicable, which is the rate that
exactly discounts estimated future cash receipts through the expected life of the financial asset to that
asset’s net carrying amount on initial recognition.
-the Company has transferred to the buyer the significant risks and rewards of ownership of the
goods;-the Company retains neither continuing managerial involvement to the degree usually associated with
ownership nor effective control over the goods sold;
-the amount of revenue can be measured reliably;
-it is probable that the economic benefits associated with the transaction will flow to the entity; and
The annual financial statements are prepared in accordance with International Financial Reporting
Standards (IFRSs) and the requirements of the Companies and Allied Matters Act (CAMA) and the
Financial Reporting Council of Nigeria Act.
The financial statements have been prepared on the historical cost basis. Historical cost is generally
based on the fair value of the consideration given in exchange for the assets. The principal accounting
policies adopted are set out below.
The financial statements have been prepared in accordance with the Company’s accounting policies
approved by the Board of Directors of the Company.
Revenue is measured at the fair value of the consideration received or receivable and represents
amounts receivable for goods and services provided in the normal course of business, net of
discounts and sales related taxes (where applicable).
Exchanges of petroleum products within normal trading activities do not generate any income and
therefore these flows are shown at their net value in both the statement of profit or loss and other
comprehensive income and the statement of financial position.
Revenue from the sale of goods is recognised when all the following conditions are satisfied:
10

CONOIL PLC
NOTES TO THE FINANCIAL STATEMENTS
FOR THE PERIOD ENDED 30 JUNE 2015
SIGNIFICANT ACCOUNTING POLICIES (continued)
3.3.3 Service income
3.4 Foreign currency translation
3.5 Pensions and other post-employment benefits
3.6 Taxation
3.6.1 Current tax
3.6.2 Deferred tax
The financial statements of the Company are prepared in Nigerian Naira which is its functional currency and
presentation currency.
The carrying amount of deferred tax assets is reviewed at each reporting date and reduced to the extent that it is no
longer probable that sufficient taxable profits will be available to allow all or part of the asset to be recovered.
Service income represents income from Entity’s property at service stations while rental income represents income
from letting of the entities building. Both service income and rental income are credited to the statement of
comprehensive income when they are earned.
In preparing the financial statements, transactions in currencies other than the Company's functional currency
(foreign currencies) are recognised at the rates of exchange prevailing at the dates of the transactions. At the end of
each reporting year, monetary items denominated in foreign currencies are retranslated at the rates prevailing at that
date. Non-monetary items carried at fair value that are denominated in foreign currencies are retranslated at the rates
prevailing at the date when the fair value was determined. Non-monetary items that are measured in terms of
historical cost in a foreign currency are not retranslated.
The Company operates a defined contribution pension plan for its employees and pays fixed contributions into a
separate entity. The Company has no legal or constructive obligations to pay further contributions if the fund does not
hold sufficient assets to pay all employees the benefits relating to employee service in the current and prior years.
The Company also operated a gratuity scheme for its qualified employees prior to 2008 which it has discontinued.
The tax expense represents the sum of the tax currently payable and deferred tax.
The tax currently payable is based on taxable profit for the year. Taxable profit differs from net profit as reported in
the statement of comprehensive income because it excludes items of income or expense that are taxable or
deductible in other years and it further excludes items that are never taxable or deductible. The Company’s liability for
current tax is calculated using tax rates that have been enacted or substantively enacted at the reporting date.
In addition, payments to defined contribution retirement benefit plans are recognised as an expense when employees
have rendered service entitling them to the contributions.
Deferred tax is the tax expected to be payable or recoverable on differences between the carrying amounts of assets
and liabilities in the financial statements and the corresponding tax bases used in the computation of taxable profit,
and is accounted for using the liability method. Deferred tax liabilities are generally recognised for all taxable
temporary differences and deferred tax assets are recognised to the extent that it is probable that taxable profits will
be available against which deductible temporary differences can be utilised. Such assets and liabilities are not
recognised if the temporary difference arises from the initial recognition of goodwill or from the initial recognition
(other than in a business combination) of other assets and liabilities in a transaction that affects neither the taxable
profit nor the accounting profit.
11
CONOIL PLC
NOTES TO THE FINANCIAL STATEMENTS
FOR THE PERIOD ENDED 30 JUNE 2015
SIGNIFICANT ACCOUNTING POLICIES (continued)
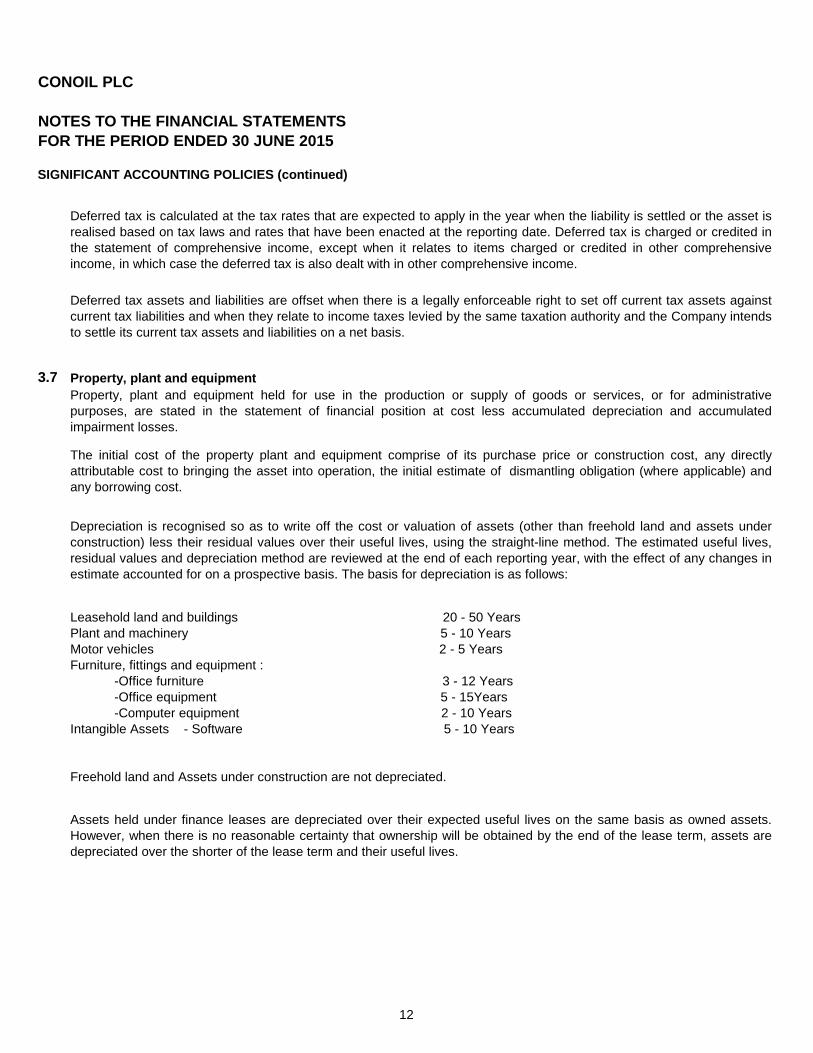
3.7 Property, plant and equipment
Assets held under finance leases are depreciated over their expected useful lives on the same basis as owned assets.
However, when there is no reasonable certainty that ownership will be obtained by the end of the lease term, assets are
depreciated over the shorter of the lease term and their useful lives.
-Office equipment 5 - 15Years
Freehold land and Assets under construction are not depreciated.
Deferred tax is calculated at the tax rates that are expected to apply in the year when the liability is settled or the asset is
realised based on tax laws and rates that have been enacted at the reporting date. Deferred tax is charged or credited in
the statement of comprehensive income, except when it relates to items charged or credited in other comprehensive
income, in which case the deferred tax is also dealt with in other comprehensive income.
Deferred tax assets and liabilities are offset when there is a legally enforceable right to set off current tax assets against
current tax liabilities and when they relate to income taxes levied by the same taxation authority and the Company intends
to settle its current tax assets and liabilities on a net basis.
Property, plant and equipment held for use in the production or supply of goods or services, or for administrative
purposes, are stated in the statement of financial position at cost less accumulated depreciation and accumulated
impairment losses.
Motor vehicles 2 - 5 Years
Leasehold land and buildings 20 - 50 Years
The initial cost of the property plant and equipment comprise of its purchase price or construction cost, any directly
attributable cost to bringing the asset into operation, the initial estimate of dismantling obligation (where applicable) and
any borrowing cost.
Intangible Assets - Software 5 - 10 Years
-Computer equipment 2 - 10 Years
Depreciation is recognised so as to write off the cost or valuation of assets (other than freehold land and assets under
construction) less their residual values over their useful lives, using the straight-line method. The estimated useful lives,
residual values and depreciation method are reviewed at the end of each reporting year, with the effect of any changes in
estimate accounted for on a prospective basis. The basis for depreciation is as follows:
Plant and machinery 5 - 10 Years
Furniture, fittings and equipment :
-Office furniture 3 - 12 Years
12
CONOIL PLC
NOTES TO THE FINANCIAL STATEMENTS
FOR THE PERIOD ENDED 30 JUNE 2015
SIGNIFICANT ACCOUNTING POLICIES (continued)
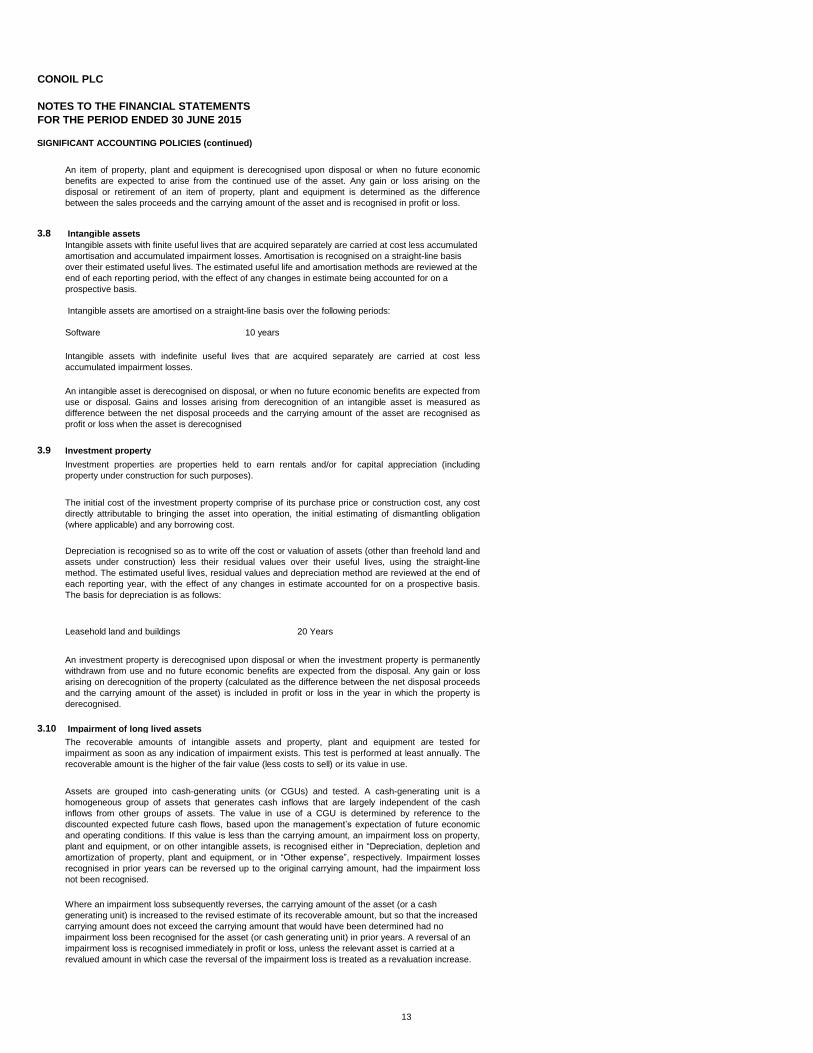
3.8 Intangible assets
Software 10 years
3.9 Investment property
3.10 Impairment of long lived assets
Where an impairment loss subsequently reverses, the carrying amount of the asset (or a cash
generating unit) is increased to the revised estimate of its recoverable amount, but so that the increased
carrying amount does not exceed the carrying amount that would have been determined had no
impairment loss been recognised for the asset (or cash generating unit) in prior years. A reversal of an
impairment loss is recognised immediately in profit or loss, unless the relevant asset is carried at a
revalued amount in which case the reversal of the impairment loss is treated as a revaluation increase.
Leasehold land and buildings 20 Years
An investment property is derecognised upon disposal or when the investment property is permanently
withdrawn from use and no future economic benefits are expected from the disposal. Any gain or loss
arising on derecognition of the property (calculated as the difference between the net disposal proceeds
and the carrying amount of the asset) is included in profit or loss in the year in which the property is
derecognised.
The recoverable amounts of intangible assets and property, plant and equipment are tested for
impairment as soon as any indication of impairment exists. This test is performed at least annually. The
recoverable amount is the higher of the fair value (less costs to sell) or its value in use.
Assets are grouped into cash-generating units (or CGUs) and tested. A cash-generating unit is a
homogeneous group of assets that generates cash inflows that are largely independent of the cash
inflows from other groups of assets. The value in use of a CGU is determined by reference to the
discounted expected future cash flows, based upon the management’s expectation of future economic
and operating conditions. If this value is less than the carrying amount, an impairment loss on property,
plant and equipment, or on other intangible assets, is recognised either in “Depreciation, depletion and
amortization of property, plant and equipment, or in “Other expense”, respectively. Impairment losses
recognised in prior years can be reversed up to the original carrying amount, had the impairment loss
not been recognised.
Intangible assets with indefinite useful lives that are acquired separately are carried at cost less
accumulated impairment losses.
An intangible asset is derecognised on disposal, or when no future economic benefits are expected from
use or disposal. Gains and losses arising from derecognition of an intangible asset is measured as
difference between the net disposal proceeds and the carrying amount of the asset are recognised as
profit or loss when the asset is derecognised
Investment properties are properties held to earn rentals and/or for capital appreciation (including
property under construction for such purposes).
The initial cost of the investment property comprise of its purchase price or construction cost, any cost
directly attributable to bringing the asset into operation, the initial estimating of dismantling obligation
(where applicable) and any borrowing cost.
Depreciation is recognised so as to write off the cost or valuation of assets (other than freehold land and
assets under construction) less their residual values over their useful lives, using the straight-line
method. The estimated useful lives, residual values and depreciation method are reviewed at the end of
each reporting year, with the effect of any changes in estimate accounted for on a prospective basis.
The basis for depreciation is as follows:
An item of property, plant and equipment is derecognised upon disposal or when no future economic
benefits are expected to arise from the continued use of the asset. Any gain or loss arising on the
disposal or retirement of an item of property, plant and equipment is determined as the difference
between the sales proceeds and the carrying amount of the asset and is recognised in profit or loss.
Intangible assets are amortised on a straight-line basis over the following periods:
Intangible assets with finite useful lives that are acquired separately are carried at cost less accumulated
amortisation and accumulated impairment losses. Amortisation is recognised on a straight-line basis
over their estimated useful lives. The estimated useful life and amortisation methods are reviewed at the
end of each reporting period, with the effect of any changes in estimate being accounted for on a
prospective basis.
13

CONOIL PLC
NOTES TO THE FINANCIAL STATEMENTS
FOR THE PERIOD ENDED 30 JUNE 2015
SIGNIFICANT ACCOUNTING POLICIES (continued)
3.11 Non-current assets held for sale
3.12 Inventories
3.13 Cash and cash equivalents
3.14 Provisions
The amount recognised as a provision is the best estimate of the consideration required to settle the present obligation at
the end of the reporting period, taking into account the risks and uncertainties surrounding the obligation. When a provision
is measured using the cash flows estimated to settle the present obligation, its carrying amount is the present value of those
cash flows (when the effect of the time value of money is material).
When some or all of the economic benefits required to settle a provision are expected to be recovered from a third party, a
receivable is recognised as an asset if it is virtually certain that reimbursement will be received and the amount of the
receivable can be measured reliably.
Non-current assets (and disposal groups) classified as held for sale are measured at the lower of their previous carrying
amount and fair value less costs to sell.
Non-current assets and disposal groups are classified as held for sale if their carrying amount will be recovered through a
sale transaction rather than through continuing use. This condition is regarded as met only when the sale is highly probable
and the asset (or disposal group) is available for immediate sale in its present condition. Management must be committed to
the sale which should be expected to qualify for recognition as a completed sale within one year from the date of
classification.
Inventories are valued at lower of cost and net realisable value. Net realisable value is the estimated selling price in the
ordinary course of business, less estimated selling expenses. Cost is determined on weighted average basis and includes all
costs incurred in acquiring the inventories and bringing them to their present location and condition.
Cash and cash equivalents comprise cash in hand, current balances with banks and similar institutions and highly liquid
short term investments that are convertible into known amounts of cash and are subject to insignificant risks of changes in
value. Investments with maturity greater than three months or less than twelve months are shown under current assets.
Provisions are recognised when the Company has a present obligation (legal or constructive) as a result of a past event, it is
probable that the Company will be required to settle the obligation, and a reliable estimate can be made of the amount of the
obligation.
14

CONOIL PLC
NOTES TO THE FINANCIAL STATEMENTS
FOR THE PERIOD ENDED 30 JUNE 2015
SIGNIFICANT ACCOUNTING POLICIES (continued)
i. Onerous contracts
ii. Restructuring
3.15 Financial assets and liabilities
3.15.1 Financial assets
i Initial recognition and measurement
ii. Subsequent measurement
Loans and receivablesLoans and receivables are non-derivative financial assets with fixed or determinable payments that are not quoted
in an active market. After initial measurement, such financial assets are subsequently measured at amortised cost
using the effective interest rate method (EIR), less impairment. Amortised cost is calculated by taking into account
any discount or premium on acquisition and fee or costs that are an integral part of the EIR. The EIR amortisation
is included in finance income in statement of profit or loss. The losses arising from impairment are recognised in
statement of profit or loss in finance costs for loans and in cost of sales or other operating expenses for
receivables.
Present obligations arising under onerous contracts are recognised and measured as provisions. An onerous
contract is considered to exist where the Company has a contract under which the unavoidable costs of meeting
the obligations under the contract exceed the economic benefits expected to be received from the contract.
The subsequent measurement of financial assets depends on their classification as follows:
A restructuring provision is recognised when the Company has developed a detailed formal plan for the
restructuring and has raised a valid expectation in those affected that it will carry out the restructuring by starting
to implement the plan or announcing its main features to those affected by it. The measurement of a restructuring
provision includes only the direct expenditures arising from the restructuring, which are those amounts that are
both necessarily entailed by the restructuring and not associated with the ongoing activities of the Company.
Financial assets within the scope of IAS 39 Financial Instruments: Recognition and Measurement are classified
as financial assets at fair value through profit or loss, loans and receivables, held to maturity investments,
available for sale financial assets. The Company determines the classification of its financial assets at initial
recognition.
All financial assets are recognised initially at fair value plus (in the case of investments not at fair value through
profit or loss) directly attributable transaction costs.
The Company’s financial assets include cash and short-term deposits, trade and other receivables and loan and
other receivables.
15
CONOIL PLC
NOTES TO THE FINANCIAL STATEMENTS
FOR THE PERIOD ENDED 30 JUNE 2015
SIGNIFICANT ACCOUNTING POLICIES (continued)
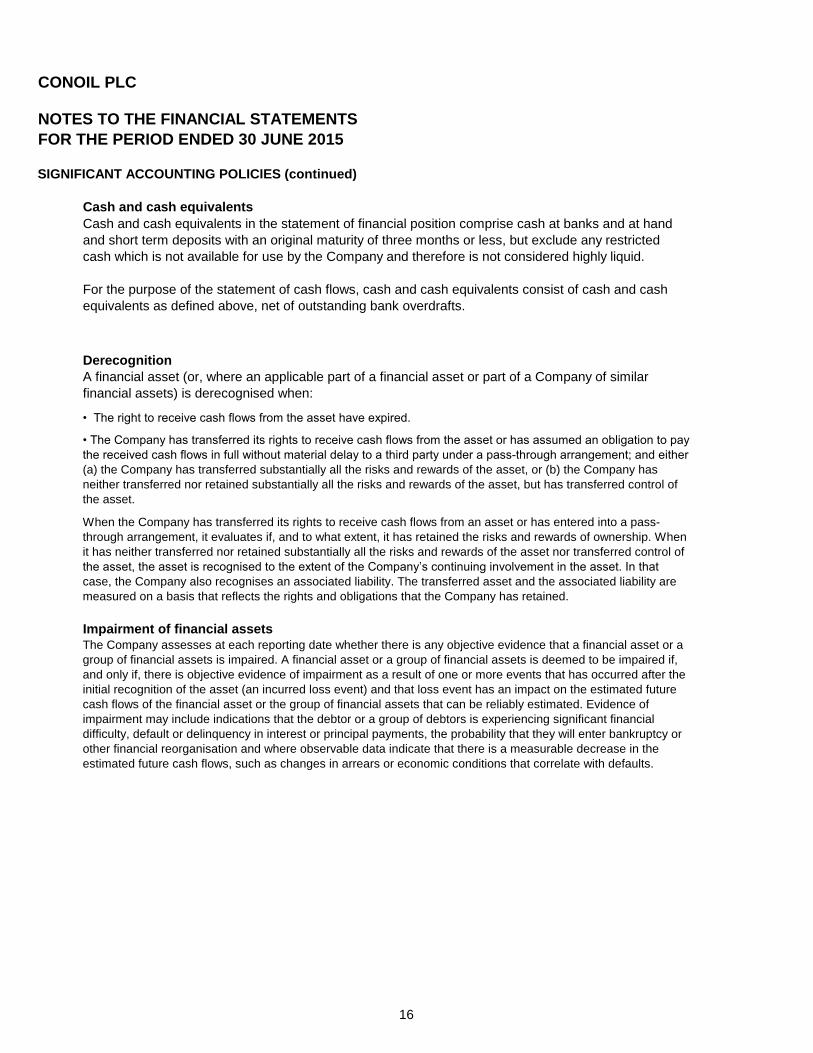
Cash and cash equivalents
Derecognition
• The right to receive cash flows from the asset have expired.
Impairment of financial assets
When the Company has transferred its rights to receive cash flows from an asset or has entered into a pass-
through arrangement, it evaluates if, and to what extent, it has retained the risks and rewards of ownership. When
it has neither transferred nor retained substantially all the risks and rewards of the asset nor transferred control of
the asset, the asset is recognised to the extent of the Company’s continuing involvement in the asset. In that
case, the Company also recognises an associated liability. The transferred asset and the associated liability are
measured on a basis that reflects the rights and obligations that the Company has retained.
The Company assesses at each reporting date whether there is any objective evidence that a financial asset or a
group of financial assets is impaired. A financial asset or a group of financial assets is deemed to be impaired if,
and only if, there is objective evidence of impairment as a result of one or more events that has occurred after the
initial recognition of the asset (an incurred loss event) and that loss event has an impact on the estimated future
cash flows of the financial asset or the group of financial assets that can be reliably estimated. Evidence of
impairment may include indications that the debtor or a group of debtors is experiencing significant financial
difficulty, default or delinquency in interest or principal payments, the probability that they will enter bankruptcy or
other financial reorganisation and where observable data indicate that there is a measurable decrease in the
estimated future cash flows, such as changes in arrears or economic conditions that correlate with defaults.
Cash and cash equivalents in the statement of financial position comprise cash at banks and at hand
and short term deposits with an original maturity of three months or less, but exclude any restricted
cash which is not available for use by the Company and therefore is not considered highly liquid.
For the purpose of the statement of cash flows, cash and cash equivalents consist of cash and cash
equivalents as defined above, net of outstanding bank overdrafts.
A financial asset (or, where an applicable part of a financial asset or part of a Company of similar
financial assets) is derecognised when:
• The Company has transferred its rights to receive cash flows from the asset or has assumed an obligation to pay
the received cash flows in full without material delay to a third party under a pass-through arrangement; and either
(a) the Company has transferred substantially all the risks and rewards of the asset, or (b) the Company has
neither transferred nor retained substantially all the risks and rewards of the asset, but has transferred control of
the asset.
16

CONOIL PLC
NOTES TO THE FINANCIAL STATEMENTS
FOR THE PERIOD ENDED 30 JUNE 2015
SIGNIFICANT ACCOUNTING POLICIES (continued)
Financial assets carried at amortised cost
For financial assets carried at amortised cost, the Company first assesses individually whether
objective evidence of impairment exists individually for financial assets that are individually significant,
or collectively for financial assets that are not individually significant. If the Company determines that
no objective evidence of impairment exists for an individually assessed financial asset, whether
significant or not, it includes the asset in a group of financial assets with similar credit risk
characteristics and collectively assesses them for impairment. Assets that are individually assessed for
impairment and for which an impairment loss is, or continues to be, recognised are not included in a
collective assessment of impairment.
If there is objective evidence that an impairment loss has incurred, the amount of the loss is measured
as the difference between the asset’s carrying amount and the present value of estimated future cash
flows (excluding future expected credit losses that have not yet been incurred). The present value of
the estimated future cash flows is discounted at the financial asset’s original effective interest rate. If a
loan has a variable interest rate, the discount rate for measuring any impairment loss is the current
effective interest rate.
The carrying amount of the asset is reduced through the use of an allowance account and the amount
of the loss is recognised in statement of profit or loss. Interest income continues to be accrued on the
reduced carrying amount and is accrued using the rate of interest used to discount the future cash
flows for the purpose of measuring the impairment loss. The interest income is recorded as part of
finance income in the statement of profit or loss. Loans together with the associated allowance are
written off when there is no realistic prospect of future recovery and all collateral has been realised or
has been transferred to the Company. If, in a subsequent year, the amount of the estimated
impairment loss increases or decreases because of an event occurring after the impairment was
recognised, the previously recognised impairment loss is increased or reduced by adjusting the
allowance account. If a future write-off is later recovered, the recovery is credited to finance costs in
statement of profit or loss.
Financial liabilities and equity instruments are classified according to the substance of the contractual
arrangements entered into. An equity instrument is any contract that evidences a residual interest in
the assets of the Company after deducting all of its liabilities. Equity instruments issued by the
Company are recorded at the proceeds received net of direct issue costs.
Financial liabilities are classified as financial liabilities at fair value through profit or loss; derivatives
designated as hedging instruments in an effective hedge; or as financial liabilities measured at
amortised cost, as appropriate. Financial liabilities include trade and other payables, accruals, most
items of finance debt and derivative financial instruments. The Company determines the classification
of its financial liabilities at initial recognition. The measurement of financial liabilities depends on their
classification, as follows:
For financial liabilities at fair value through profit or loss, derivatives, other than those designated as
effective hedging instruments, are classified as held for trading and are included in this category.
These liabilities are carried on the balance sheet at fair value with gains or losses recognised in the
income statement.
For financial liabilities measured at amortised cost, all other financial liabilities are initially recognised at
fair value. For interest-bearing loans and borrowings this is the fair value of the proceeds received net
of issue costs associated with the borrowing. After initial recognition, other financial liabilities are
subsequently measured at amortized cost using the effective interest method. Amortized cost is
calculated by taking into account any issue costs, and any discount or premium on settlement. Gains
and losses arising on the repurchase, settlement or cancellation of liabilities are recognised
respectively in interest and other revenues and finance costs. This category of financial liabilities
includes trade and other payables and finance debt.
17

CONOIL PLC
NOTES TO THE FINANCIAL STATEMENTS
FOR THE PERIOD ENDED 30 JUNE 2015
SIGNIFICANT ACCOUNTING POLICIES (continued)
3.15.2 Financial liabilities
i Initial recognition and measurement
Interest-bearing loans and borrowings
Derecognition
3.15.3
3.15.4 Fair value of financial instruments
3.16 Creditors and accruals 0
3.17 Asset retirement obligations
Financial liabilities within the scope of IAS 39 are classified as financial liabilities at fair value through
profit or loss, loans and borrowings. The Company determines the classification of its financial liabilities
at initial recognition.
The Company’s financial liabilities include trade and other payables, bank overdrafts, loans and
borrowings, financial guarantee contracts, and derivative financial instruments.
After initial recognition, interest-bearing loans and borrowings are subsequently measured at amortised
cost using the effective interest rate (EIR) method. Gains and losses are recognised in statement of
profit or loss when the liabilities are derecognised, as well as through the EIR method amortisation
process.
Amortised cost is calculated by taking into account any discount or premium on acquisition and fee or
costs that are an integral part of the EIR. The EIR amortisation is included in finance cost in statement
of profit or loss.
A financial liability is derecognised when the associated obligation is discharged or cancelled or expires.
When an existing financial liability is replaced by another from the same lender on substantially different terms, or
the terms of an existing liability are substantially modified, such an exchange or modification is treated as a
derecognition of the original liability and the recognition of a new liability. The difference in the respective carrying
amounts is recognised in statement of profit or loss.
Financial assets and financial liabilities are offset and the net amount reported in the statement of
financial position if, and only if, there is a currently enforceable legal right to offset the recognised
amounts and there is an intention to settle on a net basis, or to realise the assets and settle the
liabilities simultaneously.
The fair value of financial instruments that are traded in active markets at each reporting date is
determined by reference to quoted market prices or dealer price quotations (bid price for long positions
and ask price for short positions), without any deduction for transaction costs.
For financial instruments not traded in an active market, the fair value is determined using appropriate
valuation techniques. Such techniques may include: using recent arm’s length market transactions;
reference to the current fair value of another instrument that is substantially the same; a discounted
cash flow analysis or other valuation models.
Creditors and accruals are the financial obligations due to third parties and are falling due within one
year. The outstanding balances are not interest bearing and are stated at their nominal value.
Asset retirement obligations, which result from a legal or constructive obligation, are recognised based
on a reasonable estimate in the year in which the obligation arises. The associated asset retirement
costs are capitalized as part of the carrying amount of the underlying asset and depreciated over the
useful life of this asset. An entity is required to measure changes in the liability for an asset retirement
obligation due to the passage of time (accretion) by applying a risk-free discount rate to the amount of
the liability. The increase of the provision due to the passage of time is recognised as part of finance
cost.
Offsetting of financial instruments
18
CONOIL PLC
NOTES TO THE FINANCIAL STATEMENTS
FOR THE PERIOD ENDED 30 JUNE 2015
4. CRITICAL ACCOUNTING JUDGEMENTS AND KEY SOURCES OF ESTIMATION UNCERTAINTY:
4.1
4.1.1
4.1.2
4.2
4.2.1
4.2.2
4.2.3
Contingent liabilities
During the evaluation of whether certain liabilities represent contingent liabilities or provisions, management is
required to exercise significant judgment. Based on the current status, facts and circumstances, management
concluded that the dispute with Vitol S.A (as disclosed in Note 35) should be classified as a contingent liability
rather than a provision.
The Company reviews the estimated useful lives of property, plant and equipment at the end of each reporting
period. During the current year, the useful lives of property, plant and equipment remained constant.
Estimates regarding cash flows, discount rate and weighted average expected timing of cashflows were made
in arriving at the future liability relating to decommission costs.
The key assumptions concerning the future, and other key sources of estimation uncertainty at the reporting
date, that have a significant risk of causing a material adjustment to the carrying amounts of assets and
liabilities within the next financial year, are discussed below:
Decommissioning liabilities
The Company reviews its receivables to access impairment at least on an annual basis. The Company's
credit risk is primarily attributable to its trade receivables. In determining whether impairment losses should be
reported in profit or loss, the Company makes judgements as to whether there is any observable data
indicating that there is a measureable decrease in the estimated future cash flow. Accordingly, an allowance
for impairment is made where there are identified loss events or condition which, based on previous
experience, is evident of a reduction in the recoverability of the cash flows.
In the application of the Company’s accounting policies, which are described in Note 3, the directors are
required to make judgements, estimates and assumptions about the carrying amounts of assets and liabilities
that are not readily apparent from other sources. The estimates and associated assumptions are based on
historical experience and other factors that are considered to be relevant. Actual results may differ from these
estimates.
The estimates and underlying assumptions are reviewed on an ongoing basis. Revisions to accounting
estimates are recognised in the year in which the estimate is revised if the revision affects only that year, or in
the year of the revision and future years if the revision affects both current and future years.
The following are the critical judgements, apart from those involving estimations (which are dealt with
separately below), that the directors have made in the process of applying the Company’s accounting policies
and that have a significant effect on the amounts recognised in the financial statements.
Critical judgements in applying accounting policies
Useful lives of property, plant and equipment
In making its judgment, management considered the detailed criteria for the recognition of revenue from the
sale of goods set out in IAS 18 Revenue and in particular, whether the entity had transferred to the buyer the
significant risks and rewards of ownership of the goods. Based on the acceptance by the customer of the
liability of the goods sold, the directors are satisfied that the significant risks and rewards have been
transferred and that recognition of the revenue in the current year is appropriate.
Impairment losses on receivables
Revenue recognition
Key sources of estimation uncertainty
19

CONOIL PLC
NOTES TO THE FINANCIAL STATEMENTS
FOR THE PERIOD ENDED 30 JUNE 2015
4. CRITICAL ACCOUNTING JUDGEMENTS AND KEY SOURCES OF ESTIMATION UNCERTAINTY (continued)
4.2.4 Allowance for obsolete inventory
4.2.5 Valuation of financial liabilities
4.2.6 Impairment on non-current assets
The Company reviews its inventory to assess losses on account of obsolescence on a regular basis. In
determining whether an allowance for obsolescence should be recorded in profit or loss, the Company makes
judgements as to whether there is any observable data indicating that there is any future sellability of the product
and the net realizable value of such products. Accordingly, allowance for impairment, if any, is made where the net
realisable value is less than cost based on best estimates by the management.
Financial liabilities have been measured at amortised cost. The effective interest rate used in determining the
amortised cost of the individual liability amounts has been estimated using the contractual cash flows on the loans.
IAS 39 requires the use of the expected cash flows but also allows for the use of contractual cash flows in
instances where the expected cash flows cannot be reliably determined. However, the effective interest rate has
been determined to be the rate that effectively discounts all the future contractual cash flows on the loans including
processing, management fees and other fees that are incidental to the different loan transactions.
Determining whether non-current assets are impaired requires an estimation of the value in use of the cash-
generating units to which assets have been allocated. The value in use calculation requires the Company to
estimate the future cash flows expected to arise from the cash-generating unit and a suitable discount rate in order
to calculate present value. The assets were tested for impairment and there was no indication of impairment
observed after testing. Therefore, no impairment loss was recognised during the year.
20
CONOIL PLC
NOTES TO THE FINANCIAL STATEMENTS
FOR THE PERIOD ENDED 30 JUNE 2015
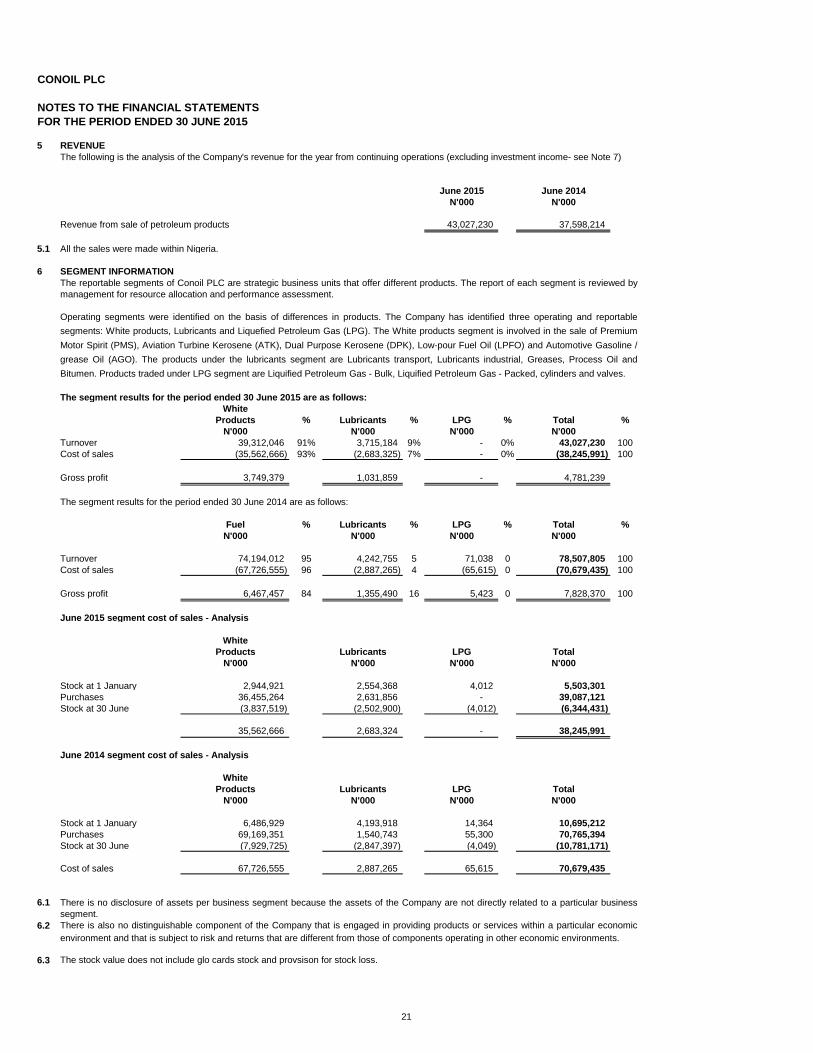
5 REVENUE
June 2015 June 2014
N'000 N'000
Revenue from sale of petroleum products 43,027,230 37,598,214
5.1 All the sales were made within Nigeria.
6 SEGMENT INFORMATION
The segment results for the period ended 30 June 2015 are as follows:
White
Products % Lubricants % LPG % Total %
N'000 N'000 N'000 N'000
Turnover 39,312,046 91% 3,715,184 9% - 0% 43,027,230 100
Cost of sales (35,562,666) 93% (2,683,325) 7% - 0% (38,245,991) 100
Gross profit 3,749,379 1,031,859 - 4,781,239
The segment results for the period ended 30 June 2014 are as follows:
Fuel % Lubricants % LPG % Total %
N'000 N'000 N'000 N'000
Turnover 74,194,012 95 4,242,755 5 71,038 0 78,507,805 100
Cost of sales (67,726,555) 96 (2,887,265) 4 (65,615) 0 (70,679,435) 100
Gross profit 6,467,457 84 1,355,490 16 5,423 0 7,828,370 100
June 2015 segment cost of sales - Analysis
White
Products Lubricants LPG Total
N'000 N'000 N'000 N'000
Stock at 1 January 2,944,921 2,554,368 4,012 5,503,301
Purchases 36,455,264 2,631,856 - 39,087,121
Stock at 30 June (3,837,519) (2,502,900) (4,012) (6,344,431)
35,562,666 2,683,324 - 38,245,991
June 2014 segment cost of sales - Analysis
White
Products Lubricants LPG Total
N'000 N'000 N'000 N'000
Stock at 1 January 6,486,929 4,193,918 14,364 10,695,212
Purchases 69,169,351 1,540,743 55,300 70,765,394
Stock at 30 June (7,929,725) (2,847,397) (4,049) (10,781,171)
Cost of sales 67,726,555 2,887,265 65,615 70,679,435
6.1
6.2
6.3 The stock value does not include glo cards stock and provsison for stock loss.
Operating segments were identified on the basis of differences in products. The Company has identified three operating and reportable
segments: White products, Lubricants and Liquefied Petroleum Gas (LPG). The White products segment is involved in the sale of Premium
Motor Spirit (PMS), Aviation Turbine Kerosene (ATK), Dual Purpose Kerosene (DPK), Low-pour Fuel Oil (LPFO) and Automotive Gasoline /
grease Oil (AGO). The products under the lubricants segment are Lubricants transport, Lubricants industrial, Greases, Process Oil and
Bitumen. Products traded under LPG segment are Liquified Petroleum Gas - Bulk, Liquified Petroleum Gas - Packed, cylinders and valves.
The reportable segments of Conoil PLC are strategic business units that offer different products. The report of each segment is reviewed by
management for resource allocation and performance assessment.
The following is the analysis of the Company's revenue for the year from continuing operations (excluding investment income- see Note 7)
There is no disclosure of assets per business segment because the assets of the Company are not directly related to a particular business
segment.
There is also no distinguishable component of the Company that is engaged in providing products or services within a particular economic
environment and that is subject to risk and returns that are different from those of components operating in other economic environments.
21

CONOIL PLC
NOTES TO THE FINANCIAL STATEMENTS
FOR THE PERIOD ENDED 30 JUNE 2015
7 OTHER OPERATING INCOME
June 2015 June 2014
N'000 N'000
Rental income:
Rental income (Note 7.3) 68,531 61,800
Service income (Note 7.1) 26,347
Interest income:
Interest on delayed subsidy payment (Note 7.2) 2,544,932 -
2,639,810 61,800
7.1 Service income
7.2 Interest income:
7.3 Rental Income
8 OTHER GAINS AND LOSSES
June 2015 June 2014
N'000 N'000
Glo recharge card 1,251 -
1,251 0 -
June 2015 June 2014
9 DISTRIBUTION EXPENSES N'000 N'000
Freight costs 1,313,229 2,150,494
1,313,229 2,150,494
Rental income represents income received from letting out the Company's property.
Service income represents commissions received from dealers for the use of the Company's properties at service
stations. The dealers use the properties for the sale of Conoil's products.
Interest Income on delayed subsidy payments represents interest received from Petroleum Products Pricing
Regulatory Agency on delayed subsidy payments for 2013/2014.
22

CONOIL PLC
NOTES TO THE FINANCIAL STATEMENTS
FOR THE PERIOD ENDED 30 JUNE 2015
10 ADMINISTRATIVE EXPENSESJune 2015 June 2014
Note N'000 N'000
Staff cost 1,015,837 987,576
Depreciation of property, plant and equipment 675,868 780,429
Provision for litigation claims 450,000 -
Rent and rates 411,212 452,007
Advertisement and sales promotion 174,212 212,175
Repairs and maintenance 155,591 182,784
Insurance 116,471 110,821
Pension fund - employer's contribution 59,871 37,550
Consumables, small tools and equipment 55,720 46,220
Security services 50,484 52,070
Legal and professional charges 43,263 26,422
Throughtput others 39,173 35,415
Postages, telephone and telex 30,338 30,483
Provision for obsolete stock 30,000 30,000
Provision for bad and doubtful debts 30,000 30,000
Entertainment and hotels 26,149 23,140
Own used oil 25,231 34,718
Annual general meeting 25,000 25,000
Depreciation of investment property 24,825 24,825
Health safety and environmental expenses 24,678 19,272
Printing and stationery 24,576 15,955
Bank charges 23,406 50,752
Travelling 22,357 29,277
Water and electricity 22,219 15,307
Subscriptions 20,971 18,992
Directors' remuneration 20,405 24,300
Staff training and welfare 15,859 18,955
Vehicle, plant and equipment running 15,424 16,788
Audit fee 15,000 13,750
Medical 12,830 11,488
Depreciation of intangible asset 5,307 5,307
Other expenses 9,457 7,427
3,671,732 3,369,202
11 FINANCE COST
June 2015 June 2014
N'000 N'000
Interest on bank overdraft 1,908,791 882,366
1,908,791 882,366
Bank overdrafts are repayable on demand. The average effective interest rate on bank overdrafts approximates 17.5%
(2014: 17.5%) per annum and are determined based on NIBOR plus lender's mark-up.
The Overdraft was necessitated by delay in payment of subsidy claims by the federal government on
importation/purchase of products for resale in line with the provision of Petroleum Support Fund Act for regulated
petroleum products.
23

CONOIL PLC
NOTES TO THE FINANCIAL STATEMENTS
FOR THE PERIOD ENDED 30 JUNE 2015
12 PROFIT BEFORE TAX June 2015 June 2014
N'000 N'000
This is stated after charging/(crediting) the following:
Depreciation 675,868 780,429
Director's emoluments 20,405 24,300
Depreciation of Investment property 24,825 24,825
Auditors remuneration 15,000 13,750
Amortisation of Intangible Asset 5,307 5,307
13 INCOME TAXES
June 2015 December 2014
N'000 N'000
Income tax based on profit for the year 436,688 1,505,690
Education tax 34,891 111,887
Under provision in prior year - 98,891
Deferred tax (302,443) (1,018,715)
Per statement of profit or loss 169,135 697,753
At 1 January 3,770,483 2,826,206
Payment during the year (1,133,268) (750,000)
Withholding tax utilised during the year - (22,191)
Transfer to deferred tax (Note 13.1) 302,443 1,018,715
Per balance sheet 3,108,793 3,770,483
Balance above is made up of :
Company income tax 2,908,510 3,600,204
Education tax 200,004 169,999
Capital gains tax 280 2800
3,108,794 3,770,483
Income tax expense for the year can be reconciled to the accounting profit as follows:
2014 2014
N'000 N'000
Profit before tax from continuing operations 528,548 1,532,174
Expected income tax expense calculated at 30% 158,564 459,652
Education tax 34,891 111,887
Expenses not deductible for tax purposes :
Investment allowance (1,203) (1,666)
Effect of balancing charge - -
Effect of capital allowance on assessible profit (85,473) (170,947)
Timing difference recognised as deferred tax asset (302,443) (1,018,715)
Effect of expenses that are not deductible in determining taxable profit 364,800 1,218,651
- 98,891
169,135 697,753
13.1 Deferred tax
June 2015 December 2014
N'000 N'000
At 1 January (665,805) 352,910
Write back to profit or loss (302,443) (1,018,715)
At 30 June /31 December (968,248) (665,805)
The charge for taxation in these financial statements is based on the provisions of the Companies Income Tax Act CAP
C21 LFN 2004 as amended to date, tertiary education tax charge is based on the Tertiary Education Trust Fund Act,
2011 and Capital Gains Tax Act CAP C1 LFN 2004.
The under provision in the prior year is as a result of additional tax assessment levied by Federal Inland Revenue
Service in 2012.
Adjustments recognised in the current year in relation to the tax of
prior years
24

CONOIL PLC
NOTES TO THE FINANCIAL STATEMENTS
FOR THE PERIOD ENDED 30 JUNE 2015
14 BASIC EARNINGS PER SHARE
June 2015 December 2014
Earnings N'000 N'000
359,413 1,011,913
Number of shares Number Number
693,952,117 693,952,117
June 2015 December 2014
N'000 N'000
Basic earnings per 50k share
From continuing operations 52 146
The earnings and weighted average number of ordinary shares used in the calculation of basic earnings per share are as follows.
Kobo per share
Earnings per share is calculated by dividing net income by the number of ordinary shares outstanding during the period.
Kobo per share
Earnings for the purposes of basic earnings per share being net profit attributable to equity holders
of the Company
Weighted average number of ordinary shares for the purposes of basic earnings per share
25

CONOIL PLC
NOTES TO THE FINANCIAL STATEMENTS
FOR THE PERIOD ENDED 30 JUNE 2015
15 PROPERTY PLANT AND EQUIPMENT
Freehold Freehold Plant and Furniture Motor Computer
land buildings machinery and fittings vehicles equipment Total
N'000 N'000 N'000 N'000 N'000 N'000 N'000
Cost or valuation
Balance at 1 January 2014 147,766 4,900,233 11,014,733 4,144,929 1,317,178 984,960 22,509,799
Additions - 365,387 46,662 12,400 71,450 8,876 504,775
Balance at 31 December 2014 147,766 5,265,620 11,061,395 4,157,329 1,388,628 993,836 23,014,574
Additions - - 76,043 52,457 4,175 132,675
Balance at 30 June 2015 147,766 5,265,620 11,137,438 4,209,786 1,388,628 998,011 23,147,249
Accumulated depreciation and impairment
Balance at 1 January 2014 - 3,103,862 8,296,706 4,087,253 1,272,348 915,997 17,676,166
Impairments /write off - - - - - -
Depreciation expense - 263,281 981,176 52,692 91,521 22,352 1,411,022
Balance at 31 December 2014 - 3,367,143 9,277,882 4,139,945 1,363,869 938,349 19,087,188
Depreciation expense - 131,640.50 460,945 26,346 45,760.50 11,176 675,868
Balance at 30 June 2015 - 3,498,784 9,738,827 4,166,291 1,409,630 949,525 19,763,056
Carrying amount
At 30 June 2015 147,766 1,766,837 1,398,611 43,495 (21,002) 48,486 3,384,193
At 31 December 2014 147,766 1,898,477 1,783,512 17,384 24,759 55,487 3,927,385
15.1 Impairment assessment
15.2
15.3 Assets pledged as security
No asset was pledged as security as at 30 June 2015 (2014: nil)
Impairment assessment of assets in the year under review disclosed no material impaiment loss on any of the Company's assets.
Contractual commitments
The Company did not have any contractual commitments in relation to capital expenditure as at 30 June 2015 (2014: nil).
26

CONOIL PLC
NOTES TO THE FINANCIAL STATEMENTS
FOR THE PERIOD ENDED 30 JUNE 2015
16 INTANGIBLE ASSETS
June 2015 December 2014
N'000 N'000
Cost
Balance as at 1 January 106,136 106,136
Addition - -
Balance as at 30 June /31 December 106,136 106,136
Accumulated depreciation
Balance at the beginning of the year 21,228 10,614
Amortisation 5,307 10,614
Balance at the end of the period 26,535 21,228
Carrying amount
As at 30 June/ 31 December 79,601 84,908
17 INVESTMENT PROPERTY
Building
June 2015 December 2014
N'000 N'000
Cost
Balance at beginning of year 993,000 993,000
Balance at the end of the period 993,000 993,000
Accumulated depreciation
Balance at the beginning of the year 546,150 496,500
Depreciation 24,825 49,650
Balance at the end of the period 570,975 546,150
Carrying amount 422,025 446,850
The Company's investment property is held under freehold interests.
Amortisation expense was incurred during the period at 10% per annum on the total cost.
Computer
software
Computer
software
27

CONOIL PLC
NOTES TO THE FINANCIAL STATEMENTS
FOR THE PERIOD ENDED 30 JUNE 2015
18 OTHER FINANCIAL ASSET
June 2015 December 2014
N'000 N'000
Investment in Nigerian Yeast and Alcohol Manufacturing Plc
Cost 1,846 1,846
Impairment (1,836) (1,836)
10 10
19 PREPAYMENTS
June 2015 December 2014
N'000 N'000
Current
Prepaid rent and insurance 521,153 246,004
521,153 246,004
Non-current
Prepaid rent 100,359 100,359
100,359 100,359
20 INVENTORIES
June 2015 December 2014
N'000 N'000
Raw materials 524,568 605,711
Finished goods 5,698,448 4,822,984
Spare parts and consumables 121,458 87,500
Obsolete stock provision (30,000) -
6,314,474 5,516,195
20.1
21 TRADE AND OTHER RECEIVABLES
June 2015 December 2014
N'000 N'000
Trade debtors 6,874,537 7,642,572
Allowance for bad and doubtful debts (4,454,944) (4,424,944)
2,419,593 3,217,628
Receivable from Petroleum Support Fund 10,193,082 19,096,135
Bridging claims receivable (Note 21.3) 14,674,477 16,789,362
Advance to related company (Note 32) 19,919,446 5,108,750
Advance for product supplies 116,326 116,328
Withholding tax recoverable (Note 21.4) 23,123 22,147
Other debtors (Note 21.1) 138,883 97,505
47,484,930 44,447,855
21.1 Other debtors balance includes :
Advance deposits 398,024 393,735
Insurance claims receivables 29,835 29,835
Employee advances 47,308 10,879
Staff share purchase loan - -
Interest receivable - -
Other non trade debtors 660 -
Provision for doubtful advance deposits (336,944) (336,944)
138,883 97,505
Nigerian Yeast and Alcohol Manufacturing Company Plc (NIYAMCO) has stopped business operations for
several years, hence the Company has impaired its investments.
Spare parts and consumables relate to packaging materials and engineering spares used for maintenance
of generators, pumps, plants and machinery.
Prepayments are rents paid in advance to owners of properties occupied by Conoil Plc for the purpose of
carrying out business in various locations in Lagos.
28

CONOIL PLC
NOTES TO THE FINANCIAL STATEMENTS
FOR THE PERIOD ENDED 30 JUNE 2015
21.2
The Company does not hold any collateral over these balances.
June 2015 December 2014
N'000 N'000
Ageing of past due trade receivables
Current 1,758,828 2,234,813
Less than 90 days 475,910 637,910
91 - 180 days 156,805 231,855
181 - 360 days 264,243 365,243
Above 360 days 4,218,751 4,172,751
Total 6,874,537 7,642,572
June 2015 December 2014
N'000 N'000
Ageing of past due and impaired trade
receivables
Less than 90 days 61,212 46,212
91 - 180 days 32,760 23,360
181 - 360 days 142,221 182,621
Above 360 days 4,218,751 4,172,751
Total 4,454,944 4,424,944
Allowance for doubtful debts June 2015 December 2014
N'000 N'000
As at 1 January 4,424,944 2,622,858
Current period provision 30,000 1,802,086
At 30 June / 31 December 4,454,944 4,424,944
21.3 Bridging claims receivable
21.4 Withholding tax recoverable
June 2015 December 2014
N'000 N'000
At 1 January 22,147 37,742
Addition during the year 976 6,596
Amount utilised during the period - (22,191)
At 30 June / 31 December 23,123 22,147
22 CASH AND CASH EQUIVALENTS
June 2015 December 2014
N'000 N'000
Cash and bank 24,493,300 31,158,085
Bank overdraft (17,671,163) (22,655,108)
Cash and cash equivalents 6,822,137 8,502,977
The Company did not have any restricted cash at the reporting date (2014: nil)
In determining the recoverability of a trade receivable the Company considers changes in the credit quality of the trade
receivable from the date credit was initially granted up to the reporting date.
Bridging claims are costs of transporting white products such as Premium Motor Spirit (PMS), Dual Purpose Kerosene
(DPK) except Aviation Turbine Kerosene (ATK) and Automotive Gas Oil (AGO) from specific Pipelines and Products
Marketing Company depots to approved zones which are claimable from the Federal Government. Bridging claims are
handled by the Petroleum Equalization Fund. The bridging claims receivable at the end of the year is stated after
deduction of a specific provision for claims considered doubtful of recovery.
The directors consider that the carrying amount of trade and other receivables is approximately equal to their fair
29

CONOIL PLC
NOTES TO THE FINANCIAL STATEMENTS
FOR THE PERIOD ENDED 30 JUNE 2015
23 SHARE CAPITAL
June 2015 December 2014
N'000 N'000
Authorised
700,000,000 ordinary shares of 50k each 350,000 350,000
Issued and fully paid
693,952,117 ordinary shares of 50k each 346,976 346,976
Share premium account
At 30 June / 31 December 3,824,770 3,824,770
24 RETAINED EARNINGS
June 2015 December 2014
N'000 N'000
At 1 January 11,924,301 13,865,688
Dividend declared and paid - (2,775,808)
Profit for the period 359,413 834,421
At 30 June / 31 December 12,283,714 11,924,301
30

CONOIL PLC
NOTES TO THE FINANCIAL STATEMENTS
FOR THE PERIOD ENDED 30 JUNE 2015
24.1 Dividend
June 2015 December 2014
N'000 N'000
Summary
At 1 January 50 50
Dividend declared - 2,775,808
50 2,775,858
Payments - Sterling Registrars - (2,775,808)
At 30 June / 31 December 50 50
25 BORROWINGS
June 2015 December 2014
N'000 N'000
Unsecured borrowing at amortised cost
Bank overdraft 17,671,163 22,655,108
26 TRADE AND OTHER PAYABLES
June 2015 December 2014
N'000 N'000
Trade creditors- Imported 14,516,788 18,725,667
Bridging contribution (Note 26.2) 18,757,294 14,449,965
Trade creditors - Local 7,761,661 5,202,608
Value added tax payable 1,321,299 1,338,719
Withholding tax payable 835,364 984,883
PAYE 245,893 168,167
Staff Pension and similar obligations (Note 26.3) 19,220 10,682
Unclaimed dividend (Note 24.1) 50 50
Other creditors and accruals (Note 26.1) 2,539,450 2,660,220
45,997,019 43,540,961
26.1 Other creditors and accruals June 2015 December 2014
These represent various provisions, accruals and non trade creditors made on accounts :N'000 N'000
Non-trade creditors 420,514 744,749
Rent 645,452 645,452
Litigation claims 945,454 495,454
Insurance premium 358,895 448,895
Employees payables 67,273 112,605
Lube incentives - 99,390
Surcharges 56,862 83,675
Audit fees 45,000 30,000
2,539,450 2,660,220
Bank overdrafts are repayable on demand. The average effective interest rate on bank overdrafts approximates 17.5%
(2014:17.5%) per annum and is determined based on NIBOR plus lender's mark-up.
There is no security or pledge on the Company’s assets with respect to the borrowings.
31

CONOIL PLC
NOTES TO THE FINANCIAL STATEMENTS
FOR THE PERIOD ENDED 30 JUNE 2015
26.2 Bridging contributions
26.3 Staff pension
June 2015 December 2014
N'000 N'000
At 1 January 10,682 11,329
Contributions during the year 108,866 139,517
Remittance in the year (100,328) (140,164)
At 30 June / 31 December 19,220 10,682
27 DISTRIBUTORS' DEPOSITS
June 2015 December 2014
N'000 N'000
At 1 January 498,347 496,397
New deposits 5,000 10,450
Refunds - (8,500)
At 30 June / 31 December 503,347 498,347
28 DECOMMISSIONING LIABILITY
June 2015 December 2014
N'000 N'000
Balance at 1 January 32,511 27,669
Accretion - 4,842
At 30 June / 31 December 32,511 32,511
The following table presents the reconciliation of the carrying amount of the obligation associated with the
decommissioning of the Company's signages and fuel pumps:
Distributors' deposit represents amounts collected by the Company from its various dealers and distributors as
security deposit against the value of the Company's assets with these dealers.
Bridging contributions are mandatory contributions per litre of all white products lifted to assist the Federal
Government defray the Bridging claims.
Decommissioning liabilities is accounted for in accordance with IAS 37, Provisions, contingent liabilities and
contingent assets and IAS 16, Property, plant and equipment . The associated asset retirement costs are
capitalized as part of the carrying cost of the asset. Asset retirement obligations consist of estimated costs for
dismantlement and removal of signages and pumps from dealer-owned service stations. An asset retirement
obligation and the related asset retirement cost are recorded when an asset is first constructed or purchased. The
asset retirement cost is determined and discounted to present value using commercial lending rate ruling at the
reporting period . After the initial recording, the liability is increased for the passage of time, with the increase being
reflected as accretion expense in the statement of profit or loss and other comprehensive income.
32

CONOIL PLC
NOTES TO THE FINANCIAL STATEMENTS
FOR THE PERIOD ENDED 30 JUNE 2015
29 FINANCIAL INSTRUMENTS
29.1 Significant accounting policies
29.2 Categories of financial instruments
June 2015 December 2014
N'000 N'000
Financial asset
Cash and bank balance 24,493,300 31,158,085
Loans and receivables 47,461,808 44,425,708
71,955,108 75,583,793
Financial liabilities
Trade and other payables 43,594,463 41,049,192
Borrowings 17,671,163 22,655,108
61,265,626 63,704,300
29.3 Fair value of financial instruments
Details of the significant accounting policies and methods adopted (including the criteria for recognition, the basis of
measurement and the bases for recognition of income and expenses) for each class of financial asset, financial liability and
equity instrument are disclosed in the accounting policies in Note 3 to the financial statements.
Loans and receivables:
Financial liabilities at amortized cost:
The directors consider that the carrying amounts of financial assets and financial liabilities recorded in the financial statements
approximate their fair values.
33

CONOIL PLC
NOTES TO THE FINANCIAL STATEMENTS
FOR THE PERIOD ENDED 30 JUNE 2015
30 FINANCIAL RISK MANAGEMENT
The Board oversight is performed by the Board of Directors through the Board Risk and Management Committee.
The second level is performed by the Executive Management Committee (EXCOM).
30.1 Financial risk management objectives
30.2 Interest rate risk management
Interest rate risk
Sensitivity Analysis
At the reporting date the interest rate profile of the Company's interest-bearing financial instruments was:
Average rate June 2015 December 2014
N'000 N'000
Variable rate instruments
Financial assets 0 0% - -
Bank overdrafts 18% 17,671,163 22,655,108
17,671,163 22,655,108
Sensitivity Analysis of variable rate instruments
Change of 200 basis points (2%).
Interest charged
N'000
30 June 2015 867,514 +/-2 91,309
31December 2014 2,302,925 +/-2 242,391
Exchange Rate
Effect of increase/Decrease in
A change of 200 basis points in interest rates at the reporting date would have increased /( decreased) equity and profit
and loss after tax by the amounts shown below
Risk management roles and responsibilities are assigned to stake holders in the Company at three levels: The board,
executive committee and line managers.
The third level is performed by all line managers under EXCOM and their direct reports. They are required to comply with
all risk policies and procedures and to manage risk exposures that arise from daily operations.
The Internal Audit Department provides an independent assurance of the risk frame work. They assess compliance with
established controls and recommendations for improvement in processes are escalated to relevant management, Audit
Committee and Board of Directors.
The Company monitors and manages financial risks relating to its operations through internal risk reports which analyses
exposures by degree and magnitude of risks. These risks include market risk (including currency risk, fair value interest
rate risk and price risk), credit risk, liquidity risk and cash flow interest rate risk.
The Company is exposed to interest rate risk because the Company borrows funds at both fixed and floating interest
rates (overdraft). The risk is managed by the Company by maintaining an appropriate mix between short and long term
borrowings. The risk is managed by the Company by constantly negotiating with the banks to ensure that interest are
consistent witht the monetary policy rates as defined by the Central Bank of Nigeria.
34

CONOIL PLC
NOTES TO THE FINANCIAL STATEMENTS
FOR THE PERIOD ENDED 30 JUNE 2015
Financial risk management (continued)
30.3 Foreign currency risk
Effect in thousands of Naira
Foreign Naira Decrease in
Currency Balance Exchange Exchange Rate
30 June 2015 US$’000' N'000 Rate N'000
USD 114,543 22,564,971 197 451,299
Effect in thousands of Naira
Foreign Naira Decrease in
Currency Balance Exchange Exchange Rate
31 December 2014 US$’000' N'000 Rate N'000
USD 179,094 29,998,313 167.50 599,966
30.4 Credit risk management
A movement in the exchange rate either postively or negatively by 200 basis points is illustrated below. Such movement would have
increased /(decreased) the cash and bank balance by the amounts shown below. This analysis is based on foreign currency exchange rate
variances that the Company considered to be reasonably possible at the end of the reporting period. The analysis assumes that all other
variables in particular interest rates remains constant.
Credit risk refers to the risk that a counterparty will default on its contractual obligations resulting in financial loss to the Company. The
Company has adopted a policy of only dealing with creditworthy counterparties and obtaining sufficient collateral where appropriate, as a
means of mitigating the risk of financial loss from defaults. The Company uses publicly available financial information and its own trading
records to rate its major customers. The Company ’s exposure and the credit ratings of its counterparties are monitored and the aggregate
value of transactions concluded is spread amongst approved counterparties. Credit exposure is controlled by counterparty limits that are
reviewed and approved by the risk management committee annually.
Trade receivables consist of a large number of customers, spread across diverse industries and geographical areas. Ongoing credit
evaluation is performed on the financial condition of accounts receivable and, where appropriate, credit guarantee insurance cover is
purchased.
Effect of Increase/
Effect of Increase/
35
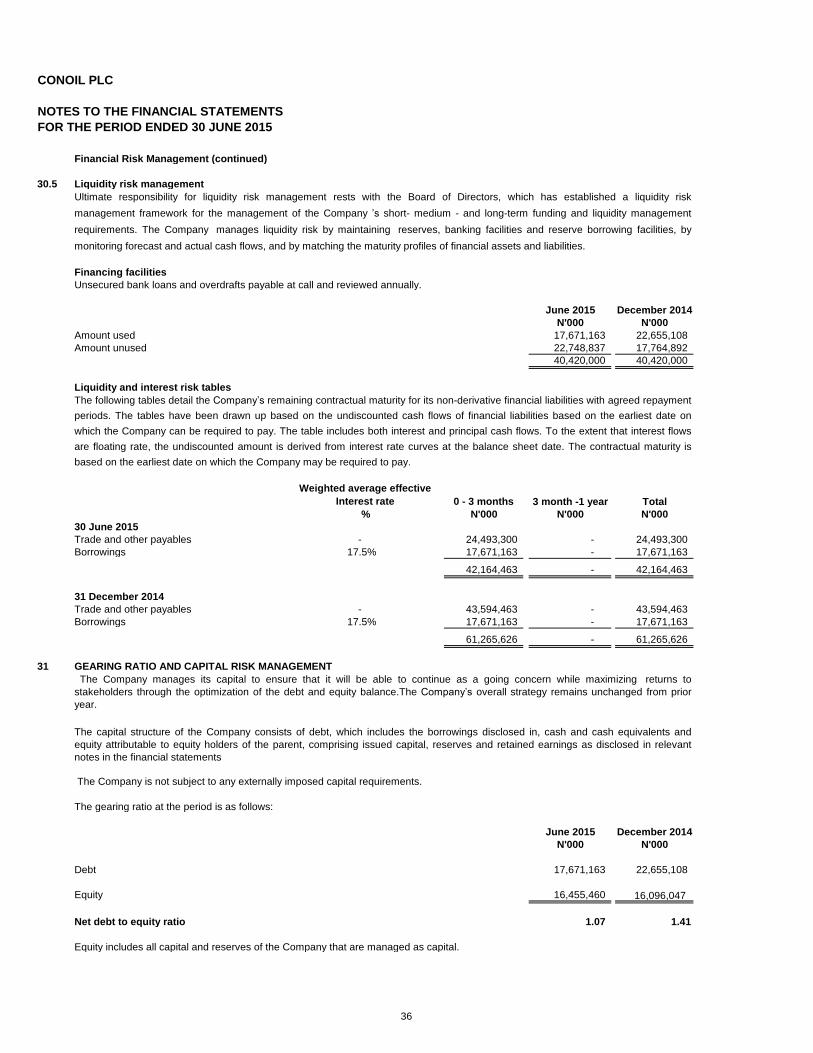
CONOIL PLC
NOTES TO THE FINANCIAL STATEMENTS
FOR THE PERIOD ENDED 30 JUNE 2015
Financial Risk Management (continued)
30.5 Liquidity risk management
Financing facilities
Unsecured bank loans and overdrafts payable at call and reviewed annually.
June 2015 December 2014
N'000 N'000
Amount used 17,671,163 22,655,108
Amount unused 22,748,837 17,764,892
40,420,000 40,420,000
Liquidity and interest risk tables
0 - 3 months 3 month -1 year Total
N'000 N'000 N'000
30 June 2015
Trade and other payables - 24,493,300 - 24,493,300
Borrowings 17.5% 17,671,163 - 17,671,163
42,164,463 - 42,164,463
31 December 2014
Trade and other payables - 43,594,463 - 43,594,463
Borrowings 17.5% 17,671,163 - 17,671,163
61,265,626 - 61,265,626
31 GEARING RATIO AND CAPITAL RISK MANAGEMENT
The Company is not subject to any externally imposed capital requirements.
The gearing ratio at the period is as follows:
June 2015 December 2014
N'000 N'000
Debt 17,671,163 22,655,108
Equity 16,455,460 16,096,047
Net debt to equity ratio 1.07 1.41
Equity includes all capital and reserves of the Company that are managed as capital.
Weighted average effective
Interest rate
Ultimate responsibility for liquidity risk management rests with the Board of Directors, which has established a liquidity risk
management framework for the management of the Company ’s short- medium - and long-term funding and liquidity management
requirements. The Company manages liquidity risk by maintaining reserves, banking facilities and reserve borrowing facilities, by
monitoring forecast and actual cash flows, and by matching the maturity profiles of financial assets and liabilities.
The following tables detail the Company’s remaining contractual maturity for its non-derivative financial liabilities with agreed repayment
periods. The tables have been drawn up based on the undiscounted cash flows of financial liabilities based on the earliest date on
which the Company can be required to pay. The table includes both interest and principal cash flows. To the extent that interest flows
are floating rate, the undiscounted amount is derived from interest rate curves at the balance sheet date. The contractual maturity is
based on the earliest date on which the Company may be required to pay.
The Company manages its capital to ensure that it will be able to continue as a going concern while maximizing returns to
stakeholders through the optimization of the debt and equity balance.The Company’s overall strategy remains unchanged from prior
year.
The capital structure of the Company consists of debt, which includes the borrowings disclosed in, cash and cash equivalents and
equity attributable to equity holders of the parent, comprising issued capital, reserves and retained earnings as disclosed in relevant
notes in the financial statements
%
36

CONOIL PLC
NOTES TO THE FINANCIAL STATEMENTS
FOR THE PERIOD ENDED 30 JUNE 2015
32 RELATED PARTY TRANSACTIONS
30 June 2015
Sales of Goods
Purchase of
Goods
Balance due
(to)/fromDeposits
Overdraft and
Term loan
N'000 N'000 N'000 N'000 N'000
Sterling Bank Plc - - - - (5,840,355)
Globacom Mobile Limited - (18,599) 30,587 - -
Consolidated Oil Limited 520,545 - - - -
Southern Air Limited 33,190 - 25,349 - -
Proline (WA) Ltd - (143,712) (17,038) - -
Synopsis Limited - - - 19,919,446 -
553,735 (162,311) 38,898 19,919,446 (5,840,355)
31 Dec 2014
Sales of Goods
Purchase of
Goods
Balance due
(to)/fromDeposits
Overdraft and
Term loan
N'000 N'000 N'000 N'000 N'000
Sterling Bank Plc - - - - (9,263,608)
Globacom Mobile Limited 23,258 (41,998) 24,263 - -
Consolidated Oil Limited 1,245,420 - - - -
Southern Air Limited 65,706 - 21,914 - -
Proline (WA) Ltd - (293,597) (26,972) - -
Synopsis Limited - - - 5,108,750 -
1,334,384 (335,595) 19,205 5,108,750 (9,263,608)
During the year, the Company traded with the following companies with which it shares common ownership based on terms similar to
those entered into with third parties as stated below:
The Chairman of the Company, Dr. Mike Adenuga (Jr.) GCON, has significant interests in Globacom Mobile Limited, Principal
Enterprises, Southern Air Limited, Sterling Bank Plc (formerly Equitorial Trust Bank), Conoil Producing Limited (formerly Consolidated Oil
Limited) and Synopsis Enterprises Limited.
37

CONOIL PLC
NOTES TO THE FINANCIAL STATEMENTS
FOR THE PERIOD ENDED 30 JUNE 2015
33 CAPITAL COMMITMENTS
There were no capital commitments as at 30 June 2015 (31 December 2014: nil).
34 FINANCIAL COMMITMENTS
35 CONTINGENT LIABILITIES
36 INFORMATION ON DIRECTORS AND EMPLOYEES
June 2015 December 2014
36.1 Employment costs: N'000 N'000
Employment cost including directors' salaries
and wages, staff training and benefit scheme 1,111,971 2,199,688
As at 30 June 2015, the Company had outstanding letters of credit amounting to N12.40billion (31 December 2014:
N15.29billion).
There are a number of legal suits outstanding against the Company estimated at N11.75billion (31 December 2014 :
N11.75 billion). On the advice of the Solicitors, the Board of Directors are of the opinion that no material losses are
expected to arise therefrom. However a provision of N720m has been made in these financial statements to mitigate
any possible future loss.
38

CONOIL PLC
NOTES TO THE FINANCIAL STATEMENTS
FOR THE PERIOD ENDED 30 JUNE 2015 June 2015 December 2014
N'000 N'000
36.2 Number of employees of the Company in receipt of
emoluments within the bands listed below are: Number Number
Up to 1,000,000 16 15
N1,000,001 - N2,000,000 34 32
N2,000,001 - N3,000,000 50 70
N3,000,001 - N4,000,000 34 36
N4,000,001 - N5,000,000 21 22
N5,000,001 - Above 95 78
250 253
36.3 Average number of employees during the year:
Managerial staff 22 23
Senior staff 210 212
Junior staff 18 18
250 253
June 2015 December 2014
36.4 Directors' emoluments: N'000 N'000
Emoluments of the chairman - -
Directors' fees 300 600
Emoluments of executives 20,105 50,003
20,405 50,603
36.5 The emoluments of the highest paid Director were N24million (31 December 2014: N24million)June 2015 December 2014
N'000 N'000
Number Number
0
36.6 Directors receiving no emolument 3 3
36.7 Number of Directors (excluding the Chairman) in
receipt of emoluments within the following ranges: Below N15,000,000 0 1
N15,000,001 - N20,000,000 1 1
N20,000,001 - N25,000,000 1 1
N25,000,001 N30,000,000 - -
2 3
39

CONOIL PLC
STATEMENT OF VALUE ADDED
FOR THE PERIOD ENDED 30 JUNE 2015
June 2015 December 2014
N'000 % N'000 %
Revenue 43,027,230 128,352,674
Other operating income 2,639,810 173,437
Other gains and losses 1,251 761,178
45,668,291 129,287,289
Bought in materials and services
Imported (14,516,788) (88,695,981)
Local (27,175,518) (34,099,108)
Value added 3,952,868 100 6,492,200 100
Distributed as follows:
Employment costs:
Employment cost including Directors salaries 1,111,971 28 2,199,688 34 and wages, staff training and benefit scheme
Providers of capital
Interest payable and similar charges 1,908,791 48 2,307,767 36
Government
Tax 169,135 4 697,753 10
Retained for maintenance of assets,
future expansion and payment of
dividend to shareholders
Depreciation 706,000 18 1,471,286 23
Deferred tax (302,443) (8) (1,018,715) (16)
Profit for the peiod 359,413 9 834,421 13
3,952,868 100 6,492,200 100
Value added represents the additional wealth the Company has been able to create by its own and
employees' efforts. This statement shows the allocation of that wealth among employees, providers of
capital, government and that retained for future creation of more wealth.
40