Embed Size (px)
Citation preview

8

8
High Speed Rail Phase 2 / 357
Economic appraisal of the preferred HSR system
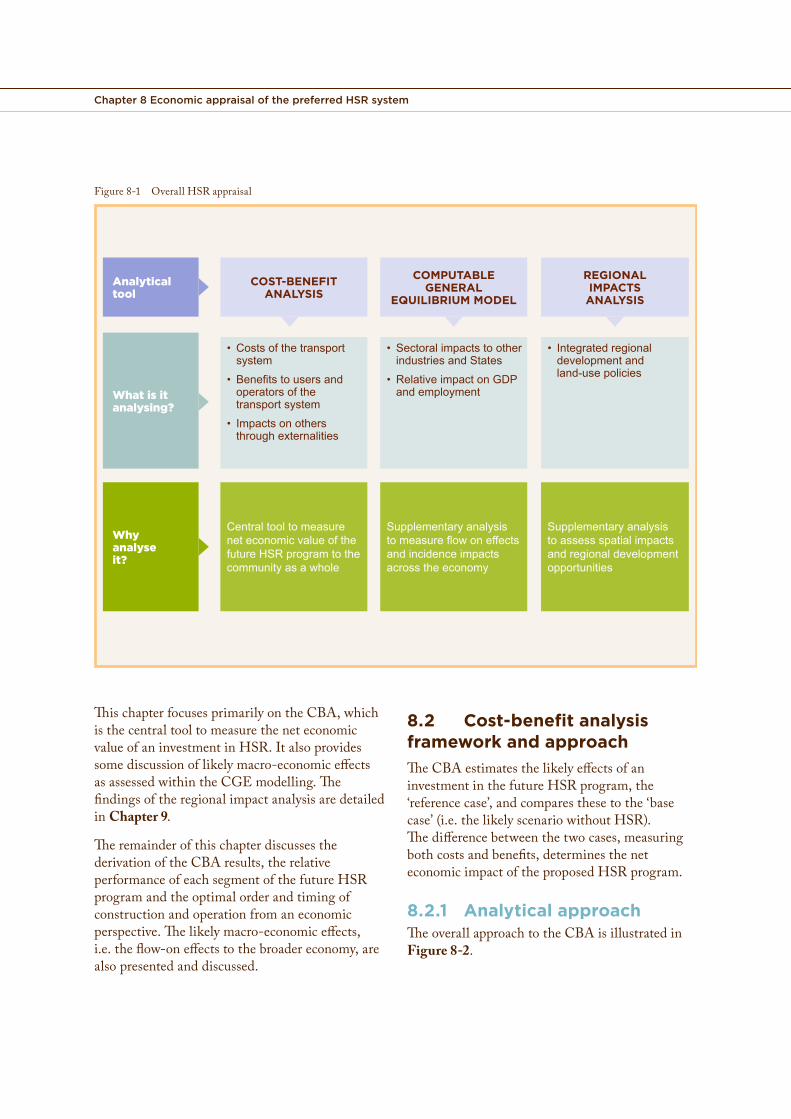
8.1 IntroductionTheeconomicappraisalbringstogetherdemandanduserbenefits,revenueandcostsdescribedinChapters 2and7toprovideanoverallappraisaloftheeconomicvalueofthefutureHSRprogram.TheoverallHSReconomicappraisalconsistsofthreecomponents,asoutlinedinFigure 8-1.
Insummary:• Thecost-benefit analysis (CBA)seeksto
provideacomprehensiveassessmentofthecostsandbenefitstousersandoperatorsofHSRthatcanbevaluedinmonetaryterms.Italsoincludesanassessmentofexternalities,suchasenvironmentalimpacts,accidentcostsavingsanddecongestionbenefits.TheCBAhelpsestablishtheoveralleconomicmeritofafutureHSRprogramand,asoutlinedinChapter 6,guidesdecisionsontheoptimalstagingoftheHSRprogram.
• Thecomputable general equilibrium(CGE)analysisexplorestheflow-oneffectstothebroaderAustralianeconomyofaninvestmentinHSR.Itidentifiesthetotal(directandindirect)economicimpactsoftheconstructionandoperationoftheHSRnetworkonnationalandregionalGrossDomesticProduct(GDP)andemployment.
• Theregional impacts analysisexplorestheimpactofHSRonregionsandregionaltownsandcitiesalongthepreferredcorridor,duetoimprovedaccessibilityandassesseswhetherfurtherbenefitscouldbeachievedthroughcomplementaryregionaldevelopmentpoliciesintegratedwiththeimplementationofHSR.
8.
Chapter 8 Economic appraisal of the preferred HSR system
Figure 8-1 Overall HSR appraisal
• Costsofthetransportsystem
• Benefitstousersandoperatorsofthetransportsystem
• Impactsonothersthroughexternalities
COST-BENEFITANALYSIS
CentraltooltomeasureneteconomicvalueofthefutureHSRprogramtothecommunityasawhole
• SectoralimpactstootherindustriesandStates
• RelativeimpactonGDPandemployment
COMPUTABLE GENERAL
EQUILIBRIUM MODEL
Supplementaryanalysistomeasureflowoneffectsandincidenceimpactsacrosstheeconomy
• Integratedregionaldevelopmentandland-usepolicies
REGIONALIMPACTSANALYSIS
Supplementaryanalysistoassessspatialimpactsandregionaldevelopmentopportunities
Analyticaltool
What is itanalysing?
Why analyseit?
This chapter focuses primarily on the CBA, which is the central tool to measure the net economic value of an investment in HSR. It also provides some discussion of likely macro-economic effects as assessed within the CGE modelling. The findings of the regional impact analysis are detailed in Chapter 9.
The remainder of this chapter discusses the derivation of the CBA results, the relative performance of each segment of the future HSR program and the optimal order and timing of construction and operation from an economic perspective. The likely macro-economic effects, i.e. the flow-on effects to the broader economy, are also presented and discussed.
8.2 Cost-benefit analysis framework and approachThe CBA estimates the likely effects of an investment in the future HSR program, the ‘reference case’, and compares these to the ‘base case’ (i.e. the likely scenario without HSR). The difference between the two cases, measuring both costs and benefits, determines the net economic impact of the proposed HSR program.
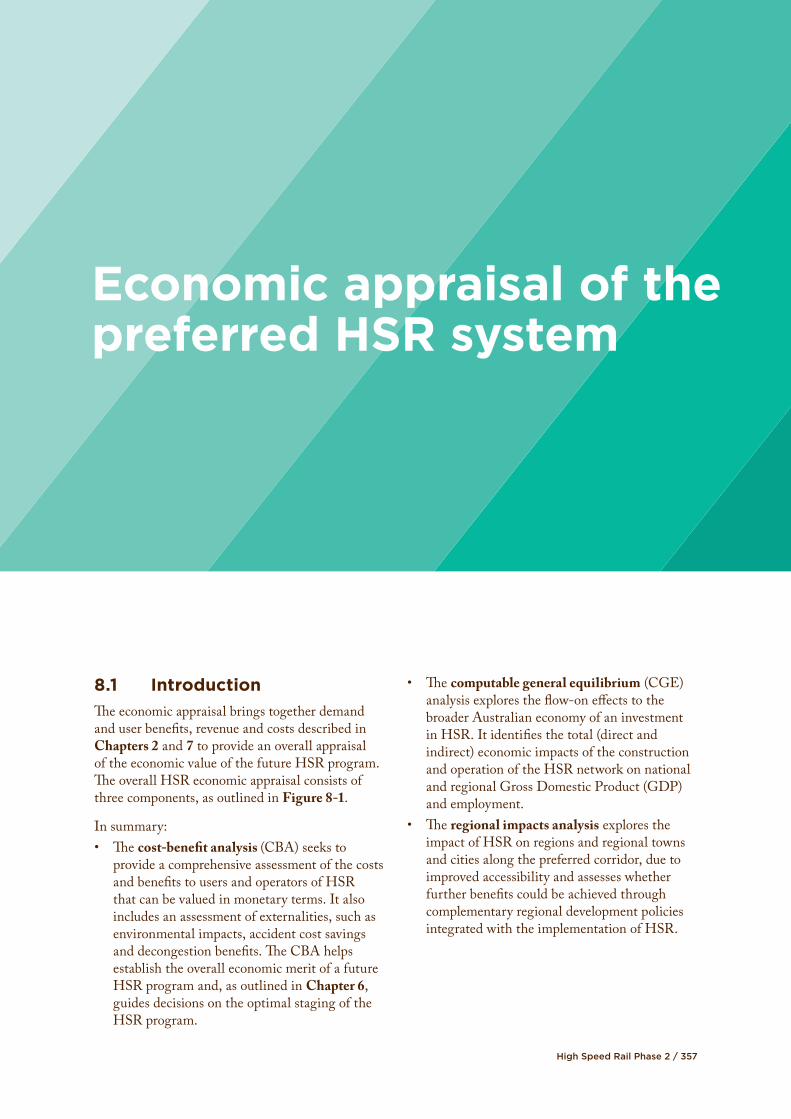
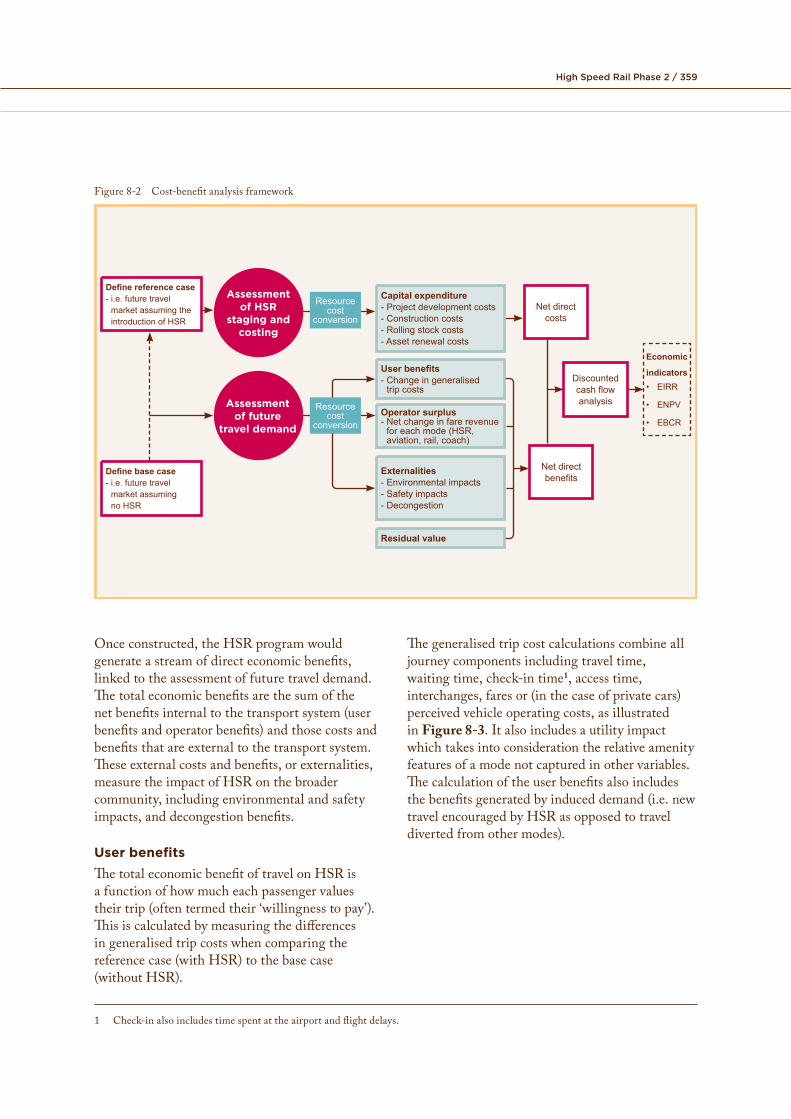
8.2.1 Analytical approach The overall approach to the CBA is illustrated in Figure 8-2.
High Speed Rail Phase 2 / 359
Figure 8-2 Cost-benefit analysis framework
Discounted cash flow analysis
Economic
indicators• EIRR
• ENPV
• EBCR
Net direct benefits
Net direct costs
User benefits- Change in generalised
trip costs
Operator surplus- Net change in fare revenue
for each mode (HSR, aviation, rail, coach)
Externalities- Environmental impacts- Safety impacts- Decongestion
Residual value
Assessment of HSR
staging and costing
Capital expenditure- Project development costs- Construction costs- Rolling stock costs- Asset renewal costs
Define reference case- i.e. future travel
market assuming the introduction of HSR
Define base case- i.e. future travel
market assuming no HSR
Assessment of future
travel demand
Resource cost
conversion
Resource cost
conversion
Once constructed, the HSR program would generate a stream of direct economic benefits, linked to the assessment of future travel demand. The total economic benefits are the sum of the net benefits internal to the transport system (user benefits and operator benefits) and those costs and benefits that are external to the transport system. These external costs and benefits, or externalities, measure the impact of HSR on the broader community, including environmental and safety impacts, and decongestion benefits.
User benefitsThe total economic benefit of travel on HSR is a function of how much each passenger values their trip (often termed their ‘willingness to pay’). This is calculated by measuring the differences in generalised trip costs when comparing the reference case (with HSR) to the base case (without HSR).
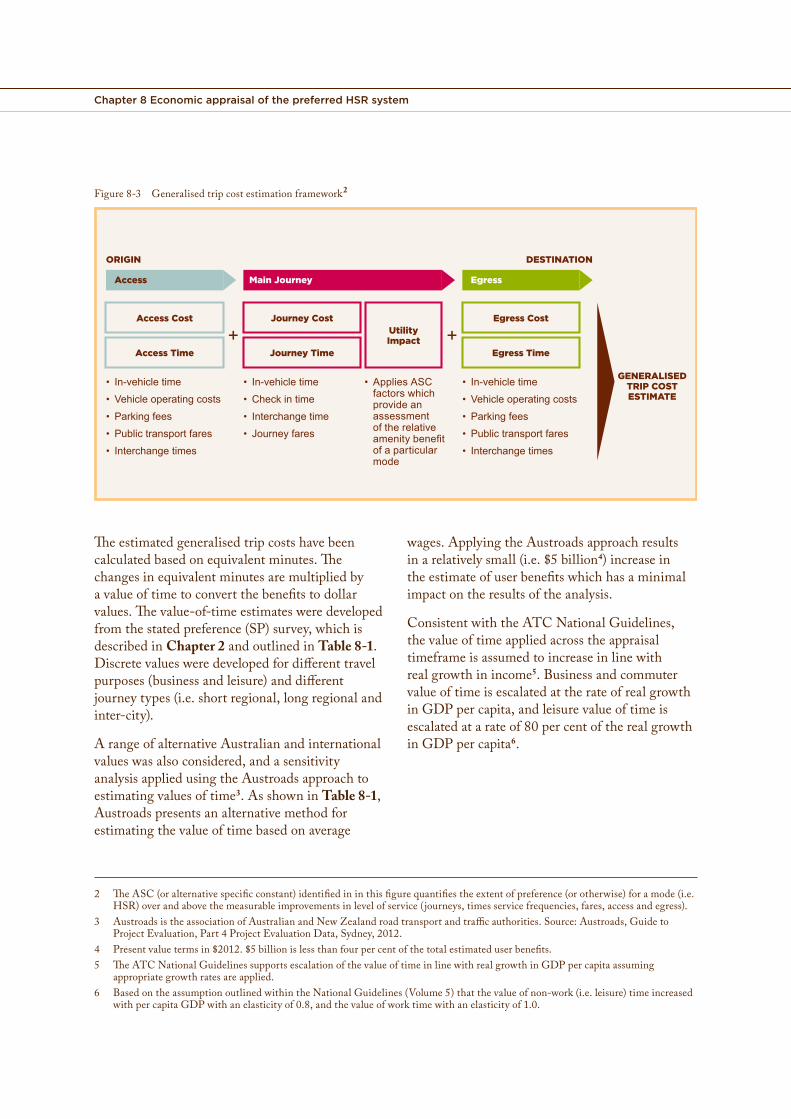
The generalised trip cost calculations combine all journey components including travel time, waiting time, check-in time1, access time, interchanges, fares or (in the case of private cars) perceived vehicle operating costs, as illustrated in Figure 8-3. It also includes a utility impact which takes into consideration the relative amenity features of a mode not captured in other variables. The calculation of the user benefits also includes the benefits generated by induced demand (i.e. new travel encouraged by HSR as opposed to travel diverted from other modes).
1 Check-in also includes time spent at the airport and flight delays.
Chapter 8 Economic appraisal of the preferred HSR system
Figure 8-3 Generalised trip cost estimation framework2
Access Cost Journey Cost Egress CostUtility Impact
Access Time Journey Time Egress Time
Access Main Journey Egress
+ +
• In-vehicletime
• Vehicleoperatingcosts
• Parkingfees
• Publictransportfares
• Interchangetimes
• In-vehicletime
• Checkintime
• Interchangetime
• Journeyfares
• AppliesASCfactorswhichprovideanassessmentoftherelativeamenitybenefitofaparticularmode
• In-vehicletime
• Vehicleoperatingcosts
• Parkingfees
• Publictransportfares
• Interchangetimes
ORIGIN DESTINATION
GENERALISED TRIP COST ESTIMATE
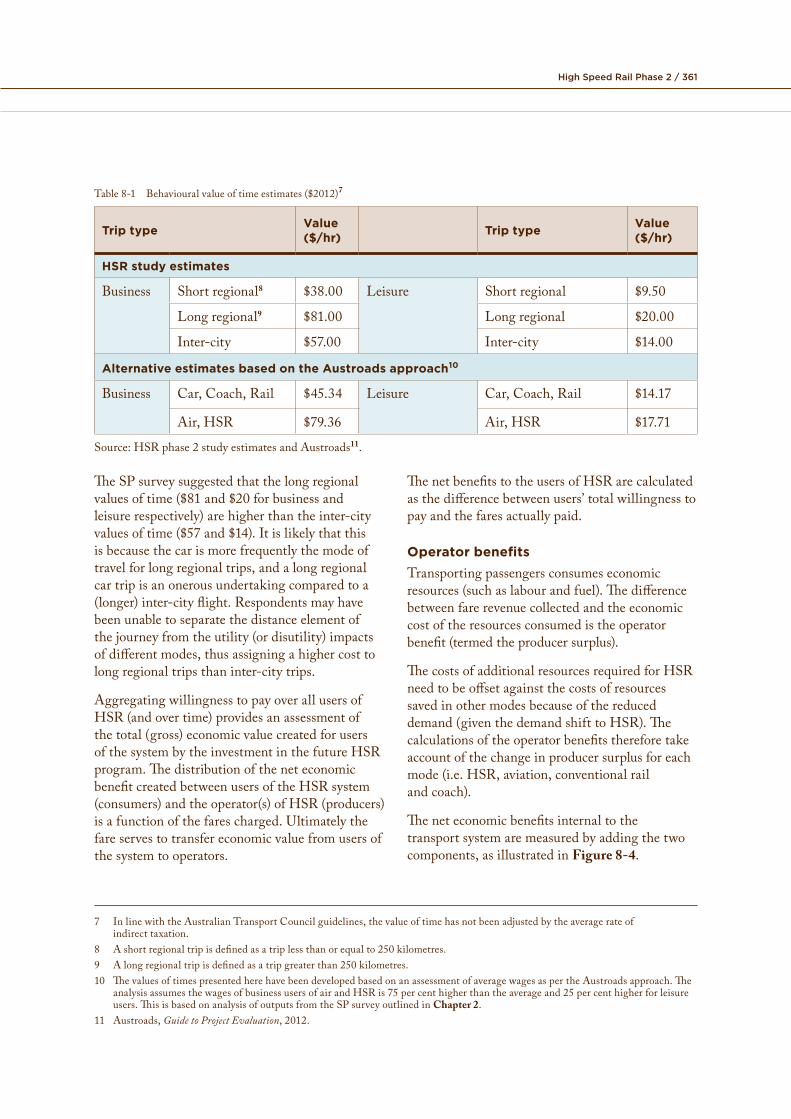
The estimated generalised trip costs have been wages. Applying the Austroads approach results calculated based on equivalent minutes. The in a relatively small (i.e. $5 billion4) increase in changes in equivalent minutes are multiplied by the estimate of user benefits which has a minimal a value of time to convert the benefits to dollar impact on the results of the analysis.values. The value-of-time estimates were developed
Consistent with the ATC National Guidelines, from the stated preference (SP) survey, which is the value of time applied across the appraisal described in Chapter 2 and outlined in Table 8-1. timeframe is assumed to increase in line with Discrete values were developed for different travel real growth in income5. Business and commuter purposes (business and leisure) and different value of time is escalated at the rate of real growth journey types (i.e. short regional, long regional and in GDP per capita, and leisure value of time is inter-city). escalated at a rate of 80 per cent of the real growth
A range of alternative Australian and international in GDP per capita6.values was also considered, and a sensitivity analysis applied using the Austroads approach to estimating values of time3. As shown in Table 8-1, Austroads presents an alternative method for estimating the value of time based on average
2 The ASC (or alternative specific constant) identified in in this figure quantifies the extent of preference (or otherwise) for a mode (i.e. HSR) over and above the measurable improvements in level of service (journeys, times service frequencies, fares, access and egress).
3 Austroads is the association of Australian and New Zealand road transport and traffic authorities. Source: Austroads, Guide to Project Evaluation, Part 4 Project Evaluation Data, Sydney, 2012.
4 Present value terms in $2012. $5 billion is less than four per cent of the total estimated user benefits.5 The ATC National Guidelines supports escalation of the value of time in line with real growth in GDP per capita assuming
appropriate growth rates are applied. 6 Based on the assumption outlined within the National Guidelines (Volume 5) that the value of non-work (i.e. leisure) time increased
with per capita GDP with an elasticity of 0.8, and the value of work time with an elasticity of 1.0.
High Speed Rail Phase 2 / 361
Table8-1 Behaviouralvalueoftimeestimates($2012)7
Trip type Value ($/hr) Trip type Value
($/hr)
HSR study estimates
Business Shortregional8 $38.00 Leisure Shortregional $9.50
Longregional9 $81.00 Longregional $20.00
Inter-city $57.00 Inter-city $14.00
Alternative estimates based on the Austroads approach10
Business Car,Coach,Rail $45.34 Leisure Car,Coach,Rail $14.17
Air,HSR $79.36 Air,HSR $17.71
Source:HSRphase2studyestimatesandAustroads11.
TheSPsurveysuggestedthatthelongregionalvaluesoftime($81and$20forbusinessandleisurerespectively)arehigherthantheinter-cityvaluesoftime($57and$14).Itislikelythatthisisbecausethecarismorefrequentlythemodeoftravelforlongregionaltrips,andalongregionalcartripisanonerousundertakingcomparedtoa(longer)inter-cityflight.Respondentsmayhavebeenunabletoseparatethedistanceelementofthejourneyfromtheutility(ordisutility)impactsofdifferentmodes,thusassigningahighercosttolongregionaltripsthaninter-citytrips.
AggregatingwillingnesstopayoverallusersofHSR(andovertime)providesanassessmentofthetotal(gross)economicvaluecreatedforusersofthesystembytheinvestmentinthefutureHSRprogram.ThedistributionoftheneteconomicbenefitcreatedbetweenusersoftheHSRsystem(consumers)andtheoperator(s)ofHSR(producers)isafunctionofthefarescharged.Ultimatelythefareservestotransfereconomicvaluefromusersofthesystemtooperators.
ThenetbenefitstotheusersofHSRarecalculatedasthedifferencebetweenusers’totalwillingnesstopayandthefaresactuallypaid.
Operator benefitsTransportingpassengersconsumeseconomicresources(suchaslabourandfuel).Thedifferencebetweenfarerevenuecollectedandtheeconomiccostoftheresourcesconsumedistheoperatorbenefit(termedtheproducersurplus).
ThecostsofadditionalresourcesrequiredforHSRneedtobeoffsetagainstthecostsofresourcessavedinothermodesbecauseofthereduceddemand(giventhedemandshifttoHSR).Thecalculationsoftheoperatorbenefitsthereforetakeaccountofthechangeinproducersurplusforeachmode(i.e.HSR,aviation,conventionalrailandcoach).
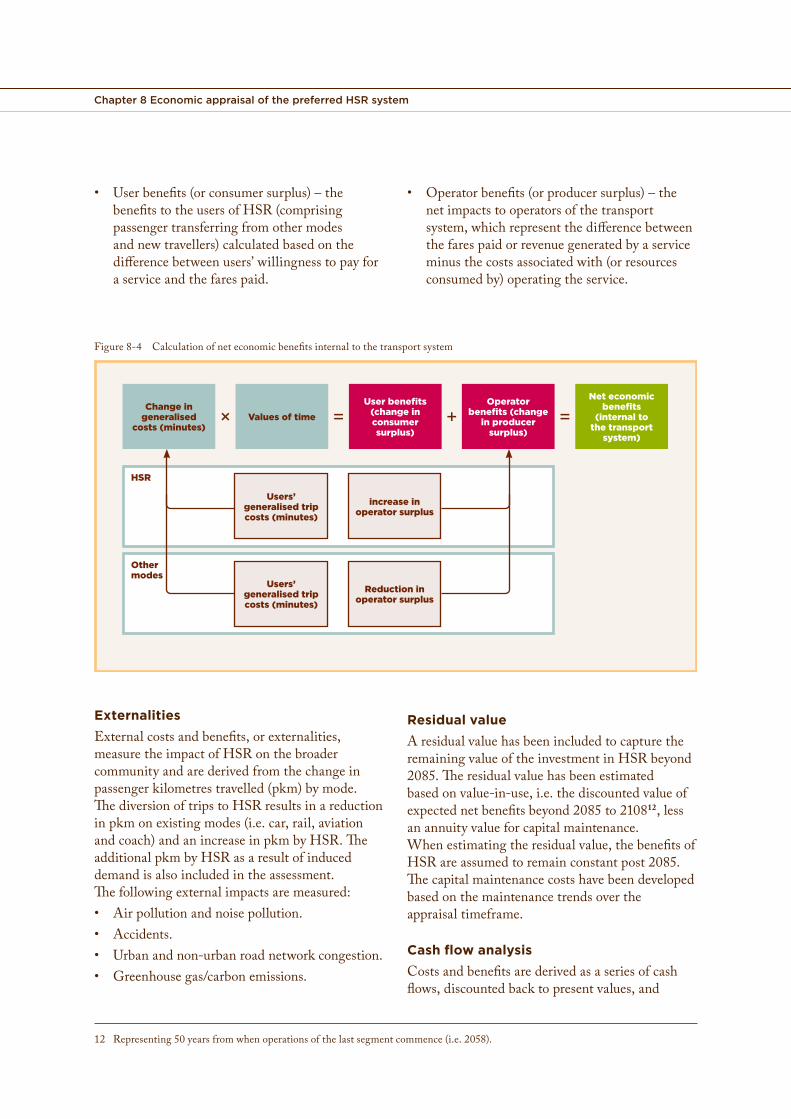
Theneteconomicbenefitsinternaltothetransportsystemaremeasuredbyaddingthetwocomponents,asillustratedinFigure 8-4.
7 InlinewiththeAustralianTransportCouncilguidelines,thevalueoftimehasnotbeenadjustedbytheaveragerateofindirecttaxation.
8 Ashortregionaltripisdefinedasatriplessthanorequalto250kilometres.9 Alongregionaltripisdefinedasatripgreaterthan250kilometres.10 ThevaluesoftimespresentedherehavebeendevelopedbasedonanassessmentofaveragewagesaspertheAustroadsapproach.The
analysisassumesthewagesofbusinessusersofairandHSRis75percenthigherthantheaverageand25percenthigherforleisureusers.ThisisbasedonanalysisofoutputsfromtheSPsurveyoutlinedinChapter 2.
11 Austroads,Guide to Project Evaluation,2012.
Chapter 8 Economic appraisal of the preferred HSR system
• User benefits (or consumer surplus) – the • Operator benefits (or producer surplus) – the benefits to the users of HSR (comprising net impacts to operators of the transport passenger transferring from other modes system, which represent the difference between and new travellers) calculated based on the the fares paid or revenue generated by a service difference between users’ willingness to pay for minus the costs associated with (or resources a service and the fares paid. consumed by) operating the service.
Figure 8-4 Calculation of net economic benefits internal to the transport system
HSR
Other modes
Change in generalised
costs (minutes)Values of time
Users’ generalised trip costs (minutes)
increase in operator surplus
Users’ generalised trip costs (minutes)
Reduction in operator surplus
User benefits (change in consumer surplus)
Net economic benefits
(internal to the transport
system)
Operator benefits (change
in producer surplus)
+× = =
ExternalitiesExternal costs and benefits, or externalities, measure the impact of HSR on the broader community and are derived from the change in passenger kilometres travelled (pkm) by mode. The diversion of trips to HSR results in a reduction in pkm on existing modes (i.e. car, rail, aviation and coach) and an increase in pkm by HSR. The additional pkm by HSR as a result of induced demand is also included in the assessment. The following external impacts are measured:• Air pollution and noise pollution.• Accidents.• Urban and non-urban road network congestion.• Greenhouse gas/carbon emissions.
Residual valueA residual value has been included to capture the remaining value of the investment in HSR beyond 2085. The residual value has been estimated based on value-in-use, i.e. the discounted value of expected net benefits beyond 2085 to 210812, less an annuity value for capital maintenance. When estimating the residual value, the benefits of HSR are assumed to remain constant post 2085. The capital maintenance costs have been developed based on the maintenance trends over the appraisal timeframe.
Cash flow analysisCosts and benefits are derived as a series of cash flows, discounted back to present values, and
12 Representing 50 years from when operations of the last segment commence (i.e. 2058).
High Speed Rail Phase 2 / 363
alignedtotheproposedstagingoftheHSRprogramassetoutinChapter 6,withoperationscommencingin2035andnetbenefitsprojectedforwardover50yearsto2085.Additionalcapitalexpenditurerequiredtorenewassetsthatwearoutoverthatperiod,suchasrollingstockwhichhasaneconomiclifeof30years,isincludedinthecashflows.TheCBAhasbeenundertakenonaresourcecostbasiswhichmeansthattaxes,suchasGST,fuelexciseandthecarbontaxwereremoved.
Thecashflowsfromthecost-benefitanalysisproducethreekeyeconomicindicators:
• Theeconomicinternalrateofreturn(EIRR)whichrepresentsthediscountratethatmakesthenetpresentvalueofalleconomiccashflowsequaltozero.ThehighertheEIRR,thegreatertheneteconomicreturnsachievedbyaprojectrelativetoitscapitalresourcecosts.
• Theeconomicnetpresentvalue(ENPV)whichisthesumofthediscountedpresentvalueoftheeconomiccostsandbenefitsovertheappraisaltimeframe.AnENPVgreaterthanzerorepresentsapositiveeconomicreturn.
• Theeconomicbenefitcostratio(EBCR)whichistheratioofthepresentvalueofneteconomicbenefitstothepresentvalueofeconomicinvestmentcosts.AnEBCRgreaterthanoneimpliesthattheneteconomicbenefitsoutweightheneteconomiccosts,thusrepresentingapositiveeconomicreturn.
AcombinationoftheseindicatorsprovidesanoverallassessmentoftheeconomicvalueofHSR.
8.2.2 Defining the reference case and the base case
Reference caseThereferencecase(orthefutureHSRprogram)isthecentralcasefortheassessment.ItconsistsofthepreferredHSRsystemandspecificationsdescribedinChapters 3,4and5includingestimatesofcapitalandoperatingcosts.ItalsoincludesdemandandtravelimpactsoutlinedinChapter 2andthestagingprofileoutlinedin
Chapter 6.Thefirstyearofconstructionwasassumedtobe2027(financialyear2028),withservicesonLine1stage1(Sydney-Canberra)beginningin2035.
TheintroductionofthefutureHSRprogramwouldcompetevigorouslywithairtravel.TheaviationsectoristhereforelikelytobethemostheavilyimpactedbytheintroductionofthefutureHSRprogram.Ofthe83.6millionHSRtripsforecastfor2065,around55percentareforecasttobedivertedairtrips.Thiswoulddrivesignificantoperationalchangesintheaviationsector.
Airlineservicesaremobileinthesensethattherearefewsignificantsunkcapitalcostsinservicingparticularroutes,andassetscanbequicklyredeployedtootherroutes.Airlinesoperatingalongkeyregionalandinter-capitalroutesacrosstheeastcoastofAustraliaalreadycompetestronglyagainsteachother,andfarelevelsofmanyfareclasseshavedeclinedovertime,whichsuggeststhatairfarelevelsarealreadyhighlycompetitiveonmajorroutes.
Itisnotexpectedthatairlinescould,orwould,respondtoHSRcompetitionbyreducingtheirfaresonasustainablebasis.Rather,ithasbeenassumedthatairlineswouldquicklyreducecapacity,eitherbyreducingfrequenciesoraircraftsizes,tolocationswithintheHSRcorridorwherethereissignificantpassengerdiversiontoHSR13.Thisassumptionisconsistentwithoverseasexperiencewhere,followingtheintroductionofHSR,theairlineresponsehasgenerallybeentoreduceservicesonthecompetitiveroute.Forexample,AirFrancerespondedtotheParis–MarseilleHSRnetworkbyreducingservicesandEasyJetexitedtheroute.InJapantherewassomelimitedpricecompetitionfromtheairlinesoncompetingroutes,althougharguablytheJapanesedomesticairlinemarketwaslesscompetitivethanAustralia’sisnow.
GiventhatairfaresinAustraliaarealreadyhighlycompetitiveonmajorroutes,nosustainablereductioninairfareswouldbeexpectedfollowingtheintroductionofHSR.However,asensitivitytesthasbeenincludedinsection 8.6.3toassess
13 ItislikelythatanyavailablecapacitywillberedeployedtoroutesoutsidetheHSRcorridor.
Chapter 8 Economic appraisal of the preferred HSR system
theimpactthatatwoyearpricewarbetweenHSRandaviationwouldhaveontheeconomicandfinancialanalysisresultsforHSR.
Base caseThebasecaseassumesthat,withoutHSR,travellersontheeastcoastwillcontinuetorelyonexistingmodesoftransport:
• Aviationwillremaintheprimarymeansoftransportforlongdistanceinterstate(andsomeinter-regional)trips.
• Road-basedtravelandprivatevehicleusagewillremaintheprimarymodeforconnectionswithandbetweenregionalcentres.
• Publictransportwillplayanincreasinglyimportantroleinmeetingtraveldemandwithincities,servedbyconventionalrailandbus.
Forroadandrailmodes,thebasecaseassumesthatgovernmentswillcontinuetoaugmentsupplybyprovidinginfrastructureandservicestomeetfuturedemand.Foraviation,giventheuncertaintyaroundthefutureofairportcapacityintheSydneyregion,thebasecasehasassumedthatnoadditionalinvestmentinairportcapacityintheSydneybasinwouldoccur.Asaconsequence,thebasecaseassumesthatservicelevelswithintheSydneyregionwillbecomeincreasinglyconstrained.
AsoutlinedwithintherecentAustralian/NSWGovernmentJoint Study into Aviation Capacity in the Sydney Region14(hereafterreferredtoastheJointStudy),growthindemandforaviationservicesintheSydneyregionisexpectedtodoubleto88millionpassengertripsperyearby2035,andthendoubleagainby2060.Sydney(KingsfordSmith)Airportdoesnothavethecapacitytomeettheexpecteddemand,leadingto:• Slowerandgreaterunreliabilityinairjourney
timesasairlinesandairportsarefacedwithhigherlevelsofcongestion.
• Anincreasingrequirementforairpassengerstoshifttheirtraveltimeasaresultoflackofcapacityattheirpreferredtraveltime.
• Anincreasingnumberoftravellerswhoareforcedtotravelbyothermeansordonottravelatall(otherwiseknownasunmetand/orsupresseddemand).
ThisassumptionhasaddedcomplexitytothemodellingofthebasecasetotakeaccountoftheconstraintsatSydneyAirport.TobeconsistentwiththeassumptionsoutlinedwithintheJointStudy15,thebasecasemodellingofaviationtripsthroughSydneyhasincludedanadditionalunexpecteddelayfactorof11minutesperpassenger16andasevenpercentincreaseinfares17.
Giventhelikelysignificanceofthisassumption,asensitivitytestthatallowedforadditionalaviationcapacityinSydneywasincludedinsection 8.6.4totesttheimpactsofremovingtheeffectsoftheunexpecteddelayandfareincreasesfromthemodelling.
8.3 Cost-benefit analysis resultsTheCBAwasundertakeninrealtermsin$2012utilisingadiscountrateoffourpercentwithabaseyearof202818,reflectingthereferencecaseandthebasecasedefinedabove.This,takentogetherasasetofCBAresults,istheprimarycasefortheeconomicevaluation,againstwhichvarioussensitivitiesandscenarioswererun.
Afourpercentdiscountratehasbeenassessedassuitableforlargescaleandlong-lifeinfrastructureprojectssuchasHSR.ThisisconsistentwithinternationalexperienceandtheAustralianTransportCouncil(ATC)guidelinesandhasthereforebeenadoptedasthediscountratefortheprimaryevaluationofHSR.
14 AustralianGovernmentandNSWGovernment,loc.cit.15 ibid.16 The11minutesaverageincreaseinunexpecteddelayovertoday’sconditionsisweightedby3.0withintheanalysis.Thisisconsistent
withCivilAviationSafetyAuthority(CASA)(2007)Cost-BenefitAnalysisProceduresManual.17 Thesevenpercentincreaseinfaresrepresentstheaveragedisbenefitofairpassengershavingtochangetheirtimeoftraveltofitwith
theavailabilityofseatcapacity.18 Thebaseyearistheyeartowhichcostsandbenefitshavebeendiscounted.ConsistentwiththeATCguidelines,thebaseyearisset
totheyearofconstructioncommencement.
High Speed Rail Phase 2 / 365
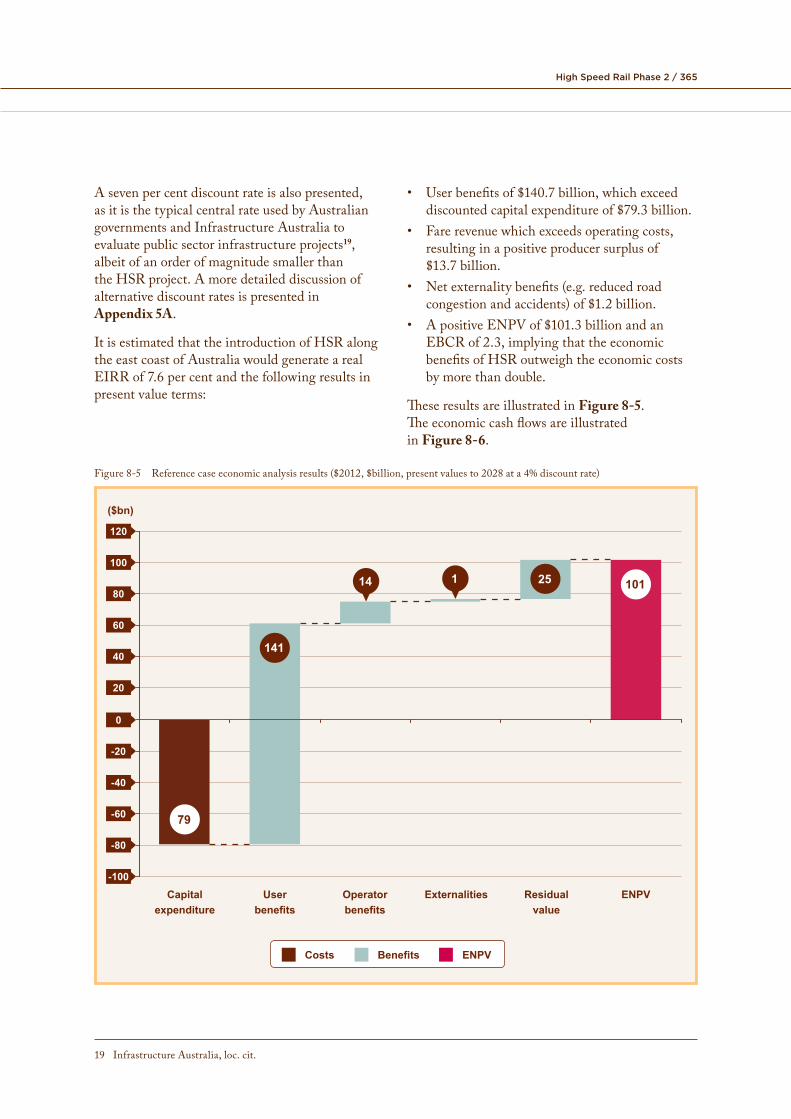
A seven per cent discount rate is also presented, • User benefits of $140.7 billion, which exceed as it is the typical central rate used by Australian discounted capital expenditure of $79.3 billion.governments and Infrastructure Australia to
19• Fare revenue which exceeds operating costs,
evaluate public sector infrastructure projects , resulting in a positive producer surplus of albeit of an order of magnitude smaller than $13.7 billion.the HSR project. A more detailed discussion of • Net externality benefits (e.g. reduced road alternative discount rates is presented in congestion and accidents) of $1.2 billion. Appendix 5A.
• A positive ENPV of $101.3 billion and an It is estimated that the introduction of HSR along EBCR of 2.3, implying that the economic the east coast of Australia would generate a real benefits of HSR outweigh the economic costs EIRR of 7.6 per cent and the following results in by more than double. present value terms:
These results are illustrated in Figure 8-5. The economic cash flows are illustrated in Figure 8-6.
Figure 8-5 Reference case economic analysis results ($2012, $billion, present values to 2028 at a 4% discount rate)
Costs Benefits ENPV
100
120
80
60
40
20
0
-40
-20
-60
-80
-100
Capitalexpenditure
Userbenefits
Operatorbenefits
Externalities Residual value
ENPV
($bn)
14 1
79
141
25 101
19 Infrastructure Australia, loc. cit.
Chapter 8 Economic appraisal of the preferred HSR system
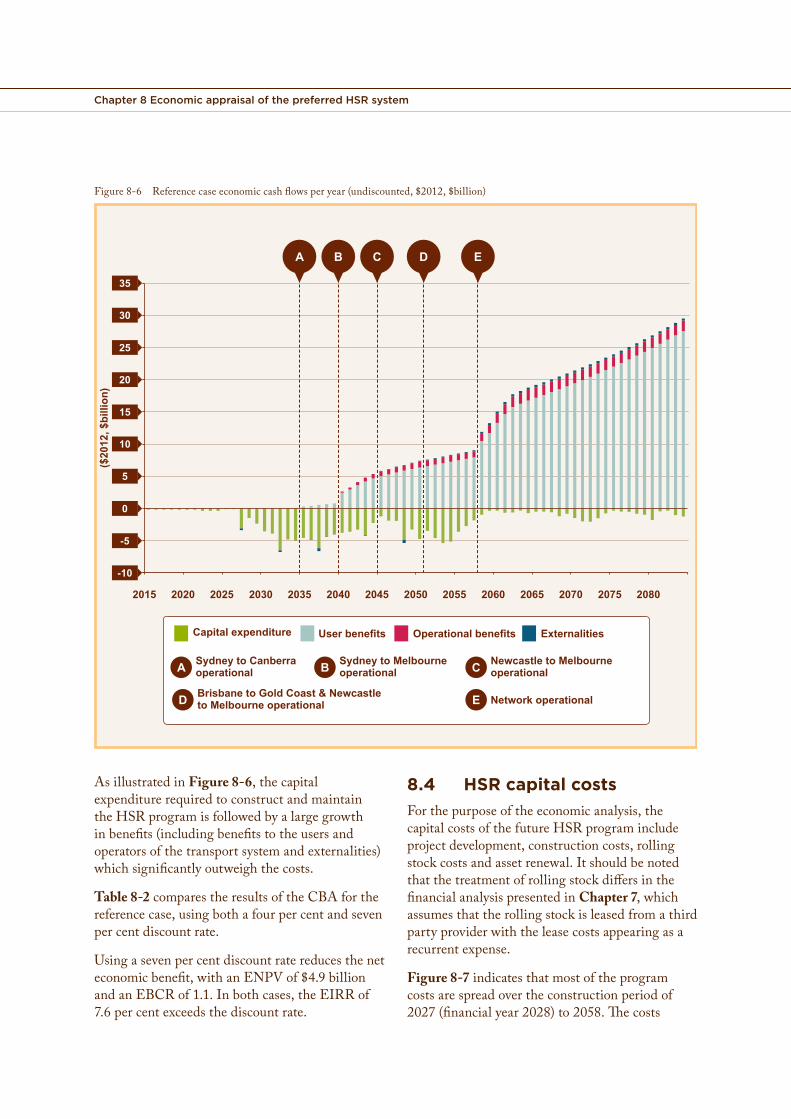
Figure 8-6 Reference case economic cash flows per year (undiscounted, $2012, $billion)
($20
12, $
billi
on)
2015 2020 2025 2030 2035 2040 2045 2050 2055 2060 2065 2070 2075 2080
-5
0
5
10
15
20
25
30
35
-10
Capital expenditure
Sydney to Canberra operational
Sydney to Melbourne operational
Newcastle to Melbourne operational
Brisbane to Gold Coast & Newcastle to Melbourne operational Network operational
User benefits Operational benefits Externalities
A
A B C
D E
B C D E
As illustrated in Figure 8-6, the capital expenditure required to construct and maintain the HSR program is followed by a large growth in benefits (including benefits to the users and operators of the transport system and externalities) which significantly outweigh the costs.
Table 8-2 compares the results of the CBA for the reference case, using both a four per cent and seven per cent discount rate.
Using a seven per cent discount rate reduces the net economic benefit, with an ENPV of $4.9 billion and an EBCR of 1.1. In both cases, the EIRR of 7.6 per cent exceeds the discount rate.
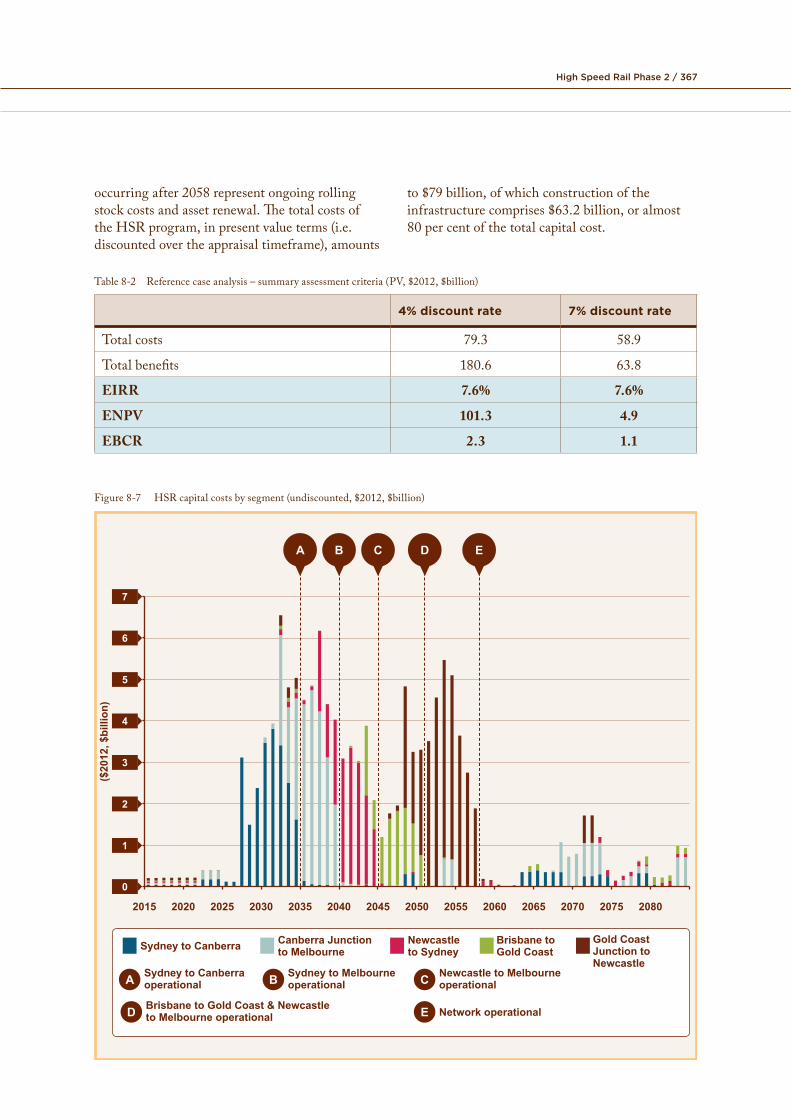
8.4 HSR capital costsFor the purpose of the economic analysis, the capital costs of the future HSR program include project development, construction costs, rolling stock costs and asset renewal. It should be noted that the treatment of rolling stock differs in the financial analysis presented in Chapter 7, which assumes that the rolling stock is leased from a third party provider with the lease costs appearing as a recurrent expense.
Figure 8-7 indicates that most of the program costs are spread over the construction period of 2027 (financial year 2028) to 2058. The costs
High Speed Rail Phase 2 / 367
occurring after 2058 represent ongoing rolling to $79 billion, of which construction of the stock costs and asset renewal. The total costs of infrastructure comprises $63.2 billion, or almost the HSR program, in present value terms (i.e. 80 per cent of the total capital cost.discounted over the appraisal timeframe), amounts
Table 8-2 Reference case analysis – summary assessment criteria (PV, $2012, $billion)
4% discount rate 7% discount rate
Total costs 79.3 58.9
Total benefits 180.6 63.8
EIRR 7.6% 7.6%
ENPV 101.3 4.9
EBCR 2.3 1.1
Figure 8-7 HSR capital costs by segment (undiscounted, $2012, $billion)
($20
12, $
billi
on)
0
1
2
3
4
5
6
7
Sydney to Canberra
Sydney to Canberra operational
Sydney to Melbourne operational
Newcastle to Melbourne operational
Brisbane to Gold Coast & Newcastle to Melbourne operational Network operational
Canberra Junction to Melbourne
Newcastle to Sydney
Brisbane to Gold Coast
Gold Coast Junction toNewcastle
A B C
D E
2015 2020 2025 2030 2035 2040 2045 2050 2055 2060 2065 2070 2075 2080
A B C D E
Chapter 8 Economic appraisal of the preferred HSR system
SignificantgovernmentcontributionswouldberequiredtofundtheconstructionofHSR.Iftaxeswereincreasedtofundthegovernmentspending,theDepartmentofFinanceandDeregulationHandbookofCost-benefitanalysis20suggeststhatanadjustmentfortheexcessburdenoftax21shouldbeincludedwiththefinancialcosts.AsdiscussedinChapter 7theanalysisdoesnotmakeanyassumptionsinregardtohowthefutureHSRprogramwouldbefundedorfinanced.Assuchnoadjustmentshavebeenincludedtothefinancialcoststocoverpotentialtaxationimplications.TheimpactsofgovernmentinvestmentintheHSRprogram,includingflowoneffectsonGDP,arediscussedinmoredetailintheCGEanalysispresentedinsection 8.8.
8.4.1 Impact of alternative cost estimatesItisprudenttotesttherobustnessoftheresultsoftheeconomicappraisaltohigherorlowercapitalcosts.Twoscenarioswereassessedtotesttheimpactthatalternativecostestimateswouldhaveontheeconomicanalysisresults,namely:• Tenpercentdecreaseinpre-riskcapitaland
operationalcostscomparedtothereferencecase.
• Thirtypercentincreaseinpre-riskcapitalandoperationalcostscomparedtothereferencecase.
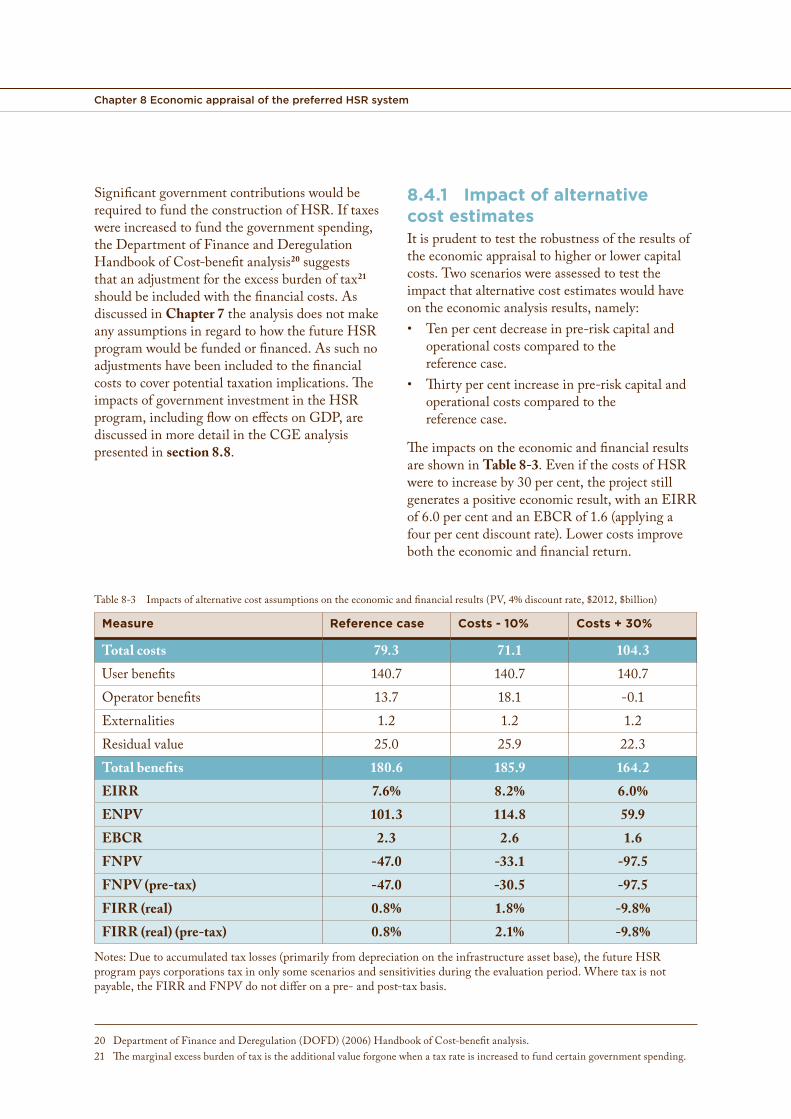
TheimpactsontheeconomicandfinancialresultsareshowninTable 8-3.EvenifthecostsofHSRweretoincreaseby30percent,theprojectstillgeneratesapositiveeconomicresult,withanEIRRof6.0percentandanEBCRof1.6(applyingafourpercentdiscountrate).Lowercostsimproveboththeeconomicandfinancialreturn.
Table8-3 Impactsofalternativecostassumptionsontheeconomicandfinancialresults(PV,4%discountrate,$2012,$billion)
Measure Reference case Costs - 10% Costs + 30%
Total costs 79.3 71.1 104.3Userbenefits 140.7 140.7 140.7Operatorbenefits 13.7 18.1 -0.1Externalities 1.2 1.2 1.2Residualvalue 25.0 25.9 22.3Total benefits 180.6 185.9 164.2EIRR 7.6% 8.2% 6.0%ENPV 101.3 114.8 59.9EBCR 2.3 2.6 1.6FNPV -47.0 -33.1 -97.5FNPV (pre-tax) -47.0 -30.5 -97.5FIRR (real) 0.8% 1.8% -9.8%FIRR (real) (pre-tax) 0.8% 2.1% -9.8%
Notes:Duetoaccumulatedtaxlosses(primarilyfromdepreciationontheinfrastructureassetbase),thefutureHSRprogrampayscorporationstaxinonlysomescenariosandsensitivitiesduringtheevaluationperiod.Wheretaxisnotpayable,theFIRRandFNPVdonotdifferonapre-andpost-taxbasis.
20 DepartmentofFinanceandDeregulation(DOFD)(2006)HandbookofCost-benefitanalysis.21 Themarginalexcessburdenoftaxistheadditionalvalueforgonewhenataxrateisincreasedtofundcertaingovernmentspending.
High Speed Rail Phase 2 / 369
8.5 HSR benefitsAsoutlinedinsection 8.2.1,thestreamofneteconomicbenefitscomprisesthreeparts:userbenefits,operatorbenefitsandexternalities.Eachisdiscussedbelow.
8.5.1 User benefitsTotaluserbenefitmeasurestheoverallchangein‘generalisedcostoftravel’asaresultofpeopleusingHSRcomparedtobasecasemodalchoices.‘Generalisedcost’includesthevariouscomponentsthatcontributetotheoverallcostofmakingatrip,e.g.thefare,thejourneytimeand,fortravelbycar,theoperatingcost.Italsoincludesautilityimpactwhichtakesintoconsiderationtherelativeamenityfeaturesofamodenotcapturedinothervariables(the‘alternativespecificconstant’).Thecalculationoftheuserbenefitsalsoincludesthebenefitsgeneratedbyinduceddemand(i.e.newtravelencouragedbyHSRasopposedtotraveldivertedfromothermodes).
Thecomputationoftheuserbenefitsisbasedonthe‘logsum’orcompositecost,whichisanoutputoftheproceduresusedforforecastingthepatronageonanewmodeoftransport(inthiscase,the‘logit’modelofthechoicebetweentransportmodes).Thesecomputationsofuserbenefitshavebeenindependentlyauditedandverifiedusingafirstprinciplesapproachtoestimatingtheconsumersurplusfromtheareaunderthedemandcurve.OneofthecharacteristicsofthechoicemodelusedinthedemandforecastsisthatitwillforecastasmallvolumeoftripsdivertingtoHSRevenwhentheexistingmodesremainbyfarthebestchoiceonaverage.Whilethiscanbeobservedinreallife,acheckontheresultsconfirmedthattheselow-volumediversionsdidnothaveamaterialeffectinaggregateontheestimateddemandandbenefits.
FourindicativecasestudyexamplesarepresentedtoillustratetheimpactthattheintroductionofHSRwouldhaveonatypicaljourney.Thecasestudiesalsooutlinehowtheuserbenefitsareestimated.ThefourexamplesarebusinesstripsfrominnereastMelbournetoinnerSydneyand
fromouternorthwestMelbournetoPortBotanyinSydney,andleisuretripsfromWaggaWaggatoSydneyCBDandfromTumuttoParramatta.ThesetripsaccountfordifferentproportionsoftheHSRdemandandbenefits,withMelbournetoSydneybeingthemostimportant.
Forbusinesstravel,themajorityofuserbenefits(about62percent)canbeattributedtoHSRprovidingadirectimprovementovertheexistingbest22transportmodes.Another24percentareduetothebenefitgainedbyhavinganadditionalmodeoftransportavailableinthecorridorwhich,whilenotthebestmode,neverthelessattractsashareofthetraveldemand23.Theremaining14percentareduetothebenefitsattributabletoinducedtraveldemand.
ForthosebusinessjourneysforwhichthecurrentmodeisairandHSRbecomesthebestmode,virtuallyall(94percent)oftheuserbenefitscanbeattributedtothereducedaccessandegresstimesandcoststo/fromtheHSRcitycentrestationsascomparedwiththeairports.
Withinthecapitalcities,mostvisitorsendtheirtripsinthecityCBDandsomeresidentsstarttheirtripsintheCBD.Forthesetripstheaccess/egressdistancesto/fromtheCBDaresubstantiallylessfromtheHSRcentralstationsthanfromtheairports.Hence,thereisasubstantialaccessbenefitwithHSRintermsofbothjourneytimesandtravelcosts.Giventheimportanceoftheaccess/egressbenefits,theaccess,egressandtraveltimeassumptionsandthegeneralisedcostformulationhavebeenindependentlyauditedandconfirmedtobereasonable.
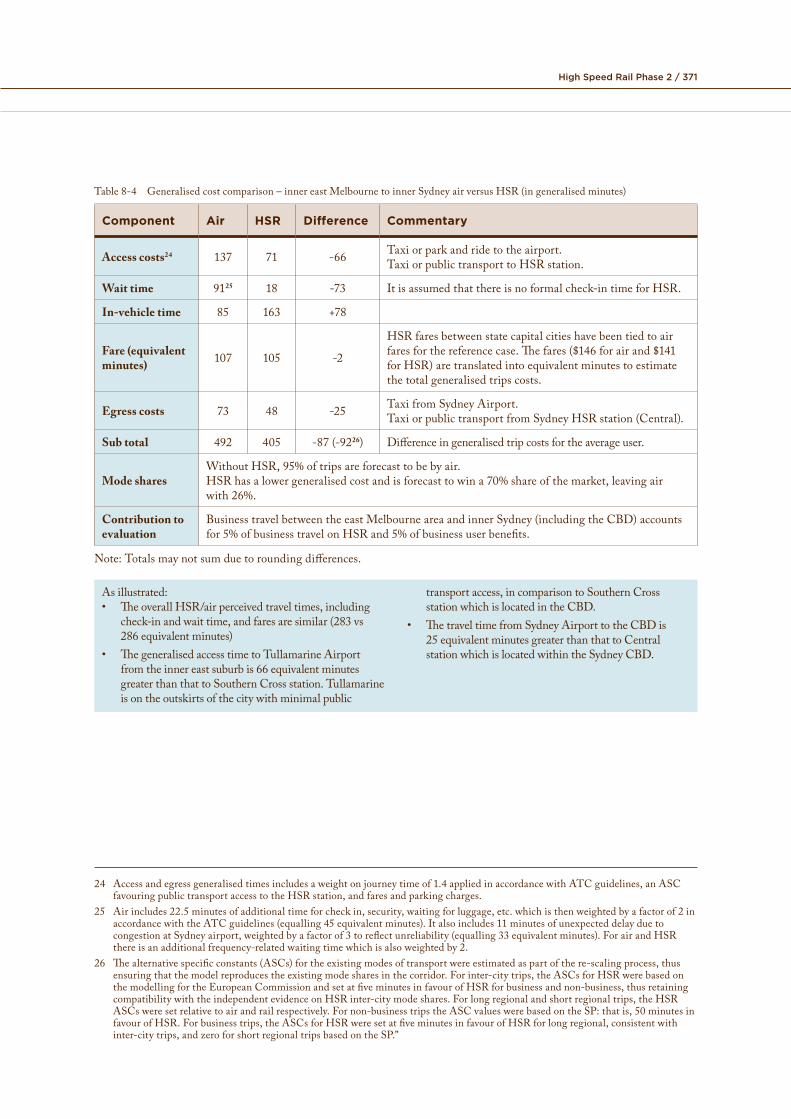
Casestudy1illustratesabusinesstripfrominnereastMelbournetoinnerSydney.Inthiscasestudy,theaccessjourneyfromeastofMelbournetotheCBDismuchshorterthanthatthroughtheCBDtotheairport;thisisreflectedintheuserbenefit.SydneyAirportisclosertotheCBDandtheegressbenefitwithHSRiscorrespondinglyless.
AsillustratedinTable 8-4,HSRisonaverage92minutesbetteringeneralisedcosttermsthanair.Ifallairtripswereforecasttoswitch
22 WithoutHSR,themodethatoffersthelowestgeneralisedcostoftravel.23 EvenifHSRisnotthebestmode‘onaverage’,becauseindividualtravelpreferencesareassumedtobedistributedaroundtheaverage
itwillstillattractsometrips,asexplainedfurtherinthedescriptionofthecasestudies.
Chapter 8 Economic appraisal of the preferred HSR system
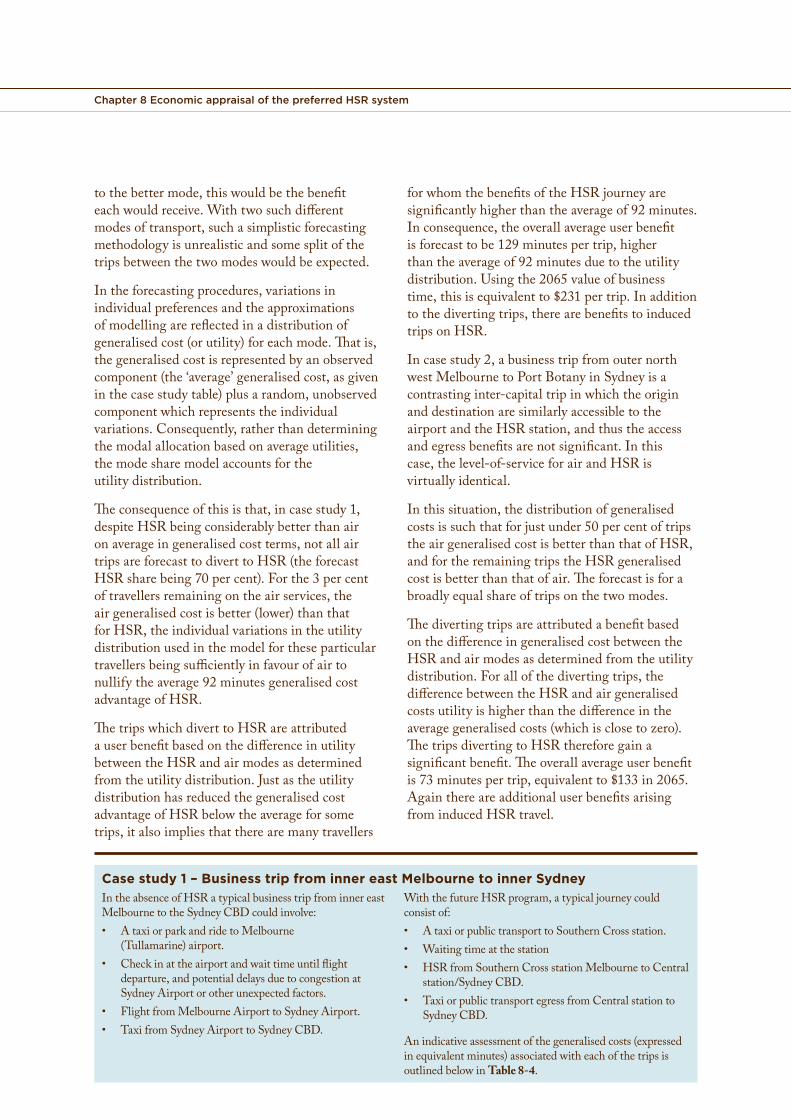
tothebettermode,thiswouldbethebenefit forwhomthebenefitsoftheHSRjourneyareeachwouldreceive.Withtwosuchdifferent significantlyhigherthantheaverageof92minutes.modesoftransport,suchasimplisticforecasting Inconsequence,theoverallaverageuserbenefitmethodologyisunrealisticandsomesplitofthe isforecasttobe129minutespertrip,highertripsbetweenthetwomodeswouldbeexpected. thantheaverageof92minutesduetotheutility
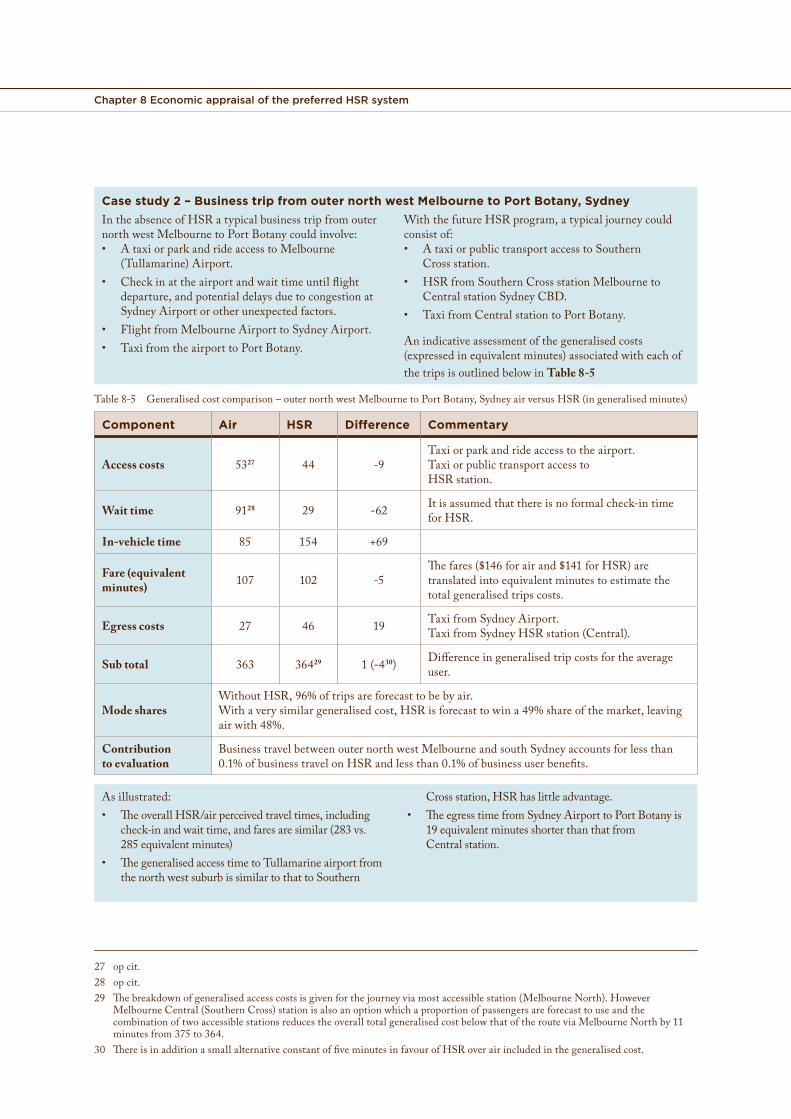
distribution.Usingthe2065valueofbusinessIntheforecastingprocedures,variationsin time,thisisequivalentto$231pertrip.Inadditionindividualpreferencesandtheapproximations tothedivertingtrips,therearebenefitstoinducedofmodellingarereflectedinadistributionof tripsonHSR.generalisedcost(orutility)foreachmode.Thatis,thegeneralisedcostisrepresentedbyanobserved Incasestudy2,abusinesstripfromouternorthcomponent(the‘average’generalisedcost,asgiven westMelbournetoPortBotanyinSydneyisainthecasestudytable)plusarandom,unobserved contrastinginter-capitaltripinwhichtheorigincomponentwhichrepresentstheindividual anddestinationaresimilarlyaccessibletothevariations.Consequently,ratherthandetermining airportandtheHSRstation,andthustheaccessthemodalallocationbasedonaverageutilities, andegressbenefitsarenotsignificant.Inthisthemodesharemodelaccountsforthe case,thelevel-of-serviceforairandHSRisutilitydistribution. virtuallyidentical.
Theconsequenceofthisisthat,incasestudy1, Inthissituation,thedistributionofgeneraliseddespiteHSRbeingconsiderablybetterthanair costsissuchthatforjustunder50percentoftripsonaverageingeneralisedcostterms,notallair theairgeneralisedcostisbetterthanthatofHSR,tripsareforecasttodiverttoHSR(theforecast andfortheremainingtripstheHSRgeneralisedHSRsharebeing70percent).Forthe3percent costisbetterthanthatofair.Theforecastisforaoftravellersremainingontheairservices,the broadlyequalshareoftripsonthetwomodes.airgeneralisedcostisbetter(lower)thanthat
ThedivertingtripsareattributedabenefitbasedforHSR,theindividualvariationsintheutilityonthedifferenceingeneralisedcostbetweenthedistributionusedinthemodelfortheseparticularHSRandairmodesasdeterminedfromtheutilitytravellersbeingsufficientlyinfavourofairtodistribution.Forallofthedivertingtrips,thenullifytheaverage92minutesgeneralisedcostdifferencebetweentheHSRandairgeneralisedadvantageofHSR.costsutilityishigherthanthedifferenceinthe
ThetripswhichdiverttoHSRareattributed averagegeneralisedcosts(whichisclosetozero).auserbenefitbasedonthedifferenceinutility ThetripsdivertingtoHSRthereforegainabetweentheHSRandairmodesasdetermined significantbenefit.Theoverallaverageuserbenefitfromtheutilitydistribution.Justastheutility is73minutespertrip,equivalentto$133in2065.distributionhasreducedthegeneralisedcost AgainthereareadditionaluserbenefitsarisingadvantageofHSRbelowtheaverageforsome frominducedHSRtravel.trips,italsoimpliesthattherearemanytravellers
Case study 1 – Business trip from inner east Melbourne to inner SydneyIntheabsenceofHSRatypicalbusinesstripfrominnereast WiththefutureHSRprogram,atypicaljourneycouldMelbournetotheSydneyCBDcould involve: consistof:• AtaxiorparkandridetoMelbourne • AtaxiorpublictransporttoSouthernCrossstation.
(Tullamarine)airport. • Waitingtimeatthestation• Checkinattheairportandwaittimeuntilflight • HSRfromSouthernCrossstationMelbournetoCentral
departure,andpotentialdelaysduetocongestionat station/SydneyCBD.SydneyAirportorotherunexpectedfactors. • TaxiorpublictransportegressfromCentralstationto
• FlightfromMelbourneAirporttoSydneyAirport. SydneyCBD.• TaxifromSydneyAirporttoSydneyCBD.
Anindicativeassessmentofthegeneralisedcosts(expressedinequivalentminutes)associatedwitheachofthetripsisoutlinedbelowinTable 8-4.
High Speed Rail Phase 2 / 371
Table8-4 Generalisedcostcomparison–innereastMelbournetoinnerSydneyairversusHSR(ingeneralisedminutes)
Component Air HSR Difference Commentary
Access costs24 137 71 -66 TaxiTaxi
oror
parkandridetopublictransport
theairport.toHSRstation.
Wait time 9125 18 -73 Itisassumedthatthereisnoformalcheck-intimeforHSR.
In-vehicle time 85 163 +78
Fare (equivalent minutes) 107 105 -2
HSRfaresbetweenstatecapitalcitieshavebeentiedtoairfaresforthereferencecase.Thefares($146forairand$141forHSR)aretranslatedintoequivalentminutestoestimatethetotalgeneralisedtripscosts.
Egress costs 73 48 -25 TaxiTaxi
fromSydneyAirport.orpublictransportfromSydneyHSRstation(Central).
Sub total 492 405 -87(-9226) Differenceingeneralisedtripcostsfortheaverageuser.
Mode sharesWithoutHSR,95%oftripsareforecastHSRhasalowergeneralisedcostandiswith 26%.
tobebyforecast
air.towina70%shareofthemarket,leavingair
Contribution to evaluation
Businesstravelbetweenfor5%ofbusinesstravel
theon
eastMelbourneHSRand5%of
areaandbusiness
innerSydneyuserbenefits.
(includingtheCBD)accounts
Note:Totalsmaynotsumduetoroundingdifferences.
Asillustrated: transportaccess,incomparisontoSouthernCross• TheoverallHSR/airperceivedtraveltimes,including stationwhichislocatedintheCBD.
check-inandwaittime,andfaresaresimilar(283vs • Th etraveltimefromSydneyAirporttotheCBDis286 equivalentminutes) 25 equivalentminutesgreaterthanthattoCentral
• Th egeneralisedaccesstimetoTullamarineAirport stationwhichislocatedwithintheSydneyCBD.fromtheinnereastsuburbis66equivalentminutesgreaterthanthattoSouthernCrossstation.Tullamarineisontheoutskirtsofthecitywithminimalpublic
24 Accessandegressgeneralisedtimesincludesaweightonjourneytimeof1.4appliedinaccordancewithATCguidelines,anASCfavouringpublictransportaccesstotheHSRstation,andfaresandparkingcharges.
25 Airincludes22.5minutesofadditionaltimeforcheckin,security,waitingforluggage,etc.whichisthenweightedbyafactorof2inaccordancewiththeATCguidelines(equalling45equivalentminutes).Italsoincludes11minutesofunexpecteddelayduetocongestionatSydneyairport,weightedbyafactorof3toreflectunreliability(equalling33equivalentminutes).ForairandHSRthereisanadditionalfrequency-relatedwaitingtimewhichisalsoweightedby2.
26 Thealternativespecificconstants(ASCs)fortheexistingmodesoftransportwereestimatedaspartofthere-scalingprocess,thusensuringthatthemodelreproducestheexistingmodesharesinthecorridor.Forinter-citytrips,theASCsforHSRwerebasedonthemodellingfortheEuropeanCommissionandsetatfiveminutesinfavourofHSRforbusinessandnon-business,thusretainingcompatibilitywiththeindependentevidenceonHSRinter-citymodeshares.Forlongregionalandshortregionaltrips,theHSRASCsweresetrelativetoairandrailrespectively.Fornon-businesstripstheASCvalueswerebasedontheSP:thatis,50minutesinfavourofHSR.Forbusinesstrips,theASCsforHSRweresetatfiveminutesinfavourofHSRforlongregional,consistentwithinter-citytrips,andzeroforshortregionaltripsbasedontheSP.”
Chapter 8 Economic appraisal of the preferred HSR system
Case study 2 – Business trip from outer north west Melbourne to Port Botany, SydneyIntheabsenceofHSRatypicalbusinesstripfromouter WiththefutureHSRprogram,atypicaljourneycouldnorthwestMelbournetoPortBotanycould involve: consistof:• AtaxiorparkandrideaccesstoMelbourne • AtaxiorpublictransportaccesstoSouthern
(Tullamarine)Airport. Crossstation.• Checkinattheairportandwaittimeuntilflight • HSRfromSouthernCrossstationMelbourneto
departure,andpotentialdelaysduetocongestionat CentralstationSydneyCBD.SydneyAirportorotherunexpectedfactors. • TaxifromCentralstationtoPortBotany.
• FlightfromMelbourneAirporttoSydneyAirport.Anindicativeassessmentofthegeneralisedcosts• TaxifromtheairporttoPortBotany. (expressedinequivalentminutes)associatedwitheachofthetripsisoutlinedbelowinTable 8-5
Table8-5 Generalisedcostcomparison–outernorthwestMelbournetoPortBotany,SydneyairversusHSR(ingeneralisedminutes)
Component Air HSR Difference Commentary
Access costs 5327 44 -9TaxiorparkandrideaccesstoTaxiorpublictransportaccessHSRstation.
theto
airport.
Wait time 9128 29 -62 ItisassumedforHSR.
thatthereisnoformalcheck-intime
In-vehicle time 85 154 +69
Fare (equivalent minutes) 107 102 -5
Thefares($146forairand$141forHSR)aretranslatedintoequivalentminutestoestimatetotalgeneralisedtripscosts.
the
Egress costs 27 46 19 TaxiTaxi
fromfrom
SydneySydney
Airport.HSRstation(Central).
Sub total 363 36429 1(-430) Differenceingeneraliseduser.
tripcostsfortheaverage
Mode sharesWithoutHSR,96%oftripsareWithaverysimilargeneralisedairwith48%.
forecasttocost,HSR
bebyair.isforecasttowina49%shareofthemarket,leaving
Contribution to evaluation
Businesstravelbetweenouternorth0.1%ofbusinesstravelonHSRand
westMelbournelessthan0.1%of
andsouthSydneyaccountsbusinessuserbenefits.
forlessthan
Asillustrated: Crossstation,HSRhaslittleadvantage.• TheoverallHSR/airperceivedtraveltimes,including • TheegresstimefromSydneyAirporttoPortBotanyis
check-inandwaittime,andfaresaresimilar(283vs. 19equivalentminutesshorterthanthatfrom285equivalentminutes) Centralstation.
• ThegeneralisedaccesstimetoTullamarineairportfromthenorthwestsuburbissimilartothattoSouthern
27 opcit.28 opcit.29 Thebreakdownofgeneralisedaccesscostsisgivenforthejourneyviamostaccessiblestation(MelbourneNorth).However
MelbourneCentral(SouthernCross)stationisalsoanoptionwhichaproportionofpassengersareforecasttouseandthecombinationoftwoaccessiblestationsreducestheoveralltotalgeneralisedcostbelowthatoftherouteviaMelbourneNorthby11minutesfrom375to364.
30 ThereisinadditionasmallalternativeconstantoffiveminutesinfavourofHSRoverairincludedinthegeneralisedcost.
High Speed Rail Phase 2 / 373
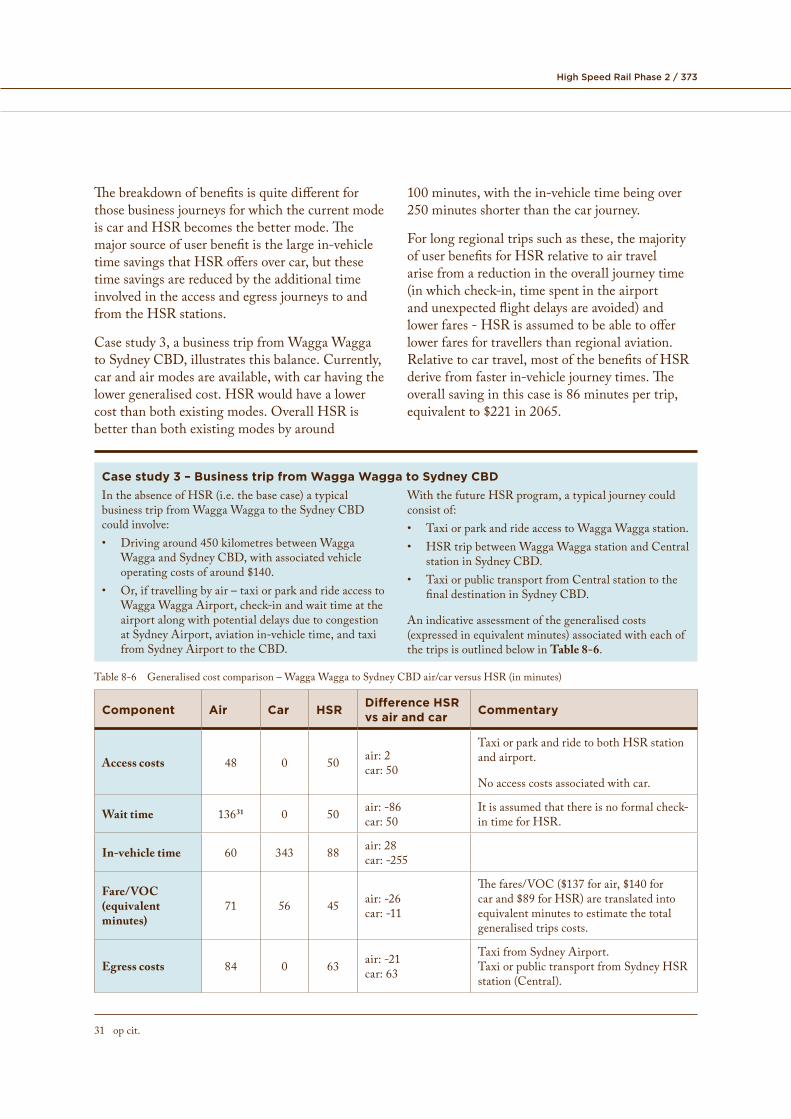
The breakdown of benefits is quite different for those business journeys for which the current mode is car and HSR becomes the better mode. The major source of user benefit is the large in-vehicle time savings that HSR offers over car, but these time savings are reduced by the additional time involved in the access and egress journeys to and from the HSR stations.
Case study 3, a business trip from Wagga Wagga to Sydney CBD, illustrates this balance. Currently, car and air modes are available, with car having the lower generalised cost. HSR would have a lower cost than both existing modes. Overall HSR is better than both existing modes by around
100 minutes, with the in-vehicle time being over 250 minutes shorter than the car journey.
For long regional trips such as these, the majority of user benefits for HSR relative to air travel arise from a reduction in the overall journey time (in which check-in, time spent in the airport and unexpected flight delays are avoided) and lower fares - HSR is assumed to be able to offer lower fares for travellers than regional aviation. Relative to car travel, most of the benefits of HSR derive from faster in-vehicle journey times. The overall saving in this case is 86 minutes per trip, equivalent to $221 in 2065.
Case study 3 – Business trip from Wagga Wagga to Sydney CBDIn the absence of HSR (i.e. the base case) a typical business trip from Wagga Wagga to the Sydney CBD could involve:• Driving around 450 kilometres between Wagga
Wagga and Sydney CBD, with associated vehicle operating costs of around $140.
• Or, if travelling by air – taxi or park and ride access to Wagga Wagga Airport, check-in and wait time at the airport along with potential delays due to congestion at Sydney Airport, aviation in-vehicle time, and taxi from Sydney Airport to the CBD.
With the future HSR program, a typical journey could consist of:• Taxi or park and ride access to Wagga Wagga station.• HSR trip between Wagga Wagga station and Central
station in Sydney CBD.• Taxi or public transport from Central station to the
final destination in Sydney CBD.
An indicative assessment of the generalised costs (expressed in equivalent minutes) associated with each of the trips is outlined below in Table 8-6.
Table 8-6 Generalised cost comparison – Wagga Wagga to Sydney CBD air/car versus HSR (in minutes)
Component Air Car HSR Difference HSR vs air and car Commentary
Access costs 48 0 50 air: 2 car: 50
Taxi or park and ride to both HSR station and airport.
No access costs associated with car.
Wait time 13631 0 50 air: -86 car: 50
It is assumed that there is no formal check-in time for HSR.
In-vehicle time 60 343 88 air: 28 car: -255
Fare/VOC (equivalent minutes)
71 56 45 air: -26 car: -11
The fares/VOC ($137 for air, $140 for car and $89 for HSR) are translated into equivalent minutes to estimate the total generalised trips costs.
Egress costs 84 0 63 air: -21 car: 63
Taxi from Sydney Airport. Taxi or public transport from Sydney HSR station (Central).
31 op cit.
Chapter 8 Economic appraisal of the preferred HSR system
Component Air Car HSR Difference HSR vs air and car Commentary
Sub total 399 399 296 air:car:
-103-103
(10832)(-9033)
Differenceinaverageuser.
generalisedtripcostsforthe
WithoutHSR,47%oftripsareforecasttobebyairand51%bycar.Mode shares Withalowergeneralisedcostthenbothairandcar,HSRisforecasttowina48%shareofthe
market,leavingairandcarwith13%and36%respectively,thegreaterimpactbeingonair.
Contribution to evaluation
BusinesstravelfromtheregionalareasbetweenCanberraandAlbury-Wodonga,encompassingWaggaWaggaandTumut,toSydneyCBDaccountsforlessthan0.1%ofbusinesstravelonHSRandlessthan0.1%ofbusinessuserbenefits.
Asillustrated: fourhoursshorter,whichisonlypartiallyoffsetbythe• Comparedwithair,HSRhasaloweroveralltime(wait accessandegresscostsforHSR.TheHSRfareisalso
andin-vehicle),alowerfareandloweregresscost. veryclosetothecostofusingcar.
• Comparedwithcar,thein-vehicletimebyHSRisover
Forthenon-businessleisuresegment,themajority (accountingfor76percentoftrips).HSRremainsofuserbenefits(about67percent)areduetothe lessattractivethancar-whileHSRhasalowerbenefitgainedbypassengerswhoswitchtoHSR in-vehicletime,itismuchmoreexpensiveanddespiteitnothavingthelowestaveragegeneralised thereisalongaccesstriptotheregionalHSRcost.Thisgenerallyappliesinthesituationwhere stationandalongegresstripfromSydneyCentralcariscurrentlythebestmodeoftraveltoandfrom toParramatta.However,HSRisasignificantregionaltowns.Another24percentofbenefitsare improvementoverthecurrentalternativeairwhereHSRprovidesadirectimprovementoverthe service(notrequiringcheck-inandhavingnoexistingbesttransportmodesandninepercent unexpecteddelaypenalties,andamuchlowerfare).areduetothebenefitsattributabletoinduced Carcontinuestobethemostattractiveoption,buttraveldemand. HSRreplacesairandwinsalargershareofthe
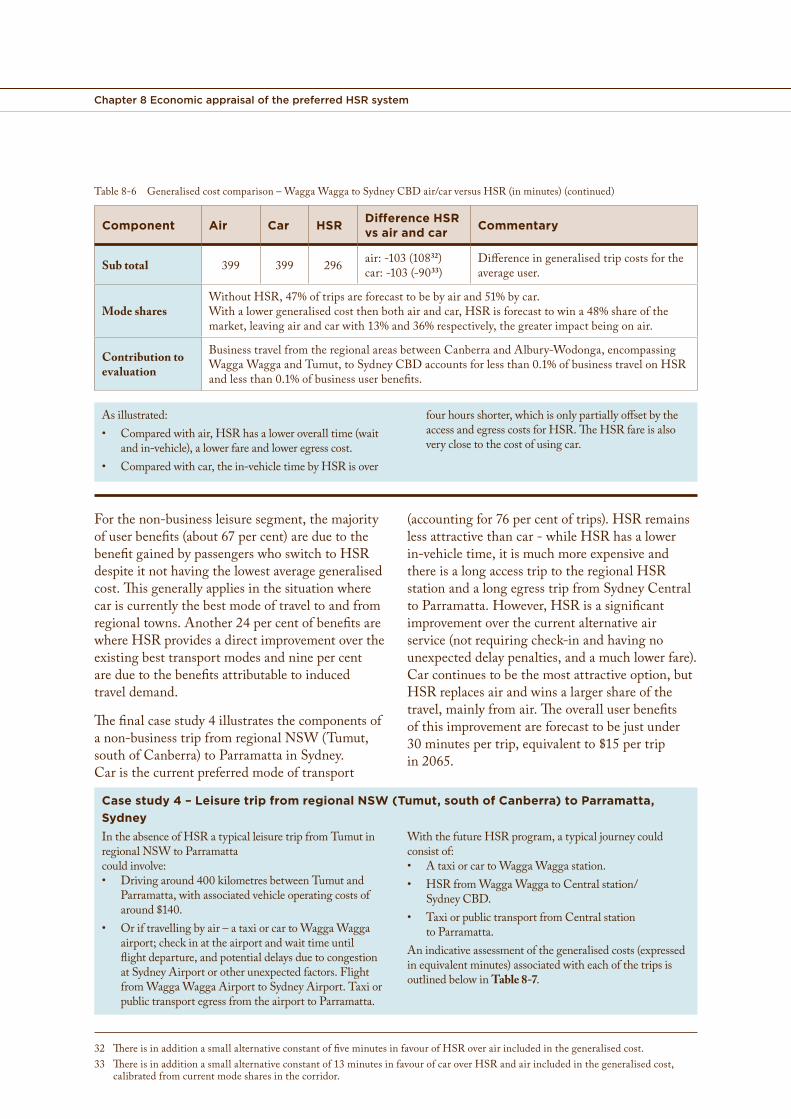
travel,mainlyfromair.TheoveralluserbenefitsThefinalcasestudy4illustratesthecomponentsof ofthisimprovementareforecasttobejustunderanon-businesstripfromregionalNSW(Tumut, 30 minutespertrip,equivalentto$15pertripsouthofCanberra)toParramattainSydney. in2065.Caristhecurrentpreferredmodeoftransport
Case study 4 – Leisure trip from regional NSW (Tumut, south of Canberra) to Parramatta, SydneyIntheabsenceofHSRatypicalleisuretripfromTumutin WiththefutureHSRprogram,atypicaljourneycouldregionalNSWtoParramatta consistof:couldinvolve: • AtaxiorcartoWaggaWaggastation.• Drivingaround400kilometresbetweenTumutand • HSRfromWaggaWaggatoCentralstation/
Parramatta,withassociatedvehicleoperatingcostsof SydneyCBD.around$140. • TaxiorpublictransportfromCentralstation
• Oriftravellingbyair–ataxiorcartoWaggaWagga toParramatta.airport;checkinattheairportandwaittimeuntil Anindicativeassessmentofthegeneralisedcosts(expressedflightdeparture,andpotentialdelaysduetocongestion inequivalentminutes)associatedwitheachofthetripsisatSydneyAirportorotherunexpectedfactors.Flight outlinedbelowinTable 8-7.fromWaggaWaggaAirporttoSydneyAirport.TaxiorpublictransportegressfromtheairporttoParramatta.
32 ThereisinadditionasmallalternativeconstantoffiveminutesinfavourofHSRoverairincludedinthegeneralisedcost.33 Thereisinadditionasmallalternativeconstantof13minutesinfavourofcaroverHSRandairincludedinthegeneralisedcost,
calibratedfromcurrentmodesharesinthecorridor.
Table8-6 Generalisedcostcomparison–WaggaWaggatoSydneyCBDair/carversusHSR(inminutes)(continued)
High Speed Rail Phase 2 / 375
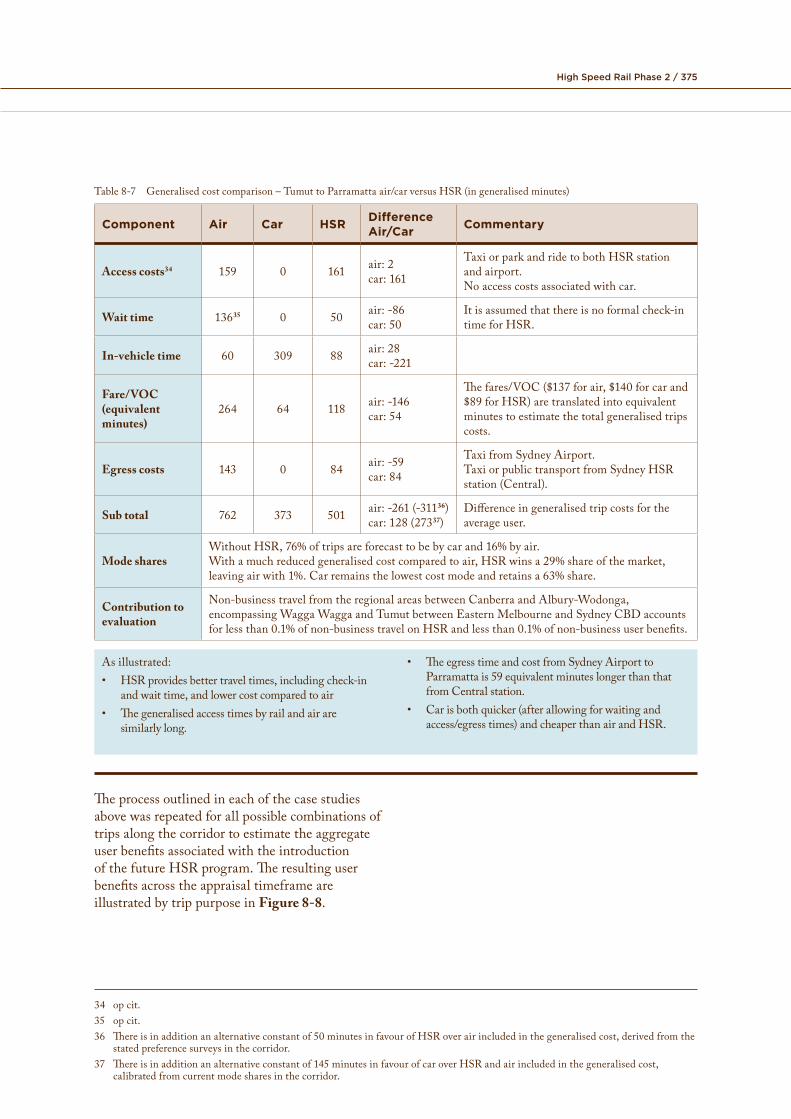
Table8-7 Generalisedcostcomparison–TumuttoParramattaair/carversusHSR(ingeneralisedminutes)
Component Air Car HSR Difference Air/Car Commentary
Access costs34 159 0 161 air:car:
2161
TaxiorparkandridetobothHSRstationandairport.Noaccesscostsassociatedwithcar.
Wait time 13635 0 50 air:car:
-8650
ItisassumedthattimeforHSR.
thereisnoformalcheck-in
In-vehicle time 60 309 88 air:car:
28-221
Fare/VOC (equivalent minutes)
264 64 118 air:car:
-14654
Thefares/VOC($137forair,$140forcarand$89forHSR)aretranslatedintoequivalentminutestoestimatethetotalgeneralisedtripscosts.
Egress costs 143 0 84 air:car:
-5984
TaxifromSydneyAirport.Taxiorpublictransportfromstation(Central).
SydneyHSR
Sub total 762 373 501 air:car:
-261128
(-31136)(27337)
Differenceinaverageuser.
generalisedtripcostsforthe
WithoutHSR,76%oftripsareforecasttobebycarand16%byair.Mode shares Withamuchreducedgeneralisedcostcomparedtoair,HSRwinsa29%shareofthemarket,
leavingairwith1%.Carremainsthelowestcostmodeandretainsa63%share.
Contribution to evaluation
Non-businesstravelfromtheregionalareasbetweenCanberraandAlbury-Wodonga,encompassingWaggaWaggaandTumutbetweenEasternMelbourneandSydneyCBDaccountsforlessthan0.1%ofnon-businesstravelonHSRandlessthan0.1%ofnon-businessuserbenefits.
Asillustrated: • TheegresstimeandcostfromSydneyAirportto• HSRprovidesbettertraveltimes,includingcheck-in Parramattais59equivalentminuteslongerthanthat
andwaittime,andlowercostcomparedtoair fromCentralstation.
• Thegeneralisedaccesstimesbyrailandairare • Carisbothquicker(afterallowingforwaitingandsimilarlylong. access/egresstimes)andcheaperthanairandHSR.
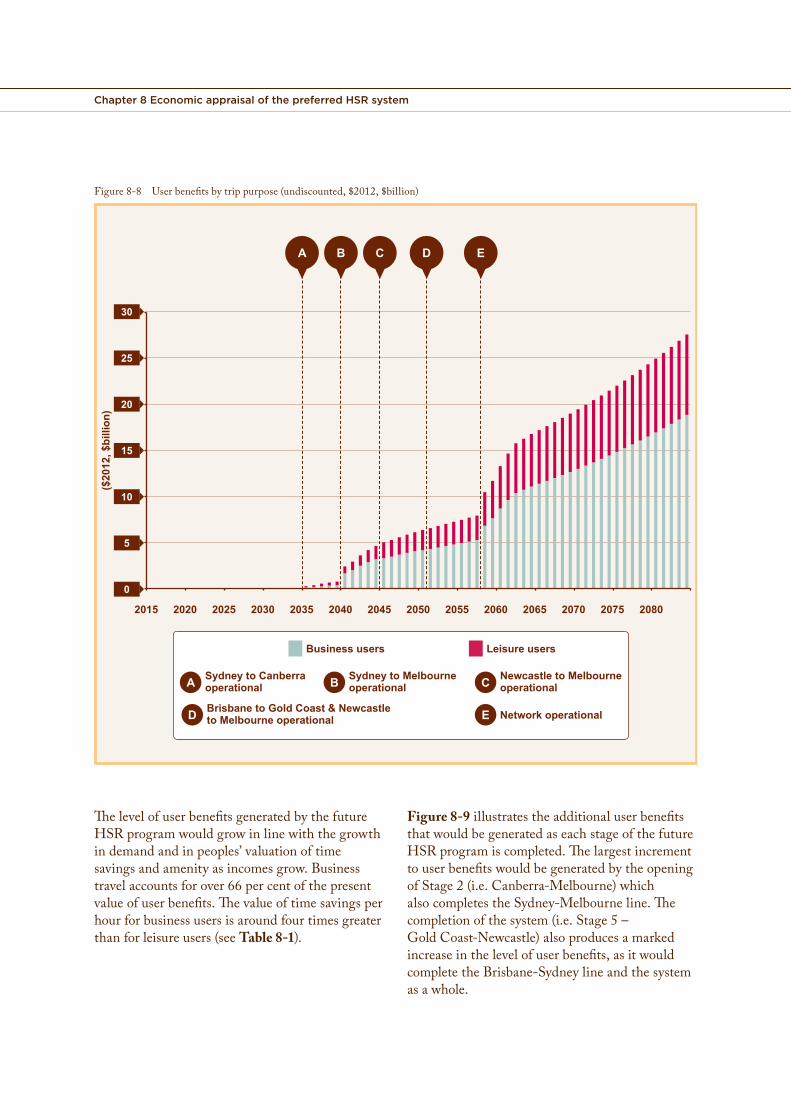
TheprocessoutlinedineachofthecasestudiesabovewasrepeatedforallpossiblecombinationsoftripsalongthecorridortoestimatetheaggregateuserbenefitsassociatedwiththeintroductionofthefutureHSRprogram.TheresultinguserbenefitsacrosstheappraisaltimeframeareillustratedbytrippurposeinFigure 8-8.
34 opcit.35 opcit.36 Thereisinadditionanalternativeconstantof50minutesinfavourofHSRoverairincludedinthegeneralisedcost,derivedfromthe
statedpreferencesurveysinthecorridor.37 Thereisinadditionanalternativeconstantof145minutesinfavourofcaroverHSRandairincludedinthegeneralisedcost,
calibratedfromcurrentmodesharesinthecorridor.
Chapter 8 Economic appraisal of the preferred HSR system
Figure 8-8 User benefits by trip purpose (undiscounted, $2012, $billion)
($20
12, $
billi
on)
0
Sydney to Canberra operational
Sydney to Melbourne operational
Newcastle to Melbourne operational
Brisbane to Gold Coast & Newcastle to Melbourne operational Network operational
Business users Leisure users
A B C
D E
2015 2020 2025 2030 2035 2040 2045 2050 2055 2060 2065 2070 2075 2080
A B C D E
30
25
20
15
10
5
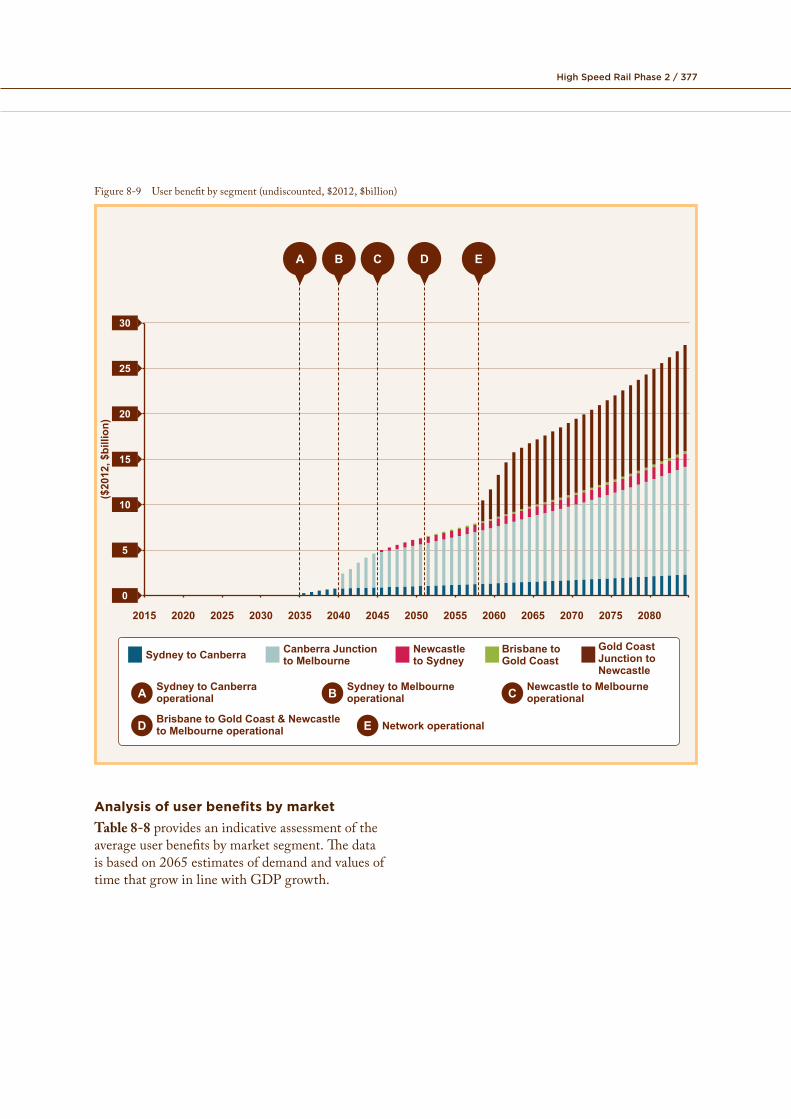
The level of user benefits generated by the future Figure 8-9 illustrates the additional user benefits HSR program would grow in line with the growth that would be generated as each stage of the future in demand and in peoples’ valuation of time HSR program is completed. The largest increment savings and amenity as incomes grow. Business to user benefits would be generated by the opening travel accounts for over 66 per cent of the present of Stage 2 (i.e. Canberra-Melbourne) which value of user benefits. The value of time savings per also completes the Sydney-Melbourne line. The hour for business users is around four times greater completion of the system (i.e. Stage 5 – than for leisure users (see Table 8-1). Gold Coast-Newcastle) also produces a marked
increase in the level of user benefits, as it would complete the Brisbane-Sydney line and the system as a whole.
High Speed Rail Phase 2 / 377
Figure 8-9 User benefit by segment (undiscounted, $2012, $billion)
($20
12, $
billi
on)
0
Sydney to Canberra operational
Sydney to Melbourne operational
Newcastle to Melbourne operational
Brisbane to Gold Coast & Newcastle to Melbourne operational Network operational
A B C
D E
2015 2020 2025 2030 2035 2040 2045 2050 2055 2060 2065 2070 2075 2080
A B C D E
30
25
20
15
10
5
Sydney to Canberra Canberra Junction to Melbourne
Newcastle to Sydney
Gold Coast Junction toNewcastle
Brisbane to Gold Coast
Analysis of user benefits by marketTable 8-8 provides an indicative assessment of the average user benefits by market segment. The data is based on 2065 estimates of demand and values of time that grow in line with GDP growth.
Chapter 8 Economic appraisal of the preferred HSR system
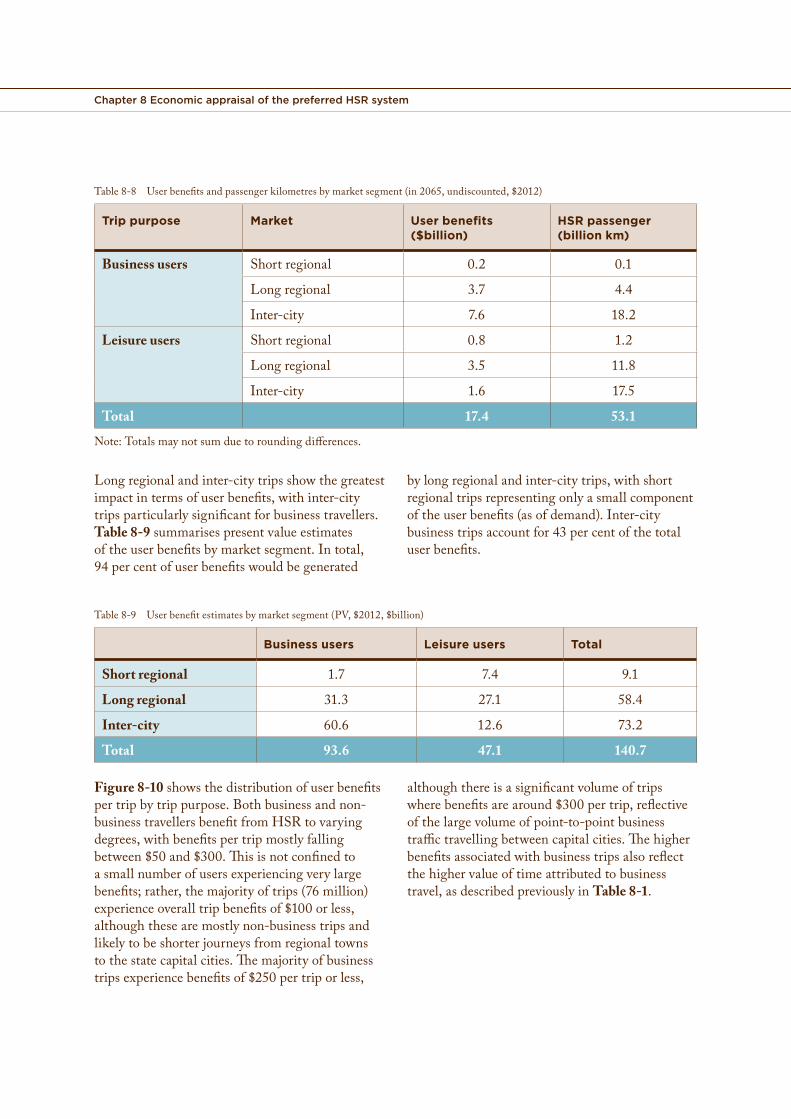
Table8-8 Userbenefitsandpassengerkilometresbymarketsegment(in2065,undiscounted,$2012)
Trip purpose Market User benefits ($billion)
HSR passenger (billion km)
Business users Shortregional 0.2 0.1
Longregional 3.7 4.4
Inter-city 7.6 18.2
Leisure users Shortregional 0.8 1.2
Longregional 3.5 11.8
Inter-city 1.6 17.5
Total 17.4 53.1
Note:Totalsmaynotsumduetoroundingdifferences.
Longregionalandinter-citytripsshowthegreatest bylongregionalandinter-citytrips,withshortimpactintermsofuserbenefits,withinter-city regionaltripsrepresentingonlyasmallcomponenttripsparticularlysignificantforbusinesstravellers. oftheuserbenefits(asofdemand).Inter-cityTable 8-9summarisespresentvalueestimates businesstripsaccountfor43percentofthetotaloftheuserbenefitsbymarketsegment.Intotal, userbenefits.94percentofuserbenefitswouldbegenerated
Table8-9 Userbenefitestimatesbymarketsegment(PV,$2012,$billion)
Business users Leisure users Total
Short regional 1.7 7.4 9.1
Long regional 31.3 27.1 58.4
Inter-city 60.6 12.6 73.2
Total 93.6 47.1 140.7
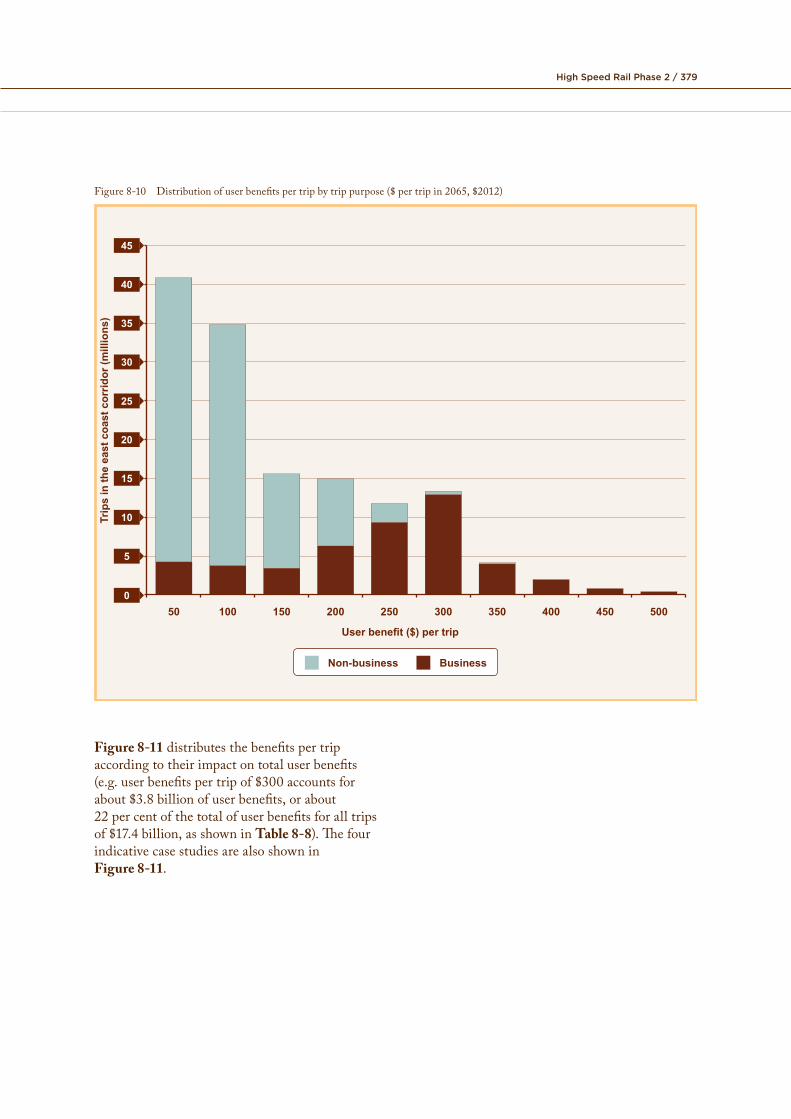
Figure 8-10showsthedistributionofuserbenefits althoughthereisasignificantvolumeoftripspertripbytrippurpose.Bothbusinessandnon- wherebenefitsarearound$300pertrip,reflectivebusinesstravellersbenefitfromHSRtovarying ofthelargevolumeofpoint-to-pointbusinessdegrees,withbenefitspertripmostlyfalling traffictravellingbetweencapitalcities.Thehigherbetween$50and$300.Thisisnotconfinedto benefitsassociatedwithbusinesstripsalsoreflectasmallnumberofusersexperiencingverylarge thehighervalueoftimeattributedtobusinessbenefits;rather,themajorityoftrips(76million) travel,asdescribedpreviouslyinTable 8-1.experienceoveralltripbenefitsof$100orless,althoughthesearemostlynon-businesstripsandlikelytobeshorterjourneysfromregionaltownstothestatecapitalcities.Themajorityofbusinesstripsexperiencebenefitsof$250pertriporless,
High Speed Rail Phase 2 / 379
Figure 8-10 Distribution of user benefits per trip by trip purpose ($ per trip in 2065, $2012)
Trip
s in
the
east
coa
st c
orrid
or (m
illio
ns)
0
5
10
15
20
25
30
35
40
45
50 100 150 200 250 300 350 400 450 500
Non-business Business
User benefit ($) per trip
Figure 8-11 distributes the benefits per trip according to their impact on total user benefits (e.g. user benefits per trip of $300 accounts for about $3.8 billion of user benefits, or about 22 per cent of the total of user benefits for all trips of $17.4 billion, as shown in Table 8-8). The four indicative case studies are also shown in Figure 8-11.

Chapter 8 Economic appraisal of the preferred HSR system
Figure 8-11 Distribution of user benefits per trip by total impact on user benefits (in 2065, $2012)
Use
r ben
efits
($ m
illio
n)
User benefit ($) per trip
0
500
1000
1500
2000
2500
3000
3500
4000
4500
50 100 150 200 250 300 350 400 450 500
Non-business Business
Case study 4
Case study 2
Case studies 1 and 3
Comparison with the ‘rule of a half’The benefits associated with new users of transport improvements are generally calculated using the economic ‘rule of a half ’. For example, if a new line is being added to an urban metro network, benefits will arise through travellers experiencing shorter journey times and less crowding on the train and at stations. These benefits will result in extra passengers using the service. The rule of a half states that the benefit accruing to diverted or new users of a transport system is on average half of that accruing to the pre-existing users.
The rule of a half involves a simplifying assumption that the shape of the demand curve is linear. For the HSR benefit estimates, the calculation of induced travel benefits does not
make the simplifying assumption (for details, see Appendix 1E), but it has been confirmed that the two methods give almost identical benefit estimates.
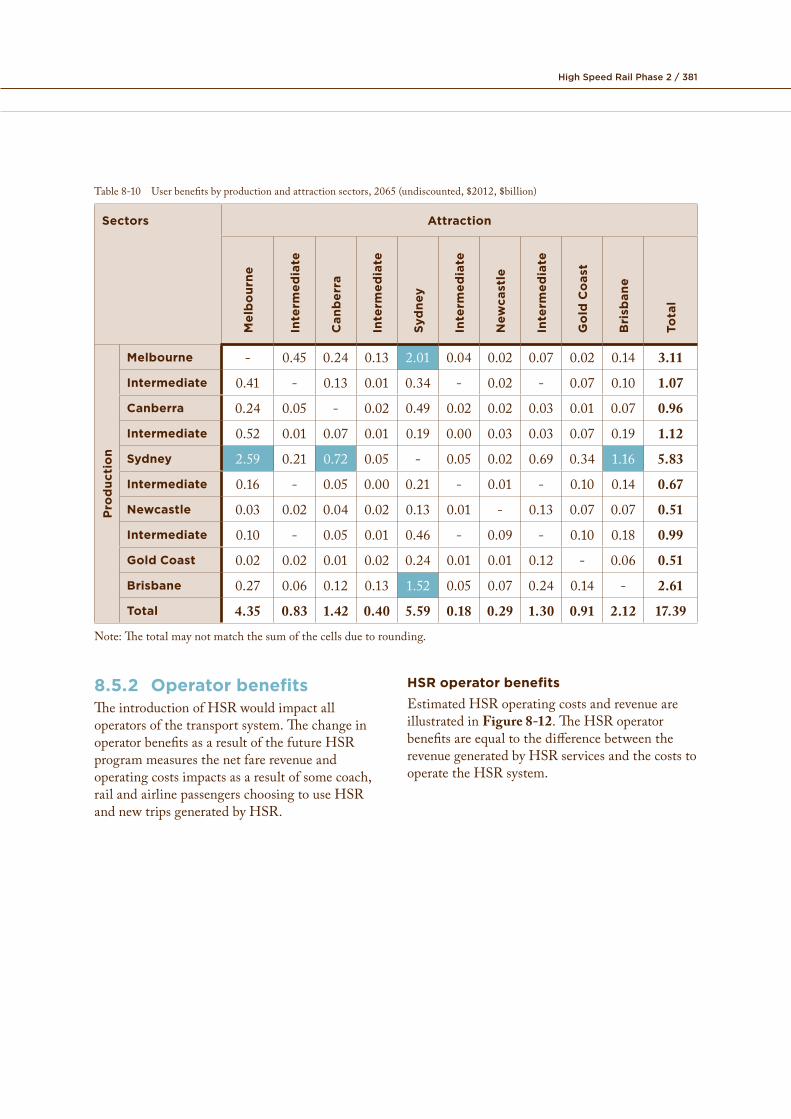
Geographic incidence of user benefitsThe majority of user benefits accrue to trips to/from NSW locations, with over 60 per cent of all benefits in 2065 involving a journey with an origin or destination in NSW. Table 8-10 presents the total user benefits (in 2065) between the trip production and attraction locations. The estimated top five journeys for scale of user benefits are Sydney-Melbourne, Melbourne-Sydney, Brisbane-Sydney, Sydney-Brisbane, and Sydney-Canberra. These are highlighted in the table.
High Speed Rail Phase 2 / 381
Table8-10 Userbenefitsbyproductionandattractionsectors,2065(undiscounted,$2012,$billion)
Sectors Attraction
Mel
bo
urne
Inte
rmed
iate
Can
ber
ra
Inte
rmed
iate
Syd
ney
Inte
rmed
iate
New
cast
le
Inte
rmed
iate
Go
ld C
oas
t
Bri
sban
e
Tota
l
Melbourne - 0.45 0.24 0.13 2.01 0.04 0.02 0.07 0.02 0.14 3.11
Intermediate 0.41 - 0.13 0.01 0.34 - 0.02 - 0.07 0.10 1.07
Canberra 0.24 0.05 - 0.02 0.49 0.02 0.02 0.03 0.01 0.07 0.96
Intermediate 0.52 0.01 0.07 0.01 0.19 0.00 0.03 0.03 0.07 0.19 1.12
tio
n Sydney 2.59 0.21 0.72 0.05 - 0.05 0.02 0.69 0.34 1.16 5.83
Pro
duc Intermediate 0.16 - 0.05 0.00 0.21 - 0.01 - 0.10 0.14 0.67
Newcastle 0.03 0.02 0.04 0.02 0.13 0.01 - 0.13 0.07 0.07 0.51
Intermediate 0.10 - 0.05 0.01 0.46 - 0.09 - 0.10 0.18 0.99
Gold Coast 0.02 0.02 0.01 0.02 0.24 0.01 0.01 0.12 - 0.06 0.51
Brisbane 0.27 0.06 0.12 0.13 1.52 0.05 0.07 0.24 0.14 - 2.61
Total 4.35 0.83 1.42 0.40 5.59 0.18 0.29 1.30 0.91 2.12 17.39
Note:Thetotalmaynotmatchthesumofthecellsduetorounding.
8.5.2 Operator benefitsTheintroductionofHSRwouldimpactalloperatorsofthetransportsystem.ThechangeinoperatorbenefitsasaresultofthefutureHSRprogrammeasuresthenetfarerevenueandoperatingcostsimpactsasaresultofsomecoach,railandairlinepassengerschoosingtouseHSRandnewtripsgeneratedbyHSR.
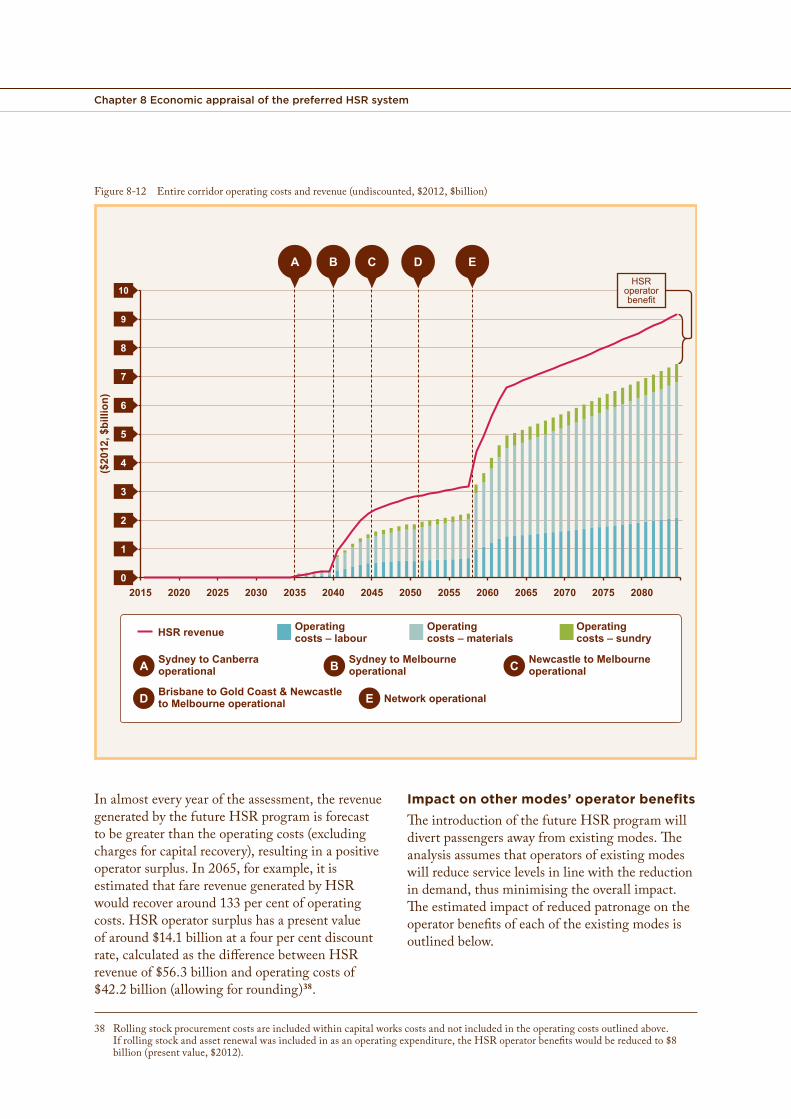
HSR operator benefitsEstimatedHSRoperatingcostsandrevenueareillustratedinFigure 8-12.TheHSRoperatorbenefitsareequaltothedifferencebetweentherevenuegeneratedbyHSRservicesandthecoststooperatetheHSRsystem.
Chapter 8 Economic appraisal of the preferred HSR system
Figure 8-12 Entire corridor operating costs and revenue (undiscounted, $2012, $billion)
0
2
1
4
3
6
5
8
7
10
9
2015 2020 2025 2030 2035 2040 2045 2050 2055 2060 2065 2070 2075 2080
HSR operator benefit
($20
12, $
billi
on)
Operating costs – sundryHSR Revenue Operating costs – materials
Operating costs – labourSydney to Canberra operational
Sydney to Melbourne operational
Newcastle to Melbourne operational
Brisbane to Gold Coast & Newcastle to Melbourne operational Network operational
A B C
D E
A B C D E
Operating costs – labour
Operating costs – materials
Operating costs – sundryHSR revenue
In almost every year of the assessment, the revenue generated by the future HSR program is forecast to be greater than the operating costs (excluding charges for capital recovery), resulting in a positive operator surplus. In 2065, for example, it is estimated that fare revenue generated by HSR would recover around 133 per cent of operating costs. HSR operator surplus has a present value of around $14.1 billion at a four per cent discount rate, calculated as the difference between HSR revenue of $56.3 billion and operating costs of $42.2 billion (allowing for rounding)38.
Impact on other modes’ operator benefitsThe introduction of the future HSR program will divert passengers away from existing modes. The analysis assumes that operators of existing modes will reduce service levels in line with the reduction in demand, thus minimising the overall impact. The estimated impact of reduced patronage on the operator benefits of each of the existing modes is outlined below.
38 Rolling stock procurement costs are included within capital works costs and not included in the operating costs outlined above. If rolling stock and asset renewal was included in as an operating expenditure, the HSR operator benefits would be reduced to $8 billion (present value, $2012).
High Speed Rail Phase 2 / 383
CoachTheCBAassumesthatacompetitivecoachindustryresultsinadirectrelationshipbetweenchangesincoachoperatingcosts,faresandthusoverallfarerevenue.Asaresult,theanalysisassumesthatthereductionincoachpatronageduetothefutureHSRprogramwouldbemetbyareductionincoachservicelevelsandthereforeoperatingcosts.TheintroductionofHSRwouldthereforeresultinanoverallproportionalreductioninthelevelofcoachoperatorbenefits.
Conventional railSimilartocoachtravel,theanalysisassumesthatthereisadirectrelationshipbetweenrailfaresonconventionalrailservicesandtheiroperatingcosts.Areductioninpatronageisthereforeassumedtoresultinaproportionatereductioninservicelevelsandthusoperatingcosts.However,conventionalrailoperations,particularlyontheNewcastletoSydneyroutewherepassengertrainsaremostlikelytobeimpactedbythefutureHSRprogram,currentlydonotrecoveralloperatingcoststhroughfarerevenue.Futureconventionalrailoperatingcostsareexpectedtobearounddoublefarerevenue.Thereductioninpatronageonconventionalrail,asaresultofHSR,therefore
resultsinareductioninoperatorbenefits,whichisoffsetbyahigherreductioninthepassengersubsidyrequirement.Thisproducesanincreaseinnetoperatorbenefitsforconventionalrail.
AviationTheintroductionofHSRwouldcompetevigorouslywithairtravel,anditislikelythattheaviationsectorwouldbethemodemostheavilyimpactedbythefutureHSRprogram.Asdiscussedearlier,theanalysisassumesthatairlinesareunlikelytocompetewithHSRbyreducingfares,butthattheywouldinsteadreducecapacitytolocationswithintheHSRcorridorwheresignificantdiversiontoHSRisforecast,witharedeploymentofsomeservicestootherlocationsatasimilarlevelofprofitability.
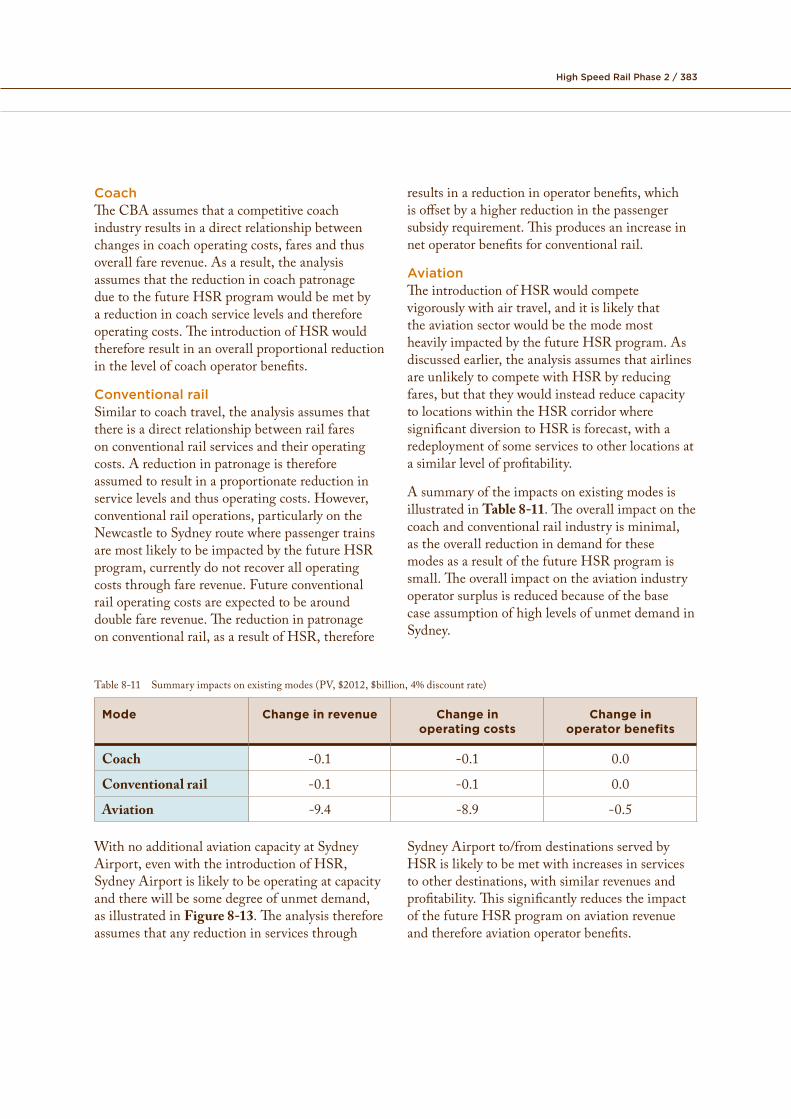
AsummaryoftheimpactsonexistingmodesisillustratedinTable 8-11.Theoverallimpactonthecoachandconventionalrailindustryisminimal,astheoverallreductionindemandforthesemodesasaresultofthefutureHSRprogramissmall.TheoverallimpactontheaviationindustryoperatorsurplusisreducedbecauseofthebasecaseassumptionofhighlevelsofunmetdemandinSydney.
Table8-11 Summaryimpactsonexistingmodes(PV,$2012,$billion,4%discountrate)
Mode Change in revenue Change in operating costs
Change in operator benefits
Coach -0.1 -0.1 0.0
Conventional rail -0.1 -0.1 0.0
Aviation -9.4 -8.9 -0.5
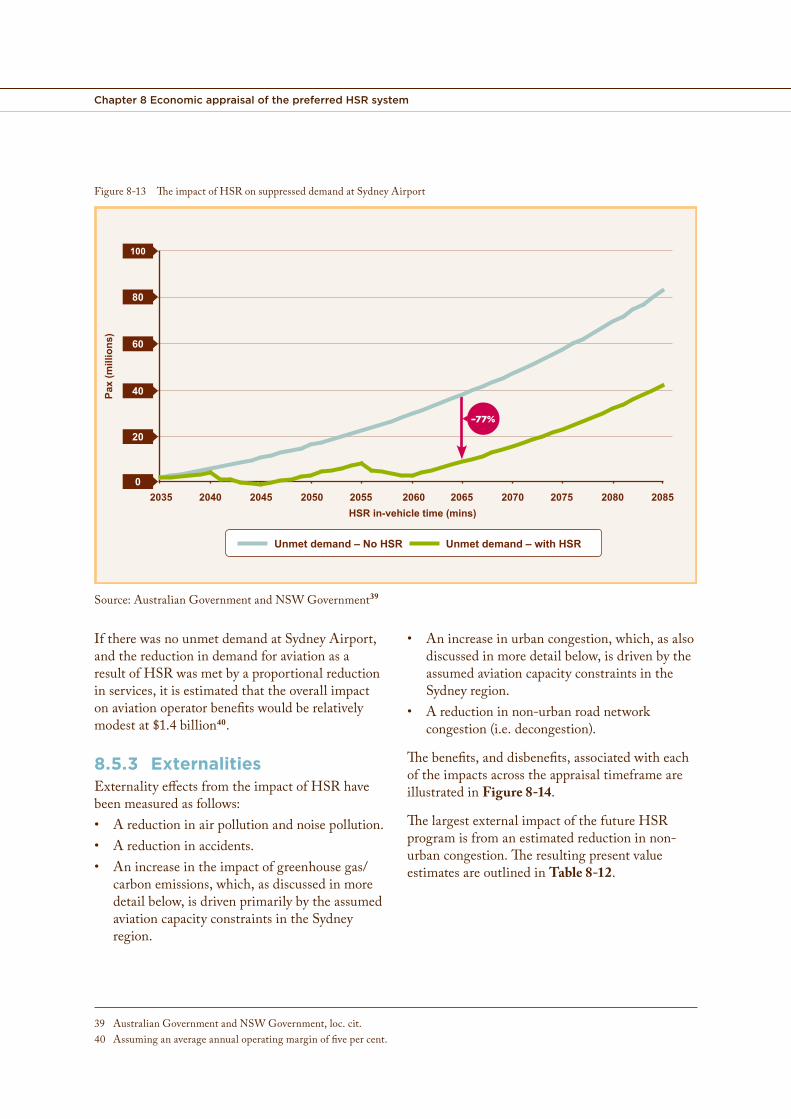
WithnoadditionalaviationcapacityatSydney SydneyAirportto/fromdestinationsservedbyAirport,evenwiththeintroductionofHSR, HSRislikelytobemetwithincreasesinservicesSydneyAirportislikelytobeoperatingatcapacity tootherdestinations,withsimilarrevenuesandandtherewillbesomedegreeofunmetdemand, profitability.ThissignificantlyreducestheimpactasillustratedinFigure 8-13.Theanalysistherefore ofthefutureHSRprogramonaviationrevenueassumesthatanyreductioninservicesthrough andthereforeaviationoperatorbenefits.
Chapter 8 Economic appraisal of the preferred HSR system
Figure 8-13 The impact of HSR on suppressed demand at Sydney Airport
0
20
40
60
80
100
–77%
HSR in-vehicle time (mins)
Pax
(mill
ions
)
2035 2040 2045 2050 2055 2060 2065 2070 2075 2080 2085
Unmet demand – No HSR Unmet demand – with HSR
Source: Australian Government and NSW Government39
If there was no unmet demand at Sydney Airport, and the reduction in demand for aviation as a result of HSR was met by a proportional reduction in services, it is estimated that the overall impact on aviation operator benefits would be relatively modest at $1.4 billion40.
8.5.3 ExternalitiesExternality effects from the impact of HSR have been measured as follows:• A reduction in air pollution and noise pollution.• A reduction in accidents.• An increase in the impact of greenhouse gas/
carbon emissions, which, as discussed in more detail below, is driven primarily by the assumed aviation capacity constraints in the Sydney region.
• An increase in urban congestion, which, as also discussed in more detail below, is driven by the assumed aviation capacity constraints in the Sydney region.
• A reduction in non-urban road network congestion (i.e. decongestion).
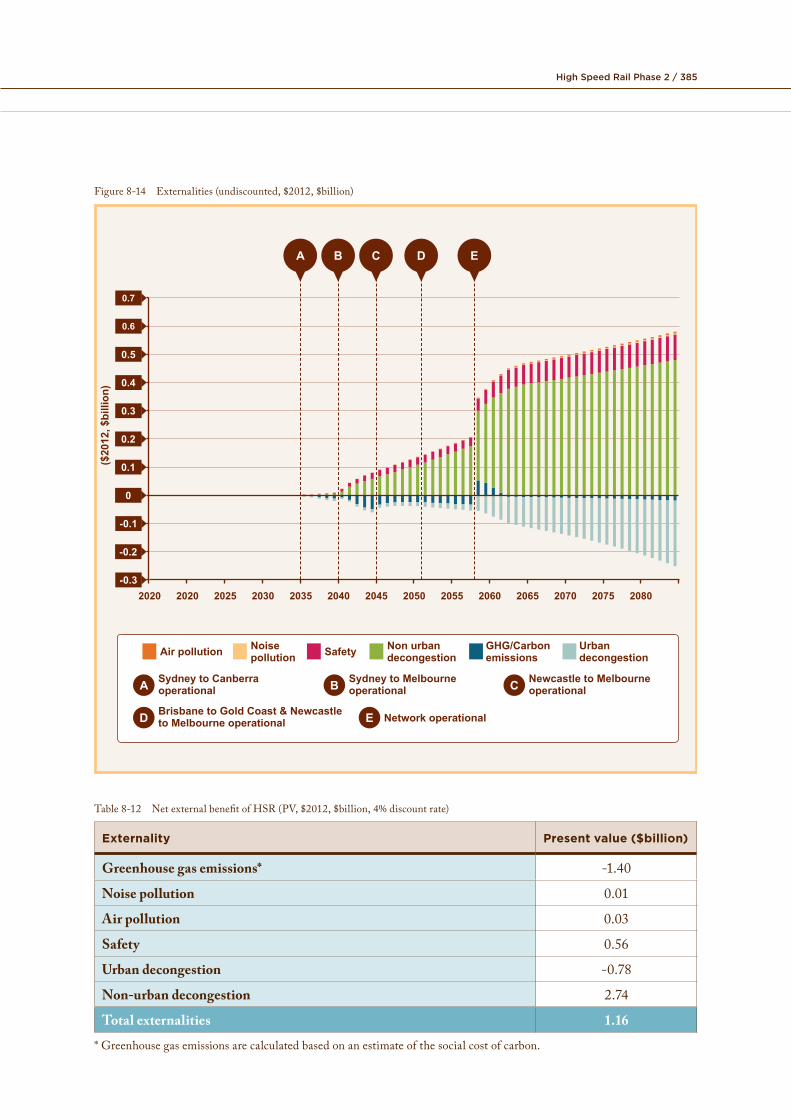
The benefits, and disbenefits, associated with each of the impacts across the appraisal timeframe are illustrated in Figure 8-14.
The largest external impact of the future HSR program is from an estimated reduction in non-urban congestion. The resulting present value estimates are outlined in Table 8-12.
39 Australian Government and NSW Government, loc. cit.40 Assuming an average annual operating margin of five per cent.
High Speed Rail Phase 2 / 385
Figure 8-14 Externalities (undiscounted, $2012, $billion)
-0.2
-0.3
0.1
0
-0.1
0.3
0.2
0.5
0.4
0.7
0.6
20202020 2025 2030 2035 2040 2045 2050 2055 2060 2065 2070 2075 2080
($20
12, $
billi
on)
Operating costs – sundryHSR Revenue Operating costs – materials
Operating costs – labourSydney to Canberra operational
Sydney to Melbourne operational
Newcastle to Melbourne operational
Brisbane to Gold Coast & Newcastle to Melbourne operational Network operational
A B C
D E
A B C D E
Noise pollutionAir pollution Non urban
decongestionSafety Urban decongestion
GHG/Carbon emissions
Table 8-12 Net external benefit of HSR (PV, $2012, $billion, 4% discount rate)
Externality Present value ($billion)
Greenhouse gas emissions* -1.40
Noise pollution 0.01
Air pollution 0.03
Safety 0.56
Urban decongestion -0.78
Non-urban decongestion 2.74
Total externalities 1.16
* Greenhouse gas emissions are calculated based on an estimate of the social cost of carbon.
Chapter 8 Economic appraisal of the preferred HSR system
Eachcategoryofexternalitiesisdiscussedfurtherbelow.
Environmental impactsHighspeedrailproduceslessgreenhousegasemissionsforagiventransporttaskthanexistingtransportmodes,particularlyaviation41.Asaresult,ashiftindemandforHSRawayfromexistingmodeswouldresultinanetreductioningreenhousegasemissions,otherthingsbeingequal,andwouldgenerateabenefitofaround$2 billionovertheappraisaltimeframe42.
However,theassumptionregardingnonewcapacityatSydneyairportmakestheassessmentmorecomplex.Asdiscussedpreviously,thereferencecaseassumestherearehighlevelsofunmetaviationdemandatSydneyAirport.Thestudythereforeassumesthatanyreductioninaviationtripsto/fromSydneyduetotheintroductionofHSRwouldbemetbyanincreaseinaviationservicesto/fromdestinationsoutsidetheHSRcorridorwhichwaspreviouslyunmetduetoalackofcapacityatSydneyAirport.ThisadditionaltravelgeneratesadditionalgreenhousegasemissionswhichoffsettheenvironmentalbenefitsofashiftintravelfromaviationtoHSR,andresultsinanetincreaseingreenhousegasemissionsandapresentvaluedisbenefitofaround$1.4billionovertheappraisaltimeframe.
TheimpactofthefutureHSRprogramonairpollutionandnoisepollutionisrelativelyminimal,generatinganestimatedpresentvaluenetbenefitof$29millionfromreducedairpollutionand$13 millionfromreducednoisepollution.
DecongestionAfutureHSRprogramwouldleadtoareductioninurbanmotortrafficbyservingthecitycentre,whichistheultimatedestinationformanytravellers(whowouldnolongerneedtotraveltherefromtheairport;insteadtheirtripwouldconsistofHSRpluspublictransportorashort
taxiride).Itwouldalsodiverttravelfromcars(whosejourneysincludeanurbancomponent)toHSRpluspublictransport.Thereductioninurbancartravelislikelytoresultinareductionincongestion.However,theassumptionregardingaviationcapacityinSydneygeneratesadditionalurbancartravelforthosetravellersaccessingtheairportthatpreviouslycouldnottravel.Whenthisadditionaltravelistakenintoconsiderationthereisanetincreaseinurbancartravelandthusanetincreaseincongestion,whichrepresentsapresentvaluedisbenefitofaround$783millionovertheappraisaltimeframe.
Thedecongestionimpactswereestimatedbasedonanassessmentoftheimpactthatthereductioninurbanmotortrafficwouldhaveonthetravelenvironmentforremainingusers.Allowancewasmadeforgeneratedmotortrafficassociatedwithprovidingaccessto/fromurbanHSRstations.Non-urbanroaddecongestionhasbeenassessedinasimilarway,byconsideringtheimpactthatareductioninnon-urbanmotortraffic,generatedasaresultofcaruserstransferringtoHSR,wouldhaveonremainingusersoftheroadnetwork.Theexpectedpresentvaluebenefitfromnon-urbandecongestionis$2.7billionovertheappraisal timeframe.
8.5.4 Residual valueAsmentionedpreviously,aresidualvaluehasbeenincludedtocapturetheremainingvalueoftheinvestmentinHSRbeyond2085.Theresidualvaluehasbeenestimatedbasedonvalue-in-use,i.e.thediscountedvalueofexpectednetbenefitsbeyond2085to210843,lessanannuityvalueforcapitalmaintenance.TheresidualvalueofHSRisestimatedtobe$25.0billion,representingaround14percentofthetotalbenefits.By2085thepopulationalongtheeastcoastofAustraliaisestimatedtobeover30millionwhichdrivessignificantlevelsofdemandforHSRandhencehighuserbenefitsandrevenueandarelativelylargeresidualvalue.
41 AsdiscussedinmoredetailinAppendix 5G,theaveragecostimpactpertonneofcarbonistwotimeshigherforaviationbecauseairlinesemitmostoftheirgreenhousegasesdirectlyintotheupperatmosphere.
42 The$2billiondiscountedbenefitovertheappraisaltimeframealsotakesintoaccounttheadditionalgreenhousegasemissionsassociatedwithinduceddemandforHSR.
43 Representing50yearsfromwhenoperationsofthelastsegmentcommence(i.e.2058).
High Speed Rail Phase 2 / 387
8.6 Sensitivity to alternative assumptionsTheresultsoftheanalysispresentapositiveeconomiccasefortheintroductionofthefutureHSRprogramandreflectanumberofimportantassumptionsandexpectations:• Stronggrowthinthebasetravelmarketover
theperiodbeforetheHSRprogrambecomesfullyoperational(travelontheeastcoastwillhavemorethandoubledfromexistinglevelsofaround152milliontripsto355milliontripsin206544)placingsignificantpressureonbase-casetransportnetworksthatwouldrelymainlyonaviationandprivatecar.
• HSRfareswouldbestructuredtobecompetitivewithalternativemodesoftransportforbothbusinessandleisurepurposes.HSRfareshavebeensettobecompetitivewithandcomparabletoairfaresonthemaininter-capitalroutesontheeastcoastandtoremainconstantafter2035.
• NoadditionalaviationcapacityintheSydneybasin,whichhastheeffectofincreasingdelayandthecostofairfares,generatinghighlevelsofunmetdemandforaviationtravel.
• Airlineservicesaremobileinthesensethatthereafewsignificantsunkcapitalcostsinservicingparticularroutes,andassetscanbereadilyredeployedtootherroutes.Inlinewithinternationalexperience,itisassumedthatairlineswouldadjustcapacitywithintheHSRcorridorratherthanreducepriceinresponsetotheintroductionofHSR.
Theimpactsoftheseassumptionsontheresultsoftheeconomicanalysisaretestedinthescenariosandsensitivitiespresentedinthissection.ImplicationsforthefinancialresultspresentedinChapter 7arealsotested.FurtheranalysisispresentedinAppendix 5B andAppendix 6B.
Inaddition,givenitiscustomarytoincludefactorsinthedemandmodellingsuchastheAlternativeSpecificConstant(ASC)andegress/accessweightswhichmayfavourafutureHSRmarketshare,
sensitivitytestingincludedtwoscenariostoexploretheimpactthatremovingtheseassumptionshasontheresults.
8.6.1 Impact of future growthAsmentionedabove,travelontheeastcoastofAustraliaisforecasttomorethandoublefromexistinglevelstoaround355milliontripsby2065.Populationandeconomicgrowtharetwokeydriversofdemandfortransport.Thepopulationandeconomicgrowthassumptionsappliedintheanalysishavebeendevelopedtorepresentthe‘mostlikely’case45.However,giventhelongtimeframefortheanalysis,thereisthepossibilitythatadifferentoutcomecouldprevail.LowandhighgrowthscenarioshavebeendevelopedtoexploretheimpactthatalternativegrowthassumptionsmayhaveontheeconomiccaseforHSR.
• The‘lowgrowth’scenarioassumesslowereconomicandpopulationgrowth(relativetothereferencecase).ThisscenarioresultsinloweroveralldemandfortransportandthuslowerdemandforHSR.PercapitaGDPgrowthratesareassumedtobe0.3percentperyearlowerthanthereferencecase,andpopulationgrowthisassumedtobe51percentbetween2010and2065,comparedto72percentinthereferencecase.
• The‘highgrowth’scenarioassumesthattheAustralianeconomyexperiencesstrongergrowthintothefuture,withhighpopulationgrowth.ThisscenarioresultsinhigheroveralldemandfortransportandthushigherdemandforHSR.PercapitaGDPgrowthratesareassumedtobe0.3percentperyearhigherthaninthereferencecase,andpopulationgrowthisassumedtobe103 percentbetween2010and2065,comparedto72percentinthereferencecase.
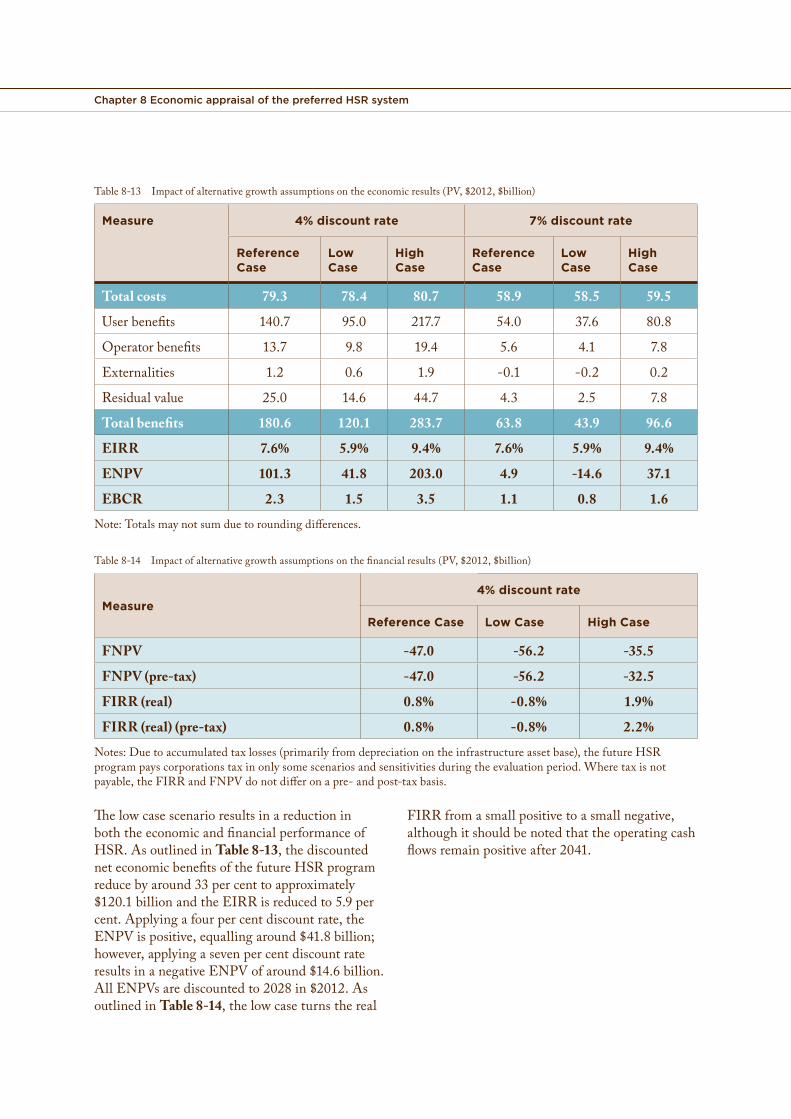
TheimpactsofthealternativegrowthscenariosontheeconomicresultsarepresentedinTable 8-13usingbothfourpercentandsevenpercentdiscountrates.Table 8-14 summarisestheimpactsofthealternativegrowthscenariosonthefinancialresultsusingafourpercentdiscountrate.
44 SeeChapter 2foradiscussionoftherelevantmarketandexpectedgrowth.45 FuturepopulationgrowthissourcedfromtheABSPopulationProjections(SeriesB)CatalogueNumber3222.0.TheGDP
projectionsarebasedonthesamemethodologyasusedintheAustralianGovernment’sIGR.Thatis,long-termprojectionsofeconomicgrowthtakecurrenteconomicconditionsandeconomicforecastsasabase.Trendgrowthratesoverthelongertermareafunctionofpopulation,productivityandparticipation(the3Psframework).
Chapter 8 Economic appraisal of the preferred HSR system
Table8-13 Impactofalternativegrowthassumptionsontheeconomicresults(PV,$2012,$billion)
Measure 4% discount rate 7% discount rate
Reference Case
Low Case
High Case
Reference Case
Low Case
High Case
Total costs 79.3 78.4 80.7 58.9 58.5 59.5
Userbenefits 140.7 95.0 217.7 54.0 37.6 80.8
Operatorbenefits 13.7 9.8 19.4 5.6 4.1 7.8
Externalities 1.2 0.6 1.9 -0.1 -0.2 0.2
Residualvalue 25.0 14.6 44.7 4.3 2.5 7.8
Total benefits 180.6 120.1 283.7 63.8 43.9 96.6
EIRR 7.6% 5.9% 9.4% 7.6% 5.9% 9.4%
ENPV 101.3 41.8 203.0 4.9 -14.6 37.1
EBCR 2.3 1.5 3.5 1.1 0.8 1.6
Note:Totalsmaynotsumduetoroundingdifferences.
Table8-14 Impactofalternativegrowthassumptionsonthefinancialresults(PV,$2012,$billion)
Measure4% discount rate
Reference Case Low Case High Case
FNPV -47.0 -56.2 -35.5
FNPV (pre-tax) -47.0 -56.2 -32.5
FIRR (real) 0.8% -0.8% 1.9%
FIRR (real) (pre-tax) 0.8% -0.8% 2.2%
Notes:Duetoaccumulatedtaxlosses(primarilyfromdepreciationontheinfrastructureassetbase),thefutureHSRprogrampayscorporationstaxinonlysomescenariosandsensitivitiesduringtheevaluationperiod.Wheretaxisnotpayable,theFIRRandFNPVdonotdifferonapre-andpost-taxbasis.
ThelowcasescenarioresultsinareductioninboththeeconomicandfinancialperformanceofHSR.AsoutlinedinTable 8-13,thediscountedneteconomicbenefitsofthefutureHSRprogramreducebyaround33 percenttoapproximately$120.1billionandtheEIRRisreducedto5.9percent.Applyingafourpercentdiscountrate,theENPVispositive,equallingaround$41.8billion;however,applyingasevenpercentdiscountrateresultsinanegativeENPVofaround$14.6billion.AllENPVsarediscountedto2028in$2012.AsoutlinedinTable 8-14,thelowcaseturnsthereal
FIRRfromasmallpositivetoasmallnegative,althoughitshouldbenotedthattheoperatingcashflowsremainpositiveafter2041.
High Speed Rail Phase 2 / 389
ThehighcasescenarioimprovesboththeeconomicandfinancialperformanceofHSR.AsoutlinedinTable 8-13,thehighcasescenarioincreasesthediscountedneteconomicbenefitsbyafactorof56 percentand,asaresult,theEIRRincreasesto9.4 percent.TheENPVisequallypositivebyapplyingafourpercentandsevenpercentdiscountrate,resultingin$203.0billionand$37.1 billionrespectively.AllENPVsarediscountedto2028in$2012.Similarly,asoutlinedinTable 8-14,thehighcaseonlymarginallyimprovestheoverallfinancialreturn(from0.8percentto1.9percent)andstillleavesitwellshortoftherequirementsofcommercialinvestors.
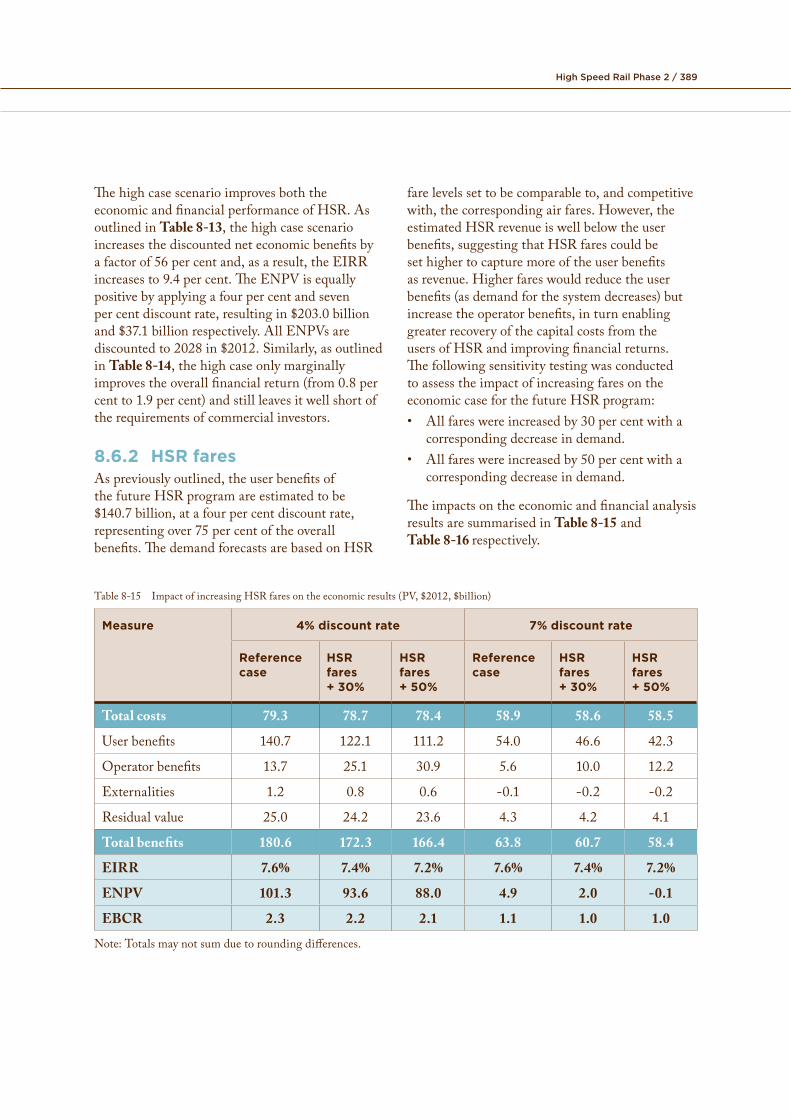
8.6.2 HSR faresAspreviouslyoutlined,theuserbenefitsofthefutureHSRprogramareestimatedtobe$140.7billion,atafourpercentdiscountrate,representingover75percentoftheoverallbenefits.ThedemandforecastsarebasedonHSR
farelevelssettobecomparableto,andcompetitivewith,thecorrespondingairfares.However,theestimatedHSRrevenueiswellbelowtheuserbenefits,suggestingthatHSRfarescouldbesethighertocapturemoreoftheuserbenefitsasrevenue.Higherfareswouldreducetheuserbenefits(asdemandforthesystemdecreases)butincreasetheoperatorbenefits,inturnenablinggreaterrecoveryofthecapitalcostsfromtheusersofHSRandimprovingfinancialreturns.ThefollowingsensitivitytestingwasconductedtoassesstheimpactofincreasingfaresontheeconomiccaseforthefutureHSRprogram:• Allfareswereincreasedby30percentwitha
correspondingdecreaseindemand.• Allfareswereincreasedby50percentwitha
correspondingdecreaseindemand.
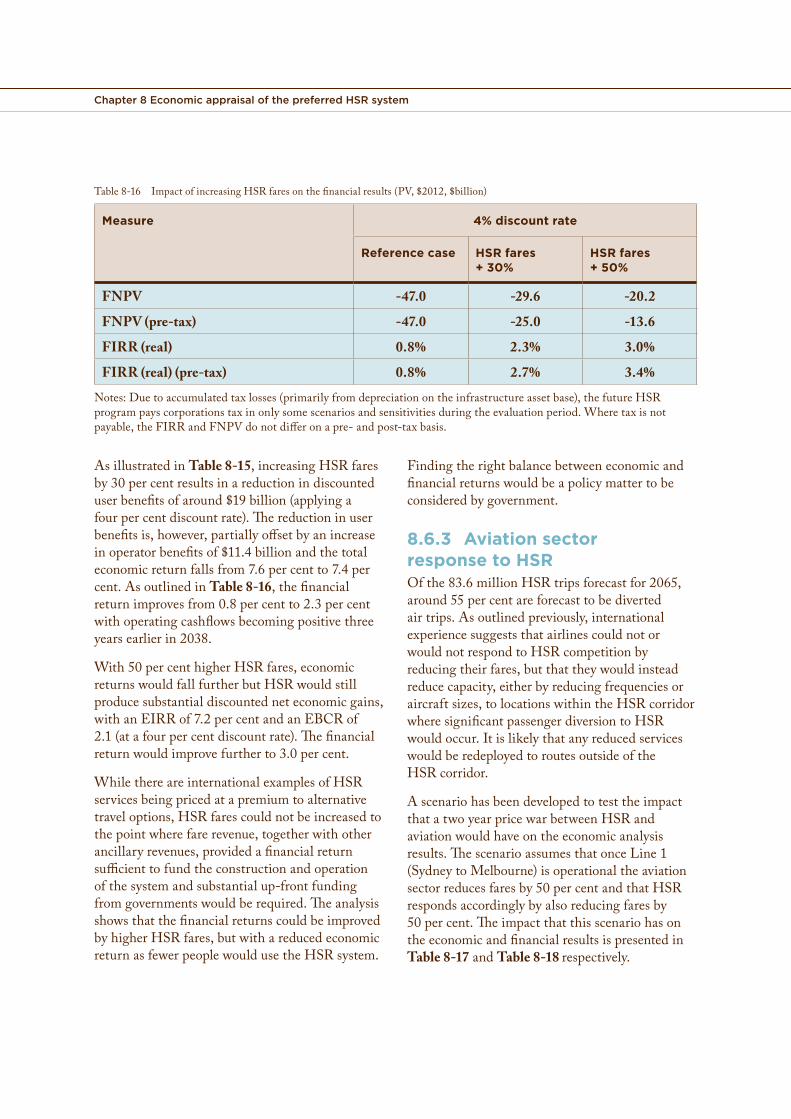
TheimpactsontheeconomicandfinancialanalysisresultsaresummarisedinTable 8-15andTable 8-16 respectively.
Table8-15 ImpactofincreasingHSRfaresontheeconomicresults(PV,$2012,$billion)
Measure 4% discount rate 7% discount rate
Reference case
HSR fares + 30%
HSR fares + 50%
Reference case
HSR fares + 30%
HSR fares + 50%
Total costs 79.3 78.7 78.4 58.9 58.6 58.5
Userbenefits 140.7 122.1 111.2 54.0 46.6 42.3
Operatorbenefits 13.7 25.1 30.9 5.6 10.0 12.2
Externalities 1.2 0.8 0.6 -0.1 -0.2 -0.2
Residualvalue 25.0 24.2 23.6 4.3 4.2 4.1
Total benefits 180.6 172.3 166.4 63.8 60.7 58.4
EIRR 7.6% 7.4% 7.2% 7.6% 7.4% 7.2%
ENPV 101.3 93.6 88.0 4.9 2.0 -0.1
EBCR 2.3 2.2 2.1 1.1 1.0 1.0
Note:Totalsmaynotsumduetoroundingdifferences.
Chapter 8 Economic appraisal of the preferred HSR system
Table8-16 ImpactofincreasingHSRfaresonthefinancialresults(PV,$2012,$billion)
Measure 4% discount rate
Reference case HSR fares + 30%
HSR fares + 50%
FNPV -47.0 -29.6 -20.2
FNPV (pre-tax) -47.0 -25.0 -13.6
FIRR (real) 0.8% 2.3% 3.0%
FIRR (real) (pre-tax) 0.8% 2.7% 3.4%
Notes:Duetoaccumulatedtaxlosses(primarilyfromdepreciationontheinfrastructureassetbase),thefutureHSRprogrampayscorporationstaxinonlysomescenariosandsensitivitiesduringtheevaluationperiod.Wheretaxisnotpayable,theFIRRandFNPVdonotdifferonapre-andpost-taxbasis.
AsillustratedinTable 8-15,increasingHSRfaresby30percentresultsinareductionindiscounteduserbenefitsofaround$19billion(applyingafourpercentdiscountrate).Thereductioninuserbenefitsis,however,partiallyoffsetbyanincreaseinoperatorbenefitsof$11.4billionandthetotaleconomicreturnfallsfrom7.6percentto7.4percent.AsoutlinedinTable 8-16,thefinancialreturnimprovesfrom0.8percentto2.3percentwithoperatingcashflowsbecomingpositivethreeyearsearlierin2038.
With50percenthigherHSRfares,economicreturnswouldfallfurtherbutHSRwouldstillproducesubstantialdiscountedneteconomicgains,withanEIRRof7.2percentandanEBCRof2.1(atafourpercentdiscountrate).Thefinancialreturnwouldimprovefurtherto3.0percent.
WhilethereareinternationalexamplesofHSRservicesbeingpricedatapremiumtoalternativetraveloptions,HSRfarescouldnotbeincreasedtothepointwherefarerevenue,togetherwithotherancillaryrevenues,providedafinancialreturnsufficienttofundtheconstructionandoperationofthesystemandsubstantialup-frontfundingfromgovernmentswouldberequired.TheanalysisshowsthatthefinancialreturnscouldbeimprovedbyhigherHSRfares,butwithareducedeconomicreturnasfewerpeoplewouldusetheHSRsystem.
Findingtherightbalancebetweeneconomicandfinancialreturnswouldbeapolicymattertobeconsideredbygovernment.
8.6.3 Aviation sector response to HSROfthe83.6millionHSRtripsforecastfor2065,around55percentareforecasttobedivertedairtrips.Asoutlinedpreviously,internationalexperiencesuggeststhatairlinescouldnotorwouldnotrespondtoHSRcompetitionbyreducingtheirfares,butthattheywouldinsteadreducecapacity,eitherbyreducingfrequenciesoraircraftsizes,tolocationswithintheHSRcorridorwheresignificantpassengerdiversiontoHSRwouldoccur.ItislikelythatanyreducedserviceswouldberedeployedtoroutesoutsideoftheHSRcorridor.
AscenariohasbeendevelopedtotesttheimpactthatatwoyearpricewarbetweenHSRandaviationwouldhaveontheeconomicanalysisresults.ThescenarioassumesthatonceLine1(SydneytoMelbourne)isoperationaltheaviationsectorreducesfaresby50percentandthatHSRrespondsaccordinglybyalsoreducingfaresby50percent.TheimpactthatthisscenariohasontheeconomicandfinancialresultsispresentedinTable 8-17andTable 8-18 respectively.
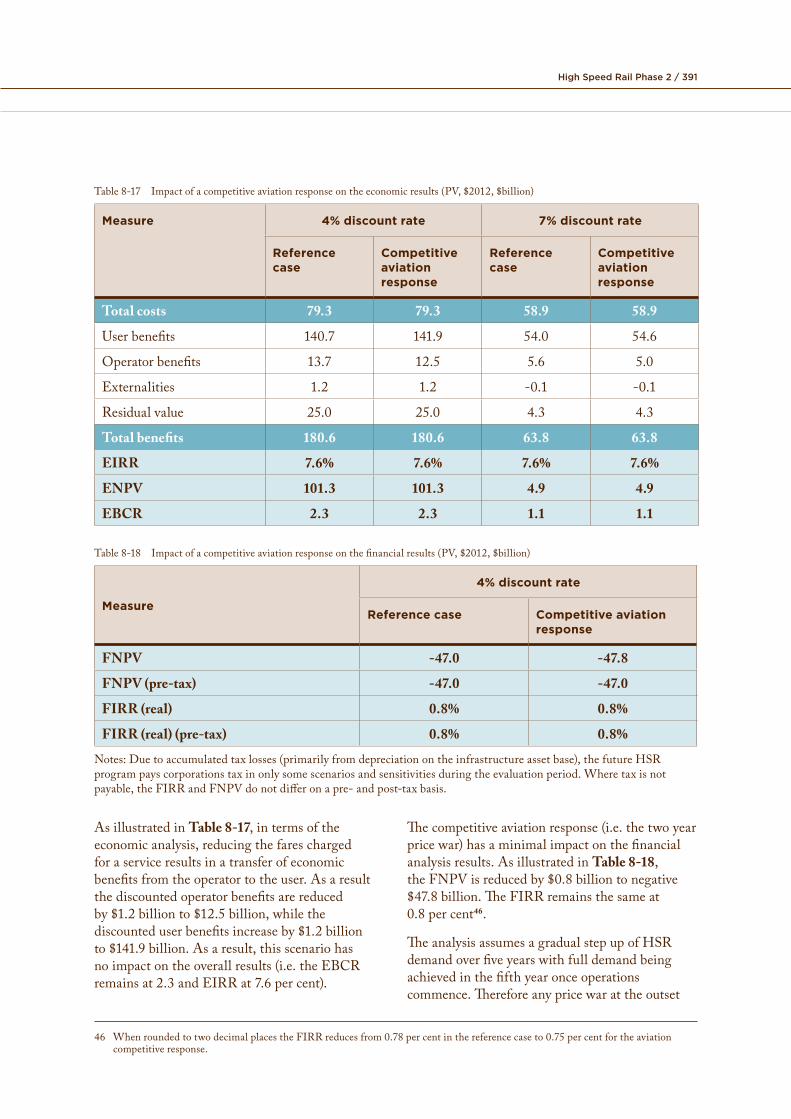
High Speed Rail Phase 2 / 391
Table8-17 Impactofacompetitiveaviationresponseontheeconomicresults(PV,$2012,$billion)
Measure 4% discount rate 7% discount rate
Reference Competitive Reference Competitive case aviation case aviation
response response
Total costs 79.3 79.3 58.9 58.9
Userbenefits 140.7 141.9 54.0 54.6
Operatorbenefits 13.7 12.5 5.6 5.0
Externalities 1.2 1.2 -0.1 -0.1
Residualvalue 25.0 25.0 4.3 4.3
Total benefits 180.6 180.6 63.8 63.8
EIRR 7.6% 7.6% 7.6% 7.6%
ENPV 101.3 101.3 4.9 4.9
EBCR 2.3 2.3 1.1 1.1
Table8-18 Impactofacompetitiveaviationresponseonthefinancialresults(PV,$2012,$billion)
Measure
4% discount rate
Reference case Competitive aviation response
FNPV -47.0 -47.8
FNPV (pre-tax) -47.0 -47.0
FIRR (real) 0.8% 0.8%
FIRR (real) (pre-tax) 0.8% 0.8%
Notes:Duetoaccumulatedtaxlosses(primarilyfromdepreciationontheinfrastructureassetbase),thefutureHSRprogrampayscorporationstaxinonlysomescenariosandsensitivitiesduringtheevaluationperiod.Wheretaxisnotpayable,theFIRRandFNPVdonotdifferonapre-andpost-taxbasis.
AsillustratedinTable 8-17,intermsofthe Thecompetitiveaviationresponse(i.e.thetwoyeareconomicanalysis,reducingthefarescharged pricewar)hasaminimalimpactonthefinancialforaserviceresultsinatransferofeconomic analysisresults.AsillustratedinTable 8-18,benefitsfromtheoperatortotheuser.Asaresult theFNPVisreducedby$0.8billiontonegativethediscountedoperatorbenefitsarereduced $47.8 billion.TheFIRRremainsthesameatby$1.2 billionto$12.5billion,whilethe 0.8 percent46.discounteduserbenefitsincreaseby$1.2 billion
TheanalysisassumesagradualstepupofHSRto$141.9 billion.Asaresult,thisscenariohasdemandoverfiveyearswithfulldemandbeingnoimpactontheoverallresults(i.e.theEBCRachievedinthefifthyearonceoperationsremainsat2.3andEIRRat7.6percent).commence.Thereforeanypricewarattheoutset
46 WhenroundedtotwodecimalplacestheFIRRreducesfrom0.78percentinthereferencecaseto0.75percentfortheaviationcompetitiveresponse.
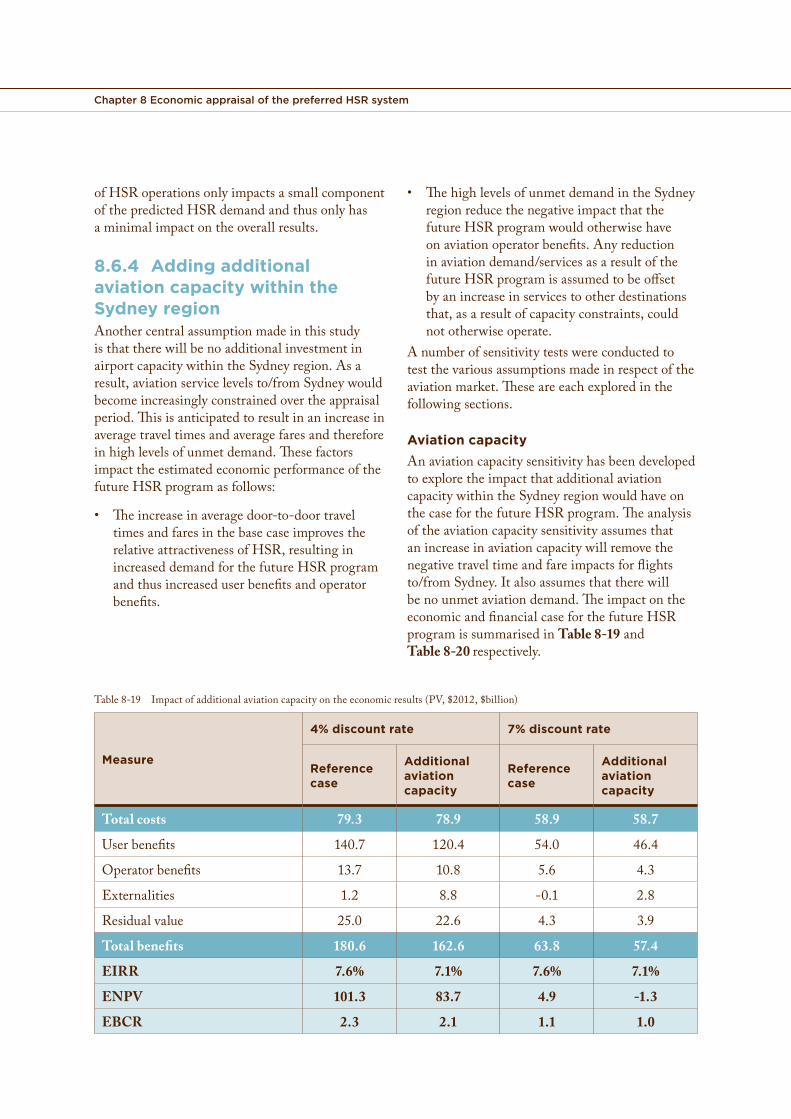
Chapter 8 Economic appraisal of the preferred HSR system
ofHSRoperationsonlyimpactsasmallcomponentofthepredictedHSRdemandandthusonlyhasaminimalimpactontheoverallresults.
8.6.4 Adding additional aviation capacity within the Sydney regionAnothercentralassumptionmadeinthisstudyisthattherewillbenoadditionalinvestmentinairportcapacitywithintheSydneyregion.Asaresult,aviationservicelevelsto/fromSydneywouldbecomeincreasinglyconstrainedovertheappraisalperiod.Thisisanticipatedtoresultinanincreaseinaveragetraveltimesandaveragefaresandthereforeinhighlevelsofunmetdemand.ThesefactorsimpacttheestimatedeconomicperformanceofthefutureHSRprogramasfollows:
• Theincreaseinaveragedoor-to-doortraveltimesandfaresinthebasecaseimprovestherelativeattractivenessofHSR,resultinginincreaseddemandforthefutureHSRprogramandthusincreaseduserbenefitsandoperatorbenefits.
• ThehighlevelsofunmetdemandintheSydneyregionreducethenegativeimpactthatthefutureHSRprogramwouldotherwisehaveonaviationoperatorbenefits.Anyreductioninaviationdemand/servicesasaresultofthefutureHSRprogramisassumedtobeoffsetbyanincreaseinservicestootherdestinationsthat,asaresultofcapacityconstraints,couldnototherwiseoperate.
Anumberofsensitivitytestswereconductedtotestthevariousassumptionsmadeinrespectoftheaviationmarket.Theseareeachexploredinthefollowingsections.
Aviation capacity AnaviationcapacitysensitivityhasbeendevelopedtoexploretheimpactthatadditionalaviationcapacitywithintheSydneyregionwouldhaveonthecaseforthefutureHSRprogram.Theanalysisoftheaviationcapacitysensitivityassumesthatanincreaseinaviationcapacitywillremovethenegativetraveltimeandfareimpactsforflightsto/fromSydney.Italsoassumesthattherewillbenounmetaviationdemand.TheimpactontheeconomicandfinancialcaseforthefutureHSRprogramissummarisedinTable 8-19andTable 8-20 respectively.
Table8-19 Impactofadditionalaviationcapacityontheeconomicresults(PV,$2012,$billion)
4% discount rate 7% discount rate
Measure Additional Additional Reference Reference aviation aviation case casecapacity capacity
Total costs 79.3 78.9 58.9 58.7
Userbenefits 140.7 120.4 54.0 46.4
Operatorbenefits 13.7 10.8 5.6 4.3
Externalities 1.2 8.8 -0.1 2.8
Residualvalue 25.0 22.6 4.3 3.9
Total benefits 180.6 162.6 63.8 57.4
EIRR 7.6% 7.1% 7.6% 7.1%
ENPV 101.3 83.7 4.9 -1.3
EBCR 2.3 2.1 1.1 1.0
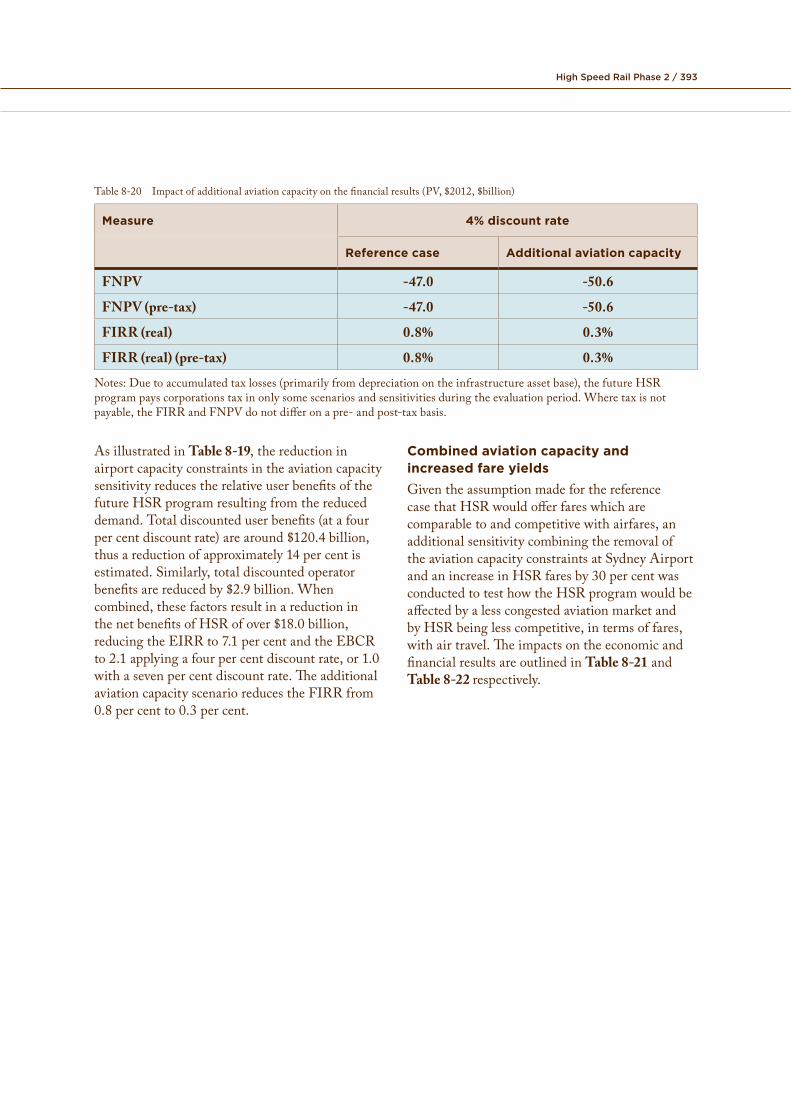
High Speed Rail Phase 2 / 393
Table8-20 Impactofadditionalaviationcapacityonthefinancialresults(PV,$2012,$billion)
Measure 4% discount rate
Reference case Additional aviation capacity
FNPV -47.0 -50.6
FNPV (pre-tax) -47.0 -50.6
FIRR (real) 0.8% 0.3%
FIRR (real) (pre-tax) 0.8% 0.3%
Notes:Duetoaccumulatedtaxlosses(primarilyfromdepreciationontheinfrastructureassetbase),thefutureHSRprogrampayscorporationstaxinonlysomescenariosandsensitivitiesduringtheevaluationperiod.Wheretaxisnotpayable,theFIRRandFNPVdonotdifferonapre-andpost-taxbasis.
AsillustratedinTable 8-19,thereductioninairportcapacityconstraintsintheaviationcapacitysensitivityreducestherelativeuserbenefitsofthefutureHSRprogramresultingfromthereduceddemand.Totaldiscounteduserbenefits(atafourpercentdiscountrate)arearound$120.4billion,thusareductionofapproximately14percentisestimated.Similarly,totaldiscountedoperatorbenefitsarereducedby$2.9billion.Whencombined,thesefactorsresultinareductioninthenetbenefitsofHSRofover$18.0billion,reducingtheEIRRto7.1percentandtheEBCRto2.1applyingafourpercentdiscountrate,or1.0withasevenpercentdiscountrate.TheadditionalaviationcapacityscenarioreducestheFIRRfrom0.8percentto0.3percent.
Combined aviation capacity and increased fare yieldsGiventheassumptionmadeforthereferencecasethatHSRwouldofferfareswhicharecomparabletoandcompetitivewithairfares,anadditionalsensitivitycombiningtheremovaloftheaviationcapacityconstraintsatSydneyAirportandanincreaseinHSRfaresby30percentwasconductedtotesthowtheHSRprogramwouldbeaffectedbyalesscongestedaviationmarketandbyHSRbeinglesscompetitive,intermsoffares,withairtravel.TheimpactsontheeconomicandfinancialresultsareoutlinedinTable 8-21andTable 8-22 respectively.
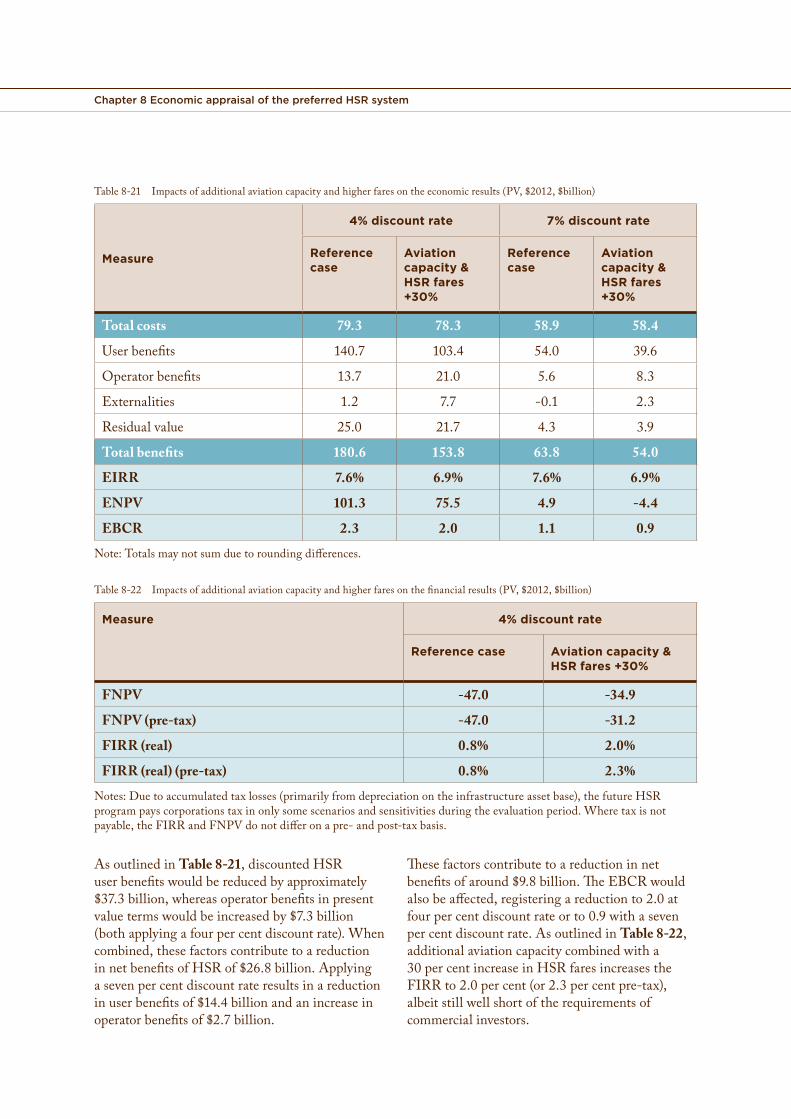
Chapter 8 Economic appraisal of the preferred HSR system
Table8-21 Impactsofadditionalaviationcapacityandhigherfaresontheeconomicresults(PV,$2012,$billion)
Measure
4% discount rate 7% discount rate
Reference case
Aviation capacity & HSR fares +30%
Reference case
Aviation capacity & HSR fares +30%
Total costs 79.3 78.3 58.9 58.4
Userbenefits 140.7 103.4 54.0 39.6
Operatorbenefits 13.7 21.0 5.6 8.3
Externalities 1.2 7.7 -0.1 2.3
Residualvalue 25.0 21.7 4.3 3.9
Total benefits 180.6 153.8 63.8 54.0
EIRR 7.6% 6.9% 7.6% 6.9%
ENPV 101.3 75.5 4.9 -4.4
EBCR 2.3 2.0 1.1 0.9
Note:Totalsmaynotsumduetoroundingdifferences.
Table8-22 Impactsofadditionalaviationcapacityandhigherfaresonthefinancialresults(PV,$2012,$billion)
Measure 4% discount rate
Reference case Aviation capacity & HSR fares +30%
FNPV -47.0 -34.9
FNPV (pre-tax) -47.0 -31.2
FIRR (real) 0.8% 2.0%
FIRR (real) (pre-tax) 0.8% 2.3%
Notes:Duetoaccumulatedtaxlosses(primarilyfromdepreciationontheinfrastructureassetbase),thefutureHSRprogrampayscorporationstaxinonlysomescenariosandsensitivitiesduringtheevaluationperiod.Wheretaxisnotpayable,theFIRRandFNPVdonotdifferonapre-andpost-taxbasis.
AsoutlinedinTable 8-21,discountedHSR Thesefactorscontributetoareductioninnetuserbenefitswouldbereducedbyapproximately benefitsofaround$9.8billion.TheEBCRwould$37.3 billion,whereasoperatorbenefitsinpresent alsobeaffected,registeringareductionto2.0atvaluetermswouldbeincreasedby$7.3billion fourpercentdiscountrateorto0.9withaseven(bothapplyingafourpercentdiscountrate).When percentdiscountrate.AsoutlinedinTable 8-22,combined,thesefactorscontributetoareduction additionalaviationcapacitycombinedwithainnetbenefitsofHSRof$26.8billion.Applying 30 percentincreaseinHSRfaresincreasestheasevenpercentdiscountrateresultsinareduction FIRRto2.0percent(or2.3percentpre-tax),inuserbenefitsof$14.4 billionandanincreasein albeitstillwellshortoftherequirementsofoperatorbenefitsof$2.7billion. commercialinvestors.
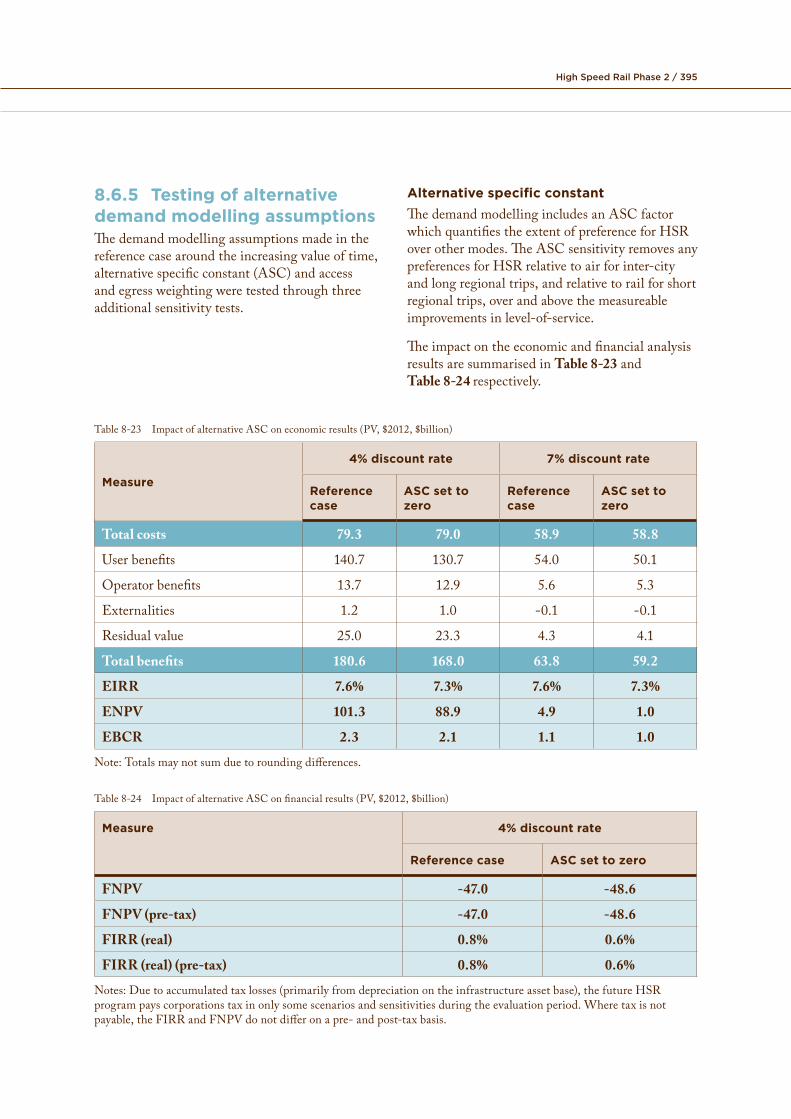
High Speed Rail Phase 2 / 395
8.6.5 Testing of alternative demand modelling assumptions Thedemandmodellingassumptionsmadeinthereferencecasearoundtheincreasingvalueoftime,alternativespecificconstant(ASC)andaccessandegressweightingweretestedthroughthreeadditionalsensitivitytests.
Alternative specific constant ThedemandmodellingincludesanASCfactorwhichquantifiestheextentofpreferenceforHSRoverothermodes.TheASCsensitivityremovesanypreferencesforHSRrelativetoairforinter-cityandlongregionaltrips,andrelativetorailforshortregionaltrips,overandabovethemeasureableimprovementsinlevel-of-service.
TheimpactontheeconomicandfinancialanalysisresultsaresummarisedinTable 8-23andTable 8-24 respectively.
Table8-23 ImpactofalternativeASConeconomicresults(PV,$2012,$billion)
Measure
4% discount rate 7% discount rate
Reference case
ASC set to zero
Reference case
ASC set to zero
Total costs 79.3 79.0 58.9 58.8
Userbenefits 140.7 130.7 54.0 50.1
Operatorbenefits 13.7 12.9 5.6 5.3
Externalities 1.2 1.0 -0.1 -0.1
Residualvalue 25.0 23.3 4.3 4.1
Total benefits 180.6 168.0 63.8 59.2
EIRR 7.6% 7.3% 7.6% 7.3%
ENPV 101.3 88.9 4.9 1.0
EBCR 2.3 2.1 1.1 1.0
Note:Totalsmaynotsumduetoroundingdifferences.
Table8-24 ImpactofalternativeASConfinancialresults(PV,$2012,$billion)
Measure 4% discount rate
Reference case ASC set to zero
FNPV -47.0 -48.6
FNPV (pre-tax) -47.0 -48.6
FIRR (real) 0.8% 0.6%
FIRR (real) (pre-tax) 0.8% 0.6%
Notes:Duetoaccumulatedtaxlosses(primarilyfromdepreciationontheinfrastructureassetbase),thefutureHSRprogrampayscorporationstaxinonlysomescenariosandsensitivitiesduringtheevaluationperiod.Wheretaxisnotpayable,theFIRRandFNPVdonotdifferonapre-andpost-taxbasis.
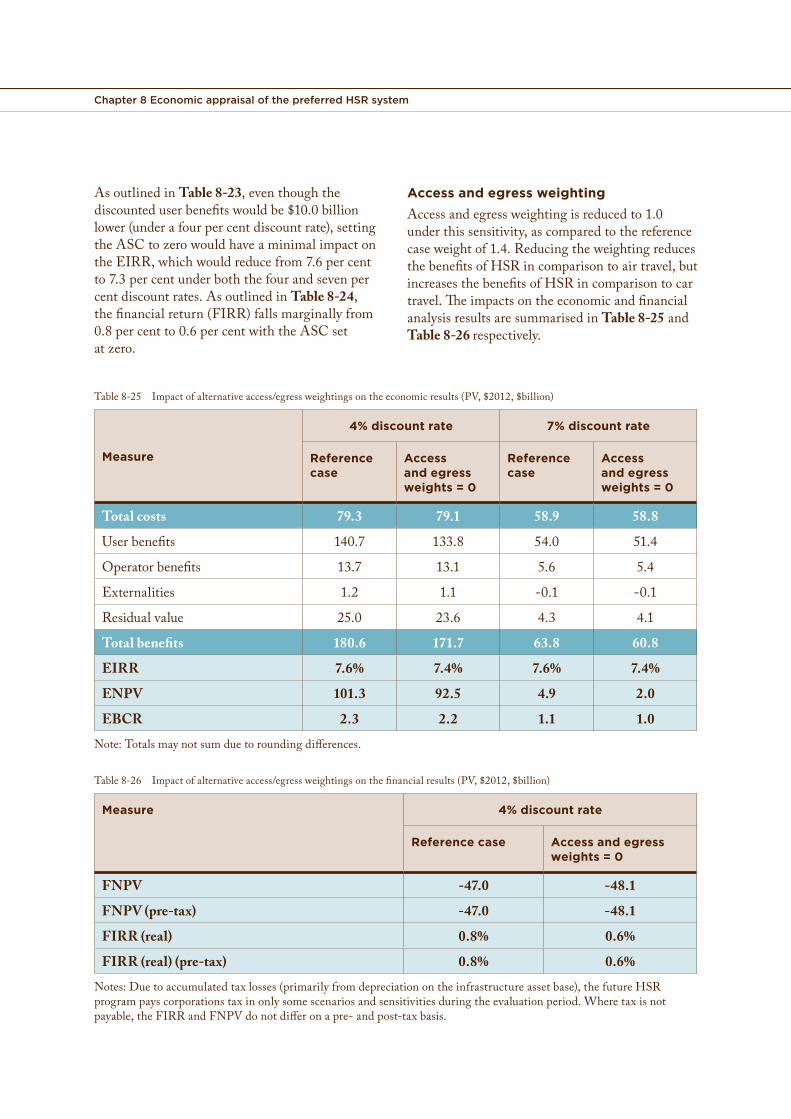
Chapter 8 Economic appraisal of the preferred HSR system
AsoutlinedinTable 8-23,eventhoughthediscounteduserbenefitswouldbe$10.0billionlower(underafourpercentdiscountrate),settingtheASCtozerowouldhaveaminimalimpactontheEIRR,whichwouldreducefrom7.6percentto7.3percentunderboththefourandsevenpercentdiscountrates.AsoutlinedinTable 8-24,thefinancialreturn(FIRR)fallsmarginallyfrom0.8 percentto0.6percentwiththeASCsetatzero.
Access and egress weightingAccessandegressweightingisreducedto1.0underthissensitivity,ascomparedtothereferencecaseweightof1.4.ReducingtheweightingreducesthebenefitsofHSRincomparisontoairtravel,butincreasesthebenefitsofHSRincomparisontocartravel.TheimpactsontheeconomicandfinancialanalysisresultsaresummarisedinTable 8-25andTable 8-26 respectively.
Table8-25 Impactofalternativeaccess/egressweightingsontheeconomicresults(PV,$2012,$billion)
4% discount rate 7% discount rate
Measure Reference Access Reference Access case and egress case and egress
weights = 0 weights = 0
Total costs 79.3 79.1 58.9 58.8
Userbenefits 140.7 133.8 54.0 51.4
Operatorbenefits 13.7 13.1 5.6 5.4
Externalities 1.2 1.1 -0.1 -0.1
Residualvalue 25.0 23.6 4.3 4.1
Total benefits 180.6 171.7 63.8 60.8
EIRR 7.6% 7.4% 7.6% 7.4%
ENPV 101.3 92.5 4.9 2.0
EBCR 2.3 2.2 1.1 1.0
Note:Totalsmaynotsumduetoroundingdifferences.
Table8-26 Impactofalternativeaccess/egressweightingsonthefinancialresults(PV,$2012,$billion)
Measure 4% discount rate
Reference case Access and egress weights = 0
FNPV -47.0 -48.1
FNPV (pre-tax) -47.0 -48.1
FIRR (real) 0.8% 0.6%
FIRR (real) (pre-tax) 0.8% 0.6%
Notes:Duetoaccumulatedtaxlosses(primarilyfromdepreciationontheinfrastructureassetbase),thefutureHSRprogrampayscorporationstaxinonlysomescenariosandsensitivitiesduringtheevaluationperiod.Wheretaxisnotpayable,theFIRRandFNPVdonotdifferonapre-andpost-taxbasis.
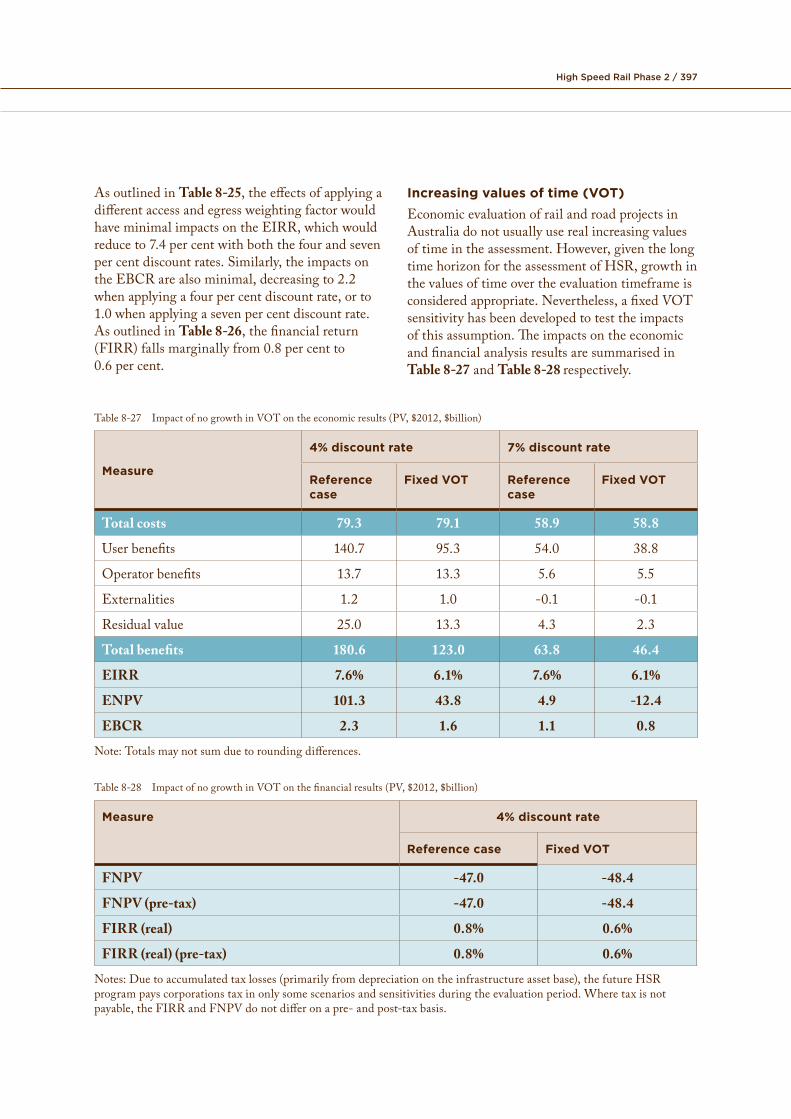
High Speed Rail Phase 2 / 397
AsoutlinedinTable 8-25,theeffectsofapplyingadifferentaccessandegressweightingfactorwouldhaveminimalimpactsontheEIRR,whichwouldreduceto7.4percentwithboththefourandsevenpercentdiscountrates.Similarly,theimpactsontheEBCRarealsominimal,decreasingto2.2whenapplyingafourpercentdiscountrate,orto1.0whenapplyingasevenpercentdiscountrate.AsoutlinedinTable 8-26,thefinancialreturn(FIRR)fallsmarginallyfrom0.8percentto0.6percent.
Increasing values of time (VOT)EconomicevaluationofrailandroadprojectsinAustraliadonotusuallyuserealincreasingvaluesoftimeintheassessment.However,giventhelongtimehorizonfortheassessmentofHSR,growthinthevaluesoftimeovertheevaluationtimeframeisconsideredappropriate.Nevertheless,afixedVOTsensitivityhasbeendevelopedtotesttheimpactsofthisassumption.TheimpactsontheeconomicandfinancialanalysisresultsaresummarisedinTable 8-27andTable 8-28 respectively.
Table8-27 ImpactofnogrowthinVOTontheeconomicresults(PV,$2012,$billion)
Measure
4% discount rate 7% discount rate
Reference case
Fixed VOT Reference case
Fixed VOT
Total costs 79.3 79.1 58.9 58.8
Userbenefits 140.7 95.3 54.0 38.8
Operatorbenefits 13.7 13.3 5.6 5.5
Externalities 1.2 1.0 -0.1 -0.1
Residualvalue 25.0 13.3 4.3 2.3
Total benefits 180.6 123.0 63.8 46.4
EIRR 7.6% 6.1% 7.6% 6.1%
ENPV 101.3 43.8 4.9 -12.4
EBCR 2.3 1.6 1.1 0.8
Note:Totalsmaynotsumduetoroundingdifferences.
Table8-28 ImpactofnogrowthinVOTonthefinancialresults(PV,$2012,$billion)
Measure 4% discount rate
Reference case Fixed VOT
-48.4FNPV -47.0
FNPV (pre-tax) -47.0 -48.4
FIRR (real) 0.8% 0.6%
FIRR (real) (pre-tax) 0.8% 0.6%
Notes:Duetoaccumulatedtaxlosses(primarilyfromdepreciationontheinfrastructureassetbase),thefutureHSRprogrampayscorporationstaxinonlysomescenariosandsensitivitiesduringtheevaluationperiod.Wheretaxisnotpayable,theFIRRandFNPVdonotdifferonapre-andpost-taxbasis.
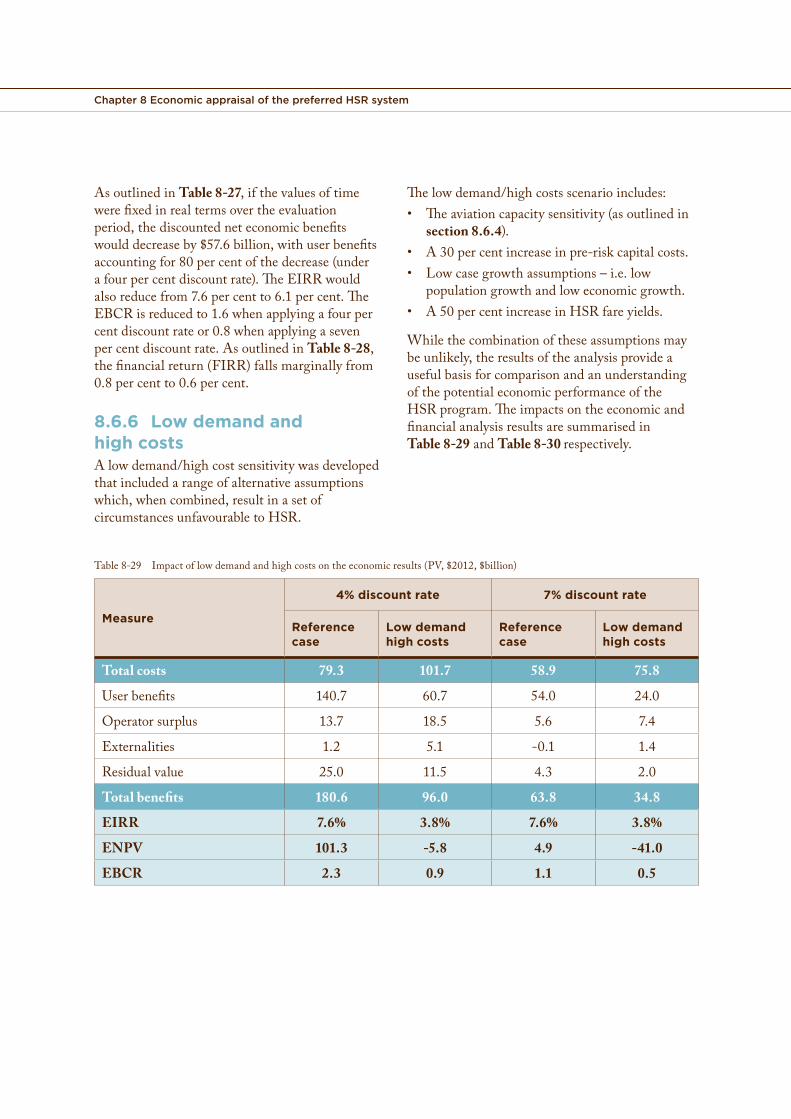
Chapter 8 Economic appraisal of the preferred HSR system
AsoutlinedinTable 8-27,ifthevaluesoftimewerefixedinrealtermsovertheevaluationperiod,thediscountedneteconomicbenefitswoulddecreaseby$57.6billion,withuserbenefitsaccountingfor80percentofthedecrease(underafourpercentdiscountrate).TheEIRRwouldalsoreducefrom7.6percentto6.1 percent.TheEBCRisreducedto1.6whenapplyingafourpercentdiscountrateor0.8whenapplyingasevenpercentdiscountrate.AsoutlinedinTable 8-28,thefinancialreturn(FIRR)fallsmarginallyfrom0.8 percentto0.6percent.
8.6.6 Low demand and high costsAlowdemand/highcostsensitivitywasdevelopedthatincludedarangeofalternativeassumptionswhich,whencombined,resultinasetofcircumstancesunfavourabletoHSR.
Thelowdemand/highcostsscenarioincludes:• Theaviationcapacitysensitivity(asoutlinedin
section 8.6.4).• A30percentincreaseinpre-riskcapitalcosts.• Lowcasegrowthassumptions–i.e.low
populationgrowthandloweconomicgrowth.• A50percentincreaseinHSRfareyields.
Whilethecombinationoftheseassumptionsmaybeunlikely,theresultsoftheanalysisprovideausefulbasisforcomparisonandanunderstandingofthepotentialeconomicperformanceoftheHSRprogram.TheimpactsontheeconomicandfinancialanalysisresultsaresummarisedinTable 8-29andTable 8-30 respectively.
Table8-29 Impactoflowdemandandhighcostsontheeconomicresults(PV,$2012,$billion)
4% discount rate 7% discount rate
MeasureReference Low demand Reference Low demand case high costs case high costs
Total costs 79.3 101.7 58.9 75.8
Userbenefits 140.7 60.7 54.0 24.0
Operatorsurplus 13.7 18.5 5.6 7.4
Externalities 1.2 5.1 -0.1 1.4
Residualvalue 25.0 11.5 4.3 2.0
Total benefits 180.6 96.0 63.8 34.8
EIRR 7.6% 3.8% 7.6% 3.8%
ENPV 101.3 -5.8 4.9 -41.0
EBCR 2.3 0.9 1.1 0.5
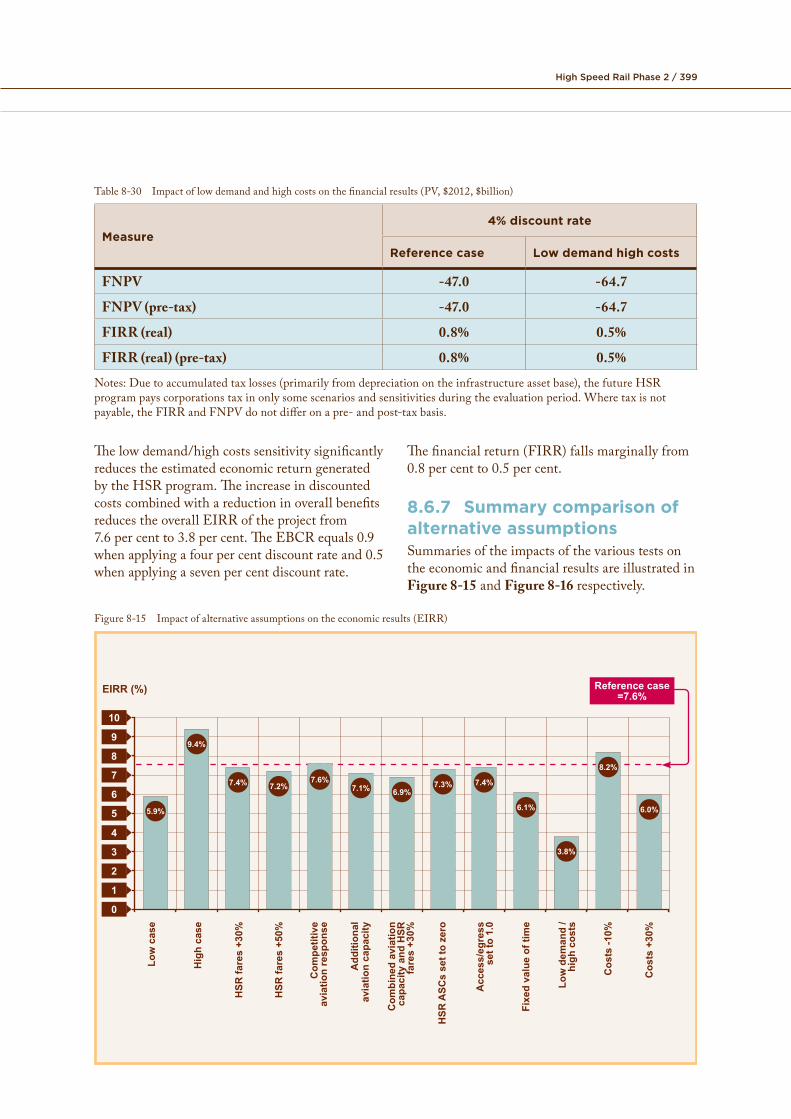
High Speed Rail Phase 2 / 399
Table 8-30 Impact of low demand and high costs on the financial results (PV, $2012, $billion)
Measure4% discount rate
Reference case Low demand high costs
FNPV -47.0 -64.7
FNPV (pre-tax) -47.0 -64.7
FIRR (real) 0.8% 0.5%
FIRR (real) (pre-tax) 0.8% 0.5%
Notes: Due to accumulated tax losses (primarily from depreciation on the infrastructure asset base), the future HSR program pays corporations tax in only some scenarios and sensitivities during the evaluation period. Where tax is not payable, the FIRR and FNPV do not differ on a pre- and post-tax basis.
The low demand/high costs sensitivity significantly reduces the estimated economic return generated by the HSR program. The increase in discounted costs combined with a reduction in overall benefits reduces the overall EIRR of the project from 7.6 per cent to 3.8 per cent. The EBCR equals 0.9 when applying a four per cent discount rate and 0.5 when applying a seven per cent discount rate.
The financial return (FIRR) falls marginally from 0.8 per cent to 0.5 per cent.
8.6.7 Summary comparison of alternative assumptionsSummaries of the impacts of the various tests on the economic and financial results are illustrated in Figure 8-15 and Figure 8-16 respectively.
Figure 8-15 Impact of alternative assumptions on the economic results (EIRR)
EIRR (%)
Low
cas
e
Hig
h ca
se
HSR
fare
s +3
0%
HSR
fare
s +5
0%
Com
petit
ive
avia
tion
resp
onse
Add
ition
al
avia
tion
capa
city
Com
bine
d av
iatio
n ca
paci
ty a
nd H
SR
fare
s +3
0%
Acc
ess/
egre
ss
set t
o 1.
0
HSR
ASC
s se
t to
zero
Cos
ts +
30%
Low
dem
and
/ hi
gh c
osts
Cos
ts -1
0%
Fixe
d va
lue
of ti
me
8
9
10
7
6
5
4
3
2
1
0
Reference case=7.6%
5.9%
7.4% 7.2%6.9%
7.3% 7.4%
3.8%
6.0%6.1%
8.2%
9.4%
7.1%7.6%
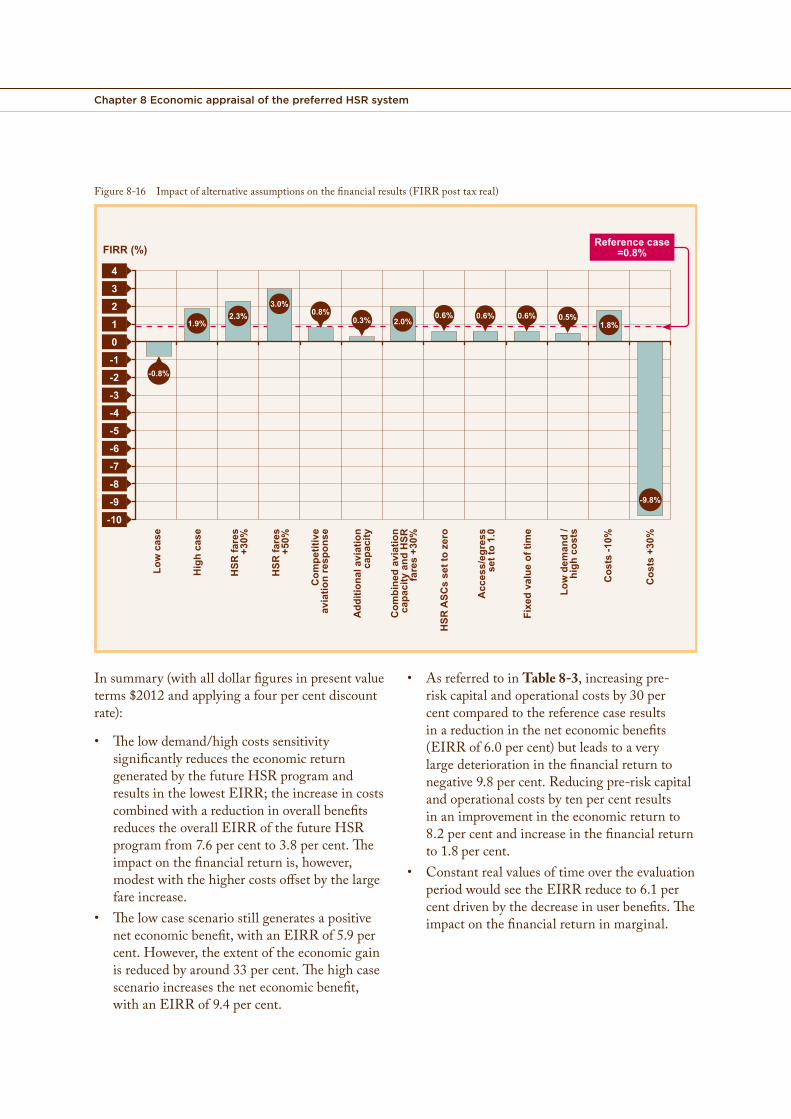
Chapter 8 Economic appraisal of the preferred HSR system
Figure 8-16 Impact of alternative assumptions on the financial results (FIRR post tax real)
FIRR (%)
Low
cas
e
Hig
h ca
se
HSR
fare
s +3
0%
HSR
fare
s +5
0%
Com
petit
ive
avia
tion
resp
onse
Add
ition
al a
viat
ion
capa
city
Com
bine
d av
iatio
n ca
paci
ty a
nd H
SR
fare
s +3
0%
HSR
ASC
s se
t to
zero
Fixe
d va
lue
of ti
me
Acc
ess/
egre
ss
set t
o 1.
0
Low
dem
and
/ hi
gh c
osts
Cos
ts -1
0%
Cos
ts +
30%
43210-1-2-3-4-5-6-7-8-9
Reference case=0.8%
-0.8%
-9.8%
1.8%2.0%
3.0%2.3%
1.9% 0.3% 0.6% 0.6% 0.6% 0.5%0.8%
-10
In summary (with all dollar figures in present value terms $2012 and applying a four per cent discount rate):
• The low demand/high costs sensitivity significantly reduces the economic return generated by the future HSR program and results in the lowest EIRR; the increase in costs combined with a reduction in overall benefits reduces the overall EIRR of the future HSR program from 7.6 per cent to 3.8 per cent. The impact on the financial return is, however, modest with the higher costs offset by the large fare increase.
• The low case scenario still generates a positive net economic benefit, with an EIRR of 5.9 per cent. However, the extent of the economic gain is reduced by around 33 per cent. The high case scenario increases the net economic benefit, with an EIRR of 9.4 per cent.
• As referred to in Table 8-3, increasing pre-risk capital and operational costs by 30 per cent compared to the reference case results in a reduction in the net economic benefits (EIRR of 6.0 per cent) but leads to a very large deterioration in the financial return to negative 9.8 per cent. Reducing pre-risk capital and operational costs by ten per cent results in an improvement in the economic return to 8.2 per cent and increase in the financial return to 1.8 per cent.
• Constant real values of time over the evaluation period would see the EIRR reduce to 6.1 per cent driven by the decrease in user benefits. The impact on the financial return in marginal.
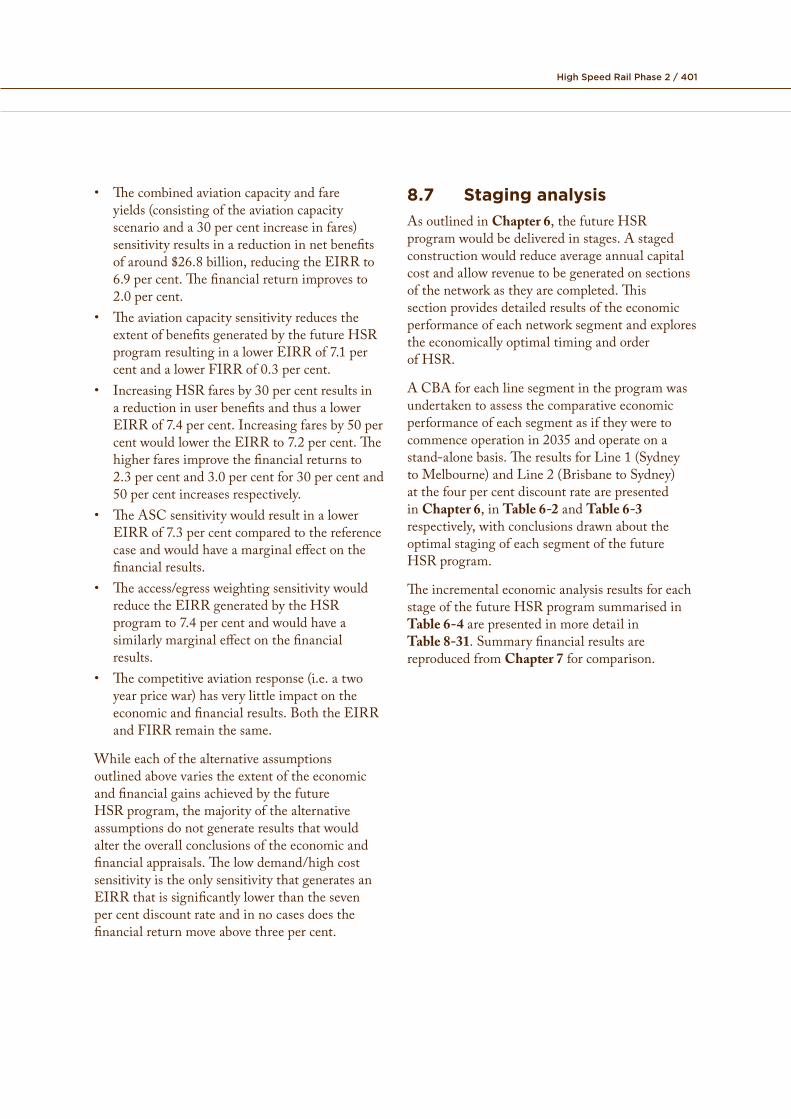
High Speed Rail Phase 2 / 401
• Thecombinedaviationcapacityandfareyields(consistingoftheaviationcapacityscenarioanda30percentincreaseinfares)sensitivityresultsinareductioninnetbenefitsofaround$26.8 billion,reducingtheEIRRto6.9 per cent.Thefinancialreturnimprovesto2.0per cent.
• TheaviationcapacitysensitivityreducestheextentofbenefitsgeneratedbythefutureHSRprogramresultinginalowerEIRRof7.1percentandalowerFIRRof0.3percent.
• IncreasingHSRfaresby30percentresultsinareductioninuserbenefitsandthusalowerEIRRof7.4percent.Increasingfaresby50percentwouldlowertheEIRRto7.2percent.Thehigherfaresimprovethefinancialreturnsto2.3 percentand3.0percentfor30percentand50 per centincreasesrespectively.
• TheASCsensitivitywouldresultinalowerEIRRof7.3percentcomparedtothereferencecaseandwouldhaveamarginaleffectonthefinancialresults.
• Theaccess/egressweightingsensitivitywouldreducetheEIRRgeneratedbytheHSRprogramto7.4percentandwouldhaveasimilarlymarginaleffectonthefinancialresults.
• Thecompetitiveaviationresponse(i.e.atwoyearpricewar)hasverylittleimpactontheeconomicandfinancialresults.BoththeEIRRandFIRRremainthesame.
WhileeachofthealternativeassumptionsoutlinedabovevariestheextentoftheeconomicandfinancialgainsachievedbythefutureHSRprogram,themajorityofthealternativeassumptionsdonotgenerateresultsthatwouldaltertheoverallconclusionsoftheeconomicandfinancialappraisals.Thelowdemand/highcostsensitivityistheonlysensitivitythatgeneratesanEIRRthatissignificantlylowerthanthesevenpercentdiscountrateandinnocasesdoesthefinancialreturnmoveabovethreepercent.
8.7 Staging analysisAsoutlinedinChapter 6,thefutureHSRprogramwouldbedeliveredinstages.Astagedconstructionwouldreduceaverageannualcapitalcostandallowrevenuetobegeneratedonsectionsofthenetworkastheyarecompleted.Thissectionprovidesdetailedresultsoftheeconomicperformanceofeachnetworksegmentandexplorestheeconomicallyoptimaltimingandorderof HSR.
ACBAforeachlinesegmentintheprogramwasundertakentoassessthecomparativeeconomicperformanceofeachsegmentasiftheyweretocommenceoperationin2035andoperateonastand-alonebasis.TheresultsforLine1(SydneytoMelbourne)andLine2(BrisbanetoSydney)atthefourpercentdiscountratearepresentedinChapter 6,inTable 6-2andTable 6-3respectively,withconclusionsdrawnabouttheoptimalstagingofeachsegmentofthefutureHSRprogram.
TheincrementaleconomicanalysisresultsforeachstageofthefutureHSRprogramsummarisedinTable 6-4arepresentedinmoredetailinTable 8-31.SummaryfinancialresultsarereproducedfromChapter 7forcomparison.
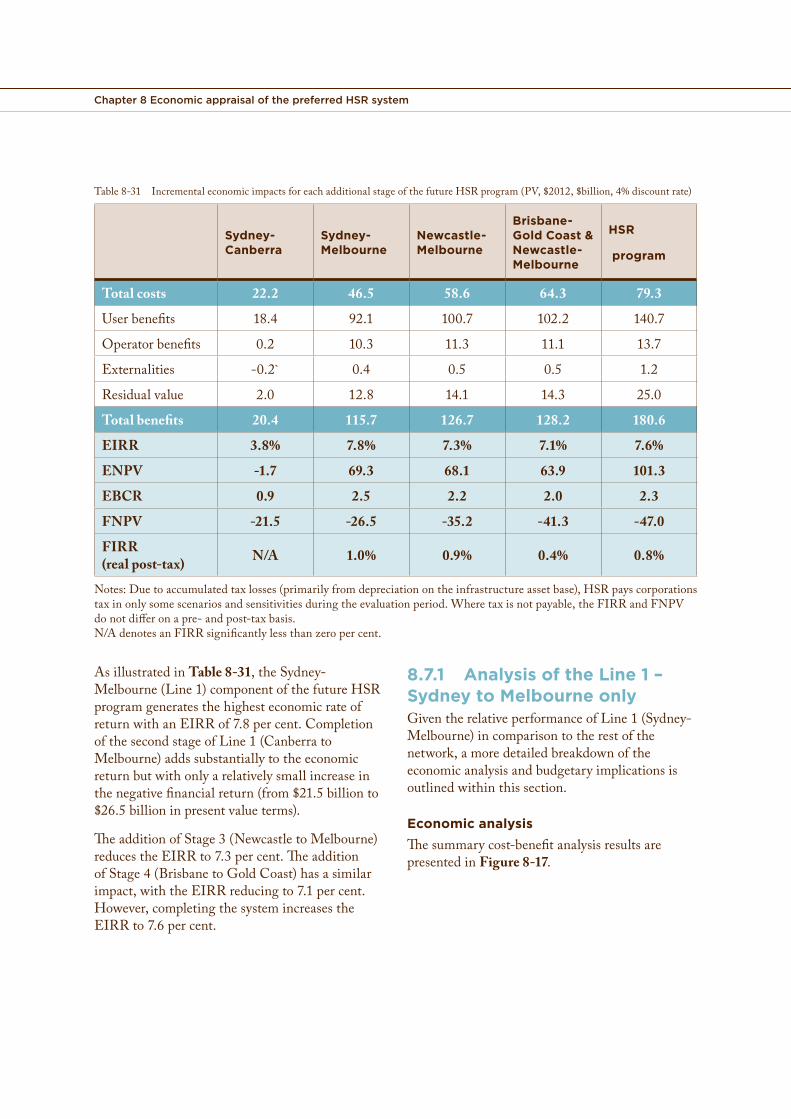
Chapter 8 Economic appraisal of the preferred HSR system
Table8-31 IncrementaleconomicimpactsforeachadditionalstageofthefutureHSRprogram(PV,$2012,$billion,4%discountrate)
Sydney- Canberra
Sydney-Melbourne
Newcastle- Melbourne
Brisbane-Gold Coast & Newcastle-Melbourne
HSR
program
Total costs 22.2 46.5 58.6 64.3 79.3
Userbenefits 18.4 92.1 100.7 102.2 140.7
Operatorbenefits 0.2 10.3 11.3 11.1 13.7
Externalities -0.2` 0.4 0.5 0.5 1.2
Residualvalue 2.0 12.8 14.1 14.3 25.0
Total benefits 20.4 115.7 126.7 128.2 180.6
EIRR 3.8% 7.8% 7.3% 7.1% 7.6%
ENPV -1.7 69.3 68.1 63.9 101.3
EBCR 0.9 2.5 2.2 2.0 2.3
FNPV -21.5 -26.5 -35.2 -41.3 -47.0
FIRR (real post-tax) N/A 1.0% 0.9% 0.4% 0.8%
Notes:Duetoaccumulatedtaxlosses(primarilyfromdepreciationontheinfrastructureassetbase),HSRpayscorporationstaxinonlysomescenariosandsensitivitiesduringtheevaluationperiod.Wheretaxisnotpayable,theFIRRandFNPVdonotdifferonapre-andpost-taxbasis.N/AdenotesanFIRRsignificantlylessthanzeropercent.
AsillustratedinTable 8-31,theSydney-Melbourne(Line1)componentofthefutureHSRprogramgeneratesthehighesteconomicrateofreturnwithanEIRRof7.8percent.CompletionofthesecondstageofLine1(CanberratoMelbourne)addssubstantiallytotheeconomicreturnbutwithonlyarelativelysmallincreaseinthenegativefinancialreturn(from$21.5 billionto$26.5billioninpresentvalueterms).
TheadditionofStage3(NewcastletoMelbourne)reducestheEIRRto7.3percent.TheadditionofStage4(BrisbanetoGoldCoast)hasasimilarimpact,withtheEIRRreducingto7.1percent.However,completingthesystemincreasestheEIRRto7.6percent.
8.7.1 Analysis of the Line 1 – Sydney to Melbourne onlyGiventherelativeperformanceofLine1(Sydney-Melbourne)incomparisontotherestofthenetwork,amoredetailedbreakdownoftheeconomicanalysisandbudgetaryimplicationsisoutlinedwithinthissection.
Economic analysisThesummarycost-benefitanalysisresultsarepresentedinFigure 8-17.
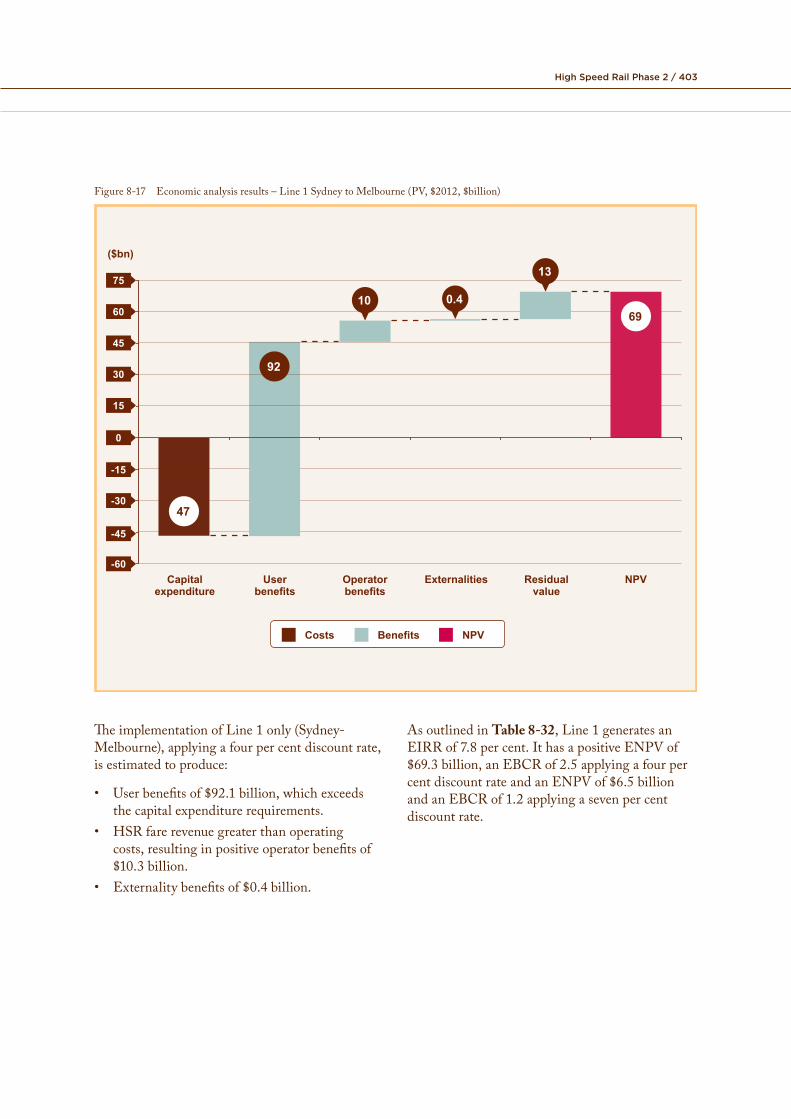
High Speed Rail Phase 2 / 403
Figure 8-17 Economic analysis results – Line 1 Sydney to Melbourne (PV, $2012, $billion)
Costs Benefits NPV
75
60
45
30
15
0
-30
-15
-45
-60Capital
expenditureUser
benefitsOperatorbenefits
Externalities Residual value
NPV
($bn)
10 0.4
47
92
69
13
The implementation of Line 1 only (Sydney- As outlined in Table 8-32, Line 1 generates an Melbourne), applying a four per cent discount rate, EIRR of 7.8 per cent. It has a positive ENPV of is estimated to produce: $69.3 billion, an EBCR of 2.5 applying a four per
cent discount rate and an ENPV of $6.5 billion • User benefits of $92.1 billion, which exceeds and an EBCR of 1.2 applying a seven per cent
the capital expenditure requirements. discount rate. • HSR fare revenue greater than operating
costs, resulting in positive operator benefits of $10.3 billion.
• Externality benefits of $0.4 billion.
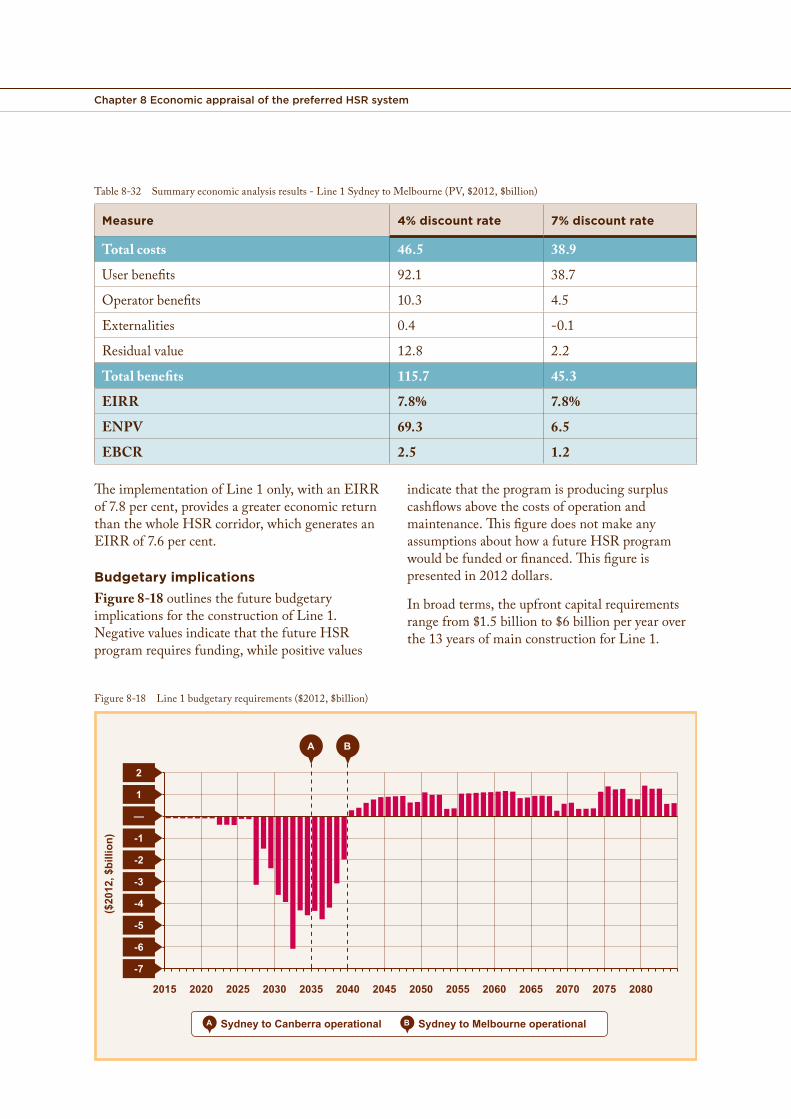
Chapter 8 Economic appraisal of the preferred HSR system
Table 8-32 Summary economic analysis results - Line 1 Sydney to Melbourne (PV, $2012, $billion)
Measure 4% discount rate 7% discount rate
Total costs 46.5 38.9
User benefits 92.1 38.7
Operator benefits 10.3 4.5
Externalities 0.4 -0.1
Residual value 12.8 2.2
Total benefits 115.7 45.3
EIRR 7.8% 7.8%
ENPV 69.3 6.5
EBCR 2.5 1.2
The implementation of Line 1 only, with an EIRR of 7.8 per cent, provides a greater economic return than the whole HSR corridor, which generates an EIRR of 7.6 per cent.
Budgetary implicationsFigure 8-18 outlines the future budgetary implications for the construction of Line 1. Negative values indicate that the future HSR program requires funding, while positive values
indicate that the program is producing surplus cashflows above the costs of operation and maintenance. This figure does not make any assumptions about how a future HSR program would be funded or financed. This figure is presented in 2012 dollars.
In broad terms, the upfront capital requirements range from $1.5 billion to $6 billion per year over the 13 years of main construction for Line 1.
Figure 8-18 Line 1 budgetary requirements ($2012, $billion)
($20
12, $
billi
on)
205520502045204020352030202520202015 2060 2065 2070 2075 2080
—
-4
-6
-7
-1
-2
-3
-5
1
2
A B
Sydney to Canberra operationalA Sydney to Melbourne operationalB
High Speed Rail Phase 2 / 405
TheanalysishasconcludedthatestablishingthelinkbetweenSydneyandMelbourneisthefirstpriorityforanyHSRlineontheeastcoastofAustralia,becauseitrepresentsthebesteconomicandfinancialperformance.Atacostof$46.5 billion(PV,$2012)(includingprojectdevelopment,construction,assetrenewalandrollingstock),thissectorrepresentsamajorundertakingthatwouldinitselfneedtobestaged.Althoughthereareintermediatestationswithineachofthesectors,itwouldnotbeeconomicallyorfinanciallyjustifiabletopartiallyconstructasectortoorfromanintermediatestation,giventherelativelylowerdemandprojectedfortheintermediatestations.
CanberraisthenextmostimportantcityonthelinebetweenSydneyandMelbourne(afterthesetwomajorcentresthemselves),andwouldbeanappropriateterminusforthefirststage.Sydney-CanberraandCanberra-Melbourneprovidesimilarvalueformoneyineconomicterms,buttheformercanbedeliveredatlowercost,inashortertimeperiodandwithsuperiorfinancialperformance,andisthereforepreferredasthefirststage.However,thisisonlyaviableoptionifthecommitmentismadetocontinuethelinetoMelbourne;ashorterSydney-Canberraonlyroutewouldnotbeviableonastand-alonebasis.
8.8 Flow-on effects using CGE analysisTheCBAestimatesthedirectcostsandbenefitsofHSR.Thedynamiccomputablegeneralequilibrium(CGE)modelling47ccomplementstheCBA,estimatingtheeconomy-wideimpactsofconstructionandoperationofthepreferredHSRprogramontheAustralianeconomy.
TheCGEanalysisshouldbeconsideredasaseparatebutcomplementaryanalysistotheCBA.CBAfocusesonthedirectimpactsoftheproject
ontransportusers,transportoperatorsandthecommunity.CGEmodellingconsiderstheprojectfromamulti-sectoralpointofviewandwithinacompleteandinternallyconsistentframeworkoftheentireeconomy.WhileCBAisthemaintoolusedforcomparingprojectsandforinvestmentdecisions,CGEisausefulcomplementaryanalysisbecauseitexploresthepossiblewiderflow-onimpactstosectorsandregions.
AsummaryoftheresultsoftheCGEanalysisarepresentedbelow,whichfocusesonthefollowingkeymetrics:• Grossdomesticproduct(GDP)–measure
ofvalueadded48generatedbythedomesticeconomy.
• Grossstateproduct(GSP)–measureofvalueaddedgeneratedbyastateeconomy.
• Consumption–measureoffinalhouseholdspending,usedasaproxyforlivingstandards.
• Investment–measureofuseofresourcestocreatecapital.
• Employment–measureoflabour-hoursemployed.
Theresultsarepresentedaspercentchangesfrombaseline49.TheCGEanalysishasbeenconductedforthereferencecaseonly.
8.8.1 Key assumptions and inputsTheCGEanalysisisbasedonarangeofassumptionsandinputsassummarisedbelow.• FundingofHSR –theCGEanalysisfocuses
primarilyontheeconomicimpactsofaHSRsectorfundeddomesticallywithimmediatedomesticcrowding-out50effectsandalong-runadjustmentinnationalsavings.
• Long-runlaboursupply:theCGEanalysisassumesthatHSRdoesnotinfluencetheunderlyingsupplyoflabourinthelong-run,
47 Themodelusedinthisstudyisabottom-up,multi-regional,dynamicCGEmodelthatcontainsastructuralrepresentationoftheAustralianeconomyatthestateandterritorylevel.TheCGEmodelisfirstusedtocreateabaselineprojectionoftheAustralianeconomythroughto2085,andtheniscomparedtoanalternateprojectionoftheeconomyincludingtheimpactsofHSR.
48 Valueaddediscalculatedbyfinaloutputminuspurchasesofgoodsandservices(intermediateinputs)usedtomaketheoutput,ormeasuredanotherwayiswagesplusgrossprofitplusindirecttaxes.
49 Forexample,adeviationof–1percentfrombaselinerealGDPin2085wouldindicatethatGDPinthatyearisonepercentlowerthanitwouldhavebeenhadHSRnotgoneahead.
50 Crowdingoutreferstothechannellingofresourcestoacertainpurposewhichpreventsthesameresourcesbeingusedelsewhere,inthiscaseimposedbyassumingaconstantratioofthecurrentaccountbalancetoGDP.
Chapter 8 Economic appraisal of the preferred HSR system
whichisprimarilydeterminedbydemographicfactorsandtechnologicalchange.Wageratesadaptovertimetoshortrunexcessdemandorsupplyinthelabourmarket,suchthatlongrunemploymentimpactsatthenationallevelarenegligible.However,atthesub-nationallevel,labourcanmovebetweensectorsandacrossregionalboundaries.
• Productivitygains:theCGEanalysistakeson-boardassumptionsaboutthepotentialgainstoproductivityduetoHSRgeneratedbytraveltimesavedforbusinesspassengers.Thesebusinessuserbenefitsareassumedtobeworth$4 billion(2012prices)in2035andwerecalculatedoutsidetheCGEmodellingframework.Theproductivitygainsaverage0.17percentperannumandaredistributedacrossindustriesaccordingtotheirshareinvalueaddedanduseofbusinesstravel.TheproductivitygainsareimposedontheCGEmodelaschangestolabourproductivitytoreflectthattimesavedduetoHSRenhancestheproductivityofbusinesstravellers.Theseproductivitygainsarebasedontheoutputsfromthedemandmodellingandcostbenefitanalysis.
8.8.2 Macro-economic impactof HSR through construction and operationThecombinedeffectfromdevelopmentandoperationofthefutureHSRprogramonthedomesticAustralianeconomythroughto2085ispresentedinFigure 8-19.Thisshowstheannualdifferencesinthemaineconomicindicators.HSRisestimatedtoleadtoGDPfortheyear2085being0.1percenthigherrelativetothebaseline.ThesegainstoGDPflowfromtheproductivitygainsassociatedwithtimesavingstobusinesstravellers.
Asamajorinfrastructureinvestmentproject,HSRwouldalsoraisetheoveralllevelofinvestmentinAustralia.AsshowninFigure 8-19,in2036,HSRinvestmentwouldaddsignificantlytoaggregateinvestmentduringtheoperationalphase,withaconcomitantreductioninaggregateconsumptionundertheassumptionthatdomesticsavingsare
theprimarysourceoffunding.By2056,atthecloseofconstruction,theannualtotaladditionalinvestmentattheaggregatelevelisequivalenttoaround0.4percentoftheaggregateinvestmentundertakeninAustraliabetween2021and2056.
Asmentionedabove,HSRisassumedtobefinancedbydomesticsavings,whichcanbesourcedfromacombinationofreducedconsumptionandthecrowding-outofotherinvestment.HSRthereforeleadstoanimmediatediversionofinvestmentfromotherusesintheeconomyandareductioninaggregateconsumption.Alternativeassumptionsregardingthesourceofinvestmentfunds(forexample,foreignsourcingatthemargin,orfundedyear-on-yearbytaxrevenue)wouldleadtodifferentshort-to-mediumtermimpacts,butwouldhaveonlymarginalimpactsinthelongrun.
Intheabsenceoftheassumedproductivitygains,redirectinginvestmentfromother,market-generatedopportunitiesintoHSRconstructionleadstoafallinGDP,particularlyduringtheearlystagesofconstructionwhentheoperationalphase(i.e.thephasethatgeneratesthebenefits)hasyettobegin.HSRisprojectedtoachieveonlya0.8percentrateofreturnoncapitalinvested.AsHSRisacomparativelycapitalintensivesector,anAustralianeconomywithaHSRsectoris,onaverage,slightlymorecapitalintensive,andtheredirectionofcapitalawayfromotheruseswithhigherratesofreturnleadstoafallintheaveragerateofreturnontheaggregatecapitalstockandlowerGDPuntilthebenefitsofoperationalphaseandhigherlabourproductivityarerealised.
Otherthingsbeingequal,andintheabsenceofproductivitybenefitsgeneratedbyHSR,thiswouldlowerconsumptionpossibilitiesandGrossNationalIncome(GNI).However,businesstraveltimesavingsgeneratedbyHSRareassumedtoincreaselabourproductivity,whichoverthelongtermdrivesgainsinGDPasconsumptionrecovers.ThishighlightstheimportantrolethatproductivitybenefitsmustplayintheultimateefficacyofaHSR project.
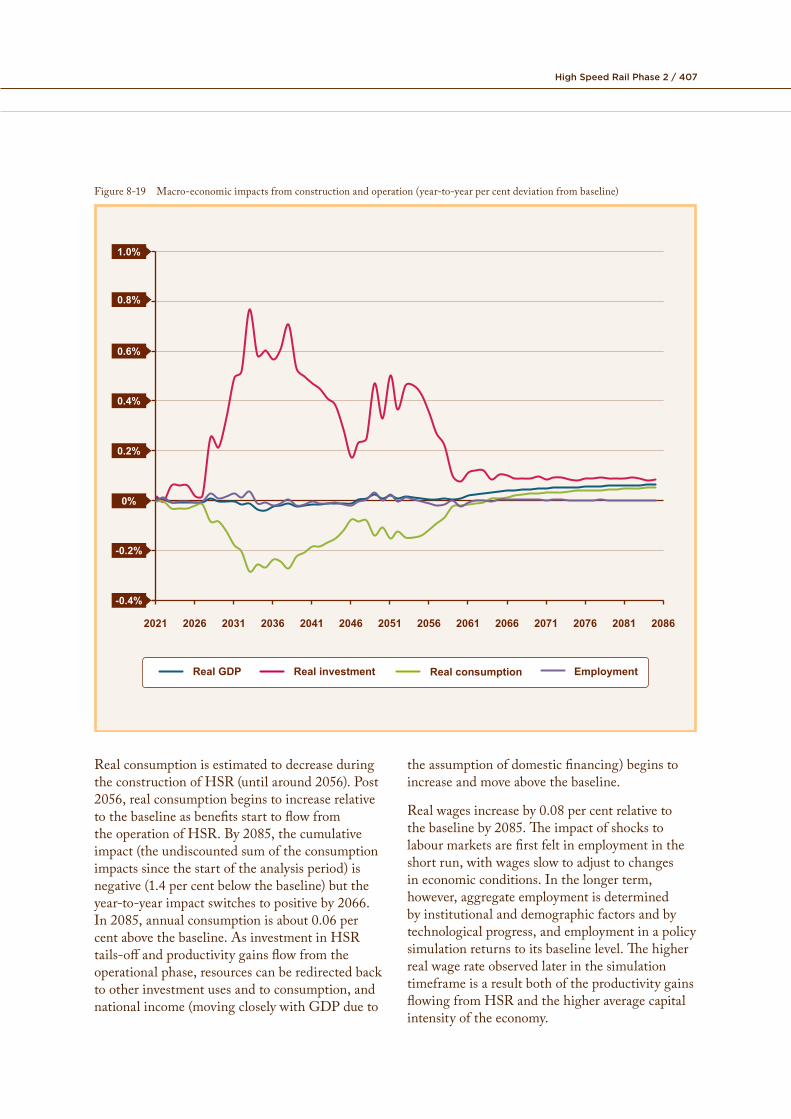
High Speed Rail Phase 2 / 407
Figure 8-19 Macro-economic impacts from construction and operation (year-to-year per cent deviation from baseline)
1.0%
0.8%
0.6%
0.4%
0.2%
0%
-0.2%
-0.4%
2021 2026 2031 2036 2041 2046 2051 2056 2061 2066 2071 2076 2081 2086
Real GDP EmploymentReal investment Real consumption
Real consumption is estimated to decrease during the assumption of domestic financing) begins to the construction of HSR (until around 2056). Post increase and move above the baseline.2056, real consumption begins to increase relative
Real wages increase by 0.08 per cent relative to to the baseline as benefits start to flow from the baseline by 2085. The impact of shocks to the operation of HSR. By 2085, the cumulative labour markets are first felt in employment in the impact (the undiscounted sum of the consumption short run, with wages slow to adjust to changes impacts since the start of the analysis period) is in economic conditions. In the longer term, negative (1.4 per cent below the baseline) but the however, aggregate employment is determined year-to-year impact switches to positive by 2066. by institutional and demographic factors and by In 2085, annual consumption is about 0.06 per technological progress, and employment in a policy cent above the baseline. As investment in HSR simulation returns to its baseline level. The higher tails-off and productivity gains flow from the real wage rate observed later in the simulation operational phase, resources can be redirected back timeframe is a result both of the productivity gains to other investment uses and to consumption, and flowing from HSR and the higher average capital national income (moving closely with GDP due to intensity of the economy.

Chapter 8 Economic appraisal of the preferred HSR system
8.8.3 Structural impacts of HSR on industries within the economyThefutureHSRprogramislikelytoaffectsectorsoftheeconomyindifferentways.Figure 8-20 presentsthecumulativeimpactonindustryvalueaddedthroughto208551.
ThesectorswhicharedirectlylinkedtotheconstructionandoperationofHSRwillbenefitmostlyfromthisprojectthoughincreaseddemandfortheiroutput.Forexample,theconstructionofHSRwouldprovideastimulustothenon-housingconstructionindustry,whichwouldinturnflowbackupthroughtheconstructionindustrysupplychain.Asanexample,anexpansionofthenon-housingconstructionindustrywillraisedemandforconstructionmaterialsrequiredtobuildthetunnelsandbridges,suchascement,andthenincreasethedemandforinputsfromthecementmanufacturersleadingtobenefitsfortheirsuppliers.Asaruleofthumb,thestimulustoindustryactivitydiminishesproportionallyasitflowsbackthroughthesupplychainwiththeshareofoutputlinkedtoHSR.
However,thestimulusprovidedtoanindustrysuchasthenon-housingconstructionindustrythroughHSRprogramwouldalsoadverselyaffectsomeindustries.Highernon-housingconstructionactivitywillrequireincreasedlevelsoflabour,capitalandmaterials,leadingtoincreasedpressureonthepricesfortheseinputs.Othersectorsthatcompetewiththenon-housingconstructionindustryfortheseinputs,butarenotdirectlystimulatedbyHSRconstructionactivity,arelikelytobeadverselyaffectedbyhigherinputcostswithoutthebenefitsoffacinghigherdemandfortheirproducts.Anexampleistheresidentialconstructionsector,asitisanindustry
thatcompetesdirectlyforitsprimaryfactorsandrawmaterialswiththenon-housingconstructionindustry,butisunlikelytoenjoyanoffsettingliftinthedemandforitsoutput.
AstheHSRprogrambecomesoperational,therewillbearesultantcontractionofothertransportsectorsasaparticularpassengercohortsubstitutesawayfrom(forexample)airtraveltoHSR.Therestructuringofthetransportsectoroftheeconomythenleadstofurthersectoralimpactsviatherespectivesupplychains.In2058forexample,theexpansionintheHSRtransportmodeindicatedbythecostbenefitanalysiswouldraisedemandforelectricityandrequireanexpansionintheelectricitysectortomeettheadditionaldemand,potentiallyleadingtoanincreaseinelectricitypricesandanadverseimpactonotherelectricity-intensiveproductionsectorsandhouseholdrealincome.
Additionally,duringconstruction,sectorsthatsellmostoftheiroutputtoconsumers(suchasaccommodationandfoodservices)willfeelsomeadditionalpressure.Thisisduetoareductioninconsumptionrelativetothebaseline(asGDPandcloselyrelatednationalincomefallbelowbaseline),andnationalincomeistosomeextentdivertedintoinvestment.Ontheotherhand,suppliersofinvestmentgoods(likecranesandtrucks)andsomematerials(forexamplesteel)willbenefitfromtheincreasedinvestmentactivityintheeconomy.Overall,astheeconomybecomesmoreinvestmentandcapitalintensiveandless‘consumptionintensive’duringtheconstructionphase,thesalesstructureoftheeconomywilldeterminethat,onaverage,producersofcapitalgoodswillbenefitandproducersofconsumptiongoodscouldfaceadditionalpressure.
51 Industryemploymentimpactsfollowasimilardistributiontovalueaddedimpacts.
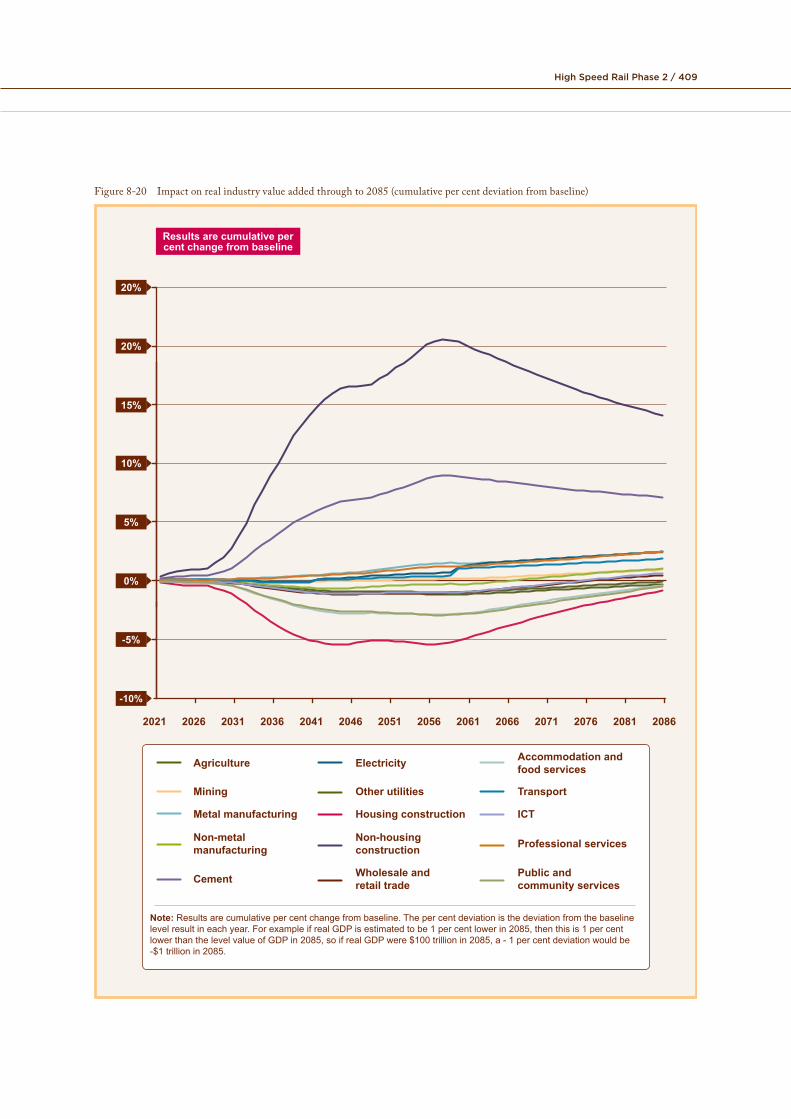
High Speed Rail Phase 2 / 409
Figure 8-20 Impact on real industry value added through to 2085 (cumulative per cent deviation from baseline)
Results are cumulative per cent change from baseline
20%
20%
15%
10%
5%
0%
-5%
-10%
2021 2026 2031 2036 2041 2046 2051 2056 2061 2066 2071 2076 2081 2086
Note: Results are cumulative per cent change from baseline. The per cent deviation is the deviation from the baseline level result in each year. For example if real GDP is estimated to be 1 per cent lower in 2085, then this is 1 per cent lower than the level value of GDP in 2085, so if real GDP were $100 trillion in 2085, a - 1 per cent deviation would be -$1 trillion in 2085.
Agriculture Electricity Accommodation and food services
Mining Other utilities Transport
Metal manufacturing Housing construction ICT
Non-metal manufacturing
Non-housing construction Professional services
Cement Wholesale and retail trade
Public and community services
Chapter 8 Economic appraisal of the preferred HSR system
8.8.4 Distributional impacts of HSR on states and the corridor regionTheHSRcorridorwillrunthrough14statisticaldivisionsacrossQueensland,NSW,theACTandVictoria.These14regionswillreceivethebenefitsofHSRthroughconstructionandoperation.DuringdevelopmentofHSR,theHSRcorridorregionwilldrawinresourcesfromtherestofAustralia.TheconstructionofHSRwillexpanddemandforconstructionservicesintheseregionsandraiseinputprices,affectingindustriesthatcompeteforthesematerialsandprimaryfactorssuchasminingandmanufacturing.
HSRwillimpacteachoftheAustralianstatesdifferently,particularlyasaresultoftheincreasedinvestmentinthecorridorduringconstruction.Allelsebeingequal,domesticfinancingofHSRandanincreaseininvestmentinonestatewouldresultinareductioninthelevelofinvestmentacrosstheremainingstates(or,underalternativeassumptions,anincreaseinforeign-sourcedinvestmentfundsinothersectors).InthecaseofHSRunderdomesticfinancingandanassumptionofafixedcurrentaccountbalancetoGDPratio,theimpactoneachstatereflectsthestrengthofinvestmentin,andoperationof,HSR,andtheconcentrationofindustriesthatcompeteforHSRinputsorsupplyHSRinputswithineachstate.
Basedontheseassumptions,NSW/ACTisexpectedtobetheprimarybeneficiaryregionfromHSRconstructionduetothehighlevelsofadditionalinvestmentgeneratedbytheproject.Simplyput,akeydriveroftheseinterstaterelativitiesduringconstructionisthechangeintheshareofnationalinvestmentactivityduetoeachstate’sroleintheHSRproject.ThelargestincreaseinthismetricisintheNSW/ACTregionofthecorridorwherethebulkofHSRcapitalexpendituresoccur.TheexpansioninNSW/ACT’sinvestmentwouldcomeatacosttotheotherstates,whichsharetheburdenofreducedinvestmentinothersectors.ProductivitygainsarealsoexpectedtobeconcentratedinNSW/ACT,althoughtherearealsosufficientgainsinVictoriaandQueenslandtoyieldapositiveGSPimpactovertime.Itisimportanttonotethattheseresultsdonotimplycontractioninotherstates–rather,thenegative
deviationfromthebaselinefornon-HSRstatesimpliesaslowerrateofpositivegrowthinthoseregions.Furthermore,thescenariosmodelleddonotinclude(forexample)otherinfrastructureprojectsthatmightoccurinotherstatesduringthetimeframeoftheanalysis,nordotheyallowforthesestatestofreelyaccessadditionalforeign-sourcedinvestmentfunds.
TheincreasedactivityinthecorridorduringconstructionofHSRdrawslabourinto(particularly)NSW/ACTandawayfromotherstates.ThisleadstoimpactsonemploymentbystatesimilartoimpactsonGSPbystate.Non-HSR-relatedsectorsoftheeconomythatrequirerelativelyhighlabour-sharesinproductionwillbeadverselyeffectedbythehighereconomy-widecostoflabourflowingfromHSR,butthisimpactwillbedistributedindifferentwaysbetweenoccupations.OccupationssuchasengineeringandconstructionthatwillbeusedheavilyinHSRwillseehigherthanaverageincreasesinwages,whileoccupationssuchasthoseusedintensivelyinretailtradewillseelower-than-averageandpotentiallynegativeimpactswagerates(comparedtothebaseline).
8.9 ConclusionThefollowingconclusionscanbedrawnfromtheeconomicassessment:• ConstructionofanHSRsystemwoulddeliver
positiveneteconomicbenefits.Thecost-benefitanalysisestimatesarealeconomicinternalrateofreturn(EIRR)of7.6percentoninvestmentintheHSRprogramasawhole.Thislevelofeconomicreturnwoulddeliverapositiveneteconomicbenefit,i.e.thepresentvalueoftheeconomicbenefitsexceedsthepresentvalueoftheeconomiccosts,atbothafourpercentandasevenpercentdiscountrate.
• Approximately90percentoftheeconomicbenefits(excludingtheresidualvalue)arebenefitsaccruingtousersofthesystemwhichhavebeenderivedfrom,andareconsistentwith,thedemandanalysis.UserbenefitsareprimarilydrivenbythecitycentrelocationofHSR,fasteraccesstimesandlesstimerequiredtocheckinandboard,leadingtoareductioninoveralltraveltimesformanyusers.
High Speed Rail Phase 2 / 411
• Otherexternalcostsandbenefits,includingthepotentialenvironmentalbenefitsofHSR,arerelativelysmallandthereforeofsecondaryimportanceintheoverallassessmentofbenefits.
• ThefirstlineofafutureHSRprogrambetweenSydneyandMelbournewoulddeliverthestrongesteconomicreturn,withanestimatedEIRRof7.8percent.ServiceswouldfirstbeofferedontheSydney-CanberrasectionwhilethetrackfromCanberratoMelbourneisconstructed.
• Theeconomicresultsremainrobustunderarangeofalternativeassumptionsandsensitivitytests,supportingthebroadconclusionthataninvestmentinHSRontheeastcoastofAustraliawouldgenerateapositiveneteconomicbenefit.