Embed Size (px)
Citation preview
Consequences for the global forest sector of carbon offset
payments
Joseph Buongiorno, Shushuai Zhu
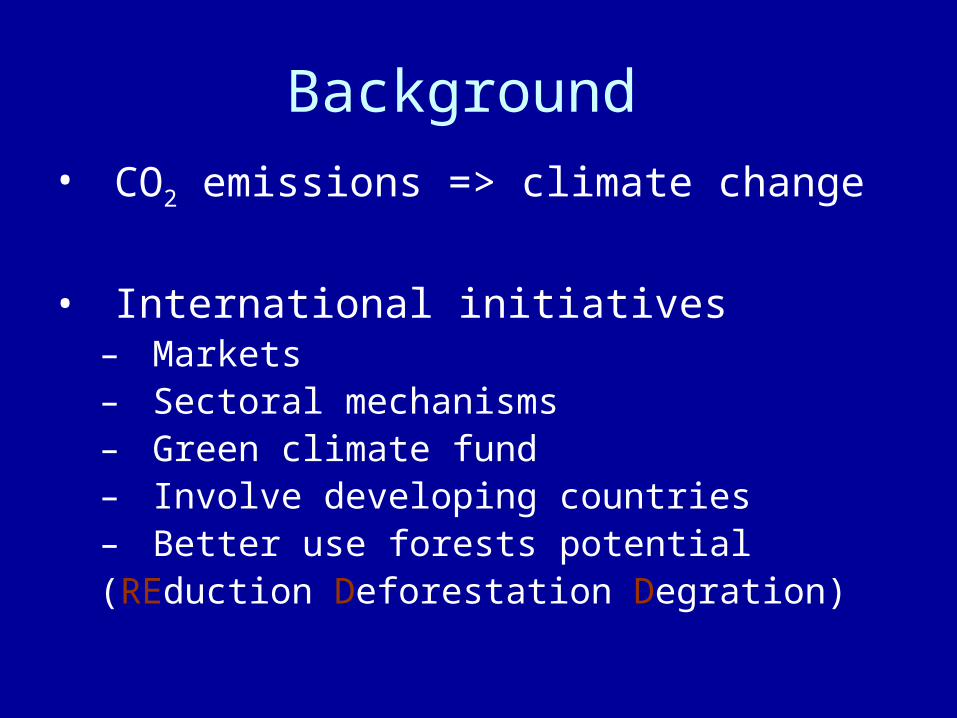
Background
• CO2 emissions => climate change
• International initiatives– Markets– Sectoral mechanisms– Green climate fund– Involve developing countries– Better use forests potential (REduction Deforestation Degration)

Objectives
• CO2e sequestration
– World– Regions and countries
• Effects on markets– Roundwood– Manufactured products
With subsidies:
≠ Prices CO2e
-Global policy
-Partial policy
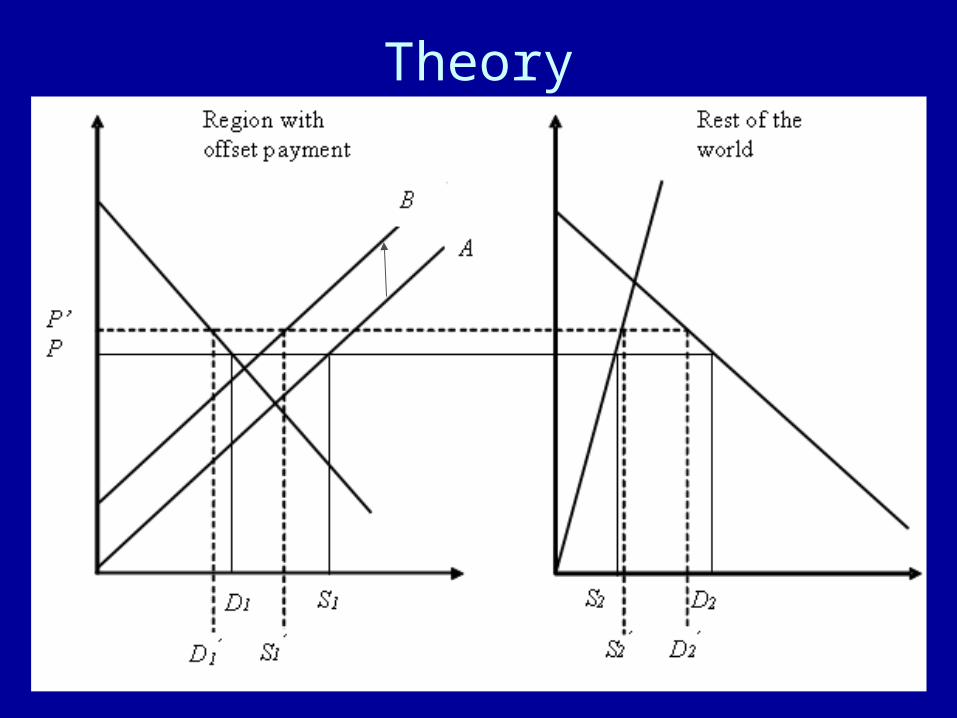
Theory
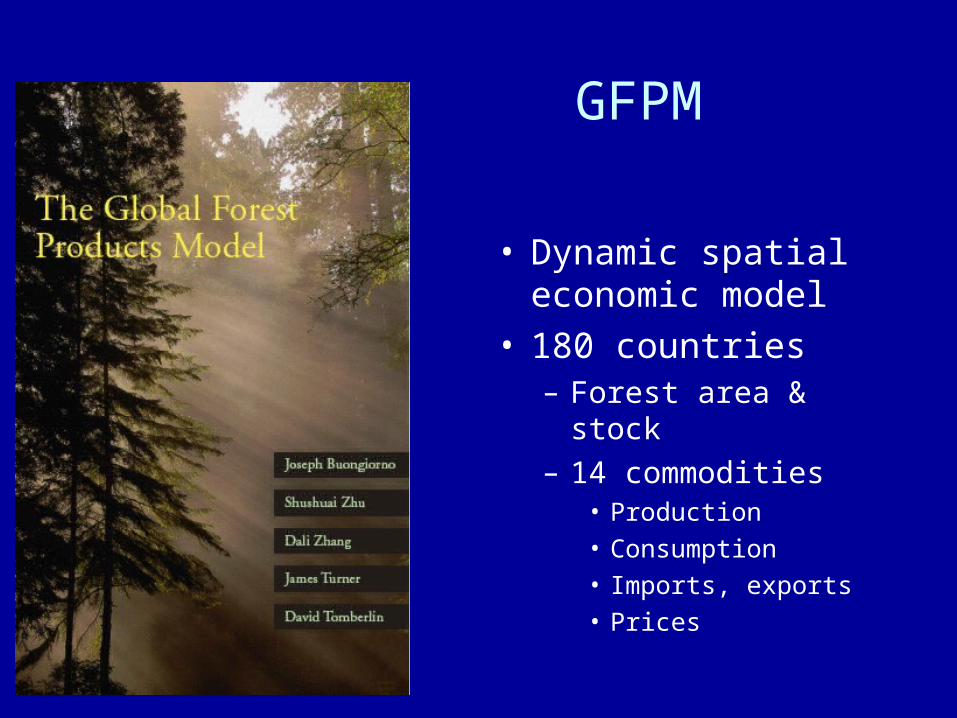
GFPM
• Dynamic spatial economic model
• 180 countries– Forest area & stock – 14 commodities
• Production• Consumption• Imports, exports• Prices
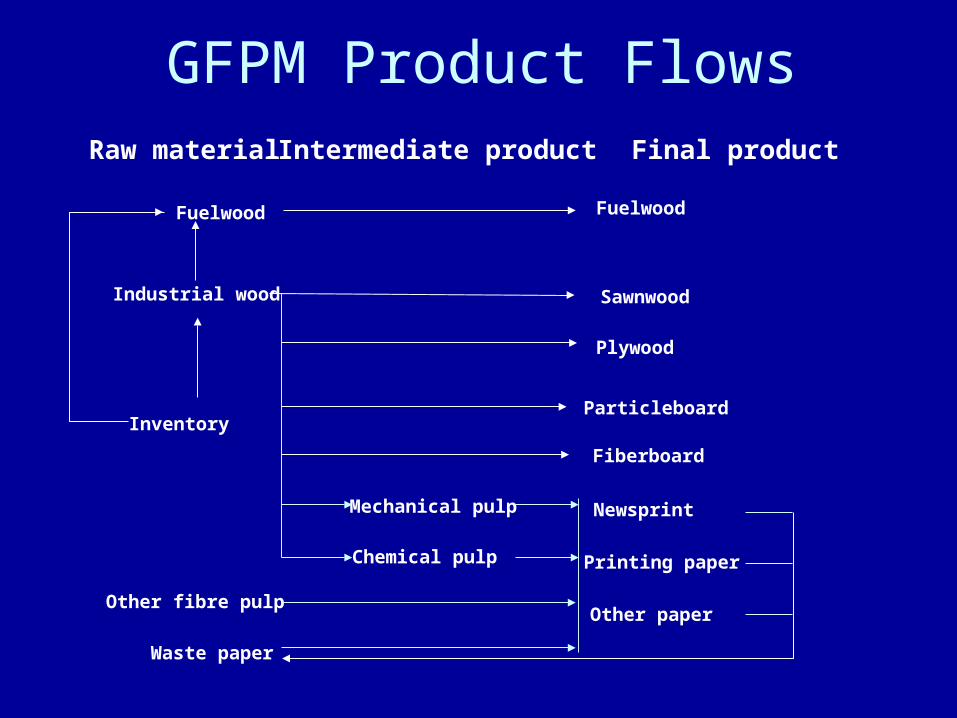
GFPM Product FlowsRaw material Intermediate product Final product
Fuelwood
Industrial wood
Other fibre pulp
Waste paper
Fuelwood
Sawnwood
Plywood
Particleboard
Newsprint
Printing paper
Other paper
Mechanical pulp
Chemical pulp
Fiberboard
Inventory
))()(max(,,, 0, 0
kji
ijkijkikki
Y
ikikki
D
ikikik TcdYYmdDDPikik
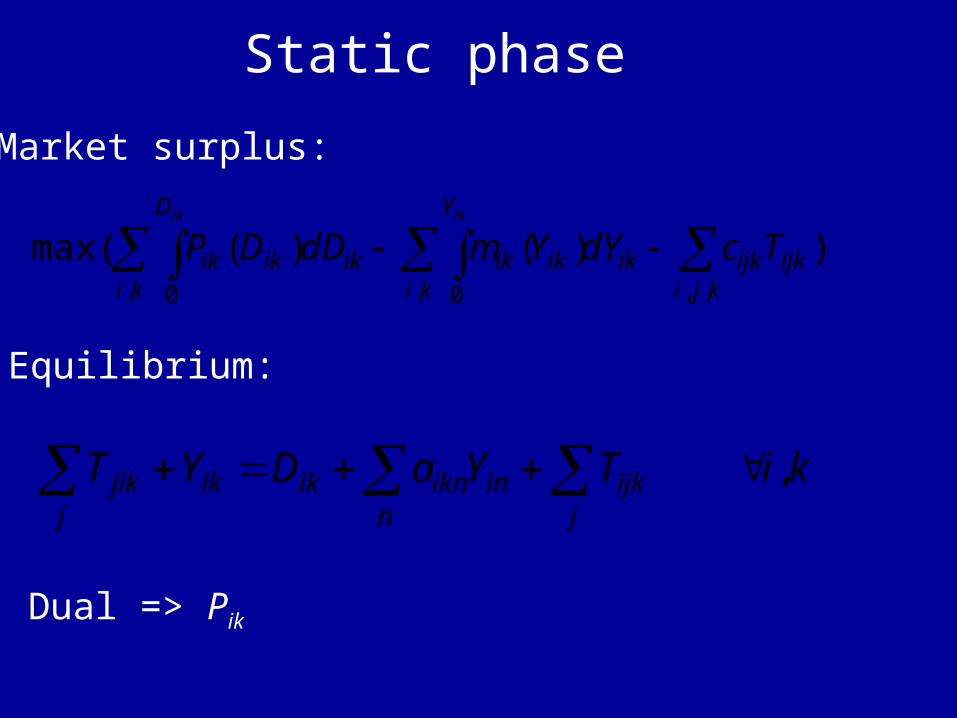
Static phase
Market surplus:
kiTYaDYTn j
ijkiniknikikj
jik ,
Equilibrium:
Dual => Pik
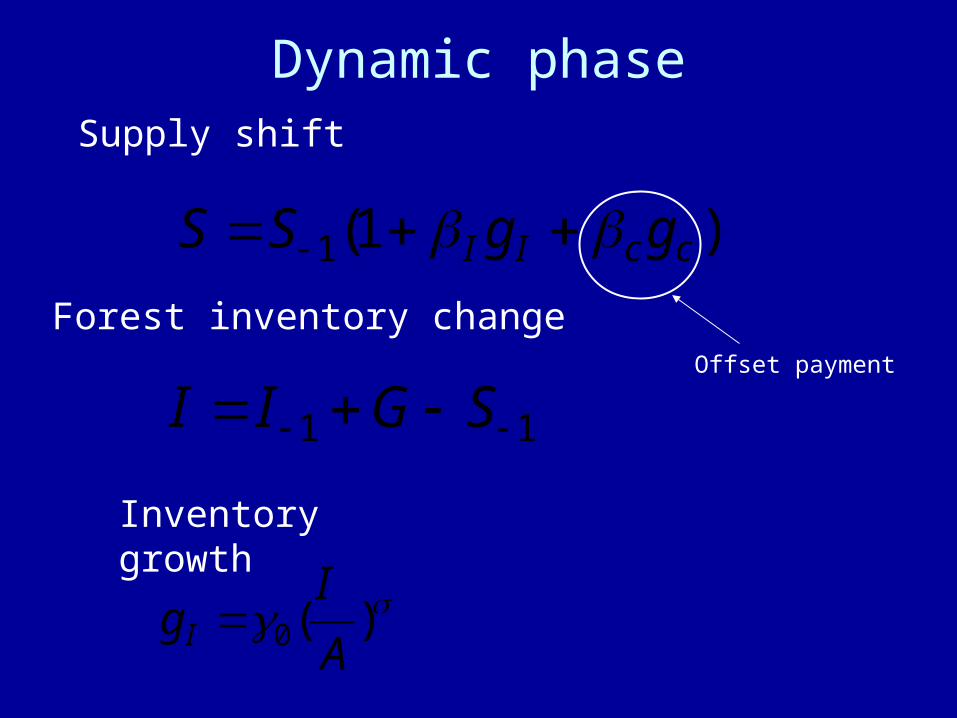
Dynamic phase
)1(1 ccII ggSS
Supply shift
Forest inventory change
Inventory growth
)(0 A
IgI
11 SGIIOffset payment

Inventory growth
-30
-20
-10
0
10
20
30
40
0 50 100 150 200 250 300 350 400
Density (m3 ha-1)
Sto
ck
Gro
wth
(%
ye
ar-1
)
Observed
Predicted )(0 A
IgI

DATA
Base year = 2009 (FAOSTAT)
Resources = FRA 2010
GDP
Population
2009-2030
USDA-ERS
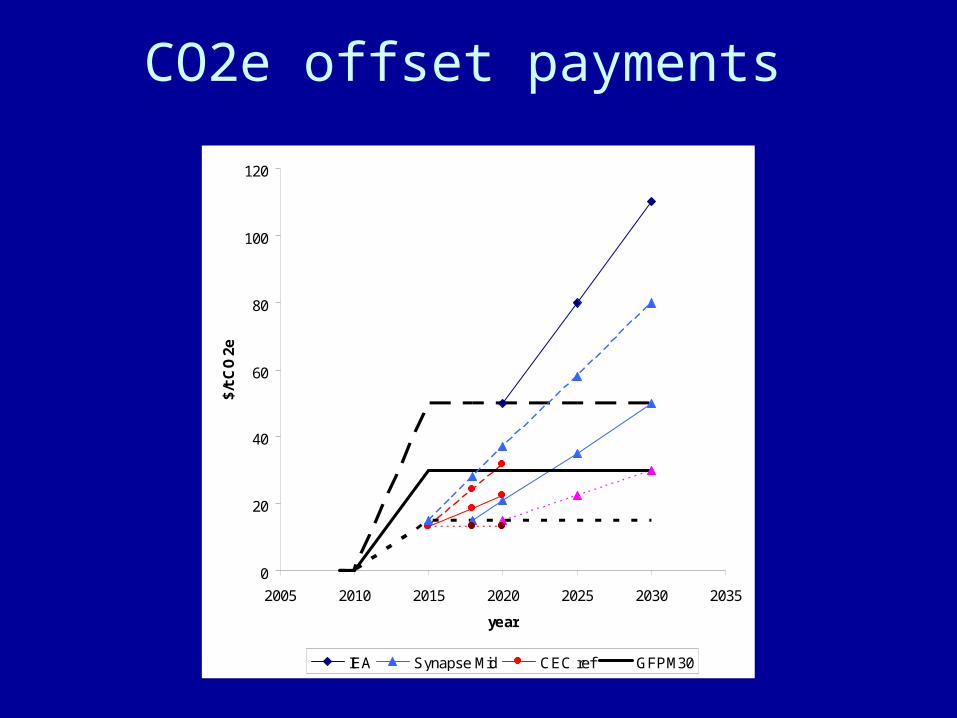
CO2e offset payments
0
20
40
60
80
100
120
2005 2010 2015 2020 2025 2030 2035
year
$/t
CO
2e
IEA Synapse Mid CEC ref GFPM30

Effects on stock CO2e
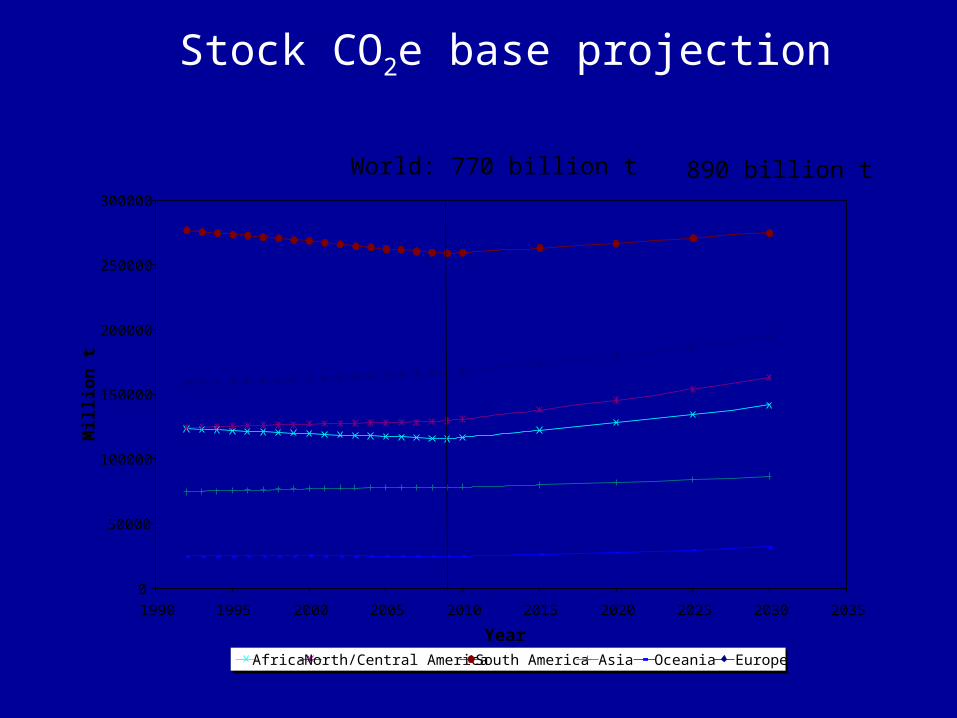
Stock CO2e base projection
0
50000
100000
150000
200000
250000
300000
1990 1995 2000 2005 2010 2015 2020 2025 2030 2035
Year
Mill
ion
t
Africa North/Central America South America Asia Oceania Europe
World: 770 billion t 890 billion t

Δstock CO2e with global policy @$30/t
0
200
400
600
800
1000
1200
1400
1600
1800
2000
2015 2020 2025 2030
Year
Mil
lio
n t
AFRICA NORTH/CENTRAL AMERICA SOUTH AMERICA ASIA OCEANIA EUROPE

Δstock CO2e @ $30/t, developed countries only
-1500
-1000
-500
0
500
1000
1500
2000
2500
3000
3500
2015 2020 2025 2030
Year
Mil
lio
n t
AFRICA NORTH/CENTRAL AMERICA SOUTH AMERICA ASIA OCEANIA EUROPE
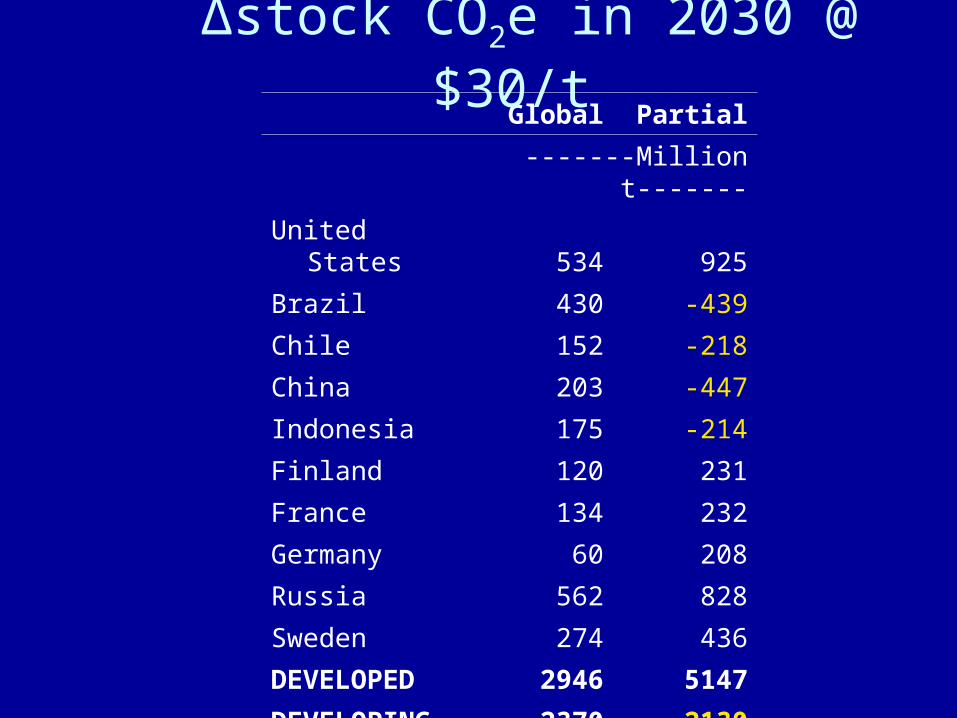
Global Partial
-------Million t-------
United States 534 925
Brazil 430 -439
Chile 152 -218
China 203 -447
Indonesia 175 -214
Finland 120 231
France 134 232
Germany 60 208
Russia 562 828
Sweden 274 436
DEVELOPED 2946 5147
DEVELOPING 2370 -2130
WORLD 5316 3017
Δstock CO2e in 2030 @ $30/t

CO2e storage supply
=>
Europe
$0
$20
$40
$60
0 1000 2000 3000 4000 5000
CO2e million t
Pri
ce C
O2e
/t
South America
$0
$20
$40
$60
-2000 -1000 0 1000 2000
CO2e million t
Pri
ce
CO
2e
/t
World
$0$20$40$60
0 5000 10000
CO2e Million t
Pri
ce C
O2e
/t
Global Partial
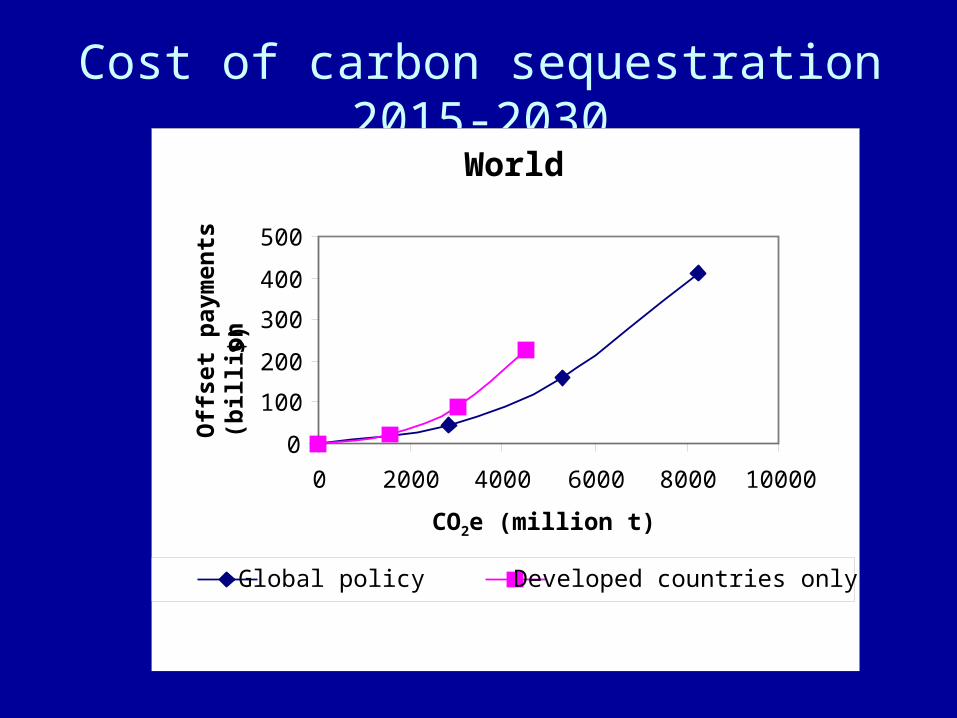
Cost of carbon sequestration 2015-2030
World
0
100
200
300
400
500
0 2000 4000 6000 8000 10000
CO2e (million t)
Off
set
pay
men
ts
(
bil
lio
n
$)
Global policy Developed countries only
Effects on wood markets

Wood prices @$30/t CO2e
0
50
100
150
200
250
300
350
400
1990 1995 2000 2005 2010 2015 2020 2025 2030 2035
Year
US
D$/
CU
M (
2009
)
Fuelwood IndRound Sawnwood
Global (+38%)
Partial(+28%)
base
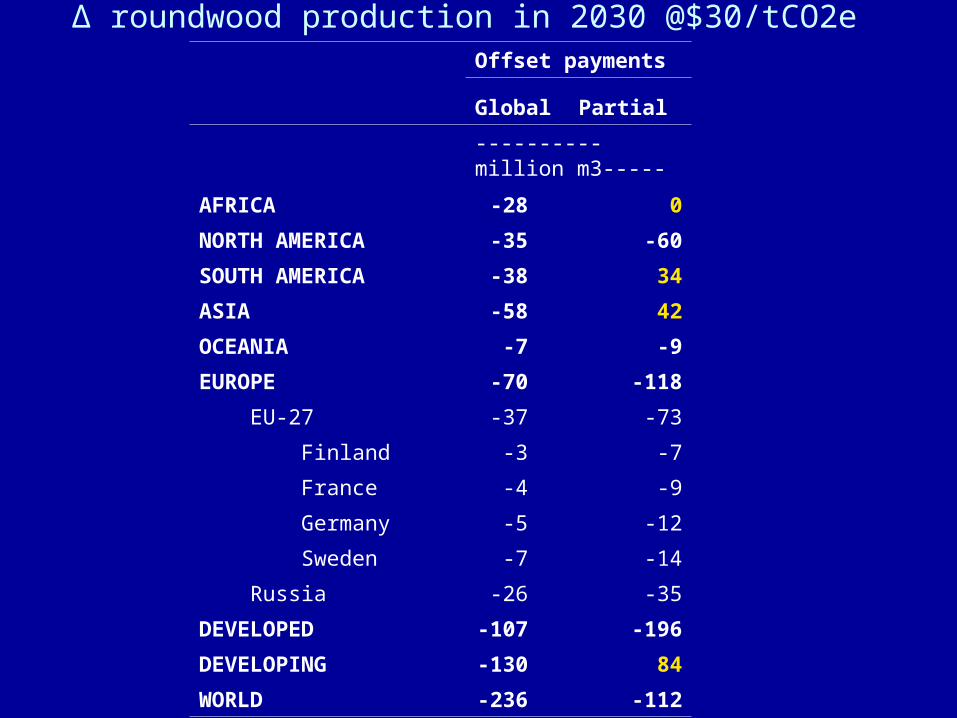
Δ roundwood production in 2030 @$30/tCO2eOffset payments
Global Partial
----------million m3-----
AFRICA -28 0
NORTH AMERICA -35 -60
SOUTH AMERICA -38 34
ASIA -58 42
OCEANIA -7 -9
EUROPE -70 -118
EU-27 -37 -73
Finland -3 -7
France -4 -9
Germany -5 -12
Sweden -7 -14
Russia -26 -35
DEVELOPED -107 -196
DEVELOPING -130 84
WORLD -236 -112
-7% -3%
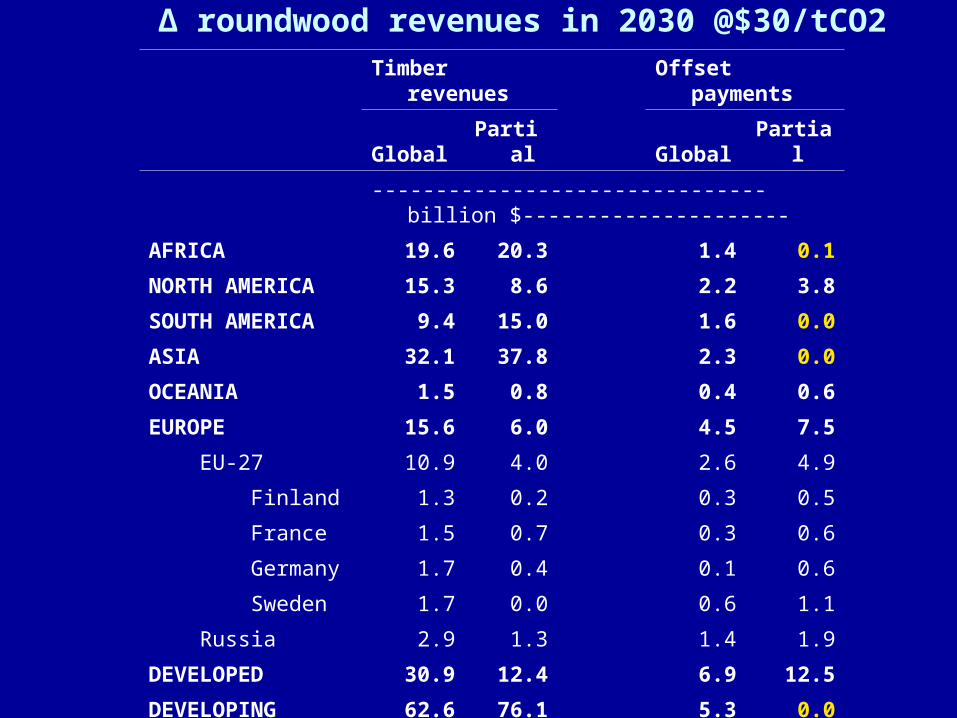
Δ roundwood revenues in 2030 @$30/tCO2Timber revenues Offset payments
Global Partial Global Partial
-------------------------------billion $---------------------
AFRICA 19.6 20.3 1.4 0.1
NORTH AMERICA 15.3 8.6 2.2 3.8
SOUTH AMERICA 9.4 15.0 1.6 0.0
ASIA 32.1 37.8 2.3 0.0
OCEANIA 1.5 0.8 0.4 0.6
EUROPE 15.6 6.0 4.5 7.5
EU-27 10.9 4.0 2.6 4.9
Finland 1.3 0.2 0.3 0.5
France 1.5 0.7 0.3 0.6
Germany 1.7 0.4 0.1 0.6
Sweden 1.7 0.0 0.6 1.1
Russia 2.9 1.3 1.4 1.9
DEVELOPED 30.9 12.4 6.9 12.5
DEVELOPING 62.6 76.1 5.3 0.0
WORLD 93.5 88.5 12.2 7.1
41% 39%
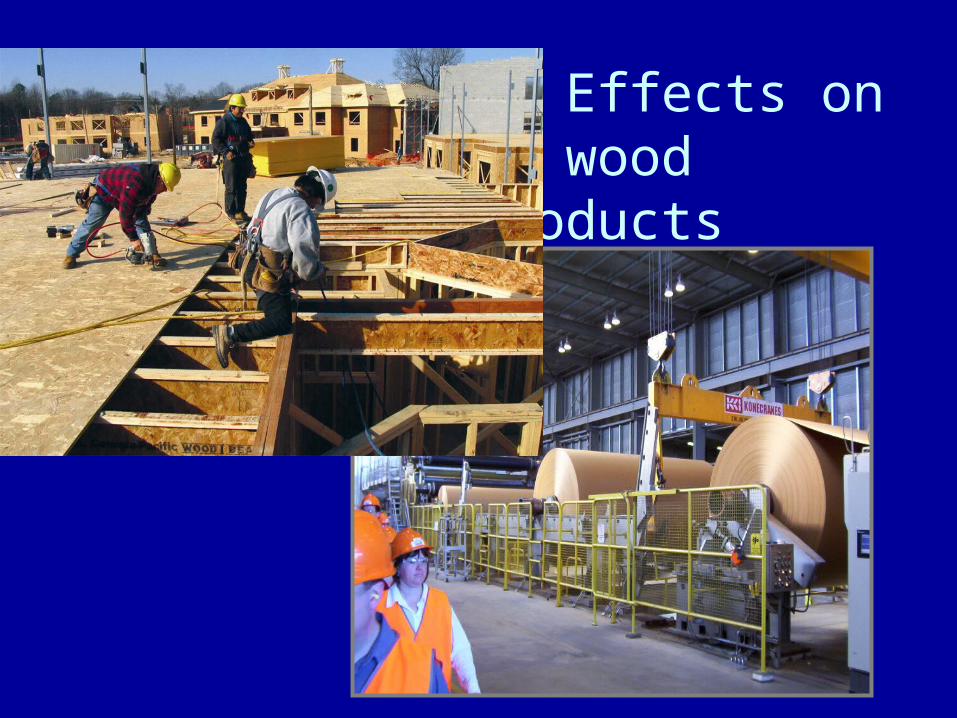
Effects on wood products
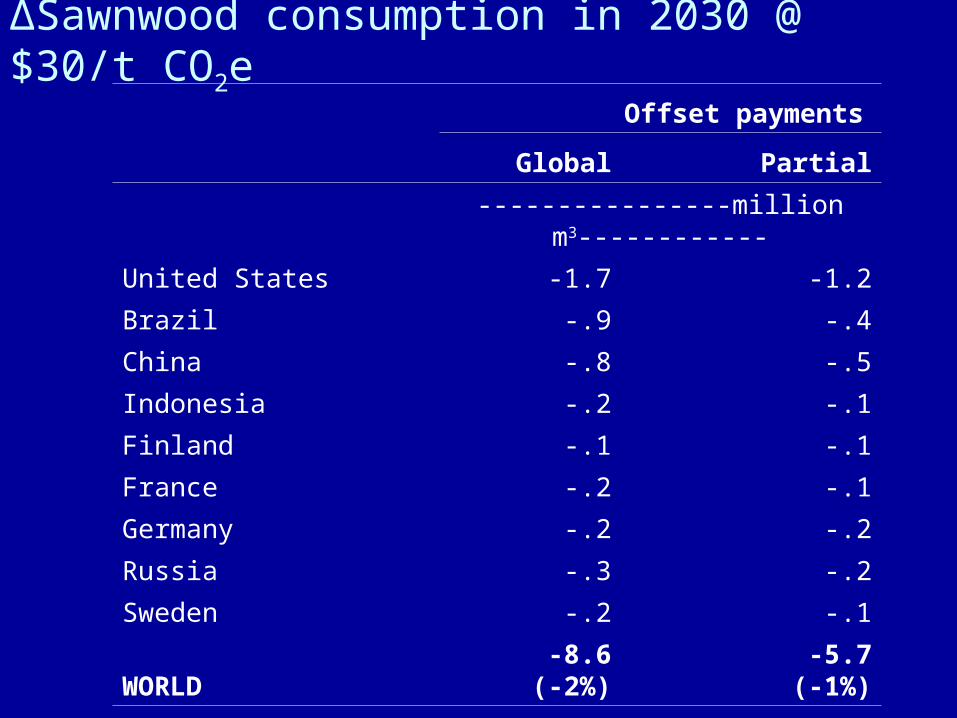
Offset payments
Global Partial
----------------million m3------------
United States -1.7 -1.2
Brazil -.9 -.4
China -.8 -.5
Indonesia -.2 -.1
Finland -.1 -.1
France -.2 -.1
Germany -.2 -.2
Russia -.3 -.2
Sweden -.2 -.1
WORLD-8.6
(-2%)-5.7
(-1%)
ΔSawnwood consumption in 2030 @ $30/t CO2e
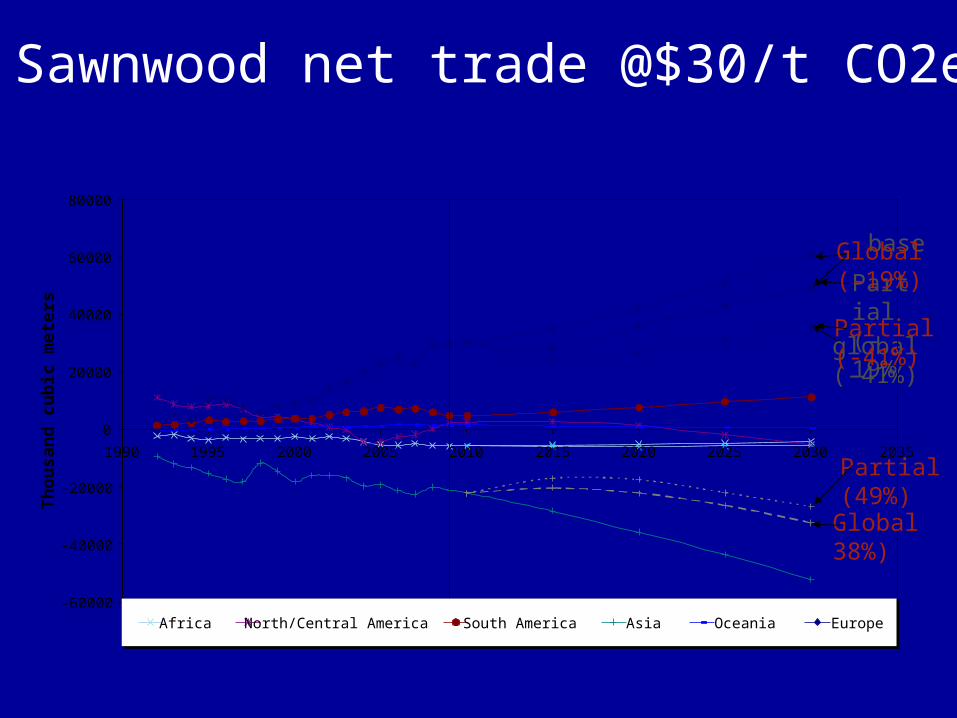
Sawnwood net trade @$30/t CO2e
global (-41%)
Partial(-19%
base
-60000
-40000
-20000
0
20000
40000
60000
80000
1990 1995 2000 2005 2010 2015 2020 2025 2030 2035
Year
Th
ou
san
d c
ub
ic m
eter
s
Africa North/Central America South America Asia Oceania Europe
Global (-19%)
Partial(-41%)
Global 38%)
Partial(49%)
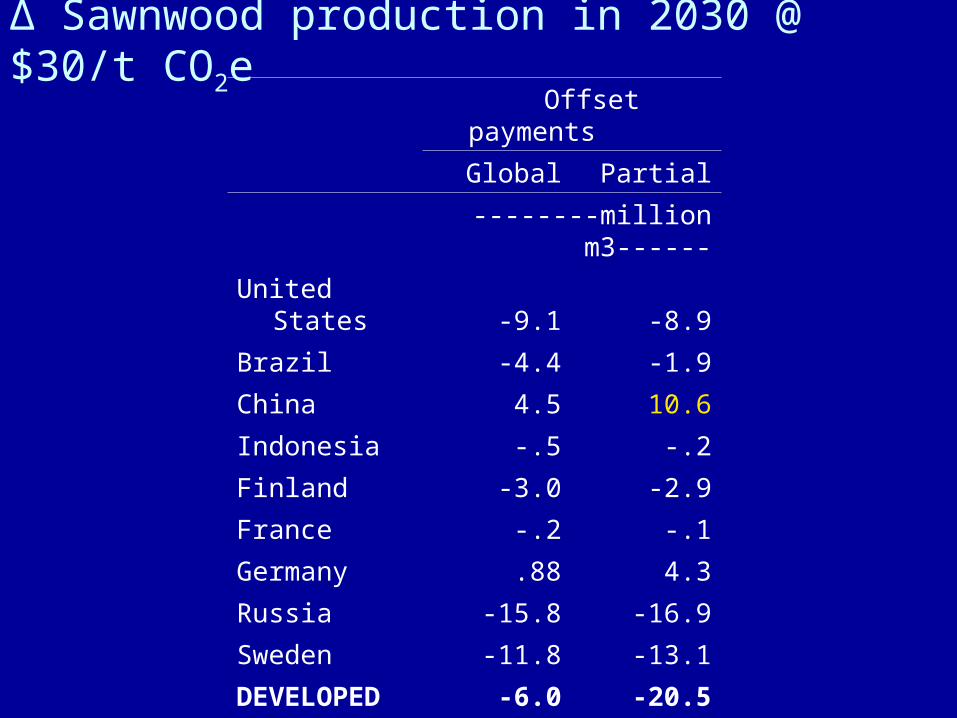
Offset payments
Global Partial
--------million m3------
United States -9.1 -8.9
Brazil -4.4 -1.9
China 4.5 10.6
Indonesia -.5 -.2
Finland -3.0 -2.9
France -.2 -.1
Germany .88 4.3
Russia -15.8 -16.9
Sweden -11.8 -13.1
DEVELOPED -6.0 -20.5
DEVELOPING -2.6 14.8
WORLD -8.6(-2%) -5.7(-1%)
Δ Sawnwood production in 2030 @ $30/t CO2e
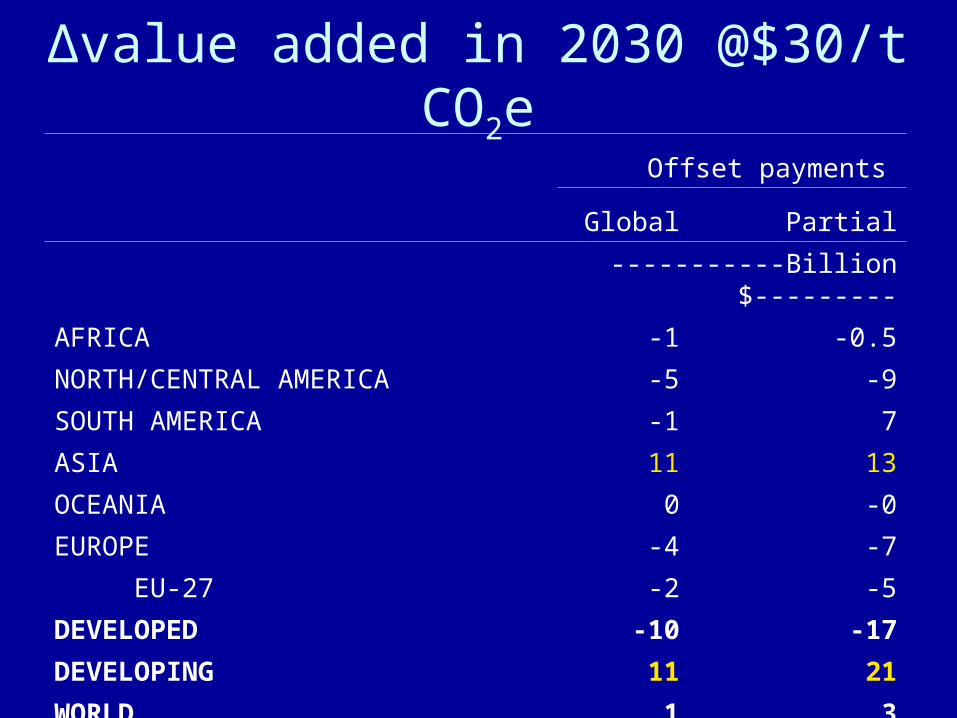
Δvalue added in 2030 @$30/t CO2e
Offset payments
Global Partial
-----------Billion $---------
AFRICA -1 -0.5
NORTH/CENTRAL AMERICA -5 -9
SOUTH AMERICA -1 7
ASIA 11 13
OCEANIA 0 -0
EUROPE -4 -7
EU-27 -2 -5
DEVELOPED -10 -17
DEVELOPING 11 21
WORLD 1 3
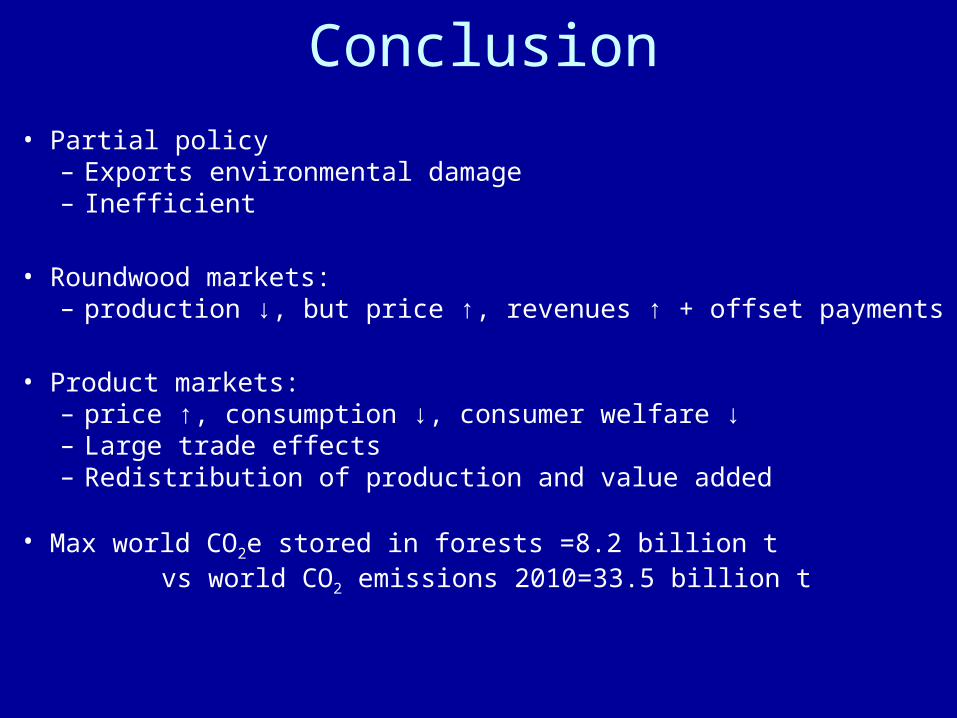
• Partial policy– Exports environmental damage– Inefficient
• Roundwood markets:– production ↓, but price ↑, revenues ↑ + offset payments
• Product markets:– price ↑, consumption ↓, consumer welfare ↓– Large trade effects– Redistribution of production and value added
• Max world CO2e stored in forests =8.2 billion t vs world CO2 emissions 2010=33.5 billion t
Conclusion

Acknowledgments
• USDA Forest Service Southern Research Station
• Jeffrey P. Prestemon
Thank you!