Embed Size (px)
Citation preview
Chihuahuan Desert researCh instituteP.O. Box 905Fort Davis, TX 79734www.cdri.org
Conservation Blueprint for the Chihuahuan Desert Ecoregion
Authors: Gary P. Bell, Steven Yanoff, John Karges, Jennifer Atchley Montoya, Sonia Najera, Angélica Ma. Arango, and Adrian Ganem Sada
Source: Cathryn A. Hoyt and John Karges (editors) 2014. Proceedings of the Sixth Symposium on the Natural Resources of the Chihuahuan Desert Region October 14–17, 2004. pp. 1–36.
Published by: The Chihuahuan Desert Research Institute, Fort Davis, TX.Submitted in 2004
Recommended citation: Bell, G.P., S. Yanoff, J. Karges, J. A. Montoya, S. Najera, A. Ma. Arango, and A.G. Sada. 2014. Conservation blueprint for the Chihuahuan Desert ecoregion. In: C.A. Hoyt & J. Karges (editors). Proceedings of the Sixth Symposium on the Natural Resources of the Chihuahuan Desert Region. October 14–17. Chihuahuan Desert Research Institute, Fort Davis, TX. pp. 1–36. http://cdri.org/publications/proceedings-of-the-symposium-on-the-natural-resources-of-the-chihuahuan-desert-region/
Material from this symposium proceedings may be linked to, quoted or reproduced for personal, educational, or non-commercial scientific purposes without prior permission, pro-vided appropriate credit is given to the Chihuahuan Desert Research Institute and, if stated, the author or photographer, subject to any specific terms and conditions for the respective content. Text and images may not be sold, reproduced or published for any other purpose without permission from the Chihuahuan Desert Research Institute and any additional copyright holder, subject to any specific terms and conditions for the respective content. For permission, please contact us at 432.364.2499.
For complete Terms and Conditions of Use visit:http://cdri.org/publications/proceedings-of-the-symposium-on-the-natural-resources-of-the-chihuahuan-desert-region/#sympterms
1
Conservation Blueprint for the Chihuahuan Desert Ecoregion
Gary P Bell,* Steven yanoff, John KarGeS, Jennifer atchley Montoya, Sonia naJera, anGélica Ma. aranGo, and adrian GaneM Sada
Nature Conservancy of Canada, 180 Chandler Avenue, Ottawa, Ontario KC2 0G2, Canada (GPB)
The Nature Conservancy, HC 31 Box 38, Carrizozo NM 88301 (SY)
The Nature Conservancy, P.O. Box 2137, Alpine, TX 79831 (JK)
World Wildlife Fund, 100 East Hadley Street, Las Cruces, NM 88001 (JAM)
The Nature Conservancy, P.O. Box 2563, Corpus Christi, TX 78403 (SN)
Pronatura Noreste A.C., Loma Larga 235, Esq. con Loma Florida, Col. Loma Larga, Monterrey, 64710, N.L. (AMA, AGS)
*Correspondent: [email protected]
aBStract—We report on a Chihuahuan Desert Ecoregion conservation planning effort conducted through an international partnership of planners, scientists, and practitioners. Building on past efforts we used data on the status and distribution of species, natural communities, and ecological systems to delineate a set of areas that, if properly managed, would promote the long-term survival of the biodiversity of the Chihuahuan Desert. We delineated 125 primary terrestrial conservation areas, 464 secondary terrestrial areas needing additional data and field verification, and 74 aquatic conservation areas totaling approximately 21 million hectares. The full report on this effort, including detailed appendices, maps, and supplemental data, are available on the CD attached to this volume.
reSuMen—Se presenta el esfuerzo de scientificos, planificadores, y manejadores internacionales en el desarollo del Plan Ecoregional del Desierto Chihuahuense. Aumentando los esfuerzos de otros grupos, usamos datos sobre estatus y distribución de especies, comunidades naturales y sistemas ecologicas para determinar un juego de áreas que, si manejado adecuadamente, promueven la sobrevivencia de la biodiversidad del Desierto Chihuahuense. Se deslineo 125 areas de conservación terrestres primarias, 464 areas de conservación terrestres secundarias que requiren datos adicionales y 74 areas de conservación aquaticas sumando en total aproximadamente 21 milliones de hectareas. El reporte completo que incluye apendices, mapas, y datos adicionales en forma detallado esta disponible en CD.
The Chihuahuan Desert is the most biologically diverse desert in the Western Hemisphere and one of the most diverse arid regions in the world. This large upland desert on the Mexican Plateau is isolated from surrounding arid regions by the high mountains of the Sierra Madre Oriental, the Sierra Madre Occidental, and the
2
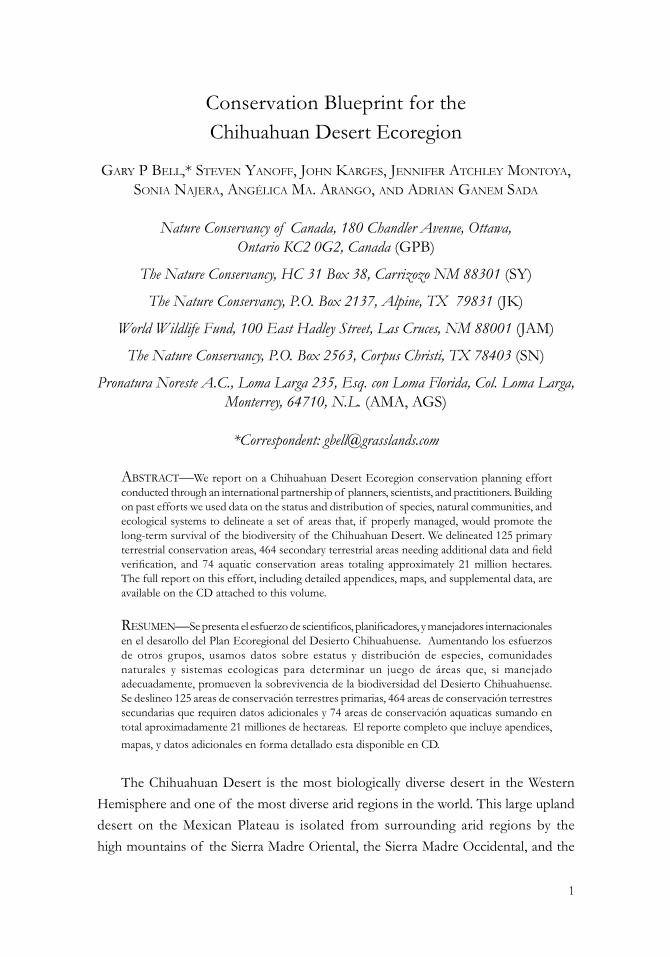
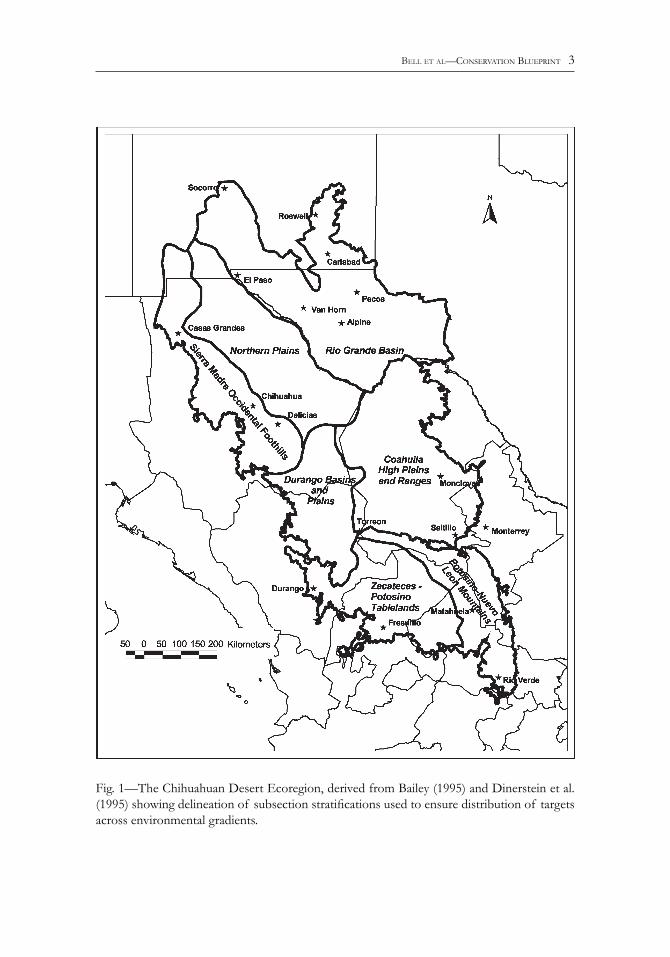
mountains of Arizona and New Mexico. This isolation has produced an area rich in endemic species, especially among plants and reptiles. Many different definitions and boundaries have been described for the Chihuahuan Desert (Schmidt 1979; Johnston 1977). The boundary we use here is modified after the work of Dinerstein et al. (1995), and incorporating Bailey’s (1995) boundary within the United States. The resulting ecoregion (Fig. 1) covers 61,157,386 hectares. The ecoregion extends nearly 1,500 km from just south of Albuquerque, New Mexico, to the Trans-Mexican Volcanic Belt just 250 km north of Mexico City, including much of the states of Chihuahua, Coahuila, Durango, Zacatecas, and San Luis Potosi, as well as large parts of New Mexico and the Trans-Pecos region of Texas. Most of the ecoregion lies between 900 and 1500 m, although foothill areas and some isolated mountain ranges in Meseta Central may rise to more than 3000 m. Schmidt (1979) notes the relative uniformity of climate within the ecoregion; hot summers and cool to cold, dry winters. This uniformity is due to the more-or-less equal distance of most areas of the desert from moisture sources (Gulf of Mexico and the Sea of Cortez), the uniformity of elevation of surrounding mountain masses, and the position of the desert on the continent that results in little frontal precipitation. The Chihuahuan Desert has more rainfall than other warm desert ecoregions, with precipitation typically ranging from 150 to 500 mm annually, an average of about 235 mm, and a high percentage falling in the form of monsoonal rains during the summer months (Schmidt 1979). We divided the ecoregion into three north-south primary sections and seven subsections within those, based upon patterns of geology, soils, and vegetation (Fig. 1) and as described here. The “Northern Chihuahuan” section includes the area of grasslands and desert scrub straddling the Rio Bravo/Rio Grande Valley, as well as a number of isolated, north-south-trending “Sky Island” mountain ranges. The Northern Chihuahuan is further subdivided into three subsections, the “Rio Grande Basin” (Cuenca del Rio Grande), the “Northern Plains” (Llanuras del Norte), and “Sierra Madre Occidental Foothills” (Pie de Monte de la Sierra Madre Occidental). The “Mapimi Basin” section (Bolson de Mapimi) consists of a series of basins and ranges with a central highland between the Sierra Madre Oriental and Rio Grande, and lying north of the Sierra Madre Oriental and the Mexican Plateau, extending across most of Coahuila into Durango. The Mapimi Basin section is subdivided into two subsections; the “Durango Basins and Plains” (Bolsones y Llanuras Duranguenses) and the “Coahuila High Plains and Ranges” (Sierras y Llanos Altos Coahuilenses).
Bell et al—conServation BluePrint 3
Fig. 1—The Chihuahuan Desert Ecoregion, derived from Bailey (1995) and Dinerstein et al. (1995) showing delineation of subsection stratifications used to ensure distribution of targets across environmental gradients.
Bell et al—conServation BluePrint 4
The “Meseta Central” section, considered by some to be a separate ecoregion, is dominated by desert plains and mountains that rise up to 2,400 m above sea level. The Meseta Central section is subdivided into two subsections; the “Zacatecas–Potosino Tablelands” (Meseta Zacatecano–Potosina), and the “Potosino–Nuevo Leon Mountains” (Sierras Potosino–Neoleonenses). Biodiversity Status—The Chihuahuan Desert evolved recently—9,000 years ago this area was much more mesic and with mountain slopes dominated by coniferous woodland (Wells 1977; Allen et al. 1998, Van Devender 1990). Miller (1977) suggests that the region served as a post-Pleistocene dispersal route for many organisms, and that as aridity increased the result was isolation, differentiation, and extinction that led to the unique Chihuahuan biota of today. Johnston (1977) indicates that the Sierra Madre Oriental, that forms the eastern boundary of the Chihuahuan Desert, is one of the oldest and richest centers of plant evolution on the North American continent. Johnston maintains that the northern Chihuahuan Desert is essentially a broad physiographic expansion of the Sierra Madre Oriental, and that the flora of this region has its strongest affinities with this high mountain block. There are at least 1,000 endemic plant taxa in the Chihuahuan Desert (Johnston 1977; Dinerstein et al. 2000)—an astonishing richness of biodiversity. This high desert area is a center for endemism of yuccas and cacti (Hernandez and Barcenas 1995). The dominant plant species throughout the Chihuahuan Desert is creosote bush (Larrea tridentata), but large areas of the region are grama grasslands, with black grama (Bouteloua eriopoda) characteristic, and mesic swales of tobosa (Hilaria mutica) and giant sacaton (Sporobolus wrightii). The Chihuahuan Desert also supports more than 120 species of mammals, 300 species of birds, 110 species of fish, and more than 170 species of amphibians and reptiles. The mammal and bird faunas are largely comprised of widespread and common species, and there are few endemics (Findley and Caire 1977; Phillips 1977). Nevertheless, the Chihuahuan Desert grasslands serve as wintering grounds for a large proportion of North American Great Plains birds including a number of significantly declining species such as mountain plover (Charadrius montanus), ferruginous hawk (Buteo regalis), and Baird’s sparrow (Ammodramus bairdii). Also of significance is that the largest remaining black-tailed prairie dog (Cynomys ludovicianus) complex on the continent and the only populations of the endemic Mexican prairie dog (Cynomys mexicanus) occur in the Chihuahuan Desert. Morafka (1977) indicates that at least 18 species of reptiles and amphibians are endemic to the Chihuahuan Desert, including the bolson tortoise (Gopherus
Bell et al—conServation BluePrint 5
flavomarginatus), black softshell turtle (Apalone ater, formerly Trionyx), and the Chihuahuan fringe-toed lizard (Uma exsul). A striking number of endemic fish occur in the Chihuahuan Desert—nearly half of the species in the ecoregion are either endemic or of limited distribution. Most of these are relict pupfish (Cyprinodontidae), shiners (Cyprinidae), livebearers (Poeciliidae), and Mexican livebearers (Goodeidae) found in isolated springs in the closed basins of the region. The best known of these aquatic basins is Cuatro Ciénegas in central Coahuila, but other significant areas of endemism include the Rio Nazas, Media Luna, the Guzman Basin (Miller 1977; Minckley 1977; Minckley et al. 1991), and the Pecos Plain. At least one undescribed species of trout (Oncorhynchus) occurs in the Chihuahuan Desert ecoregion as an evolutionary isolate in headwater streams in the Sierra Madre Occidental (Hendrickson et al., 1999, pers. comm., Annual Symposium of the Desert Fishes Council). MethodS—Building on previous efforts we used data on the status and distribution of species, natural communities, and ecological systems to delineate a conservation portfolio for the Chihuahuan Desert ecoregion. The Chihuahuan Desert Portfolio was developed through a joint effort of Pronatura Noreste, World Wildlife Fund, and The Nature Conservancy. The portfolio complements the World Wildlife Fund’s recent “Chihuahuan Desert Biological Assessment” (Dinerstein et al. 2000). Other organizations and individuals contributed substantial information and expertise. The tasks of compiling and processing data, generating a portfolio and assessing results were accomplished across state and international boundaries. The portfolio is comprehensive in scope as it combines ample quantitative data, a powerful computer model, the knowledge of experts, and results of previous conservation efforts to produce a shared vision for Chihuahuan Desert conservation. A conservation portfolio is a set of areas that, if managed appropriately, would conserve viable examples of the biodiversity of the entire ecoregion (The Nature Conservancy 2000; Groves 2003). In recognition of practical limits on our ability to implement conservation on an ecoregional scale, a companion goal is that the portfolio should be efficient in size. Conservation areas must also be sufficiently intact and functional to sustain the ecoregion’s ecosystems and biota. Finally, the portfolio should compensate, where possible, for biodiversity losses that have resulted from accelerated human impacts, particularly over the past 100 to 200 years (Pimm et al. 1995). We chose a two-tiered approach to portfolio assembly. Ecological systems (vegetation types combined with landscape features), vegetation-sites, indicator species,
Bell et al—conServation BluePrint 6
and keystone species were considered coarse-filter conservation targets. Consequently, we created the special class of larger scaled targets called vegetation sites which included landscape features such as desert grasslands and montane forests. These targets approximate ecosystems in scale and complexity. Though rare species are the traditional focus of conservation efforts, a consensus has grown that such species persist only in the context of functional ecosystems (Franklin 1993; Flather et al. 1998; Poiani et al. 2000). The aim of the coarse filter is to embrace the principal ecological processes and components of the Chihuahuan Desert, and in so doing create an umbrella to capture the plants and animals that depend on those systems. Fine-filter targets comprise the second tier of our approach. These are rare taxa and those that are characteristic of the Chihuahuan Desert. The fine-filter ensures that all biological components of the desert, including those that might slip by the coarse-filter, are represented. For the purpose of assembling a portfolio, the coarse and fine-filter targets are considered practical surrogates for biodiversity conservation. To develop a portfolio of terrestrial conservation areas we used the SITES computer model (Davis et al. 2002). The huge area of the Chihuahuan Desert presented a technical problem for creating a single ecoregion-wide portfolio of terrestrial conservation areas since the computational limits of SITES were exceeded by such a large area. As a solution we developed a separate portfolio for each of the three major sections of the ecoregion. During the portfolio review process we carefully assessed proposed conservation areas associated with section boundaries to ensure that the three portfolios are compatible and make sense as an ecoregion-wide conservation solution. Portfolio assembly was carried out at the level of planning units—2000-hectare hexagons that cover the ecoregion. Planning units of uniform size and shape have the advantage of “leveling the playing field” so that conservation areas are identified based on clear parameters, rather than factors that may be difficult to understand or quantify. These parameters include the known distributions of conservation targets, numeric and area goals for capturing targets, the degree of human impacts, and the overall size of the portfolio. Targets represent the full complement of ecoregional biodiversity, and include ecological systems, selected vegetation sites, plant communities, and species. SITES can select planning units individually or in aggregation, depending on the specific targets and goals. The chief disadvantage of these planning units is that they do not, of themselves, represent conservation areas, even when aggregated. Rather, they provide a first approximation of conservation area boundaries to be reassessed in detail during more specific site-based planning efforts.
Bell et al—conServation BluePrint 7
Portfolio assembly entailed several steps. Criteria for identifying conservation targets were established and a conservation target list was developed. Location records for targets were compiled from various sources and standardized. Species locations were combined to approximate populations. Ecological system and vegetation-site locations were honed using a landcover map of the ecoregion. Quantitative goals, intended to support target viability, were set to govern each target’s level of representation in the portfolio. An impacts assessment was developed for the ecoregion that highlights intact areas and those with low human impacts. The aquatic portfolio was assembled manually. Again, portfolio assembly entailed several steps: target criteria were established, a target list was developed, target locations were compiled, and target goals were set. We lacked the necessary data to assemble a classification of aquatic community types for the Chihuahuan Desert. Therefore we were unable to take a coarse-filter approach to aquatic portfolio assembly and were forced to rely upon species-occurrence data. The aquatics portfolio was heavily influenced by occurrence data on native fishes, although a few additional aquatic taxa were included in the analysis. Results for both terrestrial and aquatic portfolios were reviewed by a team of scientists, planners, and land managers and adjusted to better meet goals and reflect biological and practical reality. The review team balanced the computer-generated draft portfolios with first-hand knowledge of the ecoregion and integrated other existing conservation plans. In the final step the portfolio was assessed as to how it compares to the ecoregion in terms of physical and biological composition, anthropogenic impacts, and fragmentation. Target Selection and Target Occurrences—A crucial first step in portfolio assembly was the creation of a conservation target list. To encompass the range of elements and processes that comprise ecoregional biodiversity, we selected targets at different geographic and ecological scales, from intact portions of the landscape to individual species populations. Targets also included endemics, and rare and declining species that might be overlooked but need immediate protection. A draft list of terrestrial targets was compiled from Pronatura Noreste, the Natural Heritage Information Systems (NatureServe 2002; Natural Heritage Information System 2002; Texas Conservation Data Center 2002), the 1997 World Wildlife Fund Chihuahuan Desert Conservation Workshop (Dinerstein et al. 2000), regional experts, and the literature. This list was circulated among biologists and ecologists for review and modification. Reviewers were asked to ensure that the list was complete and confirm that targets met at least one of the following criteria (The Nature Conservancy
Bell et al—conServation BluePrint 8
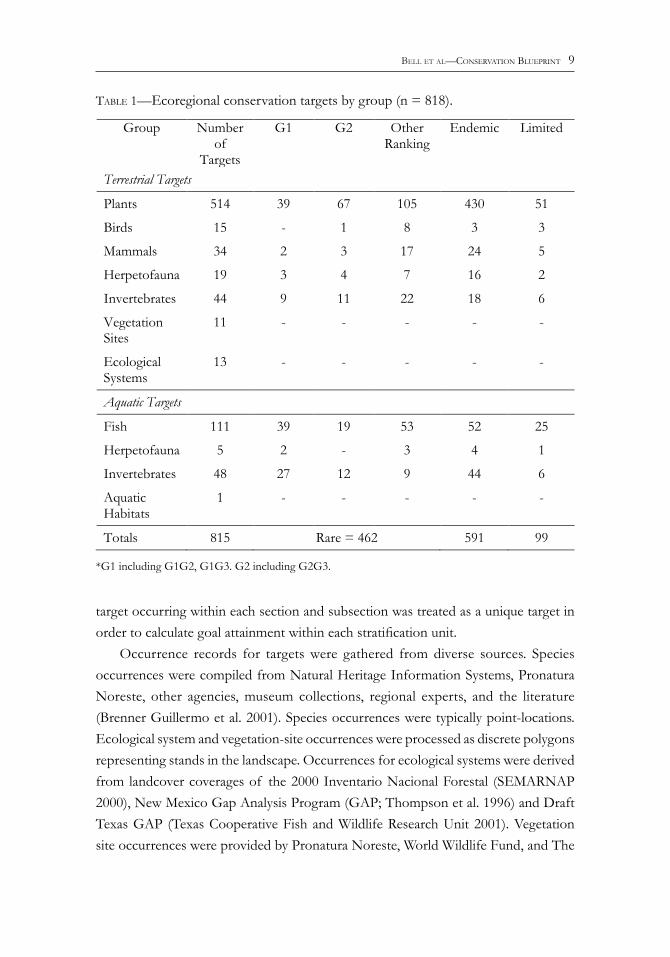
2000): (1) Rare, having TNC global ranks G1 to G3/T1 to T3, or deemed rare by an expert; (2) Endemic to the Chihuahuan Desert; (3) Limited to two or three ecoregions including the Chihuahuan Desert; (4) Disjunct populations important for evolution; (5) Key Indicators of quality habitat, such as fish species that indicate pristine aquatic conditions; (6) Keystone taxa, such as prairie dogs; (7) Taxa for which the Chihuahuan Desert is key to the target’s overall success, such as wintering migratory songbirds that are declining in their breeding range; (8) Taxa or plant communities for which we have evidence of serious immediate or impending decline but that lack documentation; and/or (9) Ecological systems that represent all naturally occurring plant communities in the ecoregion. Our next step was to develop an ecological system classification for the Chihuahuan Desert. Ecological systems are associations of vegetation types and their physical surroundings. For example, Chihuahuan Desert Grasslands are an ecological system that links a biological element—grasslands dominated by warm-season grasses—to the physical features of lower-elevation mountain basins and plains and a semi-arid climate. Ecological systems are important tools for conservation because they are comparable to ecosystems, serve as a coarse filter for other biodiversity elements, and can be spatially represented using landcover maps and digital elevation models. Our classification is based on vegetation classifications by Brown, Lowe, and Pase (1979), Jimenez-Guzman and Zuniga-Ramos (1991), Muldavin et al. (2000), Rzedowski (1978), Villarreal and Valdez (1993), and Wood et al. (1997, 1999). All naturally occurring vegetation types of the Chihuahuan Desert are embedded in the classification; however, we ultimately targeted very coarse ecological system classes, similar to vegetation types, due to limitations in our occurrence data. Because of these limitations we were challenged to distinguish high quality, intact examples of ecological systems to ensure that we captured superior occurrences of ecological systems in our portfolio. The final list of 815 conservation targets includes 626 terrestrial species, 164 aquatic species, 14 ecological systems, and 11 vegetation sites (Table 1 and on the accompanying compact disk with this symposium volume). There are 462 rare targets (G1 to G3), 591 endemics, and 99 of limited distribution. Since we relied so heavily upon species targets to select aquatic sites, we tried to be comprehensive in including native fish species as targets and in identifying extant occurrences of these. There are 164 rare targets and 100 endemics in our aquatics list. Species known or thought to be extinct were included in the list. Note that this summary lists unique elements across the ecoregion undifferentiated by section or subsection—for portfolio assembly each
Bell et al—conServation BluePrint 9
target occurring within each section and subsection was treated as a unique target in order to calculate goal attainment within each stratification unit. Occurrence records for targets were gathered from diverse sources. Species occurrences were compiled from Natural Heritage Information Systems, Pronatura Noreste, other agencies, museum collections, regional experts, and the literature (Brenner Guillermo et al. 2001). Species occurrences were typically point-locations. Ecological system and vegetation-site occurrences were processed as discrete polygons representing stands in the landscape. Occurrences for ecological systems were derived from landcover coverages of the 2000 Inventario Nacional Forestal (SEMARNAP 2000), New Mexico Gap Analysis Program (GAP; Thompson et al. 1996) and Draft Texas GAP (Texas Cooperative Fish and Wildlife Research Unit 2001). Vegetation site occurrences were provided by Pronatura Noreste, World Wildlife Fund, and The
taBle 1—Ecoregional conservation targets by group (n = 818).
*G1 including G1G2, G1G3. G2 including G2G3.
Group Number of
Targets
G1 G2 Other Ranking
Endemic Limited
Terrestrial Targets
Plants 514 39 67 105 430 51
Birds 15 - 1 8 3 3
Mammals 34 2 3 17 24 5
Herpetofauna 19 3 4 7 16 2
Invertebrates 44 9 11 22 18 6
Vegetation Sites
11 - - - - -
Ecological Systems
13 - - - - -
Aquatic Targets
Fish 111 39 19 53 52 25
Herpetofauna 5 2 - 3 4 1
Invertebrates 48 27 12 9 44 6
Aquatic Habitats
1 - - - - -
Totals 815 Rare = 462 591 99
Bell et al—conServation BluePrint 10
Nature Conservancy. We compiled 3,314 plant and 961 animal occurrence records, as well as 904 system target polygons, and 18 vegetation sites for a total of 5,197 terrestrial target occurrences. A general lack of occurrence data for aquatic targets required a much larger data-mining effort of museum collections for occurrence information, resulting in our adding more than 2,000 data occurrence records to the combined dataset. Locations of species-target occurrences in the U.S. and México were largely drawn from well-established biodiversity data archives, such as Natural Heritage Information Systems and collections of various museums and universities. Museum record occurrences were processed as point-locations, and collections without latitude and longitude information were georeferenced where sufficient locality information allowed. More than 96% of our 2,932 aquatic species target occurrences are of fish. Because of a severe lack of recent collections in most areas of the ecoregion, we frequently relied upon older occurrence data to imply the location of extant populations of aquatic target species. This approach requires that most of the aquatic portfolio areas, particularly those in México, need ground-truthing to determine whether the target elements still occur on those sites as viable populations. We modeled species locations to represent populations since the objective was to set goals for populations rather than occurrences of individual organisms (Morris et al. 1999). This was achieved by consolidating terrestrial species locations based on estimates of the minimum area required to support populations of each species, while aquatic species were consolidated to stream reaches and water bodies (see below for details). Target Goals—We established conservation goals for all targets. Goals ensure that the portfolio captures sufficient occurrences to support viable populations of targets in the ecoregion over the long-term. We consider a species target viable if a sufficient number of populations are included and spatially dispersed to withstand local extinctions, sustain genetic diversity, and are associated with habitat patches of suitable size (Morris et al. 1999). Ecological systems are considered viable if they occur in patches large enough to maintain dynamic ecological processes such as fire, are spatially dispersed, and comprise a reasonable proportion of their historical extents. We defined viability in practical terms that can be addressed through the target occurrence data. Thus goals are expressed in terms of the number of populations (species targets) or total area (ecological systems and vegetation sites), and their geographic distribution within the ecoregion. We also assumed that viability is greatest where human impacts are lowest,
Bell et al—conServation BluePrint 11
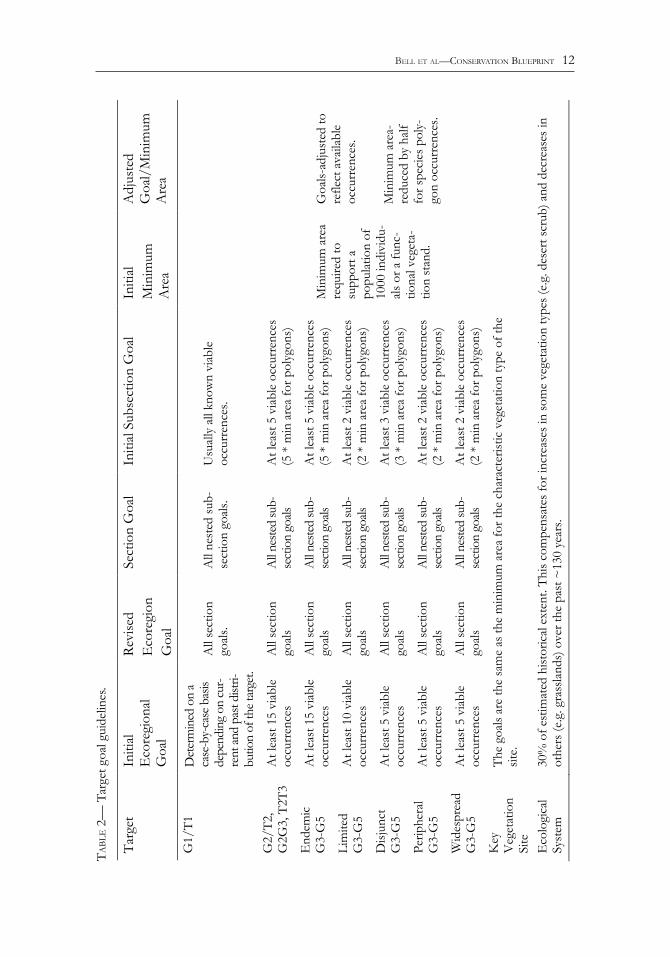
and we addressed this directly through a spatial impacts assessment and indirectly by setting minimum area requirements. Initial ecoregion-wide goals (Table 2) for each target were based on rarity, geographic range, and ecoregional distribution drawn from a literature review and consultation with experts. These optimal conservation goals are termed “ecological goals.” Ecological goals were stratified for each target at the subsection level. Subsection goals were then adjusted based on estimated target abundance: if a target was not expected to occur in a subsection its goal was zeroed, if it was incidental its goal was lowered, and goals in other subsections were increased to compensate. This increased the odds that the portfolio would capture actual target locations. Section goals were then set to the sum of subsection goals. Revised ecoregion-wide goals were set to the sum of section goals. Ecoregion and section goals were considered met only if all nested goals of their respective sections and subsections were met. Goals for aquatic targets were stratified by ecoregional section and subsection, but only for review purposes—portfolio assembly was not based upon stratification units since aquatic systems are not generally tied to terrestrial stratification. For portfolio assembly ecological goals were reduced to actual target occurrence amounts. This was necessary since selection of conservation areas that efficiently represent targets in terms of area and number depends on the use of actual, rather than perceived, occurrence locations. Such practical goals are termed “applied goals.” For most species targets, we estimated the minimum area required to support a population of 1,000 individuals, which represents our operational concept of a minimum viable population for 100 years. For wide-ranging species we estimated minimum areas for 250 individuals. Minimum areas for each target were based on the lowest published population densities, thus representing required area under suboptimal environmental conditions. When we could not find specific population density information on a species we used information on closely-related species. We set an ecoregion-wide goal of 30% of the historical extent for ecological systems, based on the species-area curve described by Dobson (1996). A discussion of the derivation of this number and setting of conservation goals for ecoregional assessment is provided in Groves (2003). Minimum areas for ecological systems were based on a combination of the habitat area of a typical associated species with large habitat requirements and the minimum area needed to support dynamic ecological processes such as fire. In cases of declining ecological systems, such as grasslands, minimum area also reflects the reality that existing stands function at smaller scales than in the past. Minimum area goals were not set for aquatic species or systems; rather, element occurrences were
Bell et al—conServation BluePrint 12
taBl
e 2
— T
arge
t goa
l gui
delin
es.
Targ
et
Initi
al
Eco
regi
onal
G
oal
Revi
sed
Eco
regi
on
Goa
l
Sect
ion
Goa
l In
itial
Sub
sect
ion
Goa
l In
itial
M
inim
um
Are
a
Adj
uste
d G
oal/
Min
imum
A
rea
G1/
T1
Det
erm
ined
on
a ca
se-b
y-ca
se b
asis
depe
ndin
g on
cur-
rent
and
past
distr
i-bu
tion
of th
e tar
get.
All
sect
ion
goal
s.
All
nest
ed su
b-se
ctio
n go
als.
Usu
ally
all
know
n vi
able
oc
curr
ence
s.
Min
imum
are
a re
quire
d to
su
ppor
t a
popu
latio
n of
10
00 in
divi
du-
als o
r a fu
nc-
tiona
l veg
eta-
tion
stan
d.
Goa
ls-ad
just
ed to
re
flect
ava
ilabl
e oc
curr
ence
s. M
inim
um a
rea-
redu
ced
by h
alf
for s
peci
es p
oly-
gon
occu
rren
ces.
G2/
T2,
G2G
3, T
2T3
At l
east
15
viab
le
occu
rren
ces
All
sect
ion
goal
s A
ll ne
sted
sub-
se
ctio
n go
als
At l
east
5 v
iabl
e oc
curr
ence
s (5
* m
in a
rea
for p
olyg
ons)
E
ndem
ic
G3-
G5
At l
east
15
viab
le
occu
rren
ces
All
sect
ion
goal
s A
ll ne
sted
sub-
se
ctio
n go
als
At l
east
5 v
iabl
e oc
curr
ence
s (5
* m
in a
rea
for p
olyg
ons)
Li
mite
d G
3-G
5 A
t lea
st 1
0 vi
able
oc
curr
ence
s A
ll se
ctio
n go
als
All
neste
d su
b-se
ctio
n go
als
At l
east
2 v
iabl
e oc
curr
ence
s (2
* m
in a
rea
for p
olyg
ons)
D
isjun
ct
G3-
G5
At l
east
5 v
iabl
e oc
curr
ence
s A
ll se
ctio
n go
als
All
neste
d su
b-se
ctio
n go
als
At l
east
3 v
iabl
e oc
curr
ence
s (3
* m
in a
rea
for p
olyg
ons)
Pe
riphe
ral
G3-
G5
At l
east
5 v
iabl
e oc
curr
ence
s A
ll se
ctio
n go
als
All
neste
d su
b-se
ctio
n go
als
At l
east
2 v
iabl
e oc
curr
ence
s (2
* m
in a
rea
for p
olyg
ons)
W
ides
prea
d G
3-G
5 A
t lea
st 5
via
ble
occu
rren
ces
All
sect
ion
goal
s A
ll ne
sted
sub-
sect
ion
goals
A
t lea
st 2
via
ble
occu
rren
ces
(2 *
min
are
a fo
r pol
ygon
s)
Key
V
eget
atio
n Si
te
The
goal
s are
the
sam
e as
the
min
imum
are
a fo
r the
cha
ract
erist
ic v
eget
atio
n ty
pe o
f the
sit
e.
Eco
logi
cal
Syst
em
30%
of e
stim
ated
hist
oric
al e
xten
t. Th
is co
mpe
nsat
es fo
r inc
reas
es in
som
e ve
geta
tion
type
s (e.
g. d
eser
t scr
ub) a
nd d
ecre
ases
in
othe
rs (e
.g. g
rass
land
s) o
ver t
he p
ast ~
130
year
s.
Bell et al—conServation BluePrint 13
aggregated such that entire reaches and stream networks were treated as viable target occurrences for the purposes of site selection. Impacts Assessment—We quantified major human impacts and identified intact areas across the ecoregion. We calculated the relative area of urban areas, tilled agricultural lands, roads, railroads, powerlines, protected areas, and sites considered to be intact. Results were used to deter or restrict SITES from selecting affected areas, to encourage SITES to select protected and intact areas, and to assess portfolio results. It should be noted that the information we obtained on impacts varied in quality and completeness between states and countries. Therefore, we excluded some types of impacts from the impacts assessment including dam, well and mine locations, and the distribution and intensity of logging, mining, and livestock grazing. Sources for the locations and areas of urban and crop lands were the 2000 Inventario Nacional Forestal (SEMARNAP 2000), New Mexico GAP (Thompson et al. 1996) and draft Texas GAP landcover maps. Road, railroad, and powerline spatial layers were from The Nature Conservancy’s GIS data archive. Protected area data were obtained from the New Mexico GAP land protection status coverage (Thompson et al. 1996), The Nature Conservancy of Texas, and Pronatura Noreste. Typically, government lands such as parks and refuges, and military reservations with limited public access, along with non-governmental land trusts and preserves, are considered dedicated protected areas. Intact areas were obtained from the 1997 World Wildlife Fund Chihuahuan Desert Conservation Workshop (Dinerstein et al. 2000). Biophysical Model—We developed a biophysical model that combines biotic and abiotic features of the Chihuahuan Desert ecoregion. The model was a means to represent the biological, ecological, and physical diversity of the ecoregion. As such, we considered the model a rough surrogate for the ecosystems of the Chihuahuan Desert. The model was also used to help evaluate the portfolio. By comparing the portfolio to the ecoregion we were able to estimate the proportion of biophysical variation captured in the portfolio. Abiotic features of the model were elevation, slope, slope-aspect, landform, an index of moisture availability, intermittently wet arroyos, playas and wetlands, and soils. These are physical components of ecosystems easily represented in a GIS. The model was developed separately for each ecoregional section to isolate large-scale physiographic influences such as latitude and regional weather systems. Except for soils and intermittently wet areas these data were derived from a 60 m digital elevation model. Locations of intermittently wet areas were obtained from The Nature Conservancy’s GIS data archive. We obtained a standardized soils classification of México and
Bell et al—conServation BluePrint 14
the U.S. from the National Resources Conservation Service (Almaraz and Eswaran 1998). That classification was cross-walked to the State Soil Geographic Data Base, or STATSGO (http://www.nrcs.usda.gov/technical/techtools/stat_browser.html), and then generalized to common soil texture and chemistry attributes. An example of an abiotic mapping unit is “Northern Chihuahuan Desert mid-elevation south-facing lower montane dry moderately-steep slopes with gravelly soils.” Biological features of the model were ecological systems. Though the Chihuahuan Desert ecological systems were intended to represent both vegetation and their associated physical features, and so should be similar to biophysical units, they were more or less generalized to vegetation types. The biophysical model, in part, estimated the range of variation within ecological systems. The model contained 9,118 biophysical units and over 900,000 biophysical unit patches. Selecting Terrestrial Conservation Areas Using SITES—We used the SITES computer program (Davis et al. 2002) to identify potential terrestrial conservation areas. SITES has been used by The Nature Conservancy and others to create networks of potential conservation areas. SITES was developed to simplify the task of identifying conservation areas across large areas where options are overwhelming and information is complex. SITES meets target goals while simultaneously avoiding impacted areas and limiting total portfolio size. SITES uses a partial optimization algorithm (Possingham et al. 2000, Pressey et al. 1996, McDonnell et al. 2002) that is capable of processing huge datasets and comparing millions of alternative networks of conservation areas. Though the algorithm does not compare all possible networks it is considered an effective and practical means for identifying conservation areas at the ecoregional scale. SITES is conveniently viewed as a cost-benefit analysis. Costs increase with larger portfolios and greater impacts, and benefits are accrued by capturing targets and meeting target goals. Costs and benefits are specified interactively, and it is their balance that determines the ultimate shape of the portfolio. In summary, we covered the ecoregion with 2,000-hectare hexagons and designated these as planning units. Target lists, locations and goals, and impacts and intact areas were input into SITES. Scores were assigned to targets, impacts, and intact areas that correspond to costs and benefits. SITES parameters that discount more clustered (rather than scattered) conservation areas were selected. SITES was run ten times for each ecoregional section, each run consisting of 10 million iterations, or groupings, of possible conservation areas. Ultimately, each run generated a single proposal for a conservation area network, or ten proposals per section. For each of these sets of ten proposals SITES ranked one as most effective at meeting target goals while
Bell et al—conServation BluePrint 15
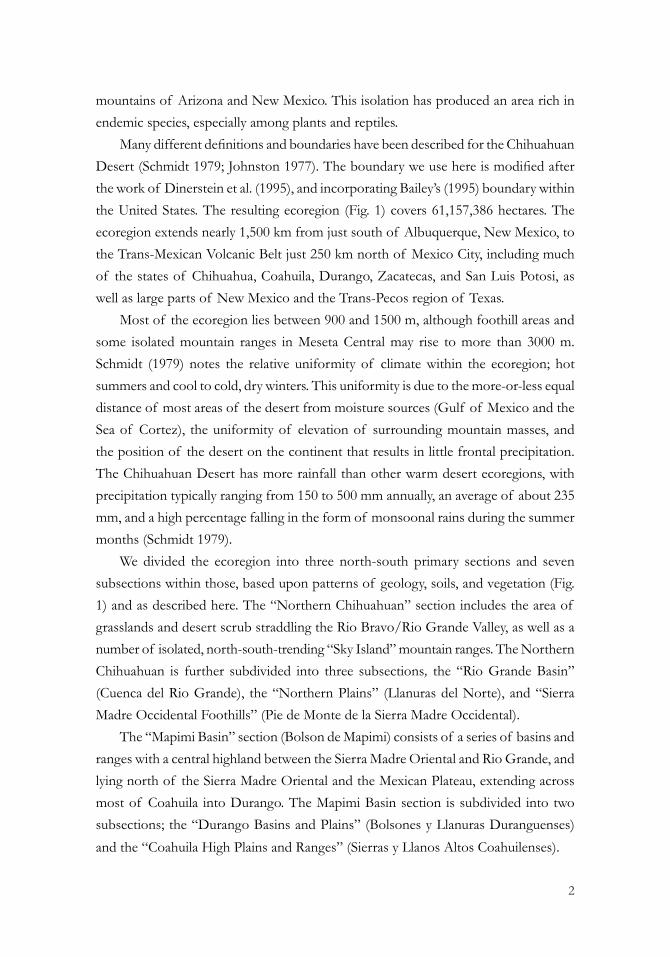
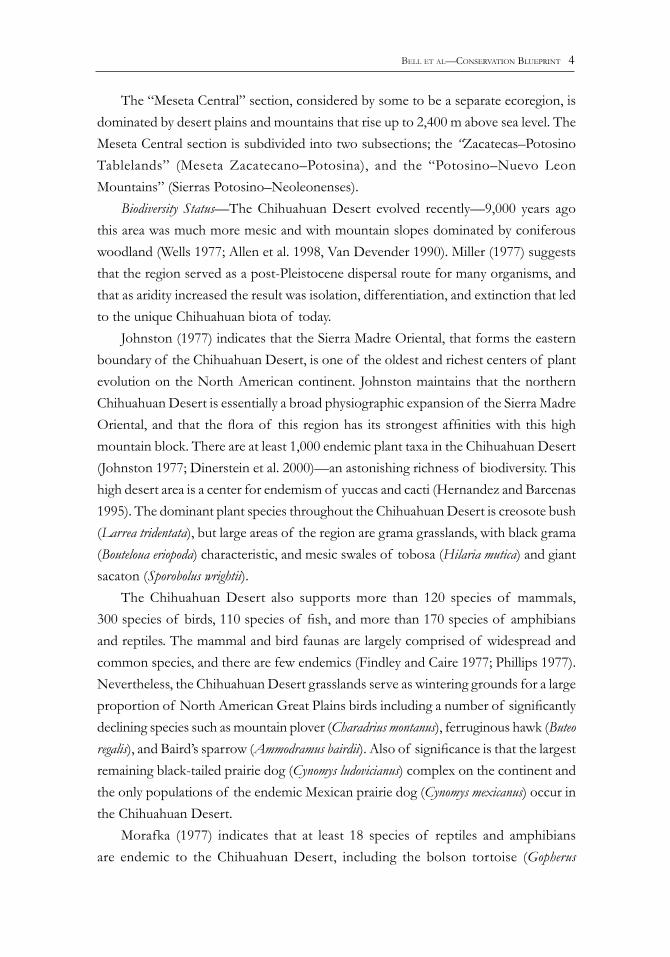
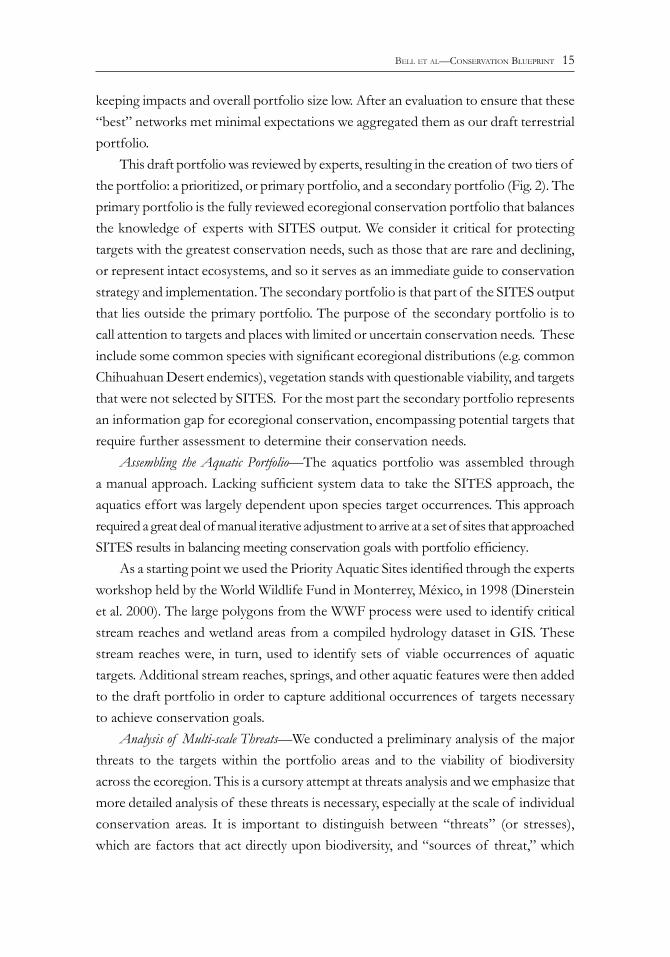
keeping impacts and overall portfolio size low. After an evaluation to ensure that these “best” networks met minimal expectations we aggregated them as our draft terrestrial portfolio. This draft portfolio was reviewed by experts, resulting in the creation of two tiers of the portfolio: a prioritized, or primary portfolio, and a secondary portfolio (Fig. 2). The primary portfolio is the fully reviewed ecoregional conservation portfolio that balances the knowledge of experts with SITES output. We consider it critical for protecting targets with the greatest conservation needs, such as those that are rare and declining, or represent intact ecosystems, and so it serves as an immediate guide to conservation strategy and implementation. The secondary portfolio is that part of the SITES output that lies outside the primary portfolio. The purpose of the secondary portfolio is to call attention to targets and places with limited or uncertain conservation needs. These include some common species with significant ecoregional distributions (e.g. common Chihuahuan Desert endemics), vegetation stands with questionable viability, and targets that were not selected by SITES. For the most part the secondary portfolio represents an information gap for ecoregional conservation, encompassing potential targets that require further assessment to determine their conservation needs. Assembling the Aquatic Portfolio—The aquatics portfolio was assembled through a manual approach. Lacking sufficient system data to take the SITES approach, the aquatics effort was largely dependent upon species target occurrences. This approach required a great deal of manual iterative adjustment to arrive at a set of sites that approached SITES results in balancing meeting conservation goals with portfolio efficiency. As a starting point we used the Priority Aquatic Sites identified through the experts workshop held by the World Wildlife Fund in Monterrey, México, in 1998 (Dinerstein et al. 2000). The large polygons from the WWF process were used to identify critical stream reaches and wetland areas from a compiled hydrology dataset in GIS. These stream reaches were, in turn, used to identify sets of viable occurrences of aquatic targets. Additional stream reaches, springs, and other aquatic features were then added to the draft portfolio in order to capture additional occurrences of targets necessary to achieve conservation goals. Analysis of Multi-scale Threats—We conducted a preliminary analysis of the major threats to the targets within the portfolio areas and to the viability of biodiversity across the ecoregion. This is a cursory attempt at threats analysis and we emphasize that more detailed analysis of these threats is necessary, especially at the scale of individual conservation areas. It is important to distinguish between “threats” (or stresses), which are factors that act directly upon biodiversity, and “sources of threat,” which
Bell et al—conServation BluePrint 16
Fig. 2—The Terrestrial Portfolio of Conservation Areas selected using SITES and manual editing to capture viable examples of all terrestrial conservation targets.
Bell et al—conServation BluePrint 17
are the ultimate activities or situations that lead to those threats. For example, stream sedimentation is considered a serious threat to aquatic biodiversity and one that has a number of direct effects on the system including reduction of water-oxygen content, reduced visibility, covering of food, siltation of nest sites, and killing of eggs. But sedimentation can be from a variety of different sources including grazing, residential or commercial development, channelization, construction of ditches, dikes and diversions, conversion to agriculture, and crop production practices. Conversely, one source of threat may result in many different threats. For example, grazing management may result in sedimentation, streambed alteration, and direct destruction of native plants. Our objective in this process was to identify those sources of threat which are having the most pervasive impacts on the biodiversity of the ecoregion, and to try to determine which of those sources of threat might be addressed through various multi-site strategies to abate the threats that they cause. There are three different measures of sources of stress: a) Severity. Severity is the degree to which an identified source of stress actually
threatens the integrity of a site and the targets it contains. For example, altered fire regime may have no impact on an aquatic site but may be a severe threat to fire-adapted communities such as ponderosa pine woodland or bunchgrass prairie. For each threat we asked the experts to rank severity as: 1 (Low), 2 (Medium), or 3 (High).
b) Immediacy. Immediacy is the likelihood that a particular source of stress will affect a site regardless of the severity. We asked the experts to rank immediacy as: 1 (likely to occur in the next 20 years); 2 (likely to occur in the next five years); or 3 (occurring now).
c) Reversibility. This is the degree to which a source of stress can be removed, its effects erased, and a site restored. For example, loss of a natural fire regime might be highly to moderately reversible in some systems through the introduction of fuel management and prescribed fire. On the other hand, the loss of habitat through urbanization or the construction of highways is not likely to be reversed. We asked the experts to rank each source of stress at each site as: 1 (easily reversed); 2 (can be reversed with high cost and effort); or 3 (effects irreversible).
For each conservation area we attempted to identify the sources of stress affecting each, and assign scores for severity, immediacy, and reversibility. It is important here to note that, in most cases, the listing of a source of threat does not necessarily mean that
Bell et al—conServation BluePrint 18
that source or activity is incompatible with conservation of the portfolio. Conservation of a portfolio will, under most circumstances, mean ensuring that such threats-activities are managed so as to minimize their impact on the conservation targets. Biological Irreplaceability of the Conservation Portfolio—A second metric for setting priority for conservation action among conservation areas is the degree of biological uniqueness of each site. There are various ways of measuring the biological uniqueness or value of particular areas, including measures of species richness and biological diversity. In our analysis we are interested in the degree of irreplaceability of an area; in other words, how likely are we to be able to find another area containing the same conservation targets of a conservation area if that site is lost or compromised. The simplest measure of irreplaceability might be the number of conservation targets found only on that particular site. But for our analysis we need to take into account all targets that are seriously limited in distribution within the portfolio; i.e. all targets for which that site is critical to meeting conservation goals. In order to capture this definition in a single metric we summed the total of the number of all targets at each site divided by the number of sites at which those targets were found. In other words, in our target sum, all targets that are at or below conservation goals and found only on one site get a score of 1; all targets found on only two sites get a score of 0.5; all targets found on only three sites get a score of 0.3334, etc. Setting Priorities Among Portfolio Areas for Conservation Action—We used combined scores of degree of threat and irreplaceability to set priorities for conservation action at each of the aquatic and primary terrestrial conservation areas within the portfolio. We consider priority to be a measure of sequencing rather than importance, since the portfolio is considered to be a complete conservation blueprint for the Chihuahuan Desert ecoregion.
reSultS—The total area of the primary terrestrial portfolio is 17,748,591 hectares (43,857,549 acres) or 29% of the ecoregion. There are 125 primary conservation areas with a mean size of 141,988 hectares (350,860 acres). The combined ecoregion-wide terrestrial portfolio (non-redundant overlap of primary and secondary conservation areas) captured 98% of all conservation targets (Table 3). The sectional portfolios were much less efficient at capturing targets: we failed to capture at least 25% of all targets in each section. To understand the difference between ecoregion-wide and sectional results note that at the ecoregion-wide level a target was considered captured if any amount of its goal, > 0, was captured anywhere in the ecoregion. Thus there was a greater chance of capturing only one occurrence
Bell et al—conServation BluePrint 19
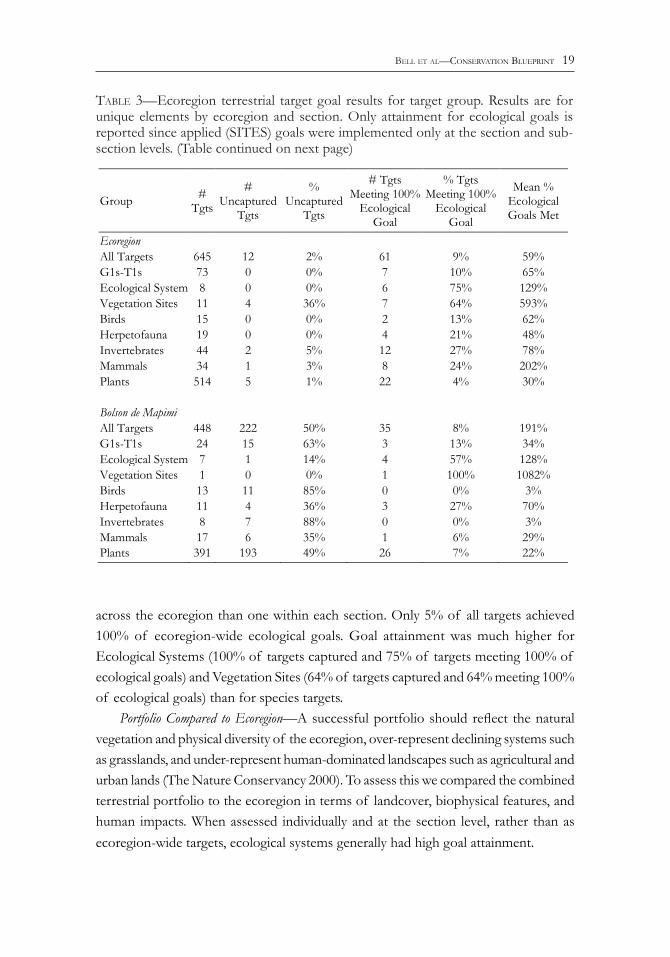
taBle 3—Ecoregion terrestrial target goal results for target group. Results are for unique elements by ecoregion and section. Only attainment for ecological goals is reported since applied (SITES) goals were implemented only at the section and sub-section levels. (Table continued on next page)
across the ecoregion than one within each section. Only 5% of all targets achieved 100% of ecoregion-wide ecological goals. Goal attainment was much higher for Ecological Systems (100% of targets captured and 75% of targets meeting 100% of ecological goals) and Vegetation Sites (64% of targets captured and 64% meeting 100% of ecological goals) than for species targets. Portfolio Compared to Ecoregion—A successful portfolio should reflect the natural vegetation and physical diversity of the ecoregion, over-represent declining systems such as grasslands, and under-represent human-dominated landscapes such as agricultural and urban lands (The Nature Conservancy 2000). To assess this we compared the combined terrestrial portfolio to the ecoregion in terms of landcover, biophysical features, and human impacts. When assessed individually and at the section level, rather than as ecoregion-wide targets, ecological systems generally had high goal attainment.
Group # Tgts
# Uncaptured
Tgts
% Uncaptured
Tgts
# Tgts Meeting 100%
Ecological Goal
% Tgts Meeting 100%
Ecological Goal
Mean % Ecological Goals Met
Ecoregion All Targets 645 12 2% 61 9% 59% G1s-T1s 73 0 0% 7 10% 65% Ecological System 8 0 0% 6 75% 129% Vegetation Sites 11 4 36% 7 64% 593% Birds 15 0 0% 2 13% 62% Herpetofauna 19 0 0% 4 21% 48% Invertebrates 44 2 5% 12 27% 78% Mammals 34 1 3% 8 24% 202% Plants 514 5 1% 22 4% 30% Bolson de Mapimi All Targets 448 222 50% 35 8% 191% G1s-T1s 24 15 63% 3 13% 34% Ecological System 7 1 14% 4 57% 128% Vegetation Sites 1 0 0% 1 100% 1082% Birds 13 11 85% 0 0% 3% Herpetofauna 11 4 36% 3 27% 70% Invertebrates 8 7 88% 0 0% 3% Mammals 17 6 35% 1 6% 29% Plants 391 193 49% 26 7% 22%
Bell et al—conServation BluePrint 20
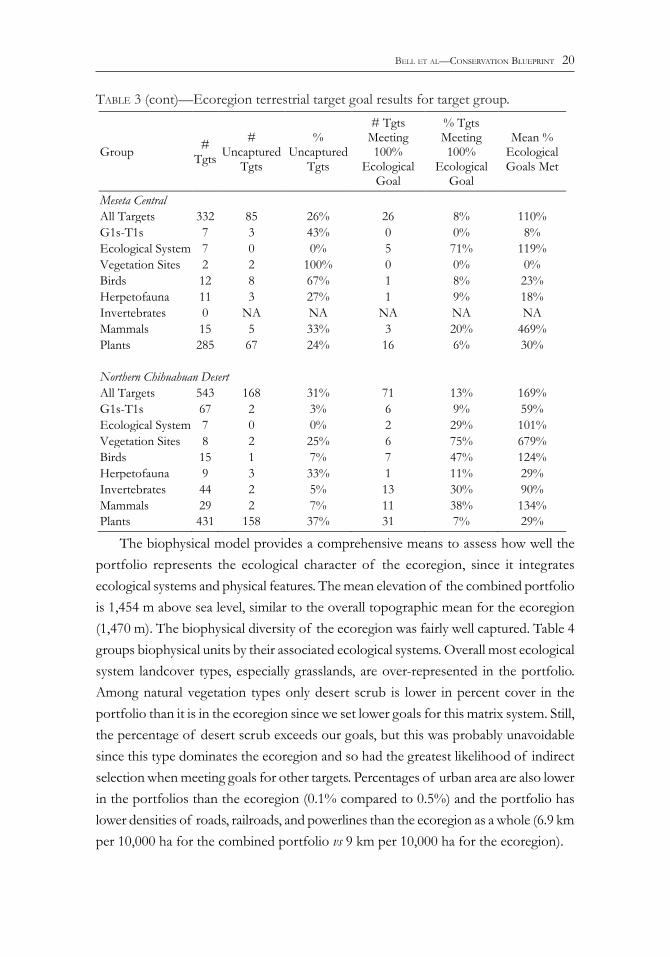
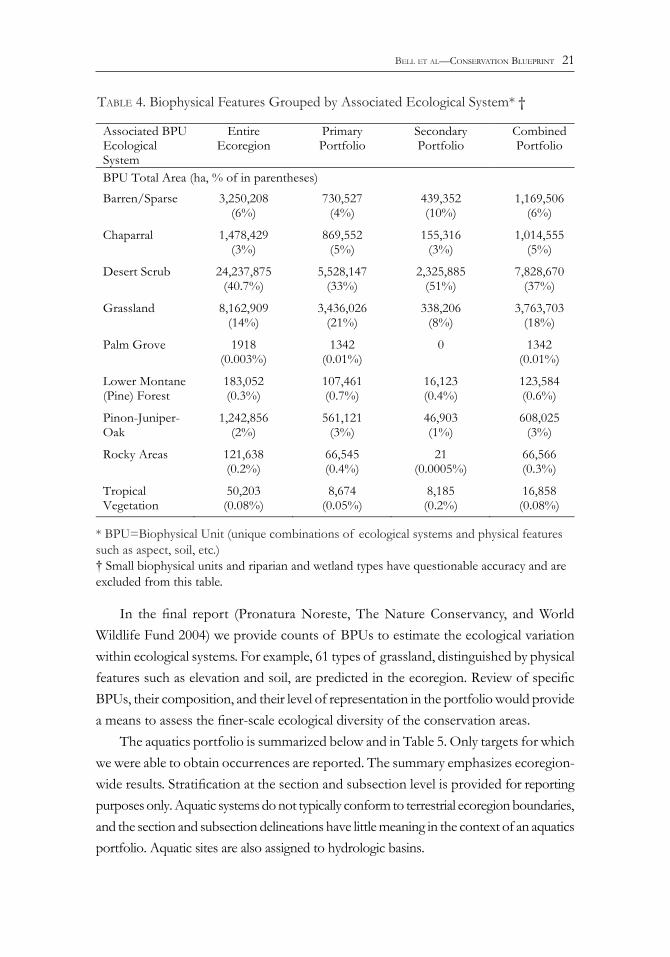
The biophysical model provides a comprehensive means to assess how well the portfolio represents the ecological character of the ecoregion, since it integrates ecological systems and physical features. The mean elevation of the combined portfolio is 1,454 m above sea level, similar to the overall topographic mean for the ecoregion (1,470 m). The biophysical diversity of the ecoregion was fairly well captured. Table 4 groups biophysical units by their associated ecological systems. Overall most ecological system landcover types, especially grasslands, are over-represented in the portfolio. Among natural vegetation types only desert scrub is lower in percent cover in the portfolio than it is in the ecoregion since we set lower goals for this matrix system. Still, the percentage of desert scrub exceeds our goals, but this was probably unavoidable since this type dominates the ecoregion and so had the greatest likelihood of indirect selection when meeting goals for other targets. Percentages of urban area are also lower in the portfolios than the ecoregion (0.1% compared to 0.5%) and the portfolio has lower densities of roads, railroads, and powerlines than the ecoregion as a whole (6.9 km per 10,000 ha for the combined portfolio vs 9 km per 10,000 ha for the ecoregion).
taBle 3 (cont)—Ecoregion terrestrial target goal results for target group.
Group # Tgts
# Uncaptured
Tgts
% Uncaptured
Tgts
# Tgts Meeting 100%
Ecological Goal
% Tgts Meeting 100%
Ecological Goal
Mean % Ecological Goals Met
Meseta Central All Targets 332 85 26% 26 8% 110% G1s-T1s 7 3 43% 0 0% 8% Ecological System 7 0 0% 5 71% 119% Vegetation Sites 2 2 100% 0 0% 0% Birds 12 8 67% 1 8% 23% Herpetofauna 11 3 27% 1 9% 18% Invertebrates 0 NA NA NA NA NA Mammals 15 5 33% 3 20% 469% Plants 285 67 24% 16 6% 30% Northern Chihuahuan Desert All Targets 543 168 31% 71 13% 169% G1s-T1s 67 2 3% 6 9% 59% Ecological System 7 0 0% 2 29% 101% Vegetation Sites 8 2 25% 6 75% 679% Birds 15 1 7% 7 47% 124% Herpetofauna 9 3 33% 1 11% 29% Invertebrates 44 2 5% 13 30% 90% Mammals 29 2 7% 11 38% 134% Plants 431 158 37% 31 7% 29%
Bell et al—conServation BluePrint 21
In the final report (Pronatura Noreste, The Nature Conservancy, and World Wildlife Fund 2004) we provide counts of BPUs to estimate the ecological variation within ecological systems. For example, 61 types of grassland, distinguished by physical features such as elevation and soil, are predicted in the ecoregion. Review of specific BPUs, their composition, and their level of representation in the portfolio would provide a means to assess the finer-scale ecological diversity of the conservation areas. The aquatics portfolio is summarized below and in Table 5. Only targets for which we were able to obtain occurrences are reported. The summary emphasizes ecoregion-wide results. Stratification at the section and subsection level is provided for reporting purposes only. Aquatic systems do not typically conform to terrestrial ecoregion boundaries, and the section and subsection delineations have little meaning in the context of an aquatics portfolio. Aquatic sites are also assigned to hydrologic basins.
Associated BPU Ecological System
Entire Ecoregion
Primary Portfolio
Secondary Portfolio
Combined Portfolio
BPU Total Area (ha, % of in parentheses)
Barren/Sparse 3,250,208 (6%)
730,527 (4%)
439,352 (10%)
1,169,506 (6%)
Chaparral 1,478,429 (3%)
869,552 (5%)
155,316 (3%)
1,014,555 (5%)
Desert Scrub 24,237,875 (40.7%)
5,528,147 (33%)
2,325,885 (51%)
7,828,670 (37%)
Grassland 8,162,909 (14%)
3,436,026 (21%)
338,206 (8%)
3,763,703 (18%)
Palm Grove 1918 (0.003%)
1342 (0.01%)
0 1342 (0.01%)
Lower Montane (Pine) Forest
183,052 (0.3%)
107,461 (0.7%)
16,123 (0.4%)
123,584 (0.6%)
Pinon-Juniper-Oak
1,242,856 (2%)
561,121 (3%)
46,903 (1%)
608,025 (3%)
Rocky Areas 121,638 (0.2%)
66,545 (0.4%)
21 (0.0005%)
66,566 (0.3%)
Tropical Vegetation
50,203 (0.08%)
8,674 (0.05%)
8,185 (0.2%)
16,858 (0.08%)
taBle 4. Biophysical Features Grouped by Associated Ecological System* †
* BPU=Biophysical Unit (unique combinations of ecological systems and physical features such as aspect, soil, etc.)† Small biophysical units and riparian and wetland types have questionable accuracy and are excluded from this table.
Bell et al—conServation BluePrint 22
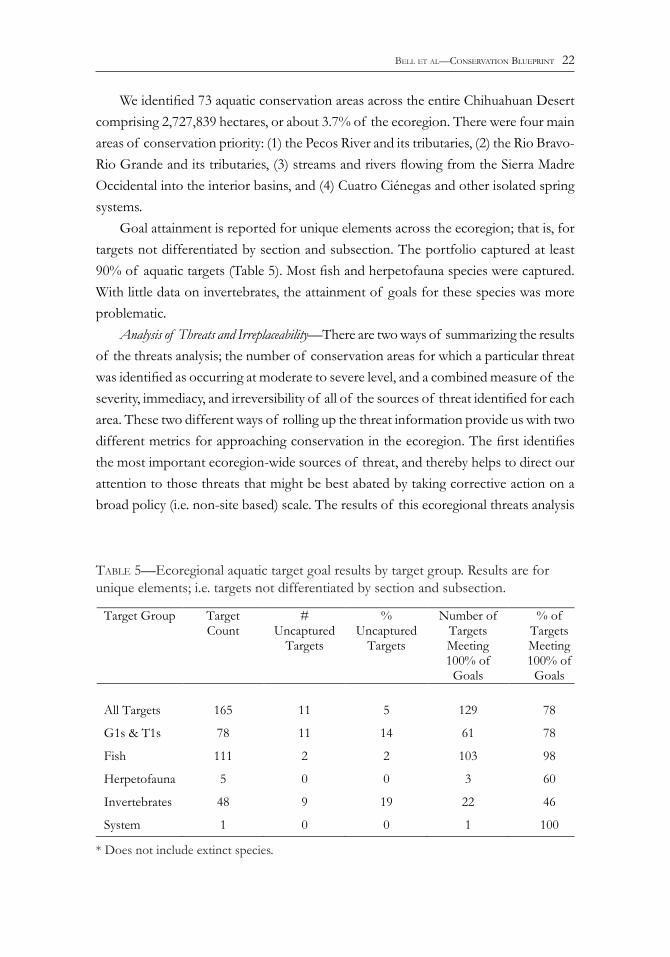
We identified 73 aquatic conservation areas across the entire Chihuahuan Desert comprising 2,727,839 hectares, or about 3.7% of the ecoregion. There were four main areas of conservation priority: (1) the Pecos River and its tributaries, (2) the Rio Bravo-Rio Grande and its tributaries, (3) streams and rivers flowing from the Sierra Madre Occidental into the interior basins, and (4) Cuatro Ciénegas and other isolated spring systems. Goal attainment is reported for unique elements across the ecoregion; that is, for targets not differentiated by section and subsection. The portfolio captured at least 90% of aquatic targets (Table 5). Most fish and herpetofauna species were captured. With little data on invertebrates, the attainment of goals for these species was more problematic. Analysis of Threats and Irreplaceability—There are two ways of summarizing the results of the threats analysis; the number of conservation areas for which a particular threat was identified as occurring at moderate to severe level, and a combined measure of the severity, immediacy, and irreversibility of all of the sources of threat identified for each area. These two different ways of rolling up the threat information provide us with two different metrics for approaching conservation in the ecoregion. The first identifies the most important ecoregion-wide sources of threat, and thereby helps to direct our attention to those threats that might be best abated by taking corrective action on a broad policy (i.e. non-site based) scale. The results of this ecoregional threats analysis
taBle 5—Ecoregional aquatic target goal results by target group. Results are for unique elements; i.e. targets not differentiated by section and subsection.
* Does not include extinct species.
Target Group Target Count
# Uncaptured
Targets
% Uncaptured
Targets
Number of Targets Meeting 100% of
Goals
% of Targets Meeting 100% of
Goals
All Targets 165 11 5 129 78
G1s & T1s 78 11 14 61 78
Fish 111 2 2 103 98
Herpetofauna 5 0 0 3 60
Invertebrates 48 9 19 22 46
System 1 0 0 1 100
Bell et al—conServation BluePrint 23
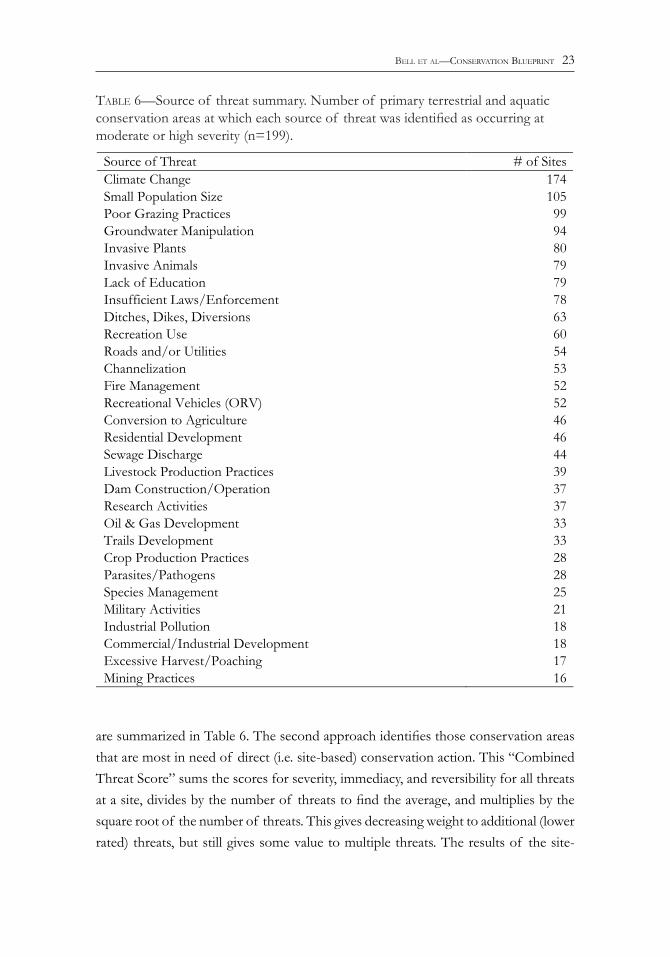
are summarized in Table 6. The second approach identifies those conservation areas that are most in need of direct (i.e. site-based) conservation action. This “Combined Threat Score” sums the scores for severity, immediacy, and reversibility for all threats at a site, divides by the number of threats to find the average, and multiplies by the square root of the number of threats. This gives decreasing weight to additional (lower rated) threats, but still gives some value to multiple threats. The results of the site-
taBle 6—Source of threat summary. Number of primary terrestrial and aquatic conservation areas at which each source of threat was identified as occurring at moderate or high severity (n=199).
Source of Threat # of Sites Climate Change 174 Small Population Size 105 Poor Grazing Practices 99 Groundwater Manipulation 94 Invasive Plants 80 Invasive Animals 79 Lack of Education 79 Insufficient Laws/Enforcement 78 Ditches, Dikes, Diversions 63 Recreation Use 60 Roads and/or Utilities 54 Channelization 53 Fire Management 52 Recreational Vehicles (ORV) 52 Conversion to Agriculture 46 Residential Development 46 Sewage Discharge 44 Livestock Production Practices 39 Dam Construction/Operation 37 Research Activities 37 Oil & Gas Development 33 Trails Development 33 Crop Production Practices 28 Parasites/Pathogens 28 Species Management 25 Military Activities 21 Industrial Pollution 18 Commercial/Industrial Development 18 Excessive Harvest/Poaching 17 Mining Practices 16
Bell et al—conServation BluePrint 24
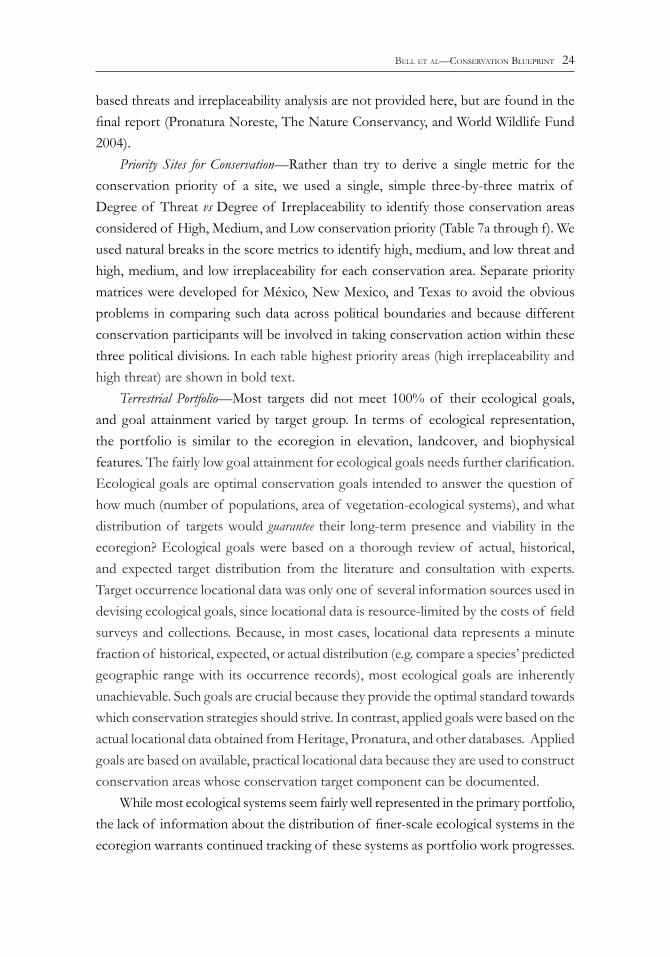
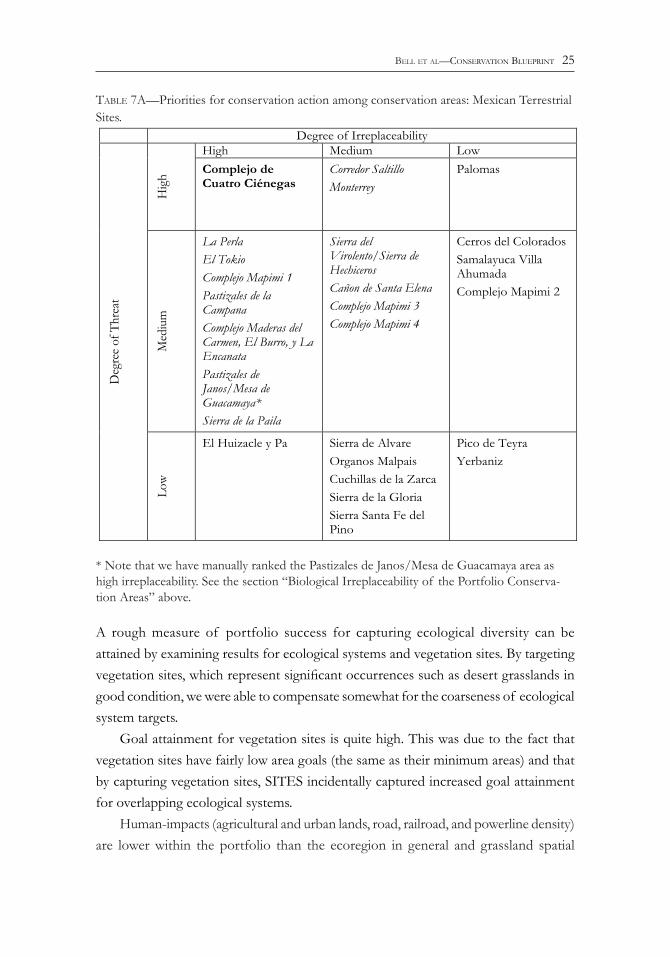
based threats and irreplaceability analysis are not provided here, but are found in the final report (Pronatura Noreste, The Nature Conservancy, and World Wildlife Fund 2004). Priority Sites for Conservation—Rather than try to derive a single metric for the conservation priority of a site, we used a single, simple three-by-three matrix of Degree of Threat vs Degree of Irreplaceability to identify those conservation areas considered of High, Medium, and Low conservation priority (Table 7a through f). We used natural breaks in the score metrics to identify high, medium, and low threat and high, medium, and low irreplaceability for each conservation area. Separate priority matrices were developed for México, New Mexico, and Texas to avoid the obvious problems in comparing such data across political boundaries and because different conservation participants will be involved in taking conservation action within these three political divisions. In each table highest priority areas (high irreplaceability and high threat) are shown in bold text. Terrestrial Portfolio—Most targets did not meet 100% of their ecological goals, and goal attainment varied by target group. In terms of ecological representation, the portfolio is similar to the ecoregion in elevation, landcover, and biophysical features. The fairly low goal attainment for ecological goals needs further clarification. Ecological goals are optimal conservation goals intended to answer the question of how much (number of populations, area of vegetation-ecological systems), and what distribution of targets would guarantee their long-term presence and viability in the ecoregion? Ecological goals were based on a thorough review of actual, historical, and expected target distribution from the literature and consultation with experts. Target occurrence locational data was only one of several information sources used in devising ecological goals, since locational data is resource-limited by the costs of field surveys and collections. Because, in most cases, locational data represents a minute fraction of historical, expected, or actual distribution (e.g. compare a species’ predicted geographic range with its occurrence records), most ecological goals are inherently unachievable. Such goals are crucial because they provide the optimal standard towards which conservation strategies should strive. In contrast, applied goals were based on the actual locational data obtained from Heritage, Pronatura, and other databases. Applied goals are based on available, practical locational data because they are used to construct conservation areas whose conservation target component can be documented. While most ecological systems seem fairly well represented in the primary portfolio, the lack of information about the distribution of finer-scale ecological systems in the ecoregion warrants continued tracking of these systems as portfolio work progresses.
Bell et al—conServation BluePrint 25
Degree of Irreplaceability High Medium Low
High
Complejo de Cuatro Ciénegas
Corredor Saltillo Monterrey
Palomas M
ediu
m
La Perla El Tokio Complejo Mapimi 1 Pastizales de la Campana Complejo Maderas del Carmen, El Burro, y La Encanata Pastizales de Janos/Mesa de Guacamaya* Sierra de la Paila
Sierra del Virolento/Sierra de Hechiceros Cañon de Santa Elena Complejo Mapimi 3 Complejo Mapimi 4
Cerros del Colorados Samalayuca Villa Ahumada Complejo Mapimi 2
Deg
ree o
f Thr
eat
Low
El Huizacle y Pa Sierra de Alvare Organos Malpais Cuchillas de la Zarca Sierra de la Gloria Sierra Santa Fe del Pino
Pico de Teyra Yerbaniz
taBle 7A—Priorities for conservation action among conservation areas: Mexican Terrestrial Sites.
* Note that we have manually ranked the Pastizales de Janos/Mesa de Guacamaya area as high irreplaceability. See the section “Biological Irreplaceability of the Portfolio Conserva-tion Areas” above.
A rough measure of portfolio success for capturing ecological diversity can be attained by examining results for ecological systems and vegetation sites. By targeting vegetation sites, which represent significant occurrences such as desert grasslands in good condition, we were able to compensate somewhat for the coarseness of ecological system targets. Goal attainment for vegetation sites is quite high. This was due to the fact that vegetation sites have fairly low area goals (the same as their minimum areas) and that by capturing vegetation sites, SITES incidentally captured increased goal attainment for overlapping ecological systems. Human-impacts (agricultural and urban lands, road, railroad, and powerline density) are lower within the portfolio than the ecoregion in general and grassland spatial
Bell et al—conServation BluePrint 26
Degree of Irreplaceability High Medium Low
Hig
h
Cuatro Ciénegas Media Luna/Rio Verde Muzquiz Potosi Rio San Pedro Ojo Solo
Rio Casas Grandes Ojo Julimes Sandia Rio Mezquital Rio Santa Catarina Rio Grande Ojinaga Venado-Moctezuma Rio del Carmen Rio Monclova Rio Nazus Guzman Basin Bustillos
Cadena Chorro Ojo de San Gregorio Valle de Allende Illesces Rio Santa Maria Ocampo Sauz Basin Lower Rio Conchos Arroyo del Pino
Med
ium
San Diego de Alcala La Concha Ojo de Villa Lopez Ojo de Dolores Rio Balleza Upper Conchos
Upper Aguanaval Rio de Ramos Rio Guatimape Ojo de Galeana
Deg
ree
of T
hrea
t
Low
Rio Torrero Lower Rio Naza Arroyo El Nogal Rio Chuviscar
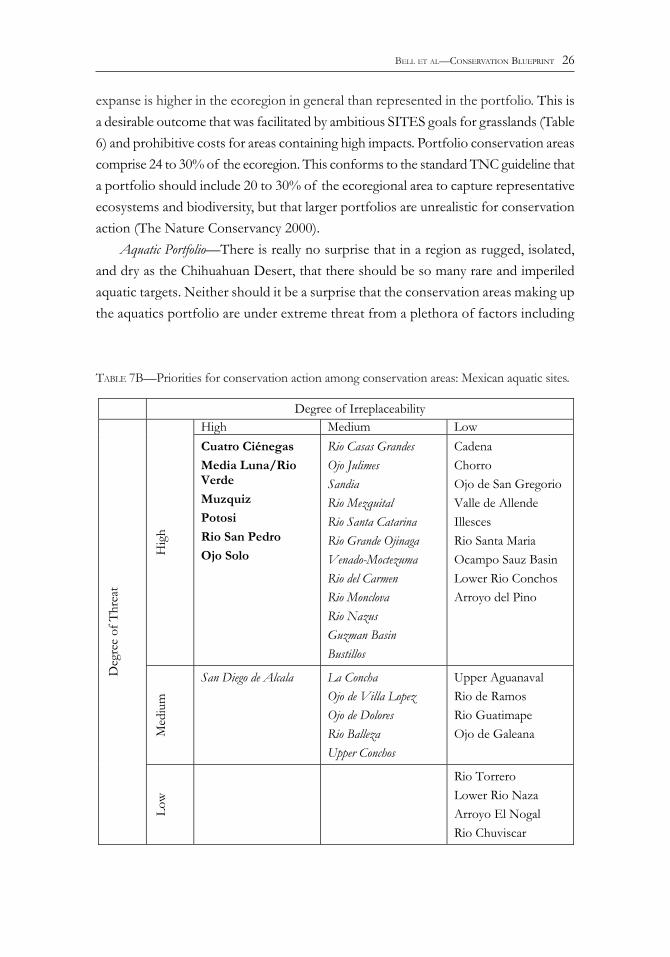
taBle 7B—Priorities for conservation action among conservation areas: Mexican aquatic sites.
expanse is higher in the ecoregion in general than represented in the portfolio. This is a desirable outcome that was facilitated by ambitious SITES goals for grasslands (Table 6) and prohibitive costs for areas containing high impacts. Portfolio conservation areas comprise 24 to 30% of the ecoregion. This conforms to the standard TNC guideline that a portfolio should include 20 to 30% of the ecoregional area to capture representative ecosystems and biodiversity, but that larger portfolios are unrealistic for conservation action (The Nature Conservancy 2000). Aquatic Portfolio—There is really no surprise that in a region as rugged, isolated, and dry as the Chihuahuan Desert, that there should be so many rare and imperiled aquatic targets. Neither should it be a surprise that the conservation areas making up the aquatics portfolio are under extreme threat from a plethora of factors including
Bell et al—conServation BluePrint 27
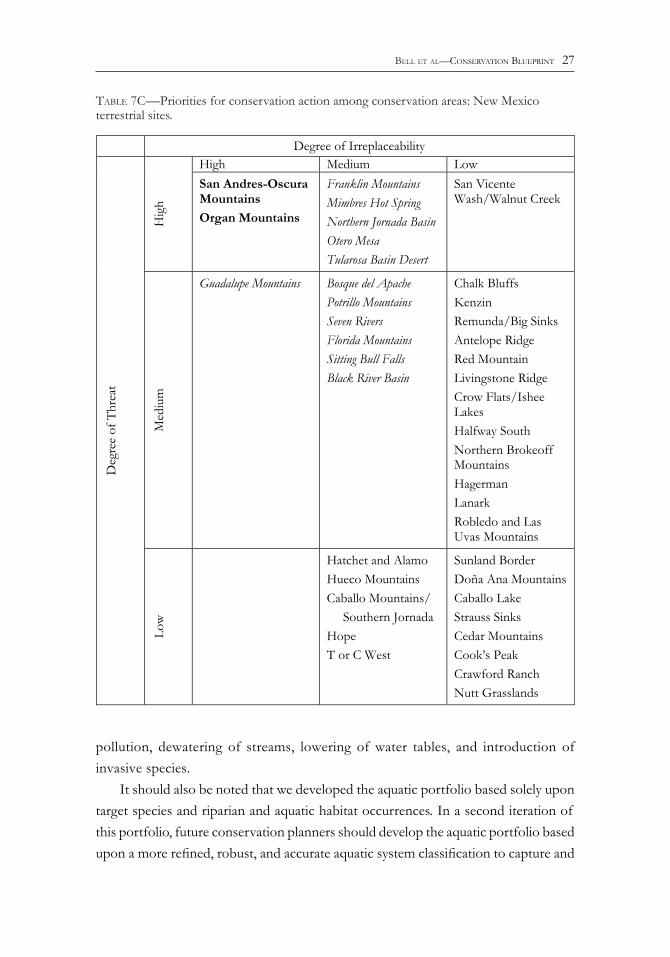
taBle 7C—Priorities for conservation action among conservation areas: New Mexico terrestrial sites.
pollution, dewatering of streams, lowering of water tables, and introduction of invasive species. It should also be noted that we developed the aquatic portfolio based solely upon target species and riparian and aquatic habitat occurrences. In a second iteration of this portfolio, future conservation planners should develop the aquatic portfolio based upon a more refined, robust, and accurate aquatic system classification to capture and
Degree of Irreplaceability High Medium Low
Hig
h
San Andres-Oscura Mountains Organ Mountains
Franklin Mountains Mimbres Hot Spring Northern Jornada Basin Otero Mesa Tularosa Basin Desert
San Vicente Wash/Walnut Creek
Med
ium
Guadalupe Mountains Bosque del Apache Potrillo Mountains Seven Rivers Florida Mountains Sitting Bull Falls Black River Basin
Chalk Bluffs Kenzin Remunda/Big Sinks Antelope Ridge Red Mountain Livingstone Ridge Crow Flats/Ishee Lakes Halfway South Northern Brokeoff Mountains Hagerman Lanark Robledo and Las Uvas Mountains
Deg
ree
of T
hrea
t
Low
Hatchet and Alamo Hueco Mountains Caballo Mountains/
Southern Jornada Hope T or C West
Sunland Border Doña Ana Mountains Caballo Lake Strauss Sinks Cedar Mountains Cook’s Peak Crawford Ranch Nutt Grasslands
Bell et al—conServation BluePrint 28
Degree of Irreplaceability High Medium Low
Hig
h Blue Spring Black River Lower Hondo
Oscura Salt Creek Mimbres River
Rattlesnake Springs M
ediu
m Bitter Lake
Pecos River Delaware Pecos River Roswell
Lost River Tularosa Creek
Deg
ree
of T
hrea
t
Low
Rio Grande Elephant Butte
Bottomless Lakes Pecos River High Plains Pecos River Carlsbad Rio Grande Caballo Rio Felix
Cottonwood Springs Sitting Bull Falls Clayton Basin lakes Laguna Plata
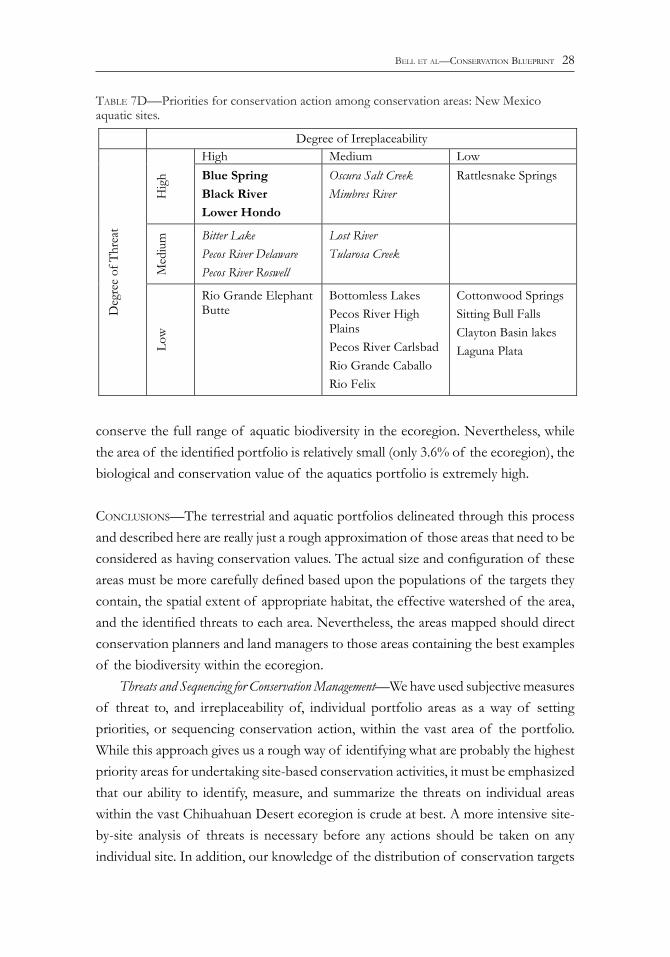
taBle 7D—Priorities for conservation action among conservation areas: New Mexico aquatic sites.
conserve the full range of aquatic biodiversity in the ecoregion. Nevertheless, while the area of the identified portfolio is relatively small (only 3.6% of the ecoregion), the biological and conservation value of the aquatics portfolio is extremely high.
concluSionS—The terrestrial and aquatic portfolios delineated through this process and described here are really just a rough approximation of those areas that need to be considered as having conservation values. The actual size and configuration of these areas must be more carefully defined based upon the populations of the targets they contain, the spatial extent of appropriate habitat, the effective watershed of the area, and the identified threats to each area. Nevertheless, the areas mapped should direct conservation planners and land managers to those areas containing the best examples of the biodiversity within the ecoregion. Threats and Sequencing for Conservation Management—We have used subjective measures of threat to, and irreplaceability of, individual portfolio areas as a way of setting priorities, or sequencing conservation action, within the vast area of the portfolio. While this approach gives us a rough way of identifying what are probably the highest priority areas for undertaking site-based conservation activities, it must be emphasized that our ability to identify, measure, and summarize the threats on individual areas within the vast Chihuahuan Desert ecoregion is crude at best. A more intensive site-by-site analysis of threats is necessary before any actions should be taken on any individual site. In addition, our knowledge of the distribution of conservation targets
Bell et al—conServation BluePrint 29
Degree of Irreplaceability High Medium Low
Hig
h
Big Bend Davis Mountains
Devils River Megasite Dryden/Sanderson Glass Mountains Marathon Basin Grasslands Marfa Plateau Grassland Musquiz Canyon Salt Basin Sierra Diablo Sierra Vieja-Chinati Mountains
Alamito Creek Borderland Clint Lake Amistad Sorcerer’s Cave
Med
ium
Langtry Longfellow Grasslands and Mesas Hueco Mountains Monahans Sandhills Apache Mountains Eagle Mountains Lake Toyah Basin Bullis Gap
Hackberry Draw Cedar Station/Dryden Red Light Draw Boracho Cornudas Quitman Mountains North Roberts Mesa Mesa/Pecos Plain Van Horn West of Fort Stockton Saddle Butte Western Sierra Diablos Yeso Hills
Deg
ree
of T
hrea
t
Low
Border Noelke Hill
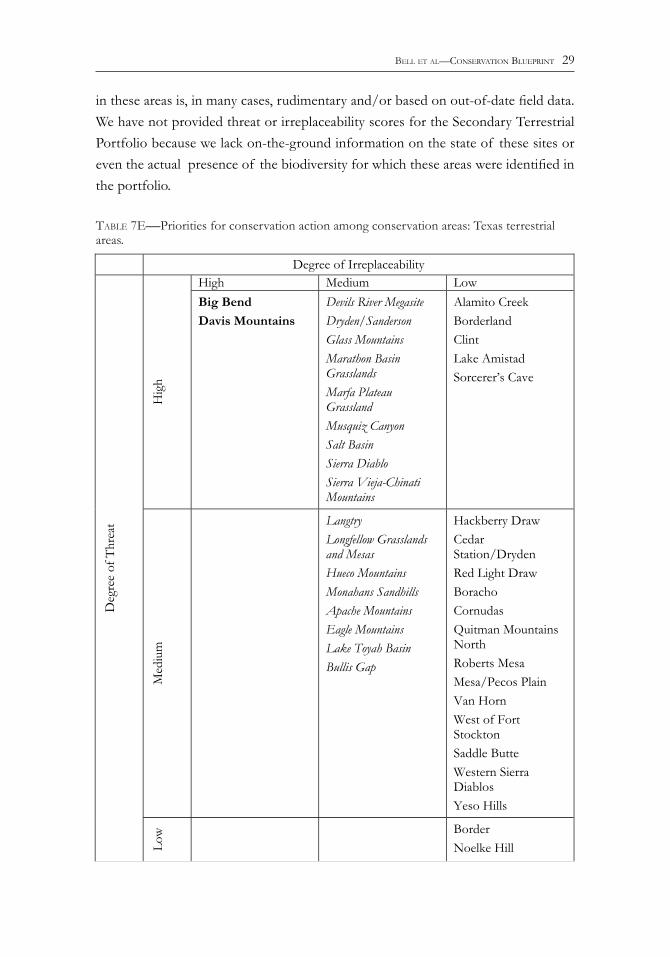
taBle 7E—Priorities for conservation action among conservation areas: Texas terrestrial areas.
in these areas is, in many cases, rudimentary and/or based on out-of-date field data. We have not provided threat or irreplaceability scores for the Secondary Terrestrial Portfolio because we lack on-the-ground information on the state of these sites or even the actual presence of the biodiversity for which these areas were identified in the portfolio.
Bell et al—conServation BluePrint 30
Future Work—Ecoregional planning efforts can always be improved upon as more and better data become available. A lack of comprehensive data is always a stumbling block to such efforts, especially for such a large, complex, and incompletely understood region such as the Chihuahuan Desert. There are a number of areas where data are lacking or incomplete for the Chihuahuan Desert, and we encourage the collection and archiving of more comprehensive data by which the assumptions made in this plan can be checked and the results refined through future iterations. There are three main areas where data are lacking or incomplete—target occurrences, vegetation mapping, and an aquatic system classification. Numerous data gaps were encountered for conservation targets. Data were completely lacking for some species. Occurrence data were out of date for others. In some cases we lack up-to-date taxonomic assessments of species or groups of species; for example the status of the trout (Oncorhynchus) of the Sierra Madre Occidental has not yet been clarified. While many museums are now making their specimen collection data available online, many occurrence locations have yet to be spatially referenced, and many collections from the Mexican portion of the ecoregion are very old. Vegetation data for the ecoregion is incomplete and classification systems are often incompatible across political boundaries. The New Mexico and Texas GAP vegetation data sets both suffer from incomplete verification and a number of erroneous
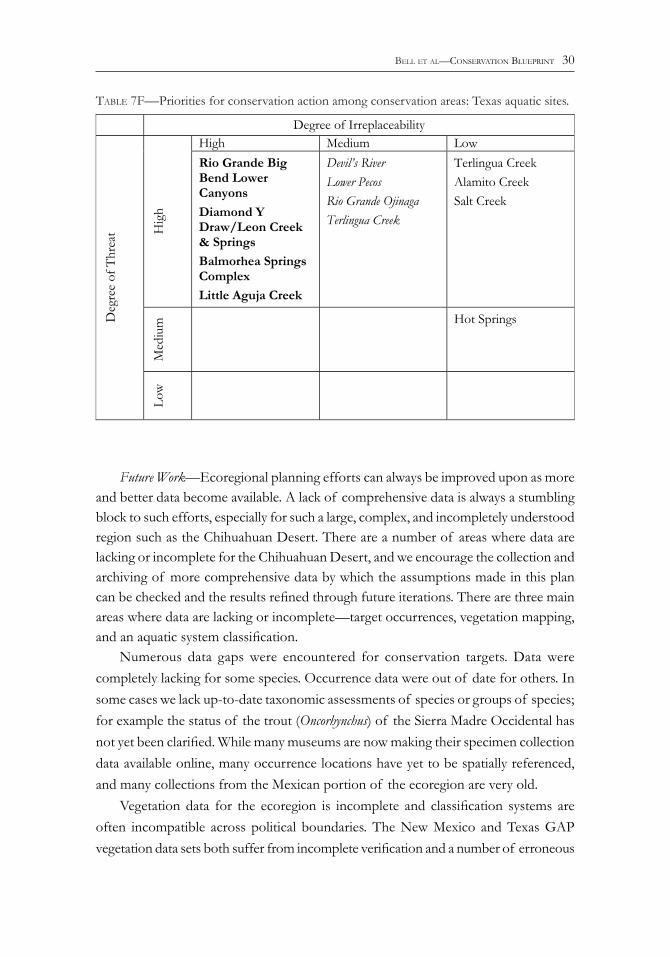
taBle 7F—Priorities for conservation action among conservation areas: Texas aquatic sites.
Degree of Irreplaceability High Medium Low
Hig
h Rio Grande Big Bend Lower Canyons Diamond Y Draw/Leon Creek & Springs Balmorhea Springs Complex Little Aguja Creek
Devil’s River Lower Pecos Rio Grande Ojinaga Terlingua Creek
Terlingua Creek Alamito Creek Salt Creek
Med
ium
Hot Springs Deg
ree
of T
hrea
t
Low
Bell et al—conServation BluePrint 31
delineations were discovered in the Chihuahuan portion of these datasets. The vegetation mapping for the Mexican portion of the ecoregion, developed by INEGI, was updated in time for this project, but lacks any resolution of some vegetation classes, most notably grasslands. A better, seamless vegetation spatial dataset for the ecoregion is a top priority for improving upon future iterations of the plan.An even greater limiting factor to this effort was the complete lack of an aquatic classification system for the ecoregion, or even access to adequate data sets to develop such a classification. The first priority in this regard must be a complete hydrologic spatial dataset for México such as exists in the National Hydrologic Database (NHD) for the United States.
Note: The results presented in this paper and in the accompanying Ecoregional Conservation Assessment of the Chihuahuan Desert (http://cdri.org/publications/proceedings-of-the-symposium-on-the-natural-resources-of-the-chihuahuan-desert-region/) are preliminary and subject to revision following the preparation of this paper. Contact The Nature Conservancy in New Mexico for confirmation and updates.
The final report and appendices upon which this paper are based was developed by a core planning team that in addition to the authors included M. Cotera, E. Guadarrama, J. Brenner, A. M. Arango, M. E. García Garza, A. Ganem Sada, T. Sullivan, M. Gronemeyer, J. Weigel, R. McCready, D. Mehlman, J. Bergan, J. King, M. Gallyoun, D. L. Certain, R. Potts, J. Wrinkle, L. Wood Miller, J. Bezaury, H. M. Arias, I. E. Parra, E. Muldavin, T. Neville, and G. Kittel. This project could not have been completed without the generous financial support of The Nature Conservancy’s Migratory Bird Program, Ian Cummings, and the Conservancy’s Ecoregional Planning Support Team. Special thanks go to C. Groves, L. Landon, and R. Mullen for their advice and support. Funding also came from The Nature Conservancy’s New Mexico, Mexico, and Texas programs.
Locational data and other supporting information was provided by a host of experts in the United States and Mexico. Thanks to all those who participated in an experts workshop hosted by the World Wildlife Fund in Monterrey, Mexico, in October, 1997. Pronatura Noreste coordinated the mining of additional locational data for Mexico. Experts providing data for that effort were E. Estrada, H. A. Garza, F. González, P. Lavín, A. Moreno, J. Valdez, and P. Vela. Thanks also to D. González, and C. Redendiz for their assistance with this effort.
We also thank the technical team members who assisted in the development and review of taxonomic target lists and to those who provided additional data on species distributions; D.Anderson, D. Baumgardner, M. Bogan, D. Bowles, B. Carr, S. Cary, A. Contreras-Arquieta, M. A. Cruz, E. Estrada, J. Frey, G. Garrett, M. Goering, C. Hoagstrom, A. Hobbs, D. Hugg, R. Keeshen, B. Knisely, B. Lang, R. R. Larsen, J. Medel, A. Metcalf, A. Montoya, C. Painter, S. Platania, J. Poole, A. Price, D. Propst, C. Rustay, R.Sivinski, R. Spellenberg, P. Tonne, J. Valdes, T. Wendt, and K. Young.
L. Delay provided invaluable assistance in developing data layers for the biophysical model. M. Heiner, D. Dorfman, and P. Comer assisted in developing the biophysical model and helped with other GIS problems. R. Almaraz of NRCS helped build an ecoregion-wide soils map. B. Unnasch assisted in developing metrics to measure threat and irreplaceability for conservation areas. Other GIS and technical assistance was provided by T. Alnutt, M. Altenbach, R. Alvarez, D. Benesh, F. Biasi, B. Cholvin, E. Falconer, C. Frasier, S. Gilbert, A. Gondor, L. Gorenflo, B. Houseal, G. Harris, M. Khoury, X. Li, C.
Bell et al—conServation BluePrint 32
Loucks, J. McNees, C. Moritz, P. Neville, P. Patterson, B. Runnels, M. Schindel, D. Scott, and R. Smith. Other assistance, review, and support was provided by B. Adler, S. Anderson, S. Chaplin, W. Dinner, K. Echols, L. Elliot, I. Etienne, J. Hall, R. Hannan, K. Haywood, S. Laskey, C. Marginot, P. McCarthy, P. Mehlhop, D. Moon, D. Nethers, W. Ostlie, M. A. Paredes, L. Paulson, T. Peterson, C. Rhoe, P. Russell, J. Spensley, J. Sulentich, W. Waldman, and L. Wilsman.
literature cited
allen, C.D., J.L. Betancourt, and T.W. SwetnaM. 1998. Landscape changes in the southwestern United States: Techniques, long-term data sets, and trends. In: T. Sisk, editor. Perspectives on the Land Use History of North America: A Context for Understanding Our Changing Environment. United States Geological Survey, Biological Science Report USGS/BRD/BSR-1998-0003.
alMaraz, R.A., and H. eSwaran. 1998. Soil taxonomy translation of the INEGI 1:1,000,000 soil map of Mexico. United States Department of Agriculture, Natural Resources Conservation Service, World Soil Resources, Washington, D.C.
Bailey, R.G. 1995. Description of the Ecoregions of the United States. United States Forest Service Miscellaneous Publication Number 1391, Washington, D.C.
Brenner GuillerMo, M.C.J., M.C. correa, and J.M. anorve. 2001. Reporte final de la minería de datos de la ecoregión de Desierto Chihuahuense en México. Pronatura for The Nature Conservancy.
Brown, D.E., C.H. lowe, and C.P. PaSe. 1979. A digitized classification system for the biotic communities of North America, with community (series) and association examples for the Southwest. The Journal of the Arizona-Nevada Academy of Science 14(Supplement 1):1–16.
daviS, F., S. andelMan, and D. StoMS. 2002. SITES: an analytical toolbox for ecoregional planning. Internet site: http://www.biogeog.ucsb.edu/projects/tnc/toolbox.html.
dinerStein, e., d. olSon, d. GrahaM, a. weBSter, S. PriMM, M. BooKBinder, and G. ledec. 1995. A Conservation Assessment of the Terrestrial Ecoregions of Latin America and the Caribbean. The World Bank – World Wildlife Fund, The International Bank for Reconstruction and Development-The World Bank, Washington, D.C.
dinerStein, e., d. olSon, J. atchley, c. loucKS, S. contreraS-BalderaS, r. aBell, e. iñiGo, e. enKerlin, c. williaMS, and G. caStilleJa. 2000. Ecoregion-based Conservation in the Chihuahuan Desert: A Biological Assessment. World Wildlife Fund, Washington, D.C.
doBSon, A.P. 1996. Conservation and Biodiversity. Scientific American Library, New York.
Bell et al—conServation BluePrint 33
findley, J.S., and w. caire. 1977. The status of mammals in the northern region of the Chihuahuan Desert. In: R.H. Wauer and D.H. Riskind, editors. Transactions of the Symposium on the Biological Resources of the Chihuahuan Desert Region, United States and Mexico. Sul Ross State University, Alpine, Texas, 17–18 October 1974. United States Department of the Interior, National Parks Service Transactions and Proceedings, Series No. 3. Pages 127–139.
flather, c.h., M.S. KnowleS, and i.a. Kendall. 1998. Threatened and endangered species geography, characteristic hot spots in the conterminous United States. Bioscience 48(5):365–376.
franKlin, J.F. 1993. Preserving biodiversity: species, ecosystems or landscapes? Ecological Applications 3(2):202–205.
GroveS, C.R. 2003. Drafting a Conservation Blueprint: A Practitioner’s Guide to Planning for Biodiversity. The Nature Conservancy and Island Press, Washington, D.C.
hendricKSon, d.a., l.t. findley, and h. eSPinoSa Pérez. 1999. Mexican trouts—the need for status surveys and research. Paper presented at the Annual Symposium of the Desert Fishes Council, November 1999, Ciudad Victoria, Tamaulipas, México.
hernandez, h.M., and r.t. BarcenaS. 1995. Endangered cacti in the Chihuahuan Desert: I. Distribution patterns. Conservation Biology 9(5):1176–1187.
JiMenez-GuzMan, a., and M.a. zuniGa-raMoS. 1991. Caracterizacion biologica de Sierra Maderas del Carmen, Coahuila, Mexico. Anales Instituto Universidad Nacional Autonoma de México. Serie Zoologica. 62:373–382.
JohnSton, M.C. 1977. Brief resume of botanical, including vegetational, features of the Chihuahuan Desert region with special emphasis on their uniqueness. In: R.H. Wauer and D.H. Riskind, editors. Transactions of the Symposium on the Biological Resources of the Chihuahuan Desert region, United States and Mexico, Sul Ross State University, Alpine Texas, 17–18 October 1974. United States Department of the Interior, National Parks Service Transactions and Proceedings Series No. 3, Washington, D.C. Pages 335–359.
Mcdonnell, M.d., h.P. PoSSinGhaM, i.r. Ball, and e.a. couSinS. 2002. Mathematical methods for spatially cohesive reserve design. Environmental Modeling and Assessment 7:107–114.
Miller, r.r. 1977. Composition and derivation of the native fish fauna of the Chihuahuan Desert region. In: R.H. Wauer and D.H. Riskind, editors, Transactions of the Symposium on the Biological Resources of the Chihuahuan Desert region, United States and Mexico, Sul Ross State University, Alpine Texas, 17–18 October 1974. United States Department of the Interior, National Parks Service Transactions and Proceedings Series No. 3, Washington, D.C. Pages 365–382.
Bell et al—conServation BluePrint 34
MincKley, w.l. 1977. Endemic fishes of the Cuatro Cienegas basin, Coahuila, Mexico. In: R.H. Wauer and D.H. Riskind, editors, Transactions of the Symposium on the Biological Resources of the Chihuahuan Desert region, United States and Mexico, Sul Ross State University, Alpine Texas, 17–18 October 1974. United States Department of the Interior, National Parks Service Transactions and Proceedings Series No. 3, Washington, D.C. Pages 383–404.
MincKley, w.l., G.K. Meffe, and d.l. Soltz. 1991. Conservation and management of short-lived fishes: the cyprinodontids. In: W.L. Minckley and J.E. Deacon, editors. Battle Against Extinction: Native Fish Management in the American West. University of Arizona Press, Tucson. Pages 247–282.
MorafKa, d.J. 1977. Is there a Chihuahuan Desert? A quantitative evaluation through a herpetofauna perspective. In: R.H. Wauer and D.H. Riskind, editors. Transactions of the Symposium on the Biological Resources of the Chihuahuan Desert region, United States and Mexico, Sul Ross State University, Alpine Texas, 17–18 October 1974. United States Department of the Interior, National Parks Service Transactions and Proceedings Series No. 3, Washington, D.C. Pages 437–454.
MorriS, w., d. doaK, M. GrooM, P. Kareiva, J. fieBerG, l. GerBer. P. MurPhy, and d. thoMSon. 1999. A Practical Handbook for Population Viability Analysis. The Nature Conservancy, Arlington, Virginia.
Muldavin, e., y. chauvin, and G. harPer. 2000. The Vegetation of White Sands Missile Range, New Mexico; Volume I: Handbook of Vegetation Communities. New Mexico Natural Heritage Program, Albuquerque, New Mexico.
natural heritaGe inforMation SySteM (NHIS). 2002. New Mexico Natural Heritage Program. Museum of Southwestern Biology, University of New Mexico, Albuquerque, New Mexico.
natureServe. 2002. Web site: http://natureserve.org/. Arlington, Virginia.
PhilliPS, a.r. 1977. Summary of avian resources of the Chihuahuan Desert Region. In: R.H. Wauer and D.H. Riskind, editors. Transactions of the Symposium on the Biological Resources of the Chihuahuan Desert region, United States and Mexico, Sul Ross State University, Alpine Texas, 17–18 October 1974. United States Department of the Interior, National Parks Service Transactions and Proceedings Series No. 3, Washington, D.C. Pages 617–620.
PiMM, S.l., G.J. ruSSell, J.l. GittleMan, and t.M. BrooKS. 1995. The future of biodiversity. Science 269:347–350.
Poiani, K.a., B.d. richter, M.G. anderSon, and h.e. richter. 2000. Biodiversity conservation at multiple scales: functional sites, landscapes, and networks. Bioscience 50(2):133–146.
Bell et al—conServation BluePrint 35
PoSSinGhaM, h.P., i.r. Ball, and S. andelMan. 2000. Mathematical methods for identifying representative reserve networks, In: S. Ferson and M. Burgman, editors. Quantitative Methods for Conservation Biology. Springer-Verlag, New York. Pages 291–305.
PreSSey, r.l., h.P. PoSSinGhaM, and r.i. MarGuleS. 1996. Optimality in reserve selection algorithms: when does it matter and how much? Biological Conservation 76(3):259–267.
Pronatura noreSte, the nature conServancy, and world wildlife fund. 2004. Ecoregional Conservation Assessment of the Chihuahuan Desert. Report and Appendices. Pronatura Noreste, Monterrey, Nuevo Leon.
rzedowSKi, J. 1978. Vegetación de México. Editorial Limusa, México, D.F.
SEMARNAP. 2000. Inventario Nacional Forestal 2000. Secretaría de Medio Ambiente y Recursos Naturales, México, D.F.
SchMidt, r.h., Jr. 1979. A climatic delineation of the ‘real’ Chihuahuan Desert. Journal of Arid Environments 2:243–250.
texaS conServation data center. 2002. Biological and Conservation Database. The Nature Conservancy. San Antonio, Texas.
texaS cooPerative fiSh and wildlife reSearch unit. 2001. Draft Texas GAP vegetation data. Texas Cooperative Fish and Wildlife Research Unit, Texas Tech University, Lubbock, Texas.
the nature conServancy. 2000. Designing a Geography of Hope, Second Edition. The Nature Conservancy, Arlington, Virginia.
thoMPSon, B.c., P.J. criSt, J.S. Prior-MaGee, r.a. deitner, d.l. GarBer, and M.a. huGheS. 1996. Gap analysis of biological diversity conservation in New Mexico using geographic information systems. Final Gap Analysis Report, United States Department of the Interior, New Mexico Cooperative Fish and Wild. Res. Unit, Las Cruces, New Mexico.
van devender, T.R. 1990. Late Quaternary vegetation and climate of the Chihuahuan Desert, United States and Mexico. In: J. Betancourt, T. Van Devender and P. Martin, editors. Packrat Middens, the Last 40,000 Years of Biotic Change. The University of Arizona Press, Tucson, Arizona. Pages 104–133.
villarreal, Q., and J.a. y J.valdeS R. 1993. Vegetacion de Coahuila. Manejo de Pastizales, 6:9–18.
wellS, P.v. 1977. Post-glacial origin of the present Chihuahuan Desert less than 11,500 years ago. In: R.H. Wauer and D.H. Riskind, editors. Transactions of the Symposium on the Biological Resources of the Chihuahuan Desert region, United States and Mexico, Sul Ross State University, Alpine Texas, 17–18 October 1974. United States Department of the Interior, National Parks Service Transactions and Proceedings Series No. 3, Washington, D.C. Pages 67–83.

Bell et al—conServation BluePrint 36
wood, S., G. harPer, e. Muldavin, and P. neville. 1999. Vegetation map of the Sierra Del Carmen, U.S.A. and Mexico. Final report submitted to the United States Geological Survey, National Wetlands Research Center and the National Park Service, Big Bend National Park. New Mexico Natural Heritage Program, Albuquerque, New Mexico.
wood, S., S. yanoff, n. douGlaS, S. radJy, e. Muldavin, and P. MehlhoP. 1997. Vegetation of Fort Bliss Texas and New Mexico; Volume I: Addendum Vegetation Community Handbook. New Mexico Natural Heritage Program, Albuquerque, New Mexico.