Embed Size (px)
Citation preview
CONSERVATION
Human impacts on global freshwater fish biodiversityGuohuan Su1*, Maxime Logez2,3, Jun Xu4,5, Shengli Tao1, Sébastien Villéger6†, Sébastien Brosse1†
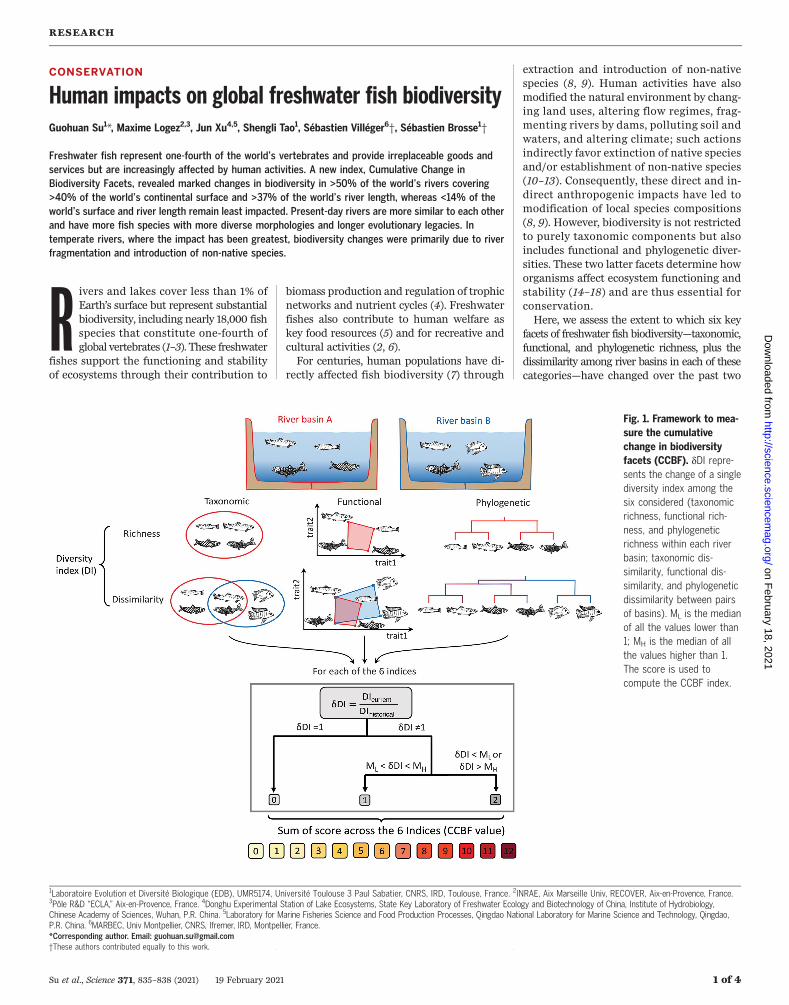
Freshwater fish represent one-fourth of the world’s vertebrates and provide irreplaceable goods andservices but are increasingly affected by human activities. A new index, Cumulative Change inBiodiversity Facets, revealed marked changes in biodiversity in >50% of the world’s rivers covering>40% of the world’s continental surface and >37% of the world’s river length, whereas <14% of theworld’s surface and river length remain least impacted. Present-day rivers are more similar to each otherand have more fish species with more diverse morphologies and longer evolutionary legacies. Intemperate rivers, where the impact has been greatest, biodiversity changes were primarily due to riverfragmentation and introduction of non-native species.
Rivers and lakes cover less than 1% ofEarth’s surface but represent substantialbiodiversity, including nearly 18,000 fishspecies that constitute one-fourth ofglobal vertebrates (1–3). These freshwater
fishes support the functioning and stabilityof ecosystems through their contribution to
biomass production and regulation of trophicnetworks and nutrient cycles (4). Freshwaterfishes also contribute to human welfare askey food resources (5) and for recreative andcultural activities (2, 6).For centuries, human populations have di-
rectly affected fish biodiversity (7) through
extraction and introduction of non-nativespecies (8, 9). Human activities have alsomodified the natural environment by chang-ing land uses, altering flow regimes, frag-menting rivers by dams, polluting soil andwaters, and altering climate; such actionsindirectly favor extinction of native speciesand/or establishment of non-native species(10–13). Consequently, these direct and in-direct anthropogenic impacts have led tomodification of local species compositions(8, 9). However, biodiversity is not restrictedto purely taxonomic components but alsoincludes functional and phylogenetic diver-sities. These two latter facets determine howorganisms affect ecosystem functioning andstability (14–18) and are thus essential forconservation.Here, we assess the extent to which six key
facets of freshwater fish biodiversity—taxonomic,functional, and phylogenetic richness, plus thedissimilarity among river basins in each of thesecategories—have changed over the past two
RESEARCH
Su et al., Science 371, 835–838 (2021) 19 February 2021 1 of 4
Fig. 1. Framework to mea-sure the cumulativechange in biodiversityfacets (CCBF). dDI repre-sents the change of a singlediversity index among thesix considered (taxonomicrichness, functional rich-ness, and phylogeneticrichness within each riverbasin; taxonomic dis-similarity, functional dis-similarity, and phylogeneticdissimilarity between pairsof basins). ML is the medianof all the values lower than1; MH is the median of allthe values higher than 1.The score is used tocompute the CCBF index.
1Laboratoire Evolution et Diversité Biologique (EDB), UMR5174, Université Toulouse 3 Paul Sabatier, CNRS, IRD, Toulouse, France. 2INRAE, Aix Marseille Univ, RECOVER, Aix-en-Provence, France.3Pôle R&D “ECLA,” Aix-en-Provence, France. 4Donghu Experimental Station of Lake Ecosystems, State Key Laboratory of Freshwater Ecology and Biotechnology of China, Institute of Hydrobiology,Chinese Academy of Sciences, Wuhan, P.R. China. 5Laboratory for Marine Fisheries Science and Food Production Processes, Qingdao National Laboratory for Marine Science and Technology, Qingdao,P.R. China. 6MARBEC, Univ Montpellier, CNRS, Ifremer, IRD, Montpellier, France.*Corresponding author. Email: [email protected]†These authors contributed equally to this work.
on February 18, 2021
http://science.sciencem
ag.org/D
ownloaded from
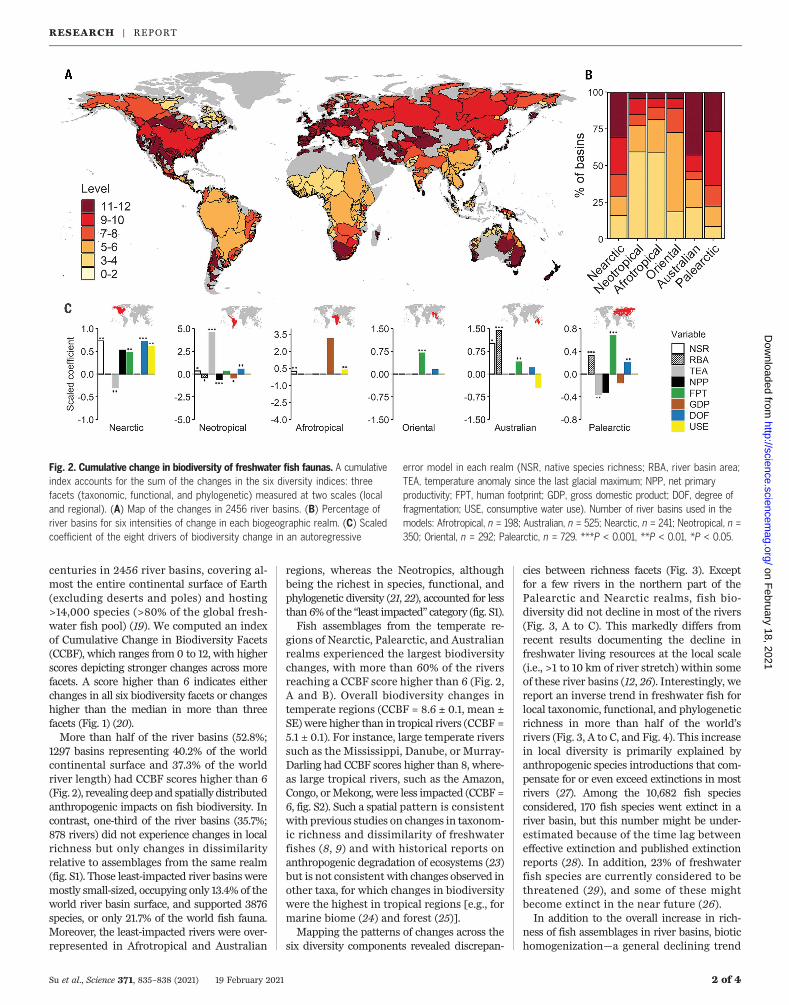
centuries in 2456 river basins, covering al-most the entire continental surface of Earth(excluding deserts and poles) and hosting>14,000 species (>80% of the global fresh-water fish pool) (19). We computed an indexof Cumulative Change in Biodiversity Facets(CCBF), which ranges from 0 to 12, with higherscores depicting stronger changes across morefacets. A score higher than 6 indicates eitherchanges in all six biodiversity facets or changeshigher than the median in more than threefacets (Fig. 1) (20).More than half of the river basins (52.8%;
1297 basins representing 40.2% of the worldcontinental surface and 37.3% of the worldriver length) had CCBF scores higher than 6(Fig. 2), revealing deep and spatially distributedanthropogenic impacts on fish biodiversity. Incontrast, one-third of the river basins (35.7%;878 rivers) did not experience changes in localrichness but only changes in dissimilarityrelative to assemblages from the same realm(fig. S1). Those least-impacted river basins weremostly small-sized, occupying only 13.4% of theworld river basin surface, and supported 3876species, or only 21.7% of the world fish fauna.Moreover, the least-impacted rivers were over-represented in Afrotropical and Australian
regions, whereas the Neotropics, althoughbeing the richest in species, functional, andphylogenetic diversity (21, 22), accounted for lessthan 6%of the “least impacted” category (fig. S1).Fish assemblages from the temperate re-
gions of Nearctic, Palearctic, and Australianrealms experienced the largest biodiversitychanges, with more than 60% of the riversreaching a CCBF score higher than 6 (Fig. 2,A and B). Overall biodiversity changes intemperate regions (CCBF = 8.6 ± 0.1, mean ±SE)were higher than in tropical rivers (CCBF =5.1 ± 0.1). For instance, large temperate riverssuch as the Mississippi, Danube, or Murray-Darling had CCBF scores higher than 8, where-as large tropical rivers, such as the Amazon,Congo, orMekong, were less impacted (CCBF =6, fig. S2). Such a spatial pattern is consistentwith previous studies on changes in taxonom-ic richness and dissimilarity of freshwaterfishes (8, 9) and with historical reports onanthropogenic degradation of ecosystems (23)but is not consistent with changes observed inother taxa, for which changes in biodiversitywere the highest in tropical regions [e.g., formarine biome (24) and forest (25)].Mapping the patterns of changes across the
six diversity components revealed discrepan-
cies between richness facets (Fig. 3). Exceptfor a few rivers in the northern part of thePalearctic and Nearctic realms, fish bio-diversity did not decline in most of the rivers(Fig. 3, A to C). This markedly differs fromrecent results documenting the decline infreshwater living resources at the local scale(i.e., >1 to 10 km of river stretch) within someof these river basins (12, 26). Interestingly, wereport an inverse trend in freshwater fish forlocal taxonomic, functional, and phylogeneticrichness in more than half of the world’srivers (Fig. 3, A to C, and Fig. 4). This increasein local diversity is primarily explained byanthropogenic species introductions that com-pensate for or even exceed extinctions in mostrivers (27). Among the 10,682 fish speciesconsidered, 170 fish species went extinct in ariver basin, but this number might be under-estimated because of the time lag betweeneffective extinction and published extinctionreports (28). In addition, 23% of freshwaterfish species are currently considered to bethreatened (29), and some of these mightbecome extinct in the near future (26).In addition to the overall increase in rich-
ness of fish assemblages in river basins, biotichomogenization—a general declining trend
Su et al., Science 371, 835–838 (2021) 19 February 2021 2 of 4
Fig. 2. Cumulative change in biodiversity of freshwater fish faunas. A cumulativeindex accounts for the sum of the changes in the six diversity indices: threefacets (taxonomic, functional, and phylogenetic) measured at two scales (localand regional). (A) Map of the changes in 2456 river basins. (B) Percentage ofriver basins for six intensities of change in each biogeographic realm. (C) Scaledcoefficient of the eight drivers of biodiversity change in an autoregressive
error model in each realm (NSR, native species richness; RBA, river basin area;TEA, temperature anomaly since the last glacial maximum; NPP, net primaryproductivity; FPT, human footprint; GDP, gross domestic product; DOF, degree offragmentation; USE, consumptive water use). Number of river basins used in themodels: Afrotropical, n = 198; Australian, n = 525; Nearctic, n = 241; Neotropical, n =350; Oriental, n = 292; Palearctic, n = 729. ***P < 0.001, **P < 0.01, *P < 0.05.
RESEARCH | REPORTon F
ebruary 18, 2021
http://science.sciencemag.org/
Dow
nloaded from
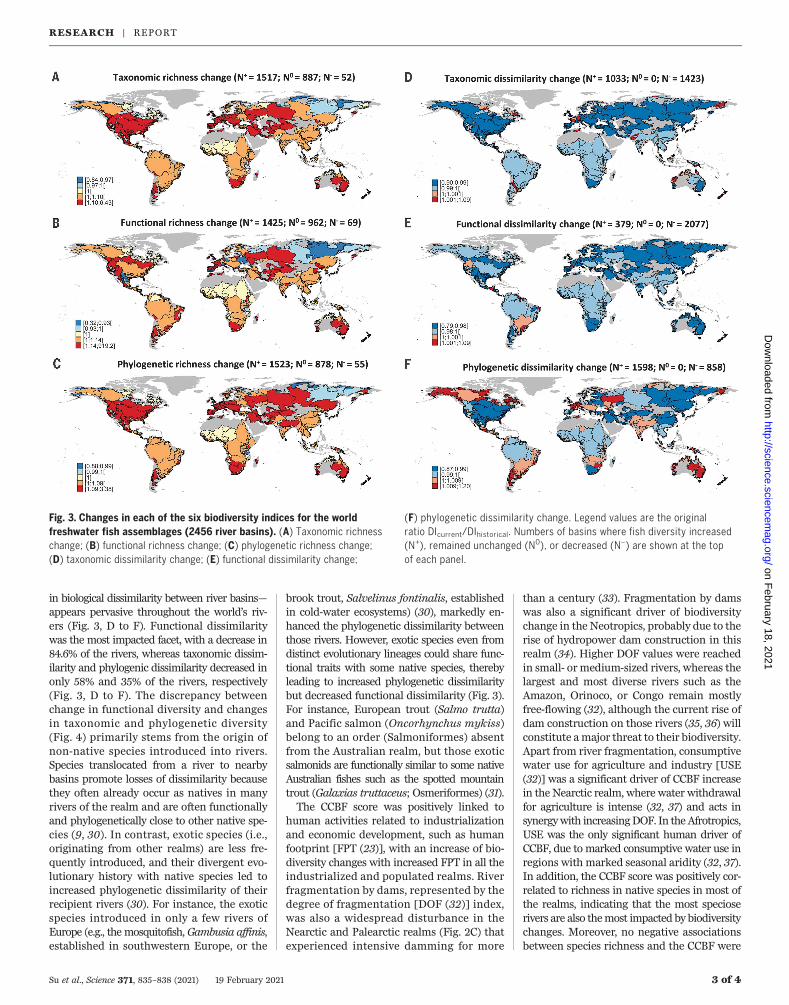
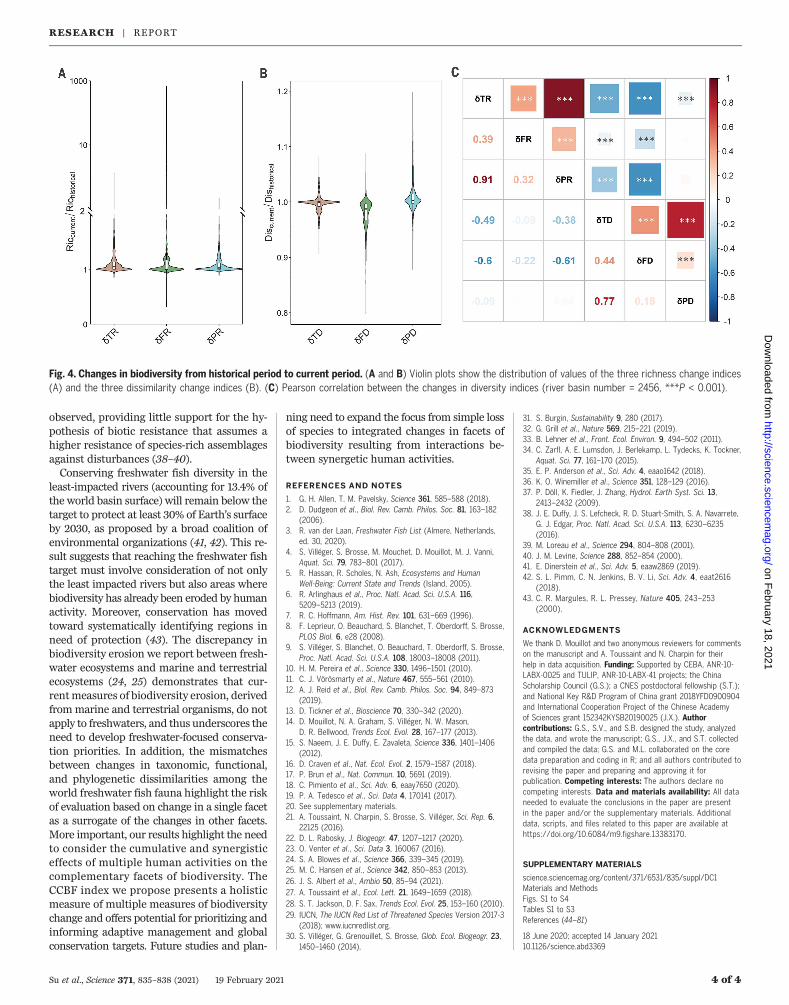
in biological dissimilarity between river basins—appears pervasive throughout the world’s riv-ers (Fig. 3, D to F). Functional dissimilaritywas the most impacted facet, with a decrease in84.6% of the rivers, whereas taxonomic dissim-ilarity and phylogenic dissimilarity decreased inonly 58% and 35% of the rivers, respectively(Fig. 3, D to F). The discrepancy betweenchange in functional diversity and changesin taxonomic and phylogenetic diversity(Fig. 4) primarily stems from the origin ofnon-native species introduced into rivers.Species translocated from a river to nearbybasins promote losses of dissimilarity becausethey often already occur as natives in manyrivers of the realm and are often functionallyand phylogenetically close to other native spe-cies (9, 30). In contrast, exotic species (i.e.,originating from other realms) are less fre-quently introduced, and their divergent evo-lutionary history with native species led toincreased phylogenetic dissimilarity of theirrecipient rivers (30). For instance, the exoticspecies introduced in only a few rivers ofEurope (e.g., the mosquitofish, Gambusia affinis,established in southwestern Europe, or the
brook trout, Salvelinus fontinalis, establishedin cold-water ecosystems) (30), markedly en-hanced the phylogenetic dissimilarity betweenthose rivers. However, exotic species even fromdistinct evolutionary lineages could share func-tional traits with some native species, therebyleading to increased phylogenetic dissimilaritybut decreased functional dissimilarity (Fig. 3).For instance, European trout (Salmo trutta)and Pacific salmon (Oncorhynchus mykiss)belong to an order (Salmoniformes) absentfrom the Australian realm, but those exoticsalmonids are functionally similar to some nativeAustralian fishes such as the spotted mountaintrout (Galaxias truttaceus; Osmeriformes) (31).The CCBF score was positively linked to
human activities related to industrializationand economic development, such as humanfootprint [FPT (23)], with an increase of bio-diversity changes with increased FPT in all theindustrialized and populated realms. Riverfragmentation by dams, represented by thedegree of fragmentation [DOF (32)] index,was also a widespread disturbance in theNearctic and Palearctic realms (Fig. 2C) thatexperienced intensive damming for more
than a century (33). Fragmentation by damswas also a significant driver of biodiversitychange in the Neotropics, probably due to therise of hydropower dam construction in thisrealm (34). Higher DOF values were reachedin small- or medium-sized rivers, whereas thelargest and most diverse rivers such as theAmazon, Orinoco, or Congo remain mostlyfree-flowing (32), although the current rise ofdam construction on those rivers (35, 36) willconstitute amajor threat to their biodiversity.Apart from river fragmentation, consumptivewater use for agriculture and industry [USE(32)] was a significant driver of CCBF increasein the Nearctic realm, where water withdrawalfor agriculture is intense (32, 37) and acts insynergywith increasingDOF. In theAfrotropics,USE was the only significant human driver ofCCBF, due to marked consumptive water use inregions with marked seasonal aridity (32, 37).In addition, the CCBF score was positively cor-related to richness in native species in most ofthe realms, indicating that the most specioserivers are also themost impacted by biodiversitychanges. Moreover, no negative associationsbetween species richness and the CCBF were
Su et al., Science 371, 835–838 (2021) 19 February 2021 3 of 4
Fig. 3. Changes in each of the six biodiversity indices for the worldfreshwater fish assemblages (2456 river basins). (A) Taxonomic richnesschange; (B) functional richness change; (C) phylogenetic richness change;(D) taxonomic dissimilarity change; (E) functional dissimilarity change;
(F) phylogenetic dissimilarity change. Legend values are the originalratio DIcurrent/DIhistorical. Numbers of basins where fish diversity increased(N+), remained unchanged (N0), or decreased (N–) are shown at the topof each panel.
RESEARCH | REPORTon F
ebruary 18, 2021
http://science.sciencemag.org/
Dow
nloaded from
observed, providing little support for the hy-pothesis of biotic resistance that assumes ahigher resistance of species-rich assemblagesagainst disturbances (38–40).Conserving freshwater fish diversity in the
least-impacted rivers (accounting for 13.4% ofthe world basin surface) will remain below thetarget to protect at least 30% of Earth’s surfaceby 2030, as proposed by a broad coalition ofenvironmental organizations (41, 42). This re-sult suggests that reaching the freshwater fishtarget must involve consideration of not onlythe least impacted rivers but also areas wherebiodiversity has already been eroded by humanactivity. Moreover, conservation has movedtoward systematically identifying regions inneed of protection (43). The discrepancy inbiodiversity erosion we report between fresh-water ecosystems and marine and terrestrialecosystems (24, 25) demonstrates that cur-rentmeasures of biodiversity erosion, derivedfrommarine and terrestrial organisms, do notapply to freshwaters, and thus underscores theneed to develop freshwater-focused conserva-tion priorities. In addition, the mismatchesbetween changes in taxonomic, functional,and phylogenetic dissimilarities among theworld freshwater fish fauna highlight the riskof evaluation based on change in a single facetas a surrogate of the changes in other facets.More important, our results highlight the needto consider the cumulative and synergisticeffects of multiple human activities on thecomplementary facets of biodiversity. TheCCBF index we propose presents a holisticmeasure of multiple measures of biodiversitychange and offers potential for prioritizing andinforming adaptive management and globalconservation targets. Future studies and plan-
ning need to expand the focus from simple lossof species to integrated changes in facets ofbiodiversity resulting from interactions be-tween synergetic human activities.
REFERENCES AND NOTES
1. G. H. Allen, T. M. Pavelsky, Science 361, 585–588 (2018).2. D. Dudgeon et al., Biol. Rev. Camb. Philos. Soc. 81, 163–182
(2006).3. R. van der Laan, Freshwater Fish List (Almere, Netherlands,
ed. 30, 2020).4. S. Villéger, S. Brosse, M. Mouchet, D. Mouillot, M. J. Vanni,
Aquat. Sci. 79, 783–801 (2017).5. R. Hassan, R. Scholes, N. Ash, Ecosystems and Human
Well-Being: Current State and Trends (Island, 2005).6. R. Arlinghaus et al., Proc. Natl. Acad. Sci. U.S.A. 116,
5209–5213 (2019).7. R. C. Hoffmann, Am. Hist. Rev. 101, 631–669 (1996).8. F. Leprieur, O. Beauchard, S. Blanchet, T. Oberdorff, S. Brosse,
PLOS Biol. 6, e28 (2008).9. S. Villéger, S. Blanchet, O. Beauchard, T. Oberdorff, S. Brosse,
Proc. Natl. Acad. Sci. U.S.A. 108, 18003–18008 (2011).10. H. M. Pereira et al., Science 330, 1496–1501 (2010).11. C. J. Vörösmarty et al., Nature 467, 555–561 (2010).12. A. J. Reid et al., Biol. Rev. Camb. Philos. Soc. 94, 849–873
(2019).13. D. Tickner et al., Bioscience 70, 330–342 (2020).14. D. Mouillot, N. A. Graham, S. Villéger, N. W. Mason,
D. R. Bellwood, Trends Ecol. Evol. 28, 167–177 (2013).15. S. Naeem, J. E. Duffy, E. Zavaleta, Science 336, 1401–1406
(2012).16. D. Craven et al., Nat. Ecol. Evol. 2, 1579–1587 (2018).17. P. Brun et al., Nat. Commun. 10, 5691 (2019).18. C. Pimiento et al., Sci. Adv. 6, eaay7650 (2020).19. P. A. Tedesco et al., Sci. Data 4, 170141 (2017).20. See supplementary materials.21. A. Toussaint, N. Charpin, S. Brosse, S. Villéger, Sci. Rep. 6,
22125 (2016).22. D. L. Rabosky, J. Biogeogr. 47, 1207–1217 (2020).23. O. Venter et al., Sci. Data 3, 160067 (2016).24. S. A. Blowes et al., Science 366, 339–345 (2019).25. M. C. Hansen et al., Science 342, 850–853 (2013).26. J. S. Albert et al., Ambio 50, 85–94 (2021).27. A. Toussaint et al., Ecol. Lett. 21, 1649–1659 (2018).28. S. T. Jackson, D. F. Sax, Trends Ecol. Evol. 25, 153–160 (2010).29. IUCN, The IUCN Red List of Threatened Species Version 2017-3
(2018); www.iucnredlist.org.30. S. Villéger, G. Grenouillet, S. Brosse, Glob. Ecol. Biogeogr. 23,
1450–1460 (2014).
31. S. Burgin, Sustainability 9, 280 (2017).32. G. Grill et al., Nature 569, 215–221 (2019).33. B. Lehner et al., Front. Ecol. Environ. 9, 494–502 (2011).34. C. Zarfl, A. E. Lumsdon, J. Berlekamp, L. Tydecks, K. Tockner,
Aquat. Sci. 77, 161–170 (2015).35. E. P. Anderson et al., Sci. Adv. 4, eaao1642 (2018).36. K. O. Winemiller et al., Science 351, 128–129 (2016).37. P. Döll, K. Fiedler, J. Zhang, Hydrol. Earth Syst. Sci. 13,
2413–2432 (2009).38. J. E. Duffy, J. S. Lefcheck, R. D. Stuart-Smith, S. A. Navarrete,
G. J. Edgar, Proc. Natl. Acad. Sci. U.S.A. 113, 6230–6235(2016).
39. M. Loreau et al., Science 294, 804–808 (2001).40. J. M. Levine, Science 288, 852–854 (2000).41. E. Dinerstein et al., Sci. Adv. 5, eaaw2869 (2019).42. S. L. Pimm, C. N. Jenkins, B. V. Li, Sci. Adv. 4, eaat2616
(2018).43. C. R. Margules, R. L. Pressey, Nature 405, 243–253
(2000).
ACKNOWLEDGMENTS
We thank D. Mouillot and two anonymous reviewers for commentson the manuscript and A. Toussaint and N. Charpin for theirhelp in data acquisition. Funding: Supported by CEBA, ANR-10-LABX-0025 and TULIP, ANR-10-LABX-41 projects; the ChinaScholarship Council (G.S.); a CNES postdoctoral fellowship (S.T.);and National Key R&D Program of China grant 2018YFD0900904and International Cooperation Project of the Chinese Academyof Sciences grant 152342KYSB20190025 (J.X.). Authorcontributions: G.S., S.V., and S.B. designed the study, analyzedthe data, and wrote the manuscript; G.S., J.X., and S.T. collectedand compiled the data; G.S. and M.L. collaborated on the coredata preparation and coding in R; and all authors contributed torevising the paper and preparing and approving it forpublication. Competing interests: The authors declare nocompeting interests. Data and materials availability: All dataneeded to evaluate the conclusions in the paper are presentin the paper and/or the supplementary materials. Additionaldata, scripts, and files related to this paper are available athttps://doi.org/10.6084/m9.figshare.13383170.
SUPPLEMENTARY MATERIALS
science.sciencemag.org/content/371/6531/835/suppl/DC1Materials and MethodsFigs. S1 to S4Tables S1 to S3References (44–81)
18 June 2020; accepted 14 January 202110.1126/science.abd3369
Su et al., Science 371, 835–838 (2021) 19 February 2021 4 of 4
Fig. 4. Changes in biodiversity from historical period to current period. (A and B) Violin plots show the distribution of values of the three richness change indices(A) and the three dissimilarity change indices (B). (C) Pearson correlation between the changes in diversity indices (river basin number = 2456, ***P < 0.001).
RESEARCH | REPORTon F
ebruary 18, 2021
http://science.sciencemag.org/
Dow
nloaded from
Human impacts on global freshwater fish biodiversityGuohuan Su, Maxime Logez, Jun Xu, Shengli Tao, Sébastien Villéger and Sébastien Brosse
DOI: 10.1126/science.abd3369 (6531), 835-838.371Science
, this issue p. 835Sciencespecialized lineages.non-native species have also led to the homogenization of rivers, with many now containing similar species and fewerby human activities, with only very large tropical river basins receiving the lowest levels of change. Fragmentation and
affectedfocusing on several key measures of fish biodiversity. They found that half of all river systems have been heavily looked across such systems globally,et al.systems. We know less about fresh waters, including large rivers. Su
We are increasingly aware of human impacts on biodiversity across our planet, especially in terrestrial and marineNo waters left untouched
ARTICLE TOOLS http://science.sciencemag.org/content/371/6531/835
MATERIALSSUPPLEMENTARY http://science.sciencemag.org/content/suppl/2021/02/17/371.6531.835.DC1
REFERENCES
http://science.sciencemag.org/content/371/6531/835#BIBLThis article cites 78 articles, 20 of which you can access for free
PERMISSIONS http://www.sciencemag.org/help/reprints-and-permissions
Terms of ServiceUse of this article is subject to the
is a registered trademark of AAAS.ScienceScience, 1200 New York Avenue NW, Washington, DC 20005. The title (print ISSN 0036-8075; online ISSN 1095-9203) is published by the American Association for the Advancement ofScience
Science. No claim to original U.S. Government WorksCopyright © 2020 The Authors, some rights reserved; exclusive licensee American Association for the Advancement of
on February 18, 2021
http://science.sciencem
ag.org/D
ownloaded from