Embed Size (px)
Citation preview
1
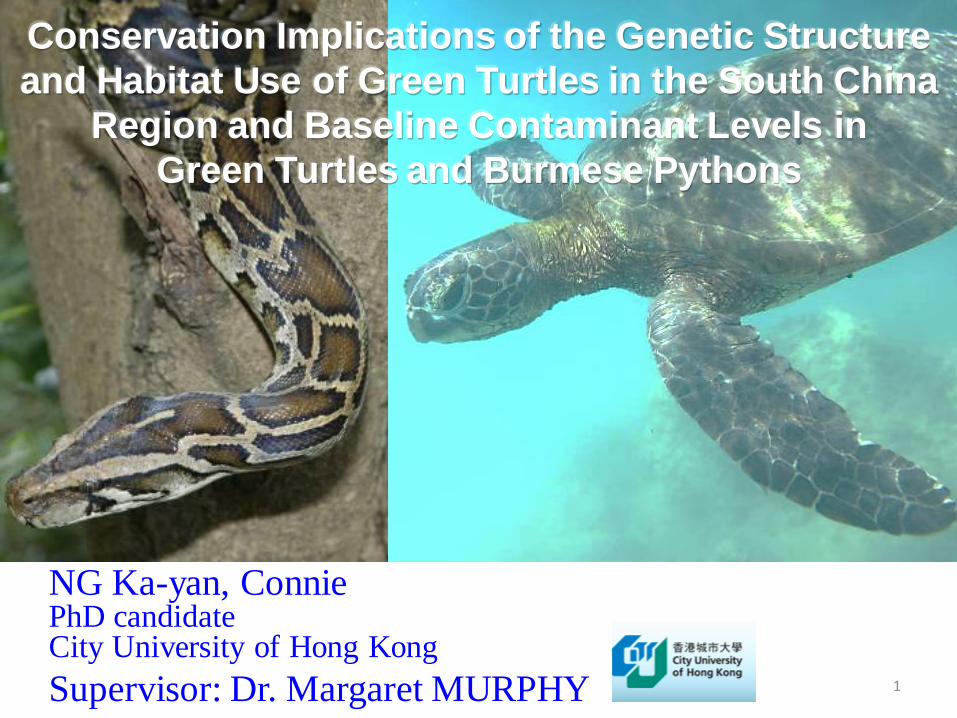
Conservation Implications of the Genetic Structure
and Habitat Use of Green Turtles in the South China
Region and Baseline Contaminant Levels in
Green Turtles and Burmese Pythons
NG Ka-yan, Connie PhD candidate City University of Hong Kong
Supervisor: Dr. Margaret MURPHY
2
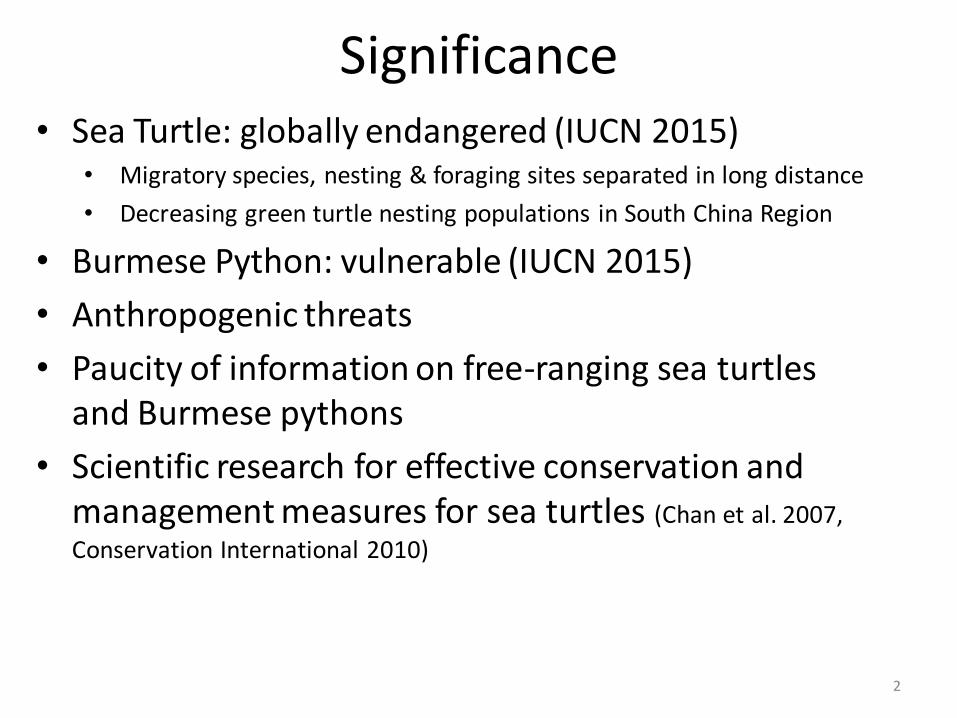
Significance • Sea Turtle: globally endangered (IUCN 2015)
• Migratory species, nesting & foraging sites separated in long distance
• Decreasing green turtle nesting populations in South China Region
• Burmese Python: vulnerable (IUCN 2015)
• Anthropogenic threats
• Paucity of information on free-ranging sea turtles and Burmese pythons
• Scientific research for effective conservation and management measures for sea turtles (Chan et al. 2007,
Conservation International 2010)
3
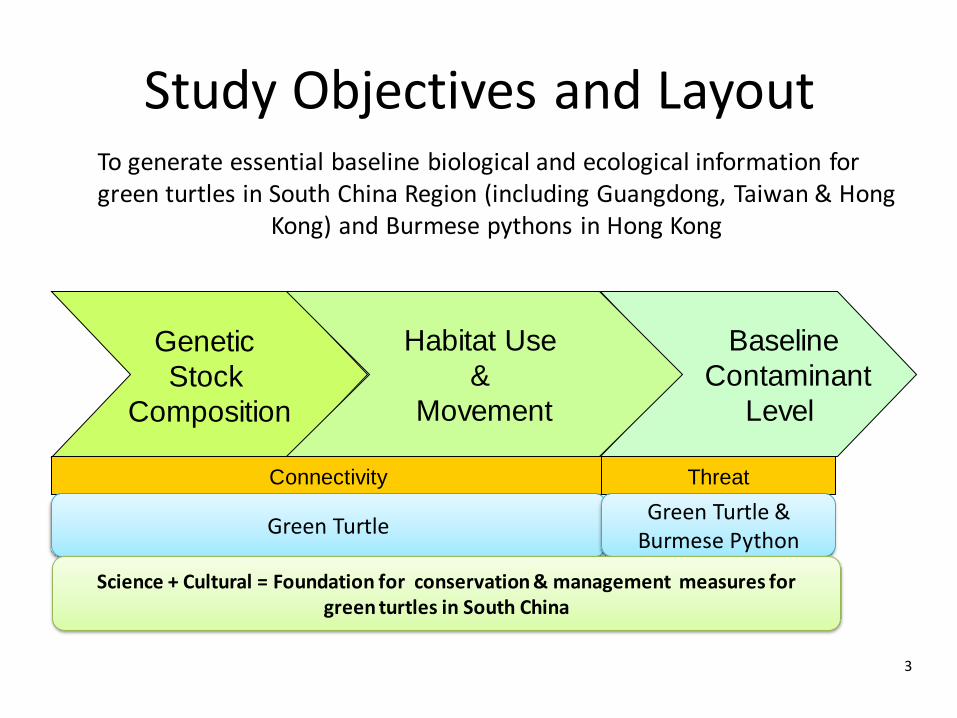
Study Objectives and Layout To generate essential baseline biological and ecological information for green turtles in South China Region (including Guangdong, Taiwan & Hong
Kong) and Burmese pythons in Hong Kong
Genetic
Stock
Composition
Baseline
Contaminant
Level
Connectivity Threat
Green Turtle Green Turtle &
Burmese Python
Habitat Use
&
Movement
Science + Cultural = Foundation for conservation & management measures for green turtles in South China
4
Genetic Stock Composition of Green Turtles
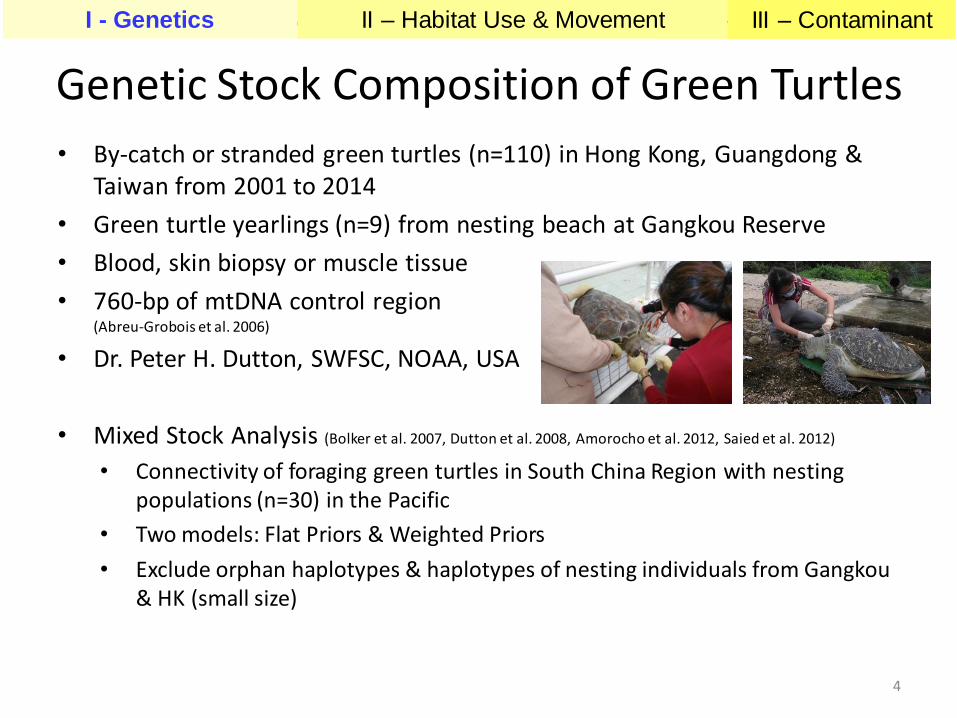
• By-catch or stranded green turtles (n=110) in Hong Kong, Guangdong & Taiwan from 2001 to 2014
• Green turtle yearlings (n=9) from nesting beach at Gangkou Reserve
• Blood, skin biopsy or muscle tissue
• 760-bp of mtDNA control region (Abreu-Grobois et al. 2006)
• Dr. Peter H. Dutton, SWFSC, NOAA, USA
• Mixed Stock Analysis (Bolker et al. 2007, Dutton et al. 2008, Amorocho et al. 2012, Saied et al. 2012)
• Connectivity of foraging green turtles in South China Region with nesting populations (n=30) in the Pacific
• Two models: Flat Priors & Weighted Priors
• Exclude orphan haplotypes & haplotypes of nesting individuals from Gangkou & HK (small size)
I – Population Structure & Habitat Use II – Genetics III – Contaminant Test I - Genetics II – Habitat Use & Movement III – Contaminant
5
Genetic Stock Composition of Green Turtles I – Population Structure & Habitat Use II – Genetics III – Contaminant Test I - Genetics II – Habitat Use & Movement III – Contaminant
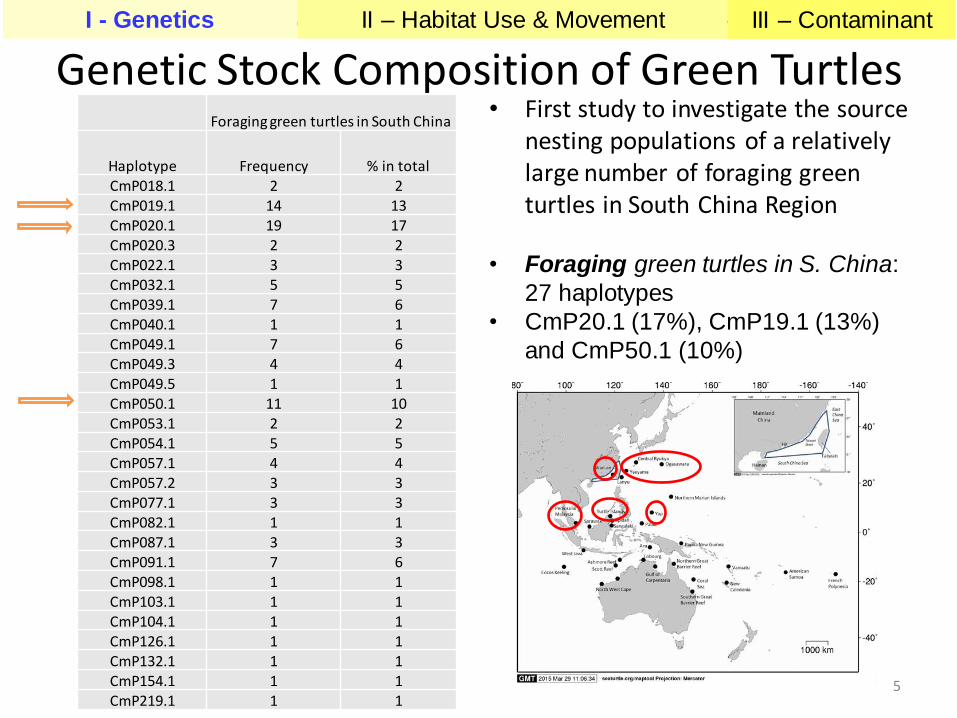
• First study to investigate the source nesting populations of a relatively large number of foraging green turtles in South China Region
• Foraging green turtles in S. China:
27 haplotypes
• CmP20.1 (17%), CmP19.1 (13%)
and CmP50.1 (10%)
Foraging green turtles in South China
Haplotype Frequency % in total CmP018.1 2 2 CmP019.1 14 13 CmP020.1 19 17 CmP020.3 2 2 CmP022.1 3 3 CmP032.1 5 5 CmP039.1 7 6 CmP040.1 1 1 CmP049.1 7 6 CmP049.3 4 4 CmP049.5 1 1 CmP050.1 11 10 CmP053.1 2 2 CmP054.1 5 5 CmP057.1 4 4 CmP057.2 3 3 CmP077.1 3 3 CmP082.1 1 1 CmP087.1 3 3 CmP091.1 7 6 CmP098.1 1 1 CmP103.1 1 1 CmP104.1 1 1 CmP126.1 1 1 CmP132.1 1 1 CmP154.1 1 1 CmP219.1 1 1
6
Genetic Stock Composition of Green Turtles I – Population Structure & Habitat Use II – Genetics III – Contaminant Test I - Genetics II – Habitat Use & Movement III – Contaminant
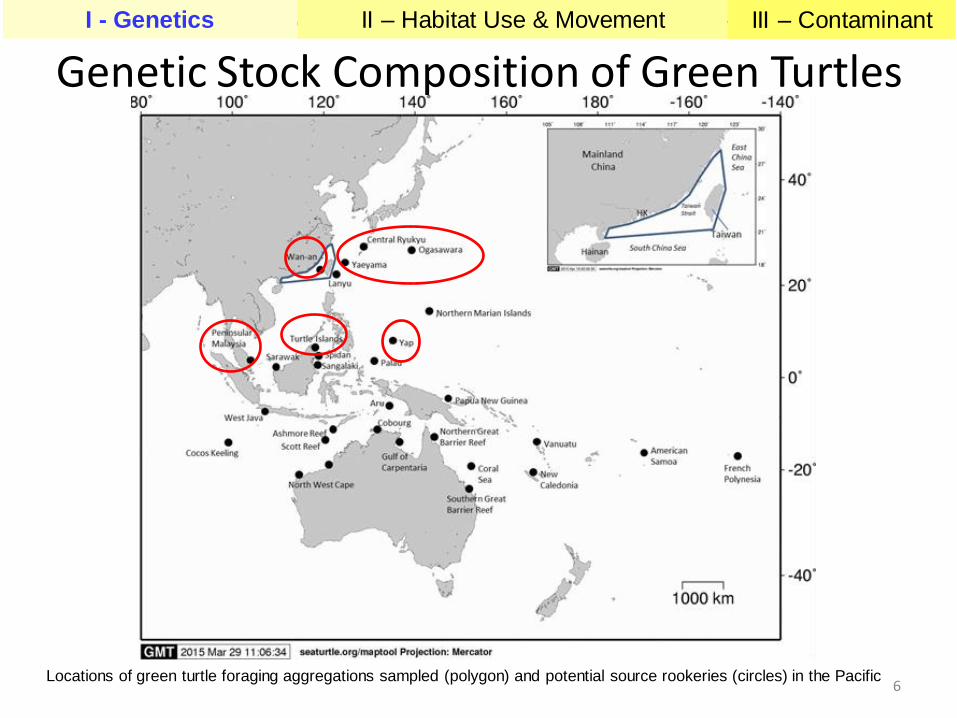
Locations of green turtle foraging aggregations sampled (polygon) and potential source rookeries (circles) in the Pacific
7
Genetic Stock Composition of Green Turtles I – Population Structure & Habitat Use II – Genetics III – Contaminant Test I - Genetics II – Habitat Use & Movement III – Contaminant
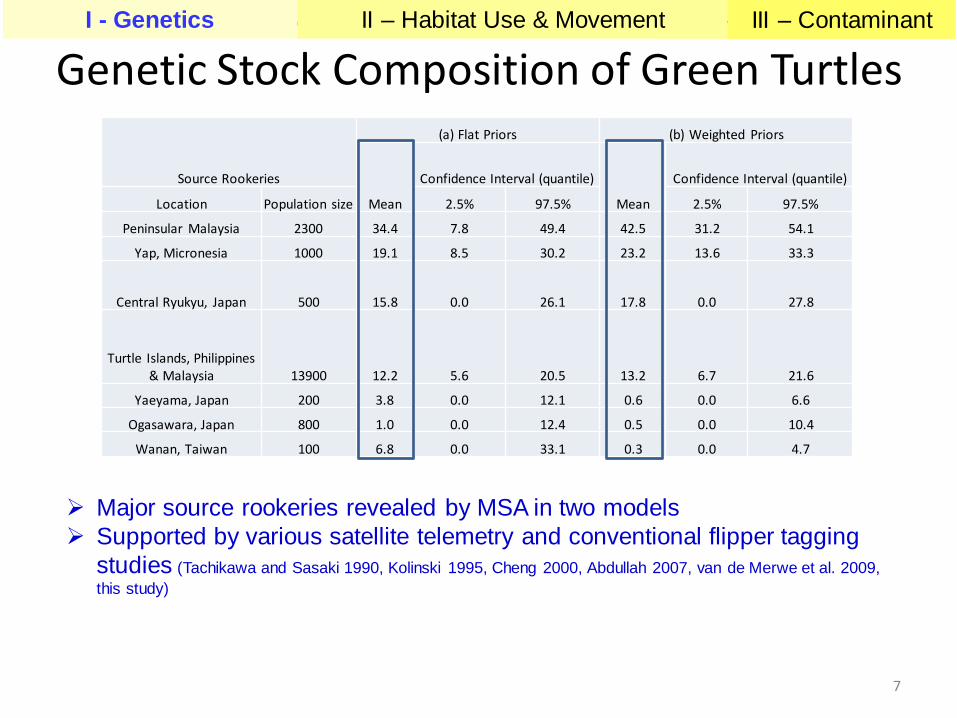
Major source rookeries revealed by MSA in two models
Supported by various satellite telemetry and conventional flipper tagging
studies (Tachikawa and Sasaki 1990, Kolinski 1995, Cheng 2000, Abdullah 2007, van de Merwe et al. 2009,
this study)
Source Rookeries
(a) Flat Priors (b) Weighted Priors
Mean
Confidence Interval (quantile)
Mean
Confidence Interval (quantile)
Location Population size 2.5% 97.5% 2.5% 97.5%
Peninsular Malaysia 2300 34.4 7.8 49.4 42.5 31.2 54.1
Yap, Micronesia 1000 19.1 8.5 30.2 23.2 13.6 33.3
Central Ryukyu, Japan 500 15.8 0.0 26.1 17.8 0.0 27.8
Turtle Islands, Philippines & Malaysia 13900 12.2 5.6 20.5 13.2 6.7 21.6
Yaeyama, Japan 200 3.8 0.0 12.1 0.6 0.0 6.6
Ogasawara, Japan 800 1.0 0.0 12.4 0.5 0.0 10.4
Wanan, Taiwan 100 6.8 0.0 33.1 0.3 0.0 4.7
8
Genetic Stock Composition of Green Turtles
• Nesting green turtles in Gangkou Reserve, Guangdong: CmP19.1 (4 yearlings in 2010) & CmP49.1 (5 yearlings in 2011)
• Nesting green turtles in Hong Kong: CmP18 & CmP116 (Ng et al. 2014)
Genetic composition of rookeries at Hong Kong and Gangkou are similar to other nesting populations in the Pacific Region
• Wan-an and Lanyu Islands of Taiwan, Australasia and the Indo-Pacific (Norman et al. 1994, Dethmers et al. 2006, Cheng et al. 2008)
I – Population Structure & Habitat Use II – Genetics III – Contaminant Test I - Genetics II – Habitat Use & Movement III – Contaminant
9
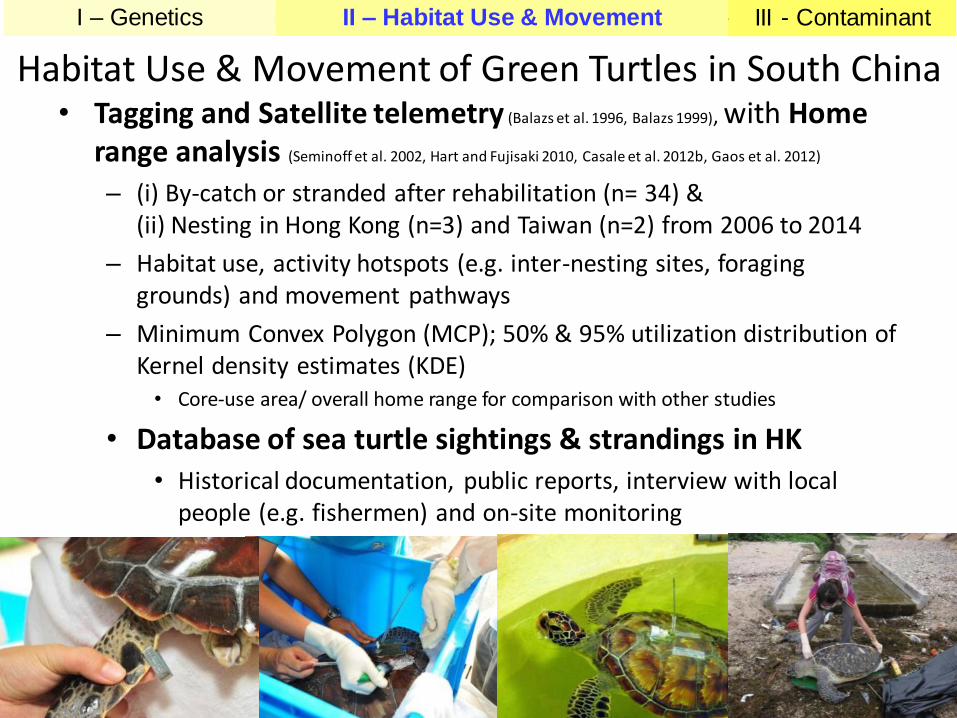
Habitat Use & Movement of Green Turtles in South China • Tagging and Satellite telemetry (Balazs et al. 1996, Balazs 1999), with Home
range analysis (Seminoff et al. 2002, Hart and Fujisaki 2010, Casale et al. 2012b, Gaos et al. 2012)
– (i) By-catch or stranded after rehabilitation (n= 34) & (ii) Nesting in Hong Kong (n=3) and Taiwan (n=2) from 2006 to 2014
– Habitat use, activity hotspots (e.g. inter-nesting sites, foraging grounds) and movement pathways
– Minimum Convex Polygon (MCP); 50% & 95% utilization distribution of Kernel density estimates (KDE)
• Core-use area/ overall home range for comparison with other studies
• Database of sea turtle sightings & strandings in HK • Historical documentation, public reports, interview with local
people (e.g. fishermen) and on-site monitoring
I – Population Structure & Habitat Use II – Genetics III – Contaminant Test I – Genetics II – Habitat Use & Movement III - Contaminant
10
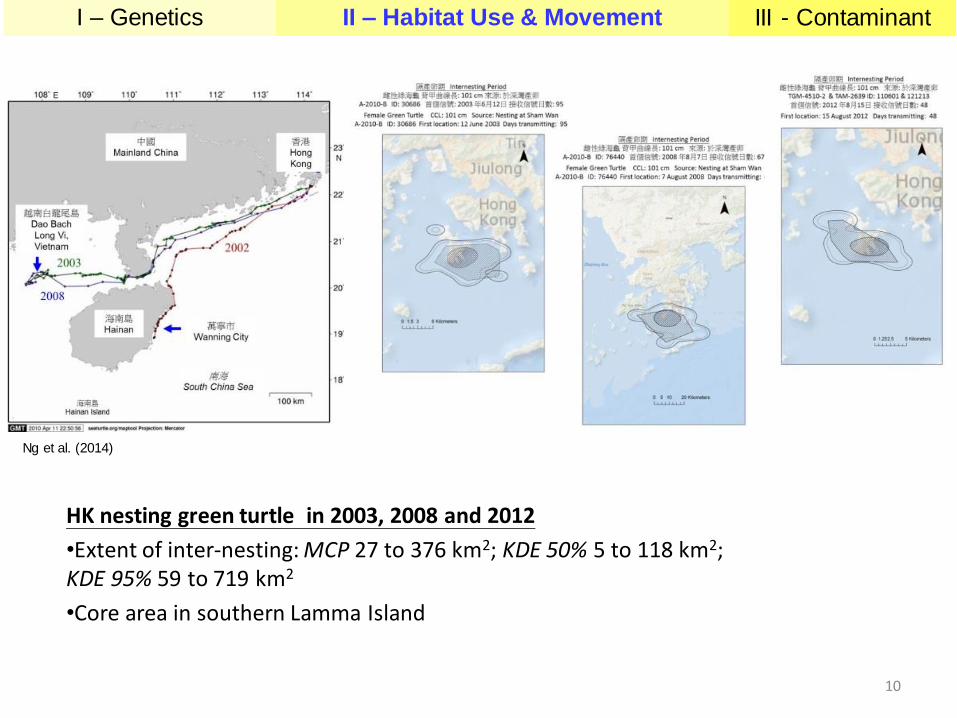
HK nesting green turtle in 2003, 2008 and 2012
•Extent of inter-nesting: MCP 27 to 376 km2; KDE 50% 5 to 118 km2; KDE 95% 59 to 719 km2
•Core area in southern Lamma Island
I – Genetics II – Habitat Use & Movement III - Contaminant
Ng et al. (2014)
11
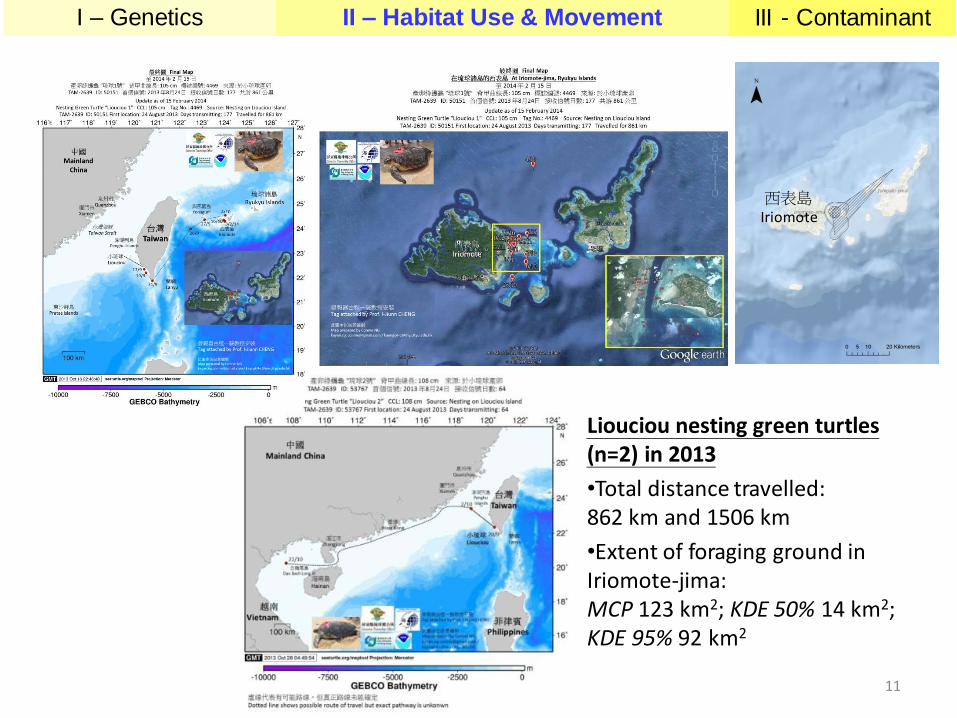
Liouciou nesting green turtles (n=2) in 2013
•Total distance travelled: 862 km and 1506 km
•Extent of foraging ground in Iriomote-jima: MCP 123 km2; KDE 50% 14 km2; KDE 95% 92 km2
I – Genetics II – Habitat Use & Movement III - Contaminant
西表島 Iriomote
12
I – Genetics II – Habitat Use & Movement III - Contaminant
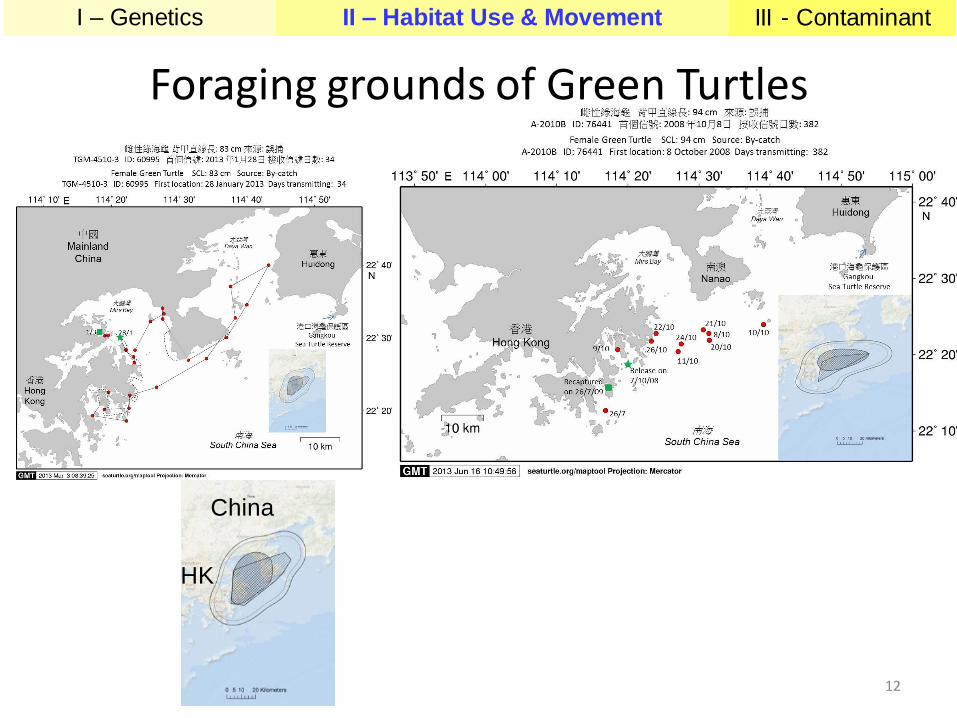
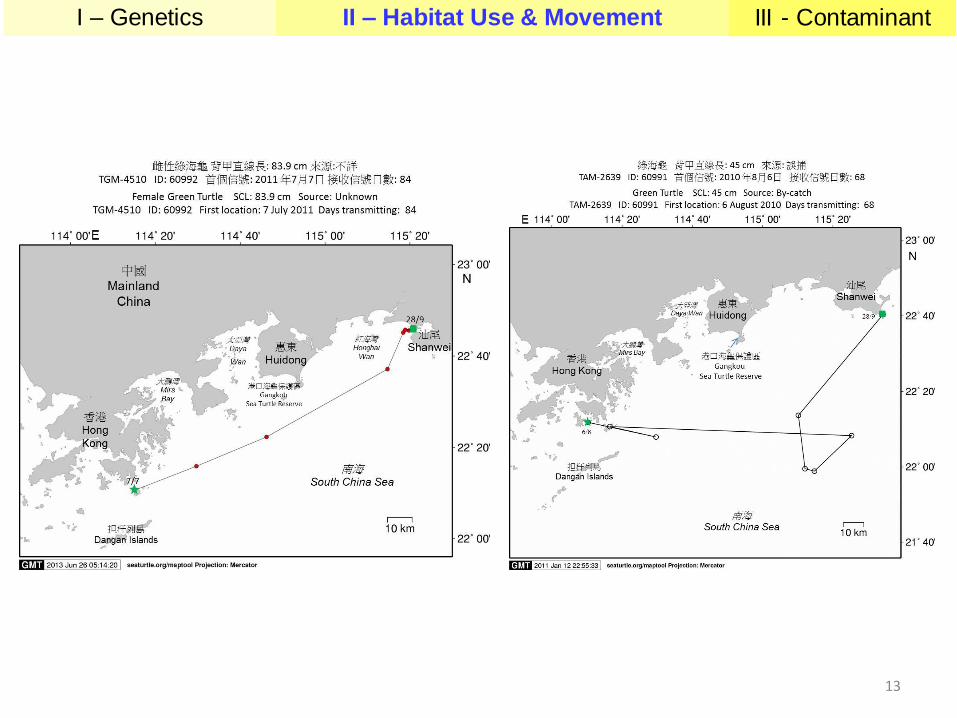
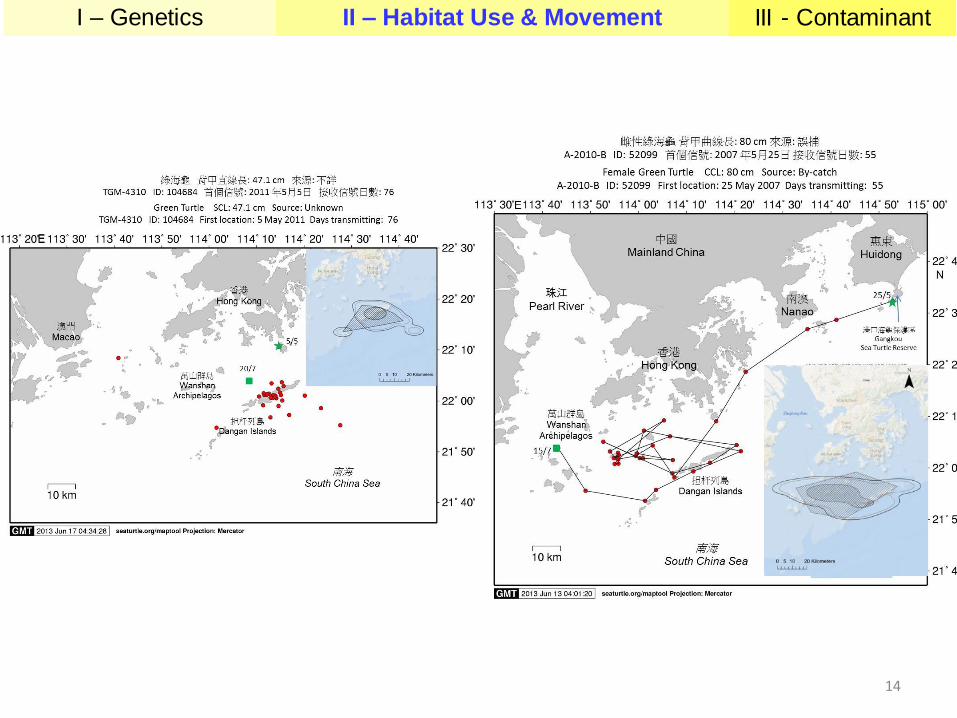
Foraging grounds of Green Turtles
HK
China
13
I – Genetics II – Habitat Use & Movement III - Contaminant
14
I – Genetics II – Habitat Use & Movement III - Contaminant
15
I – Genetics II – Habitat Use & Movement III - Contaminant
16
I – Genetics II – Habitat Use & Movement III - Contaminant
17
I – Genetics II – Habitat Use & Movement III - Contaminant
18
I – Genetics II – Habitat Use & Movement III - Contaminant
19
I – Genetics II – Habitat Use & Movement III - Contaminant
20
I – Genetics II – Habitat Use & Movement III - Contaminant
Penghu Penghu
21
I – Genetics II – Habitat Use & Movement III - Contaminant
22
I – Genetics II – Habitat Use & Movement III - Contaminant
23
I – Genetics II – Habitat Use & Movement III - Contaminant
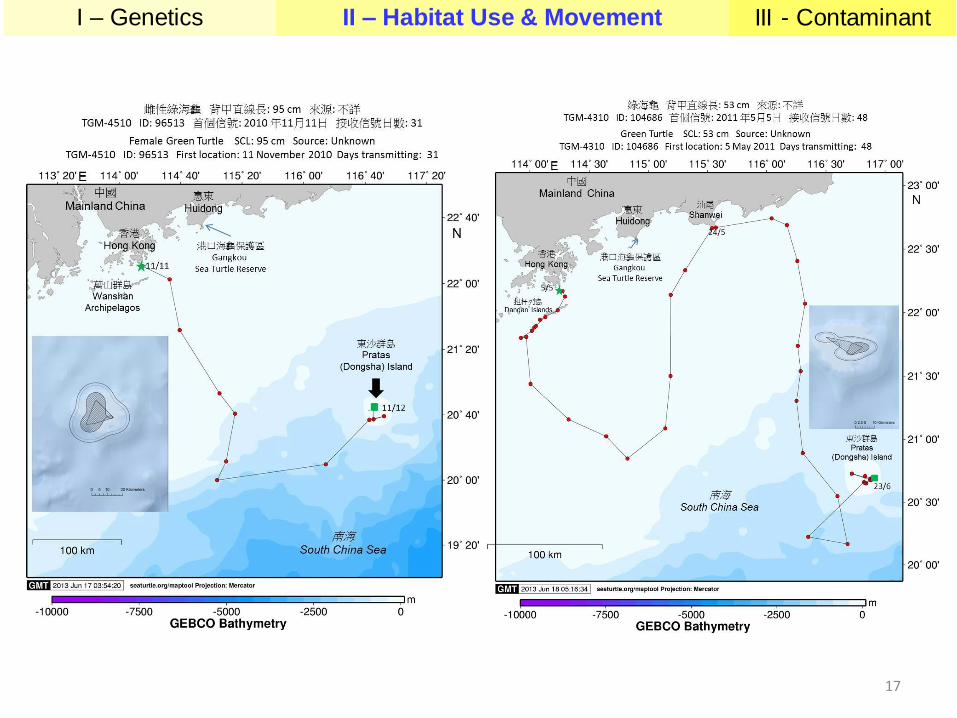
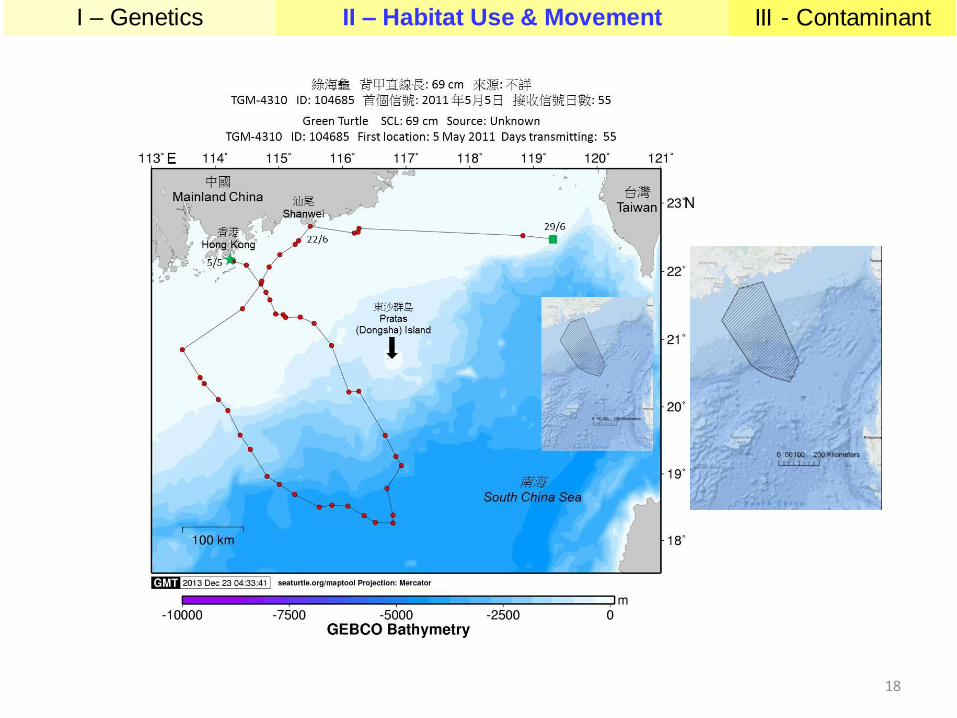
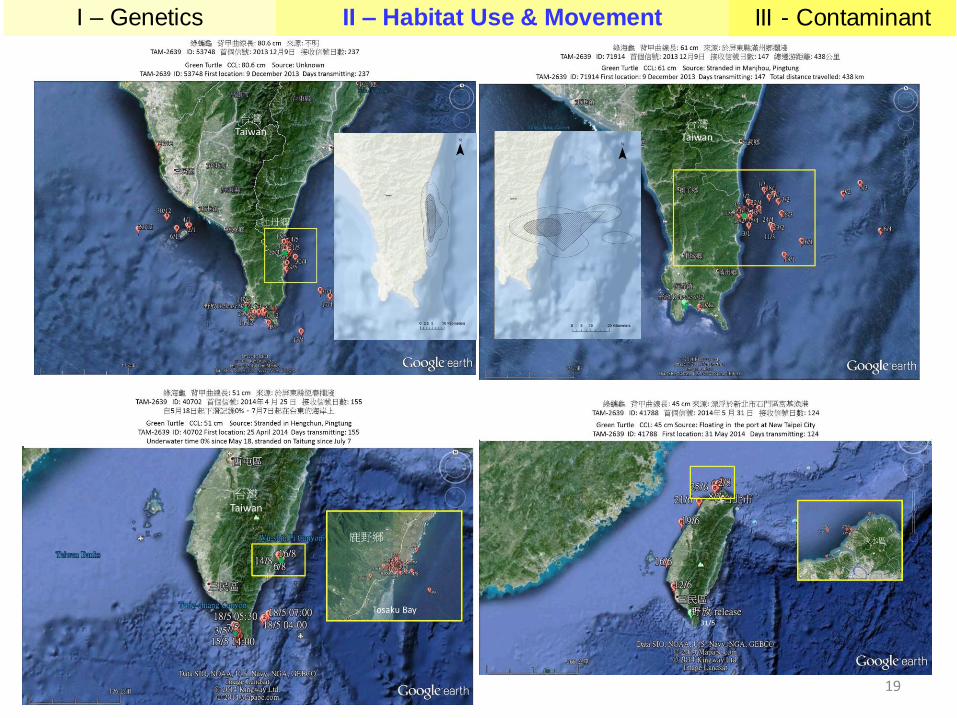
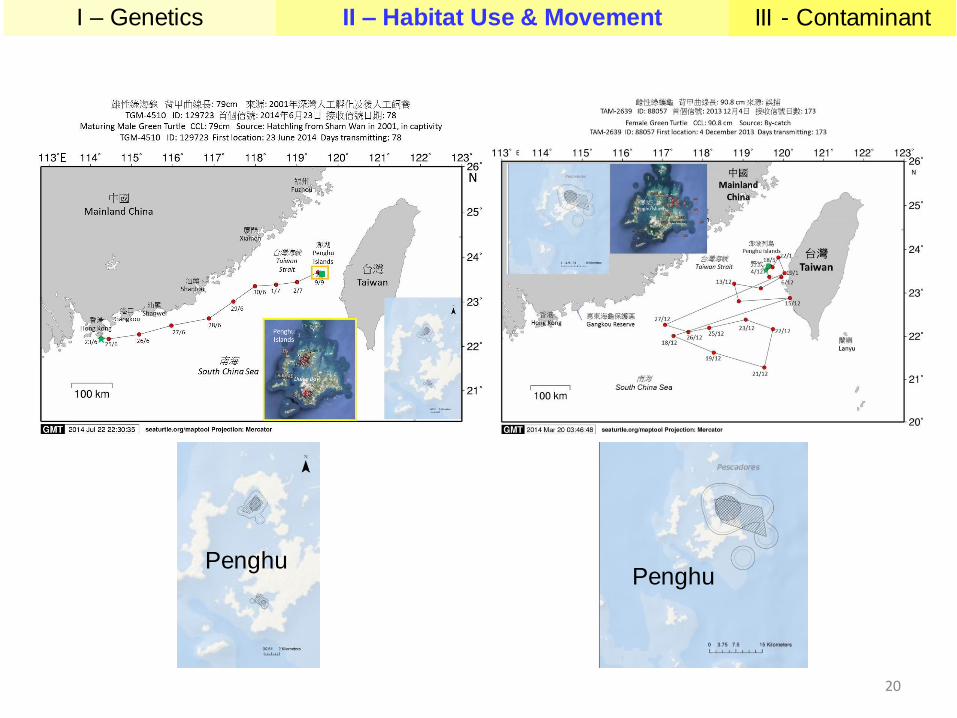
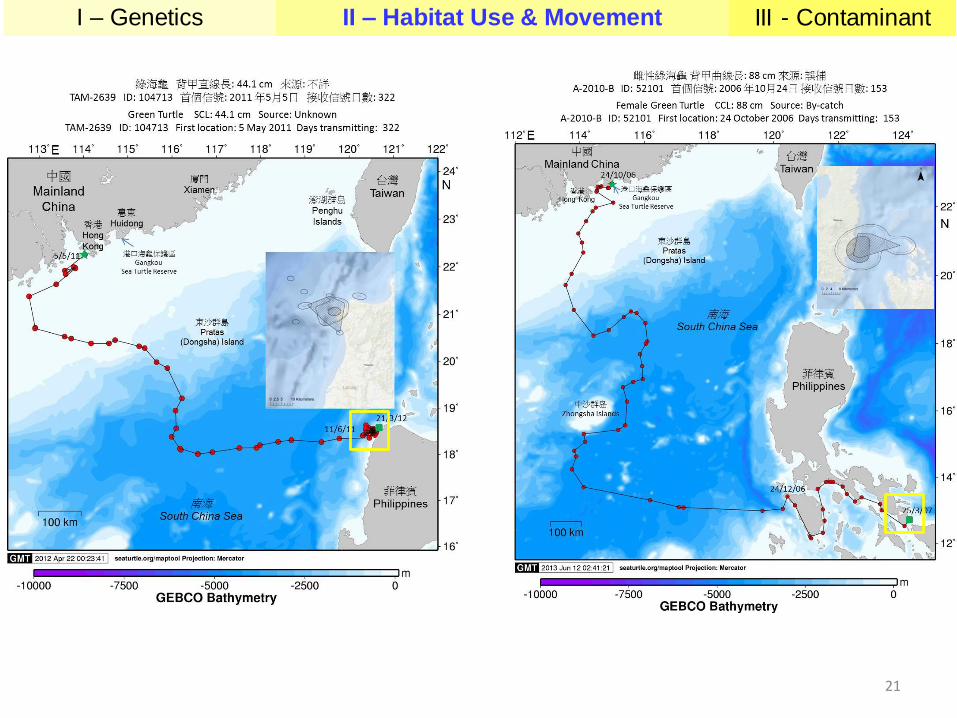
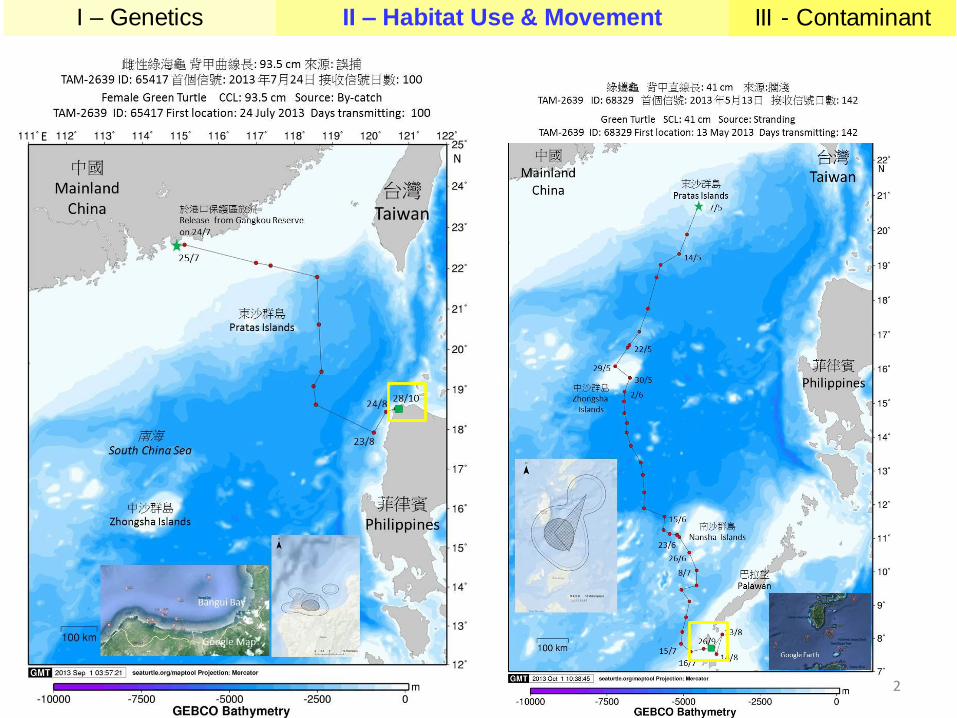
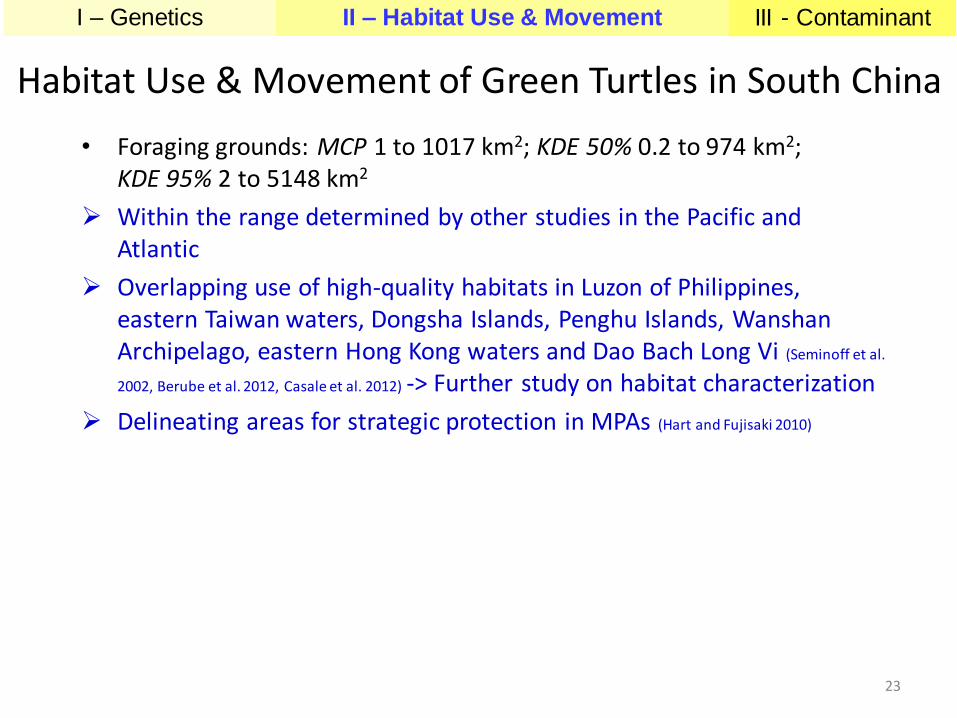
• Foraging grounds: MCP 1 to 1017 km2; KDE 50% 0.2 to 974 km2; KDE 95% 2 to 5148 km2
Within the range determined by other studies in the Pacific and Atlantic
Overlapping use of high-quality habitats in Luzon of Philippines, eastern Taiwan waters, Dongsha Islands, Penghu Islands, Wanshan Archipelago, eastern Hong Kong waters and Dao Bach Long Vi (Seminoff et al.
2002, Berube et al. 2012, Casale et al. 2012) -> Further study on habitat characterization
Delineating areas for strategic protection in MPAs (Hart and Fujisaki 2010)
Habitat Use & Movement of Green Turtles in South China
24
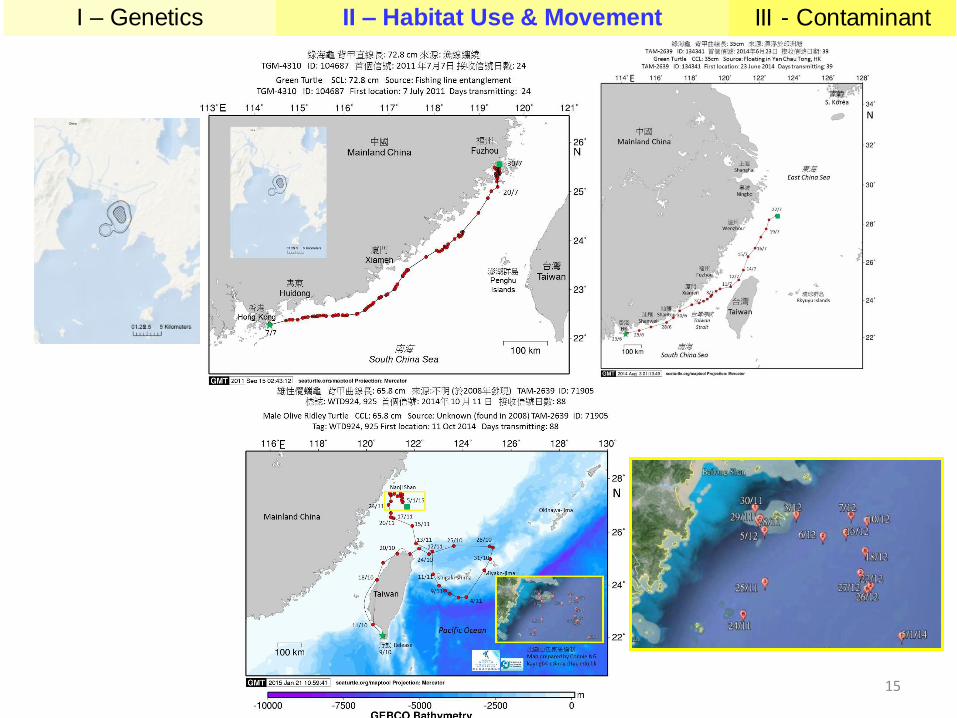
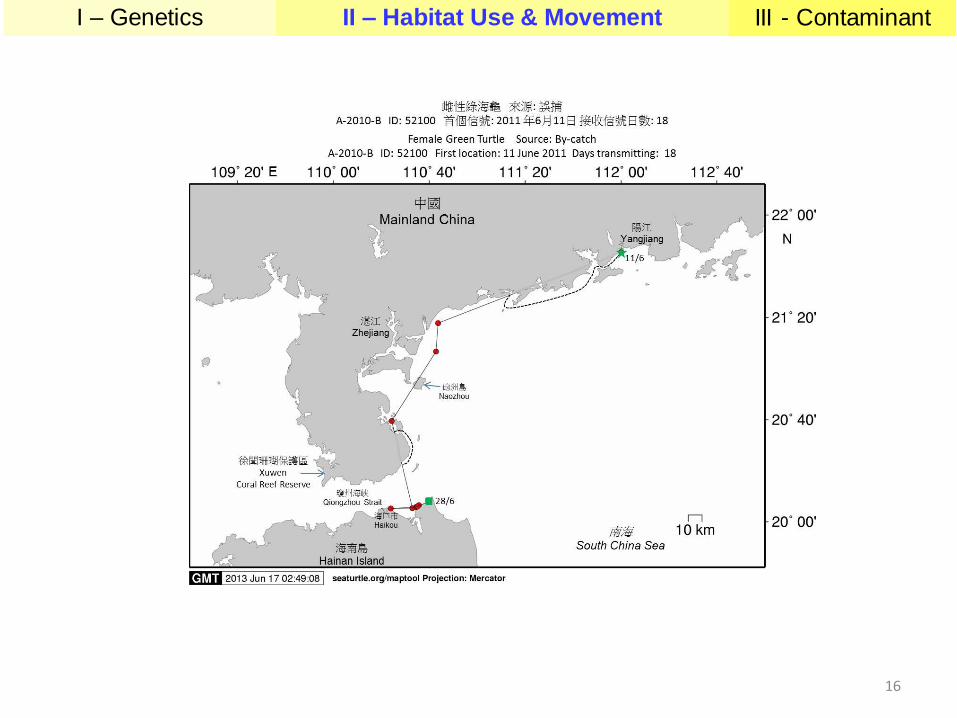
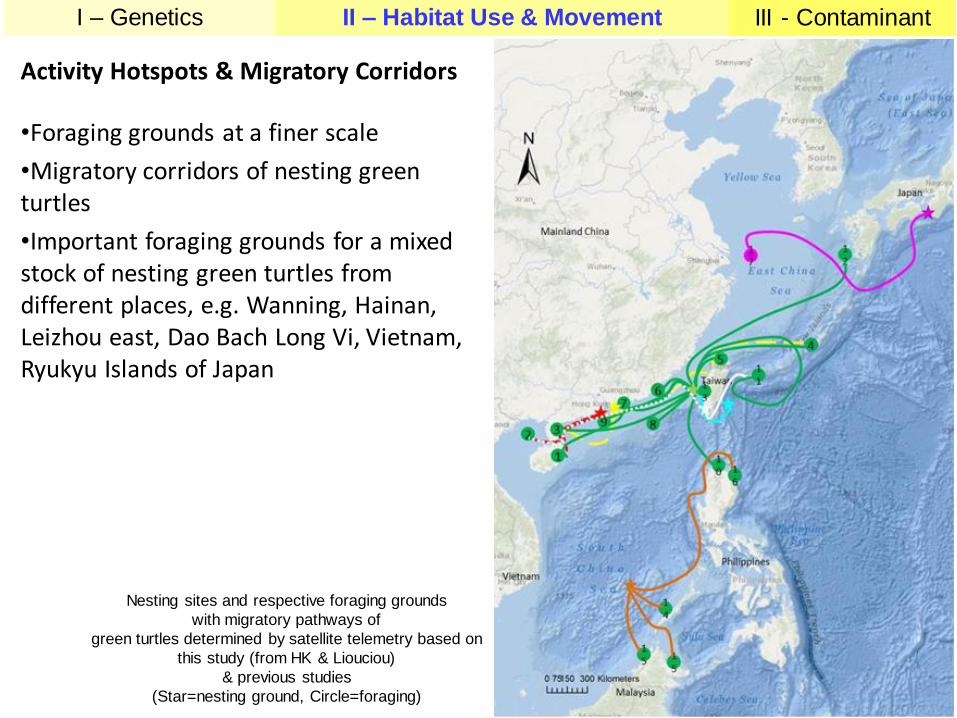
Activity Hotspots & Migratory Corridors
•Foraging grounds at a finer scale
•Migratory corridors of nesting green turtles
•Important foraging grounds for a mixed stock of nesting green turtles from different places, e.g. Wanning, Hainan, Leizhou east, Dao Bach Long Vi, Vietnam, Ryukyu Islands of Japan
Nesting sites and respective foraging grounds
with migratory pathways of
green turtles determined by satellite telemetry based on
this study (from HK & Liouciou)
& previous studies
(Star=nesting ground, Circle=foraging)
I – Genetics II – Habitat Use & Movement III - Contaminant
25
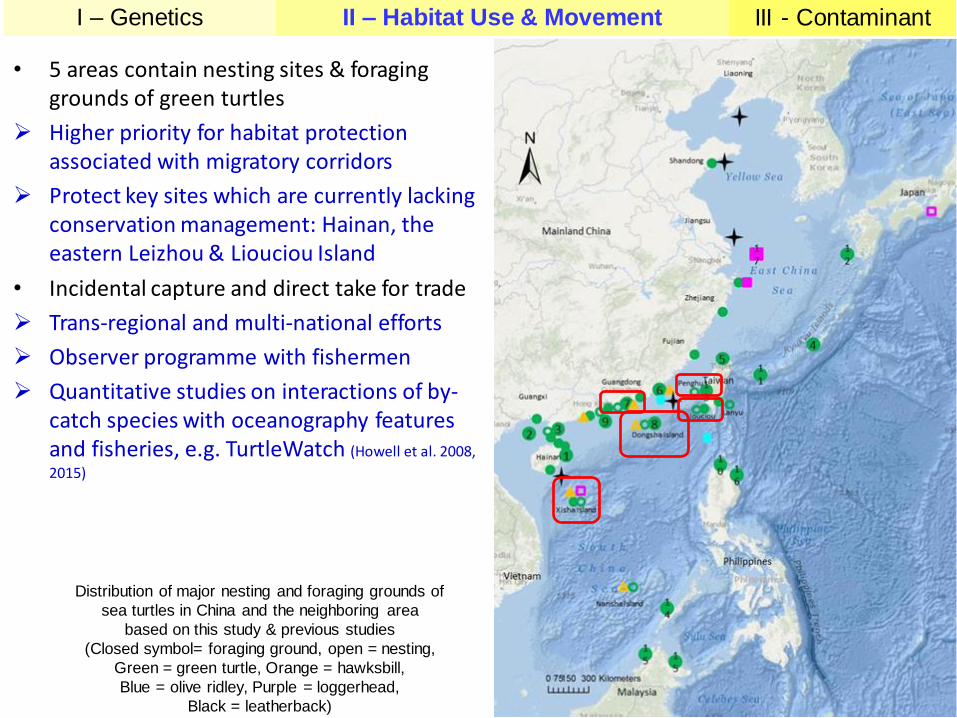
• 5 areas contain nesting sites & foraging grounds of green turtles
Higher priority for habitat protection associated with migratory corridors
Protect key sites which are currently lacking conservation management: Hainan, the eastern Leizhou & Liouciou Island
• Incidental capture and direct take for trade
Trans-regional and multi-national efforts
Observer programme with fishermen
Quantitative studies on interactions of by-catch species with oceanography features and fisheries, e.g. TurtleWatch (Howell et al. 2008,
2015)
Distribution of major nesting and foraging grounds of
sea turtles in China and the neighboring area
based on this study & previous studies
(Closed symbol= foraging ground, open = nesting,
Green = green turtle, Orange = hawksbill,
Blue = olive ridley, Purple = loggerhead,
Black = leatherback)
I – Genetics II – Habitat Use & Movement III - Contaminant
26
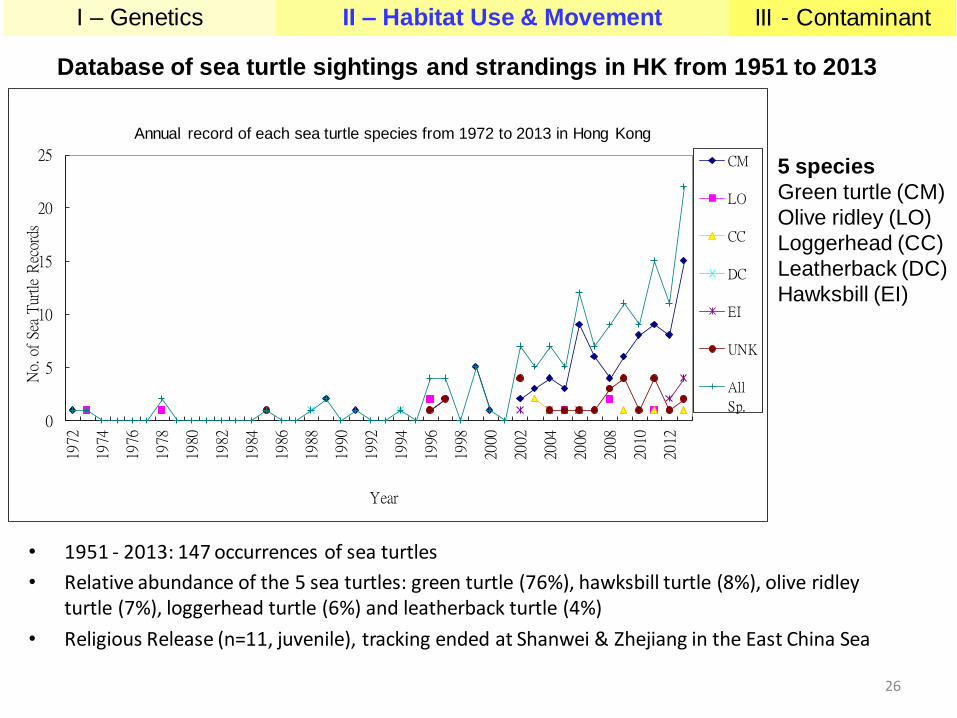
• 1951 - 2013: 147 occurrences of sea turtles
• Relative abundance of the 5 sea turtles: green turtle (76%), hawksbill turtle (8%), olive ridley turtle (7%), loggerhead turtle (6%) and leatherback turtle (4%)
• Religious Release (n=11, juvenile), tracking ended at Shanwei & Zhejiang in the East China Sea
5 species
Green turtle (CM)
Olive ridley (LO)
Loggerhead (CC)
Leatherback (DC)
Hawksbill (EI)
I – Genetics II – Habitat Use & Movement III - Contaminant
Database of sea turtle sightings and strandings in HK from 1951 to 2013
0
5
10
15
20
25
1972
1974
1976
1978
1980
1982
1984
1986
1988
1990
1992
1994
1996
1998
2000
2002
2004
2006
2008
2010
2012
No.
of
Sea
Tur
tle R
ecor
ds
Year
CM
LO
CC
DC
EI
UNK
All
Sp.
Annual record of each sea turtle species from 1972 to 2013 in Hong Kong
27
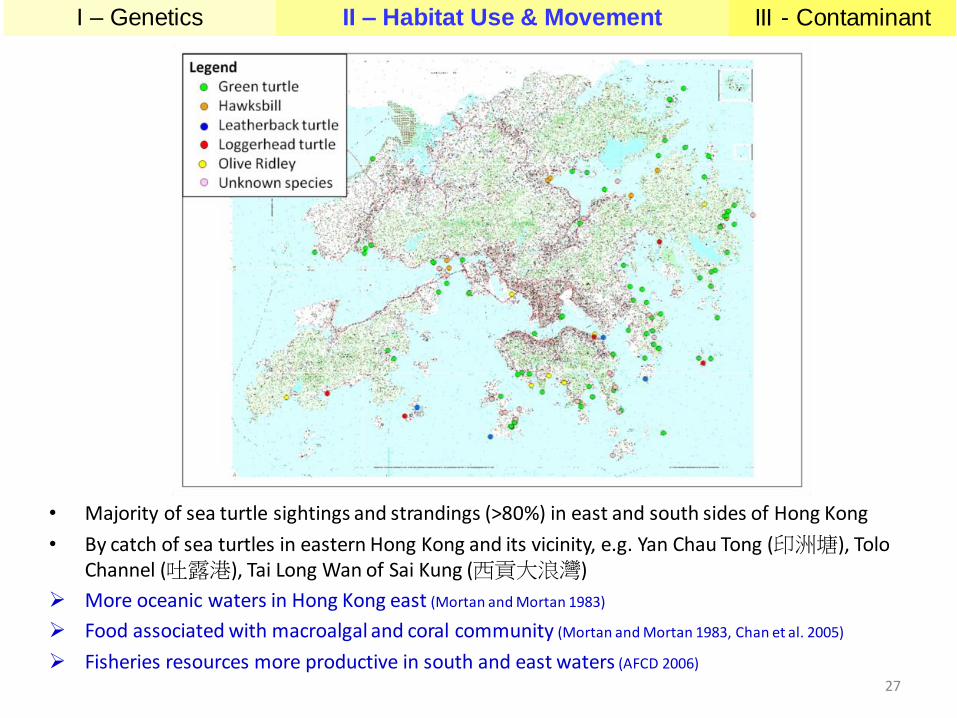
• Majority of sea turtle sightings and strandings (>80%) in east and south sides of Hong Kong
• By catch of sea turtles in eastern Hong Kong and its vicinity, e.g. Yan Chau Tong (印洲塘), Tolo Channel (吐露港), Tai Long Wan of Sai Kung (西貢大浪灣)
More oceanic waters in Hong Kong east (Mortan and Mortan 1983)
Food associated with macroalgal and coral community (Mortan and Mortan 1983, Chan et al. 2005)
Fisheries resources more productive in south and east waters (AFCD 2006)
I – Genetics II – Habitat Use & Movement III - Contaminant
28
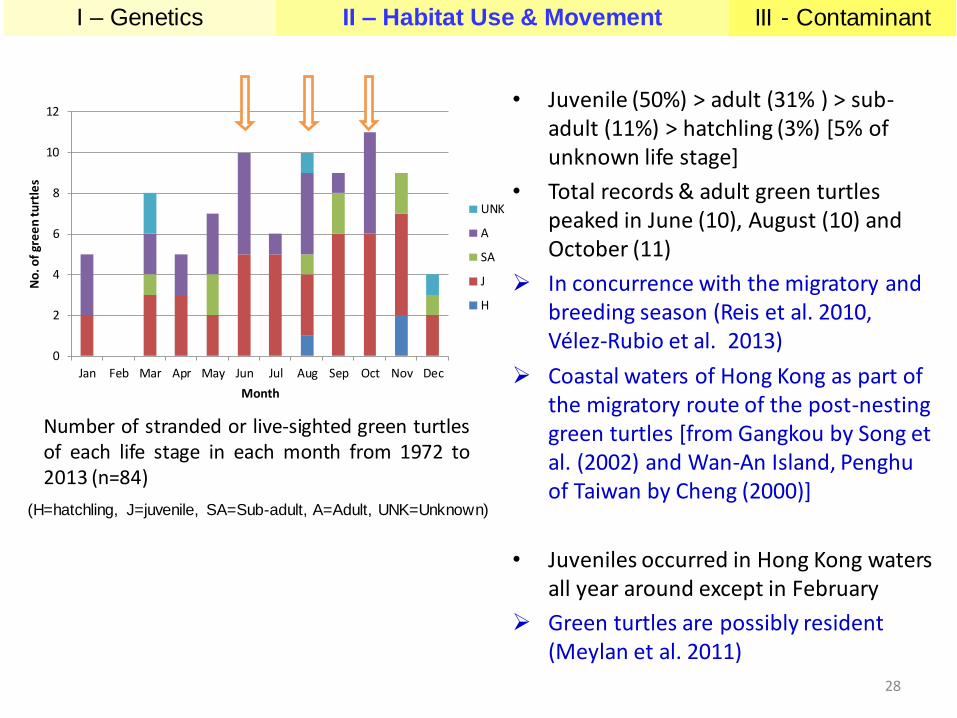
• Juvenile (50%) > adult (31% ) > sub-adult (11%) > hatchling (3%) [5% of unknown life stage]
• Total records & adult green turtles peaked in June (10), August (10) and October (11)
In concurrence with the migratory and breeding season (Reis et al. 2010, Vélez-Rubio et al. 2013)
Coastal waters of Hong Kong as part of the migratory route of the post-nesting green turtles [from Gangkou by Song et al. (2002) and Wan-An Island, Penghu of Taiwan by Cheng (2000)]
• Juveniles occurred in Hong Kong waters all year around except in February
Green turtles are possibly resident (Meylan et al. 2011)
(H=hatchling, J=juvenile, SA=Sub-adult, A=Adult, UNK=Unknown)
I – Genetics II – Habitat Use & Movement III - Contaminant
Number of stranded or live-sighted green turtles of each life stage in each month from 1972 to 2013 (n=84)
0
2
4
6
8
10
12
Jan Feb Mar Apr May Jun Jul Aug Sep Oct Nov Dec
No
. of
gre
en
tu
rtle
s
Month
UNK
A
SA
J
H
29
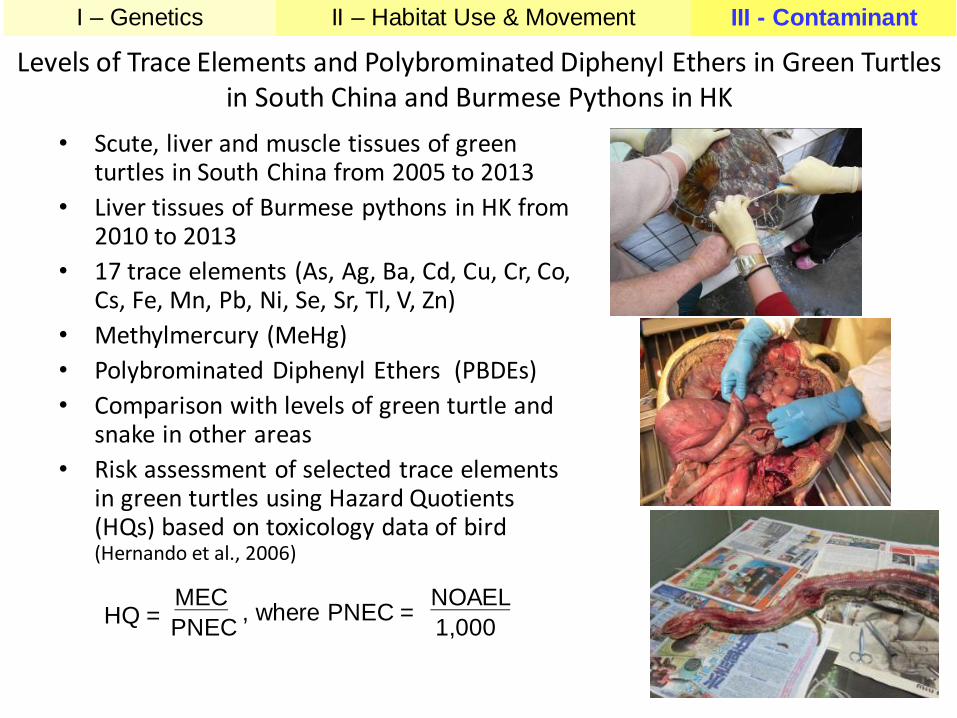
Levels of Trace Elements and Polybrominated Diphenyl Ethers in Green Turtles in South China and Burmese Pythons in HK
• Scute, liver and muscle tissues of green turtles in South China from 2005 to 2013
• Liver tissues of Burmese pythons in HK from 2010 to 2013
• 17 trace elements (As, Ag, Ba, Cd, Cu, Cr, Co, Cs, Fe, Mn, Pb, Ni, Se, Sr, Tl, V, Zn)
• Methylmercury (MeHg)
• Polybrominated Diphenyl Ethers (PBDEs)
• Comparison with levels of green turtle and snake in other areas
• Risk assessment of selected trace elements in green turtles using Hazard Quotients (HQs) based on toxicology data of bird (Hernando et al., 2006)
I – Genetics II – Habitat Use & Movement III - Contaminant
HQ = MEC
PNEC , where PNEC =
NOAEL
1,000
30
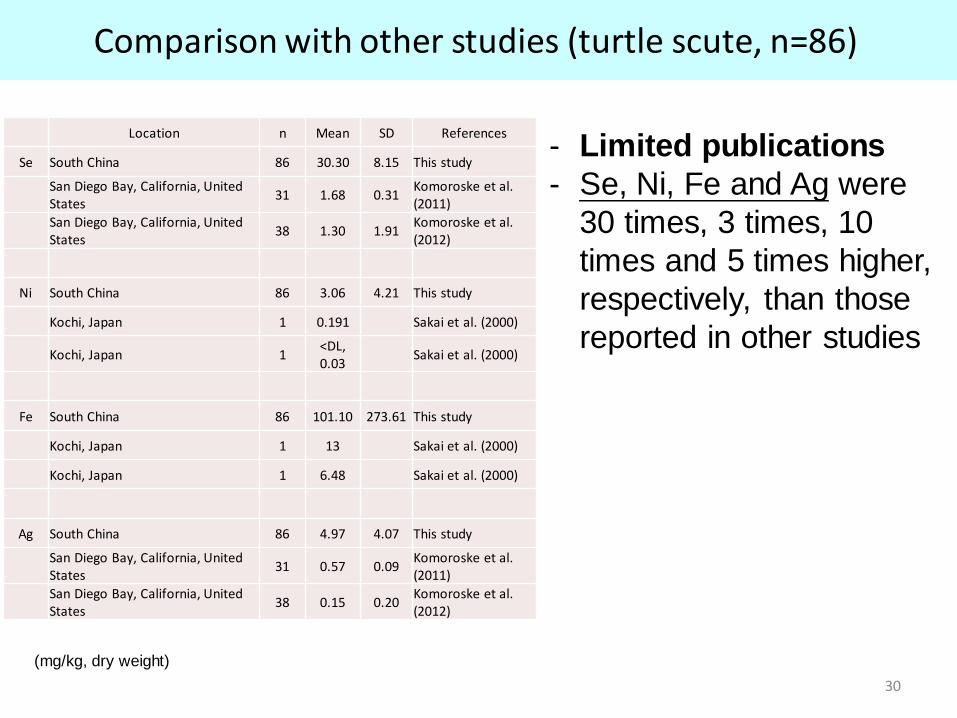
Comparison with other studies (turtle scute, n=86)
- Limited publications
- Se, Ni, Fe and Ag were
30 times, 3 times, 10
times and 5 times higher,
respectively, than those
reported in other studies
(mg/kg, dry weight)
Location n Mean SD References
Se South China 86 30.30 8.15 This study
San Diego Bay, California, United States
31 1.68 0.31 Komoroske et al. (2011)
San Diego Bay, California, United States
38 1.30 1.91 Komoroske et al. (2012)
Ni South China 86 3.06 4.21 This study
Kochi, Japan 1 0.191 Sakai et al. (2000)
Kochi, Japan 1 <DL, 0.03
Sakai et al. (2000)
Fe South China 86 101.10 273.61 This study
Kochi, Japan 1 13 Sakai et al. (2000)
Kochi, Japan 1 6.48 Sakai et al. (2000)
Ag South China 86 4.97 4.07 This study
San Diego Bay, California, United States
31 0.57 0.09 Komoroske et al. (2011)
San Diego Bay, California, United States
38 0.15 0.20 Komoroske et al. (2012)
31
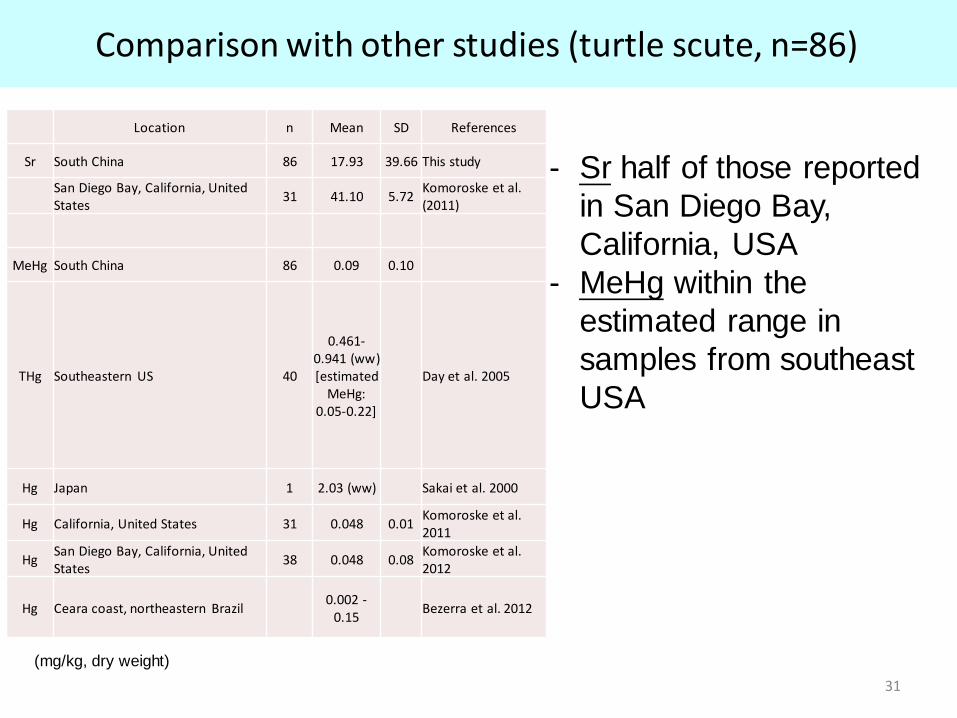
Comparison with other studies (turtle scute, n=86)
- Sr half of those reported
in San Diego Bay,
California, USA
- MeHg within the
estimated range in
samples from southeast
USA
(mg/kg, dry weight)
Location n Mean SD References
Sr South China 86 17.93 39.66 This study
San Diego Bay, California, United States
31 41.10 5.72 Komoroske et al. (2011)
MeHg South China 86 0.09 0.10
THg Southeastern US 40
0.461-0.941 (ww) [estimated
MeHg: 0.05-0.22]
Day et al. 2005
Hg Japan 1 2.03 (ww) Sakai et al. 2000
Hg California, United States 31 0.048 0.01 Komoroske et al. 2011
Hg San Diego Bay, California, United States
38 0.048 0.08 Komoroske et al. 2012
Hg Ceara coast, northeastern Brazil 0.002 -
0.15 Bezerra et al. 2012
32
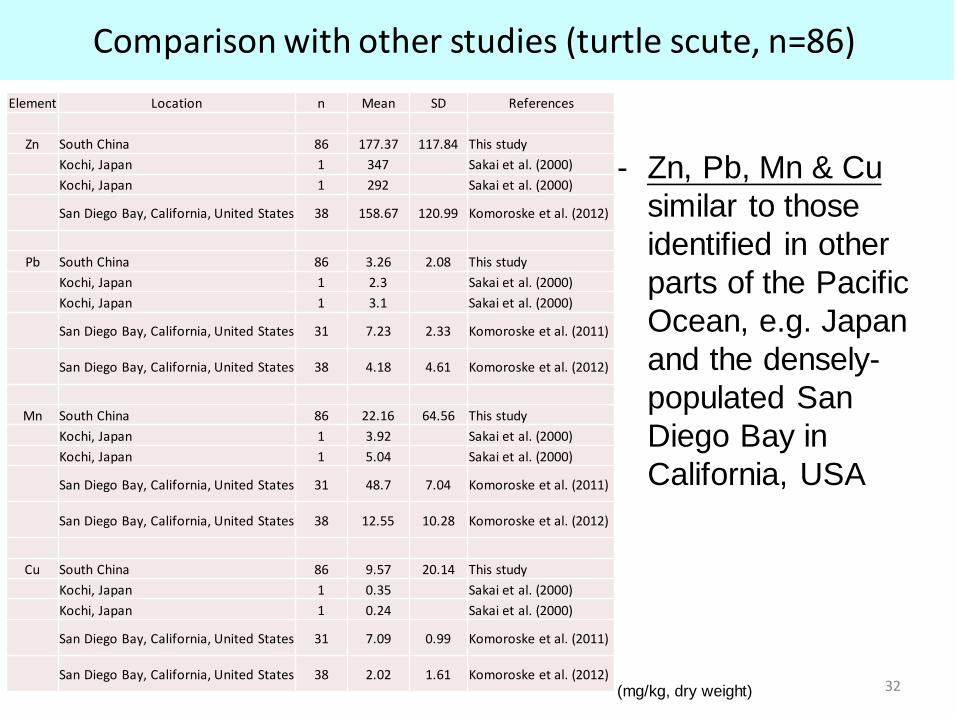
Comparison with other studies (turtle scute, n=86)
- Zn, Pb, Mn & Cu
similar to those
identified in other
parts of the Pacific
Ocean, e.g. Japan
and the densely-
populated San
Diego Bay in
California, USA
(mg/kg, dry weight)
Element Location n Mean SD References
Zn South China 86 177.37 117.84 This study
Kochi, Japan 1 347 Sakai et al. (2000)
Kochi, Japan 1 292 Sakai et al. (2000)
San Diego Bay, California, United States 38 158.67 120.99 Komoroske et al. (2012)
Pb South China 86 3.26 2.08 This study
Kochi, Japan 1 2.3 Sakai et al. (2000)
Kochi, Japan 1 3.1 Sakai et al. (2000)
San Diego Bay, California, United States 31 7.23 2.33 Komoroske et al. (2011)
San Diego Bay, California, United States 38 4.18 4.61 Komoroske et al. (2012)
Mn South China 86 22.16 64.56 This study
Kochi, Japan 1 3.92 Sakai et al. (2000)
Kochi, Japan 1 5.04 Sakai et al. (2000)
San Diego Bay, California, United States 31 48.7 7.04 Komoroske et al. (2011)
San Diego Bay, California, United States 38 12.55 10.28 Komoroske et al. (2012)
Cu South China 86 9.57 20.14 This study
Kochi, Japan 1 0.35 Sakai et al. (2000)
Kochi, Japan 1 0.24 Sakai et al. (2000)
San Diego Bay, California, United States 31 7.09 0.99 Komoroske et al. (2011)
San Diego Bay, California, United States 38 2.02 1.61 Komoroske et al. (2012)
33
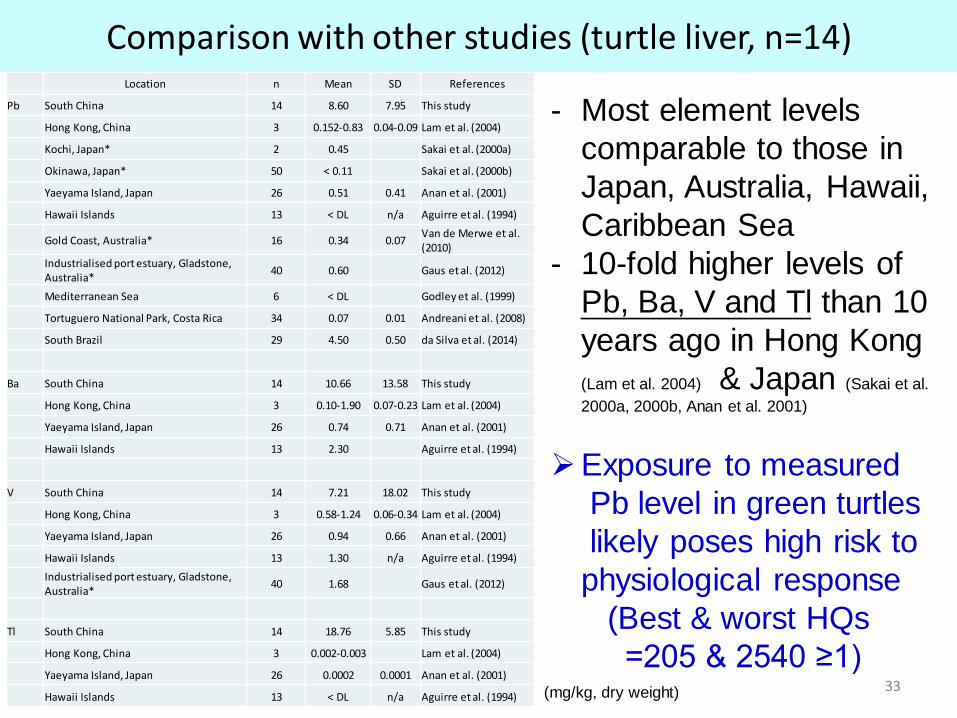
Comparison with other studies (turtle liver, n=14)
- Most element levels
comparable to those in
Japan, Australia, Hawaii,
Caribbean Sea
- 10-fold higher levels of
Pb, Ba, V and Tl than 10
years ago in Hong Kong
(Lam et al. 2004) & Japan (Sakai et al.
2000a, 2000b, Anan et al. 2001)
Exposure to measured
Pb level in green turtles
likely poses high risk to
physiological response
(Best & worst HQs
=205 & 2540 ≥1)
(mg/kg, dry weight)
Location n Mean SD References
Pb South China 14 8.60 7.95 This study
Hong Kong, China 3 0.152-0.83 0.04-0.09 Lam et al. (2004)
Kochi, Japan* 2 0.45 Sakai et al. (2000a)
Okinawa, Japan* 50 < 0.11 Sakai et al. (2000b)
Yaeyama Island, Japan 26 0.51 0.41 Anan et al. (2001)
Hawaii Islands 13 < DL n/a Aguirre et al. (1994)
Gold Coast, Australia* 16 0.34 0.07 Van de Merwe et al. (2010)
Industrialised port estuary, Gladstone, Australia*
40 0.60 Gaus et al. (2012)
Mediterranean Sea 6 < DL Godley et al. (1999)
Tortuguero National Park, Costa Rica 34 0.07 0.01 Andreani et al. (2008)
South Brazil 29 4.50 0.50 da Silva et al. (2014)
Ba South China 14 10.66 13.58 This study
Hong Kong, China 3 0.10-1.90 0.07-0.23 Lam et al. (2004)
Yaeyama Island, Japan 26 0.74 0.71 Anan et al. (2001)
Hawaii Islands 13 2.30 Aguirre et al. (1994)
V South China 14 7.21 18.02 This study
Hong Kong, China 3 0.58-1.24 0.06-0.34 Lam et al. (2004)
Yaeyama Island, Japan 26 0.94 0.66 Anan et al. (2001)
Hawaii Islands 13 1.30 n/a Aguirre et al. (1994)
Industrialised port estuary, Gladstone, Australia*
40 1.68 Gaus et al. (2012)
Tl South China 14 18.76 5.85 This study
Hong Kong, China 3 0.002-0.003 Lam et al. (2004)
Yaeyama Island, Japan 26 0.0002 0.0001 Anan et al. (2001)
Hawaii Islands 13 < DL n/a Aguirre et al. (1994)
34
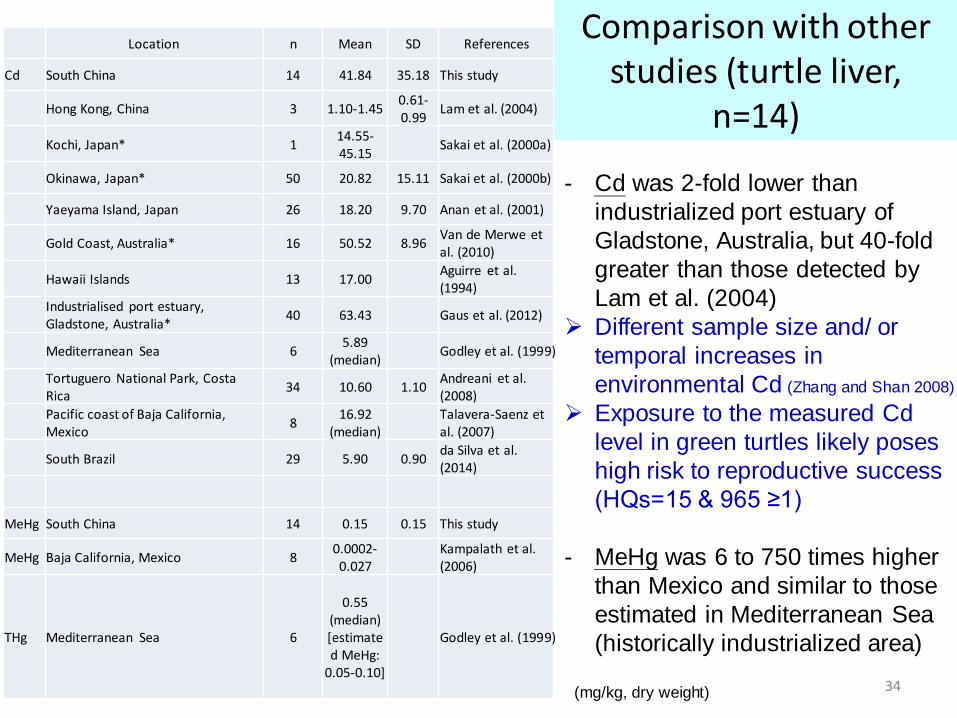
- Cd was 2-fold lower than
industrialized port estuary of
Gladstone, Australia, but 40-fold
greater than those detected by
Lam et al. (2004)
Different sample size and/ or
temporal increases in
environmental Cd (Zhang and Shan 2008)
Exposure to the measured Cd
level in green turtles likely poses
high risk to reproductive success
(HQs=15 & 965 ≥1)
- MeHg was 6 to 750 times higher
than Mexico and similar to those
estimated in Mediterranean Sea
(historically industrialized area)
(mg/kg, dry weight)
Location n Mean SD References
Cd South China 14 41.84 35.18 This study
Hong Kong, China 3 1.10-1.45 0.61-0.99
Lam et al. (2004)
Kochi, Japan* 1 14.55-45.15
Sakai et al. (2000a)
Okinawa, Japan* 50 20.82 15.11 Sakai et al. (2000b)
Yaeyama Island, Japan 26 18.20 9.70 Anan et al. (2001)
Gold Coast, Australia* 16 50.52 8.96 Van de Merwe et al. (2010)
Hawaii Islands 13 17.00 Aguirre et al. (1994)
Industrialised port estuary, Gladstone, Australia*
40 63.43 Gaus et al. (2012)
Mediterranean Sea 6 5.89
(median) Godley et al. (1999)
Tortuguero National Park, Costa Rica
34 10.60 1.10 Andreani et al. (2008)
Pacific coast of Baja California, Mexico
8 16.92
(median) Talavera-Saenz et al. (2007)
South Brazil 29 5.90 0.90 da Silva et al. (2014)
MeHg South China 14 0.15 0.15 This study
MeHg Baja California, Mexico 8 0.0002-0.027
Kampalath et al. (2006)
THg Mediterranean Sea 6
0.55 (median) [estimated MeHg:
0.05-0.10]
Godley et al. (1999)
Comparison with other studies (turtle liver,
n=14)
35
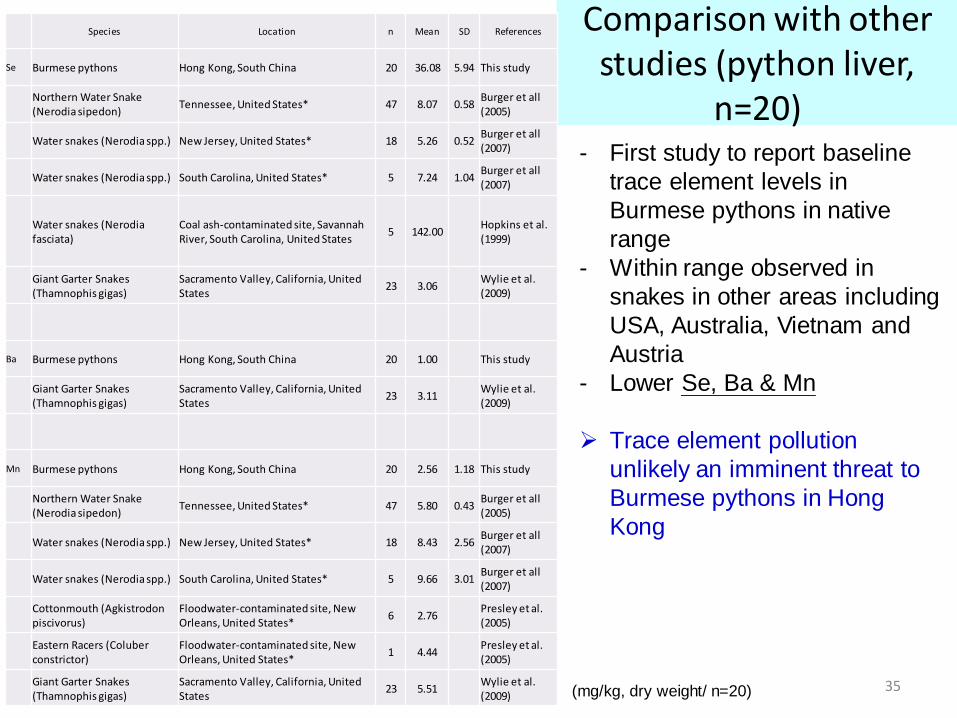
Comparison with other studies (python liver,
n=20) - First study to report baseline
trace element levels in
Burmese pythons in native
range
- Within range observed in
snakes in other areas including
USA, Australia, Vietnam and
Austria
- Lower Se, Ba & Mn
Trace element pollution
unlikely an imminent threat to
Burmese pythons in Hong
Kong
(mg/kg, dry weight/ n=20)
Species Location n Mean SD References
Se Burmese pythons Hong Kong, South China 20 36.08 5.94 This study
Northern Water Snake (Nerodia sipedon)
Tennessee, United States* 47 8.07 0.58 Burger et all (2005)
Water snakes (Nerodia spp.) New Jersey, United States* 18 5.26 0.52 Burger et all (2007)
Water snakes (Nerodia spp.) South Carolina, United States* 5 7.24 1.04 Burger et all (2007)
Water snakes (Nerodia fasciata)
Coal ash-contaminated site, Savannah River, South Carolina, United States
5 142.00 Hopkins et al. (1999)
Giant Garter Snakes (Thamnophis gigas)
Sacramento Valley, California, United States
23 3.06 Wylie et al. (2009)
Ba Burmese pythons Hong Kong, South China 20 1.00 This study
Giant Garter Snakes (Thamnophis gigas)
Sacramento Valley, California, United States
23 3.11 Wylie et al. (2009)
Mn Burmese pythons Hong Kong, South China 20 2.56 1.18 This study
Northern Water Snake (Nerodia sipedon)
Tennessee, United States* 47 5.80 0.43 Burger et all (2005)
Water snakes (Nerodia spp.) New Jersey, United States* 18 8.43 2.56 Burger et all (2007)
Water snakes (Nerodia spp.) South Carolina, United States* 5 9.66 3.01 Burger et all (2007)
Cottonmouth (Agkistrodon piscivorus)
Floodwater-contaminated site, New Orleans, United States*
6 2.76 Presley et al. (2005)
Eastern Racers (Coluber constrictor)
Floodwater-contaminated site, New Orleans, United States*
1 4.44 Presley et al. (2005)
Giant Garter Snakes (Thamnophis gigas)
Sacramento Valley, California, United States
23 5.51 Wylie et al. (2009)
(ng/g, wet weight) (ng/g, lipid weight)
Location Tissue N Mean SD Mean SD References
South China Liver 13 4.99 5.94 95.69 75.30 This study
Muscle 11 2.44 3.87 159.16 109.41
Gold Coast, Australia Liver 16 0.12 n/a n/a n/a Van de Merwe et al. (2010)
Muscle 16 0.07 n/a n/a n/a
Queensland, Australia Liver 1 n/a n/a 1.60 n/a Hermanussen et al. (2008)
Muscle 1 n/a n/a 6.30 n/a
Ishigaki Island and Kochi, Japan Liver 5 n/a n/a 1.60 n/a Malarvannan et al. (2011)
36
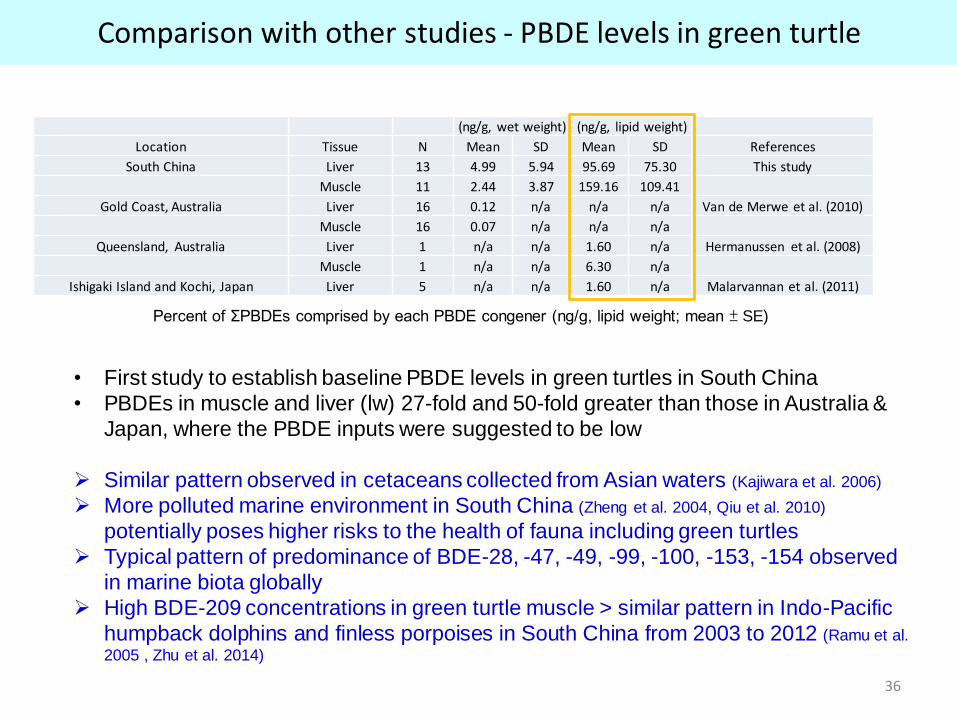
Comparison with other studies - PBDE levels in green turtle
• First study to establish baseline PBDE levels in green turtles in South China
• PBDEs in muscle and liver (lw) 27-fold and 50-fold greater than those in Australia &
Japan, where the PBDE inputs were suggested to be low
Similar pattern observed in cetaceans collected from Asian waters (Kajiwara et al. 2006)
More polluted marine environment in South China (Zheng et al. 2004, Qiu et al. 2010)
potentially poses higher risks to the health of fauna including green turtles
Typical pattern of predominance of BDE-28, -47, -49, -99, -100, -153, -154 observed
in marine biota globally
High BDE-209 concentrations in green turtle muscle > similar pattern in Indo-Pacific
humpback dolphins and finless porpoises in South China from 2003 to 2012 (Ramu et al.
2005 , Zhu et al. 2014)
Percent of ΣPBDEs comprised by each PBDE congener (ng/g, lipid weight; mean ± SE)
37
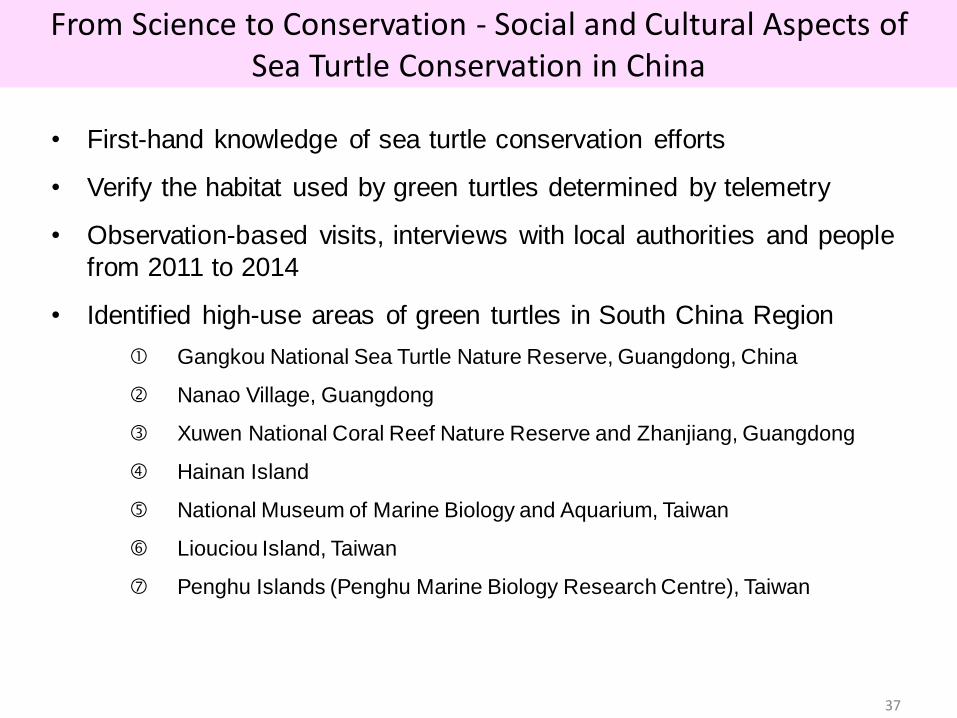
From Science to Conservation - Social and Cultural Aspects of Sea Turtle Conservation in China
• First-hand knowledge of sea turtle conservation efforts
• Verify the habitat used by green turtles determined by telemetry
• Observation-based visits, interviews with local authorities and people
from 2011 to 2014
• Identified high-use areas of green turtles in South China Region
Gangkou National Sea Turtle Nature Reserve, Guangdong, China
Nanao Village, Guangdong
Xuwen National Coral Reef Nature Reserve and Zhanjiang, Guangdong
Hainan Island
National Museum of Marine Biology and Aquarium, Taiwan
Liouciou Island, Taiwan
Penghu Islands (Penghu Marine Biology Research Centre), Taiwan
38
39
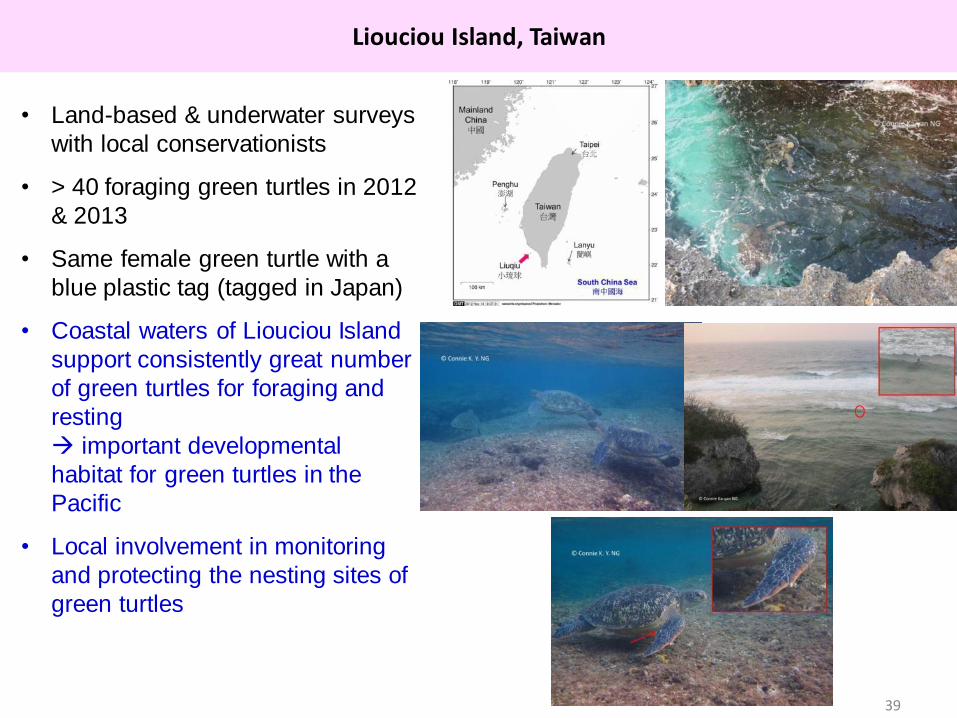
Liouciou Island, Taiwan
• Land-based & underwater surveys
with local conservationists
• > 40 foraging green turtles in 2012
& 2013
• Same female green turtle with a
blue plastic tag (tagged in Japan)
• Coastal waters of Liouciou Island
support consistently great number
of green turtles for foraging and
resting
important developmental
habitat for green turtles in the
Pacific
• Local involvement in monitoring
and protecting the nesting sites of
green turtles
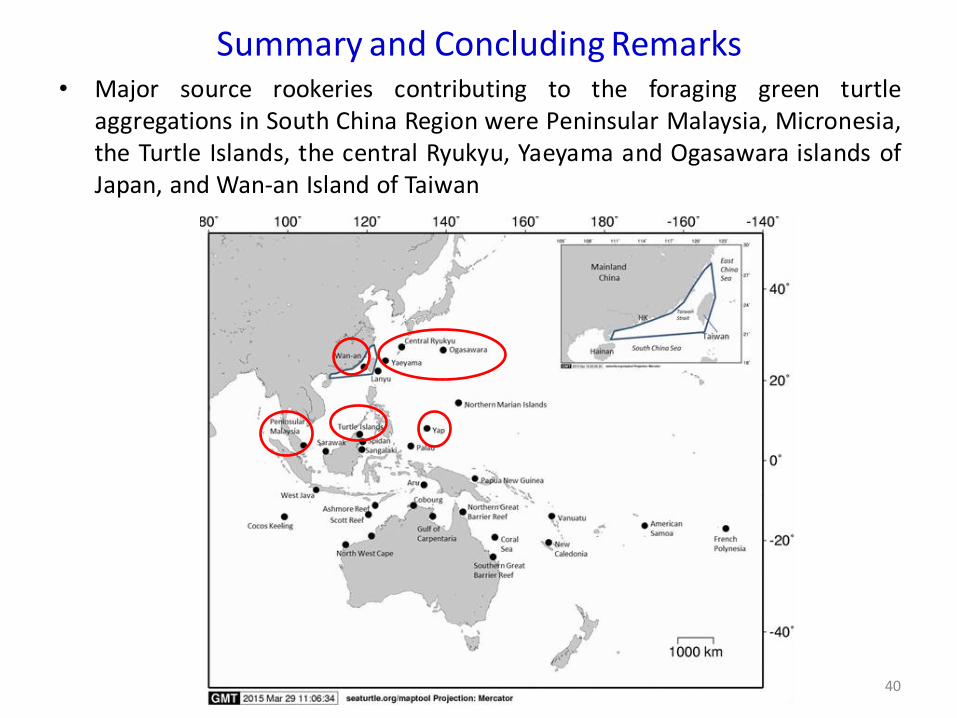
Summary and Concluding Remarks • Major source rookeries contributing to the foraging green turtle
aggregations in South China Region were Peninsular Malaysia, Micronesia, the Turtle Islands, the central Ryukyu, Yaeyama and Ogasawara islands of Japan, and Wan-an Island of Taiwan
40
Summary and Concluding Remarks
• Activity hotspots and migratory corridors of green turtles
• Coastal waters near Wanning City of Hainan Island, eastern Leizhou Peninsula, the Ryukyu Islands of Japan and Dao Bach Long Vi of Vietnam as foraging grounds for nesting green turtles from several origins
• Paracel (Xisha) and Pratas (Dongsha) Islands, Gangkou and its vicinity, Liouciou Island and the Penghu Islands of Taiwan contain both nesting sites and foraging grounds of green turtles
• Hainan Island, eastern Leizhou Peninsula and Liouciou Island currently lack conservation plans and warrant higher priority for habitat and species protection, e.g. MPAs
• Potential high risks to green turtles in South China and their source rookeries due to high pollutant levels (i.e. Pb, Ba, V, Tl, Cd & PBDEs)
41
Recommendations - Pathways to Conservation linking Local Traditions, Culture and Science
• Establish and reinforce networks among scientists, managers and local community in China and with other areas of ecological connectivity
• Seek financial & technical support and personnel (e.g. international NGO, government, corporate) to sustain long-term efforts
• Utilize diverse means of communication among stakeholders, e.g. social media, online newsletters in Chinese, symposium, workshop
• Expand monitoring of potential & existing nesting sites, tracking and genetic studies on nesting green turtles and additional rookeries, pollutant levels, captive breeding, threat quantification & mitigation in activity hotspots
• Implement conservation measures compatible with local cultural practices and religion, e.g. religious release on scientific basis
• Integrate local knowledge and direct involvement with proper training & financial incentives, e.g. nesting site monitoring, tourism, compensation for by-catch
42
43
Acknowledgements
Dr. Margaret MURPHY Prof. Paul LAM Dr. Paul SHIN Dr. James LAM
George BALAZS Dr. Peter DUTTON Xiao-Hua ZHANG
State Key Laboratory of Marine Pollution Prof. Wen-Xiong WANG and his research team, HKUST
Gangkou National Sea Turtle Nature Reserve NMMBA, Taiwan
Penghu Marine Biology Research Centre, Taiwan Agriculture, Fisheries & Conservation Dept, HK
CITES authority Shantou University
Xuwen National Coral Reef Nature Reserve
44
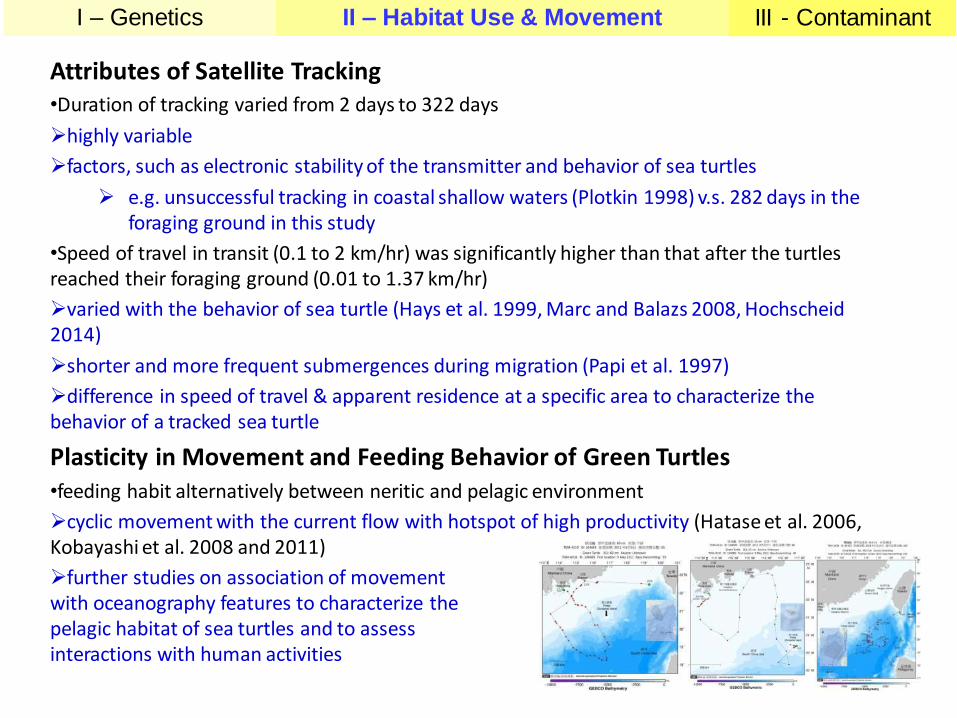
Attributes of Satellite Tracking •Duration of tracking varied from 2 days to 322 days
highly variable
factors, such as electronic stability of the transmitter and behavior of sea turtles
e.g. unsuccessful tracking in coastal shallow waters (Plotkin 1998) v.s. 282 days in the foraging ground in this study
•Speed of travel in transit (0.1 to 2 km/hr) was significantly higher than that after the turtles reached their foraging ground (0.01 to 1.37 km/hr)
varied with the behavior of sea turtle (Hays et al. 1999, Marc and Balazs 2008, Hochscheid 2014)
shorter and more frequent submergences during migration (Papi et al. 1997)
difference in speed of travel & apparent residence at a specific area to characterize the behavior of a tracked sea turtle
Plasticity in Movement and Feeding Behavior of Green Turtles •feeding habit alternatively between neritic and pelagic environment
cyclic movement with the current flow with hotspot of high productivity (Hatase et al. 2006, Kobayashi et al. 2008 and 2011)
further studies on association of movement with oceanography features to characterize the pelagic habitat of sea turtles and to assess interactions with human activities
I – Genetics II – Habitat Use & Movement III - Contaminant
45
Type of case
X Y SCL CCL SCW CCW
1951 5 8 stranding Cheung Chau 821319 808053 DC A UNK ----- ----- ----- ----- -- A -- -- -- --
1954 7 1 stranding Tai Tam Bay 841473 809276 UNK UNK UNK ----- ----- ----- ----- -- D -- -- -- --
1964 12 8 live sighting Lei Yue Mun, Eastern Victoria Habour 842729 816099 DC A UNK ----- ----- ----- ----- -- A -- -- -- --
1972 8 1 live sighting Tai Tam Bay 841473 809276 CM H UNK ----- ----- ----- ----- -- A -- -- -- --
1973 6 1 stranding North Stonecutters Islands 832212 821072 LO UNK UNK ----- ----- ----- ----- -- D -- -- -- UNK
1978 3 20stranding
(floating)Tolo Channel 849065 837013 CM UNK UNK ----- ----- ----- ----- -- D -- -- -- Floating
1978 4 13 live sighting Shau Kei Wan 841764 816469 LO UNK UNK ----- ----- ----- ----- -- A -- -- -- --
1985 4 27 stranding Ham Tin, Sai Kung 856703 830052 UNK A UNK ----- ----- ----- ----- -- D -- -- -- UNK
1988 5 28 stranding Sai Wan, Sai Kung 856172 828823 DC UNK UNK ----- ----- ----- ----- -- D -- -- -- UNK
1989 6 5 stranding Sai Wan, Sai Kung 856172 828823 CM? A UNK ----- ----- ----- ----- -- D -- -- -- UNK
1989 8 29 stranding Pak Sha Chau (Round Island) 851949 844719 CM UNK UNK ----- ----- ----- ----- -- D -- -- -- UNK
1991 1 14 stranding Tap Mun Chau 854839 836971 CM A UNK ----- ----- ----- ----- -- D -- -- -- UNK
1994 8 27 stranding Tung Lung Chau 847579 811364 DC A UNK ----- ----- ----- ----- -- D -- -- -- UNK
1996 4 5stranding
(floating)Clearwater Bay 848578 816092 UNK A UNK ----- ----- ----- ----- -- D -- -- -- Floating
1996 8 7 stranding Repulse Bay 838254 810864 LO UNK UNK ----- ----- ----- ----- -- D -- -- -- UNK
1996 11 23 stranding Shek Pik, Tai Long Wan, Lantau 806278 809175 LO UNK UNK ----- ----- ----- ----- -- D -- -- -- UNK
1996 12 15 stranding Little Palm Beach, Sai Kung 847706 820107 CM UNK UNK ----- ----- ----- ----- -- D -- -- -- UNK
1997 5 1 stranding Powerstation Beach, Lamma 829957 809061 UNK J UNK ----- ----- ----- ----- -- A -- -- N UNK
1997 8 1 stranding Sheung Sze Wan, Clearwater Bay 847989 818692 UNK J UNK ----- ----- ----- ----- -- A -- -- N UNK
1997 8 16stranding
(floating)
Channel between Town Island & High
Island855121 822016 CM A UNK ----- ----- ----- ----- -- D -- -- N Floating
1997 10 2 stranding Ham Tin, Sai Kung 856703 830052 CM A UNK ----- ----- ----- ----- -- D -- -- N UNK
1999 3 14 stranding Sai Wan, Sai Kung 856172 828823 CM SA UNK 68.00 ----- 55.00 ----- -- D --wounds found on
the plastronN Boat Impact
1999 3 19 live sighting Cape d'Aquilar 844793 807701 CM UNK UNK ----- ----- ----- ----- -- A -- -- N --
1999 6 2 stranding Shek O, Hong Kong 843921 810030 CM J UNK 52.00 ----- 37.00 ----- -- D -- -- N UNK
1999 8 20 live sighting Tung O, Lamma Island 832532 806361 CM A UNK ----- ----- ----- ----- -- A -- -- N --
1999 12 16 stranding Ham Tin, Sai Kung 856703 830052 CM A UNK 94.00 ----- 73.00 ----- -- D -- -- N UNK
2000 8 22 stranding Fung Wong Wat, Tolo Channel 849858 838794 CM A UNK 78.00 103.00 66.00 76.00 -- D -- -- N UNK
2002 1 20 stranding Ham Tin, Sai Kung 856703 830052 UNK UNK UNK ----- ----- ----- ----- -- D -- -- N UNK
2002 1 24 stranding Castle Peak Bay Typhoon Shelter 815353 826317 CM J UNK 26.00 ----- 22.00 ----- -- D -- -- N UNK
2002 1 30stranding
(floating)Shing Mun River 840490 829778 UNK UNK UNK ----- ----- ----- ----- -- D -- wounded N Floating
2002 8 1 stranding Ham Tin, Sai Kung 856703 830052 UNK UNK UNK -- D -- -- N UNK
2002 9 2 stranding Tai Po N/A N/A CM J UNK ----- ----- ----- ----- -- D-EU -- -- N UNK
2002 9 16 live sighting Hok Tsui Marine Reserve 844573 807509 UNK UNK UNK ----- ----- ----- ----- -- A -- -- N --
2002 summerlive sighting &
rescueHam Tin, Sai Kung 856938 829820 EI J UNK ----- ----- ----- ----- -- A N -- N Net entanglement
2003 4 5 stranding Ham Tin, Sai Kung 856703 830052 CC A F ----- ----- ----- ----- -- D N -- N UNK
2003 5 5 stranding Tai Wan Tau, Clear Water Bay 848374 816848 CM A UNK 84.00 90.00 64.00 88.00 -- D N -- N UNK
2003 6 5 stranding Ham Tin, Sai Kung 856703 830052 CM A F 100.00 103.00 73.00 92.00 -- D N -- N UNK
2003 7 4 stranding Nam Kwo Chau 854212 813176 CC A UNK 72.00 66.00 -- D N -- N UNK
2003 11 23 stranding Sai Wan, Sai Kung 856172 828823 CM J UNK 46.00 64.00 -- D N
1/3 of the torso
including hind limbs
and tail were missing
N shark attack
2004 4 26 stranding Island House, Tai Po 836343 834199 EI J UNK 40.00 42.00 32.50 36.00 5.6 D N -- N UNK
2004 5 12 stranding Tai Wan Tau, Clear Water Bay 848374 816848 CM A UNK 93.00 196.00 73.00 185.00 -- D N -- N UNK
2004 8 16 stranding Shau Kei Wan Typhoon Shelter 841653 816160 CC A UNK -- D N -- N UNK
2004 8 29 stranding Turtle Cove Beach, Tai Tam 841089 810483 CM A M 94.00 197.00 78.00 88.00 -- D N -- N UNK
2004 9 12 live sighting Mat Chau, Po Toi Island 843825 802536 UNK SA UNK 50.00 -- A N -- N --
2004 10 10 live sighting Sai Kung Tsim Chau 857828 829106 CM A UNK 100.00 -- A N -- N --
Month Day
Sex
Size (cm)
External wound
Suspected
religious
release (Y/N)
Casue of death /
injury / strandingWeight (kg) Condition
External
marking
Date
Location
Sighting Location
(coordinates in HK1980 Grid)Species Age
Carapace length Carapace width
Year
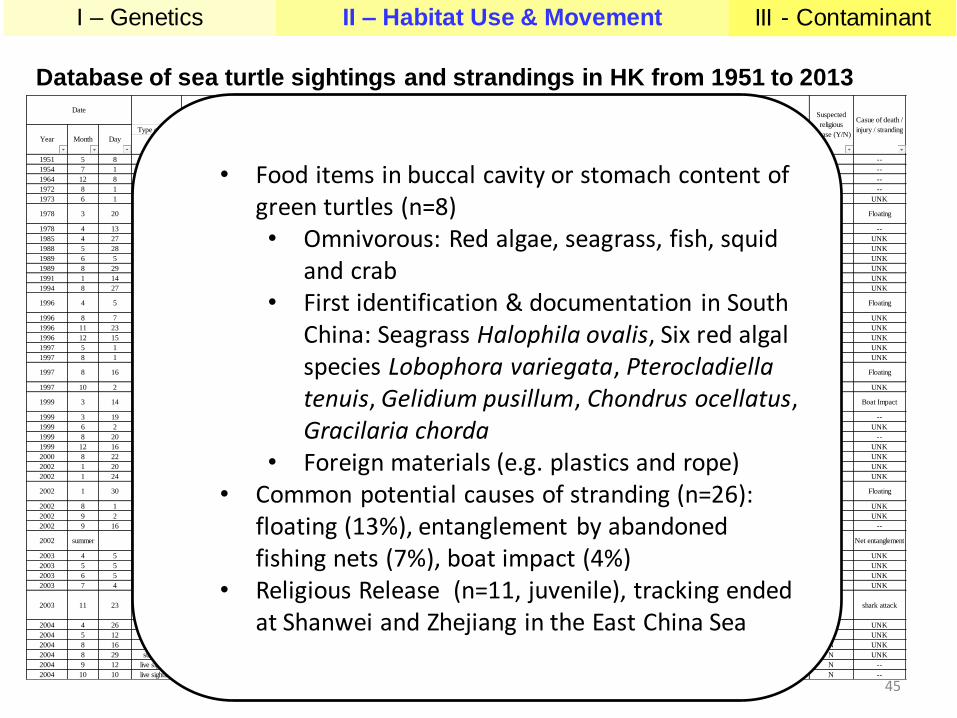
Database of sea turtle sightings and strandings in HK from 1951 to 2013
• Food items in buccal cavity or stomach content of green turtles (n=8) • Omnivorous: Red algae, seagrass, fish, squid
and crab • First identification & documentation in South
China: Seagrass Halophila ovalis, Six red algal species Lobophora variegata, Pterocladiella tenuis, Gelidium pusillum, Chondrus ocellatus, Gracilaria chorda
• Foreign materials (e.g. plastics and rope) • Common potential causes of stranding (n=26):
floating (13%), entanglement by abandoned fishing nets (7%), boat impact (4%)
• Religious Release (n=11, juvenile), tracking ended at Shanwei and Zhejiang in the East China Sea
I – Genetics II – Habitat Use & Movement III - Contaminant