Embed Size (px)
Citation preview
September 2002
Conservationof the African Lion :Contribution to a Status Survey
Conservationof the African Lion :Contribution to a Status Survey
CONSERVATION FORCE

Citation : Chardonnet, Ph. (ed.), 2002. Conservation of the African Lion :Contribution to a Status Survey. International Foundation for theConservation of Wildlife, France & Conservation Force, USA.
Front cover picture : From an original drawing by Roger Reboussin
Back cover picture : Adult male lion paw
Available from : International Foundation for the Conservation of Wildlife15, rue de Téhéran75008 Paris - France
This survey and publication were made possible through a generous grant from Mr. Steven CHANCELLOR, with the support of Conservation Force and the InternationalFoundation for the Conservation of Wildlife
Copyright : © 2002 International Foundation for the Conservation of Wildlife
CONSERVATION FORCE

1
"From the standpoint of conservation and possible management of the lion no topic
has more relevance than population dynamics, yet it was an aspect of the study for
which it was difficult to obtain unbiased quantitative information. To estimate
accurately the size of the lion population in 25,500 sq. km is a project in itself. Three
years of work was clearly not long enough to elucidate such topics as birth patterns
and mortality rates, much less to find out general trends in the population. Some of
the conclusions in this chapter are therefore tentative rather than final."
George Schaller, 1972. The Serengeti Lion.

2
CONTENTS
Pages
ACKNOWLEDGEMENTS 3
ACRONYMS 4
COMMON NAMES OF LION 5
CHAPTER I - INTRODUCTION
1. Purpose 9
2. Methodology 10
3. Limitations 19
4. Prospects 21
CHAPTER II - POPULATION SURVEY
1. Continental overview 23
2. Western Africa 36
3. Central Africa 48
4. Eastern Africa 60
5. Southern Africa 80
CHAPTER III - DRIVING FORCES
1. Cohabitation of man and lion 103
2. Lion as a resource 116
3. Lion conservation policies 142
4. Challenges 147
BIBLIOGRAPHY

3
ACKNOWLEDGEMENTS
Must be thanked the persons whose names follow, who have either contributed to this survey,
by helping to gather and providing data, by activating their field networks, by offering their
experience and by enriching the bibliography, or those who have helped review the
manuscript.
Rolf Baldus, Dave Balfour, Eulalie Bashige, Yvonne Bastin, Faustin Bateshi Murotsi, Jean-
Pierre Bernon, Sylvie Bernon, Vernon Booth, Hubert Boulet, Mathieu Bourgarel, Hiver
Boussini, David Brugière, Olivier Buttin, F. Buyeye, Stefan Buys, John Caldwell, Jean
Capiod, Alex Caron, James Cavenagh, Solange Chaffard-Sylla, Karen Chapman, Bertrand
Chardonnet, Philippe Chardonnet, Marco Ciambelli, Sarah Clegg, Bertrand des Clers, Serge
Cogels, Craig Coid, Marianne Courouble, Ian Craig, David Cumming, Serge Darroze, Jock
Dawson, Yilma Dellelegn Abebe, Yirmed Demeke, Seydou Diarrassouba, Gustave
Doungoube, Daniel Ewur, Tony Ferrar, Hervé Fritz, F. Funston, Paul Funston, Raynald Gilon,
Abaka Haizel, Jonathan Harwood, Brian Heath, Kes Hillman-Smith, Francis Hurst, Yaro
Iniyé, Albert Iokem, John Jackson, Richard Jeffery, Pierre Jonquères, Gerrie Kamasho,
Dennis King, Pierre Koffi Kouamé, André Djaha Koffi, Djaha Kouamé, Johan Kruger,
François Lamarque, Richard Lamprey, Francis Lauginie, Sébastien Lebel, José Lobao Tello,
Andy Loveridge, Sami Mankoto Ma Mbaelele, N. Masulani, G. Matipano, Thomas
Mattanovich, Geoffroy Mauvais, Ataila Mbayma, Djadou Moksia, Norman Monks, Helena
Motta, Jean Ngog Nje, Fanny N'Golo, Nkulu Kalala, Jacques Nyambre, George Pangeti, Jean-
Michel Pavy, Alfredo Pelizzoli, Alain Pénelon, Hubert Planton, Alistair Pole, Jeremy Pope,
Gianetta Purchase, Adrian Radcliffe, Mick Reilly, Hubert Ressaire, Kirsten Roettcher, Didier
Roques Rogery, Pascal Rouamba, Pierre-Armand Roulet, Serge Roux, J. Rudge, Ludwig
Seige, Angus Shulto-Douglas, Rob Slotow, Martin Seth-Smith, Malte Sommerlatte, Phillip
Stander, Russel Taylor, Jean Thal, Marcel Tiran, Jérôme Tubiana, Gus Van Dyk, Suzanne van
Hoven, Wouter van Hoven, Wolf Ekkehard Waitkuwait, Stuart Williams, Christiaan
Winterbach, Florent Zowoy.
Odile Caillot and Andrée Lambert have to be acknowledged for their patience and skill to put
together the text, references, tables, maps and pictures.
The contribution of each person does not imply their endorsement of the entire document as it
is published.

4
ACRONYMS
ALWG African Lion Working Group (IUCN/SSC/Cat Specialist Group)
BTB Bovine Tuberculosis
CAR Central African Republic
CDV Canine Distemper Virus
CITES Convention on International Trade in Endangered Species of Wild Fauna
& Flora (Washington Convention)
CF Conservation Force
CPUE Catch-per-unit-effort
CSG Cat Specialist Group (IUCN/SSC)
CU Conservation Unit
DC Domaine de chasse
DRC Democratic Republic of Congo
HA Hunting Area
FcaV Feline Calici Virus
FeHV Feline Herpes Virus
FeLV Feline Leukaemia Virus
FIP Feline Infectious Peritonitis and Pleuritis
FIV Feline Immunodeficiency Virus
FL Forest Land
FPV Feline Panleukopenia Virus
GASP Global Animal Survival Plan
GCA Game Controlled Area, Game Conservation Area
GMA Game Management Area
GR Game Reserve
IGF International Foundation for the Conservation of Wildlife
IR Integral Reserve
IUCN The World Conservation Union
MAB Man and the Biosphere Program (UNESCO)
NGA Non Gazetted Area
PAC Problem Animal Control
PHVA Population and Habitat Viability Assessment
PR Partial Reserve
RP Réserve partielle
SA Safari Area
SSA Sub-Saharan Africa
SSC Species Survival Commission (IUCN)
SSP Species Survival Plan
TB Tuberculosis
UNDP United Nations Development Programme
UNEP United Nations Environment Programme
UNESCO United Nations Educational, Scientific and Cultural Organization
WCMC World Conservation Monitoring Centre
WMA Wildlife Management Area
WUA Wildlife Utilisation Area
WWF World Wildlife Fund
ZIC Zone d'Intérêt Cynégétique

5
COMMON NAMES OF LION
Panthera leo (Linnaeus, 1758)
REGION LANGUAGE NAME OF LION
English Lion
French Lion
German Löwe
Italian Leone
Portuguese Leao
Europe
Spanish Leon
Adja Kinikini
Adrar, Ioullimmïden, Isekkemaren Aouekkas, ioukkâsen (pl.), toauekkast (fem. sing.), tiouekkasîn (fem. pl.)
Ahaggar/Rhät Ahar, iharren (pl.), tahart (fem. sing.),
tihârrîn (fem. pl.)
Aïr Amekloul, imeklat (pl.), ahar, aouekkas
Bambara Ouraba, diara
Baoulé Guara
Bariba Gbéroussounon
Bassari Irane
Bobofing Wuru, zora
Bouzou (Filingué) Ahar, wan'tagorass
Dindi Gounou, moussou-béri
Dioula Dyra, jaralin
Djerma Moussou béri
Fon Kinikini, djanta
Fulfulde (Peuhl) Biladdè, Rawandu ladde, mbarooga
Gurma Yambol
Gouro Guizra
Hausa Zaki
Ibo, Yoruba Odun
Kassena (Po) Nyongo
Kissi Yarra
Koniagui Ivissin
Koulango Diara
Lobi Siduhu
Malinké Nian-fin, diara
Mandinka Diarinté, diato
Manga N'gam, n'garin
Maure Sebah
Mooré (Mossi) Guigemde, bongnega, ouèougo-naba
Nagot Kinihoun
Ngbandi-Yakoma Bamara
Ouolof Gaïndé, gaynde
Peul Foula Pio-oui, nga-iouri
Sarakolé Diarinté
Sénoufo Charao
Sérère N'diogoy
Somba Tchirli-tchirli
Sonraï Gandihaya
Soussou Yété
Tamachek (Touareg) Ahard, awakass
Western Africa
Toubou (Termit) Dogoule

6
Apindji, Eviya, Okandais, Awandji,
Mitsogo, Adouma
Nzégo
Arab Assad, dutou baach, baach/doud
Bafia Kimondo
Bakaningui, Batéké Ngô
Bakota Ngoyi, nzé
Baloumbou Ikoumbou
Bamiléké Nopkema
Bamoun Gbayi
Banda Bamara
Bandjabi Ndzèguè, vevi
Bapounou Maguène, ma-gena
Bassa Mbondo ndjeé
Bavoungou Maguène, ma-gena
Baya Dila
Duma I-ngungu, bingungu
Eschira Meguène
Ewondo, ntumu Embgem
Fang N'zé, zeh, benze
Fulfuldé Mbarooga, njagaawu
Gambaye Tobeuye
Goula Ndjendjé
Goulaye Toboi
Iwum, ruumbu Ng-kosi
Kinyarwanda Intare, ntaré
Lingala Ntambu
Masa Zlona
Mpongwe Layoni, amale, ndjègo
Masango Maguiène, m-bungu
Mbuno M-kwe, le-kaga
Ndambomo Ngoyi
Nzakara Ndoulou (maned lion),
Gbamakangaor Kinguilima (no mane)
Obamba Ngoô
Pidgin Lion
Pove, Simba, Nkomi, Galwa, Oroungou,
Tsogo
Ndjègo
Sango Bamara, dila
Saké N'zé, zeh
Sara Bohol, mbole, bole, basch, n'guessi
Shira Gi-bungu
Teke fumu N-kwe, ban-kwe, n-gombulu
Via, Kande Yé-mbogngo
Vouté Mbap, nir
Yakouma Mbatan
Central Africa
Zandé Ngbanguru, bahu
Afar Lubaaka, madu, molta (female)
Amharic Ambessa
Gikuyu N-do, no-rothi, merothi (pl.),
ngatia, mo-nyambo, me-nyambo
Luo Labwor
Maasai Olnyatuni
Oromo Leencha
Ruanda In-tare
Samburu Oiugatany
Somalia Aar, baranbarqo, libaax, gool,
Davar
Eastern Africa
Swahili Simba

7
Afrikaans Leeu
Chichewa Nkharam
Ju/hoan Bushman N!hai
Nama/Damara Xaami
Ndebele In-gwenyama, i-bhubezi
Shangaan Nghala, n'shumba
Shona Shumba (usual), mhondoro (spirit medium)
Swati Si-Iwane, ti-Iwane
Sotho, Lozi, Setswana Tau
Venda Ndau
Yei Undavu
Southern Africa
Zulu Ingonyama
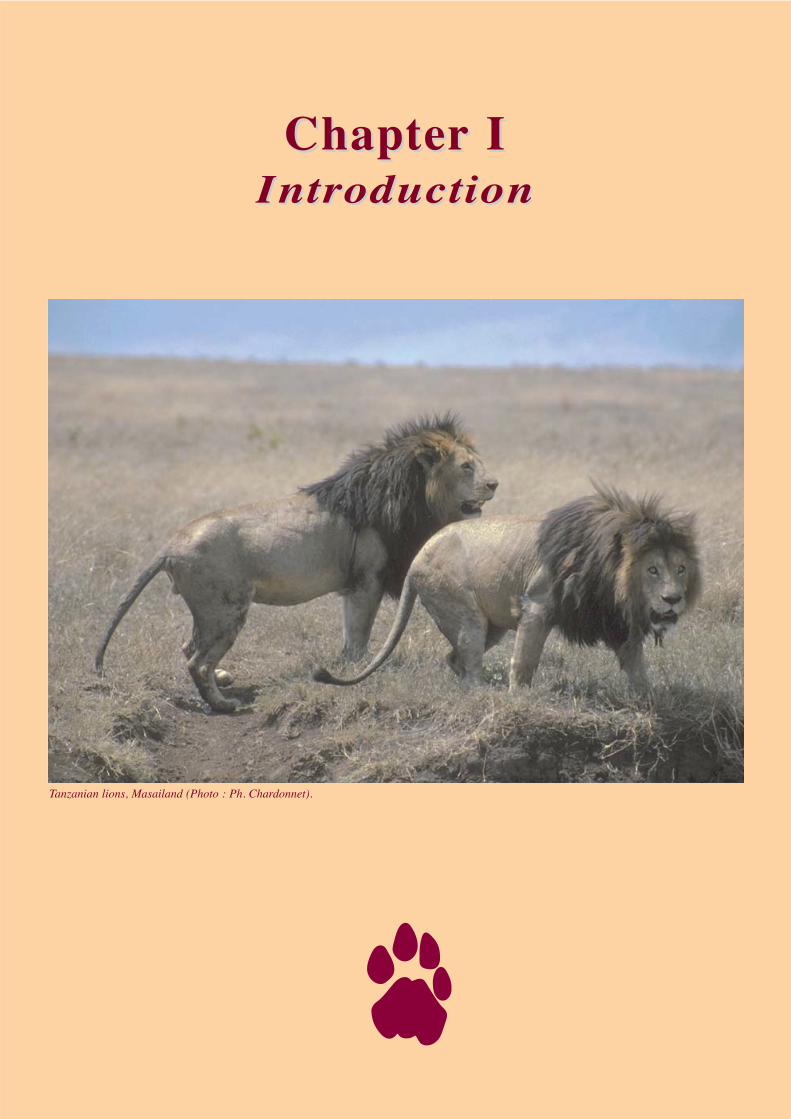
ChapterChapter IIIntroductionIntroduction
Tanzanian lions, Masailand (Photo : Ph. Chardonnet).
8
"The population of lions, like many other carnivores with the exception of the
Ethiopian wolf, is a rather mysterious affair in Ethiopia…."
Yilma Abebe & Thomas Mattanovich, 2002, pers. comm.

9
1. PURPOSE
The purpose of the survey is to provide interested parties with additional data on the
conservation status of the lion in Sub-Saharan Africa (SSA).
This survey is considered as a contribution to the issue, which is already addressed by a
number of scientists, managers and authorities, etc. The intention of the survey is to be much
more a "food for thought" than a conclusive statement. The survey is attempting, not to be
competitive with other surveys, but rather to be a source of complementary input. It is
hopefully expected that some new sources of information and some innovative approaches
will be provided and will help to improve the knowledge in this matter. A variety of views
should stimulate the discussion on this important topic and, hopefully, better progress will be
achieved by the entire conservation community.
It is understood that the present survey is limited to a general review of the global status of the
lion. Therefore, the survey should not be regarded as a planning exercise, i.e. the study does
not comprise any action plan or conservation strategy. The elaboration of a proper strategy for
the long-term conservation of the lion would require a slightly different exercise with another
methodology and involvement of appropriate authorities, etc. For this reason, no conservation
measures are proposed, nor ranked priorities suggested or management plans recommended.

10
2. METHODOLOGY
2.1. CONTRIBUTORS
The survey has been carried out by a team of experts under the auspices of the International
Foundation for the Conservation of Wildlife (IGF) since, given the magnitude of the scope, it
could not be the product of a single author. So far, more than 40 persons have been directly
involved to gather and analyse the data. In addition to the core group of direct authors, several
members of the team have activated and consulted their own networks of African contacts,
involving people with many years of field experience in wildlife conservation and
management.
2.2. TIME AND DELAY
The survey began at the end of February 2002 and the final report was completed by the end
of July. Within such a short period of time (5 months) it cannot be expected to provide an
exhaustive survey with an entirely complete set of details and systematic cross-checking of all
data. However, the output of the survey may hopefully be considered as a comprehensive
review of the current situation as possible within the limits set by the available and accessible
information.
2.3. SCOPE
• Geographical scope
The survey covers the entire continental Sub-Saharan Africa, i.e. a total of 42 countries,
excluding islands where the lion does not occur.
The report includes maps of the 4 African Regions (Western, Central, Eastern and Southern)
where sub-populations are delineated and defined by reference numbers corresponding to the
figures produced in tables included in the text.
• Thematic scope
The survey includes inter alia the definition of the different lion sub-populations, and as
much information as possible for each sub-population, including:
- The protection status and size of lion habitats;
- An estimate of lion population sizes, population densities and population trends;
- Lion habitat quality, main prey for lions (wildlife and/or livestock) and major constraints
to lion conservation, and;
- The use of lion resources (whether consumptive or non-consumptive), as well as
management and regulatory measures, problem animal control and poaching.
The trade in live lions and lion products has tentatively been analysed.
Relevant bibliographical references are given at the end of the report.

11
2.4. DEFINITIONS
• Regions
To remain consistent with the methodology used for the survey, the demarcation of the
regions is based on ecological criteria, not on political boundaries. As a matter of fact, a given
lion sub-population cannot be split in two simply because it is spread on both sides of a
political border. It is not only a matter of definition, but it also addresses conservation issues;
sub-populations should be considered as relevant entities for appropriate management
purposes. For example, the lion populations of Virunga National Park in DRC and Queen
Elisabeth National Park in Uganda should be considered as belonging to the same sub-
population; consequently, both should belong to the same biological region in terms of lion
conservation issues.
The definition of the regional demarcations could be discussed extensively, however some
decisions had to be taken based on the available information, for instance:
- The Southern limit of the Eastern Africa region could have been set on the Rufiji river for
biological reasons; nevertheless Mikumi National Park and both banks of Kilombero river
were preferred to be included in the Selous Ecosystem within the Southern Africa region,
and;
- A country such as the DRC has been split into 3 different "lion regions" (Central, Eastern
and Southern) since it appears that they form distinctly different lion areas, each of them
linked to those respective regions.
The definitions of the "lion regions" are given in Table 1.
It must be stressed that regional demarcations, which are convenient or appropriate for the
lion, may not be relevant for other taxa.
For obvious reasons, political criteria (boundaries etc.) must be kept when it comes to
addressing legal issues and to proposing the definition of lion Range States.

12
TABLE 1 - THE "LION REGIONS" USED FOR THE SURVEY
DemarcationsRegional
breakdown North South West East
Western Africa Sahara Coast Coast Niger river
estuary & Jos plateau
Central Africa Sahara Congo river lower
course &
extension North-
eastward
Niger river estuary
& Jos plateau
Nile river &
DRC rain
forest
Eastern Africa Sahara Lake Malawi &
Northern limit of Selous ecosystem
Nile river, DRC
rain forest & Lake Tanganyika
Coast
Southern Africa Congo river
estuary, DRC
rain forest &
Northern limit of Selous ecosystem
Coast Coast Coast
• Protected Areas
Protected Areas mentioned in the report are according to the IUCN criteria.
For the French and Portuguese speaking countries, the French and Portuguese word is used
when it defines a specific status of protected area, for example:
- Zone d'Intérêt Cynégétique (French) and Coutada (Portuguese) may be slightly different
concepts than that of a "Hunting Block", and;
- Forêt classée (French) has no real synonym in English.
A number of acronyms are utilized and their meaning is explained in the "List of acronyms".
• Areas
Distribution and size of ranges are given in km² (square kilometres).
The sizes of the Protected Areas are taken from two main sources:
- The IUCN Directory of Afrotropical Protected Areas (IUCN, 1987), and;
- The African Antelope Database 1998 (East, 1999).
The sizes of the non-gazetted areas are sourced from either literature or experts' opinions.

13
• Sub-populations
In this study, two lion sub-populations are considered as two separate lion populations with
very few or without any exchanges. Sub-populations are defined here as distinct populations
separated by:
- Natural barriers such as large rivers or mountain ranges, and/or;
- Extensive areas of human settlements, and/or;
- Very large distances.
The fact is acknowledged that this definition of sub-population reflects the situation at a
particular time in the historical trends of the lion in the continent. This situation is likely to
evolve further, hence needs modification to the classification proposed in the present study,
and is open to discussion. Nevertheless, this geographical definition will help in the
assessment of the lion status in the various regions.
• Unit of measure
The following rules have been applied:
- Range figures are given in km² with no decimal;
- Density figures are given in lions/100 km² with one decimal only;
- Population figures are given with no decimal, and;
- Percentages are given to break down the lion range and the lion population size. Given the
low level of global accuracy, there would be no point in giving a precise %, which
explains the reason why tables show % figures without a decimal.
• Terms
The words "lion" and "lions" are used as generic terms, unless lioness, sub-adult lion, lion cub
or male lion are mentioned.
Various words are used to define non-sedentary lions: erratic, migrant, nomad, nomadic,
occasional, temporary, transient, vagrant, wanderer, have been considered similar.
2.5. DATA COLLECTION
• Difficulty
As expected, collecting reliable information proved to be a complex exercise. One of the main
difficulties appears to be the variable quality of information, some of it being more precise,
more detailed, more reliable, etc. than others.
The lion belongs to a group of taxa that is difficult to study for a number of reasons. The
densities of large predators are usually much lower than the densities of their prey species, in
the rough order of 1 to 100, making them obviously less prone to be observed, either directly
or indirectly. Furthermore, lions quickly become secretive and nocturnal as soon as they are
subject to hunting pressure and even more so when and where they suffer from harassment.
The counting methods by direct observation (with or without calling) provide results which
14
must be considered as minimum numbers with these shy and nocturnal lions. Under such
conditions, the behaviour of the lion becomes similar to the one of leopard, a species which is
rarely observed, although omnipresent in SSA. Furthermore, a particular counting method
may be valid for a given case-study and not for another, e.g. (Loveridge, A.J., T. Lynam & D.W.
Macdonald, 2001):
- the calling station technique is suitable for lion surveys in medium to high lion density
areas, while the spoor frequency technique is more suitable and more cost/effort effective
than calling station in low density areas;
- the level of interaction between lions and hyaenas may influence response to calling: (i) in
areas with high-density hyaenas and low-density lions, the lions may not respond to
calling with hyaena sounds, (ii) in areas with no hyaenas, the lions may not respond to
calling with hyaena sounds.
Huge tracts of lion habitat are indeed remote wilderness regions, which are often difficult to
access. The attention of conservationists inevitably focuses on the areas with easiest access,
roads, and infrastructure etc., particularly those Protected Areas, which are well suited for
tourism purposes. As a matter of fact, data on lion are available for these locations, while they
are scarce or absent for the others. Pastoral rangelands with presence of lions are generally
overlooked since they are (i) rarely studied, (ii) extensive areas with low lion densities and
(iii) of difficult access. Also, due to the habit of the lions to walk on dirt tracks, the
observation (and the counting) of lions is much more difficult in areas with a sparse road
network, e.g. Protected Areas such as Faro National Park in Cameroon or Pendjari National
Park in Benin.
Civil unrest, mass movement, settlement of refugees and any political turmoil represent other
reasons for the difficult access to some lion distribution areas, which makes it necessary to
base estimates of current status of lion populations on “educated guesses”.
During the rainy season, the situation of lion in terms of distribution and behaviour is not well
known since access to many areas becomes very difficult, and often even impossible, at this
particular time of the year.
• Presence/absence
On the one hand, a single observation of lion means presence of the species, either permanent
or occasional. Conversely, no physical observation of lion does not necessarily confirm the
absence of the species from an area.
However, "as lions are great wanderers, they may be expected to turn up from time to time in
areas where for many years they were unknown, often far from their present limits of
distribution; there are many examples of this" (Smithers, 1983). A considerable number of
cases could be quoted in this regard. To mention only a single and recent example, a solitary
adult male lion has settled down early 2002 in a ranch nearby Chinhoyi close to Harare,
Zimbabwe, where the taxon had not occurred for decades (C. Coid, pers. comm.).
• Abundance
Information on density, pride size, hunting success, eventually hyena/lion ratio etc. provide
data to estimate the abundance of a given lion population.

15
The concept of density (number of lions/100 km²) is difficult to use for a number of reasons:
- As censuses and indices of abundance are never fully accurate, a single figure of density is
always appropriately subject to relevant criticisms;
- Uninformed persons are prone to make use of a single figure of density, even sometimes
for an entire country, and;
- Lion density figures are not to be regarded as fixed in time, since lion populations are
subject to significant fluctuations due to a number of factors such as:
- Natural factors: inter alia, all predators adjust their population dynamics to the
population dynamics of their prey basis;
- Human factors: direct (predation and disturbance by humans) or indirect
(decrease in prey availability and/or habitat quality), and;
- Epidemic diseases, which can cause drastic reductions in lion numbers every so
often.
Despite these limitations, it appears useful to present available figures of lion density with the
intention of providing an indicator for comparing sites. But it must be borne in mind that:
- Some of these density figures originate from field studies;
- Others are calculated from the estimated population size and surface of habitat, and;
- The rest is evaluated from comparisons with available population assessments from either
neighbouring or similar situations.
Admittedly, the density figures given are more often issued from experts' opinions than from
precise field observations. Nevertheless, they provide useful benchmarks to avoid wild
guesses of global population sizes.
Obviously, lion density figures always correspond to a given area. However, they are usually
not calculated by country or by region, as densities in those broad geographic entities would
not have much significance.
2.6. DATA ANALYSIS
• Presence/absence
Using the data of lion presence/absence it is possible to define:
- Distribution range;
- Sub-populations, and;
- Proposed Range States (countries where lion occurs, either permanently or occasionally).
This information is usually very reliable, as it is quite easy to collect.
• Sub-populations
The different sub-populations have been designated on the basis of the following criteria:
- Information on presence/absence (not abundance);

16
- The recent continuity of local populations with current or recently interrupted flows of
animals;
- Some sub-populations have been considered as separate sub-populations even though they
used to be linked historically, e.g. sub-population n° 4 in Cameroon and sub-population n°
5 in Chad and CAR used to make a single sub-population before they were fragmented to
the point of having no more linkages;
- Some local populations very recently isolated (currently no more exchange of animals)
have been considered belonging to the same sub-population, for example:
- In Mali, sub-population n° 1.6 in the South-West used to be linked with sub-
population n° 1.7 in Boucle du Baoulé National Park;
- Sub-population n° 4.2 in Yankari National Park, Nigeria, used to be linked with
sub-population n° 4.1 in Faro National Park, Cameroon, and;
- Some doubts remain for certain sub-populations, e.g. in Mozambique it is uncertain
whether sub-population n° 27 is linked with sub-population n° 31; if it is the case, then
they should be considered as a single sub-population.
• Abundance
Population size figures are given by several assessment modes (Table 2), which are ranked
according to their reliability as follows:
- Assessment mode A:
The estimated population size is produced by total census or abundance index or density or
intimate knowledge of an area including lions, prey availability, use, etc. Minimum and
maximum figures are calculated with a 10% error on the estimate.
- Assessment mode B:
The estimated population size is produced by comparison of the given population with known
population in a similar ecosystem, usually in a neighbouring area. Using hunting results
following a calculation of ratio may also make this comparison. Minimum and maximum
figures are calculated with a 20% error on the estimate.
- Assessment mode C:
The estimated population figures are produced by experts' opinions usually based upon first
hand information, sometimes on "guesstimates" drawn from available information. Minimum
and maximum figures are calculated with a 30% error on the estimate.
TABLE 2 - THE DIFFERENT ASSESSMENT MODES USED TO ESTIMATE LION POPULATION SIZES
Population sizeAssessment
mode Minimum Estimated Maximum
A - 10 % Figure + 10 %
B - 20 % Figure + 20 %
C - 30 % Figure + 30 %

17
• Complementary note on the assessment mode B
Assessment mode B may consist of a comparison of the hunting results. The given lion
population is assessed by comparison with an already assessed lion population using ratio of
hunting results/efforts/sucess as measurements of catch-per-unit-effort (CPUE). The ratio of
the number of lion obtained per hunter and per hunting day is considered as representative of
the sampling effort made by an average hunter in a given area, thus it may be regarded as an
interesting indicator of the lion population for this particular area. "An advantage of CPUE
estimates is that the rquired data can be collected by hunters [and other local stakeholders]…
In cases of sustained-yield harvesting, CPUE estimates are probably sufficiently accurate
because underestimates would lead to conservative management decisions" (Lancia et al.,
1996).
For instance, the density of lions has been assessed in the hunting areas of Burkina Faso. In
countries of the same region, the lion density in the hunting areas of a given country is
estimated by multiplying the already assessed lion density in Burkina Faso hunting areas by
the ratio of the hunting result in the hunting areas of the given country (number of hunted
lions per 100 km²) divided by the hunting result in Burkina Faso hunting areas (Table 3).
Such an approach might be of some validity if the hunting effort is constant year after year. In
the present case study of Burkina Faso, the number of big game hunting permits was fairly
constant for the last 5 years (roughly 180 per year), as well as the average period of a big
game hunting trip (about 6 days of operational hunting in the field per hunter).
TABLE 3 - ESTIMATION OF LION DENSITIES BY COMPARISON OF THE HUNTING RESULTS: AN
EXAMPLE FROM WEST AND CENTRAL AFRICA
Lion density (lions/100 km²)Country Lions
hunted per
100 km²Already
assessed*Estimated in the area
hunted for lion**Extended to the total
hunting area***
Burkina Faso 0.16 5 5 5
Senegal 0.05 1.6 0.2
Benin 0.12 3.8 3.4
Cameroon 0.05 1.5 1.3
CAR 0.05 1.6 0.5
Chad 0.08 2.3 1.6
* Chardonnet, 1999
** The estimated lion density in the hunting areas of a given country is the already assessed lion density in
Burkina Faso hunting areas, multiplied by the ratio of the number of hunted lions per 100 km² in the hunting
areas of the given country by the number of hunted lions per 100 km² in Burkina Faso hunting areas, given that time factors remain constant
*** The distribution area of lions does not match the surface of hunting areas
• Figures
Since all efforts have been made to be as accurate and consistent as possible, careful
precautions are taken in producing figures. Conservative estimates are given systematic
preference. Averages are calculated when discrepancies appear between two or more sources
for a given site. For instance, in the case of Ethiopia, discrepancies appear very high between

18
sources, with estimates differing by a factor of 5 for lion population numbers. In this
particular instance, reasonable conservative decisions had to be taken upon basis of experts'
opinions.
• Trends and Constraints
A summary of the trends and constraints facing the various populations by region are given in
Tables 14, 17, 20 and 23.
• Precision
Tentatively, the minimum-maximum range assesses an indication of the precision level for the
population size.
• Accuracy
At this stage, there is no way to know exact numbers of free-ranging lion population size.
Excellent accuracy is to be expected for enclosed populations of lion in Southern Africa.
19
3. LIMITATIONS
3.1. GENERAL COMMENTS
This survey does not pretend to be:
- Exhaustive: some lion populations have certainly been forgotten, ignored, overlooked, etc;
- Perfect: most probably knowledgeable experts may notice some errors;
- Definitive/conclusive: improvements are hoped for, from better observation and
fluctuations from future monitoring, and;
- Exclusive: other contributions are expected to complete this survey.
This survey is claiming to be:
- Based on honest assumptions to the best of available knowledge;
- As comprehensive as possible within the limits of the available capacity;
- Conservative in the way that cautious figures and prudent assumptions have been used,
and;
- Valid only at the time of its publication. It should be considered as a snapshot in time,
acknowledging that status, situations, figures, etc. may change over time. Nevertheless, it
may be regarded as a bench mark of the 2002 situation for future studies.
It must be emphasised that exact data on the status of lions, as it is for most African
mammals, is extremely difficult to secure, especially for those of the lion populations which
are exclusively nocturnally active. Published data has been referred to where available,
however, in many instances this report has had to rely on the “informed opinion” of local
experts, resource managers and scientists based in the respective countries, or with long field
experience of working with wildlife.
Numbers given in this report, in all other cases, are based on experts opinion, with cross-
referencing whenever possible.
The present report aims at providing a picture of the conservation status of the species
Panthera leo in Sub-Saharan Africa. It is not intended to represent an exact count of lions
continent-wide.
Lion populations have fluctuated widely in the past, but show a remarkable degree of
resilience and capacity to bounce back after a rapid decline, therefore the figures indicated for
a given population/sub-population may be smaller or larger in a few months time.
3.2. MAPS
5 original maps are produced in this survey:
- 1 general map of the global distribution area of the African lion in SSA, and;
- 4 regional maps, 1 for each of the 4 identified regions, giving a more precise picture of the
lion distribution in each region.

20
The maps are tentatively proposing the limits of the lion sub-populations identified in this
study. The delineation of the different sub-populations tries to sketch out the lion distribution
to the best of the available knowledge. These maps are indeed subject to discussion
considering that:
- Some of the sub-populations are obvious and most probably will not be challenged, and;
- Others are more than questionable and open to interpretation.
It is certainly expected that these maps will be improved. Some of these improvements are
already known, for instance:
- In Mozambique: a new National Park under creation, Parque Nacional das Quirimbas, on
the Northern coast of the country, in Cabo Delgado Province, appears to host a quite large
population of lions (H. Motta, pers. comm.);
- In Ethiopia: a small isolated area not mentioned on the map contains some lions in lower
Tekeze river valley, Shire region, as far North as the Eritrea border (T. Mattanovich, pers.
comm.), and;
- North-central Nigeria may apparently contain a small population centred on Kamuku
National Park (about 1,500 km² but part of a much larger area of forest reserve, grazing
reserve) which is contiguous with Kwiambana Game Reserve (J. Rudge, pers. comm.).
The positioning of frontiers on the maps in no way implies official recognition or acceptance
by the editor or by the respective countries.
3.3. OFFICIAL VALUE
The information provided here has no political value, as it is not meant to appear endorsed by
political authorities. It is only given as technical support to help decision-makers and other
interested stakeholders.
21
4. PROSPECTS
It is not the primary intention of this survey to make recommendations. However, by
conducting such a study, obvious prospects became apparent.
The first and main prospect to come out is the urgent need to conduct a planning exercise such
as an action plan or similar guidance document. This action plan should be drafted by all
appropriate and consensual means, involving every responsible and interested stakeholders,
i.e. political authorities, specialised scientists, local communities living with lions, the private
sector involved, development and conservation NGO's, etc.
Since the African continent carries by itself the burden of conserving this outstanding and
charismatic species, Africans should be the primary stakeholders to design lion action plans
and to take the strategic decisions.
The next prospect to come to light is the necessity to discuss the implementation of the
designed action plan. This discussion should take place in the same framework as the
planning exercise, since too many action plans are left without being implemented and
adapted to changes over time.

ChapterChapter IIIIPopulation SurveyPopulation Survey
Lioness of Benin, Konkombri Hunting Area (Photo : C. Morio & V. Morio).
22
"In the bush the king of the animals is the lion. He roars once a year. The toa (blue
duikers) are scared of being eaten. They hide themselves and they are so frightened
that they eventually die in their refuge. The lion of Mounts Nimba used to be hunted
but he did not stay; he was coming from Touba in Côte d'Ivoire, passing through
Foumandou and finally reached the Mounts Nimba where he remained 6 months
before leaving again."
A Konon hunter, the old chief of Gbakoré village,
Guinea, 01.08.1999,
Solange Chaffard-Sylla, 2002, pers. comm.
23
1. CONTINENTAL OVERVIEW
1.1. DISTRIBUTION AREA
1.1.1. Presence
• Range borders
- Latitudes
The extreme latitudes of the lion range are:
Highest latitudes
- Northern Hemisphere
The African lion has been extirpated from all the former high latitudes where it used
to live, both in the Northern (North Africa) and Southern Hemisphere (the Cape).
Rock paintings also attest to the former presence of lion deep inside what is now the
Sahara Desert. The famous Theodore Monod reported in Northern Chad that a lion
was shot in 1927 in the region of Erdi Dji (as far North as 19°N, just where the 3
borders Chad, Libya, Sudan meet), and another lion was shot in 1940 near Mourdi
(18°30'N) (Smithers, 1983). Now lions are still present in Central Africa up to 15°N
(Hoinathy Honimadji, pers. comm.; J. Tubiana, pers. comm.). The Northernmost lion
populations are probably:
(i) The few remaining individuals of Boucle du Baoulé National Park in Mali (if
they still exist);
(ii) The small relict population of Kapka mountain range, a non-gazetted area in
North-Eastern Chad (the Ennedi mountain range seems to have lost its lion
population), and;
(iii) The population of Dinder National Park, Sudan, and of the neighbouring area
in Ethiopia.
- Southern Hemisphere
Free-ranging lions do not presently occur farther South of latitude 24° South.
However, enclosed lions have been reintroduced as far South as the Southern coast
of South Africa.
Lowest latitudes
6 lion sub-populations (see maps) have been identified to live on or near the Equator:
- Sub-population n°6: Congo and Gabon;
- Sub-population n°9: DRC and Uganda;
- Sub-population n°19: Somalia and Kenya;
- Sub-population n°20: Kenya;
- Sub-population n°21: Kenya, and;


24
- Sub-population n°22: Kenya.
- Longitudes
The extreme longitudes of the lion range are:
- In the West, as far as Guinea Bissau where the lion penetrates westwards into the
country along the course of the Corubal river (Ph. Chardonnet, pers. comm.),
and;
- In the East, where in Somalia the map of the lion range by Laurent (2002) shows
the presence of lion as far as the Indian Ocean coastline.
• Range size
Although it remains extremely difficult to assess the range size of large predators that may
sometimes wander great distances and of which the density is always low compared to other
mammals such as their prey, the range size of the African lion has been tentatively estimated
as the following:
- The global African lion distribution range covers about 3 million km², and;
- The distribution area of the lion covers approximately 10 % of the whole
continent, about 15% of SSA.
TABLE 4 - EXTENT AND STATUS OF LION DISTRIBUTION AREAS IN SUB-SAHARAN AFRICA
Protected AreasLion range(km² & %*)
TotalNat. parks Reserves Hunting areas
Non-gazettedareas
Km² 121,980 43,190 14,690 18,400 45,700Western
Africa % 4 35 12 15 37
Km² 651,970 67,555 24,860 247,860 311,695Central
Africa % 22 10 4 38 48
Km² 1,137,205 149,347 139,594 116,730 731,534Eastern
Africa % 39 13 12 10 64
Km² 1,039,212 289,139 405,404 27,472 317,197Southern
Africa** % 35 28 39 3 31
Km² 2,950,367 549,231 584,548 410,462 1,406,126Sub-Saharan
Africa % 19 20 14 48
* % of the existing lion range in the sub-region, except for the last line, which is relative to the continent.
** excluding fenced Protected Areas.
• Lion range and status of Protected Areas
About half of the lion range falls within Protected Areas, while the remainder is non-gazetted.
This is noteworthy because of:
- The remarkable importance of so-called pastoral areas (nearly half of the lion range) to
lions appears clearly, while it is often overlooked, and;
25
- Of Protected Areas, National Parks encompass nearly 20% of the lion range, the same for
the Reserves and the remainder comprising of Hunting Areas.
However, these figures must be interpreted with caution since:
- Some of the "Reserves" are in fact Hunting Areas. For instance, in Tanzania Game
Reserves are classified as reserves even though they are officially used for hunting;
- Some non-gazetted areas are conservation areas with or without hunting activity. For
instance, in Zimbabwe commercial wildlife ranches and wildlife conservancies are
classified as non-gazetted even though their main purpose is wildlife conservation with
hunting operations, and;
- Non-gazetted areas are always difficult to assess or define in size.
• Regions
The lion is present in all four regions of the continent South of the Sahara.
In terms of range size:
- The strongholds of the lion are Eastern and Southern Africa with similar surfaces covering
more than 1/3 of the total lion range each (39% and 35% respectively);
- Central Africa contains more than 1/5th
of the lion range (22%), and;
- Western Africa holds a bit less than 1/20th
of the lion range (4%).
1.1.2. Absence
• Long-standing absence
Historically the lion ranged throughout the entire continent from North to South. However, to
the best of available knowledge, it has always been absent from some of the African regions
such as what is now the Equatorial Guinea, the rain forest areas of the Gulf of Guinea and in
the Congo basin.
• Extirpations
"There is probably no other species whose distribution range has shrunk over historical times
to the extent shown by the lion" (Smithers, 1983). The contraction of the lion range is
characterised by regional and local extinctions of the taxon.
- Ancient extirpations
The lion has not always been an endemic African taxon as it has become today (if the relict
Indian population is considered as separate from the African one). It used to live in South-
eastern Europe, the Near-east, South-central Asia and the Indian sub-continent. Outside
Africa now, it only remains in the Gir forest in India with a population ranging between
250 and 300 (Jackson, 1997).
26
- Recent extirpations
In Africa, the lion disappeared more recently from the two tips, North and South, of the
continent. North of the Sahara, it was extirpated from Tunisia and Algeria about 1891,
from Morocco in 1920; in Southern Africa, it disappeared from most of the Cape Province
during the 1860s as well as from the greater part of Natal (Smithers, 1983).
- Modern extirpations
Within the recent distribution range of the lion, several countries have witnessed its
extinction:
Western Africa:
Gambia
- The lion used to occur along the Gambia River (Bigourdan & Prunier,
1937) within the present borders of Gambia.
Mauritania
- In Mauritania, “the lion used to be widespread from South to North of the
wooded savannah’s limit, penetrating even further North during the
rainy season” (Prévost, 1987);
- According to Chudeau (1920 in Le Berre, 1990), the lion was present in
the Northern Tagant;
- Roure (1956) mentioned the presence of lions and abundant prey species
in the Nema region, South-East Mauritania: "the lion exists about
everywhere South of the 17th
parallel, in the Trarza, in the Brakna and
mainly in the Guidikama, along the Karakoro Oued, and in the Hodh,
South of the Timbedra-Nema line";
- In the late 1980’s, about 10 lions were still surviving in Guidimaka
Region and South-East of the Affole mountain range where they were
causing damage to cattle every year (Prévost, 1987), and;
- The lion may be considered extinct now in Mauritania.
Sierra Leone
- According to Smithers (1983), the lion was found in the Northern parts of
Sierra Leone.
Central Africa:
- No country has definitely lost the species in this region, neither in the
tropical region of Central Africa, nor in the equatorial region.

Map
of
lion
dis
trib
utio
n in
Wes
tern
Afr
ica
in 1
937
(Big
ourd
an &
Pru
nier
, 193
7)
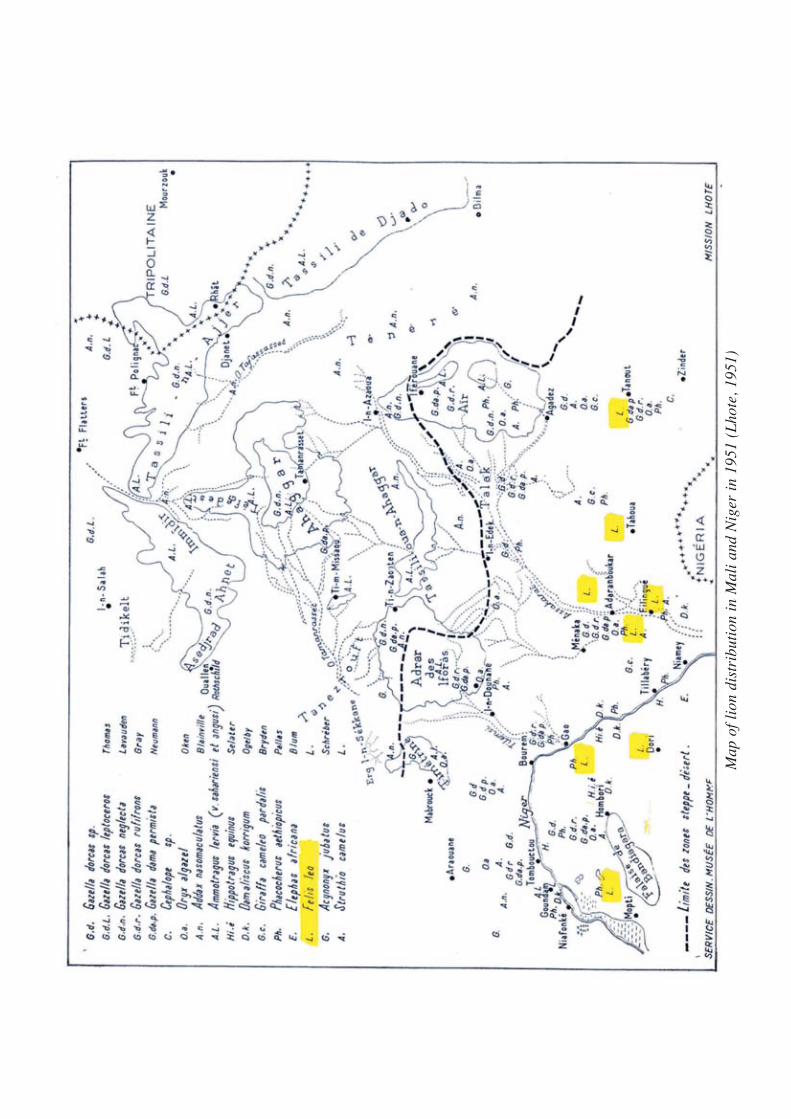
Map
of
lion
dis
trib
utio
n in
Mal
i an
d N
iger
in
1951
(L
hote
, 195
1)

27
Eastern Africa:
Djibouti
- Alain & Danielle Laurent (2002) consider the lion as extinct in Djibouti.
However A. Laurent (pers. comm.) does not exclude the possibility of
erratic lions coming from Ethiopia following cattle herds along the
Awash River.
Eritrea
- The lion was probably present in Eritrea during recent times, from where
we have no record now. However, it must be mentioned that some lions
remain in Northern Ethiopia, very close to the Eritrea border, precisely in
lower Tekeze river valley, Shire region (T. Mattanovich, pers. comm.).
Southern Africa:
- As stated before, the "Cape" lion is definitely extinct;
- Lesotho has lost its lion population, and;
- Swaziland has reintroduced the species after having lost it in recent
times.
1.2. PROPOSED RANGE STATES
The information provided here has no political value, since political authorities have not been
asked to endorse it officially. The data are only given as guidelines to help decision-makers
and other interested stakeholders.
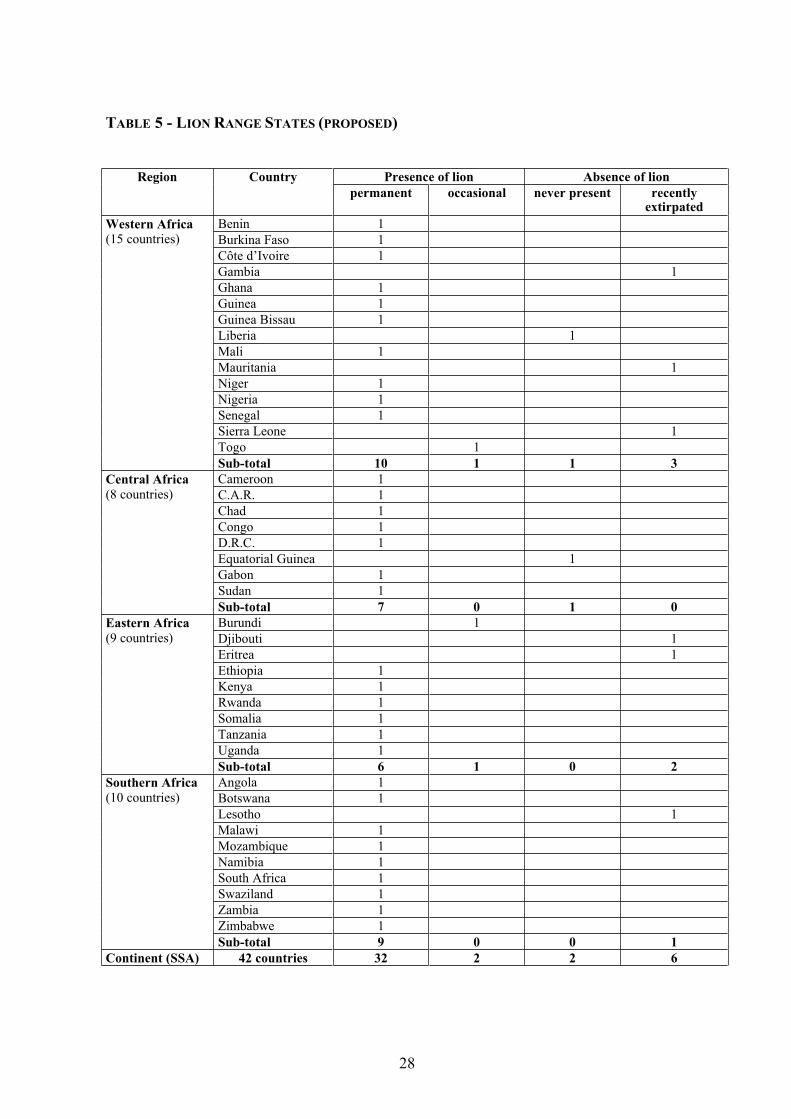
Lions are present in 34 Range States (Table 5):
- They are permanently present in 32 States, and;
- Occasional in the other 2.
To the best of our knowledge at this stage, 8 countries in SSA are not Range States:
- 2 of them historically never had lions, and;
- The 6 others have lost their lions in recent history.
28
TABLE 5 - LION RANGE STATES (PROPOSED)
Presence of lion Absence of lionRegion Country
permanent occasional never present recentlyextirpated
Benin 1
Burkina Faso 1
Côte d’Ivoire 1
Gambia 1
Ghana 1
Guinea 1
Guinea Bissau 1
Liberia 1
Mali 1
Mauritania 1
Niger 1
Nigeria 1
Senegal 1
Sierra Leone 1
Togo 1
Western Africa
(15 countries)
Sub-total 10 1 1 3
Cameroon 1
C.A.R. 1
Chad 1
Congo 1
D.R.C. 1
Equatorial Guinea 1
Gabon 1
Sudan 1
Central Africa
(8 countries)
Sub-total 7 0 1 0
Burundi 1
Djibouti 1
Eritrea 1
Ethiopia 1
Kenya 1
Rwanda 1
Somalia 1
Tanzania 1
Uganda 1
Eastern Africa
(9 countries)
Sub-total 6 1 0 2
Angola 1
Botswana 1
Lesotho 1
Malawi 1
Mozambique 1
Namibia 1
South Africa 1
Swaziland 1
Zambia 1
Zimbabwe 1
Southern Africa
(10 countries)
Sub-total 9 0 0 1
Continent (SSA) 42 countries 32 2 2 6
29
1.3. SUB-POPULATIONS
It may be assumed that the Western African sub-populations were once linked with the
Central African sub-populations, the latter being contiguous with the Eastern African sub-
populations, and therefore, the Southern African sub-populations. The assumption of a
continuum of lions throughout Africa is not improbable, although not proved.
However, today the African lion population appears to be fragmented into:
- 36 sub-populations supported by an equivalent number of global distribution areas,
and;
- 35 free-ranging sub-populations and 1 sub-population of enclosed lions (the latter in
South Africa).
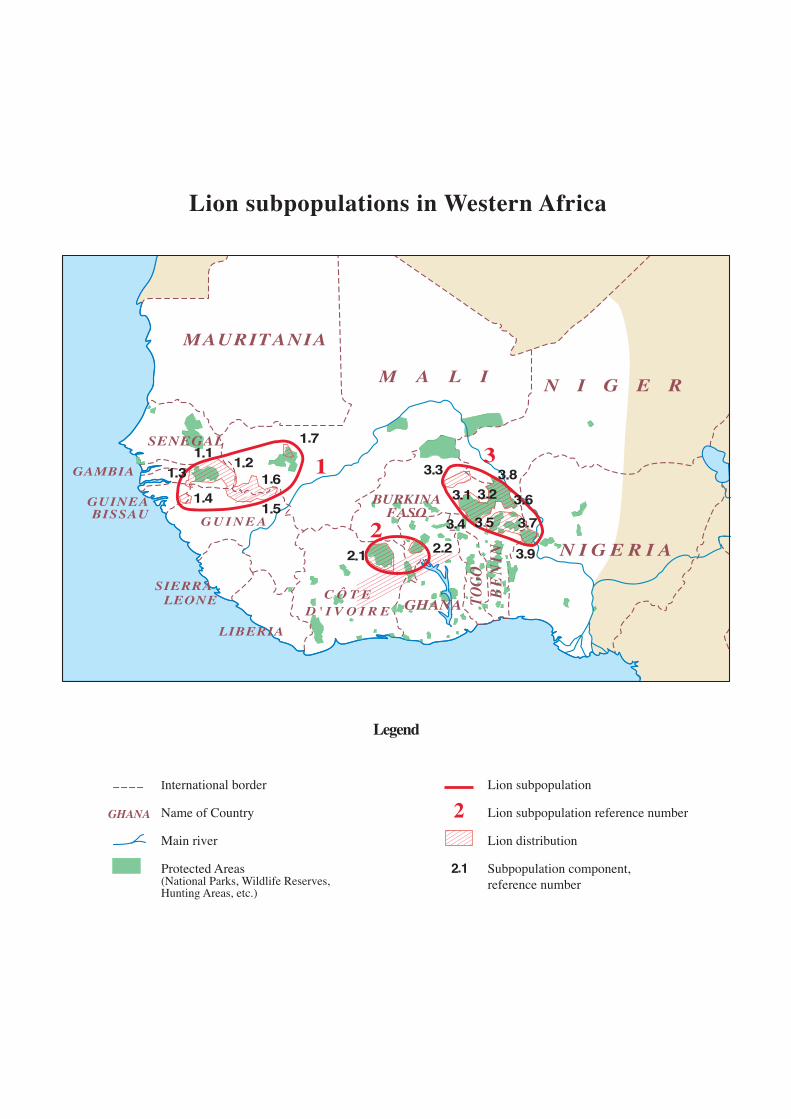
The different sub-populations of lions are distributed in the four regions as follows:
- 3 sub-populations in Western Africa;
- 3 sub-populations in Central Africa;
- 18 sub-populations in Eastern Africa, and;
- 12 sub-populations in Southern Africa.
Within these global distribution areas, the sub-populations are also fragmented in several
areas.
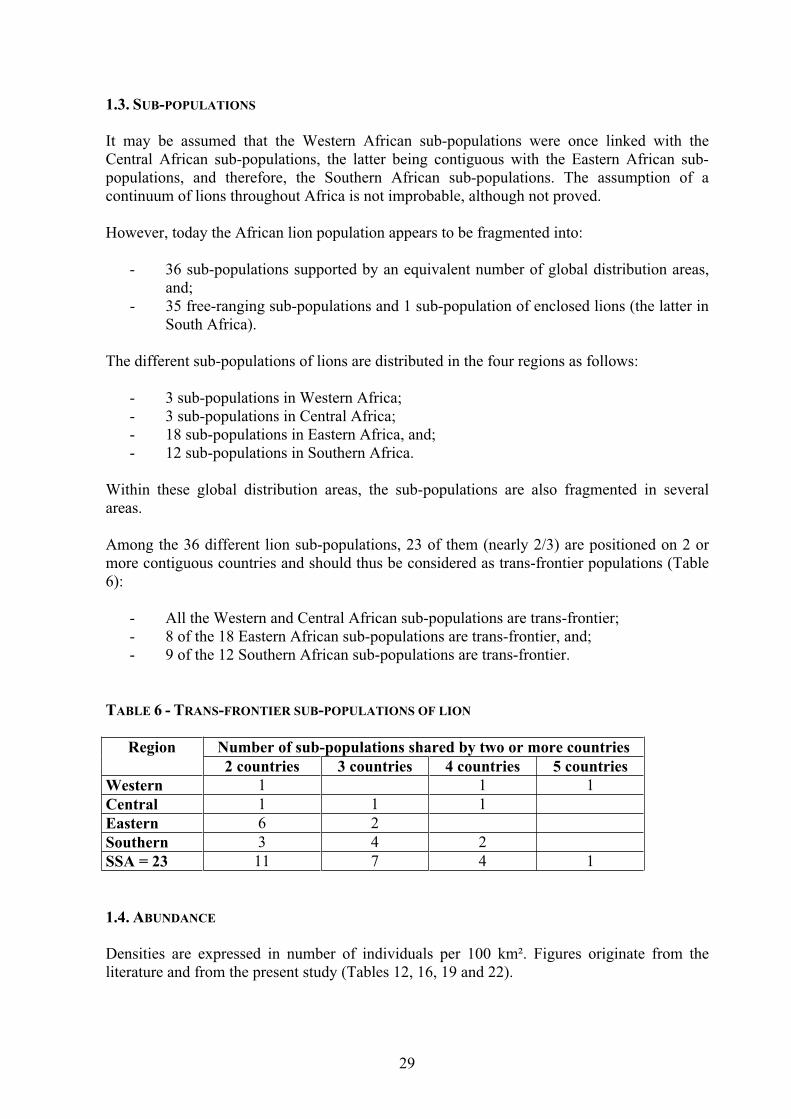
Among the 36 different lion sub-populations, 23 of them (nearly 2/3) are positioned on 2 or
more contiguous countries and should thus be considered as trans-frontier populations (Table
6):
- All the Western and Central African sub-populations are trans-frontier;
- 8 of the 18 Eastern African sub-populations are trans-frontier, and;
- 9 of the 12 Southern African sub-populations are trans-frontier.
TABLE 6 - TRANS-FRONTIER SUB-POPULATIONS OF LION
Number of sub-populations shared by two or more countriesRegion
2 countries 3 countries 4 countries 5 countries
Western 1 1 1
Central 1 1 1
Eastern 6 2
Southern 3 4 2
SSA = 23 11 7 4 1
1.4. ABUNDANCE
Densities are expressed in number of individuals per 100 km². Figures originate from the
literature and from the present study (Tables 12, 16, 19 and 22).

30
Quite reliable density figures are sometimes available for some Protected Areas, which have
been lucky enough to host lion studies. Unfortunately, this is not the case for most Protected
Areas. The assessment of lion density is even worse for non-gazetted areas. As developed in
chapter III (Driving forces), pastoral areas are a matter of special concern simply because they
are commonly overlooked by conventional conservationists even though it may happen that
their lion carrying capacity might sometimes be higher than in some wildlife-depleted
Protected Areas.
It is important to stress that lion density figures are produced for a given ecosystem, a given
year and a given season.
No density figure is given (calculated) per country or per region because it would not be
meaningful, as it would not relate to respective local field situations.
Also, no figure is usually produced for a particular site within a given ecosystem since the
variations existing between localities are too great. For instance, within Queen Elizabeth
National Park ecosystem, Uganda (Table 7), where:
- In the early 1980's, lion density was 5 times higher in Ishasha area than in Mweya
area, corresponding to a prey biomass also 5 times higher in Ishasha (14 tons/km²)
than in Mweya (2.8 tons/km²) (Von Ordol, 1982), and;
- In the late 1990's, lion density was 7 times higher in Ishasha than in Kyambura
(Dricuru, 1999)
TABLE 7 - LION DENSITIES IN DIFFERENT SITES OF QUEEN ELIZABETH NATIONAL PARK
ECOSYSTEM
Lion density (number of lions/100 km²)Source
Ishasha Mweya Katwe Katunguru Kyambura*
Von Ordol, 1982 52 11
Dricuru, 1999 23 10 12 3
* Kyambura Wildlife Reserve is adjacent to Queen Elizabeth National Park
Similarly, no detailed figure is usually produced for a particular season within a given area
since very broad seasonal variations exist during a single year, as shown below (Table 8) in
NG 29 Controlled Hunting Areas, Botswana (Winterbach & Winterbach, 1999):
TABLE 8 - SEASONAL VARIATIONS OF DENSITY FOR THE LION POPULATION IN NG29
CONTROLLED HUNTING AREAS, OKAVANGO DELTA, BOTSWANA, (WINTERBACH AND
WINTERBACH, 1999)
Season Density (lions/100 km²) Home range (km²)
Warm dry (Aug.-Dec. 1997) 38.7 33.6
Warm wet (Jan.-Apr. 1998) 18.8 69.1
Cold dry with floods (May-Aug. 1998) 33.0 39.4
Warm dry (Sept.-Dec. 1998) 24.6 52.8

31
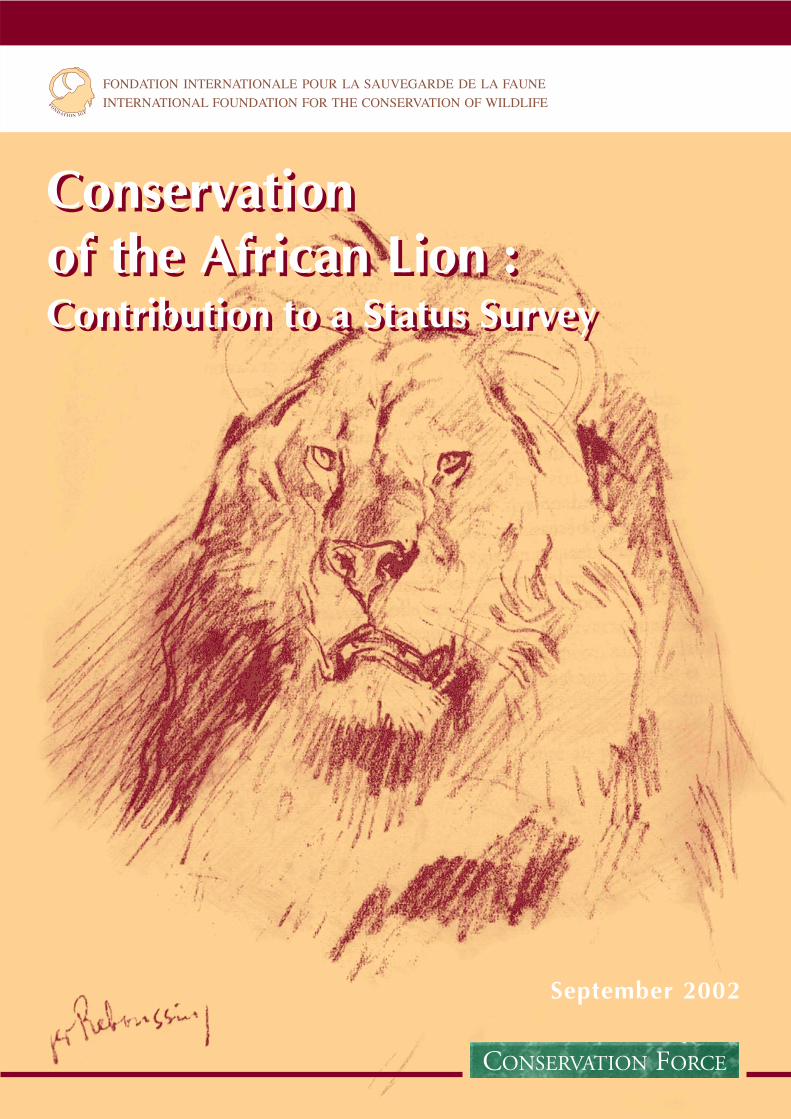
TABLE 9 - SOME LION DENSITIES IN AFRICA
Lion density
(lions/100 km²)
Manyara National Park, Tanzania 40.0 Makacha & Schaller, 1969
Chobe N.P. (Riverfront, dry season), Botswana 37.0 Neo-Mahupeleng et al. , 2001
Masaï Mara National Park, Kenya 30.0 H. Dublin, in litt. 1993 (in Nowell & Jackson, 1996)
Ngorongoro Conservation Area, Tanzania 27.0 Schaller, 1972
Nairobi N.P. & Kitengela C.U., Kenya 26.3 Rudnai, 1973
Lupande Game Management Area, Zambia (1990) 24.7 Jachmann, 2001
Chobe N.P. (Riverfront, wet season), Botswana 21.0 Neo-Mahupeleng et al. , 2001
Ngorongoro Crater, Tanzania 20.0 Elliott & Mc Taggart Cowan, 1978
Okavango delta (higher density), Botswana 18.0 Sechele & Winterbach, 2001
Chobe N.P. (higher density area), Botswana 17.0 Viljoen, 1993
Manyeleti Game Reserve, South Africa 16.9 Van Dyk, 1997 adapted from Van Schalkwyk, 1994
Central District of Kruger N.P., South Africa 12.7 Smuts, 1976
Queen Elizabeth National Park, Uganda 12.0 Dricuru, 1999
Kafue National Park, Zambia 12.0 Mitchell, Shenton & Uys, 1965
Kruger N.P. (higher density area), South Africa 11.2 Van Dyk, 1997 adapted from Van Schalkwyk, 1994
Kruger National Park, South Africa 10.0 Bothma & Walker, 1999
Serengeti N.P. (higher density area), Tanzania 9.4 Schaller, 1972
Gounda plain, Central African Republic 9.1 Ruggiero, 1991
Olifants River Game Reserve, South Africa 8.3 Van Dyk, 1997 adapted from Van Schalkwyk, 1994
Gounda plain, Central African Republic 8.0 present study
Selous Game Reserve (East), Tanzania 8.0 Rodgers, 1974
Serengeti N.P. (lower density area), Tanzania 7.9 Schaller, 1972
Katavi National Park, Tanzania 7.0 Caro, 1999
Pilanesberg National Park, South Africa 6.9 Van Dyk, 1997 adapted from Van Schalkwyk, 1994
Chobe N.P. (lower density area), Botswana 6.9 Van Dyk, 1997 adapted from Van Schalkwyk, 1994
Umfolozi-Hluhluwe Complex, South Africa 6.2 Van Dyk, 1997 adapted from Van Schalkwyk, 1994
Kruger N.P. (lower density area), South Africa 5.9 Van Dyk, 1997 adapted from Van Schalkwyk, 1994
Garamba National Park (core area), RDC 5.0 present studyArly Total Reserve, Burkina Faso 5.0 Chardonnet, 1999
Zakouma National Park, Chad 4.2 present study
Okavango delta (lower density), Botswana 4.0 Sechele & Winterbach, 2001
Madikwe Game Reserve, South Africa 3.6 Van Dyk, 1997 adapted from Van Schalkwyk, 1994
Pendjari complex, Benin 3.4 present study
Gewane-Melka Worer area, Ethiopia 3.0 T. Mattanovich in Abebe & Mattanovich, 2002
Waza National Park, Cameroon 2.7 present study
Yankari National Park, Nigeria 2.5 present study
Etosha National Park, Namibia 2.1 Berry, 1981 (year 1974-78)
Etosha National Park, Namibia 1.8 Van Dyk, 1997 adapted from Van Schalkwyk, 1994
Aouk Hunting Area, Chad 1.6 present study
Kalahari Transfontier Park, Botswana & South Africa 1.6 Funston, 2002
Kalahari Gemsbok N.P., South Africa 1.5 Mills, Wolff, Le Riche & Meyer, 1978
Niokolo Koba National Park, Senegal 1.3 present study
Etosha National Park, Namibia 1.2 Berry, 1996 (year 1994)
Faro-Bubandjida-Benoue Complex, Cameroon 1.1 present study
Makgadikgadi, Botswana 0.8 Hemson, 2001
Masai Steppe, Kenya & Tanzania 0.3 Lamprey, 1964
Pastoral areas in West & Central Africa 0.2 present study
High
density
Low
density
Very low
density
SourceCategory of
lion densityArea
Very high
density
Medium
density

32
FIG. 1 - LION DENSITY THROUGHOUT AFRICA (Sources: see Table 9)
1.5. POPULATION SIZE
1.5.1. Total population
The overall number of lions which is found today by the current survey in Sub-Saharan Africa
is estimated to be about 40,000 individuals with the following tentative distribution (Tables
11, 15, 18 and 21):
- 10 % of the total population inhabits the Western and Central African regions with
respectively 3% and 7%;
- 40% of the total population lives in the Eastern African region, and;
- 50% of the total population is situated in the Southern African region.
TABLE 10 - ESTIMATED LION POPULATION SIZE IN SUB-SAHARAN AFRICA
Estimated lion population sizeRegionsMinimum Estimated Maximum
% of estimatedlions per region
Western Africa 968 1,163 1,358 3
Central Africa 2,092 2,815 3,538 7.2
Eastern Africa 11,268 15,744 18,811 40
Southern Africa 14,526 19,651 23,425 49.9
Sub-Saharan Africa 28,854 39,373 47,132
0.0
5.0
10.0
15.0
20.0
25.0
30.0
35.0
40.0
45.0
Different areas of lion occurence
Nu
mb
er
of
lion
s/
100 k
m²
33
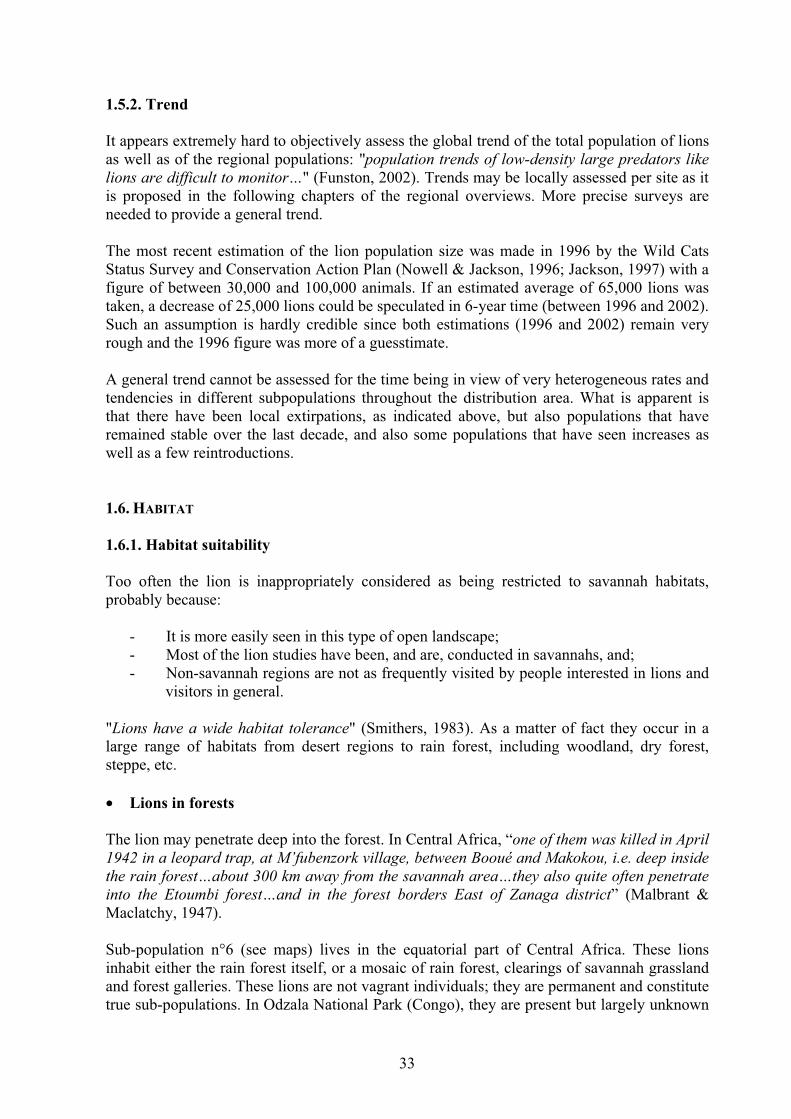
1.5.2. Trend
It appears extremely hard to objectively assess the global trend of the total population of lions
as well as of the regional populations: "population trends of low-density large predators like
lions are difficult to monitor…" (Funston, 2002). Trends may be locally assessed per site as it
is proposed in the following chapters of the regional overviews. More precise surveys are
needed to provide a general trend.
The most recent estimation of the lion population size was made in 1996 by the Wild Cats
Status Survey and Conservation Action Plan (Nowell & Jackson, 1996; Jackson, 1997) with a
figure of between 30,000 and 100,000 animals. If an estimated average of 65,000 lions was
taken, a decrease of 25,000 lions could be speculated in 6-year time (between 1996 and 2002).
Such an assumption is hardly credible since both estimations (1996 and 2002) remain very
rough and the 1996 figure was more of a guesstimate.
A general trend cannot be assessed for the time being in view of very heterogeneous rates and
tendencies in different subpopulations throughout the distribution area. What is apparent is
that there have been local extirpations, as indicated above, but also populations that have
remained stable over the last decade, and also some populations that have seen increases as
well as a few reintroductions.
1.6. HABITAT
1.6.1. Habitat suitability
Too often the lion is inappropriately considered as being restricted to savannah habitats,
probably because:
- It is more easily seen in this type of open landscape;
- Most of the lion studies have been, and are, conducted in savannahs, and;
- Non-savannah regions are not as frequently visited by people interested in lions and
visitors in general.
"Lions have a wide habitat tolerance" (Smithers, 1983). As a matter of fact they occur in a
large range of habitats from desert regions to rain forest, including woodland, dry forest,
steppe, etc.
• Lions in forests
The lion may penetrate deep into the forest. In Central Africa, “one of them was killed in April
1942 in a leopard trap, at M’fubenzork village, between Booué and Makokou, i.e. deep inside
the rain forest…about 300 km away from the savannah area…they also quite often penetrate
into the Etoumbi forest…and in the forest borders East of Zanaga district” (Malbrant &
Maclatchy, 1947).
Sub-population n°6 (see maps) lives in the equatorial part of Central Africa. These lions
inhabit either the rain forest itself, or a mosaic of rain forest, clearings of savannah grassland
and forest galleries. These lions are not vagrant individuals; they are permanent and constitute
true sub-populations. In Odzala National Park (Congo), they are present but largely unknown

34
(C. Aveling, pers. comm.), while on the Batéké plateau (Gabon and Congo), they are present
but remain totally ignored by most researchers.
Similarly, the lions of Aberdare National Park (Kenya) prey on rain forest dependent taxa
such as bongo.
• Lions in deserts
"The lions will penetrate deep into desert, where there are avenues of watercourses, and are
common in semi-desert areas such as in parts of the sahelian zone of West Africa or the
Kalahari in Botswana. Where water is available they will drink regularly, especially after
feeding, but they are by no means dependent on this and they can subsist for long periods
without it, getting their moisture requirements from their prey" (Smithers, 1983).
- In the Southern hemisphere:
In Botswana "lions have been observed going without drinking water for a period of nine
months during a drought in the Kalahari" (Owens & Owens, 1984 in de Waal et al., 2001),
where they are known to eat juicy tsama melon (Citrullus lanatus) and gemsbok cucumber
(Acanthosicyos naudinianus) which contain respectively 94% and 91% of water (de Waal et
al., 2001).
- In the Northern hemisphere:
Lions were still roaming a few decades ago in remote Northern latitudes, apparently mainly in
mountain ranges of the Sahara desert such as the Aïr Ténéré in Northern Niger, the Adrar des
Ifhoras in Northern Mali, the Ennedi in Northern Chad, etc. In the Sahelo-Saharan region, the
Touaregs used to traditionally hunt lions on a regular basis (Lhote, 1951).
1.6.2. Habitat availability
• Habitats available
In some regions, large tracts of suitable habitat for lions sustain very low or even zero density
of lions. Two main reasons for this, both of human origin:
(i) Directly, through predation of lion by man, and;
(ii) Indirectly, through the depletion of lion prey species by man.
• Habitats unavailable
The degradation of wildlife habitat, even to the point of total desertification or transformation,
is extensively described in the literature.
1.6.3. Habitat trends
In very extensive Protected Areas, the natural habitat of lion is still largely maintained.
However, with a few exceptions, in smaller Protected Areas and in non-gazetted areas,
wildlife habitats are generally decreasing on the continent due to three main causes, which are
documented in the survey:
35
(i) Human population growth;
(ii) Agricultural encroachment, and;
(iii) Increase in domestic livestock numbers.
1.6.4. Legal status of habitats
Most of the lion sub-populations cover geographical ranges that include a mosaic of areas
with different conservation status:
- Protected Areas, such as National Parks, Wildlife Reserves, Hunting and Game
Management Areas, and;
- Non-gazetted areas, the latter being often pastoral rangeland utilised by cattle-herders
for livestock grazing.
The management scheme applied to each one of these areas of course varies according to their
respective legal status. Consequently the same applies to lion management: e.g. theoretically
(on paper):
- Full protection is granted in National Parks;
- A quota of trophies is allocated to Hunting Areas, and;
- No management measures, except for problem animal control in some countries, are
taken in non-gazetted areas, etc.
36
2. WESTERN AFRICA
2.1. LION RANGE
While the lion has been widely studied in Eastern and Southern Africa, very little has been
published on its current status in the Western and Central Regions of the continent.
In Western Africa, the lion range probably covers an area of more than 12 million hectares
(Table 11):
- About two thirds of the range are gazetted as Protected Areas including:
. National Parks: about one third;
. Reserves: 12%, and;
. Hunting Areas: 15%.
- Even though the lion range outside Protected Areas is very difficult to evaluate, non-
gazetted areas probably cover more than a third of the lion range.

37
TA
BL
E 1
1 -
ST
AT
US
OF
LIO
N D
IST
RIB
UT
ION
AR
EA
S I
N W
ES
TE
RN
AF
RIC
A
No
n g
aze
tted
Na
t. P
ark
sR
eser
ves
Hu
nti
ng
are
as
are
as
Sen
egal
1.1
. N
iok
olo
Ko
ba
Nat
ion
al P
ark
9,5
00
1.2
. F
além
é Z
on
e d
'In
térê
t C
yn
égét
iqu
e1
3,0
80
Gu
inea
Bis
sau
1.3
. B
uru
ntu
ma
reg
ion
55
0
1.4
. B
oe
& B
eli
reg
ion
s1
,58
0
Gu
inea
1.5
. S
igir
ini
& F
ello
Ko
un
do
ua
reg
ion
s1
0,4
00
Mal
i1
.6.
Hau
t-B
afin
g &
Hau
t-B
ako
y r
egio
ns
8,9
50
1.7
. K
on
go
sam
bo
ug
ou
Blo
ck (
wit
hin
Bo
ucl
e d
u B
aou
le N
atio
nal
Par
k)
1,5
00
Su
b-t
ota
l 1
11
,00
00
13
,08
02
1,4
80
Co
te d
'Iv
oir
e2
.1.
Co
mo
é N
atio
nal
Par
k1
1,5
00
5,0
00
Ghan
a2.2
. M
ole
Nat
ion
al P
ark
4,5
60
Su
b-t
ota
l 2
16
,06
00
05
,00
0
Bu
rkin
a F
aso
3.1
. A
rly
-Sin
go
u c
om
ple
x (
Nat
ion
al P
ark
s, F
aun
al R
eser
ves
& H
un
tin
g A
reas
)8
,08
0
3.2
. W
Nat
ion
al P
ark
2,2
50
3.3
. S
irb
a v
alle
y6
,59
0
To
go
3.4
. O
ti-M
and
ou
ri F
aun
al T
ota
l R
eser
ve
37
0
Ben
in3
.5.
Pen
dja
ri c
om
ple
x (
Nat
ion
al P
ark
& H
un
tin
g A
reas
)2
,75
03
,75
08
50
3.6
. W
co
mp
lex
(N
atio
nal
Par
k &
Hu
nti
ng
Are
as)
5,0
20
1,1
90
72
0
3.7
. A
lib
ori
su
pér
ieu
r &
Tro
is r
iviè
res
com
ple
x (
Fo
rêts
cla
ssée
s)6
,24
01
1,0
60
Nig
er3
.8.
W N
atio
nal
Par
k c
om
ple
x &
So
uth
of
Tam
ou
Fau
nal
Par
tial
Res
erv
e2
,25
03
80
Nig
eria
3.9
. K
ain
ji L
ake
Nat
ion
al P
ark
3,8
60
Su
b-t
ota
l 3
16
,13
01
4,6
90
5,3
20
19
,22
0
km
²1
21
,98
04
3,1
90
14
,69
01
8,4
00
45
,70
0
%3
51
21
53
7
Are
a
Con
serv
ati
on
sta
tus
& s
urf
ace
(k
m²)
Pro
tect
ed a
rea
sN
° of
sub
-
po
pu
lati
on
Cou
ntr
y
Tota
l
1 2 3

38
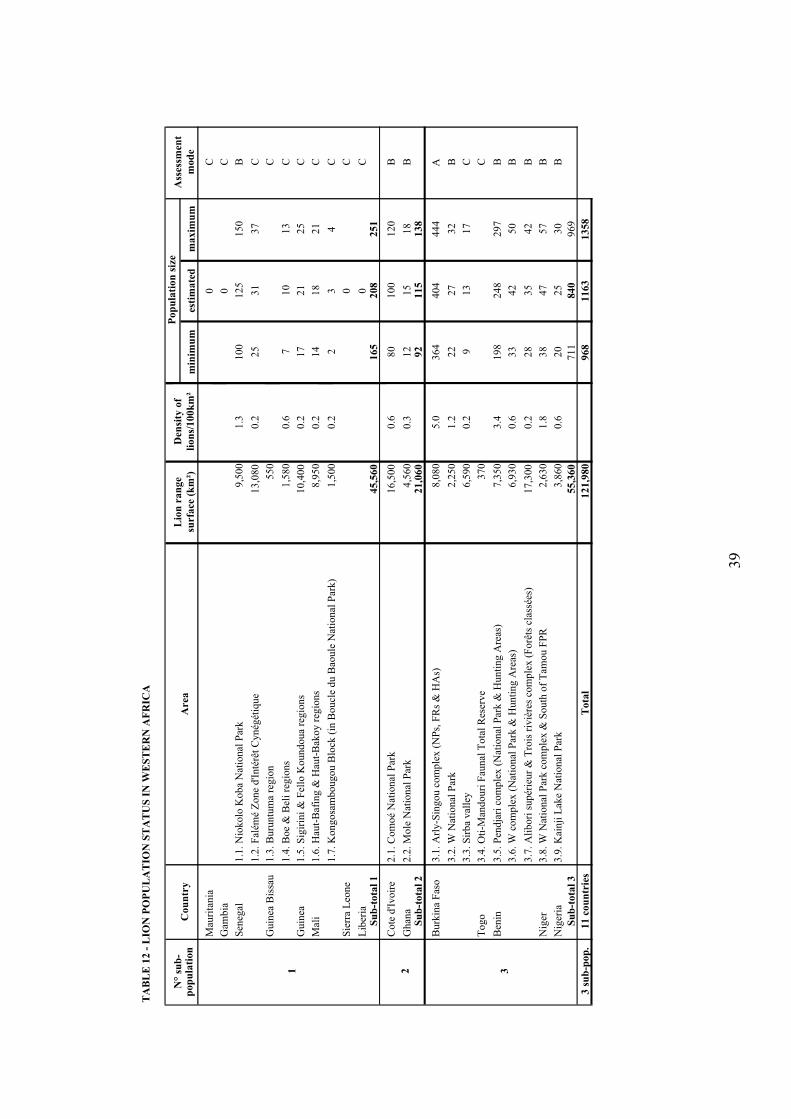
2.2. LION POPULATION SIZE
The evaluation of the lion population in this region relies more on first hand information from
managers and users, rather than on proper census methodology by scientists. Reasons for this
are almost certainly mainly due to:
- The relative low number of Protected Areas, and;
- The few lion studies conducted in these regions.
However, it is estimated that the current lion population size in this region probably stands
higher than one thousand individuals (Table 12).
39
TA
BL
E 1
2 -
LIO
N P
OP
UL
AT
ION
ST
AT
US
IN
WE
ST
ER
N A
FR
ICA
min
imu
mes
tim
ate
dm
ax
imu
m
Mau
rita
nia
0C
Gam
bia
0C
Sen
egal
1.1
.N
iokolo
Koba
Nat
ional
Par
k9,5
00
1.3
100
125
150
B
1.2
.F
além
é Z
one
d'I
nté
rêt
Cynég
étiq
ue
13,0
80
0.2
25
31
37
C
Guin
ea B
issa
u1.3
.B
uru
ntu
ma
regio
n550
C
1.4
.B
oe
&B
eli
regio
ns
1,5
80
0.6
71
01
3C
Guin
ea1.5
.S
igir
ini
& F
ello
Koundoua
regio
ns
10,4
00
0.2
17
21
25
C
Mal
i1.6
. H
aut-
Baf
ing &
Hau
t-B
akoy r
egio
ns
8,9
50
0.2
14
18
21
C
1.7
.K
ongosa
mbougou B
lock
(in
Boucl
e du B
aoule
Nat
ional
Par
k)
1,5
00
0.2
23
4C
Sie
rra
Leo
ne
0C
Lib
eria
0C
Su
b-t
ota
l 1
45,5
60
165
208
251
Cote
d'I
voir
e2.1
.C
om
oé
Nat
ional
Par
k16,5
00
0.6
80
100
120
B
Ghan
a2.2
. M
ole
Nat
ional
Par
k4,5
60
0.3
12
15
18
BS
ub
-tota
l 2
21,0
60
92
115
138
Burk
ina
Fas
o3.1
.A
rly-S
ingou c
om
ple
x (
NP
s,F
Rs
&H
As)
8,0
80
5.0
364
404
444
A
3.2
. W
Nat
ional
Par
k2,2
50
1.2
22
27
32
B
3.3
.S
irba
val
ley
6,5
90
0.2
91
31
7C
Togo
3.4
.O
ti-M
andouri
Fau
nal
Tota
l R
eser
ve
370
C
Ben
in3.5
.P
endja
ri c
om
ple
x (
Nat
ional
Par
k &
Hunti
ng A
reas
)7,3
50
3.4
198
248
297
B
3.6
. W
com
ple
x (
Nat
ional
Par
k &
Hunti
ng A
reas
)6,9
30
0.6
33
42
50
B
3.7
.A
libori
supér
ieur
&T
rois
riviè
res
com
ple
x (
Forê
tscl
assé
es)
17,3
00
0.2
28
35
42
B
Nig
er3
.8.
W N
atio
nal
Par
k c
om
ple
x &
South
of
Tam
ou
FP
R2,6
30
1.8
38
47
57
B
Nig
eria
3.9
.K
ainji
Lak
e N
atio
nal
Par
k3,8
60
0.6
20
25
30
B
Su
b-t
ota
l 3
55,3
60
711
840
969
3 s
ub
-pop
.11 c
ou
ntr
ies
Tota
l121,9
80
968
1163
1358
31
Den
sity
of
lio
ns/
10
0k
m²
Pop
ula
tion
siz
eA
sses
smen
t
mod
e
2
N°
sub
-p
op
ula
tion
Co
un
try
Are
aL
ion
ran
ge
surf
ace
(km
²)

40
SUB-POPULATION N° 1
The sub-population n° 1 used to occur throughout the Western African region and was
certainly historically linked with the sub-populations n° 2 and 3 as shown on the maps by
Bigourdan & Prunier (1937) and Lhote (1951).
This sub-population is extremely important in terms of conservation:
- It is located far from any other lion stronghold;
- There is no realistic eventuality of any natural linkage between this sub-population and
any other stronghold;
- It is not very large in terms of population size, maybe 200 individuals, and;
- It is spread over a large area, maybe close to 5 million hectares.
To be positive, it may be that small pockets of lions have been overlooked and that the global
population size has been underestimated, since this region has not been studied extensively
and accurately.
• Senegal
The lion used to be widespread in Senegal, occurring notably in the Senegal River valley
(Bigourdan & Prunier, 1937; Roure, 1956).
After Independence in the early 1960s, the Niokolo Koba National Park (sub-population n°
1.1) was considered to host about 100 lions (Dupuy, 1972) with an estimated carrying
capacity of 300 lions (Dupuy, 1971). Today, G. Mauvais (pers. comm.) who has been
working in Niokolo Koba N.P. for a number of years estimates the lion population to number
between 100 and 150 in the Park and about a similar number in the hunting area of Falémé
Zone d'Intérêt Cynégétique (sub-population n° 1.2). According to him:
- The lions are more abundant around the periphery of the Park where they are used to
preying on livestock, especially during the rainy season, and;
- The usual size of lion groups observed is 1 to 2 with a maximum of 6 animals seen
together.
Therefore, for Niokolo Koba N.P., this report has retained the conservative figure of 100.
For Falémé Z.I.C., the survey has made its own estimation based on hunting efforts and cross-
referencing, adopting a very conservative figure of about 30 individuals.
• Guinea Bissau
The lion is present in very small numbers in the North-eastern and South-eastern part of the
country:
- In the North-east, according to Ph. Chardonnet (pers. comm.) who worked two years with
cattle-herders in the Regiaõ de Leste, the lion is most probably erratic from Niokolo Koba
complex (sub-population n° 1.3), and;
41
- In the South-east, according to A. Baldé (pers. comm.), a very small population of lion
(maybe 10 individuals) is permanently present in Boé and Beli regions (sub-population n°
1.4).
Incidents of livestock killed by large carnivores are numerous and frequent, but mostly they
are due to spotted hyenas, and sometime even to other ethnic groups disguising cattle robbery
as cattle predation by carnivores (Ph. Chardonnet, pers. comm.).
• Guinea
During their time spent in Guinea, Bigourdan and Prunier (1937) considered the lion as very
abundant and widespread along the Bafing and Tinkisso rivers.
Today, lions are definitely present in the Northern part of the country (sub-population n° 1.5),
although with regional differences (S. Darroze, pers. comm.):
- lions (and hyaenas) seem to be more abundant in the North-western region, which is the
Northern part of the Fouta Djalon massif, on the West bank of the Bafing river, and;
- lions are more scattered in the North-eastern region, which is the Siguiri Préfecture, on
the East bank of the Bafing river.
A preliminary evaluation of the lion population size has been carried out in 2001 by the
Bafing-Falémé transfontier project in a 1.5 million ha area of Northern Guinea (S. Darroze,
pers. comm.). The method used is probably questionable since it transposed East African
procedures with little ajustment to West Africa, e.g. it looks like the average lion group size
set was 6 individuals, a figure much over the observed situation of less than 2 in West Africa.
The results give a country-wide population size of 200-300 lions which is considered as
probably over-estimated (S. Darroze, pers. comm.). Until further data are produced, a more
conservative figure is given by this study.
Predation on livestock is regularly reported and attributed to the lion, although many local
persons appear to mix up the three large predators: lion, leopard and spotted hyaena. Some
ethnic groups do not hunt lions for mystic reasons while others do, and poison is widely used
by cattle breeders. Lions find suitable refuge sites in the "woula" which are uninhabited dense
bush areas also used by prey species including western giant eland (S. Darroze, pers. comm.).
In the the newly established Parc National du Haut Niger (PNHN), in Central Guinea, the
lion is with no doubt present in the Mafou Forest (Brugière et al., 2002) which is rapidly
being colonised by lions after 20 years of absence (Hunter, 2001). According to D. Brugière
(pers. comm.), who works in the PNHN, "the lion is incorrectly listed by Ziegler et al. (2002)
as "a species formerly present [in the PNHN] but now disappeared". Lions were only
occasionally seen in the Park area in the 1980's but they returned in 1997-1998, probably
from an area located about 100 km to the North of the Park, along the Tinkisso river where
this species has always been present. We suspect that this return is a consequence of the Park
creation in January 1997 and the consequent reduction in hunting pressure on the Mafou
forest, which is one of park's core areas (554 km²). A population of resident lions is now well
established in the Northern part of the Park. The number of specimens occurring in the Mafou
forest is unclear but based on field observations a figure of 5-8 individuals seems reasonably
reliable". The same author reports increasing problems with damages by lions to livestock in
the PNHN's buffer zone, especially since the settlement of cattle-herders from Sierra Leone.
As the spotted hyena has been wiped out from the PNHN by farmers over the last ten years,
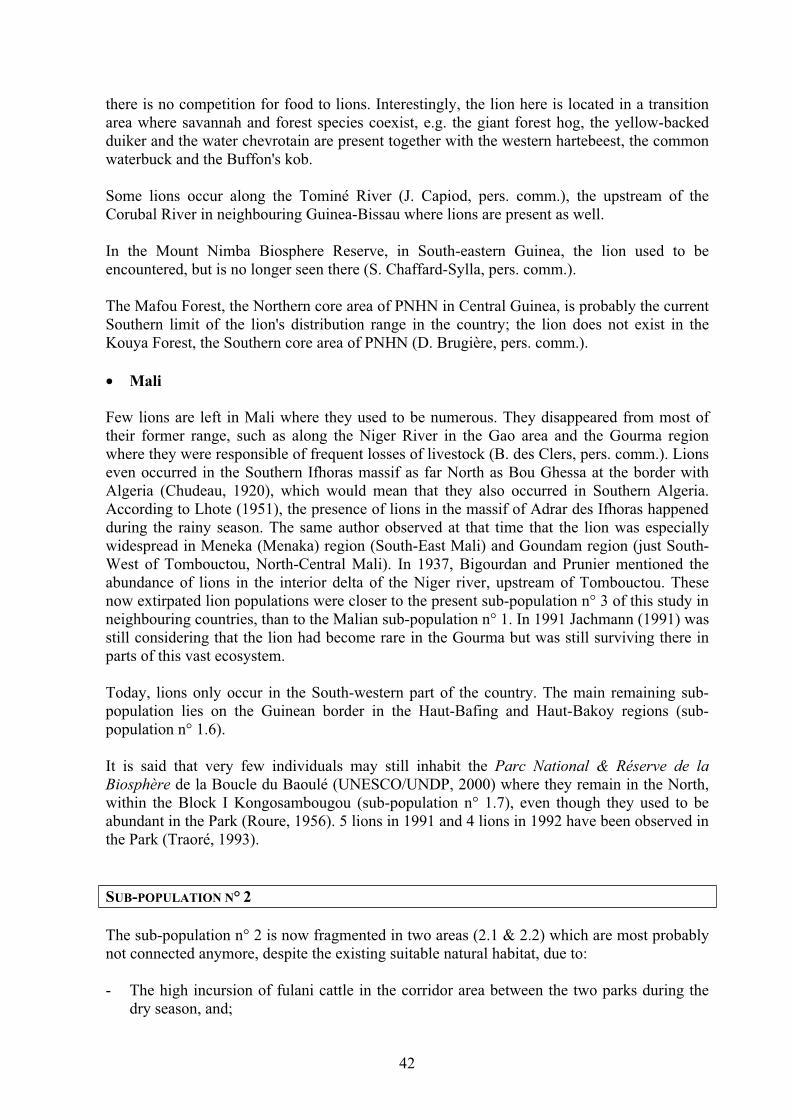
42
there is no competition for food to lions. Interestingly, the lion here is located in a transition
area where savannah and forest species coexist, e.g. the giant forest hog, the yellow-backed
duiker and the water chevrotain are present together with the western hartebeest, the common
waterbuck and the Buffon's kob.
Some lions occur along the Tominé River (J. Capiod, pers. comm.), the upstream of the
Corubal River in neighbouring Guinea-Bissau where lions are present as well.
In the Mount Nimba Biosphere Reserve, in South-eastern Guinea, the lion used to be
encountered, but is no longer seen there (S. Chaffard-Sylla, pers. comm.).
The Mafou Forest, the Northern core area of PNHN in Central Guinea, is probably the current
Southern limit of the lion's distribution range in the country; the lion does not exist in the
Kouya Forest, the Southern core area of PNHN (D. Brugière, pers. comm.).
• Mali
Few lions are left in Mali where they used to be numerous. They disappeared from most of
their former range, such as along the Niger River in the Gao area and the Gourma region
where they were responsible of frequent losses of livestock (B. des Clers, pers. comm.). Lions
even occurred in the Southern Ifhoras massif as far North as Bou Ghessa at the border with
Algeria (Chudeau, 1920), which would mean that they also occurred in Southern Algeria.
According to Lhote (1951), the presence of lions in the massif of Adrar des Ifhoras happened
during the rainy season. The same author observed at that time that the lion was especially
widespread in Meneka (Menaka) region (South-East Mali) and Goundam region (just South-
West of Tombouctou, North-Central Mali). In 1937, Bigourdan and Prunier mentioned the
abundance of lions in the interior delta of the Niger river, upstream of Tombouctou. These
now extirpated lion populations were closer to the present sub-population n° 3 of this study in
neighbouring countries, than to the Malian sub-population n° 1. In 1991 Jachmann (1991) was
still considering that the lion had become rare in the Gourma but was still surviving there in
parts of this vast ecosystem.
Today, lions only occur in the South-western part of the country. The main remaining sub-
population lies on the Guinean border in the Haut-Bafing and Haut-Bakoy regions (sub-
population n° 1.6).
It is said that very few individuals may still inhabit the Parc National & Réserve de la
Biosphère de la Boucle du Baoulé (UNESCO/UNDP, 2000) where they remain in the North,
within the Block I Kongosambougou (sub-population n° 1.7), even though they used to be
abundant in the Park (Roure, 1956). 5 lions in 1991 and 4 lions in 1992 have been observed in
the Park (Traoré, 1993).
SUB-POPULATION N° 2
The sub-population n° 2 is now fragmented in two areas (2.1 & 2.2) which are most probably
not connected anymore, despite the existing suitable natural habitat, due to:
- The high incursion of fulani cattle in the corridor area between the two parks during the
dry season, and;

43
- The Volta Noire (Borongo) river marking the border between the two countries.
This sub-population appears to be the weakest of the Western African region in terms of
global population size.
• Côte d'Ivoire
The lion was formerly widespread in the Northern half of the country, including the so-called
"Baoulé V" at the interface between savannah and forest, where it used to occur in the Lamto
research station. Today, the lion of Côte d'Ivoire (sub-population n° 2.1) currently seems to be
only restricted to the North-eastern savannahs in and around Comoé National Park.
In Comoé NP frequent lion spoor demonstrate a regular presence of the species in the
different ecosystems (Poilecot, 1991). According to Lauginie (1990), most of the lion range
lies in the valleys of the Comoé and the Iringou rivers; it is frequently spoted on the Kongo
plateau, North of Kapkin and at the confluent of the two rivers Comoé and Iringou. In 2002,
lions are regularly observed in the Gawi area and spoors are noticed nearly everywhere in the
park (R. Gilon, pers. comm.). This year, lions have been heard roaring in the Kongo scientific
camp where they had not been heard for years (F. Lauginie, pers. comm.). The population of
the park is estimated at around 100 individuals (J-M. Pavy, pers. comm.).
Few observations of lions have been noted outside Comoé NP:
- in 1994, tracks of a lioness have been seen in the upper Kinkene basin in what is named
the "desert of Kong" west of the park (H. Ressaire, pers. comm.);
- roars and tracks of lions are said to be regularly noticed by villagers in the Monts Tingui
area, South-west of Comoé NP, nearby the formerly mentioned location; a lion pride is
considered as permanent there (S. Diarrassouba, pers. comm.), and;
- a lioness and a cub have been observed in 1999 in the Warigue area, North of Comoé NP;
roaring and footprints of lions are regularly noticed there, and the wildlife in general is
recovering slowly due to better protection (D. Koffi, pers. comm.).
Interestingly, 3 lions have been seen in 1990 in the Odienné region, in North-West Côte
d'Ivoire, close to the border with Guinea and the guinean Réserve Partielle de Faune de
Kankan (S. Roux, pers. comm.; F. N'Golo, pers. comm.). As these lions were much too far
from the Comoé NP lion sub-population n° 2.1, they may have been connected with the sub-
population n° 1.5.
• Ghana
In Ghana (sub-population n° 2.2) the lion is now restricted to the North-western savannahs in
and around Mole National Park.
In early 1990's, the lion population of Mole NP was considered "certainly not high but at least
sufficient to maintain a breeding population. […] It is suggested that the main lion population
in the Mole N.P. is centred around Lovi and Nyanga camps extending towards the Mole River
in the East and South to Brugbani camp and Samole River. There is no doubt that lions,
perhaps in smaller numbers also occur around Gbanwele and Konkori and in the vicinity of
Kwomwoghlugu. As lions are known to be great wanderers they will often travel great
distances and no doubt some individuals also leave the Park from time to time. This
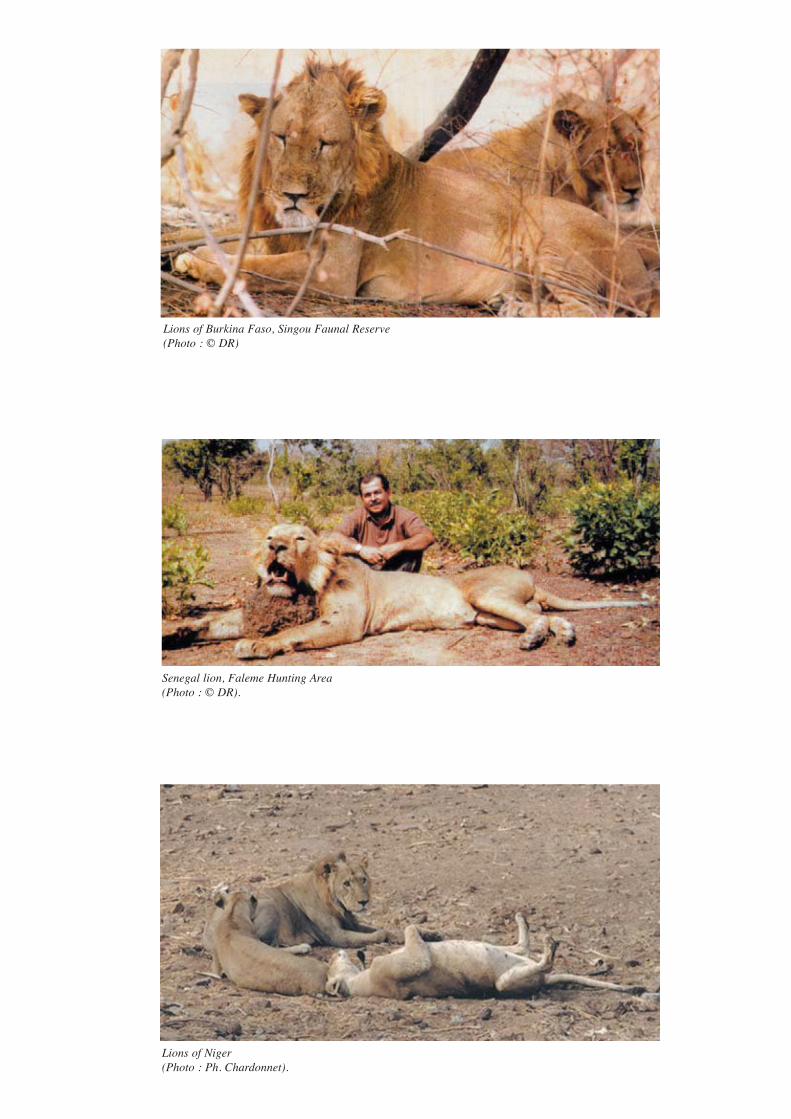
Senegal lion, Faleme Hunting Area (Photo : © DR).
Lions of Niger (Photo : Ph. Chardonnet).
Lions of Burkina Faso, Singou Faunal Reserve (Photo : © DR)

44
movement of lions out of the Park has already been reported by the staff in the Kanato,
Gbanwele and Gbantala camps" (Wilson, 1993). According to the same source, at that time
the largest prides observed were of 8 including 3 cubs, and 7 including 2 cubs.
Today, the lion population size in Mole N.P. is estimated between 15 (B. Chardonnet, pers.
comm., 01.1999) and 50 (Abaka Haizel, pers. comm., 07.2002). The lions are actually rarely
observed but they are heard roaring on a regular basis during surveillance patrols. They rarely
venture outside the limits of the park, however it may eventually happen that some
individuals wander:
- Northwards, close to the border with Burkina Faso: the Northern boundary of Mole NP is
only 80 km away from the Southern boundary of the Nazinga game ranch in Burkina
Faso, and;
- Westards, towards the Côte d'Ivoire border: the Western boundary of Mole NP is only 80
km away from Bouna, the head-quarters of Comoé NP in Côte d'Ivoire.
SUB-POPULATION N° 3
Sub-population n° 3 is the strongest of the West African region with:
- A population size of more than 800 individuals, and;
- A relatively good conservation status.
This sub-population is centred on the Arly-Pendjari-Niger ecosystem, which benefits from a
large complex of Protected Areas. The lion density is locally quite high and may even be
classified in the medium density category (Table 12).
• Burkina Faso
The lion used to be present everywhere in Burkina Faso (Roure, 1956). Today, the lions have
been extirpated from Western and Central Burkina Faso even though some areas such as
Comoé-Leraba or Nazinga reach prey availability levels which could probably sustain lion
populations. The lion population of Burkina Faso is now restricted to the Eastern region,
except for a very small population which remains in the upper basin of the Mouhoun river in
North-western Burkina Faso, close to the border with Mali (Y. Iniyé, pers. comm.). Whether
these few lions are linked to the sub-population n° 1 or n° 2 (or even n° 3) remains doubtful.
The lion population of Eastern Burkina Faso is the most important of the whole Western
Africa region, with possibly as many as 450 individuals.
Lions are quite easy to observe in the Singou-Arly complex (sub-population n° 3.1) where
they reach remarkable densities of about 5 animals per 100 km². This abundance is supported
by a correlated biomass of prey species, for instance roan antelope (Hippotragus equinus), the
second most important prey species of the lion, after buffalo. The correlation between lion
density and roan antelope density is an interesting one: in fact the roan antelope density in the
Singou valley appears to be the highest in Africa (Chardonnet et al., 1999) (Table 13) and the
lion density there is correspondingly the highest in the region. The Protected Areas of the
Pendjari Basin (1.4 million ha) in Burkina Faso and Benin with their abundance of buffalo,

45
roan, hartebeest, etc. are often overlooked but, with the quite high lion densities, they are both
continentally and regionally important.
TABLE 13 - DENSITY OF ROAN ANTELOPE IN AFRICA BY ORDER OF DENSITY (Sources: East,
1998; Chardonnet et al., 1999)
Region Country Area Density (n° of roan/km²)
Lower valley of Singou 1.5Burkina Faso
Eastern Burkina Faso 0.77
Western Africa
Benin Pendjari complex 0.61
Central Africa Cameroon Bénoué N.P. 0.56Western Africa Senegal Niokolo Koba N.P. 0.26
Central Africa Chad Zakouma N.P. 0.23
South Luangwa N.P. 0.20Southern Africa Zambia
North Luangwa N.P. 0.11
Central Africa C.A.R. Manovo Gounda St Floris N.P. 0.09
Zambia Kafue N.P. 0.03Southern Africa
Botswana Northern Botswana 0.02
Eastern Africa Tanzania Ruhaha N.P. 0.01
South Africa Kruger N.P. 0.002Southern AfricaZimbabwe Hwange N.P. 0.005
In W National Park (sub-population n° 3.2), the density of lions is much lower than in Arly,
as is the biomass of prey species.
In the hunting areas surrounding the National Parks (Ougarou, Singou, Pama, Tapoa Djerma,
etc.), the abundance of lions is pretty high. "The tourist hunting quota for lion is set at 20
individuals per year and the offtake averages 12 per year on a repeatable basis; there is no
point to reduce the quota, otherwise the cattle-herders will poison and finish the lions" (Y.
Iniyé, pers. comm.).
The Sirba valley (sub-population n° 3.3) is a little-known non-gazetted area where a small
sub-population of lions remains; these animals are probably connected with the population of
Singou (B. Chardonnet, pers. comm.).
• Benin
In Benin today, lions are only found in the Northern part of the country.
The highest concentration of Benin lions is in the Pendjari ecosystem (sub-population n° 3.5)
with local noticeable densities in Pendjari National Park and surrounding Hunting Areas such
as Porga, Batia and Konkombri.
As with the W National Park in Burkina Faso, the W National Park in Benin faces conflicts
between wildlife and livestock at the expense of taxa such as lions whose population is small
(sub-population n° 3.6).

46
The Forêts Classées (gazetted forests) of Alibori Supérieur and Trois Rivières maybe also
support a small lion population (sub-population n° 3.7). Covering more than half a million
hectares, at least on paper, these Protected Areas probably share their lions with the Kainji
Lake National Park in the neighbouring Nigeria, a National Park which is also more than half
a million hectares in size.
• Niger
The lion was once spread throughout Southern Niger and used to be present as far North as
the Aïr region on a permanent basis (Chudeau, 1920). It used to be common in the Aïr massif
(Bigourdan & Prunier, 1937). "The lion was especially widespread in Adamboukar
(Anderamboukane) region at the border with Mali […]; in Adamboukar in 1939 there were
still a lot of lions” (Lhote, 1951). It was still present some years ago in the Termit massif,
Eastern Niger, from where it has probably been extirpated by local hunters since wildlife is
currently abundant there, not only prey species but also large predators like cheetah (J.
Tubiana, pers. comm.).
Nowadays the lion in Niger is only found in W National Park and surrounding areas (mainly
South of Tamou Partial Faunal Reserve) and its population size is assessed to about 50 (sub-
population n° 3.8) even though some observers mention a population of 80 in W NP (O.
Buttin, pers. comm.). According to Tiega & Price (1995), the lion population size in Niger
reaches a bit less than 100 individuals in the areas of W, Tamou and Sirba.
It must be mentioned that this sub-population n° 3 used to be also present in neighbouring
Mali, in the Gourma region and even as far as Southern Ifhoras Massif (Chudeau, 1920 in Le
Berre, 1990).
• Nigeria
In terms of biodiversity, the Western bank of the Niger river is considered here to belong to
the Western Africa region.
In Western Nigeria, the lion is present in Kainji Lake National Park (sub-population n° 3.9),
mainly in the Borgu sector (the former Borgu Game Reserve established as a Native
Authority Forest reserve in 1961). The remaining population is small in size.
A second population which was not recorded during the map production seems to exist in
Kamuku National Park in North-central Nigeria (J. Rudge, pers. comm.; F. Hurst, pers.
comm.). The area available, although the exact size is not known, is extensive, comprising the
National Park and Kwiambana Game Reserve to the North-west and surrounding Forest
Reserves and grazing reserves. It is said that cattle predation has been reported. According to
J. Rudge (pers. comm.), the population may tentatively consist of 10 individuals and may
even be higher. These have not been included in the population estimate for the country.

47
TA
BL
E 1
4 -
TR
EN
DS
AN
D C
ON
ST
RA
INT
S O
F L
ION
CO
NS
ER
VA
TIO
N I
N W
ES
TE
RN
AF
RIC
A
Co
nse
rva
tio
n
effi
cien
cy
(ra
te 0
to
3)
Sen
egal
1.1
. N
iok
olo
Ko
ba
N.P
.D
SS
XX
2ta
rmac
ro
ad
1.2
. F
além
é Z
.I.C
.D
DD
X0
cott
on
, m
inin
g
Gu
inea
Bis
sau
1.3
. B
uru
ntu
ma
reg
ion
SS
SX
0li
ves
tock
co
mp
etit
ion
1.4
. B
oe
& B
eli
reg
ion
sD
SD
XX
0m
inin
g,
road
Gu
inea
1.5
. S
igir
ini
& F
ello
Ko
un
do
ua
reg
ion
sD
SD
X0
agri
cult
ure
, li
ves
tock
, p
oac
hin
g
Mal
i1
.6.
Hau
t-B
afin
g &
Hau
t-B
ako
y r
egio
ns
DS
DX
0ag
ricu
ltu
re,
liv
esto
ck,
po
ach
ing
1.7
. K
on
go
sam
bo
ug
ou
Blo
ck (
Bo
ucl
e d
u B
aou
le N
.P.)
DD
DX
X1
agri
cult
ure
, li
ves
tock
, p
oac
hin
g
Co
te d
'Iv
oir
e2
.1.
Co
mo
é N
.P.
DS
?S
X2
liv
esto
ck,
po
ach
ing
Ghan
a2.2
. M
ole
N.P
.D
IS
X3
Bu
rkin
a F
aso
3.1
. A
rly
-Sin
go
u c
om
ple
x (
N.P
., F
.R.
& H
.A.)
DD
?S
X2
po
ach
ing
3.2
. W
N.P
.D
DS
XX
0li
ves
tock
3.3
. S
irb
a v
alle
yD
DD
X0
liv
esto
ck
To
go
3.4
. O
ti-M
and
ou
ri F
.T.R
.S
SS
1
Ben
in3
.5.
Pen
dja
ri c
om
ple
x (
N.P
. &
H.A
.)D
SS
X3
po
ach
ing
3.6
. W
co
mp
lex
(N
.P.
& H
.A.)
DD
SX
X1
liv
esto
ck,
po
ach
ing
3.7
. A
lib
ori
su
pér
ieu
r &
Tro
is r
iviè
res
com
ple
xD
SS
/DX
0li
ves
tock
, p
oac
hin
g
Nig
er3
.8.
W N
.P.
com
ple
x &
So
uth
of
Tam
ou
F.P
.R.
DS
SX
2p
oac
hin
g
Nig
eria
3.9
. K
ain
ji L
ake
N.P
.D
DS
X2
po
ach
ing
I =
in
crea
sin
g
S =
sta
ble
D =
dec
reas
ing
Rat
e 0
to
3:
0 =
low
; 3
=h
igh
Ma
in p
rey
fo
r li
on
s
1
Lio
n c
on
serv
ati
on
co
nst
rain
tsL
ion
ha
bit
at
qu
ali
ty t
ren
dC
ou
ntr
yA
rea
Past
Pre
sen
tW
ild
life
Liv
esto
ck
2 3
Lio
n p
op
ula
tio
n t
ren
dN
° su
b-
po
pu
lati
on
48
3. CENTRAL AFRICA
3.1. LION RANGE
In the Central Africa Region, the lion range probably covers an area of more than 65 million
hectares (Table 15):
- About half of the lion range is gazetted as Protected Areas including:
. National Parks: about 10%;
. Reserves: about 4%, and;
. Hunting Areas: approximately more than one third.
- Even though the lion range outside Protected Areas is very difficult to evaluate, non-
gazetted areas probably cover nearly half of the lion range, which appears to be one
of the most characteristic features of the region as far as lion (and large wildlife
including prey species) is concerned.
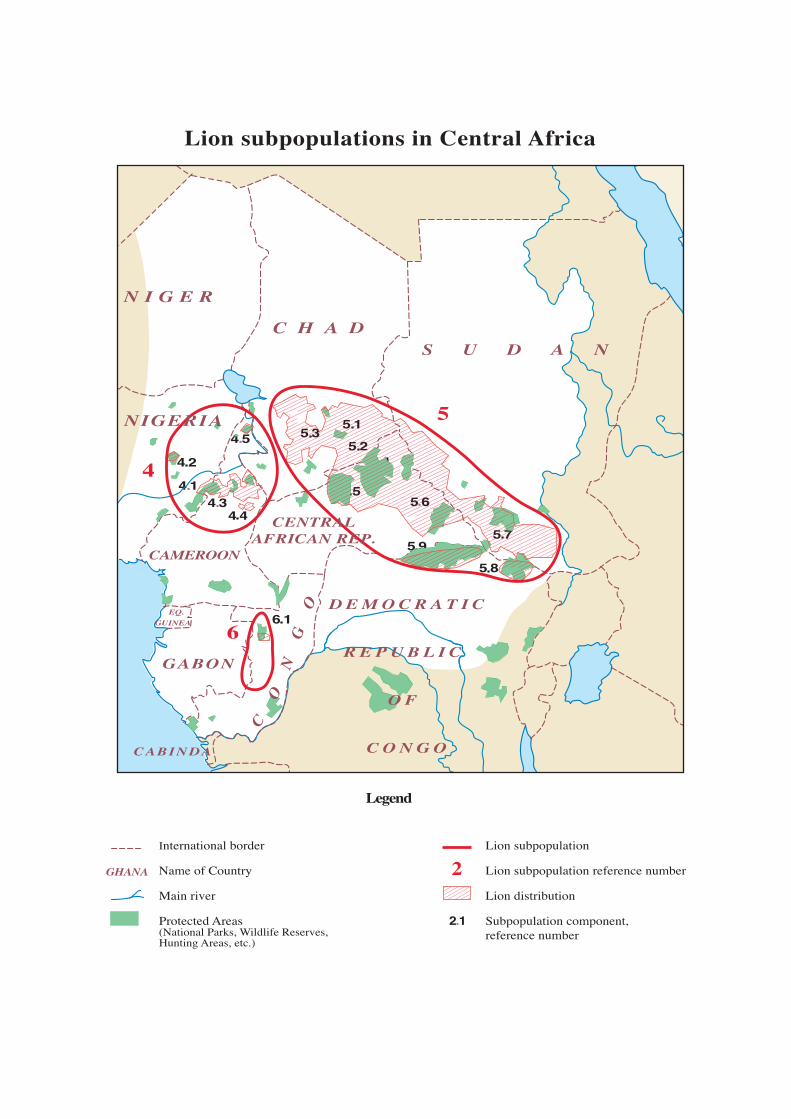

49
TA
BL
E 1
5 -
ST
AT
US
OF
LIO
N D
IST
RIB
UT
ION
AR
EA
S I
N C
EN
TR
AL
AF
RIC
A
Nat.
Park
sR
eser
ves
Hu
nti
ng a
reas
Nig
eria
4.1
. G
ash
aka-
Gu
mti
N.P
. (N
ort
her
n s
ecto
r o
nly
)1
,86
0
4.2
. Y
ankar
i N
.P.
1,9
60
Cam
ero
on
4.3
. F
aro
-Bu
ban
dji
da-
Bén
ou
é co
mp
lex
(N
.P.
& H
.A.)
7,3
00
22
,70
0
4.4
. V
og
zou
m &
Dji
vo
rke
H.A
.3
,82
0
4.5
. W
aza
N.P
.1
,88
0
Su
b-t
ota
l 4
13
,00
00
26
,52
00
Ch
ad5
.1.
Zak
ou
ma
N.P
.2
,40
0
5.2
. A
ou
k H
. A
.6
,00
0
5.3
. G
uer
ra &
Sal
amat
reg
ion
s2
4,8
60
13
8,1
40
C.A
.R.
5.4
. G
ou
nd
a p
lain
(w
ith
in M
ano
vo
-Go
un
da-
St
Flo
ris
N.P
.)8
30
5.5
. M
ano
vo
-Go
un
da-
St
Flo
ris
NP
, B
amin
gu
i-B
ang
ora
n N
P,
San
gb
a P
.Z.
28
96
05
2,5
40
5.6
. Z
on
e d
'In
térê
t C
yn
égét
iqu
e (E
aste
rn C
AR
)1
07
,80
0
Su
dan
5.7
. B
ahr
el G
azal
reg
ion
in
clu
din
g S
ou
ther
n N
.P.
15
,00
01
67
,00
0
R.D
.C.
5.8
. G
aram
ba
N.P
.; A
zan
de,
Gan
gal
a n
a B
od
io &
Mo
nd
o M
issa
D.C
.4
,92
01
0,0
00
5.9
. B
om
u &
Bil
i-U
ere
D.C
.4
5,0
00
Su
b-t
ota
l 5
52
,11
02
4,8
60
22
1,3
40
30
5,1
40
Gab
on
Bat
eke
pla
teau
2,5
00
Co
ng
oB
atek
e p
late
au2
,50
0
6.1
. O
dza
la N
.P.
2,4
45
1,5
55
Su
b-t
ota
l 6
2,4
45
00
6,5
55
km
²6
51
,97
06
7,5
55
24
,86
02
47
,86
03
11
,69
5
%1
04
38
48
Pro
tect
ed a
rea
sA
rea
Con
serv
ati
on
sta
tus
an
d s
urf
ace
(k
m²)
No
n g
aze
tted
are
as
Tota
l
N°
of
sub
-
po
pu
lati
on
Cou
ntr
y
654

50
3.2. LION POPULATION SIZE
For very similar reasons to Western Africa, the evaluation of the lion population size in
Central Africa relies more on first hand information from managers and users than on
systematic counting by scientists. It is considered that the present lion population size in this
region probably reaches a figure of just under 3,000 individuals (Table 16).
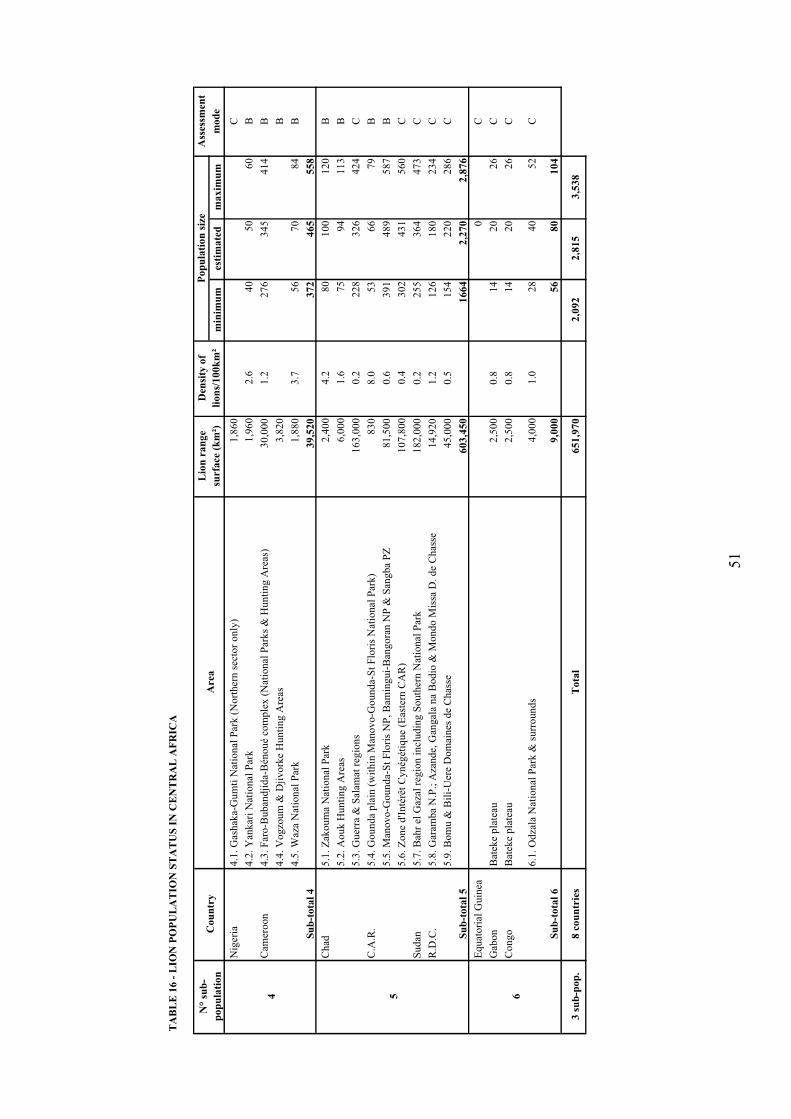
51
TA
BL
E 1
6 -
LIO
N P
OP
UL
AT
ION
ST
AT
US
IN
CE
NT
RA
L A
FR
ICA
min
imu
mes
tim
ate
dm
ax
imu
m
Nig
eria
4.1
. G
ash
aka-
Gu
mti
Nat
ion
al P
ark
(N
ort
her
n s
ecto
r o
nly
)1
,86
0C
4.2
. Y
ank
ari
Nat
ion
al P
ark
1,9
60
2.6
40
50
60
B
Cam
ero
on
4.3
. F
aro
-Bu
ban
dji
da-
Bén
ou
é co
mp
lex
(N
atio
nal
Par
ks
& H
un
tin
g A
reas
)3
0,0
00
1.2
27
63
45
41
4B
4.4
. V
og
zou
m &
Dji
vo
rke
Hu
nti
ng
Are
as3
,82
0B
4.5
. W
aza
Nat
ional
Par
k1
,88
03
.75
67
08
4B
Su
b-t
ota
l 4
39
,52
03
72
46
55
58
Ch
ad5
.1. Z
ako
um
a N
atio
nal
Par
k2
,40
04
.28
01
00
12
0B
5.2
. A
ou
k H
un
tin
g A
reas
6,0
00
1.6
75
94
11
3B
5.3
. G
uer
ra &
Sal
amat
reg
ion
s1
63
,00
00
.22
28
32
64
24
C
C.A
.R.
5.4
. G
ou
nd
a p
lain
(w
ith
in M
ano
vo
-Go
un
da-
St
Flo
ris
Nat
ion
al P
ark
)8
30
8.0
53
66
79
B
5.5
. M
ano
vo
-Go
un
da-
St
Flo
ris
NP
, B
amin
gu
i-B
ang
ora
n N
P &
San
gb
a P
Z8
1,5
00
0.6
39
14
89
58
7B
5.6
. Z
on
e d
'In
térê
t C
yn
égét
iqu
e (E
aste
rn C
AR
)1
07
,80
00
.43
02
43
15
60
C
Su
dan
5.7
. B
ahr
el G
azal
reg
ion
in
clu
din
g S
ou
ther
n N
atio
nal
Par
k1
82
,00
00
.22
55
36
44
73
C
R.D
.C.
5.8
. G
aram
ba
N.P
.; A
zan
de,
Gan
gal
a n
a B
od
io &
Mo
nd
o M
issa
D.
de
Ch
asse
14
,92
01
.21
26
18
02
34
C
5.9
. B
om
u &
Bil
i-U
ere
Do
mai
nes
de
Ch
asse
45
,00
00
.51
54
22
02
86
C
Su
b-t
ota
l 5
60
3,4
50
16
64
2,2
70
2,8
76
Eq
uat
ori
al G
uin
ea0
C
Gab
on
Bat
eke
pla
teau
2,5
00
0.8
14
20
26
C
Co
ng
oB
atek
e p
late
au2
,50
00
.81
42
02
6C
6.1
. O
dza
la N
atio
nal
Par
k &
su
rro
un
ds
4,0
00
1.0
28
40
52
C
Su
b-t
ota
l 6
9,0
00
56
80
10
4
3 s
ub
-pop
.8 c
ou
ntr
ies
Tota
l6
51
,97
02
,09
22
,81
53
,53
8
6
N°
sub
-
po
pu
lati
on
Cou
ntr
yA
rea
4 5
Lio
n r
an
ge
surf
ace
(k
m²)
Den
sity
of
lio
ns/
10
0k
m²
Pop
ula
tion
siz
eA
sses
smen
t
mod
e

52
SUB-POPULATION N° 4
• Nigeria
In terms of biodiversity, the Eastern bank of the Niger river estuary and the Eastern side of
Jos plateau are considered here to belong to the Central African region.
The Northern sector of Gashaka-Gumti National Park may still contain a small population of
lion (sub-population n° 4.1).
A permanent population of lions lives in Yankari National Park (sub-population n° 4.2).
Although the population is small in size, its conservation status is quite good (B. Chardonnet,
pers. comm.).
Maybe a few lions still enter Sambisa Game Reserve in North-eastern Nigeria, coming from
the Faro National Park in the neighbouring Cameroon.
• Cameroon
In Cameroon, the distribution area of the lion has been reduced to the Northern part of the
country, while it used to cover some locations in Southern Cameroon (Vivien, 1991):
- Lion were present in 1935 in the Yaoundé region;
- In the 1970's lion were still present in the Yoko region, and;
- Lions have become rare in 1990 on the Adamaoua Plateau.
Today three areas are identified as having lion in Cameroon, all of them located in the
Northern Province. The species has disappeared from the Far-North Province. The lion is not
present anymore in the Kalamaloue National Park where the last individual was seen in 1979
(J. Thal, pers. comm.). To the South, it has also disappeared from the Adamaoua Plateau.
In the Faro-Bénoué-Bubandjida complex (sub-population n° 4.3.) there is still suitable and
available lion habitat. This 3 million hectares region made of 3 National Parks, numerous
Hunting Blocks and extensive surrounding non-gazetted areas, contains a large number of
suitable prey species such as buffalo, giant eland, roan antelope, hartebeest, 3 kob species,
bushbuck, small size antelopes, wild suids, without forgetting abundant livestock. According
to Dr Jean Ngog Nje (pers. comm.), the former long-standing Director of the Wildlife School
of Garoua, the lion population of the Faro-Bénoué-Bubandjida complex was on the increase
during the years preceding 1997 when he left his position. In the Parc National de la Bénoué,
wildlife censuses have been carried out (Planton, 1999): the population size was 30 lions in
1997 according to Planton (1997) and 22 lions in 1998 according to the WWF-FAC project
(1998), giving densities of 1.7 and 1.2 lions per 100 km² respectively.
The lion population of Waza National Park (sub-population n° 4.5.) has been larger in the
past, about 200 individuals in the 1960’s (Flizot, 1971). Varying estimates are given for the
current Waza lion population of 40 (J. Thal, pers. comm.), 50 (J. Ngog Nje, pers. comm.), 70
(H. Planton, pers. comm.), between 50 and 150 (F. Lamarque, pers. comm.), etc. These lions
regularly move out of the park although staying in its vicinity. The lion has been persecuted to
such an extent that, in the basin, it is now found mainly in the heart of the Protected Areas,
53
including in gazetted Hunting Blocks where they benefit from the protection of safari
operators (J. Thal, pers. comm.).
• Chad
The lion used to cover the entire Southern part of Chad to the point that the present distinct
sub-populations n° 4 and 5 were previously forming a single sub-population.
As far as the sub-population n°4 is concerned, very few lions remain on the Chadian side of
the border. Today, a few lions sometimes cross the Chad border from Cameroon where they
are abundant, notably from Boubandjida National Park and surrounding hunting areas.
The only Protected Area of the region concerned, the Réserve de Faune de Binder-Léré, used
to contain lions. The taxon seems to have been extirpated in 1973 when Thal and
M'Baissekim undertook their preliminary survey before the Reserve was gazetted in 1974
(Féron, 1995).
According to Thal (1973) the inhabitants of Binder Nairi would see lion footprints from time
to time during the rainy season although the animals never settled in the area because,
according to him, prey densities were too low.
SUB-POPULATION N° 5
• Chad
- Northern Chad
The long-standing desertification process and the recurrent cyclical drought phenomena at the
end of the 20th
Century have certainly contributed to the disappearance of lions from areas of
Northern Chad where they used to be established.
According to Jérôme Tubiana (pers. comm.), an ethno-zoologist expert in North-eastern
Chad:
- Until the 1950-60's, lion population was inhabiting the Zaghawa country, especially in the
Kapka mountain range, as well as the South-eastern part of the Ennedi mountain range
(Biltine Préfecture), and;
- Today, the lion has disappeared from the Ennedi, however it is said by local communities
to be still present in small numbers in the Kapka massif around 15° North. Hoinathy
Honimadji (pers. comm.) believes that in Chad, lions still occur as far North as the 15th
parallel and he has seen lions hunting greater Kudus between Biltine and Guéréda, which
is the Southern Kapka massif.
Otherwise, lions may still be present in the Ouaddaï Préfecture where wild prey species are
locally abundant, such as warthog, roan, greater kudu, red-fronted gazelle, korrigum, ostrich,
etc. In 2000, there were numerous official complaints by pastoralists of stock-raiding lions in
the Lake Fitri area, around 13° North, in the Batha Préfecture (Ph. Chardonnet, pers. comm.).

54
- Southern Chad
Today, the distribution range of lion in Chad still remains huge, although lion density is low,
except in a few Protected Areas (Chardonnet & Lamarque, 1997).
In the Lake Chad Basin, the lion used to be very common and was found even at the edge of
the desert as far North as Nguigmi. They used to be common along the rivers Chari, Logone,
Ba-Ili, Bahr Erguig and on the shores of Lake Chad (Jeannin, 1951). Lions are scattered in the
vast pastoral areas, especially in the regions of the Chari, the Logone, the Ba-Illi and the
Mayo Kebbi (Tinan Reouyo, pers. comm.). They prey on both the large herds of livestock and
the remaining wildlife, notably the still abundant warthog populations.
The Salamat Préfecture is certainly the major region for lions in Chad today, mainly in the
two Protected Areas (Parc National de Zakouma and Domaine de Chasse de l'Aouk), but also
outside Protected Areas where difficult access especially during the rainy season helps protect
the lions.
In Zakouma National Park the lion has always been quite easy to see (sub-population n° 5.1).
There has not been any proper lion census there, although several large wildlife counting
operations have been conducted in the last few years, all of them showing a positive trend in
terms of wildlife conservation with increasing populations of lion prey species, within the
limits of Zakouma NP but also outside with a re-colonisation of new territories (MEE et al.,
2001). For instance:
- In ten year period between June 1986 and February 1995, the lelwel hartebeest may have
increased from 600 to 1,700 and the giraffe from 300 to 800 (Dejace et al., 2000), and;
- Buffalo numbers may have increased from 200 in 1986 to 1,000 in 1995 (Dejace et al.,
2000) and 1,500 in 2000 (Planton, 2000 in MEE et al., 2001).
In Zakouma NP, during the dry season, about 60 lions seem to concentrate in the Eastern part
of the park (roughly 1,000 km² for a density of 6 lions/100km²) where most of wildlife preys
reside nearby the bahr water sources (Djadou Moksia, pers. comm.).
In Aouk Domaine de Chasse (17 Hunting Blocks), there are still noticeable numbers of lion
that are not very hard to spot (sub-population n° 5.2). Tourist hunters hunt a few individuals
here. Prey species are locally in good numbers, some buffalo, a few giant eland, numerous
roan and lelwel hartebeest, three species of kob, some korrigum and red-fronted gazelle, many
bushbuck and warthog, etc.
In Central Chad (Guera and Moyen-Chari Préfectures) the lion is definitely present, notably
in the large Siniaka-Minia Réserve de Faune, but also in pastoral rangelands and mountain
ranges outside any Protected Area (sub-population n° 5.3). In Parc National de Manda, the
lion was present on a permanent basis when the prey availability was high twenty years ago.
Formerly created as a Réserve de Faune Régionale in 1951 for the conservation of the giant
eland, then gazetted as a National Park in 1965, the Park was still containing a large
population of giant eland in the 1970's. Today, the giant eland has been virtually extirpated
from the park, just as the lion. Individual lions may appear there temporarily and their
numbers do not exceed 3-5 (Chai, 1996).
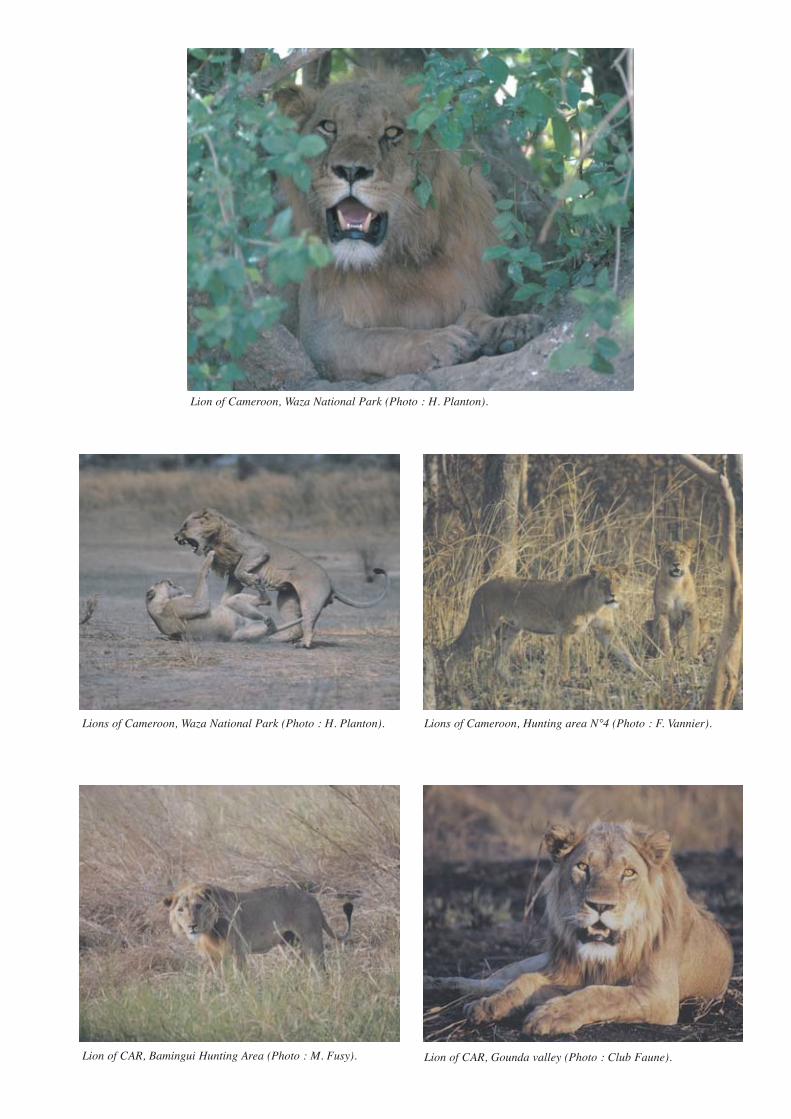
Lion of Cameroon, Waza National Park (Photo : H. Planton).
Lions of Cameroon, Waza National Park (Photo : H. Planton). Lions of Cameroon, Hunting area N°4 (Photo : F. Vannier).
Lion of CAR, Bamingui Hunting Area (Photo : M. Fusy). Lion of CAR, Gounda valley (Photo : Club Faune).

55
• Central African Republic (CAR)
The distribution of lion in CAR used to be widespread and a few decades ago the taxon was
represented everywhere except in the South Western rain forest area. It used to be abundant in
regions were it is now excinct or rare such as the Réserve de Faune de la Nana Barya or even
the surroundings of the capital Bangui, in the regions of Damara, Bossembélé and Boda
(Gauze, 1958).
Very few lion studies have been carried out in this country. One exception must be mentioned
for the Gounda Plain (sub-population n° 5.4) within Parc National de Manovo-Gounda-St
Floris (PNMGSF), where the local lion density is high and probably the highest of the whole
Western and Central African regions (Ruggerio, 1991; B. Chardonnet, pers. comm.; Ph.
Chardonnet, pers. comm.). Consequently, in this study this particular area has been set apart
from the rest of PNMGSF.
In the rest of PNMGSF and in the Parc National de Bamingui-Bangoran as well as in the
Zone Pilote de Sangba and surrounding non-gazetted areas (sub-population n° 5.5), the lion
population size has apparently shown a decline during recent years along with a decreasing
average pride size (J. Lobao Tello, pers. comm.). Possible reasons may be:
(i) The poor conservation status of the formerly abundant prey such as the three
taxa of kob;
(ii) The harassment by nomadic cattle-herders entering the region, including
some of the Protected Areas, during the dry season, and;
(iii) The apparently poor ability of these lions to tackle buffalo as prey (J. Lobao
Tello, pers. comm.); a noticeable number of live buffalo are observed by
Professional Hunters with lion wounds, tending to support a high level of
hunting failure (P. Roulet, pers. comm.);
(iv) The current bush encroachment phenomena may for lions make hunting more
difficult than in formerly more open lanscape (P. Roulet, pers. comm.);
(v) There may be a reproduction problem in lion in this region and an evaluation
study is about to be conducted in this field (A. Iokem, pers. comm.).
According to J. Lobao Tello (PDRN, 2000), the reduction in number of lions would be more
due to ecological factors than to poaching: "there has been an artificial increase of lion
during the former period of heavy poaching (elephant, black rhinoceros and other species),
which was responsible for an outstanding abundance of carcasses with the consequence of an
"explosion" of the lion population and a very high cub survival rate. The reduction of prey
and carcasses left by poaching has directly regulated the lion population as observed today
with an exceptionnaly low cub survival rate and a rarefaction of old lions. One can consider
that the lion population is returning to its natural level, in balance with the environment and
the quite low prey abundance."
The Western limit of sub-population n° 5.5 seems to be located today around the river
Gribingui, the Western border of the Réserve de Faune du Gribingui-Bamingui, while the
Eastern limit may be nearby the Forêt Classée de la Zizi, North of Ouadda, both areas where
lion tracks were spotted in January 2001 (P. Roulet, pers. comm.).
In the huge Zone d'Intérêt Cynégétique or ZIC, which covers the entire Eastern part of the
country, the current lion population remains poorly known but is probably declining following
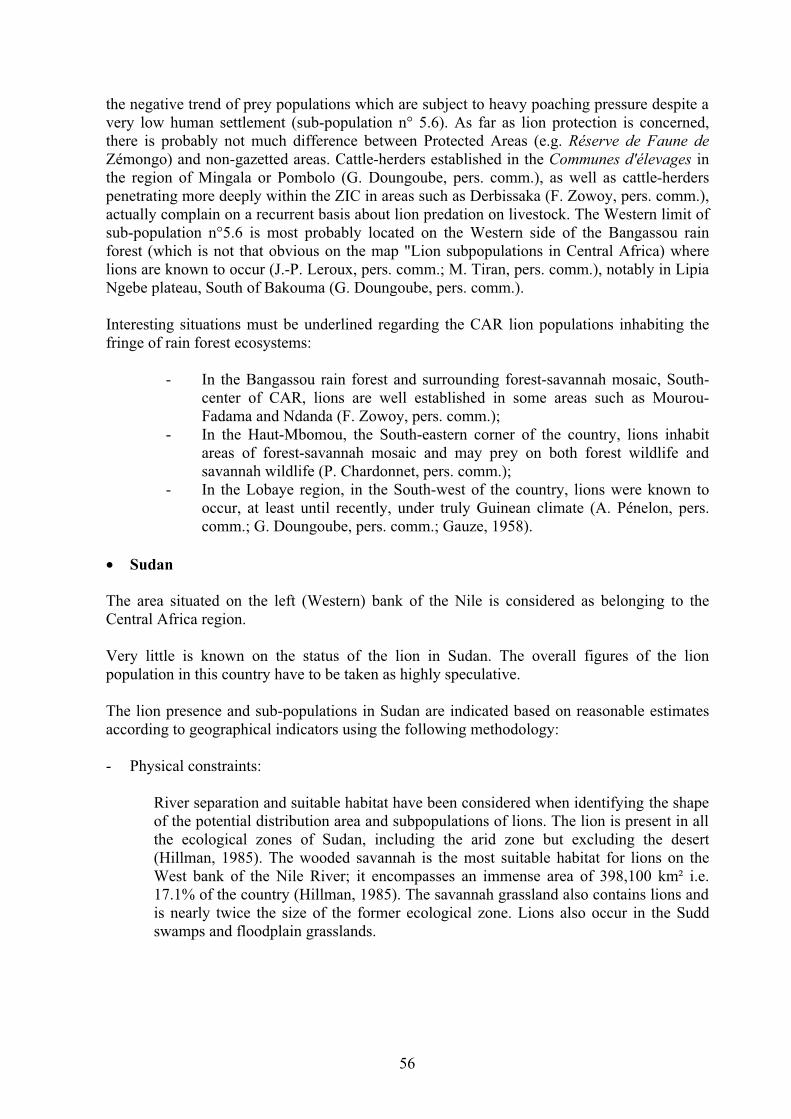
56
the negative trend of prey populations which are subject to heavy poaching pressure despite a
very low human settlement (sub-population n° 5.6). As far as lion protection is concerned,
there is probably not much difference between Protected Areas (e.g. Réserve de Faune de
Zémongo) and non-gazetted areas. Cattle-herders established in the Communes d'élevages in
the region of Mingala or Pombolo (G. Doungoube, pers. comm.), as well as cattle-herders
penetrating more deeply within the ZIC in areas such as Derbissaka (F. Zowoy, pers. comm.),
actually complain on a recurrent basis about lion predation on livestock. The Western limit of
sub-population n°5.6 is most probably located on the Western side of the Bangassou rain
forest (which is not that obvious on the map "Lion subpopulations in Central Africa) where
lions are known to occur (J.-P. Leroux, pers. comm.; M. Tiran, pers. comm.), notably in Lipia
Ngebe plateau, South of Bakouma (G. Doungoube, pers. comm.).
Interesting situations must be underlined regarding the CAR lion populations inhabiting the
fringe of rain forest ecosystems:
- In the Bangassou rain forest and surrounding forest-savannah mosaic, South-
center of CAR, lions are well established in some areas such as Mourou-
Fadama and Ndanda (F. Zowoy, pers. comm.);
- In the Haut-Mbomou, the South-eastern corner of the country, lions inhabit
areas of forest-savannah mosaic and may prey on both forest wildlife and
savannah wildlife (P. Chardonnet, pers. comm.);
- In the Lobaye region, in the South-west of the country, lions were known to
occur, at least until recently, under truly Guinean climate (A. Pénelon, pers.
comm.; G. Doungoube, pers. comm.; Gauze, 1958).
• Sudan
The area situated on the left (Western) bank of the Nile is considered as belonging to the
Central Africa region.
Very little is known on the status of the lion in Sudan. The overall figures of the lion
population in this country have to be taken as highly speculative.
The lion presence and sub-populations in Sudan are indicated based on reasonable estimates
according to geographical indicators using the following methodology:
- Physical constraints:
River separation and suitable habitat have been considered when identifying the shape
of the potential distribution area and subpopulations of lions. The lion is present in all
the ecological zones of Sudan, including the arid zone but excluding the desert
(Hillman, 1985). The wooded savannah is the most suitable habitat for lions on the
West bank of the Nile River; it encompasses an immense area of 398,100 km² i.e.
17.1% of the country (Hillman, 1985). The savannah grassland also contains lions and
is nearly twice the size of the former ecological zone. Lions also occur in the Sudd
swamps and floodplain grasslands.

57
Assuming that lions tend to avoid people, the location and density of villages
(documented on published maps) have been superimposed on the suitable lion habitat
obtained from the above-mentioned exercise. The output provides a rough estimate of
the potential lion range, which still needs to be ascertained and improved. A similar
method has been used by R. Martin (R. Taylor, pers. comm.) to map the leopard
habitat in Sub-Saharan Africa.
According to Hillman (1985), the conservation status of the lion in Sudan is "satisfactory" (at
the time of his publication), which means "reasonable numbers" in his mind. The same author
mentions the presence of lions in all Protected Areas of the country.
Figures have been published of the numbers of wildlife in Sudan, based on a national census
of wild animals including lions conducted from August 1975 to January 1977 on behalf of the
National Livestock Census (Watson et al., 1977 in C. de Jong-Boon & S. Babiker Tabidi,
1985). Watson's estimated the national lion population at 1,610 individuals; however, J.
Hillman suggested that the population is actually more than twice as high as Watson's
estimate (C. de Jong-Boon & S. Babiker Tabidi, 1985).
To the best of the available knowledge, there is no area with high density of lions in the
country. In this survey, all the estimated densities for Sudan have been set below 1 lion/100
km². An average density of 0.2 lion/100 km² has been considered for the entire area of the
sub-population n° 5, even in Protected Areas such as Radom and Southern National Parks.
However, outside villages, huge tracts of suitable habitats for lion exist in the South-western
part of the country with a large proportion of pastoral rangeland.
Lions are reported in the following regions of Southern Kordofan and Southern Darfur
Provinces (El Rayah O. Hassaballa & Mutasim B. Nimir, 1985): Jebel Ed Dair in Central
Kordofan, Radom area, the Garsila and South of Rehied el Bardi area and the areas South of
Abu Matarik, the Jebel Marra area.
According to Sommerlatte (pers. comm.), there may be a few lions (3-5?) in Shambe Game
Reserve, which lies on the west shore of the Nile. These have not been included in the
population size figures.
Bar el Gazal region (sub-population n° 5.7) constitutes a large area of 182,000 km² of which
15,000 km² are gazetted as the Southern National Park. As with much of the information from
Sudan, details are sketchy and this report puts lion densities in this area at a cautious 0.2 per
100 km² with an estimated total population of 364 animals.
- Human constraints:
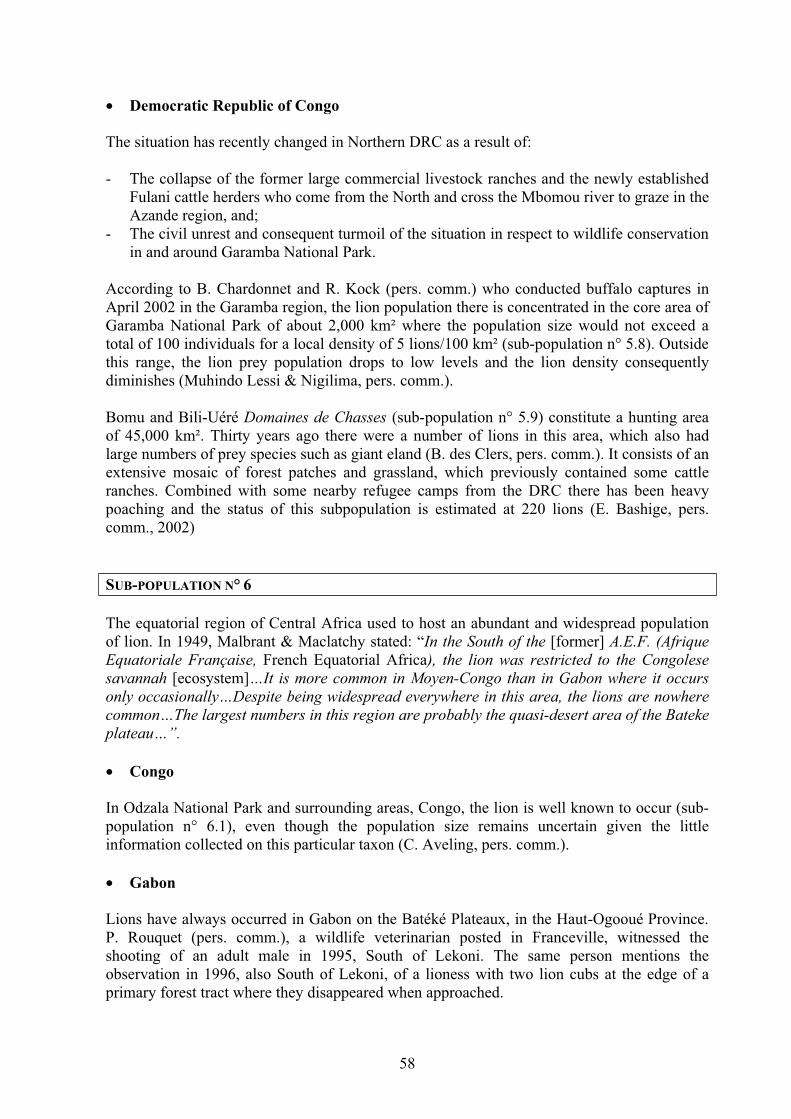
58
• Democratic Republic of Congo
The situation has recently changed in Northern DRC as a result of:
- The collapse of the former large commercial livestock ranches and the newly established
Fulani cattle herders who come from the North and cross the Mbomou river to graze in the
Azande region, and;
- The civil unrest and consequent turmoil of the situation in respect to wildlife conservation
in and around Garamba National Park.
According to B. Chardonnet and R. Kock (pers. comm.) who conducted buffalo captures in
April 2002 in the Garamba region, the lion population there is concentrated in the core area of
Garamba National Park of about 2,000 km² where the population size would not exceed a
total of 100 individuals for a local density of 5 lions/100 km² (sub-population n° 5.8). Outside
this range, the lion prey population drops to low levels and the lion density consequently
diminishes (Muhindo Lessi & Nigilima, pers. comm.).
Bomu and Bili-Uéré Domaines de Chasses (sub-population n° 5.9) constitute a hunting area
of 45,000 km². Thirty years ago there were a number of lions in this area, which also had
large numbers of prey species such as giant eland (B. des Clers, pers. comm.). It consists of an
extensive mosaic of forest patches and grassland, which previously contained some cattle
ranches. Combined with some nearby refugee camps from the DRC there has been heavy
poaching and the status of this subpopulation is estimated at 220 lions (E. Bashige, pers.
comm., 2002)
SUB-POPULATION N° 6
The equatorial region of Central Africa used to host an abundant and widespread population
of lion. In 1949, Malbrant & Maclatchy stated: “In the South of the [former] A.E.F. (Afrique
Equatoriale Française, French Equatorial Africa), the lion was restricted to the Congolese
savannah [ecosystem]…It is more common in Moyen-Congo than in Gabon where it occurs
only occasionally…Despite being widespread everywhere in this area, the lions are nowhere
common…The largest numbers in this region are probably the quasi-desert area of the Bateke
plateau…”.
• Congo
In Odzala National Park and surrounding areas, Congo, the lion is well known to occur (sub-
population n° 6.1), even though the population size remains uncertain given the little
information collected on this particular taxon (C. Aveling, pers. comm.).
• Gabon
Lions have always occurred in Gabon on the Batéké Plateaux, in the Haut-Ogooué Province.
P. Rouquet (pers. comm.), a wildlife veterinarian posted in Franceville, witnessed the
shooting of an adult male in 1995, South of Lekoni. The same person mentions the
observation in 1996, also South of Lekoni, of a lioness with two lion cubs at the edge of a
primary forest tract where they disappeared when approached.

59
TA
BL
E 1
7 -
TR
EN
DS
AN
D C
ON
ST
RA
INT
S O
F L
ION
CO
NS
ER
VA
TIO
N I
N C
EN
TR
AL
AF
RIC
A
pa
stp
rese
nt
wil
dli
feli
ves
tock
Nig
eria
4.1
. G
ash
aka-
Gu
mti
N.P
. (N
ort
her
n s
ecto
r o
nly
)S
SS
X1
4.2
. Y
ank
ari
N.P
.D
SS
X3
Cam
ero
on
4.3
. F
aro
-Bu
ban
dji
da-
Bén
ou
é co
mp
lex
(N
.P.
& H
.A.)
DD
?S
/DX
2p
oac
hin
g,
liv
esto
ck
4.4
. V
og
zou
m &
Dji
vo
rke
H.A
.D
DS
X2
po
ach
ing
4.5
. W
aza
N.P
.D
DS
XX
2p
oac
hin
g
Ch
ad5
.1.
Zak
ou
ma
N.P
.S
IS
X2
5.2
. A
ou
k H
. A
.D
SS
XX
1li
ves
tock
5.3
. G
uer
ra &
Sal
amat
reg
ion
sD
SD
XX
0ag
ricu
ltu
re,
liv
esto
ck
C.A
.R.
5.4
. G
ou
nd
a p
lain
(w
ith
in M
ano
vo
-Go
un
da-
St
Flo
ris
N.P
.)D
DS
X2
po
ach
ing
5.5
. M
ano
vo
-Go
un
da-
St
Flo
ris
NP
, B
amin
gu
i-B
ang
ora
n N
P,
San
gb
a P
.Z.
DD
SX
1&
2p
oac
hin
g,
min
ing
5.6
. Z
on
e d
'In
térê
t C
yn
égét
iqu
e (E
aste
rn C
AR
)D
SS
X0
min
ing
Su
dan
5.7
. B
ahr
el G
azal
reg
ion
in
clu
din
g S
ou
ther
n N
.P.
DD
DX
X0
&1
civ
il u
nre
st
R.D
.C.
5.8
. G
aram
ba
N.P
.; A
zan
de,
Gan
gal
a n
a B
od
io &
Mo
nd
o M
issa
D.C
.S
SS
X0
,1&
2ci
vil
un
rest
5.9
. B
om
u &
Bil
i-U
ere
D.C
.S
DS
X0
civ
il u
nre
st
Gab
on
Bat
eke
pla
teau
DD
SX
0p
oac
hin
g
Co
ng
oB
atek
e p
late
auD
DS
X0
po
ach
ing
6.1
. O
dza
la N
.P.
SS
SX
2
I =
in
crea
sin
g
S =
sta
ble
D =
dec
reas
ing
Rat
e 0
to
3:
0=
low
; 3
=h
igh
5
Co
nse
rva
tio
n
effi
cien
cy
(ra
tin
g 0
to
3)
Lio
n h
ab
ita
t
qu
ali
ty t
ren
d
Lio
n c
on
serv
ati
on
con
stra
ints
6
Are
a
Lio
n p
op
. tr
end
Ma
in p
rey
fo
r li
on
s
Cou
ntr
yN
° su
b-
po
pu
lati
on
4
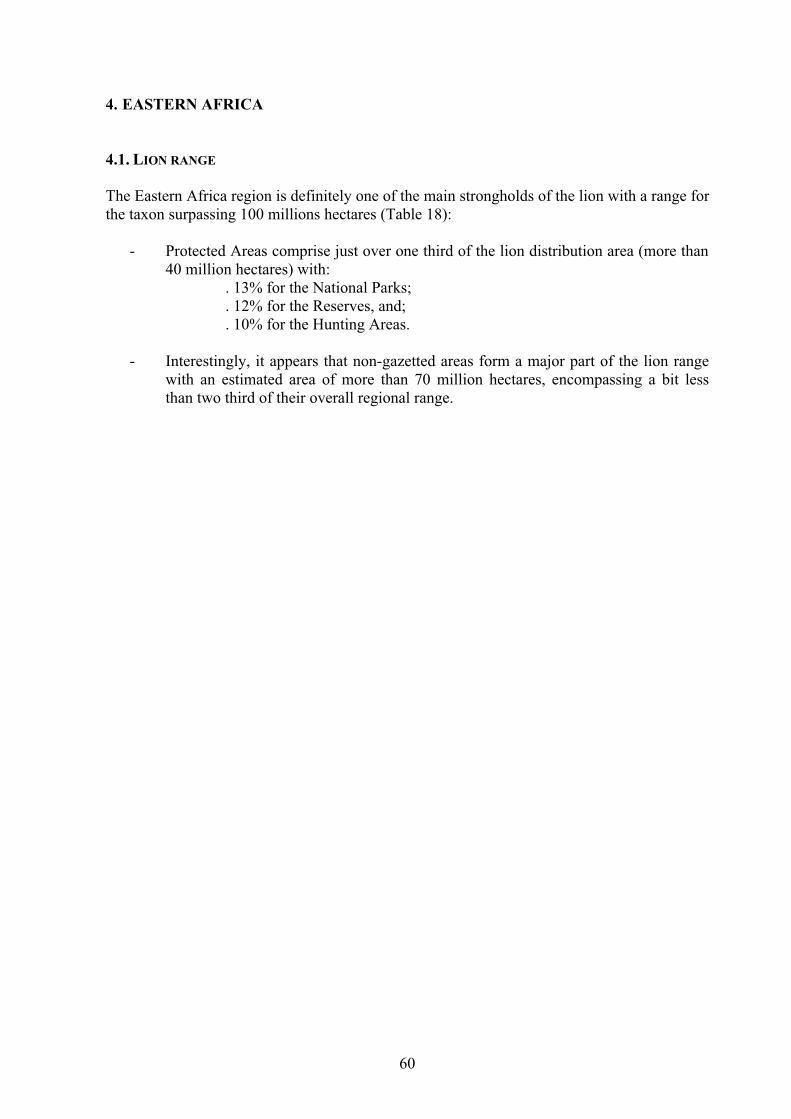
60
4. EASTERN AFRICA
4.1. LION RANGE
The Eastern Africa region is definitely one of the main strongholds of the lion with a range for
the taxon surpassing 100 millions hectares (Table 18):
- Protected Areas comprise just over one third of the lion distribution area (more than
40 million hectares) with:
. 13% for the National Parks;
. 12% for the Reserves, and;
. 10% for the Hunting Areas.
- Interestingly, it appears that non-gazetted areas form a major part of the lion range
with an estimated area of more than 70 million hectares, encompassing a bit less
than two third of their overall regional range.
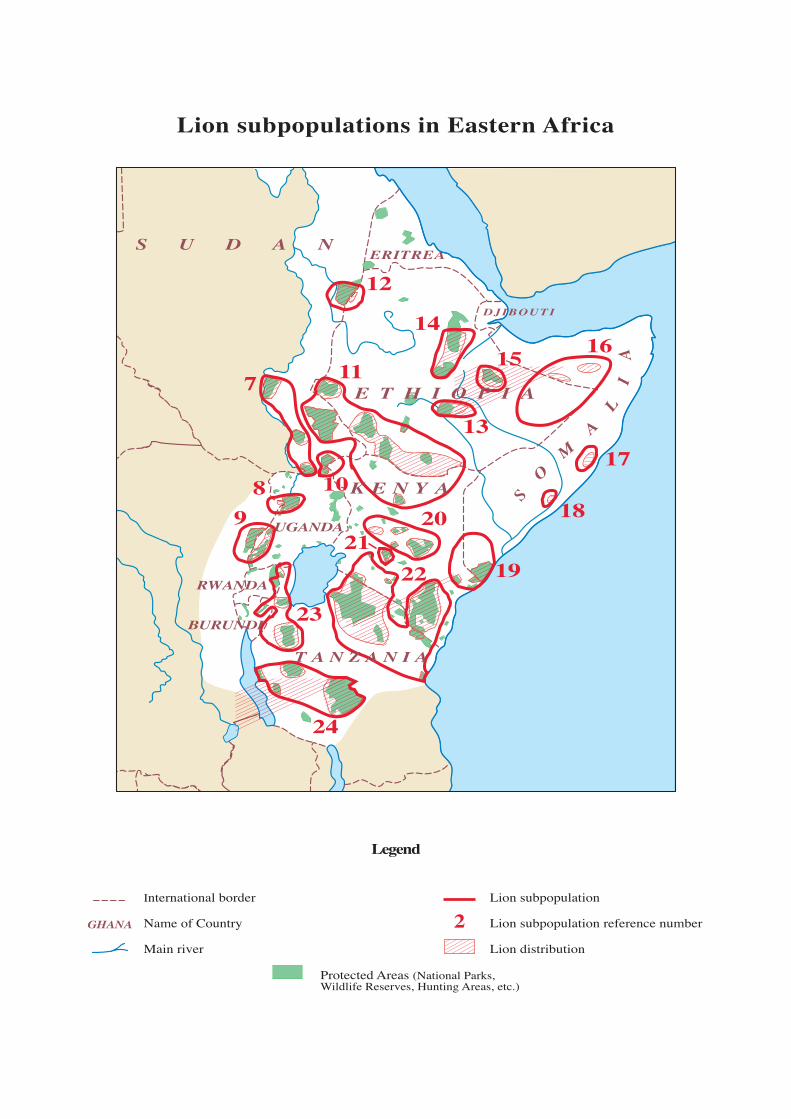
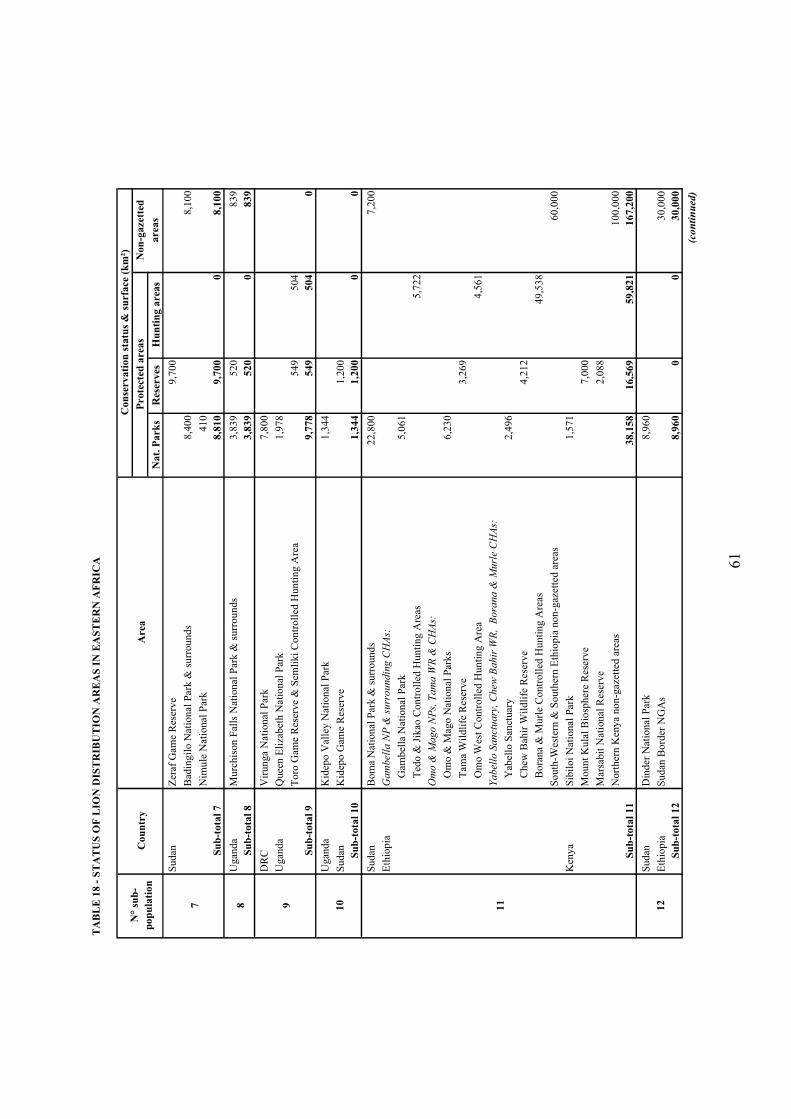
61
TA
BL
E 1
8 -
ST
AT
US
OF
LIO
N D
IST
RIB
UT
ION
AR
EA
S I
N E
AS
TE
RN
AF
RIC
A
Nat.
Park
sR
eser
ves
Hu
nti
ng a
reas
Sudan
Zer
af G
ame
Res
erve
9,7
00
Bad
ing
ilo
Nat
ion
al P
ark
& s
urr
ou
nd
s8
,40
08
,10
0
Nim
ule
Nat
ion
al P
ark
41
0
Su
b-t
ota
l 7
8,8
10
9,7
00
08
,10
0
Ug
and
aM
urc
his
on
Fal
ls N
atio
nal
Par
k &
su
rro
un
ds
3,8
39
52
08
39
Su
b-t
ota
l 8
3,8
39
52
00
83
9
DR
CV
iru
ng
a N
atio
nal
Par
k7
,80
0
Ug
and
aQ
uee
n E
liza
bet
h N
atio
nal
Par
k1
,97
8
To
ro G
ame
Res
erv
e &
Sem
lik
i C
on
tro
lled
Hu
nti
ng
Are
a5
49
50
4
Su
b-t
ota
l 9
9,7
78
54
95
04
0
Ug
and
aK
idep
o V
alle
y N
atio
nal
Par
k1
,34
4
Su
dan
Kid
epo
Gam
e R
eser
ve
1,2
00
Su
b-t
ota
l 10
1,3
44
1,2
00
00
Su
dan
Bo
ma
Nat
ion
al P
ark
& s
urr
ou
nd
s2
2,8
00
7,2
00
Eth
iop
iaG
am
bel
la N
P &
su
rro
un
din
g C
HA
s:
G
amb
ella
Nat
ional
Par
k5
,06
1
T
edo
& J
ikao
Co
ntr
oll
ed H
un
tin
g A
reas
5,7
22
Om
o &
Mago N
Ps,
Tam
a W
R &
CH
As:
O
mo
& M
ago
Nat
ion
al P
ark
s6
,23
0
T
ama
Wil
dli
fe R
eser
ve
3,2
69
O
mo
Wes
t C
on
tro
lled
Hu
nti
ng
Are
a4
,56
1
Ya
bel
lo S
an
ctu
ary
, C
hew
Ba
hir
WR
, B
ora
na
& M
url
e C
HA
s:
Y
abel
lo S
anct
uar
y2
,49
6
C
hew
Bah
ir W
ild
life
Res
erv
e4
,21
2
B
ora
na
& M
url
e C
on
tro
lled
Hu
nti
ng
Are
as4
9,5
38
So
uth
-Wes
tern
& S
ou
ther
n E
thio
pia
no
n-g
azet
ted
are
as6
0,0
00
Ken
ya
Sib
ilo
i N
atio
nal
Par
k1
,57
1
Mo
un
t K
ula
l B
iosp
her
e R
eser
ve
7,0
00
Mar
sab
it N
atio
nal
Res
erv
e2
,08
8
No
rth
ern
Ken
ya
no
n-g
azet
ted
are
as1
00
,00
0
Su
b-t
ota
l 11
38
,15
81
6,5
69
59
,82
11
67
,20
0
Sudan
Din
der
Nat
ion
al P
ark
8,9
60
Eth
iop
iaS
ud
an B
ord
er N
GA
s3
0,0
00
Su
b-t
ota
l 12
8,9
60
00
30
,00
0
(co
nti
nu
ed
)
Con
serv
ati
on
sta
tus
& s
urf
ace
(k
m²)
Pro
tect
ed a
rea
sN
on
-gaze
tted
are
as
N°
sub
-
po
pu
lati
on
Cou
ntr
yA
rea
7 8 10
119 12

62
Eth
iop
iaB
ale
Mo
un
tain
NP
, B
ale
WR
, B
ale
CH
As
& s
urr
ou
nd
s:
B
ale
Mo
un
tain
s N
atio
nal
Par
k2
,47
1
B
ale
Wil
dli
fe R
eser
ve
1,7
66
B
ale
& A
rsi
Co
ntr
oll
ed H
un
tin
g A
reas
15
,16
3
N
on
-gaz
ette
d a
reas
to
th
e S
ou
th1
5,0
00
Su
b-t
ota
l 13
2,4
71
1,7
66
15
,16
31
5,0
00
Eth
iop
iaA
far
Reg
ion
:
A
was
h N
atio
nal
Par
k7
52
Y
ang
ud
i R
assa
Nat
ion
al P
ark
4,7
31
A
was
h W
est
Wil
dli
fe R
eser
ve
1,7
81
A
lled
egh
i W
ild
life
Res
erv
e1
,83
2
G
ewan
e &
Mil
le S
erd
o W
ild
life
Res
erv
es1
1,2
05
A
fdem
Gew
ane
& E
rer
Gew
ane
Contr
oll
ed H
unti
ng A
reas
8,3
18
A
was
h W
est
Co
ntr
oll
ed H
un
tin
g A
rea
9,1
36
A
far
no
n-g
azet
ted
are
as1
5,0
00
Su
b-t
ota
l 14
5,4
83
14
,81
81
7,4
54
15
,00
0
Eth
iop
iaB
ab
ile
Ele
ph
an
t S
an
ctu
ary
& E
ast
ern
Ha
rarg
he
HA
:
B
abil
e E
lep
han
t S
anct
uar
y
6,9
82
E
aste
rn H
arar
gh
e C
on
tro
lled
Hu
nti
ng
Are
a2
3,7
88
N
on
-gaz
ette
d a
reas
to
th
e S
ou
th2
5,0
00
Su
b-t
ota
l 15
6,9
82
02
3,7
88
25
,00
0
So
mal
iaN
og
al V
alle
y r
egio
n2
5,0
00
Hau
d r
egio
n2
,00
0
Eth
iop
iaO
gad
en n
on
-gaz
ette
d a
reas
90
,00
0
Su
b-t
ota
l 16
00
01
17
,00
0
So
mal
iaE
l B
ur
reg
ion
15
,00
0
Su
b-t
ota
l 17
00
01
5,0
00
Som
alia
Sw
amp N
atio
nal
Par
k5
25
Su
b-t
ota
l 18
52
50
00
So
mal
iaB
ush
Bu
sh G
ame
Nat
ion
al P
ark
1,5
10
Bu
sh B
ush
Gam
e C
on
tro
lled
Are
a3
,34
0
Far
Wam
o r
egio
n1
,00
0
Ken
ya
Ara
wal
e N
atio
nal
Res
erve
53
3
Bo
ni,
Do
do
ri &
Kiu
ng
a N
atio
nal
Res
erv
es2
,81
6
Eas
tern
& N
ort
h-E
aste
rn K
eny
a n
on
-gaz
ette
d a
reas
50
,00
0
Su
b-t
ota
l 19
1,5
10
6,6
89
05
1,0
00
(co
nti
nu
ed
)
13
14
15
16
17
18
19

63
Ken
ya
La
ikip
ia r
an
chla
nd
s:
L
ewa
Co
nse
rvan
cy1
82
I
l N
gw
esi
Gro
up
Ran
ch6
7
B
ora
na
Ran
ch1
42
L
aik
ipia
Ran
chin
g &
Wil
dli
fe F
oru
m4
,20
5
Sam
bu
ru,
Sh
aba
& B
uff
alo
Sp
rin
gs
Nat
ion
al R
eser
ves
53
5
Ew
aso
Ny
iro
(S
hab
a to
Mer
ti d
isp
ersa
l ar
ea)
1,3
50
Nan
any
uk
Wid
life
Co
nse
rvat
ion
T
rust
/ S
era-
Mil
gis
are
a3
04
Mer
u N
atio
nal
Par
k8
70
Ko
ra N
atio
nal
Par
k
1,7
88
Bis
anad
i, M
win
gi
& R
aho
le N
atio
nal
Res
erv
es2
,62
1
Su
b-t
ota
l 20
2,6
58
3,1
56
06
,25
0
Ken
ya
Aber
dar
e N
atio
nal
Par
k &
Fau
nal
Res
erve
76
61
,20
0
Su
b-t
ota
l 21
76
61
,20
00
0
Ken
ya
Mas
ai M
ara
Nat
ion
al R
eser
ve
1,6
70
Mas
ai M
ara
gro
up
ran
ches
3,8
90
Mas
ai M
ara
dis
per
sal
area
s5
,00
0
Nai
rob
i N
atio
nal
Par
k1
17
Hel
ls G
ate
Nat
ional
Par
k6
8
Fo
rmer
Ked
on
g R
anch
are
a2
50
Lak
e N
aku
ru N
atio
nal
Par
k1
17
Tsa
vo E
ast
& W
est
Na
tio
na
l P
ark
s &
su
rro
un
din
g a
rea
s:
T
sav
o E
ast
Nat
ion
al P
ark
11
,74
7
T
sav
o W
est
Nat
ional
Par
k9
,06
5
S
ou
th K
itu
i N
atio
nal
Res
erv
e1
,83
3
T
aita
an
d o
ther
ran
ches
13
,18
8
G
alan
a R
anch
4,1
67
Am
bose
li N
atio
nal
Par
k3
92
Ch
yu
lu N
atio
nal
Par
k4
71
Am
bo
seli
dis
per
sal
area
& g
rou
p r
anch
es6
,60
0
Tan
zan
iaM
asa
ila
nd
:
S
eren
get
i, L
ake
Man
yar
a &
Tar
ang
ire
Nat
ion
al P
ark
s1
7,6
83
N
go
ron
go
ro C
on
serv
atio
n A
rea
8,2
92
M
asai
lan
d G
ame
Res
erv
es &
Co
nse
rvat
ion
Are
as1
2,0
35
M
asai
lan
d n
on
-gaz
ette
d a
reas
10
0,0
00
Su
b-t
ota
l 22
39
,66
02
3,8
30
01
33
,09
5
(co
nti
nu
ed
)
21
22
20

64
Tan
zania
Nort
h W
est
Tanza
nia
:
Moyow
osi
-Kig
osi
Gam
e R
eser
ves
& a
djo
inin
g C
onse
rv.
Are
as23,0
00
Bih
arom
olo
-Buri
gi
Gam
e R
eser
ves
2,8
50
Iban
da/
Rum
anyik
a G
ame
Res
erve
1,0
00
N
ort
h-W
este
rn T
anza
nia
non-g
azet
ted a
reas
50,0
00
Rw
anda
Akag
era
Nat
ional
Par
k1,5
00
Buru
ndi
Ruvubu N
atio
nal
Par
k500
Moss
o r
egio
n2,0
00
Su
b-t
ota
l 23
2,0
00
26,8
50
052,0
00
Tan
zania
Cen
tral
and W
este
rn T
anza
nia
:
Ruah
a/R
ungw
a co
mple
x12,9
50
13,0
00
16,0
50
Kat
avi
Nat
ional
Par
k &
adja
cent
PA
s2,2
53
12,7
47
Ugal
la R
iver
Res
erve
& s
urr
oundin
g P
As
7,0
00
Mah
ale
Mts
Nat
ional
Par
k1,2
00
C
entr
al &
Wes
tern
Tan
zania
non-g
azet
ted a
reas
80,0
00
Su
b-t
ota
l 24
16,4
03
32,7
47
096,0
50
km
²1
,13
7,2
05
14
9,3
47
13
9,5
94
11
6,7
30
73
1,5
34
%1
31
21
06
4
(en
d)
24
23
To
tal

65
4.2. LION POPULATION SIZE
The lion population size is much better known and documented in the Eastern African region
than in the two former regions. While this is true for the Protected Areas, especially the
National Parks and a few other Protected Areas such as the Masai Mara National Reserve,
non-gazetted areas remain poorly covered in terms of lion surveys. The estimated total
population of lions in Eastern Africa probably exceeds 15,000 individuals (Table 19).
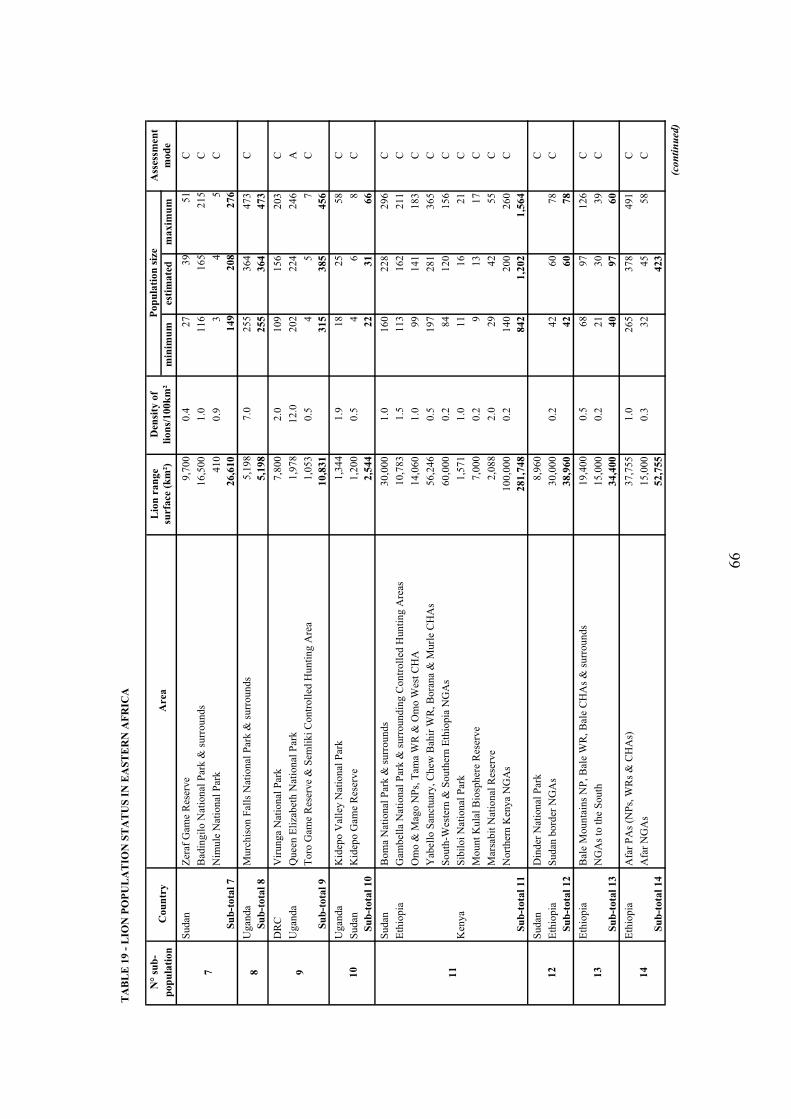
66
TA
BL
E 1
9 -
LIO
N P
OP
UL
AT
ION
ST
AT
US
IN
EA
ST
ER
N A
FR
ICA
min
imu
mes
tim
ate
dm
ax
imu
m
Sudan
Zer
af G
ame
Res
erve
9,7
00
0.4
27
39
51
C
Bad
ing
ilo
Nat
ion
al P
ark
& s
urr
ou
nd
s1
6,5
00
1.0
11
61
65
21
5C
Nim
ule
Nat
ion
al P
ark
41
00
.93
45
C
Su
b-t
ota
l 7
26
,61
01
49
20
82
76
Ug
and
aM
urc
his
on
Fal
ls N
atio
nal
Par
k &
su
rro
un
ds
5,1
98
7.0
25
53
64
47
3C
Su
b-t
ota
l 8
5,1
98
25
53
64
47
3
DR
CV
iru
ng
a N
atio
nal
Par
k7
,80
02
.01
09
15
62
03
C
Ug
and
aQ
uee
n E
liza
bet
h N
atio
nal
Par
k1
,97
81
2.0
20
22
24
24
6A
To
ro G
ame
Res
erv
e &
Sem
lik
i C
on
tro
lled
Hu
nti
ng
Are
a1
,05
30
.54
57
C
Su
b-t
ota
l 9
10
,83
13
15
38
54
56
Ug
and
aK
idep
o V
alle
y N
atio
nal
Par
k1
,34
41
.91
82
55
8C
Su
dan
Kid
epo
Gam
e R
eser
ve
1,2
00
0.5
46
8C
Su
b-t
ota
l 10
2,5
44
22
31
66
Su
dan
Bo
ma
Nat
ion
al P
ark
& s
urr
ou
nd
s3
0,0
00
1.0
16
02
28
29
6C
Eth
iop
iaG
amb
ella
Nat
ion
al P
ark
& s
urr
ou
nd
ing
Co
ntr
oll
ed H
un
tin
g A
reas
10
,78
31
.51
13
16
22
11
C
Om
o &
Mag
o N
Ps,
Tam
a W
R &
Om
o W
est
CH
A14,0
60
1.0
99
14
11
83
C
Yab
ello
San
ctu
ary
, C
hew
Bah
ir W
R,
Bo
ran
a &
Mu
rle
CH
As
56
,24
60
.51
97
28
13
65
C
So
uth
-Wes
tern
& S
ou
ther
n E
thio
pia
NG
As
60
,00
00
.28
41
20
15
6C
Ken
ya
Sib
ilo
i N
atio
nal
Par
k1
,57
11
.01
11
62
1C
Mo
un
t K
ula
l B
iosp
her
e R
eser
ve
7,0
00
0.2
91
31
7C
Mar
sab
it N
atio
nal
Res
erv
e2
,08
82
.02
94
25
5C
Nort
her
n K
enya
NG
As
10
0,0
00
0.2
14
02
00
26
0C
Su
b-t
ota
l 11
28
1,7
48
84
21
,20
21
,56
4
Sudan
Din
der
Nat
ional
Par
k8
,96
0C
Eth
iop
iaS
ud
an b
ord
er N
GA
s3
0,0
00
0.2
42
60
78
C
Su
b-t
ota
l 12
38
,96
04
26
07
8
Eth
iop
iaB
ale
Mo
un
tain
s N
P,
Bal
e W
R,
Bal
e C
HA
s &
su
rro
un
ds
19
,40
00
.56
89
71
26
C
NG
As
to t
he
So
uth
15
,00
00
.22
13
03
9C
Su
b-t
ota
l 13
34
,40
04
09
76
0
Eth
iop
iaA
far
PA
s (N
Ps,
WR
s &
CH
As)
37
,75
51
.02
65
37
84
91
C
Afa
r N
GA
s15,0
00
0.3
32
45
58
C
Su
b-t
ota
l 14
52
,75
54
23
(co
nti
nu
ed
)
Ass
essm
ent
mod
e
N°
sub
-
pop
ula
tion
Cou
ntr
yA
rea
Lio
n r
an
ge
surf
ace
(k
m²)
Den
sity
of
lio
ns/
10
0k
m²
Pop
ula
tion
siz
e
7 14
128 109 11
13

67
Eth
iop
iaB
abil
e E
lep
han
t S
anct
uar
y &
Eas
tern
Har
arg
he
CH
A3
0,7
70
1.0
21
03
00
39
0C
NG
As
to t
he
So
uth
25
,00
00
.23
55
06
5C
Su
b-t
ota
l 15
55
,77
02
10
30
03
90
So
mal
iaN
og
al V
alle
y &
Hau
d r
egio
n2
7,0
00
0.3
48
68
88
C
Eth
iop
iaO
gad
en N
GA
s9
0,0
00
0.2
35
18
06
5C
Su
b-t
ota
l 16
11
7,0
00
83
24
81
53
So
mal
iaE
l B
ur
reg
ion
15
,00
00
.99
01
28
16
6C
Su
b-t
ota
l 17
15
,00
09
01
28
16
6
Som
alia
Sw
amp N
atio
nal
Par
k5
25
4.0
15
21
27
C
Su
b-t
ota
l 18
52
52
1
So
mal
iaB
ush
Bu
sh G
ame
NP
, B
ush
Bu
sh C
HA
&
Far
Wam
o r
egio
n5
,85
03
.41
39
19
92
59
C
Ken
ya
Bo
ni
& D
od
ori
Nat
ion
al R
eser
ves
2,2
16
3.3
52
74
96
C
Ara
wal
e &
Kiu
nga
NR
s; E
aste
rn &
Nort
h-E
aste
rn N
GA
s51,1
33
0.2
70
10
21
30
C
Su
b-t
ota
l 19
59
,19
91
91
27
33
55
Ken
ya
Lai
kip
ia r
anch
lan
ds
4,5
96
5.7
21
12
64
31
7B
Sam
bu
ru,
Sh
aba
& B
uff
alo
Sp
rin
gs
Nat
ion
al R
eser
ves
& s
urr
ou
nd
s2
,18
94
.56
99
81
27
B
Mer
u &
Ko
ra N
atio
nal
Par
ks
& a
djo
inin
g N
Rs
5,2
79
1.2
52
65
78
B
Su
b-t
ota
l 20
12
,06
43
32
42
75
22
Ken
ya
Ab
erd
are
Nat
ion
al P
ark
& F
aun
al R
eser
ve
1,9
66
8.2
11
31
62
21
1C
Su
b-t
ota
l 21
1,9
66
13
01
62
19
4
Ken
ya
Mas
ai M
ara
Nat
ion
al R
eser
ve
& s
urr
ou
nd
ing
are
as1
,67
03
2.8
49
25
47
60
2A
Mas
ai M
ara
gro
up
ran
ches
3
,89
08
.22
82
31
94
22
B
Mas
ai M
ara
dis
per
sal
area
s 5
,00
01
.53
57
56
5C
Nai
rob
i N
atio
nal
Par
k1
17
18
.82
02
22
4A
Hel
ls G
ate
Nat
ion
al P
ark
& F
orm
er K
edo
ng
Ran
ch a
rea
31
82
.87
91
1B
Lak
e N
aku
ru N
atio
nal
Par
k1
17
31
.23
33
74
1A
Tsa
vo
Eas
t &
Wes
t N
atio
nal
Par
ks
& s
urr
ou
nd
ing
are
as4
0,0
00
1.9
60
07
50
90
0B
Am
bo
seli
& C
hy
ulu
Nat
ion
al P
ark
s &
su
rro
un
din
g a
reas
7,4
63
1.7
11
71
30
14
3A
Tan
zan
iaS
eren
get
i, M
any
ara,
Tar
ang
ire
Nat
ion
al P
ark
s &
Ng
oro
ng
oro
CA
25
,97
51
5.0
3,1
17
3,8
96
4,6
75
B
Mas
aila
nd
Gam
e R
eser
ves
& G
ame
Co
nse
rvat
ion
Are
as1
2,0
35
2.0
12
72
41
23
5C
Mas
aila
nd
NG
As
10
0,0
00
0.3
16
83
00
31
2C
Su
b-t
ota
l 22
4,4
37
19
6,5
85
4,9
98
6,3
16
7,4
30
(co
nti
nu
ed
)
19
20
21
22
16
17
15
18

68
Tan
zan
iaM
oy
ow
osi
-Kig
osi
Gam
e R
eser
ves
& a
djo
inin
g G
CA
s2
3,0
00
2.0
32
24
60
59
8C
Bih
aram
olo
-Bu
rig
i G
ame
Res
erv
es2
,85
02
.04
05
77
4C
Iban
da/
Ru
man
yik
a G
ame
Res
erv
es1
,00
02
.01
42
02
6C
No
rth
-Wes
tern
Tan
zan
ia N
GA
s5
0,0
00
0.2
70
10
01
30
C
Rw
and
aA
kag
era
Nat
ion
al P
ark
1,5
00
3.0
32
45
59
C
Bu
run
di
Ru
vu
bu
Nat
ion
al P
ark
50
0C
Mo
sso
reg
ion
2,0
00
C
Su
b-t
ota
l 23
63
78
0,8
50
47
76
82
88
7
Tan
zan
iaR
uah
a/R
un
gw
a co
mp
lex
42
,00
08
.02
,35
23
,36
04
,36
8C
Kat
avi
Nat
ion
al P
ark
& a
dja
cen
t P
As
15
,00
04
.04
20
60
07
80
C
Ug
alla
Riv
er R
eser
ve
& s
urr
ou
nd
ing
PA
s7
,00
04
.01
96
28
03
64
C
Mah
ale
Mts
Nat
ion
al P
ark
1,2
00
1.5
13
18
23
C
Cen
tral
& W
este
rn T
anza
nia
NG
As
80,0
00
0.2
11
21
60
20
8C
Su
b-t
ota
l 24
4,4
18
14
5,2
00
3,0
93
4,4
18
5,7
43
18 s
ub
-pop
.9 c
ou
ntr
ies
Tota
l1
,13
7,2
05
11
,26
81
5,7
44
18
,81
1
(en
d)
24
23

69
SUB-POPULATION N° 7
• Sudan
The area situated on the right (Eastern) bank of the Nile is considered as belonging to the
Eastern Africa region.
Once again, the overall figures of the lion population in this country have to be taken as
highly speculative. Among the eight individuals contacted for this survey, due to poor
communications, accessibility, etc. only one was able to provide estimates.
The continuing civil war in the South has adversely affected wildlife in general, including
lions. Most parks have been overrun by pastoralists and/or farmers (M. Sommerlatte, pers.
comm.; A. Radcliffe, pers. comm.).
In South Sudan, the lion is distributed in nearly all National Parks, Game Reserves and some
of the Hunting Blocks, and it is found in all types of habitats such as open and wooded
grasslands, forest and rocky hills (Kenyi, 1985).
In the Upper Nile region, the lion is present in the Provinces of Sobat, Unity as well as Jonglei
(Dennis Akwoch Obat, 1985).
SUB-POPULATION N° 8
• Uganda
Murchison Falls National Park (formerly Kabalega Falls National Park) is supposed to hold
between 200 and 300 lions at present (A. Radcliffe, pers. comm.; R. Lamprey, pers. comm.).
Movements of lions from this park to the neighbouring DRC (Ituri Province, Monts Bleus)
are unlikely given the geographical constraints (a lake and a river).
Overall, the total estimate of 500-600 lions for Uganda seems reasonable (A. Radcliffe, pers.
comm., R. Lamprey, pers. comm.).
SUB-POPULATION N° 9
• Democratic Republic of Congo
Even though the DRC, as a country, belongs to the Central African Region, Eastern lion
populations of the DRC have been incorporated into the Eastern Africa region because they
are historically connected with lion populations of Eastern Africa and not with those of
Central Africa. Recent political turmoil in the region must put the continued well-being and
the future of these lions in question.
In the Virunga National Park, consisting of 7,800 km², the La Rwindi plains section of the
Park is a most suitable habitat for lions (Ph. Chardonnet, pers. comm., 2002). The Park is

70
thought to have between 100 and 200 lions (156; E. Bashige, pers. comm., 2002) which are
however facing an uncertain future mostly as a result of political instability in the region.
• Uganda
The lions of Queen Elizabeth National Park (formerly, Ruwenzori National Park) have been
extensively studied in the past (inter alia: Din, 1978; Van Orsdol, 1981, 1982) and currently
as part of the LPP predator & scavenger project.
In 1998 the population of lions in Queen Elizabeth National Park ranged between 160 and
210 individuals for an overall density of 12 lions/100 km² (Dricucu, 1999). Today, according
to a survey conducted more recently, there may be as many as 300 lions (Lamprey, 2000; R.
Lamprey, pers. comm.; A. Radcliffe, pers. comm.). The population has been increasing over
several years following better protection and greater prey availability. The reproductive
potential of the lionesses has been studied and has been found good (Dricuru, 2000). In this
Park, the pride size varies between 2 and 23 with an average of 9.5 (Dricucu, 1999).
The health status of lions in Queen Elizabeth National Park has been studied. Serological
surveys have been conducted and found evidence of antibodies (Dricuru, 2000) given below:
- In lions (n=9): significant seroprevalence in lions for FIV, FcaV and FeHV; low
seroprevalence for CDV and FPV, and;
- In domestic cats: high seroprevalence for FcaV, FeHV and FIP, no seroprevalence for
CDV and FPV
It must be re-emphasised that the presence of antibodies does not mean that animals are sick.
"We don't have evidence so far that lions are disappearing in alarming numbers due to cat-
AIDS" (Siefert, 2000).
Vaccination of domestic dogs and cats in the vicinity of Queen Elizabeth NP was carried out
to help prevent the spread of CDV and rabies in wild carnivores. Bovine tuberculosis is also
known to occur, at least in buffalo, for many years in Queen Elizabeth NP (M. Woodford,
pers. comm.), even though it has not yet been observed in lion there (Siefert, 2000).
Conflicts with neighbouring communities and their livestock are common, and a number of
lions have been poisoned. Other threats to lions are armed conflicts on the DRC border (R.
Lamprey & A. Radcliffe, pers. comm.)
Toro Game Reserve and Semliki Controlled Hunting Area have a gradually increasing lion
population over recent years, possibly due to an influx from the Congo where they had been
poisoned some years previously. This is largely due to increased protection (R. Lamprey & A.
Radcliffe, pers. comm.).

71
SUB-POPULATION N° 10
• Sudan
The continuing civil war in the South has adversely affected wildlife in general, including
lions. Most parks have been over run by pastoralists and/or farmers. (M. Sommerlatte, pers.
comm.; A. Radcliffe, pers. comm.).
• Uganda
Among threats to lions in Uganda are armed conflicts on the Sudanese border, and infected
livestock from South Sudan moving into Kidepo Valley National Park and apparently
poisoning incidents as a result of stock raiding. The sub-population appears to be increasing at
least in Kidepo Valley NP (R. Lamprey, pers. comm.; A. Radcliffe, pers. comm.).
SUB-POPULATION N° 11
• Sudan
Preliminary surveys are underway in Boma National Park, and others are planned (M.
Sommerlatte, pers. comm.). However, this survey has no information on lions there.
• Ethiopia
It is worth mentioning that information on Ethiopia is hard to obtain and accurate information
even harder. The present study has shown large discrepancies between the figures provided by
sources, with up five-fold variance in estimates for the country as a whole. For instance two
sources produced very different estimates of (i) 900 to 1050 lions, certainly unlikely to exceed
1,500 (A. Racliffe, pers. comm., 2002) and (ii) a “speculated” population of “roughly” 4,900
lions in total (Y.D. Abebe & T. Mattanovich, pers. comm., 2002). Both figures are useful
considering the paucity of information and the respondents must be respected for bravely
making a considered guess in the absence of any other data. In the case of sub-population n°11 it exists in a very large area encompassing a number of National Parks, Controlled Hunting
Areas (73,889 km²), and non-gazetted areas (67,200 km²) creating a total area of 141,000 km²
which is estimated to hold a population of over 700 lions. These figures however, both the
area and population estimates, must be treated with the utmost caution.
• Kenya
In the Northern Kenya, lions are present, but scattered in low densities. However, very little is
known about the lions in this region. A figure of 180 lions has been tentatively suggested for
an area of 185,000 km² (Radcliffe, pers. comm.) but should be treated with caution.

72
SUB-POPULATION N° 12
• Sudan
The lion is reported in Dinder National Park (Ernst & Elwasila, 1985) and in the adjacent
Rahad Game Reserve (Mahgoub A., El Badawi & Salah A. Hakim, 1985). The IUCN
Directory of Afrotropical Protected Areas (IUCN, 1987) mentions lions in Dinder NP.
However, no recent information has been received on the lion numbers in this area.
In the late 1970's and early 1980's, a great deal of wildlife research effort in Sudan had been
concentrated in Dinder National Park as it was considered as the most important wildlife area
in Northern Sudan, even though the Park had to face tremendous pressures from entrance of
livestock for grazing, mechanized cultivation in the wet season, felling of trees and poaching
(El Gaily O. Ahmed et al., 1985). However, the current situation is not clear.
• Ethiopia
There is no written record of lion on the Ethiopian side of the border, opposite to Dinder NP
to the available knowledge. However, T. Mattanovich (pers. comm.) considers that lions are
frequent nearly all along the Sudan-Ethiopian sides.
SUB-POPULATION N° 13
• Ethiopia
Little is known about this sub-population of lions. Much of their range falls within the
protected area system, Bale Mountains National Park, Bale Wildlife Reserve and Bale and
Arsi Controlled Hunting areas totalling approximately 19,400 km² and non-gazetted areas to
the South totalling approximately 15,000 km². An estimated population size of 97 and 30
individuals is given for the two areas respectively, but again it should be treated with caution.
The population is “disjointed” and may merge with the Wabi Shabelle sub-population (sub-
population n° 15). Poaching and the presence of livestock are threats to their existence. While
the habitat remains stable the lion populations may be stable or declining (S. Williams, pers.
comm.).
SUB-POPULATION N° 14
• Ethiopia
In Ethiopia, there appear to be several places where lions are regularly seen. The Afar region
in the North-eastern part of the country is one of them (Y.D. Abebe & T. Mattanovich, pers.
comm.).
"[In Tellalak-Dawe and Fursi-Artuma proposed Hunting Blocks, Afar National Regional
State] the local people believe that the numbers of lion and hyena have increased and they
have requested the Regional Agriculture Bureau to seek solutions for these problem-creating

Tanzanian lions, Selous Game Reserve (Photo : O. Buttin).
South African lioness, Kruger National Park(Photo : O. Buttin).
South African lion, Kruger National Park (Photo : B. Chardonnet).
South African lion, Madikwe Wildlife Reserve (Photo : B. Chardonnet).
South African lion, Kruger National Park (Photo : B. Chardonnet).
73
animals. Leopard, lion and hyena were found to be problem animals for the local people.
Recently these predators have attacked their livestock" (Cherie Enawgaw et al., 2001).
SUB-POPULATION N° 15
• Ethiopia
Babile Elephant Sanctuary and Eastern Haraghe Controlled Hunting Area encompass over
55,000 km² of suitable lion habitat comprising 6,982 km² of National Park and 23,788 km² of
Hunting Area. The population is stable or declining and subject to the familiar twin threats of
poaching and livestock encroachment (S. Williams, pers. comm.).
Interestingly, this peculiar sub-population in the Harar Region contains a number of
particularly small lion with very dark manes, reminiscent of the now extinct races of Barbary
lions and Cape lions (T. Mattanovitch, pers. comm.).
SUB-POPULATION N° 16
• Ethiopia
Within the Somali Region of Ethiopia, the Ogaden desert tentatively comprises about 90,000
km² of non-gazetted habitat suitable for low densities of lion. Little is known about this
population and it is tentatively estimated at 180 individuals, but this must be treated with
caution.
• Somalia
The few experts with field knowledge in Somalia are quite consistent about the distribution of
lions in Somalia.
The sub-population n° 16 is spread on both sides of the North-eastern border between Somalia
and Ethiopia. Laurent (2002) considers that this sub-population expands as far East as the
coastline along the Tug Darror valley.
Between 1984 and 1987, Chazée (1987) observed lions along the Djouba River, and
especially in Sablale, Baidabo, Bardera, Gelib, Kisimoyo and Chiamboni.
SUB-POPULATION N° 17
• Somalia
The El Bur region of Somalia comprises approximately 15,000 km² of suitable lion habitat
with estimated densities of 0.7 to 1.0 animal per 100 km². There is little information on their
quarry species. Civil unrest and poor Government structures are seen as threats to this sub-
population (A. Radcliffe, pers. comm.).

74
SUB-POPULATION N° 18
• Somalia
The Swamp National Park lion sub-population appears to occur at high densities. The national
park itself is small (525 km²) with a wildlife population density of 4 animals per 100 km²
giving a total population of about 20 lions. However, civil unrest and a lack of Government
structure are cited as threats and, for a population contained in such a small area, it is hardly
surprising that it is considered to be declining.
SUB-POPULATION N° 19
• Somalia
In the South of Somalia, lions are not considered rare. "The lower Juba and the territories
beyond this river, as far as the Kenya border, are still more favourable to the presence of this
feline, even if with ample interruption due to human settlement" (F. Fagotto, 1985).
• Kenya
Boni and Dodori National Reserves are hosting lions at a conservative estimate of 3.3
individuals per 100 km² in 2002, giving a total of 45 lions in Boni N.R. and 29 lions for
Dodori N.R. (A. Pelizzoli, pers. comm.).
SUB-POPULATION N° 20
• Kenya
Several references provide information on the lion population in Laikipia District:
- According to a recent survey (Franck, 2001) on lion depredation, the Laikipia District has
about 175 lions or about 0.06 lions/100 km², and;
- According to another source (Martin, 2001), "perhaps 150 lions inhabit the 4,000 square-
mile plateau", which would mean a density of about 0.02 lions/100 km².
SUB-POPULATION N° 21
• Kenya
Aberdare National Park represents a special case as far as lions are concerned, due to the
reintroduction of the species into the park, which is fenced, in the 1950's.
By 1996 there were estimated to be 149 (probably an overestimate). These were perceived to
be having an adverse effect on the giant forest hog populations and that of the rare East
African bongo. Consequently, culling was introduced. Approximately 70 were killed in total,
75
and by 1999/2000 culling stopped, as there were hardly any signs of lion (A. Radcliffe, pers.
comm.).
Considerable discrepancies exist between sources of information regarding this Park. Some
informants mention a lion population size of more than 150, while others quote less than 20
(Rotich, 2000; A. Radcliffe, pers. comm.).
SUB-POPULATION N° 22
• Kenya
In Nairobi National Park during the period 1960's to 1997, lions averaged around 30 and in
1997, prior to the El Niño rains, there were 4 prides and a total of 39 lions. During the rains
the ungulate prey, with the lions following them, disperse to the South. Six lions were
poisoned along Kitengela, and 22 were chased down with dogs and speared in nearby local
communities. By 1999, there were 11 lions in the park. Following the rains in early 2000, 9
lions were poisoned along Kitengela. Those who returned following those rains have now
managed to breed up, and total 22 in 2 prides. Many of the migratory ungulate prey have not
however returned, having been poached. Ancient studies have shown that the Athi-Kapiti
plains act as dispersal areas for the sub-adults from Nairobi NP who leave their prides
(Rudnai, 1983; J. Cavenagh, pers. comm.; A. Radcliffe, pers. comm.).
The Masai Mara ecosystem contains the biggest share of the lion population of Kenya (Oguto
& Dublin, 1998). The lion population of the Masai-Mara ecosystem certainly does not stay
within the Reserve itself and ranges outside the boundaries, as do other large mammals which
make up their prey species: "an aerial count by the WWF done in May 1993, for example,
showed that 26% of the elephants were in dispersall areas, and 21% of the buffaloes stayed
outside the Reserve" (Mbugua, 1994 in Singida, 1995).
In Amboseli National Park systematic poisoning by local communities reportedly in response
to a perceived failure to react to stock killing lions, combined with habitat changes (reduction
in swamp areas), and in prey availability, reduced the population to 2 lions by 1990. Between
1991-1993, there were no lion in the Park. In 1994, 2 lions entered from the Chyulus and
neighbouring areas, followed by others. These have bred, and there are presently 40 lions in
the park (D. Western, pers. comm.; C. Moss, pers. comm.; A Radcliffe, pers. comm.).
In Nakuru National Park in 1987, there was 1 male lion in the Park. In 1989 a female was
brought from Nairobi, and more were added later. These have bred up, prey densities are high,
and presently there are 33-40 lions in the Park (J. Dawson, pers. comm.; A. Radcliffe, pers.
comm.).
The Hells Gate National Park and former Kedong Ranch area have a small population of
approximately 9 lions within 318 km² (J. Dawson, pers. comm.).
Tsavo East and West National Parks and surrounding areas constitute approximately 40,000
km² of suitable lion habitat with an estimated density of 2.8 per 100 km² giving an overall
population of 750 animals with a minimum of 600 and maximum of 900 within the given
confidence limits (D. King, pers. comm.; M. Smeth-Smith, pers. comm.).

76
• Tanzania
In Masailand (Serengeti National Park, Lake Manyara and Tarangire National Parks,
Masailand Game Reserves and Conservation Areas, Masai NGAs) populations are stable in
Protected Areas, but there may be some range degradation caused notably by off road driving
by tour operators. Changes in animal behaviour are noticeable due to habituation and
disturbance due to high levels of game viewing tourism. Outside Protected Areas, numbers
are decreasing due to competition with livestock (PAC, poisoning). However, some local
communities are affording protection to lions as a result of income generation through
community-based conservation programmes (L. Seige, R Baldus & V. Booth, pers. comm.).
SUB-POPULATION N° 23
• Uganda
No more Ugandan lions occur from this sub-population in Uganda. The lion has disappeared
from Southern Uganda, even from Protected Areas such as Lake Mburo National Park due to
the heavy competition with livestock, to farming encroachment by a growing human
population and to illegal hunting (Averbeck, 2001). Lions have twice re-entered this Park
coming from Tanzania, and twice been poisoned by local communities. Last time in 1999, 3
individuals were poisoned (A. Radcliffe, pers. comm.).
• Rwanda
Lions were abundant in Akagera National Park and Mutara Hunting Zone before the 1994
political events. During and after the conflict, many lions were chased away or killed by
soldiers who established permanent camps in the Park and by livestock herders bringing large
numbers of cattle from Uganda and settling down in these Protected Areas (Ph. Chardonnet,
pers. comm.). Draulans (1997 in Draulans & Van Krunkelsven, 2002) observed large numbers
of lions roaming Rwanda's Akagera National Park in 1995, a year after the civil war. Lions
are still present in the Southern part of the Park where tsetse flies tend to keep the cattle away.
• Burundi
According to Ph. Chardonnet (pers. comm.) who worked 3 years with Burundian cattle-
herders, the lions are no longer permanently resident in Burundi. However, occasionally lions
may enter from Tanzania into:
(i) The Ruvubu National Park, East of Burundi, where they follow the Ruvubu
river, and;
(ii) The Mosso region, South-east of Burundi, where they cross the narrow
Malagarazi river into the marshes on the Burundi side.
• Tanzania
In North West Tanzania (Moyowasi-Kigosi Game Reserves and adjoining Conservation
Areas, Biharomolo-Burigi & Ibanda/Rumanyika Game Reserves), the refugee crisis from
1994 onwards had a serious impact on the Miombo woodlands of the area. It can be expected
to have impacted on wildlife numbers and hence on the lion populations. There are areas

77
where a lot of poisoning has been observed and/or there is high human pressure (e.g. in the
South of Moyowosi GR, Ibanda GR). No lions known are to exist in Rumanyika GR. Burigi
GR has a lion population considered to be “healthy” but there are no figures given. Kimisi is
showing increasing reports of lion according to observations over 2 years. These populations
are anticipated to remain stable in Protected Areas (L. Seige, R Baldus & V. Booth, pers.
comm.; & Caro, 1999).
SUB-POPULATION N° 24
• Tanzania
In Central and Western Tanzania (Ruaha/Rungwa system, Katavi National Park/Rukwa,
Ugalla, Mahale, NGAs), lion populations are stable in Protected Areas. Numbers are probably
declining outside Protected Areas due to competition with livestock. Lions are locally
destroyed through PAC and local poisoning.
These populations are anticipated to remain stable in Protected Areas (L. Seige, R Baldus &
V. Booth, pers. comm.; Caro, 1999).
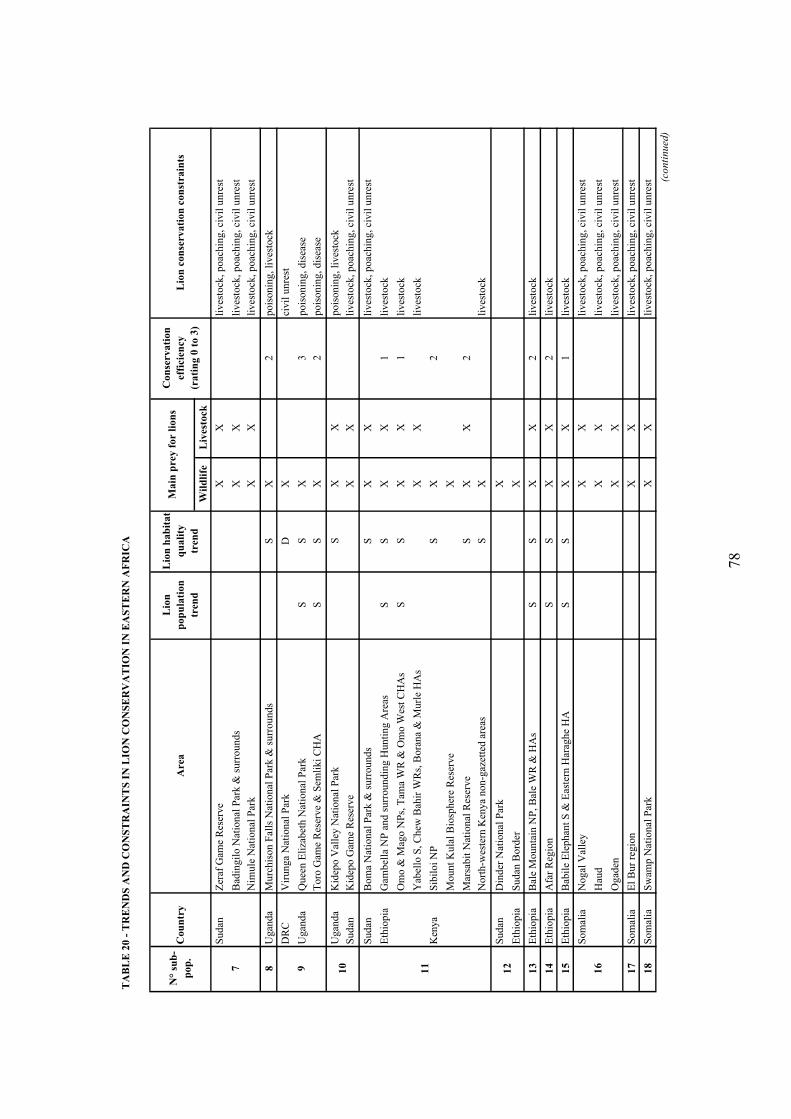
78
TA
BL
E 2
0 -
TR
EN
DS
AN
D C
ON
ST
RA
INT
S I
N L
ION
CO
NS
ER
VA
TIO
N I
N E
AS
TE
RN
AF
RIC
A
Wil
dli
feL
ives
tock
Su
dan
Zer
af G
ame
Res
erve
XX
liv
esto
ck,
po
ach
ing
, ci
vil
un
rest
Bad
ing
ilo
Nat
ion
al P
ark
& s
urr
ou
nd
sX
Xli
ves
tock
, p
oac
hin
g,
civ
il u
nre
st
Nim
ule
Nat
ional
Par
kX
Xli
ves
tock
, poac
hin
g,
civil
unre
st
8U
gan
da
Mu
rch
iso
n F
alls
Nat
ion
al P
ark
& s
urr
ou
nd
sS
X2
po
iso
nin
g,
liv
esto
ck
DR
CV
iru
ng
a N
atio
nal
Par
kD
Xci
vil
un
rest
Ug
and
aQ
uee
n E
liza
bet
h N
atio
nal
Par
kS
SX
3p
ois
on
ing
, d
isea
se
Toro
Gam
e R
eser
ve
& S
emli
ki
CH
AS
SX
2p
ois
on
ing
, d
isea
se
Ugan
da
Kid
epo V
alle
y N
atio
nal
Par
kS
XX
pois
onin
g,
lives
tock
Su
dan
Kid
epo G
ame
Res
erve
XX
liv
esto
ck,
po
ach
ing
, ci
vil
un
rest
Su
dan
Bo
ma
Nat
ion
al P
ark
& s
urr
ou
nd
sS
XX
liv
esto
ck,
po
ach
ing
, ci
vil
un
rest
Eth
iop
iaG
amb
ella
NP
and s
urr
oundin
g H
unti
ng A
reas
SS
XX
1li
ves
tock
Om
o &
Mag
o N
Ps,
Tam
a W
R &
Om
o W
est
CH
As
SS
XX
1li
ves
tock
Yab
ello
S,
Chew
Bah
ir W
Rs,
Bora
na
& M
url
e H
As
XX
lives
tock
Ken
ya
Sib
iloi
NP
SX
2
Mount
Kula
l B
iosp
her
e R
eser
ve
X
Mar
sabit
Nat
ional
Res
erve
SX
X2
Nort
h-w
este
rn K
enya
non-g
azet
ted a
reas
SX
lives
tock
Su
dan
Din
der
Nat
ion
al P
ark
X
Eth
iop
iaS
ud
an B
ord
erX
13
Eth
iop
iaB
ale
Mounta
in N
P,
Bal
e W
R &
HA
sS
SX
X2
lives
tock
14
Eth
iop
iaA
far
Reg
ion
SS
XX
2li
ves
tock
15
Eth
iop
iaB
abil
e E
lephan
t S
& E
aste
rn H
arag
he
HA
SS
XX
1li
ves
tock
Som
alia
Nogal
Val
ley
XX
liv
esto
ck,
po
ach
ing
, ci
vil
un
rest
Hau
dX
Xli
ves
tock
, p
oac
hin
g,
civ
il u
nre
st
Ogad
enX
Xli
ves
tock
, p
oac
hin
g,
civ
il u
nre
st
17
Som
alia
El
Bur
regio
nX
Xli
ves
tock
, p
oac
hin
g,
civ
il u
nre
st
18
Som
alia
Sw
amp N
atio
nal
Par
kX
Xli
ves
tock
, poac
hin
g,
civil
unre
st (co
nti
nu
ed)
Lio
n c
on
serv
ati
on
co
nst
rain
ts
12
11
Co
nse
rva
tio
n
eff
icie
ncy
(ra
tin
g 0
to
3)
Lio
n h
ab
ita
t
qu
ali
ty
tren
d
N°
sub
-
pop
.C
ou
ntr
yA
rea
Lio
n
po
pu
lati
on
tren
d
16
Ma
in p
rey
fo
r l
ion
s
7 9 10
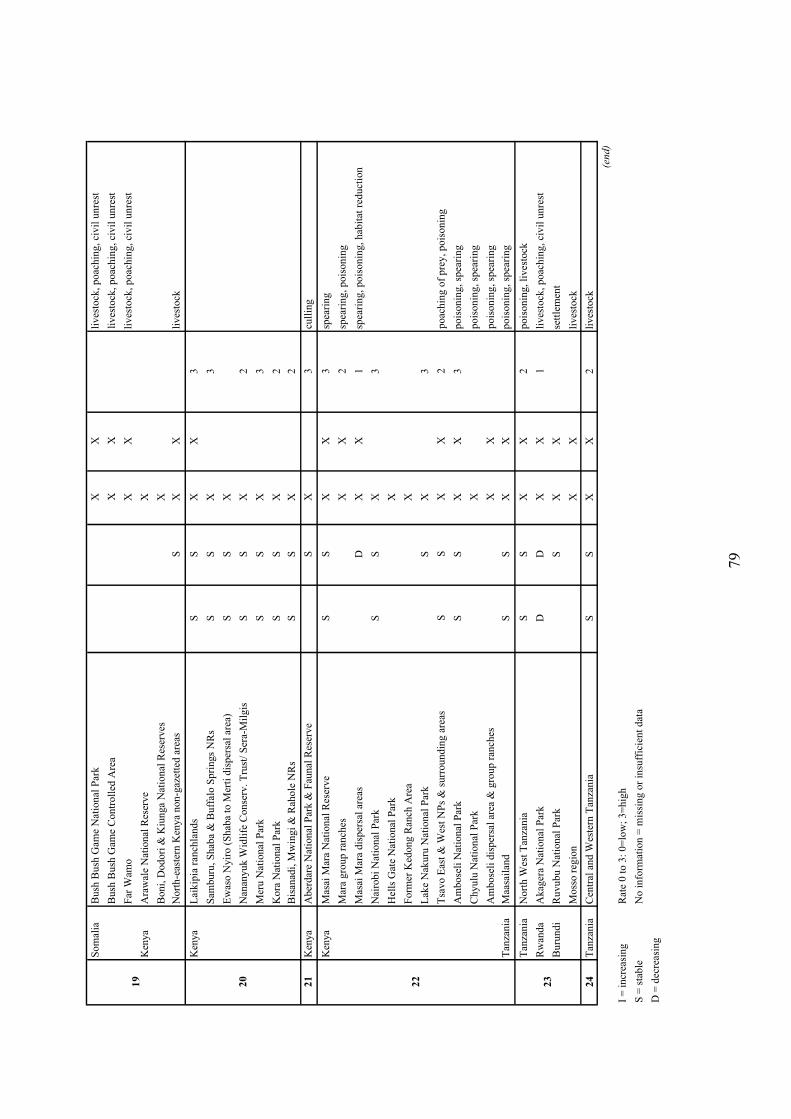
79
So
mal
iaB
ush
Bu
sh G
ame
Nat
ion
al P
ark
XX
liv
esto
ck,
po
ach
ing
, ci
vil
un
rest
Bush
Bush
Gam
e C
ontr
oll
ed A
rea
XX
lives
tock
, poac
hin
g,
civil
unre
st
Far
Wam
oX
Xli
ves
tock
, p
oac
hin
g,
civ
il u
nre
st
Ken
ya
Ara
wal
e N
atio
nal
Res
erve
X
Boni,
Dodori
& K
iunga
Nat
ional
Res
erves
X
Nort
h-e
aste
rn K
enya
non-g
azet
ted a
reas
SX
Xli
ves
tock
Ken
ya
Lai
kip
ia r
anch
lan
ds
SS
XX
3
Sam
bu
ru,
Sh
aba
& B
uff
alo
Sp
rin
gs
NR
sS
SX
3
Ew
aso N
yir
o (
Shab
a to
Mer
ti d
isper
sal
area
)S
SX
Nan
anyuk W
idli
fe C
onse
rv.
Tru
st/
Ser
a-M
ilgis
SS
X2
Mer
u N
atio
nal
Par
kS
SX
3
Kora
Nat
ional
Par
k
SS
X2
Bis
anad
i, M
win
gi
& R
aho
le N
Rs
SS
X2
21
Ken
ya
Aber
dar
e N
atio
nal
Par
k &
Fau
nal
Res
erve
SX
3cu
llin
g
Ken
ya
Mas
ai M
ara
Nat
ion
al R
eser
ve
SS
XX
3sp
eari
ng
Mar
a g
rou
p r
anch
esX
X2
spea
rin
g,
po
iso
nin
g
Mas
ai M
ara
dis
per
sal
area
sD
XX
1sp
eari
ng
, p
ois
on
ing
, h
abit
at r
edu
ctio
n
Nai
robi
Nat
ional
Par
kS
SX
3
Hel
ls G
ate
Nat
ional
Par
kX
Form
er K
edong R
anch
Are
aX
Lak
e N
akuru
Nat
ional
Par
kS
X3
Tsa
vo E
ast
& W
est
NP
s &
surr
oundin
g a
reas
SS
XX
2poac
hin
g o
f pre
y,
pois
onin
g
Am
bose
li N
atio
nal
Par
kS
SX
X3
po
iso
nin
g,
spea
rin
g
Ch
yu
lu N
atio
nal
Par
kX
po
iso
nin
g,
spea
rin
g
Am
bose
li d
isper
sal
area
& g
roup r
anch
esX
Xpois
onin
g,
spea
ring
Tan
zan
iaM
aasa
ilan
dS
SX
Xp
ois
on
ing
, sp
eari
ng
Tan
zania
Nort
h W
est
Tan
zania
SS
XX
2pois
onin
g,
lives
tock
Rw
anda
Akag
era
Nat
ional
Par
kD
DX
X1
lives
tock
, poac
hin
g,
civil
unre
st
Bu
run
di
Ru
vu
bu
Nat
ional
Par
kS
XX
sett
lem
ent
Moss
o r
egio
nX
Xli
ves
tock
24
Tan
zania
Cen
tral
and W
este
rn T
anza
nia
SS
XX
2li
ves
tock
(en
d)
I =
incr
easi
ng
Rat
e 0
to
3:
0=
low
; 3
=h
igh
S =
sta
ble
No
in
form
atio
n =
mis
sin
g o
r in
suff
icie
nt
dat
a
D =
dec
reas
ing
19
22
23
20

80
5. SOUTHERN AFRICA
5.1. LION RANGE
Lion range in the Southern Africa Region surpasses 100 millions hectares, an area very
similar to the Eastern African lion range (Table 21):
- Protected Areas cover 70% of the region's lion distribution area (about 70 million
hectares) with:
. 28% in National Parks;
. 39% in the Reserves, and;
. 3% in Hunting Areas.
- Interestingly, it would appear that non-gazetted areas, which include conservancies,
cover an estimated area of just over 30 million hectares, a very different situation
from the three other regions.


81
TA
BL
E 2
1 -
ST
AT
US
OF
LIO
N D
IST
RIB
UT
ION
AR
EA
S I
N S
OU
TH
ER
N A
FR
ICA
Na
t. P
ark
sR
eser
ves
Hu
nti
ng
are
as
Tan
zan
iaM
iku
mi
Nat
ion
al P
ark
, S
elo
us
Gam
e R
eser
ve
& K
ilo
mb
ero
GC
A
3 2
30
51
77
0
So
uth
ern
Tan
zan
ia n
on
-gaz
ette
d a
reas
45
00
0
Mal
awi
Liw
on
de
Nat
ion
al P
ark
& s
urr
ou
nd
s 5
48
25
2
Mo
zam
biq
ue
Ny
assa
Gam
e R
eser
ve
15
00
0
No
rth
ern
Mo
zam
biq
ue
no
n-g
azet
ted
are
as5
0 0
00
Su
b-t
ota
l 2
53
77
86
6 7
70
09
5 2
52
DR
CU
pem
ba
& K
un
del
un
gu
Nat
ion
al P
ark
s1
9 3
30
Zam
bia
Su
mb
u c
om
ple
x (
Nat
ion
al P
ark
s &
su
rro
un
din
g G
MA
s)
6 0
34
54
0
Su
b-t
ota
l 2
62
5 3
64
54
00
0
Zam
bia
No
rth
& S
ou
th L
uan
gw
a co
mp
lex
1
6 6
60
24
15
4
Ch
iso
mo
, L
uan
o &
Wes
t P
etau
ke
Gam
e M
anag
emen
t A
reas
16
46
0
Lo
wer
Zam
bes
i N
atio
nal
Par
k &
Kar
iba
Sh
ore
4 1
40
5 0
00
Ny
ika
Nat
ion
al P
ark
(Z
amb
ia s
ide)
80
Mal
awi
Ny
ika
Nat
ion
al P
ark
(M
alaw
i si
de)
& V
waz
a M
arsh
Wil
dli
fe R
eser
ve
3 1
34
1 0
00
Nk
ho
tak
ota
Wil
dli
fe R
eser
ve
1 5
00
Kas
un
gu
Nat
ion
al P
ark
2 0
00
Zim
bab
we
Man
a P
oo
ls N
atio
nal
Par
k,
surr
ou
nd
ing
Saf
ari
Are
as &
Co
mm
un
al L
and
s2
19
61
0 6
24
18
0
Mat
usa
do
na
& C
hiz
arir
a N
atio
nal
Par
ks,
su
rro
un
din
g S
As
& C
Ls
3 2
80
26
92
79
47
65
7
Mo
zam
biq
ue
Tet
e P
rov
ince
an
d n
eig
hb
ou
rin
g r
egio
ns
25
00
0
Su
b-t
ota
l 2
73
1 4
90
43
38
31
3 4
18
37
83
7
Zam
bia
Kaf
ue,
Lo
chin
var
& B
lue
Lag
oo
n N
atio
nal
Par
ks
& s
urr
ou
nd
ing
GM
As
23
26
04
5 1
49
Wes
t L
un
ga
Nat
ion
al P
ark
& s
urr
ou
nd
ing
Gam
e M
anag
emen
t A
reas
1
68
41
0 0
70
An
go
laK
amei
a N
atio
nal
Par
k &
Mo
xic
o n
on
-gaz
ette
d a
reas
14
45
01
0 0
00
Su
b-t
ota
l 2
83
9 3
94
55
21
90
10
00
0
(co
nti
nu
ed
)
26
27
28
N°
sub
-
po
pu
lati
on
Co
un
try
Are
a
25
Co
nse
rva
tio
n s
tatu
s &
su
rfa
ce (
km
²)
Pro
tecte
d a
rea
sN
on
ga
zett
ed
area
s
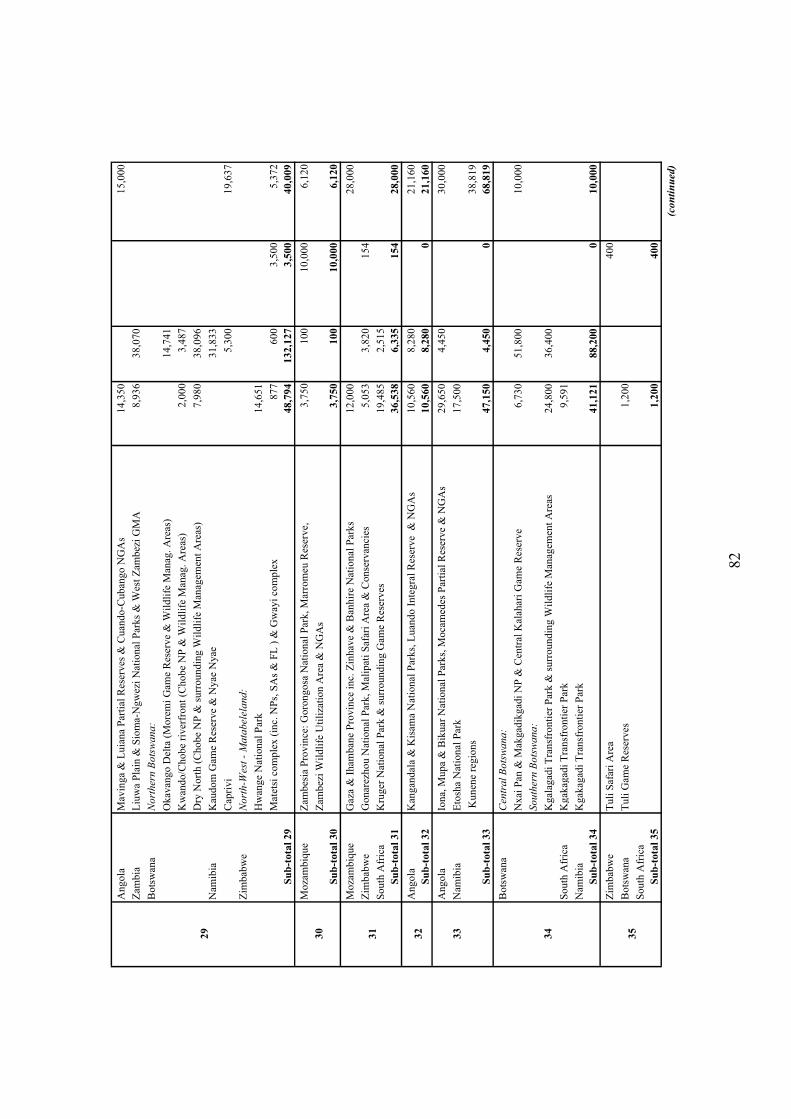
82
An
go
laM
avin
ga
& L
uia
na
Par
tial
Res
erv
es &
Cu
and
o-C
ub
ang
o N
GA
s1
4,3
50
15
,00
0
Zam
bia
Liu
wa
Pla
in &
Sio
ma-
Ng
wez
i N
atio
nal
Par
ks
& W
est
Zam
bez
i G
MA
8,9
36
38
,07
0
Bo
tsw
ana
No
rth
ern
Bo
tsw
an
a:
Ok
avan
go
Del
ta (
Mo
rem
i G
ame
Res
erv
e &
Wil
dli
fe M
anag
. A
reas
)1
4,7
41
Kw
and
o/C
ho
be
riv
erfr
on
t (C
ho
be
NP
& W
ild
life
Man
ag.
Are
as)
2,0
00
3,4
87
Dry
No
rth
(C
ho
be
NP
& s
urr
ou
nd
ing
Wil
dli
fe M
anag
emen
t A
reas
)7
,98
03
8,0
96
Nam
ibia
Kau
do
m G
ame
Res
erv
e &
Ny
ae N
yae
31
,83
3
Cap
riv
i5
,30
01
9,6
37
Zim
bab
we
No
rth
-Wes
t -
Ma
tab
elel
an
d:
Hw
ang
e N
atio
nal
Par
k1
4,6
51
Mat
etsi
co
mp
lex
(in
c. N
Ps,
SA
s &
FL
) &
Gw
ayi
com
ple
x8
77
60
03
,50
05
,37
2
Su
b-t
ota
l 29
48
,79
41
32
,12
73
,50
04
0,0
09
Mo
zam
biq
ue
Zam
bes
ia P
rov
ince
: G
oro
ng
osa
Nat
ion
al P
ark
, M
arro
meu
Res
erv
e,
3,7
50
10
01
0,0
00
6,1
20
Zam
bez
i W
ildli
fe U
tili
zati
on A
rea
& N
GA
s
Su
b-t
ota
l 30
3,7
50
10
01
0,0
00
6,1
20
Mo
zam
biq
ue
Gaz
a &
Ih
amb
ane
Pro
vin
ce i
nc.
Zin
hav
e &
Ban
hir
e N
atio
nal
Par
ks
12
,00
02
8,0
00
Zim
bab
we
Go
nar
ezh
ou
Nat
ion
al P
ark
, M
alip
ati
Saf
ari
Are
a &
Co
nse
rvan
cies
5,0
53
3,8
20
15
4
So
uth
Afr
ica
Kru
ger
Nat
ion
al P
ark
& s
urr
ou
nd
ing
Gam
e R
eser
ves
19
,48
52
,51
5
Su
b-t
ota
l 31
36
,53
86
,33
51
54
28
,00
0
An
go
laK
ang
and
ala
& K
isam
a N
atio
nal
Par
ks,
Lu
and
o I
nte
gra
l R
eser
ve
& N
GA
s1
0,5
60
8,2
80
21
,16
0
Su
b-t
ota
l 32
10
,56
08
,28
00
21
,16
0
An
go
laIo
na,
Mu
pa
& B
iku
ar N
atio
nal
Par
ks,
Mo
cam
edes
Par
tial
Res
erv
e &
NG
As
29
,65
04
,45
03
0,0
00
33
Nam
ibia
Eto
sha
Nat
ion
al P
ark
1
7,5
00
Ku
nen
e re
gio
ns
38
,81
9
Su
b-t
ota
l 33
47
,15
04
,45
00
68
,81
9
Bo
tsw
ana
Cen
tra
l B
ots
wa
na
:
Nx
ai P
an &
Mak
gad
ikg
adi
NP
& C
entr
al K
alah
ari
Gam
e R
eser
ve
6,7
30
51
,80
01
0,0
00
So
uth
ern
Bo
tsw
an
a:
Kg
alag
adi
Tra
nsf
ron
tier
Par
k &
su
rro
un
din
g W
ild
life
Man
agem
ent
Are
as2
4,8
00
36
,40
0
So
uth
Afr
ica
Kg
akag
adi
Tra
nsf
ron
tier
Par
k
9,5
91
Nam
ibia
Kg
akag
adi
Tra
nsf
ron
tier
Par
k
Su
b-t
ota
l 34
41
,12
18
8,2
00
01
0,0
00
Zim
bab
we
Tuli
Saf
ari
Are
a4
00
Bo
tsw
ana
Tu
li G
ame
Res
erv
es1
,20
0
So
uth
Afr
ica
Su
b-t
ota
l 35
1,2
00
40
0
(co
nti
nu
ed
)
31
32
34
35
30
29
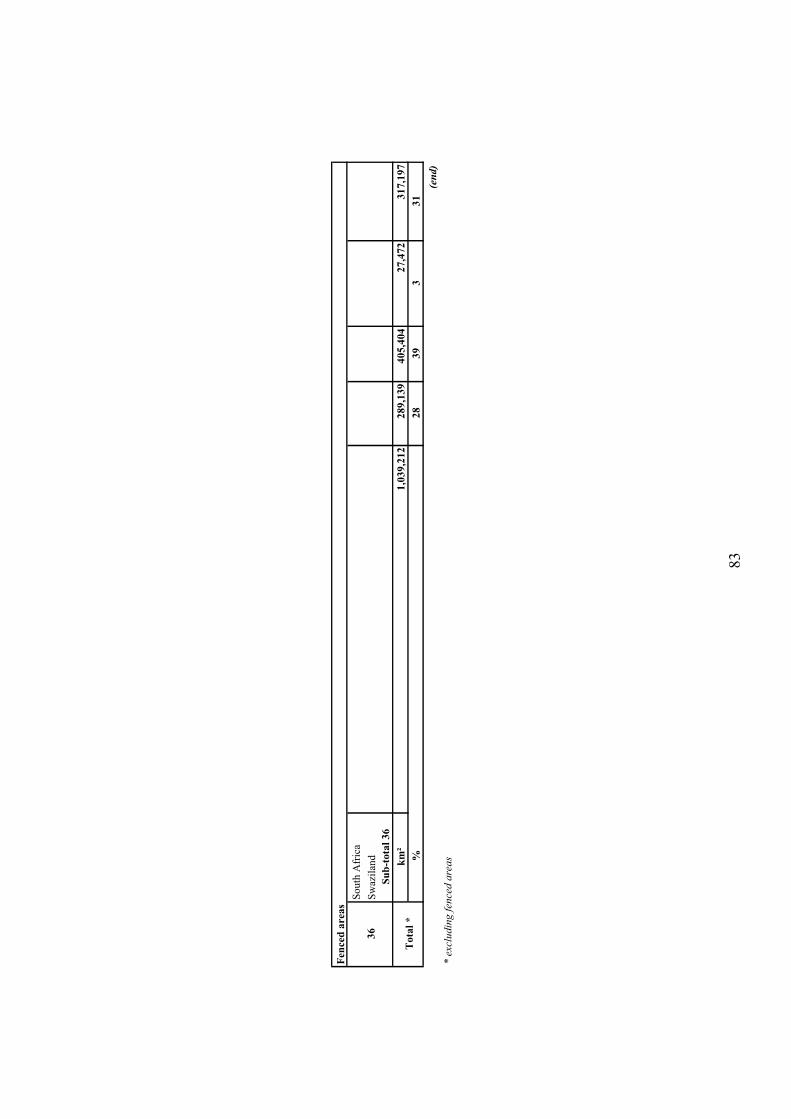
83
So
uth
Afr
ica
Sw
azil
and
Su
b-t
ota
l 36
km
²1
,03
9,2
12
28
9,1
39
40
5,4
04
27
,47
23
17
,19
7
%2
83
93
31
(en
d)
* e
xclu
din
g f
ence
d a
rea
s
To
tal
*
Fen
ced
are
as
36
84
5.2. LION POPULATION SIZE
This is probably the best-known lion population of all the regions. However, most of this
understanding is still centred upon populations living in Protected Areas, especially National
Parks and a few Wildlife Reserves. Those lions living in non-gazetted areas still remain, on
the whole, poorly understood in terms of overall numbers, population dynamics and
behaviour. The regional population of lions in Southern Africa probably exceeds 19,000
individuals (Table 22).
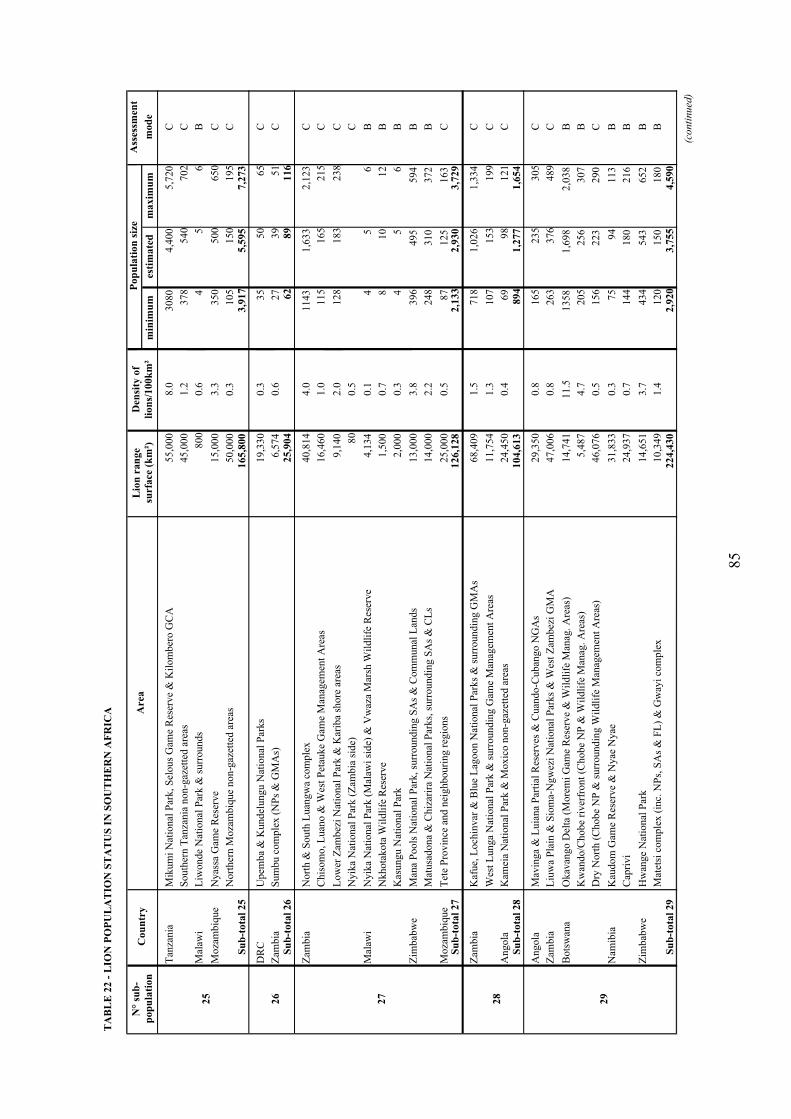
85
TA
BL
E 2
2 -
LIO
N P
OP
UL
AT
ION
ST
AT
US
IN
SO
UT
HE
RN
AF
RIC
A
min
imu
mes
tim
ate
dm
ax
imu
m
Tan
zania
Mik
um
i N
atio
nal
Par
k,
Sel
ous
Gam
e R
eser
ve
& K
ilom
ber
oG
CA
55,0
00
8.0
3080
4,4
00
5,7
20
C
South
ern T
anza
nia
non-g
azet
ted a
reas
45,0
00
1.2
378
540
702
C
Mal
awi
Liw
onde
Nat
ional
Par
k &
surr
ounds
800
0.6
45
6B
Moza
mbiq
ue
Nyas
sa G
ame
Res
erve
15,0
00
3.3
350
500
650
C
Nort
her
n M
oza
mbiq
ue
non-g
azet
ted a
reas
50,0
00
0.3
105
150
195
CS
ub
-tota
l 25
165,8
00
3,9
17
5,5
95
7,2
73
DR
CU
pem
ba
& K
undel
ungu N
atio
nal
Par
ks
19,3
30
0.3
35
50
65
C
Zam
bia
Sum
bu c
om
ple
x (
NP
s &
GM
As)
6,5
74
0.6
27
39
51
CS
ub
-tota
l 26
25,9
04
62
89
116
Zam
bia
Nort
h &
South
Luan
gw
a co
mple
x40,8
14
4.0
1143
1,6
33
2,1
23
C
Chis
om
o,
Luan
o &
Wes
t P
etau
ke
Gam
e M
anag
emen
t A
reas
16,4
60
1.0
115
165
215
C
Low
erZ
ambez
i N
atio
nal
Par
k &
Kar
iba
shore
are
as9,1
40
2.0
128
183
238
C
Nyik
a N
atio
nal
Par
k (
Zam
bia
sid
e)8
00.5
C
Mal
awi
Nyik
a N
atio
nal
Par
k (
Mal
awi
side)
& V
waz
a M
arsh
Wil
dli
fe R
eser
ve
4,1
34
0.1
45
6B
Nkhota
kota
Wil
dli
fe R
eser
ve
1,5
00
0.7
81
01
2B
Kas
ungu N
atio
nal
Par
k2,0
00
0.3
45
6B
Zim
bab
we
Man
a P
ools
Nat
ional
Par
k,
surr
oundin
g S
As
& C
om
munal
Lan
ds
13,0
00
3.8
396
495
594
B
Mat
usa
dona
& C
hiz
arir
a N
atio
nal
Par
ks,
surr
oundin
g S
As
& C
Ls
14,0
00
2.2
248
310
372
B
Moza
mbiq
ue
Tet
e P
rovin
ce a
nd n
eighbouri
ng r
egio
ns
25,0
00
0.5
87
125
163
CS
ub
-tota
l 27
126,1
28
2,1
33
2,9
30
3,7
29
Zam
bia
Kaf
ue,
Loch
invar
& B
lue
Lag
oon N
atio
nal
Par
ks
& s
urr
oundin
g G
MA
s68,4
09
1.5
718
1,0
26
1,3
34
C
Wes
t L
unga
Nat
ional
Par
k &
surr
oundin
g G
ame
Man
agem
ent
Are
as11,7
54
1.3
107
153
199
C
Angola
Kam
eia
Nat
ional
Par
k &
Moxic
o n
on-g
azet
ted a
reas
24,4
50
0.4
69
98
121
CS
ub
-tota
l 28
104,6
13
894
1,2
77
1,6
54
Angola
Mav
inga
& L
uia
na
Par
tial
Res
erves
& C
uan
do-C
uban
go N
GA
s29,3
50
0.8
165
235
305
C
Zam
bia
Liu
wa
Pla
in &
Sio
ma-
Ngw
ezi
Nat
ional
Par
ks
& W
est
Zam
bez
i G
MA
47,0
06
0.8
263
376
489
C
Bots
wan
aO
kav
ango D
elta
(M
ore
mi
Gam
e R
eser
ve
& W
ildli
fe M
anag
. A
reas
)14,7
41
11.5
1358
1,6
98
2,0
38
B
Kw
ando/C
hobe
river
front
(Chobe
NP
& W
ildli
fe M
anag
. A
reas
)5,4
87
4.7
205
256
307
B
Dry
Nort
h (
Chobe
NP
& s
urr
oundin
g W
ildli
fe M
anag
emen
t A
reas
)46,0
76
0.5
156
223
290
C
Nam
ibia
Kau
dom
Gam
e R
eser
ve
& N
yae
Nyae
31,8
33
0.3
75
94
113
B
Cap
riv
i24,9
37
0.7
144
180
216
B
Zim
bab
we
Hw
ange
Nat
ional
Par
k14,6
51
3.7
434
543
652
B
Mat
etsi
com
ple
x (
inc.
NP
s, S
As
& F
L)
& G
way
i co
mple
x10,3
49
1.4
120
150
180
B
Su
b-t
ota
l 29
224,4
30
2,9
20
3,7
55
4,5
90
(co
nti
nu
ed)
Den
sity
of
lion
s/100k
m²
Pop
ula
tion
siz
eA
sses
smen
t
mod
e
27
N°
sub
-
pop
ula
tion
Co
un
try
Are
aL
ion
ran
ge
surf
ace
(k
m²)
25
26
29
28
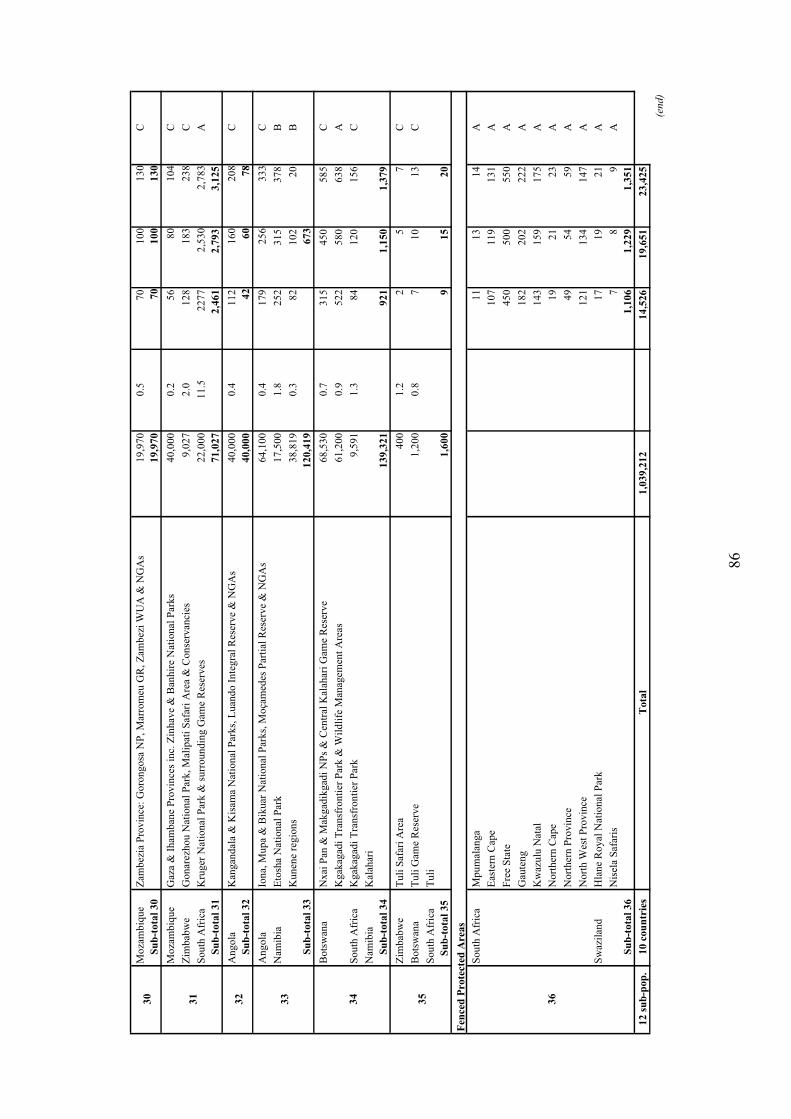
86
Mo
zam
biq
ue
Zam
bez
ia P
rovin
ce:
Goro
ngosa
NP
, M
arro
meu
GR
, Z
ambez
i W
UA
& N
GA
s1
9,9
70
0.5
70
10
01
30
C
Su
b-t
ota
l 30
19
,97
07
01
00
13
0
Mo
zam
biq
ue
Gaz
a &
Ih
amb
ane
Pro
vin
ces
inc.
Zin
hav
e &
Ban
hir
e N
atio
nal
Par
ks
40
,00
00
.25
68
01
04
C
Zim
bab
we
Go
nar
ezh
ou
Nat
ion
al P
ark
, M
alip
ati
Saf
ari
Are
a &
Co
nse
rvan
cies
9,0
27
2.0
12
81
83
23
8C
So
uth
Afr
ica
Kru
ger
Nat
ion
al P
ark
& s
urr
ou
nd
ing
Gam
e R
eser
ves
22
,00
01
1.5
22
77
2,5
30
2,7
83
A
Su
b-t
ota
l 31
71
,02
72
,46
12
,79
33
,12
5
An
go
laK
ang
and
ala
& K
isam
a N
atio
nal
Par
ks,
Lu
and
o I
nte
gra
l R
eser
ve
& N
GA
s4
0,0
00
0.4
11
21
60
20
8C
Su
b-t
ota
l 32
40
,00
04
26
07
8
An
go
laIo
na,
Mu
pa
& B
iku
ar N
atio
nal
Par
ks,
Mo
çam
edes
Par
tial
Res
erv
e &
NG
As
64
,10
00
.41
79
25
63
33
C
Nam
ibia
Eto
sha
Nat
ion
al P
ark
1
7,5
00
1.8
25
23
15
37
8B
Ku
nen
e re
gio
ns
38
,81
90
.38
21
02
20
B
Su
b-t
ota
l 33
12
0,4
19
67
3
Bo
tsw
ana
Nx
ai P
an &
Mak
gad
ikg
adi
NP
s &
Cen
tral
Kal
ahar
i G
ame
Res
erv
e6
8,5
30
0.7
31
54
50
58
5C
Kg
akag
adi
Tra
nsf
ron
tier
Par
k &
Wil
dli
fe M
anag
emen
t A
reas
61
,20
00
.95
22
58
06
38
A
So
uth
Afr
ica
Kg
akag
adi
Tra
nsf
ron
tier
Par
k9
,59
11
.38
41
20
15
6C
Nam
ibia
Kal
ahar
i
Su
b-t
ota
l 34
13
9,3
21
92
11
,15
01
,37
9
Zim
bab
we
Tuli
Saf
ari
Are
a4
00
1.2
25
7C
Bo
tsw
ana
Tu
li G
ame
Res
erv
e1
,20
00
.87
10
13
C
So
uth
Afr
ica
Tu
li
Su
b-t
ota
l 35
1,6
00
91
52
0
Fen
ced
Pro
tect
ed A
rea
s
So
uth
Afr
ica
Mp
um
alan
ga
11
13
14
A
Eas
tern
Cap
e1
07
11
91
31
A
Fre
e S
tate
45
05
00
55
0A
Gau
ten
g1
82
20
22
22
A
Kw
azulu
Nat
al1
43
15
91
75
A
Nort
her
n C
ape
19
21
23
A
No
rth
ern
Pro
vin
ce4
95
45
9A
No
rth
Wes
t P
rov
ince
12
11
34
14
7A
Sw
azil
and
Hla
ne
Ro
yal
Nat
ion
al P
ark
17
19
21
A
Nis
ela
Saf
aris
78
9A
Su
b-t
ota
l 36
1,1
06
1,2
29
1,3
51
12 s
ub
-pop
.10 c
ou
ntr
ies
Tota
l1
,03
9,2
12
14
,52
61
9,6
51
23
,42
5
(en
d)
35
36
34
33
31
32
30

87
SUB-POPULATION N° 25
Sub-population n° 25 appears to extend on the ground beyond the barrier of the Ruvuma
River. Efforts are presently underway to set up a trans-frontier conservation area to join the
Selous Game Reserve in Tanzania and the Niassa Game Reserve in Mozambique.
• Tanzania
The Selous ecosystem (Selous GR, Mikumi National Park, Kilombero Valley and
surrounding non-gazetted areas) is one of the main strongholds of the African lion, perhaps
the most secure of all.
The various observers (Rodgers, 1974; Creel & Creel 1997; L. Seige & R. Baldus, pers.
comm.; P. Jonqueres & J-P. Bernon, pers. comm.; Ph. Chardonnet, pers. comm.) agree on the
outstanding fitness of the lion status in the Selous ecosystem. All the large predator taxa of
the region, including the lion, are abundant in the ecosystem.
In this region, poaching is limited, but problem animal control is carried out because of high
incidence of man-eaters in this region (L. Seige & R. Baldus, pers. comm.).
• Mozambique
In the 1970's, Smithers & Tello (1976) were considering that "the lions have a wide
distribution throughout Mozambique […] they have a wide habitat tolerance…".
Being one of the few remaining true wilderness areas in Africa, the Niassa GR has not
suffered the same level of wildlife losses as other Protected Areas further South and North.
The surveys indicate that there are healthy populations of antelopes, lion and leopard in
numbers constituting viable populations (Michler, 1998). The Niassa GR and its surrounding
areas constitute an important conservation area for the lion (R. Taylor, pers. comm.).
The Parque Nacional das Quirimbas, presently under creation in the Cabo Delgado Province,
seems to host an important population of lions. In 2001, 70 people were reported to have been
attacked by lions while they were sleeping in their fields to protect them against crop raiding
elephants (H. Motta, pers. comm.).
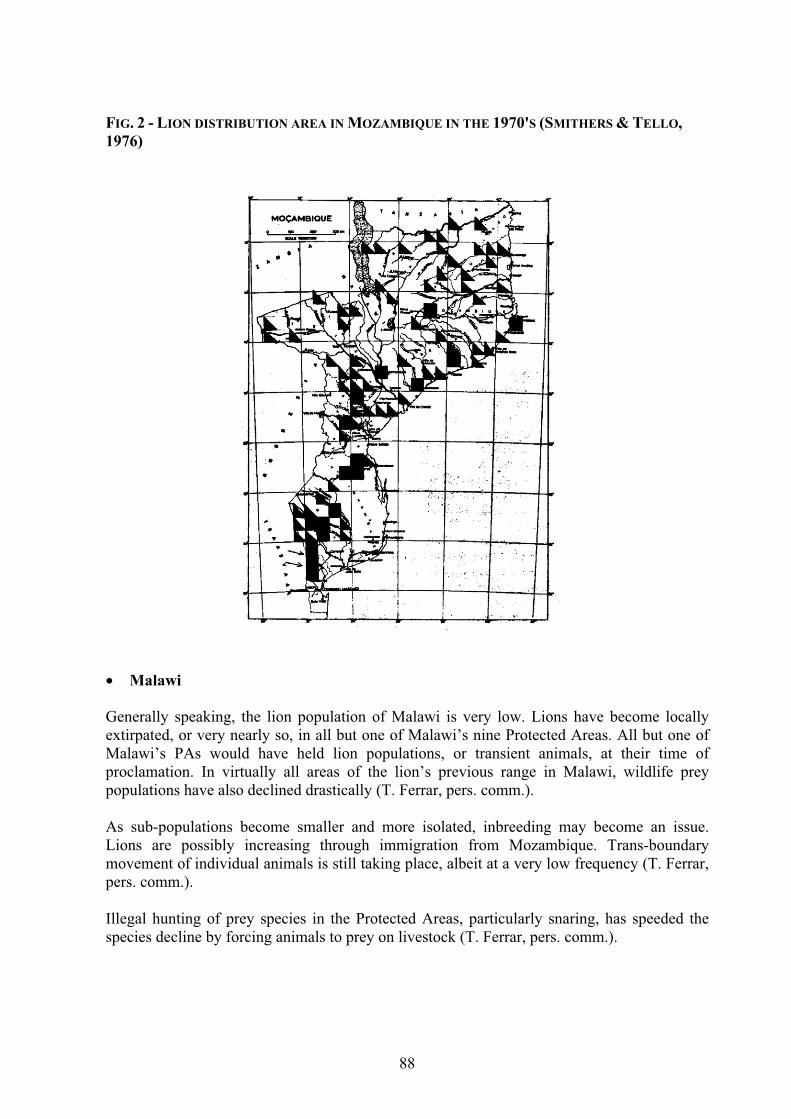
88
FIG. 2 - LION DISTRIBUTION AREA IN MOZAMBIQUE IN THE 1970'S (SMITHERS & TELLO,
1976)
• Malawi
Generally speaking, the lion population of Malawi is very low. Lions have become locally
extirpated, or very nearly so, in all but one of Malawi’s nine Protected Areas. All but one of
Malawi’s PAs would have held lion populations, or transient animals, at their time of
proclamation. In virtually all areas of the lion’s previous range in Malawi, wildlife prey
populations have also declined drastically (T. Ferrar, pers. comm.).
As sub-populations become smaller and more isolated, inbreeding may become an issue.
Lions are possibly increasing through immigration from Mozambique. Trans-boundary
movement of individual animals is still taking place, albeit at a very low frequency (T. Ferrar,
pers. comm.).
Illegal hunting of prey species in the Protected Areas, particularly snaring, has speeded the
species decline by forcing animals to prey on livestock (T. Ferrar, pers. comm.).
89
SUB-POPULATION N° 26
• Democratic Republic of Congo
Even though DRC is geographically seen to be part of Central Africa, Southern lion
populations of DRC have been incorporated into the Southern Africa Region because they are
connected with lion populations of Southern Africa and not with those of Central Africa.
Upemba and Kundelungu National Parks comprise just over 19,000 km² of Protected Areas
and, by adding the other gazetted areas, so-called Zone Annexe and Domaines de Chasse, the
entire ecosystem reaches 3 million hectares in size. The habitat there is suitable for lions, but
their density is very low and a tentative estimate of 50 individuals is given for all these areas
together.
In the early 1990's, D'Huart (1991) was considering that lions had disappeared from Upemba
in 1985. Today, lions are observed there several times a year and their population is estimated
between 10 and 15 (F. Bateshi Murotsi, pers. comm.). In the now contiguous Kundelungu a
few individuals may remain as well (Nkulu Kalala, pers. comm.). According to B. Chardonnet
(pers. comm.) who worked there in mid-2002:
- the lion's prey species appear to be rare and shy in the region, with a few exceptions such
as southern reedbuck, oribi and warthog, and;
- it is highly doubtful there are as many as 50 lions in the whole region including
surrounding non-gazetted areas.
• Zambia
The Mweru Wantipa and Sumbu National Parks have few lions as game populations have
been massively reduced by poaching (C. & T. Stewart, 2001).
Zambia is one of the few remaining countries where lions are still widespread and regularly
encountered close to human settlements. However, the distribution of lion outside the
National Parks and the GMAs has undoubtedly dwindled significantly as a result of
persecution and habitat degradation (R. Jeffery, pers. comm.).
SUB-POPULATION N° 27
• Malawi
Lion populations are very low. They have become locally extirpated, or very nearly so, in all
but one of Malawi’s nine Protected Wildlife Areas. Historically only one of Malawi’s PAs
would not have held lion populations, or transient animals, at their time of proclamation. In
virtually all areas of the lion’s previous range in Malawi, wildlife prey populations have also
declined drastically due to illegal hunting. This has speeded the species decline by forcing
animals to prey on livestock.
Only one sub-population is currently breeding well, namely that in Nkhotakota Wildlife
Reserve. There are no estimates of frequency or survival rates of cubs, but young, or spoor of
young, are occasionally seen. The lion population is probably stable in the short term.

90
In Kasungu National Park, only a single animal is known to occur in this Park.
In Nyika National Park and Vwaza Marsh Protected Area, lion populations are declining.
Occasional visiting lions from Zambia enter these Protected Areas.
• Zambia
Historically, lion occurred throughout Zambia. Today, lions are still found more or less
throughout the country, with a propensity for their occurrence in the larger more remote
Protected Areas such as the North and South Lungwa, Lower Zambezi, etc. and their
surrounding Game Management Areas, with higher densities occurring inside the National
Parks (R. Jeffery & J.J. Pope, pers. comm.). However, Ansell (1978) noted that even where
lions are no longer resident, they might still occur sporadically as transient individuals or
groups.
Few contemporary density or population data are available for these or any other areas,
although it may be assumed that densities of lion populations decrease with distance from the
major rivers and floodplains of these refuges, except in the immediate areas surrounding
permanent water, reflecting the relationships between the numbers and sizes of prides, the
densities of resident concentrations of ‘plains game’ or prey species, and availability of water.
In some areas it may well be that lion numbers are also affected by the hunting success of
competing predators such as hyena.
The Luangwa complex may be considered as one of the main stronghods for the taxon in the
whole coninent with a population presumably close to 1,500 lions.
In the early 1990's detailed studies have been carried out in the Nsefu Sector of South
Luangwa National Park and the adjoining riverine part of the Upper Lupande Game
Management Area totalling 355 km². "The number of lions in the Hunting Block was
estimated at 410 +/- 48 with 205 adults including 40 +/- 5 adult males" (Jachmann, 2001).
There are no lions resident in Kasanka National Park, nor it seems in Lavushi Mande National
Park. The last sighting of lion in Kasanka NP was of three animals in 1996, and it is felt that
they came from the nearby Congo D.R. where human population is very low (C. & T.
Stewart, 2001).
• Zimbabwe
In Mana Pools National Park, surrounding Safari Areas and neighbouring Communal Lands,
lion populations are probably stable in Protected Areas, but decrease in the Communal Lands
as a result of habitat loss (N. Monk, pers. comm.; G. Purchase, in prep.).
Lions in the un-flooded Middle Zambezi Valley are reproducing well (N. Monk, pers. comm.)
even though no information is available on the factors that are influencing reproduction (V.
Booth, pers. comm.).
In Matusadona National Park, lion numbers increased from 1990 to 1998 with a growing
number of buffalo in the park, as drought years expanded the area of lakeshore grassland due
to the drop of the lake level (G. Purchase, pers. comm.). Today the lion population is
91
estimated at around 110 with an average pride size of 11 (F. Buyeye & G. Matipano, pers.
comm.).
Lion numbers are possibly stable in other Protected Areas, but wildlife poaching appears to be
very common in Chirisa Safari Area, and so lion numbers may have decreased even though
data are not available (V. Booth, pers. comm.). Lion numbers probably decreased in the
Communal Lands during the past 22 years as a result of habitat loss (V. Booth, pers. comm.).
Lions of the Sebungwe region are reproducing well (G. Purchase, in prep.), but no
information is available on the factors that are influencing reproduction.
According to R. Taylor (pers. comm.), the lion population on the shores of Lake Kariba:
- Had increased in 2000-2001 because the weakness of buffalo made them an easier
prey; this was due to the flooding of the grasslands along the shores of lake Kariba,
but;
- Is starting to drop in 2002 with the decrease of buffalo populations and therefore less
available prey (lion infant mortality has been observed).
“A good example of the destruction and recovery of a lion population can be seen from the
Zambezi Valley. After years of heavy hunting pressure, a “cat flu” epidemic has wiped out
around 75% of the lions, and a VIP hunting scam removed a further 16 male lions just after
the epidemic has passed its peak…Furthermore, the buffalo and impala populations crashed
because of the lake and the hyena numbers built up to high levels…I seriously doubt that the
carrying capacity for lion is more than half of what it was in 1985…My personal assessment
of the Zambezi valley is that the lion population is recovering nicely. Numbers have built up
to the point where they are beginning to club the hyena population into some semblance of
normality…Also pride structure has begun to “normalise” (Heath, 2001).
• Mozambique
The Tete Province definitely has a substantial resident population of lions, however reliable
numbers are not known. It shares lions with neighbouring Zimbabwe and Zambia. Hunting
safari companies operate in the Province with uneven success as far as lion is concerned.
SUB-POPULATION N° 28
• Zambia
The sub-populations no° 28 and no° 29 are considered as separate populations here because
they occur on opposite banks of the Zambezi River. While there may occasionally be
crossover, this river represents a formidable barrier and as such these two populations are
considered accordingly.
There is considerable variation throughout the Protected Areas system in Zambia. This
population occurs in some 80,000 km² of suitable habitat comprising approximately 25,000
km² of National Parks and 55,000 km² of Reserves or Hunting Areas. Kafue National Park has
high densities of lions, particularly around the river valleys where prey species are still
92
plentiful, particularly in the Busanga Plains, possibly as high as 20 per 100 km² in some
places (R. Jeffery & J.J. Pope, pers. comm., 2002).
Elsewhere the densities are much lower in the West Lunga National Park and Lochinivar and
Blue Lagoon National Parks are unlikely to support significant populations of lion (R. Jeffery
& J.J. Pope, pers. comm.; Mitchell, Shenton & Uys, 1965).
• Angola
Little is known about the status of lions in Angola. Sub-population n° 28 occurs in Kameia
National Park, an area of 14,450 km² and its surrounding non-gazetted area known as Moxico
which is a further 10,000 km². A tentative estimate of 98 animals is given for the population
size.
The status of lions in Angola as a whole is poorly understood. "Crude estimates for some
regions of the country do exist, but these, however, are not based on scientific surveys” (W.
van Hoven, pers. comm., 2002).
SUB-POPULATION N° 29
• Zambia
This population occurs in an area of approximately 9,000 km² of Liuwa Plain and Sioma-
Ngwezi National Parks and a further 38,000 km² of Protected Areas (West Zambezi GMA).
Lion densities in these areas are considered to be relatively low with a currently estimated lion
population of 376 individuals (R. Jeffery & J.J. Pope, pers. comm.).
• Angola
There is a little known area comprising over 14,000 km² made up of Mavinga and Luiana
Partial Reserves and Cuando-Cubango non-gazetted areas covering 15,000 km². The exact
status of lions in these areas is not clear and hence their population estimate of 235 should be
viewed with caution.
• Namibia
Reliable information on lion in Namibia is available from Stander (1997), Stander & Hanssen
(2001), Loveridge, Lynam & Macdonald (2001). There may be between 500 and 1,000 lions
in the whole country (465-914; V. Booth, pers. comm.).
In Caprivi, the past trends and present status of the lion population is poorly known. There are
probably between 125 and 234 individuals. The wildlife habitat there is on the decrease due to
livestock negative impact and civil unrest. There is some livestock depredation by lion in the
Eastern Caprivi. In this region the mean annual quota is 1.4-2.8% of the lion population
(1996-2001) and a stable average of 7.2 lions are trophy-hunted per year over the past 5 years.
In Kaudom Game Reserve the lion population is stable and a similar situation seems to occur
now in Nyae Nyae after a recent decline (Stander, 1997). In Kaudom the mean annual quota is
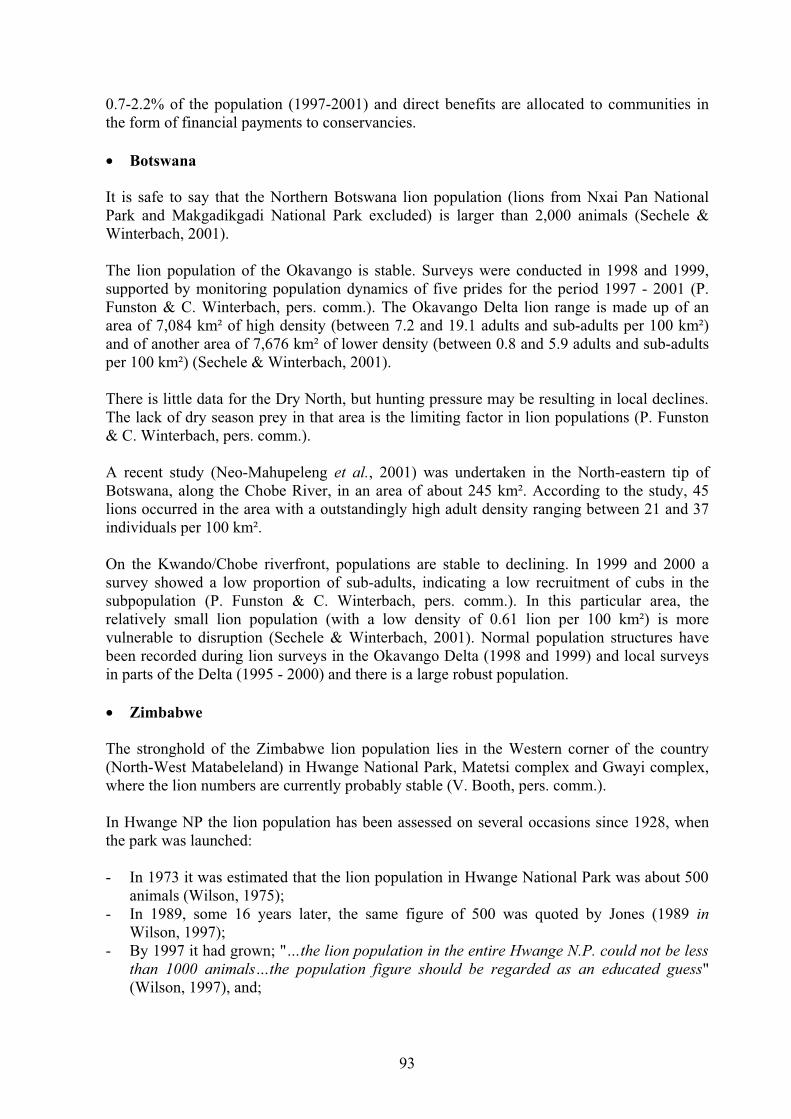
93
0.7-2.2% of the population (1997-2001) and direct benefits are allocated to communities in
the form of financial payments to conservancies.
• Botswana
It is safe to say that the Northern Botswana lion population (lions from Nxai Pan National
Park and Makgadikgadi National Park excluded) is larger than 2,000 animals (Sechele &
Winterbach, 2001).
The lion population of the Okavango is stable. Surveys were conducted in 1998 and 1999,
supported by monitoring population dynamics of five prides for the period 1997 - 2001 (P.
Funston & C. Winterbach, pers. comm.). The Okavango Delta lion range is made up of an
area of 7,084 km² of high density (between 7.2 and 19.1 adults and sub-adults per 100 km²)
and of another area of 7,676 km² of lower density (between 0.8 and 5.9 adults and sub-adults
per 100 km²) (Sechele & Winterbach, 2001).
There is little data for the Dry North, but hunting pressure may be resulting in local declines.
The lack of dry season prey in that area is the limiting factor in lion populations (P. Funston
& C. Winterbach, pers. comm.).
A recent study (Neo-Mahupeleng et al., 2001) was undertaken in the North-eastern tip of
Botswana, along the Chobe River, in an area of about 245 km². According to the study, 45
lions occurred in the area with a outstandingly high adult density ranging between 21 and 37
individuals per 100 km².
On the Kwando/Chobe riverfront, populations are stable to declining. In 1999 and 2000 a
survey showed a low proportion of sub-adults, indicating a low recruitment of cubs in the
subpopulation (P. Funston & C. Winterbach, pers. comm.). In this particular area, the
relatively small lion population (with a low density of 0.61 lion per 100 km²) is more
vulnerable to disruption (Sechele & Winterbach, 2001). Normal population structures have
been recorded during lion surveys in the Okavango Delta (1998 and 1999) and local surveys
in parts of the Delta (1995 - 2000) and there is a large robust population.
• Zimbabwe
The stronghold of the Zimbabwe lion population lies in the Western corner of the country
(North-West Matabeleland) in Hwange National Park, Matetsi complex and Gwayi complex,
where the lion numbers are currently probably stable (V. Booth, pers. comm.).
In Hwange NP the lion population has been assessed on several occasions since 1928, when
the park was launched:
- In 1973 it was estimated that the lion population in Hwange National Park was about 500
animals (Wilson, 1975);
- In 1989, some 16 years later, the same figure of 500 was quoted by Jones (1989 in
Wilson, 1997);
- By 1997 it had grown; "…the lion population in the entire Hwange N.P. could not be less
than 1000 animals…the population figure should be regarded as an educated guess"
(Wilson, 1997), and;
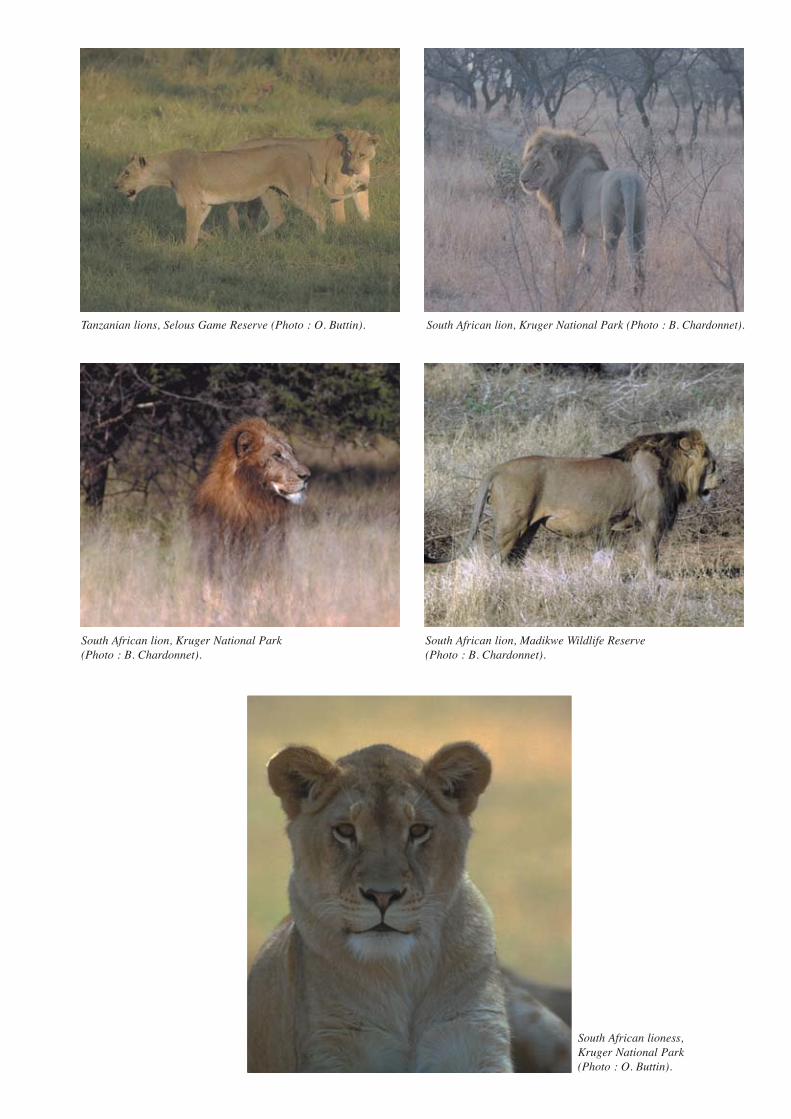
Tanzanian lions, Selous Game Reserve (Photo : O. Buttin).
South African lioness, Kruger National Park(Photo : O. Buttin).
South African lion, Kruger National Park (Photo : B. Chardonnet).
South African lion, Madikwe Wildlife Reserve (Photo : B. Chardonnet).
South African lion, Kruger National Park (Photo : B. Chardonnet).
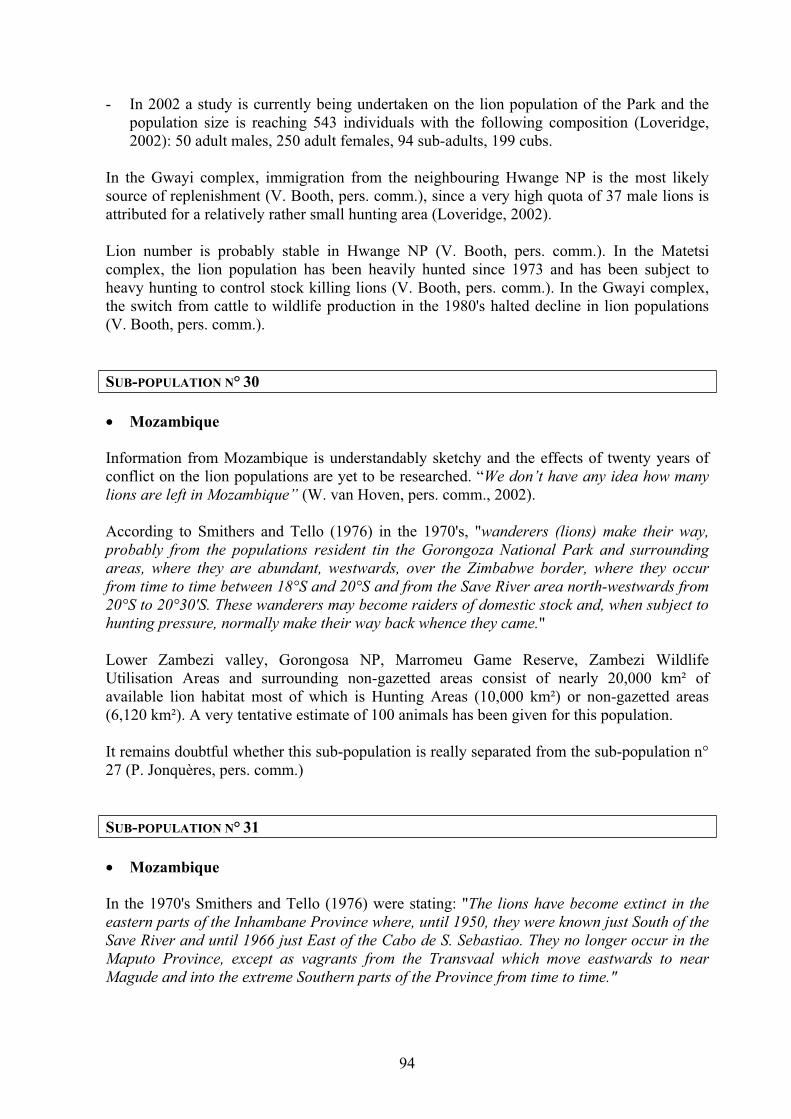
94
- In 2002 a study is currently being undertaken on the lion population of the Park and the
population size is reaching 543 individuals with the following composition (Loveridge,
2002): 50 adult males, 250 adult females, 94 sub-adults, 199 cubs.
In the Gwayi complex, immigration from the neighbouring Hwange NP is the most likely
source of replenishment (V. Booth, pers. comm.), since a very high quota of 37 male lions is
attributed for a relatively rather small hunting area (Loveridge, 2002).
Lion number is probably stable in Hwange NP (V. Booth, pers. comm.). In the Matetsi
complex, the lion population has been heavily hunted since 1973 and has been subject to
heavy hunting to control stock killing lions (V. Booth, pers. comm.). In the Gwayi complex,
the switch from cattle to wildlife production in the 1980's halted decline in lion populations
(V. Booth, pers. comm.).
SUB-POPULATION N° 30
• Mozambique
Information from Mozambique is understandably sketchy and the effects of twenty years of
conflict on the lion populations are yet to be researched. “We don’t have any idea how many
lions are left in Mozambique” (W. van Hoven, pers. comm., 2002).
According to Smithers and Tello (1976) in the 1970's, "wanderers (lions) make their way,
probably from the populations resident tin the Gorongoza National Park and surrounding
areas, where they are abundant, westwards, over the Zimbabwe border, where they occur
from time to time between 18°S and 20°S and from the Save River area north-westwards from
20°S to 20°30'S. These wanderers may become raiders of domestic stock and, when subject to
hunting pressure, normally make their way back whence they came."
Lower Zambezi valley, Gorongosa NP, Marromeu Game Reserve, Zambezi Wildlife
Utilisation Areas and surrounding non-gazetted areas consist of nearly 20,000 km² of
available lion habitat most of which is Hunting Areas (10,000 km²) or non-gazetted areas
(6,120 km²). A very tentative estimate of 100 animals has been given for this population.
It remains doubtful whether this sub-population is really separated from the sub-population n°
27 (P. Jonquères, pers. comm.)
SUB-POPULATION N° 31
• Mozambique
In the 1970's Smithers and Tello (1976) were stating: "The lions have become extinct in the
eastern parts of the Inhambane Province where, until 1950, they were known just South of the
Save River and until 1966 just East of the Cabo de S. Sebastiao. They no longer occur in the
Maputo Province, except as vagrants from the Transvaal which move eastwards to near
Magude and into the extreme Southern parts of the Province from time to time."
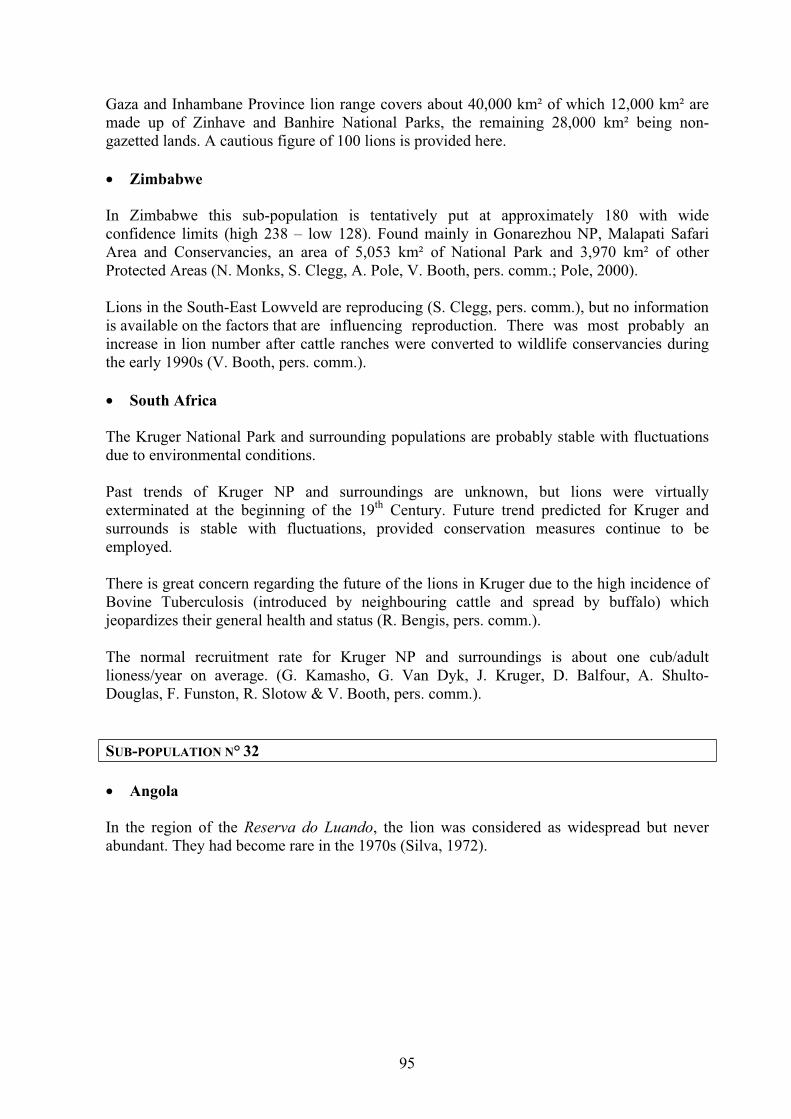
95
Gaza and Inhambane Province lion range covers about 40,000 km² of which 12,000 km² are
made up of Zinhave and Banhire National Parks, the remaining 28,000 km² being non-
gazetted lands. A cautious figure of 100 lions is provided here.
• Zimbabwe
In Zimbabwe this sub-population is tentatively put at approximately 180 with wide
confidence limits (high 238 – low 128). Found mainly in Gonarezhou NP, Malapati Safari
Area and Conservancies, an area of 5,053 km² of National Park and 3,970 km² of other
Protected Areas (N. Monks, S. Clegg, A. Pole, V. Booth, pers. comm.; Pole, 2000).
Lions in the South-East Lowveld are reproducing (S. Clegg, pers. comm.), but no information
is available on the factors that are influencing reproduction. There was most probably an
increase in lion number after cattle ranches were converted to wildlife conservancies during
the early 1990s (V. Booth, pers. comm.).
• South Africa
The Kruger National Park and surrounding populations are probably stable with fluctuations
due to environmental conditions.
Past trends of Kruger NP and surroundings are unknown, but lions were virtually
exterminated at the beginning of the 19th
Century. Future trend predicted for Kruger and
surrounds is stable with fluctuations, provided conservation measures continue to be
employed.
There is great concern regarding the future of the lions in Kruger due to the high incidence of
Bovine Tuberculosis (introduced by neighbouring cattle and spread by buffalo) which
jeopardizes their general health and status (R. Bengis, pers. comm.).
The normal recruitment rate for Kruger NP and surroundings is about one cub/adult
lioness/year on average. (G. Kamasho, G. Van Dyk, J. Kruger, D. Balfour, A. Shulto-
Douglas, F. Funston, R. Slotow & V. Booth, pers. comm.).
SUB-POPULATION N° 32
• Angola
In the region of the Reserva do Luando, the lion was considered as widespread but never
abundant. They had become rare in the 1970s (Silva, 1972).

96
SUB-POPULATION N° 33
• Angola
Lions were abundant in the 1960s in the Kuando-Kubango hunting concessions, in the South-
eastern corner of Angola (B. des Clers, pers. comm.).
• Namibia
According to P. Stander, Carnivore Co-ordinator at the Ministry of Environment & Tourism
of Namibia, the lion population of Etosha National Park is stable and has been so for the last
15 years. This is where most of the Namibian lions occur and the density in the park is quite
high with 1.8 lions per 100 km² (Stander, 2000).
Lions in the Etosha NP have a potential growth rate of 10%, excluding violent mortalities (P.
Stander, pers. comm.). However, in the longer run, the sustainability of this population is said
to be somehow uncertain because of "a shortage of scientific data on the ecological
mechanisms that drive population regulation". A peculiarity of the Etosha lions is that they
appear to be free from the Feline Immunodeficiency Virus, which seems to be widespread
among lions elsewhere (Cat News 24, 1996).
However the Etosha lions are subjected to constant persecution of lions by farmers in the
intensive cattle farming areas along the Park's borders further to livestock losses (Stander,
2000). Between 1985 and 2000, 427 lions from Etosha were thus destroyed on the borders of
the Park (Stander, 2000). Over the past 19 years an average of 28 lions have been shot along
the border, this number has remained constant (V. Booth, pers. comm.). According to Cynthia
Vernon (Vernon, 1996), "these killings may have significant effects on the demography of
Etosha lion population. About one-half of the mortality of adult lions is the result of the
killing of lions on private lands. Of all lions killed, approximately 50% are sub-adults males.
Therefore, there is a question as to the genetic and demographic prognosis for small isolated
populations".
The Kunene population is stable and has a potential growth rate of 10% (excluding violent
mortalities) despite the extremely arid environment of the area, but its past trend is unknown
(V. Booth, pers. comm.). "Lions have always existed in the Kunene region, but their ecology
and demography have never been studied" (Hanssen & Stander, 2000). P. Stander and Lise
Hanssen, Director of the Africa Cat Foundation, have initiated a study on the large carnivore
of the Kunene region in 1999. Community conservation programmes such as communal
conservancies are currently in place, notably to monitor and promote suitable habitat for lions.
SUB-POPULATION N° 34
Because of the harsh semi-desert conditions of the area, the Kalahari lions differ in many
ways from other African lion populations, not in their appearance but in their behaviour. Their
way of hunting and water consumption are unique. The size of their prides seldom exceeds 16
animals, in contrast, in Kruger NP, 40 lions were once counted in a single pride. The Kalahari
lions have also the highest mortality rate among cubs in all of Africa (Cat News 26,
reproduced from Custos 1997).

97
• Botswana
The Makgadikgadi National Park has a small [39 (28-59), 95% confidence] population of
lions that lives at a quite low density (0.8 adult and sub-adult lion per 100 km²) (Hemson,
2001). The lion population of the Pans region is stable. However, this sub-population is
locally threatened due to predator-human conflict that had a high impact on the small sub-
population. The Southern Kalahari population is probably stable with fluctuations due to
environmental conditions (Funston, 2001).
Past trends of the Southern Kalahari prides are unknown, but lions were virtually
exterminated on the South African side of the Park (P. Funston & C. Winterbach, pers.
comm.).
The Pans region shows a rapidly decreasing populations due to high level of conflict and
problem animal control. However, future trends in the Pans indicate that populations are
expected to increase after the ban on Problem Animal Control was implemented in November
2000. The Southern Kalahari population is expected to remain stable, provided that
conservation measures continue to be employed (P. Funston & C. Winterbach, pers. comm.).
• South Africa
Quite reliable figures on lion's status in South Africa are available from G. Kamasho, G. Van
Dyk, J. Kruger, D. Balfour, A. Shulto-Douglas, F. Funston, R. Slotow & V. Booth, pers.
comm.; Mills, Wolf, Le Riche & Meyer, 1978; Funston, 2001.
In recent history the Kgalagadi Trans-frontier Park lion population was virtually exterminated
on the South African side of the park. However, this population (the Kgalagadi Trans-frontier
Park population) is predicted to remain stable, providing conservation measures continue to
be employed. The normal reproductive rate for the Kgalagadi Trans-frontier Park is about one
cub/adult lioness/year on average.
• Namibia
There appears to be no mention of any lion on the Namibian side of the Kalahari Desert by
such authorities as P. Stander.
SUB-POPULATION N° 35
• Zimbabwe
In Zimbabwe there is a very small population in the Tuli Safari Area, a Hunting Block of 400
km² South of the country. The population spans three international borders and is tentatively
put at 5 animals.

98
On the Botswanan side of the border this populations has 1,200 km² of habitat available in the
Tuli Game Reserve and the estimated population is 10 individuals. This figure has not been
reliably confirmed.
• South Africa
No information was available for the South African side of the border where this sub-
population is concerned.
SUB-POPULATION N° 36
• South Africa
Accurate figures for enclosed lion populations in South Africa originate from Van Schalkwyk,
1994; W.& S. van Hoven, pers. comm.; G. Kamasho, G. Van Dyk, J. Kruger, D. Balfour, A.
Shulto-Douglas, F. Funston, R. Slotow & V. Booth, pers. comm.
The lion populations found in South Africa can be characterised as being the most intensively
managed populations in Africa. This highly interventionist approach has produced a wealth of
useful information on the management of small populations and demonstrates just what can
be done when there are sufficient resources and the will to carry out these projects. However,
it also highlights the fact that this type of management is extremely difficult and it is better to
never lose lions from an area than to try and re-introduce them having lost them in the first
place, as it is unlikely that the monumental efforts that have gone into lion management in
South Africa could be repeated across the continent.
In South Africa, there are a number of enclosed populations of lions which are not included
here as sub-populations. The populations given in the present survey consist only of free-
ranging animals and those that have been re-introduced under strict conditions to areas where
they occurred historically or other reasons, for instance:
“Lions were introduced into Pilanesberg National Park because the species was identified as
a major draw-card for foreign tourists in particular and a crucial component for the socio-
economic development of the region…A highly interventionist approach towards lion
population management was adopted…. Lions have made a significant contribution to the
park in direct economic returns from increased tourism, live sales and hunting.” (Van Dyk,
2001).
The current status of these populations is given as:
- The Mpumalanga Parks lion population is declining;
- The North West Parks meta-population is increasing;
- The Hluhluwe-Umfolozi population is slowly decreasing, but Kwazulu Natal Wildlife
started an introduction programme since 2000 and population is starting to increase,
and;
- The Phinda, Kwandwe and Shamwari populations are increasing.
Botswana•

99
- Both Madikwe and Pilanesberg populations were reintroduced from Etosha stock (22
founders);
- Before the recent introduction, the Hluhluwe-Umfolozi population’s trend has been
from stable to slowly declining. There have been 3 bottlenecks:
(i) Small founder population introduced in the 1960s;
(ii) During the 1980 drought years, herbivores were heavily culled. By the mid-
1980s lions needed to be reduced because their numbers had increased to
200, and;
(iii) Sub-adults started escaping and a policy was implemented to reduce these
groups for the sake of good neighbour-relations. Consequently, pride males
stayed too long in the pride and started breeding with their daughters and
inbreeding resulted.
The original Phinda introductions were from the Sabi Sands while Kwandwe and Shamwari
founder populations were from the Pilanesberg/Madikwe meta-population and are both very
recent introductions, i.e. the last 18 months.
The future of these animals is not clear due to the mixed fortunes of the various groups:
- The outlook for Mpumalanga Parks does not look good. Disease, habitat
fragmentation and destruction (due to unprecedented development), hunting and
poaching (snaring, shooting from the road) are having a significant impact;
- The North West population has proved so successful that dozens of the progeny of the
two populations have been relocated across the sub region (Mabula, Entabeni,
Welgevonden, Shambala, Shamwari, Kwandwe and Hluhluwe-Umfolozi). A group
was also made available to Oklahoma City Zoo and a game reserve in Zimbabwe;
- It is probably too early to tell whether the Hluhluwe-Umfolozi, Kwandwe and
Shamwari introduction programme will be successful, and;
- The Phinda population is maintained at 15 - 16 lions, which is assumed to be the
correct carrying capacity for a reserve of this size.
Interestingly their reproductive history is well documented:
- In Mpumalanga Parks, the Low-Hills population is doubling each year while the
Mthetamusha population is stable;
- Rapid growth within the Pilanesberg/Madikwe populations has resulted in the
implementation of population control (contraception) being applied in the form of
vasectomies. Vasectomies are used to manipulate the genetic composition of the
population as well;
- Of the three males and three females introduced to Hluhluwe-Umfolozi Park in 2000,
one female was killed and the two others have produced two cubs each. Two of the
males moved south and have joined up with existing prides, and;
- The Phinda lions have done very well and are on the increase. Both Kwandwe females
are pregnant. Shamwari has experienced cub mortalities and one theory is that this
may be due to male vasectomies in the founder population.
Their history is particularly important, given the intensive nature of their management:

100
TA
BL
E 2
3 -
TR
EN
DS
AN
D C
ON
TR
AIN
TS
IN
LIO
N C
ON
SE
RV
AT
ION
IN
SO
UT
HE
RN
AF
RIC
A
Tan
zania
Mik
um
i N
P, S
elous
GR
& K
ilom
ber
o G
CA
S
SX
X3
South
ern T
anza
nia
non-g
azet
ted a
reas
SS
X2
pre
dat
ion
on
hu
man
s
Mal
awi
Liw
onde
Nat
ional
Par
k &
surr
ounds
IS
X2
smal
l popula
tion s
ize,
sca
rcit
y o
f pre
y
Mo
zam
biq
ue
Nyas
sa G
ame
Res
erve
SS
X3
Nort
her
n M
oza
mbiq
ue
non-g
azet
ted a
reas
Xag
ricu
lture
DR
CU
pem
ba
& K
un
del
un
gu
Nat
ion
al P
ark
sD
DX
1ag
ricu
ltu
re,
po
ach
ing
Zam
bia
Sum
bu c
om
ple
x (
Nat
ional
Par
ks
& s
urr
oundin
g G
MA
s)X
Zam
bia
Nort
h &
South
Luan
gw
a co
mple
x
SS
X3
Chis
om
o,
Luan
o &
Wes
t P
etau
ke
GM
As
SX
Low
er Z
ambes
i N
atio
nal
Par
k &
Kar
iba
Shore
SD
X2
agri
cult
ure
, se
ttle
men
t
Ny
ika
Nat
ion
al P
ark
(Z
ambia
sid
e)X
Mal
awi
Nyik
a N
P (
Mal
awi
side)
& V
waz
a M
arsh
WR
Xsm
all
popula
tion s
ize,
sca
rcit
y o
f pre
y
Nkhota
kota
Wil
dli
fe R
eser
ve
Xsm
all
popula
tion s
ize,
sca
rcit
y o
f pre
y
Kas
ungu N
atio
nal
Par
kX
2sm
all
popula
tion s
ize,
sca
rcit
y o
f pre
y
Zim
bab
we
Man
a P
ools
NP
, su
rroundin
g S
As
& C
om
munal
Lan
ds
SS
X3
agri
cult
ure
, se
ttle
men
t
Mat
usa
dona
& C
hiz
arir
a N
Ps,
surr
oundin
g S
As
& C
Ls
SD
XX
3ag
ricu
lture
, li
ves
tock
Mo
zam
biq
ue
Tet
e P
rovin
ceX
X1
agri
cult
ure
, se
ttle
men
t
Zam
bia
Kaf
ue,
Loch
invar
, B
lue
Lag
oon N
Ps
& s
urr
oundin
g G
MA
sS
X2
Wes
t L
unga
Nat
ional
Par
k &
surr
oundin
g G
MA
s X
Angola
Kam
eia
Nat
ional
Par
k &
Moxic
o n
on-g
azet
ted a
reas
Xci
vil
unre
st,
pover
ty
Angola
Mav
inga
& L
uia
na
PR
s &
Cuan
do-C
uban
go N
GA
sX
civil
unre
st,
pover
ty
Zam
bia
Liu
wa
Pla
in,
Sio
ma-
Ngw
ezi
NP
s &
Wes
t Z
ambez
i G
MA
X
Bots
wan
aN
ort
her
n B
ots
wan
aS
SX
X3
Nam
ibia
Kau
dom
Gam
e R
eser
ve
& N
yae
Nyae
SS
XX
2li
ves
tock
Cap
riv
iX
X1
lives
tock
Zim
bab
we
Nort
h-W
est
- M
atab
elel
and
SS
XX
3ag
ricu
lture
, li
ves
tock
(co
nti
nu
ed)
Lio
n c
on
serv
ati
on
co
nst
rain
tsN
° su
b-
pop
.C
ou
ntr
yA
rea
Co
nse
rva
tio
n
eff
icie
ncy
(ra
te 0
to 3
)
Lio
n
ha
bit
at
qu
ali
ty
tren
dW
ild
life
Liv
esto
ck
Ma
in p
rey
fo
r l
ion
sL
ion
po
pu
lati
on
tren
d
29
27
28
26
25
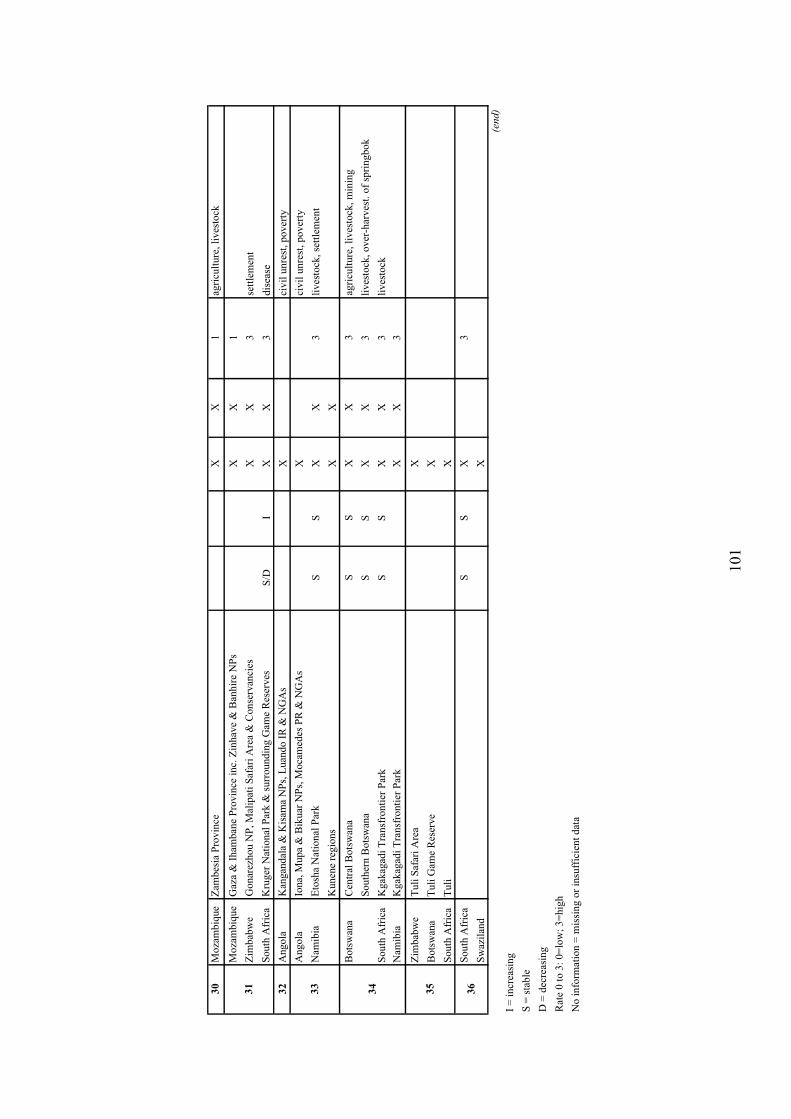
101
30
Moza
mbiq
ue
Zam
bes
ia P
rovin
ceX
X1
agri
cult
ure
, li
ves
tock
Mo
zam
biq
ue
Gaz
a &
Iham
ban
e P
rovin
ce i
nc.
Zin
hav
e &
Ban
hir
e N
Ps
XX
1
Zim
bab
we
Gonar
ezhou N
P,
Mal
ipat
i S
afar
i A
rea
& C
onse
rvan
cies
XX
3se
ttle
men
t
South
Afr
ica
Kru
ger
Nat
ional
Par
k &
surr
oundin
g G
ame
Res
erves
S/D
IX
X3
dis
ease
32
Angola
Kan
gan
dal
a &
Kis
ama
NP
s, L
uan
do I
R &
NG
As
Xci
vil
unre
st,
pover
ty
Angola
Iona,
Mupa
& B
ikuar
NP
s, M
oca
med
es P
R &
NG
As
Xci
vil
unre
st,
pover
ty
Nam
ibia
Eto
sha
Nat
ion
al P
ark
S
SX
X3
lives
tock
, se
ttle
men
t
Kunen
e re
gio
ns
XX
Bo
tsw
ana
Cen
tral
Bo
tsw
ana
SS
XX
3ag
ricu
ltu
re,
liv
esto
ck,
min
ing
South
ern B
ots
wan
aS
SX
X3
lives
tock
, over
-har
ves
t. o
f sp
ringbok
South
Afr
ica
Kgak
agad
i T
ransf
ronti
er P
ark
SS
XX
3li
ves
tock
Nam
ibia
Kg
akag
adi
Tra
nsf
ronti
er P
ark
XX
3
Zim
bab
we
Tuli
Saf
ari
Are
aX
Bots
wan
aT
uli
Gam
e R
eser
ve
X
South
Afr
ica
Tuli
X
South
Afr
ica
SS
X3
Sw
azil
and
X
(en
d)
I =
incr
easi
ng
S =
sta
ble
D =
dec
reas
ing
Rat
e 0
to
3:
0=
low
; 3
=h
igh
No
in
form
atio
n =
mis
sin
g o
r in
suff
icie
nt
dat
a
36
33
34
35
31

ChapterChapter IIIIIIDriving ForcesDriving Forces
Zambian lioness, Luangwa valley (Photo : B. Chardonnet).
102
"A l'instant où King allait saisir le cou du morane entre ses crocs, une balle
l'atteignit là où il le fallait, au défaut de l'épaule, droit au cœur. Il fut soulevé, rejeté
par le choc et rugit de surprise plus encore que de colère… Et tout à coup ce fut le
silence. Et tout à coup, à l'ombre des longues branches chargées d'épines, il y eut,
couronnées de crinières, deux formes inertes : le corps d'un homme et le corps d'un
lion."
Joseph Kessel, 1958. Le Lion.
103
1. COHABITATION OF MAN AND LION
1.1. LION HABITAT UNDER HUMAN PRESSURE
Human causes appear to be the prevailing factors responsible for the shrinkage of lion habitat.
However non-human causes have impacted lion habitat, such as desertification and
subsequent decline of lion prey availability. For instance, the desertification phenomena has
certainly contributed to the withdrawal of lions from areas of the high Northern latitudes, such
as the Adrar des Ifhoras in Mali, the Aïr Ténéré in Niger or the Ennedi in Chad.
The most important long-term threat to the presence of lion in any part of Sub-Saharan Africa
lies with human settlements and particularly agriculture and livestock rearing in lion habitat.
The distribution maps of lion subpopulations tend to confirm the direct inverse correlation of
(i) lion density and numbers with (ii) human activity and presence.
The reduction of habitat might be considered as an indirect, although most powerful, effect
threatening the lion taxon. Direct effects also originate from the presence of man as super-
predator within lion habitat. If wildlife prey habitats are converted to agriculture or grazing
for domestic livestock, human/lion conflicts are bound to increase. Unless conflicts are
alleviated (compensation to local people for losses incurred, removal of problem animals,
etc), locals will shoot, trap or poison them, leading to fewer lions in that area.
A common consequence of the human occupation of lion habitat is the development of
negative perceptions of lion presence in the mind of local communities. A demonstrative
example is the case study in Queen Elizabeth National Park, Uganda, where questioned local
communities openly expressed their negative attitude towards lions (Dricuru, 2000), to the
point that "…in Queen Elizabeth NP…we are more concerned about the poisoning of wild
carnivores and scavengers (lions, hyenas, vultures, etc)…this is extremely destructive -
ecologically and economically" (Siefert, 2000).
Man appears to be the main cause of the modification of lion habitat through a number of
factors.
• Human demographic growth
In 1950, the human population of Sub-Saharan Africa (SSA) represented only 7.6% of the
global population, but 11.3% in 2000, and it is expected to represent 15.3% in 2030 with more
than 1.2 Billion people (Figure 3).
Furthermore, urbanisation is developing in SSA: between 1950 and 2000, urban populations
of SSA were multiplied by 9.2, and will be again multiplied by 2.7 by 2030. During the same
period, rural populations will however also increase. They have been and will be multiplied
"only" by 2.7 and 1.3 respectively (FAO, 2000-2001 in Tacher et al, 2001).

104
FIG. 3 – HUMAN POPULATION GROWTH IN SUB-SAHARAN AFRICA (Source: FAO, 2001; in
Tacher et al, 2001)
• Agricultural and livestock encroachment
With a land area of about 30 million km², Africa is the largest continent on earth and SSA
represents about three quarters of it. This vast block of land is progressively being
transformed by various human uses.
- Cultivated lands
For the whole planet, cultivated lands have been multiplied by 1.64 in the last 36 years.
However, pressure on land has differed greatly between developed and developing countries.
The total area of cultivated lands increased by 80% in developing countries while it has
remained virtually the same in developed countries and actually decreased in Europe. In SSA
it has been multiplied by 1.64, corresponding to the global average (Figure 4).
- Pastoral rangeland
The total area of pastoral rangeland remains stable in most parts of the world. During the last
25 years, however, the size of grazing area per inhabitant has decreased everywhere due to
human demography, but it has decreased more rapidly in SSA. Nevertheless, SSA still has the
most hectares of pastoral rangeland per inhabitant (1.8 ha/inhabitant in 1990).
0
200
400
600
800
1000
1200
1400
1950 1960 1970 1980 1990 1995 1999 2000 2010 2020 2030
Peo
ple
(in
mil
lio
ns)

105
FIG. 4 – RISE IN CULTIVATED LAND IN SUB-SAHARAN AFRICA (Source: Tacher et al, 2001)
- Livestock development
Numbers of domestic livestock have increased in developing countries such as SSA (Figure 5)
while they have decreased in developed countries. Furthermore, it looks like this trend is
ongoing.
After Latin America, it is in SSA that the greatest numbers of cattle per inhabitant are found.
SSA has the greatest numbers of small ruminants (sheep, goats and camels) of all the
developing countries (in particular, twice as many goats as the average seen in other
developing countries). Today there are probably nearly 450 Million head of small ruminants
in SSA and close to 200 Million head of cattle.
0.03
0.04
0.05
0.06
1965 1970 1975 1980 1985 1990
Cu
ltiv
ate
d h
ecta
res
per
in
hab
itan
t

106
FIG. 5 – INCREASE IN NUMBERS OF DOMESTIC ANIMALS IN AFRICA (Source: FAO, 2001; in Tacher
et al, 2001)
• Pressure on lion prey habitat
Change in lion prey availability can be a direct consequence of human development as
exposed in the preceding paragraphs.
The availability of prey species, not surprisingly, has a direct effect upon the population
density of lions (Schaller, 1972; Dunham, 1998; Dublin & Ogutu, 1998; many others). Low
prey densities result in low lion densities.
In Northern CAR, for instance, the recent decline of lion populations may be partly due to the
decrease of kob (Buffon’s kob, bohor reedbuck, defassa waterbuck) populations submitted to
severe poaching pressure (J. Tello, pers. comm.), even though another cause is the systematic
shooting of lions by nomadic cattle herders entering Protected Areas during the dry season (B.
Chardonnet, pers. comm.).
An adult female lion needs a minimum of 5kg of meat per day to maintain basic metabolic
requirements (Schaller, 1972). Lions also need more room than any other predator. Their
behaviour, predatory and reproductive strategies etc. show extensive regional variation. They
are highly adaptable. Fundamental ecological and behavioural characteristics of carnivores
such as density, grouping, pattern, range size and prey selection are influenced respectively
19611970
19801990
19951999
camels
cattle
small ruminants0
50
100
150
200
250
300
350
400
450
500
Pop
ula
tion
siz
e (i
n m
illi
on
s of
hea
ds)

107
and individually by habitat and prey density, dispersion and richness (Stander, 1997). When
wild prey availability is reduced, for instance because of drought or disappearance of wild
habitat due to expanding human settlements and activities, lions, more so than in the case of
other large predators, feel disposed to prey on domestic herds. This is particularly tempting
when, as explained previously, they can easily access the farmlands just outside the
conservation areas. Rudnai (1983) reports that a decreased availability of game in Nairobi
National Park, Kenya, in 1974-75, due to a year of drought, which caused a massive die-off of
wild ungulates, resulted in an increase in the hunting range of the resident lion prides and thus
more regular excursions of lions into the surrounding areas. During the 1980s, fatal attacks by
lions in Southern Tanzania were attributed to heavy poaching of wild ungulates, so that lions,
deprived of natural prey, turned to livestock and entered villages (Nowell & Jackson, 1996).
• Domestic animal/wildlife interface
The fragmentation of lion habitat due to human encroachment has led to a growing
overlapping of lion and human ranges and to a developing interface between lion and man's
activities. One of the main consequences is an increasing sanitary impact on lion populations.
- Prey diseases
A number of diseases affecting lion prey species (wild, domestic or both) may have a
significant impact on habitat quality:
- Directly, when the disease may be transmitted straight from the prey to the lion,
which is consequently infected (e.g. bovine tuberculosis/BTB), and;
- Indirectly, when the disease is not transmitted to the lion itself, but causes wildlife
die-offs and reduces prey availability with obvious consequences on the population
dynamics of the lion (e.g. rinderpest/RP).
RP is an interesting case study as:
- To the best of current knowledge, the disease is transmitted by domestic animals to
wildlife, and;
- One can observe at least two main development phases:
(i) In the first phase, the occurrence of a RP outbreak kills a large number of
susceptible species (such as giraffe, buffalo, antelopes and warthog). Predator
numbers, not just lions, increase as a result of the surplus of easily available food
resulting from sick and dead animals, and;
(ii) In a second, later, phase, the crash in prey populations leads to a reduction of
the number of predators as this exceptionally abundant food supply disappears.
Similar interactions happen when a prolonged drought causes massive wildlife or livestock
die-off.
- Lion diseases
Domestic and feral cats may act as vectors for diseases such as FCaV, FeHV, FIP and rabies,
while domestic and feral dogs may carry CDV and rabies. All of which can directly

108
contaminate lions. Furthermore, immunosuppressive disease agents such as FIV and FPV
could predispose the lions to other opportunistic illnesses.
BTB appears to be a major threat to lions in some ecosystems such as Kruger National Park
(KNP) (R. Bengis, pers. comm.), South Africa, and a potential one in Queen Elizabeth
National Park, Uganda (M. Woodford, pers. comm.). In KNP, BTB is taking a heavy toll on
lions. Sick animals are in bad physical condition, are attacked by other members of the pride,
and disappear rapidly. In the Southern part of KNP, where BTB is supposed to have been
introduced several decades ago (de Vos et al., 2001) by domestic cattle grazing along the
Crocodile river, out of 31 lions tested, all were found positive to a tuberculin skin-test, except
for two cubs of approximately 5 months of age. The disease has been slowly spreading
northwards in the Park, buffalo apparently acting as host, but affecting also greater kudu,
cheetah and leopard (Bengis & Keet, 2001). If BTB becomes endemic in KNP, it could mean
the end of its lion population, putting a stop to all export/sale of live animals to other wildlife
reserves, and a stop to the opening of KNP's fence on the Mozambique and Zimbabwe
borders, in order to protect these countries’ cattle industry and people (Winterbach, 1998).
Lion populations affected by an epizootic disease, however, have shown remarkable resilience
and potential for quick recovery, as demonstrated by the Serengeti ecosystem in Tanzania: the
CDV, transmited by dogs, was considered responsible for a 33% die-off of lions in the
Serengeti-Masai Mara ecosystem (Hofmann-Lehmann et al., 1996), where the lion population
is recovering dramatically after having been reduced by one third (Kelly, 2001).
1.2. LION VERSUS PEOPLE CONFLICTS
The African lions, as most large carnivores, require vast areas in which to roam. This tends to
bring lions into direct competition with people whose need for land is increasing
exponentially as human populations expand. Consequently, interactions between humans and
these large predators in Africa are increasing and human-lion conflicts are intensifying
accordingly. Human expansion and subsequent harassment by people have led to lions being
increasingly confined to conservation areas and it is on the perimeter of these that most
conflicts occur (Mills, 2000).
The interface between people and large predators in rural Africa most often consists of
predation on livestock, but also of human injuries and death. This problem is particularly
acute in the semi-arid rangelands of Africa where pastoralists compete with large wild
herbivores and in contact with lions. Lions are dangerous predators whose existence is mostly
at odds with human activities. In the mind of most rural communities in Africa, lions are
considered as pests and should be eliminated. This hostility toward lion conservation is
further exacerbated when local measures to prevent human-predator conflicts and to
compensate the losses in livestock or human lives are absent or judged inappropriate by the
affected communities. This leads to further persecution of lions by people. Different types of
management measures for conflict mitigation are currently being devised and experimented in
Africa. However, the apparent mutual exclusivity of lion cohabitation with people remains
one of the main threats to lion conservation outside Protected Areas (Jackson, 1997).

109
• Predation on livestock
In the regions of Africa where lions occur, lion predation on livestock is reported as the main
form of conflict between the predators and local people. The problem is particularly acute in
semi-arid rangelands of the Sahel and Eastern and Southern Africa where human expansion
and recent changes in land use practices have increased the competition between pastoralists,
newly settled farmers owning livestock, and lions, especially around Protected Areas.
The following reports illustrate the extent of the problem and show that lion raiding incidents
on livestock are not rare in Africa:
- In Cameroon, the lion population of Waza National Park is reported to cause serious
damage to livestock, estimated annually at 700 cattle and over 1,000 small ruminants
(sheep and goats). This amounts to an economic loss of around US$140,000 per year
(Bauer & De Iongh, 2001).
- In Kenya, data on damage to livestock were collected for the years 1970-75 from the
Kitengela Conservation Unit, an area adjoining the Southern boundary of Nairobi
National Park. Fifty-eight head of livestock were killed during the study in the area
(Rudnai, 1983). In Galana Ranch, over an approximately 20-year period (approx 1968-
1988), lion killed about 1% of livestock per year, i.e. 250-300 head of cattle (A. Radcliffe,
pers. comm.).
- In Uganda, in the vicinity of Northern Queen Elizabeth National Park, losses caused by
lion predation on livestock between 1990 and 2000 are estimated at US$6,400 (Bauer &
De Iongh, 2001).
- In Namibia, most of the lion population occurs in the North and North-East of the country
where they are found mainly in Etosha National Park (ENP) and, to a lesser extent, in
Kaudom Game Reserve, Nyae Nyae Conservancy and Western and Eastern Caprivi
(Stander, 2000). With the intensive livestock farming that has developed around the
borders of conservation areas, lion predation on livestock in these regions is a serious
issue. Along the borders of ENP and in adjacent areas, 46 cattle, 13 goats, 8 donkeys and
3 horses were killed by lions between 1984 and 1988 (Stander, 1990). A study undertaken
in the Kwando Region in East Caprivi evaluated the cost of stock raiding by lion in the
area: between 1991 and 1993, the total economic value of stock losses amounted to
US$9,073 (O’Connell-Rodwell et al., 2000). According to the same study, lions are
considered as the animals inflicting the greatest financial losses to farmers, even more
than crop raiding elephants.
- In Zimbabwe, a single example is given here for the sole District of Nyaminyami. During
the past 3 years (1999, 2000 and 2001), a total of 32 incidents have been reported to the
District wildlife officer with observed losses of 50 goats, 13 donkeys and 1 dog; 3 lions
were destroyed by PAC operations during the period, with averages of 1 lion destroyed
per year and 10 incidents per lion destroyed (Chamoko Snodia, pers. comm.). It must be
emphasized that more incidents happen which are not registered.
The socio-economic impact of these losses is sometimes severe, but is especially hard to bear
for impoverished communities with meagre income such as the Namibian Bushmen
community. In the extreme North-East of Namibia, the Tsumkwe District, adjoining the

110
Kaudom Game Reserve, is the traditional land of the Ju/Hoan San. The Bushmen community,
traditionally hunter/gatherers, resorted to small cattle farming in the early 1980s, but farming
activities were low (Stander, 1997). From 1993, pastoralism intensified in the area, in the
form of large-scale settlements, and the number of conflicts with lions increased dramatically
(Stander, 1997). Stander (1997) reports that between January 1992 and December 1993,
livestock were killed on 17 occasions. Twenty head of cattle and 5 horses (12.2% of total)
were killed. 40% of the total number of villages of the Tsumkwe District suffered from
livestock losses with an average annual loss by lion predation of US$18.75 for each affected
village. This represents a severe drawback for subsistence farmers.
To conclude, the impact of lion predation on domestic animals is highly variable depending
on the scale of the livestock operation. As mentioned above, it can be particularly devastating
for small traditional farmers who depend on few livestock to sustain their living. It is thus a
significant problem on a local level.
To fully grasp the growing importance of the livestock-lion conflict issue in some parts of
rural SSA today, it is appropriate to review here some of the driving factors that have led to
the current conflictive co-existence. These include in particular:
• The vicinity and expansion of human settlement and activities
In SSA, pastoralists and their livestock have co-existed with wildlife for some 7,000 years or
more and it is likely that few of the tensions evident today were present in the past (Bourn &
Blench, 1999). However, co-existence has become more difficult in recent times due to a
combination of reasons and circumstances.
Over much of Africa, the general trend in the 20th
century has been for livestock and wildlife
to be managed separately. National Parks were set aside and livestock and people are
excluded from the great majority of such areas in Africa today. Outside those Protected Areas,
wildlife is extensively hunted and high pressure is exerted on predators as they impede human
development. In the last few decades, demographic pressure in some parts of Africa has led to
rural people moving progressively into wild lands that were former lion habitat. Pastoralists
are gaining access to protected rangeland and villagers are farming up to park boundaries
(Bourn & Blench, 1999) containing large carnivores, thereby accelerating the potential for
lion attacks on livestock and sometimes people.
The periphery of conservation areas are therefore particularly exposed. This is where most of
the reported clashes with lions occur. The immediate vicinity of human settlements and
farmland with Protected Areas is often the direct cause of their occurrence. In some cases,
local communities, living traditionally within the boundaries of the newly created park, were
displaced right outside its borders. In this context, it is easy to understand that these
communities object to lions coming from the park to kill their livestock and sometimes
people. In addition, because of their resentment against the park system, these communities
will not hesitate to intrude into the adjacent park to let their domestic animals graze. In Waza
National Park, Cameroon, presence of cattle inside the park is increasing and people do not
hide the fact that many of the lion predation incidents on domestic animals occur inside the
park boundaries (Bauer et al., 2001). This of course multiplies the possibilities of lethal
encounters between lions and people and their livestock. Worse, according to Bauer et al.
(2001), the increasing predation on cattle by lions both outside and inside the park could
transform the entire lion population of the area into stock killers.
111
Movements of livestock and wildlife across protected areas boundaries are common in SSA as
most of the areas having the largest lion populations are not fenced. In some regions,
however, fences have been erected to prevent interaction of wild animals from the parks with
people and livestock who live outside their boundaries, but fences are costly to maintain and
are often damaged by erosion or animals like warthog. Lions can therefore move easily out of
the parks to neighbouring farmlands. In other cases, surrounding communities deliberately
destroy fences. In South Africa, on the border of Kruger National Park, the people of the
adjacent village of Makoko were found eating roasted meat of four lions. The villagers
claimed that lions coming from the park had killed eight of their cattle. According to the
South Africa’s Sunday Time of 23d March 1997, which relates the incident, the villagers had
taken 500 metres of the park fence for housing and crop protection (Cat News, 1997).
Another aspect of lion behaviour, which can further exacerbate human hostility toward lions
and cause conflicts, is what is called “surplus killing”. Similarly to some other large felids, a
lion breaking into a fenced enclosure will sometimes kill many more domestic animals than it
can eat (Nowell & Jackson, 1996). Nowell & Jackson (1996) refer to Guggisberg (1961) who
reports that six lions killed 51 ostriches kept in an enclosure but only a small part of these
animals were actually eaten.
• Preying on humans
The African lion also occasionally preys on people. Experts have noted that some individual
animals can, in certain circumstances, develop abnormally aggressive behaviour. After several
dangerous personal encounters with lions, the senior South African researcher, Ian Whyte,
considers that old, sick or injured lions, or animals that have been pushed out of a pride were
the animals that usually became man-eaters. “It is generally accepted that lions avoid man
because they have a great respect for him. This fear disappears however, after a lion has
killed a human for the first time. Lions that are held in captivity and relocated in the wild are
among the most dangerous animals in the world, purely because they have lost their fear of
humans” (CAT News, 1997).
Fatal lion attacks on local people inside or outside the perimeter of conservation areas have
often been reported, however they are not always publicised. These incidents usually take
place in or around areas with high lion density, such as the Kruger National Park (KNP) in
South Africa or the Selous Game Reserve (SGR) in Tanzania:
- Between December 1996 and August 1997 in South Africa, at least 11 (possibly more)
illegal immigrants making their way from Mozambique across the KNP on foot were
killed by lions (Cat News, 1997). In March 2002, the Star of 4th
March 2002 reports that
another Mozambican immigrant was killed by a lion and the predator then dragged his
body through the neighbouring town of Phalaborwa (Wildnet Africa, 2002).
- Between 1995 and 2000, some villages in Tanzania have suffered dramatic attacks by
lions on people. The level of conflicts around the SGR is regarded as high with 15-30
people killed each year (V. Booth, comm. pers.). One single village, on the edge of the
Selous Reserve, has had between 29 to 50 people killed a year during this period (E.
Pasanisi in Strang, 2002). In 1999 alone, a total of 21 people were killed by lions in
Southern Tanzania (J.J. Jackson, pers. comm.). However, not all the reported conflicts
occur along the borders of Protected Areas. In South-eastern Tanzania human population

112
densities are low. Precisely because of this low human density, lion populations are
widespread outside Protected Areas and the level of incidence of man-eaters in the region
is high (V. Booth, pers. comm.).
- Similarly, the Luangwa Valley in the Eastern part of Zambia provides good lion habitat
but it is also an area of human settlement, such as villages and cultivated areas. This
situation increases the chances of conflicting encounters between lions and local people.
Three fatal lion attacks on people were reported in August 1991 in the Luangwa Valley
(Yamazaki & Bwalya, 1998).
- During the 1923 rainy season, 21 people were killed by a pair of lions near Po, Burkina
Faso (Raynaud & Georgy, 1969).
• Preventing or resolving conflicts
It is apparent that locally lion predation is a significant problem in Africa, especially for rural
communities with meagre resources. Domestic animals often represent the only wealth that a
community has in rural Africa: (i) their milk and meat consitute a vital food component for
their survival, (ii) the herd is a saving mechanism and a source of cash, (iii) the social role of
livestock is of major importance in pastoralist cultures. The loss of this important resource to
marauding lions represents a real hardship and understandably creates hostility towards lions
and increased apathy and antagonism towards wildlife conservation per se. One can see here a
relation between poverty alleviation and wildlife conservation success.
A common problem associated with many Parks and Reserves in Africa is the issue of cost
and benefit. Local communities bear the costs of the protected area through the loss of stock
due to lion predation and the opportunity costs as a result of loss of grazing and arable land.
Few if any of the benefits from photographic or sport hunting tourism ever filter down to
these communities. As a consequence, wildlife is illegally hunted and the Park is fraudulently
used as pasture for cattle or as human settlement. More generally, with no tangible benefits to
these communities, wildlife-human conflicts are intensifying and are threatening the survival
of large predators inside and outside National Parks (Lichtenfeld, 2001).
Even in countries with small lion populations, the incentive to conserve the few lions left is
low. For instance, Abdoulaye Kane (pers. comm.), the IUCN Country Representative in
Senegal, mentioned “a high pressure exerted by the local populations on authorities to allow
and organise a lion killing campaign because of loss of domestic animals due to the lions”.
Many rural Africans have little or no sympathy for the predators. Additionally, responses
from the conservation authorities to address the issues are absent or not always appropriate
and compensation schemes to alleviate stock losses are often not functioning. A study carried
out in 1974-75 in the areas bordering the Southern part of Nairobi National Park in Kenya
showed that the Masai pastoralists who traditionally tolerated wildlife were less and less
willing to suffer losses by predation without compensation. As Rudnai (1983) explains,
“while these losses may be low in statistical terms, resentment engendered by even a few kills
may be out of proportion with real damage suffered, since the individuals feel they do not
benefit from game in general and predators in particular, yet have to bear the brunt of the
damage inflicted by wild animals. Even though compensation payment for livestock killed by
lions is on the books, in practice it is virtually unavailable because of a cumbersome
administration”.
113
Conservation strategies have recently been introduced in some African regions to alleviate
lion-people conflicts by encouraging local participation in conservation. In Laikipia Plateau in
Kenya, an innovative conservation project (L. Frank & R. Woodroffe) intends to reconcile
local communities with predators and lions in particular. At the basis of the scheme is the
development of cooperative ventures between commercial ranchers and local communities
where the latter receive some of the benefits derived from commercial tourism operations.
Ranchers and local communities are slowly realizing that there is more money to be made in
keeping wildlife alive (Martin, 2001).
Similar schemes are being implemented successfully in Tanzania where sport hunting makes
a positive contribution to the local economy. Under the new laws (Wildlife Policy of
Tanzania, 1998 and the forthcoming Wildlife Management Area Regulations, 2001), benefits
from trophy hunting and ecotourism go directly to local communities. Under this legislation,
the communities can draw up contracts with hunting companies and lodges. In pilot projects
this has proven a major incentive for villagers to conserve and protect game on their village
land (V. Booth, pers. comm.). The Selous Game Ranch generated US$1.28 million in 1992
and lion generated 12%-13% of this income (Creel & Creel, 1997).
Similarly, in Namibia, a system for allowing conditional rights over wildlife and returning
benefits to rural communities has been established. Through this policy, organised tourism
enterprises directed at viewing or hunting lions with benefits going to pastoralists should be
implemented: “Revenue gained through lion-tourism is expected to exceed lion-related
livestock losses, which will turn the large carnivores into a benefit for the communities in the
Kunene region” (Stander & Hanssen, 2001). These schemes, currently in place for the Kunene
and Kaudom sub-populations (P. Stander, pers. comm.), are being designed as part of a long-
term strategy to alleviate economic losses from lion predation and reduce indiscriminate
persecution of lions by farmers outside Protected Areas.
Ultimately, the survival of wildlife and lion in particular depends on their acceptance by the
people who must share their habitat. However, when the cost of cohabitation is high and
compensation is low, there is little or no incentive for conservation. As Stander (1997)
explains, “the future of large carnivores outside conservation areas in Africa depends on the
views and aspirations of the local people. Only when the local inhabitants…have a particular
interest in conserving large carnivores will their future be ensured”.
• Long-term threat to lion conservation
While human/lion conflicts may have little effect upon high-density lion populations, the
impact on smaller or fragmented lion populations that are vulnerable can be significant with
additional factors such as low density or the aridity of habitats with low prey density
exacerbating the effects. Stander (1997) considers that due to the intensity of pastoralism in
the vicinity of Kaudom Game Reserve in Namibia, on the border with Botswana, by the end
of 1995, almost all of the 27 lions present in the area had been killed: “considering some basic
ecological characteristics, such as a) low lion density, b) large home ranges, c) the relatively
small size of the Reserve, and d) intensity of pastoralism on the borders, the conflicts are
expected to have a catastrophic effect on this lion population”.
114
The prevention and resolution of human/lion conflicts is a complex problem and requires a
holistic approach. Solving this problem is not the purpose of the present study and therefore
only some of the main issues are outlined here.
• Problem lion control
The first direct response to lion-human conflict is the destruction of the offending lions by
farmers and other affected local people. Lions are shot, trapped or poisoned to prevent further
damaging incursions of the predators on their lands. A frequently used method of killing lions
that have been raiding livestock is through the use of poisons either agricultural or natural.
Farmers, particularly pastoralists in some areas have used this to great effect, even eradicating
lions in some areas, as well as indiscriminately affecting other carnivores including birds.
Given the availability of chemical pesticides in rural Africa today this is a serious threat to
many populations. In most of SSA, it is legal to kill lions when they attack domestic animals
or people. Official Problem Animal Control (PAC, battues administratives) is the
responsibility of the wildlife authorities.
In the Pan region in Botswana, an average of seven lions are killed per year through PAC,
which amounted to 14% per annum of the sub-population in 1999-2000. An average of 25
lions per year are killed in the Okavango Delta through PAC, which is less than 2% of the
sub-population (V. Booth, pers. comm.). In Botswana, in August 2000, the Department of
Wildlife and National Parks (DWNP) prohibited lion control and set a zero quota for trophy
hunting for one year. According to Sarel van der Merwe (pers. comm.), chairman of the
African Lion Working Group of the IUCN/SSC, reports from the Makgadikgadi Pan National
Park already indicate that, as a result of clashes between lions and livestock owners, lions are
now being illegally poisoned, snared and shot without these incidents being reported to the
DWNP.
According to P. Funston (pers. comm.), in the areas bordering the Kgalagadi Transfrontier
Park, angry South African and Botswana farmers eliminated 93 lions over a period of 4 years
up to 2001, in response to losses due to lion predation. Although the Kalahari lion population
would easily sustain the off-take (Funston, 2001), it does demonstrate the nature and size of
the problem.
In Namibia, around Etosha N.P. alone, more than 30 lions are killed every year through PAC
activities (Stander, 2000). This is confirmed by the Namibian Government biologist, Hu Berry
(1996), who reports that during the period 1965-94, more than 1,000 lions were destroyed on
farmlands bordering Etosha (Etosha Ecological Institute records). He further indicates that the
number of animals killed may have been higher because before 1995, farmers were not legally
bound to report the killing of lions to the administration. In the Caprivi, an average of 7.2
lions have been shot each year, for the last 5 years (P. Stander, pers. comm.).
In Galana Ranch in Kenya, between 1968 and 1988, persistent stock raiding lions were shot,
and roughly 1 lion was shot for every 10 cattle killed. Approximately 25 lions per year were
shot out of a stable population of 150. In the period 1988-1990 the Government prohibited
the use of firearms, and numbers of livestock killed rose to roughly 250 to 800 per year; with
approximately 70% of the stock raiding lions being young males. Around 1990, the ranch was
handed over to ADC, a parastatal company, who now uses poison to control stock raiding
lions (A. Radcliffe, pers. comm.).

115
Several non-lethal management options are also currently being tested and implemented.
When it is deemed unnecessary to kill stock-raiding lions, they are either lured back into their
normal range or translocated away from the area. The process involves capturing a specific,
problem-causing lion alive in the area of conflict, transporting it to another area and releasing
it (Linnell et al., 1997). Translocation has been experimented with mixed results in Namibia
(Stander, 1990). Extensive research on translocations of problem lions showed that this does
not solve problems nor reduce the conflicts (Stander, 1990). When conflict persists, lions are
generally destroyed (V. Booth, pers. comm.).
• Improving management strategies
Other methods employed besides removing the offending animals, consist of simply
excluding lions through management practices. Erecting electric fences between conservation
areas and densely populated human zones or farmlands can be an effective way to keep the
lions away from humans (Yamazaki & Bwalya, 1999). On their side, cattle raisers have a
responsibility to implement sound stock management practices to protect their animals from
lion predation. Simple measures such as erecting lion-proof shelters for livestock at night can
make a big difference (Mills, 2000). Changes in modern society also affect traditional
husbandry methods, for instance, in rural Namibia, young boys used to protect herds at night.
However, with the independence of Namibia in 1991 and increased access to schools, herds
are now left unattended at night and they wander into predator areas (O’Connel-Rodwell et
al., 2000).
• Financial compensation
Financial compensation for losses resulting from lion predation can be the final step and a
way to encourage local people to tolerate lions’ presence. Compensation can be an effective
tool when it is not abused (Nowell & Jackson, 1996). However, while it may be feasible to
assess the level of livestock losses, the exercise relates to values which can only be accounted
for with great difficulty in the case of loss of human life. Generally speaking, lethal and non-
lethal control options for lion conflict resolution are costly. The system of compensation
requires that the central wildlife authorities have the appropriate financial resources and the
capacity to implement the scheme. This can be a major impediment for conflict resolution in
African countries where budgets for conservation are low.
However, compensation is essentially a negative payment. It does little to remove the over-
riding conflict of interest between local peoples’ development aspirations and the
conservation of lions. Ultimately, measures consisting of creating or increasing the value of
lions to local people through ecotourism and hunting operations while ensuring that the
benefits from such operations accrue to local communities might be a suitable option to
alleviate conflicts and to improve people’s perception of the predators, thus creating the local
incentive to conserve lion populations.
116
2. LION AS A RESOURCE
Game viewing is often presented as "non-consumptive" use whereas other forms of use such
as tourist hunting or live sales are presented as "consumptive" use. This distinction is certainly
Manichaean and even possibly invalid as has been pointed out by the Southern Africa
Sustainable Use Specialist Group of IUCN/SSC (SA/SUSG, undated): “many uses which are
non-consumptive at the level of the individual are consumptive at the level of the ecosystem.
By the same token, certain uses which are consumptive of individuals are non-consumptive at
the ecosystem level. Our primary concern is that use be sustainable at the level of the
ecosystem”. However, despite its obvious ambiguity, the distinction between "non-
consumptive" and "consumptive" is nonetheless used here because it is easily understandable
and widely accepted.
Game viewing and tourist hunting are often presented as being exclusive one from the other.
This is not always the case. There are many examples where both activities are carried out
side-by-side, together with trekking, wildlife-watching and live capture. One of the best
example is the outstanding Pilanesberg Reserve, South Africa, where all these activities are
carried out simultaneously with great success in a small area. Even though less spectacular,
many other cases exist, particularly in Southern African countries such as Botswana:
"…a combination of photographic and hunting safaris ensure the economic viability of the
Wildlife Management Areas in Botswana in a way that neither can achieve on their own”
(Van der Merwe, 2001).
The income generated specifically by lions is poorly documented and publicised. Regardless
of the distinction between consumptive and non-consumptive use, lions bring foreign
currency through tourist wildlife viewing and consumptive tourist hunting as well as live
sales. There are also non-monetary benefits due to (i) the key role lions play in the ecosystem
and (ii) the spiritual value of the lion in local cultures.

117
Mau
rita
nia
clo
sed
smal
l &
med
ium
gam
ecl
ose
d0
0
Gam
bia
clo
sed
smal
l &
med
ium
gam
ecl
ose
d0
0
Sen
egal
op
ensm
all,
med
ium
& b
ig g
ame
clo
sed
op
en1
0
Gu
inea
Bis
sau
op
ensm
all,
med
ium
& b
ig g
ame
clo
sed
clo
sed
00
Gu
inea
op
ensm
all
gam
ecl
ose
dcl
ose
d0
0
Mal
io
pen
smal
l &
med
ium
gam
ecl
ose
dcl
ose
d0
0
Sie
rra
Leo
ne
clo
sed
clo
sed
00
Lib
eria
clo
sed
clo
sed
00
Su
b-t
ota
l 1
46
01
Co
te d
'Iv
oir
ecl
ose
dcl
ose
d (
du
e to
reo
pen
)cl
ose
dcl
ose
d1
1
Gh
ana
clo
sed
big
gam
e li
mit
ed t
o s
pec
ial
lice
nse
scl
ose
dcl
ose
d2
0
Su
b-t
ota
l 2
01
00
Bu
rkin
a F
aso
op
ensm
all,
med
ium
& b
ig g
ame
op
eno
pen
22
To
go
clo
sed
lim
ited
au
tho
riza
tio
ncl
ose
dcl
ose
d0
0
Ben
ino
pen
smal
l, m
ediu
m &
big
gam
eo
pen
op
en2
1
Nig
ercl
ose
dte
mp
ora
rily
clo
sed
clo
sed
clo
sed
21
Nig
eria
clo
sed
clo
sed
clo
sed
clo
sed
21
Su
b-t
ota
l 3
23
22
61
02
3
*
qu
ali
ty o
f cu
rren
t w
ild
life
vie
win
g (
rati
ng
fro
m 0
to
3)
**
q
ua
lity
of
curr
ent
lio
n v
iew
ing
(ra
tin
g f
rom
0 t
o 3
)
TA
BL
E 2
4 -
ST
AT
US
OF
LIO
N U
SE
IN
WE
ST
ER
N A
FR
ICA
3
To
tal
n°
cou
ntr
ies
(ou
t o
f 1
5)
No
n-c
on
sum
pti
ve
use
Lo
cal
hu
nti
ng
Tou
rist
hu
nti
ng
1 2
Co
un
try
N°
sub
-
po
pu
lati
on
Wil
dli
fe
vie
win
g*
Lio
n
vie
win
g*
*
Lo
cal
lio
nh
un
tin
g
To
uri
st
lio
nh
un
tin
g
Co
nsu
mp
tiv
e u
se
Lio
n h
un
tin
gH
un
tin
g
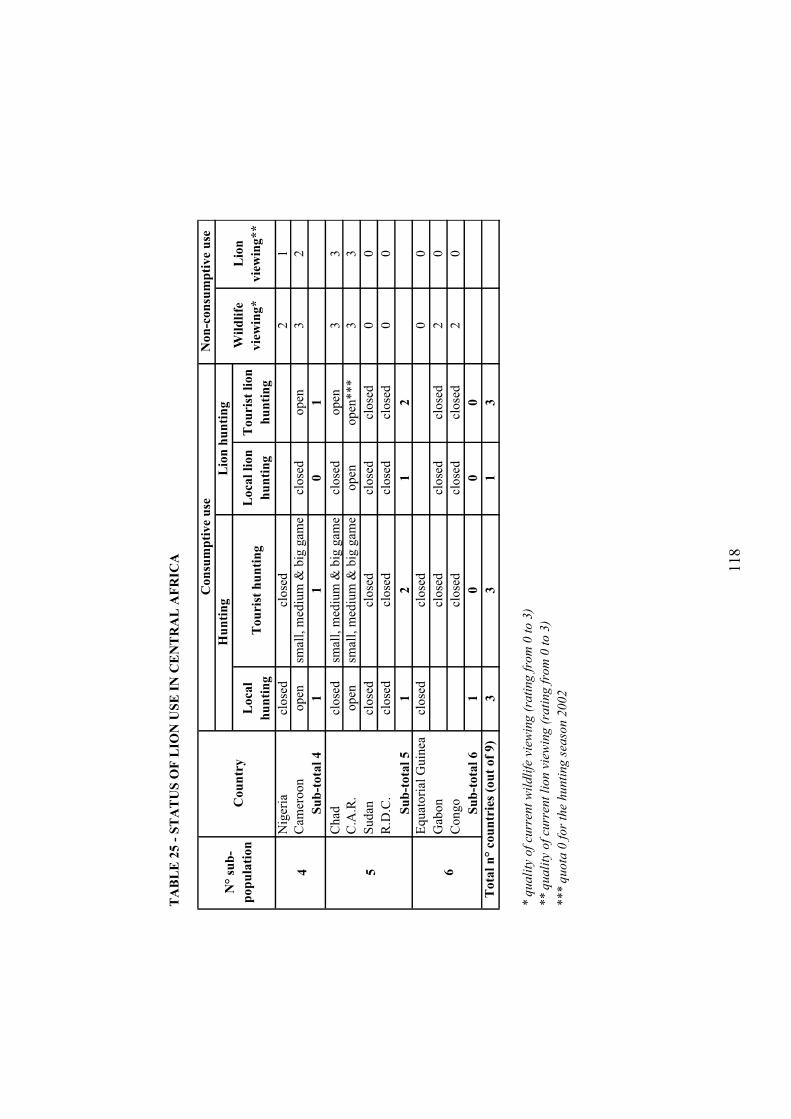
118
TA
BL
E 2
5 -
ST
AT
US
OF
LIO
N U
SE
IN
CE
NT
RA
L A
FR
ICA
Lo
cal
hu
nti
ng
Tou
rist
hu
nti
ng
Lo
cal
lio
n
hu
nti
ng
To
uri
st l
ion
hu
nti
ng
Nig
eria
clo
sed
clo
sed
21
Cam
ero
on
op
ensm
all,
med
ium
& b
ig g
ame
clo
sed
op
en3
2
Su
b-t
ota
l 4
11
01
Ch
adcl
ose
dsm
all,
med
ium
& b
ig g
ame
clo
sed
op
en3
3
C.A
.R.
op
ensm
all,
med
ium
& b
ig g
ame
op
eno
pen
**
*3
3
Su
dan
clo
sed
clo
sed
clo
sed
clo
sed
00
R.D
.C.
clo
sed
clo
sed
clo
sed
clo
sed
00
Su
b-t
ota
l 5
12
12
Eq
uat
ori
al G
uin
eacl
ose
dcl
ose
d0
0
Gab
on
clo
sed
clo
sed
clo
sed
20
Co
ng
ocl
ose
dcl
ose
dcl
ose
d2
0
Su
b-t
ota
l 6
10
00
33
13
* q
ua
lity
of
curr
ent
wil
dli
fe v
iew
ing
(ra
tin
g f
rom
0 t
o 3
)
**
qu
ali
ty o
f cu
rren
t li
on
vie
win
g (
rati
ng
fro
m 0
to
3)
**
* q
uo
ta 0
fo
r th
e h
un
tin
g s
easo
n 2
00
2
To
tal
n°
cou
ntr
ies
(ou
t o
f 9
)
5 64
No
n-c
on
sum
pti
ve
use
N°
sub
-
po
pu
lati
on
Co
un
try
Co
nsu
mp
tiv
e u
se
Hu
nti
ng
Lio
n h
un
tin
g
Wil
dli
fe
vie
win
g*
Lio
n
vie
win
g*
*
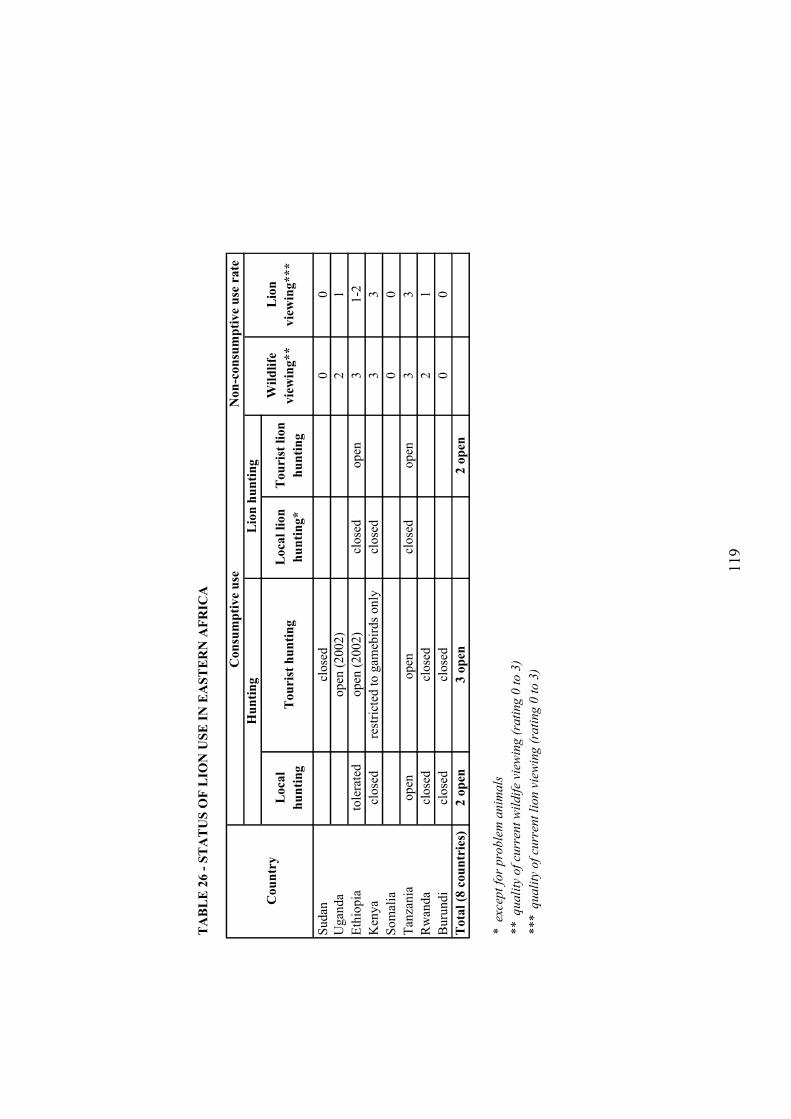
119
TA
BL
E 2
6 -
ST
AT
US
OF
LIO
N U
SE
IN
EA
ST
ER
N A
FR
ICA
Su
dan
clo
sed
00
Ug
and
ao
pen
(2
00
2)
21
Eth
iop
iato
lera
ted
op
en (
20
02
)cl
ose
do
pen
31
-2
Ken
ya
clo
sed
rest
rict
ed t
o g
ameb
ird
s o
nly
clo
sed
33
Som
alia
00
Tan
zan
iao
pen
op
encl
ose
do
pen
33
Rw
anda
close
dcl
ose
d2
1
Bu
run
di
clo
sed
clo
sed
00
Tota
l (8
cou
ntr
ies)
2 o
pen
3 o
pen
2 o
pen
*
exce
pt
for
pro
ble
m a
nim
als
**
q
ua
lity
of
curr
ent
wil
dif
e vi
ewin
g (
rati
ng
0 t
o 3
)
**
*
qu
ali
ty o
f cu
rren
t li
on
vie
win
g (
rati
ng
0 t
o 3
)
Non
-con
sum
pti
ve
use
rate
Hu
nti
ng
Lio
n h
un
tin
g
Wil
dli
fe
vie
win
g*
*
Lio
n
vie
win
g*
**
Loca
l
hu
nti
ng
Tou
rist
hu
nti
ng
Lo
cal
lio
n
hu
nti
ng*
Co
un
try
Con
sum
pti
ve
use
Tou
rist
lio
n
hu
nti
ng
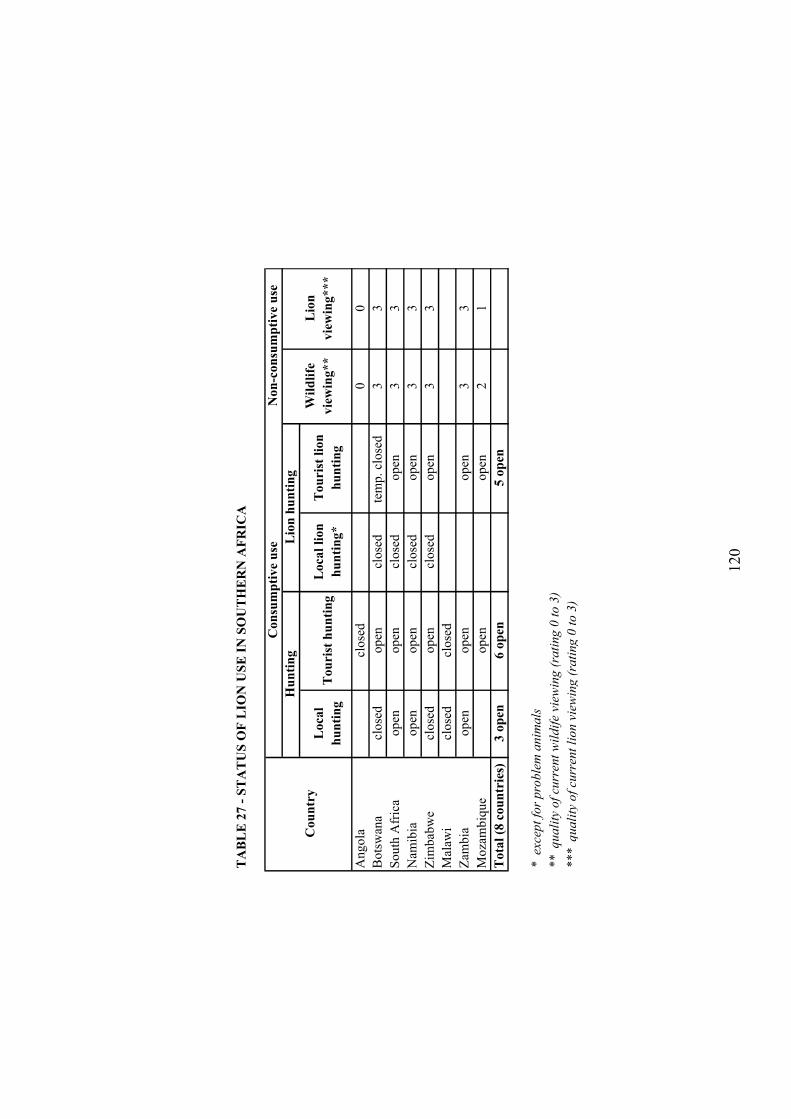
120
TA
BL
E 2
7 -
ST
AT
US
OF
LIO
N U
SE
IN
SO
UT
HE
RN
AF
RIC
A
An
go
lac l
ose
d0
0
Bo
tsw
ana
clo
sed
op
encl
ose
dte
mp
. cl
ose
d3
3
So
uth
Afr
ica
op
eno
pen
clo
sed
op
en3
3
Nam
ibia
op
eno
pen
clo
sed
op
en3
3
Zim
bab
we
clo
sed
op
encl
ose
do
pen
33
Mal
awi
clo
sed
clo
sed
Zam
bia
op
eno
pen
op
en3
3
Mo
zam
biq
ue
op
eno
pen
21
To
tal
(8 c
ou
ntr
ies)
3 o
pen
6 o
pen
5 o
pen
*
exce
pt
for
pro
ble
m a
nim
als
**
q
ua
lity
of
curr
ent
wil
dif
e vi
ewin
g (
rati
ng
0 t
o 3
)
**
*
qu
ali
ty o
f cu
rren
t li
on
vie
win
g (
rati
ng
0 t
o 3
)
Lo
cal
lio
n
hu
nti
ng
*
Co
un
try
Co
nsu
mp
tiv
e u
se
To
uri
st l
ion
hu
nti
ng
No
n-c
on
sum
pti
ve
use
Hu
nti
ng
Lio
n h
un
tin
g
Wil
dli
fe
vie
win
g*
*
Lio
n
vie
win
g*
**
Lo
cal
hu
nti
ng
Tou
rist
hu
nti
ng

121
2.1. LION VIEWING TOURISM
- Western Africa
The tourist infrastructures and trade are not well developed in this region, and wildlife-based
tourism is considerably under-developed, as compared to other regions. The reasons are
climatic as well as economic, in comparison with competition from Eastern and Southern
Africa.
However, out of the 15 countries of the region, 7 (half) have been identified as having
significant wildlife viewing, of which 5 allow some lion viewing. The two countries where
one has the best chance to actually see lions in the region are (i) Burkina Faso and (ii) Benin
(Table 24).
- Central Africa
Similarly to Western Africa, the tourist infrastructures and trade are not well developed in this
region, and wildlife-based tourism is considerably under-evaluated.
However, out of the 9 countries of the region, 6 (two thirds) have been identified as offering
significant wildlife viewing possibilities, of which 4 allow some lion viewing. The three
countries where one has the best chance to observe lions in the region are (i) Cameroon, (ii)
CAR and (iii) Chad (Table 25). It is too poorly publicised that lions are indeed quite easy to
see by tourists in those last three countries, with a relatively high lion observation rate, as
compared to other countries.
- Eastern Africa
Out of the 8 countries of the region, 5 (two thirds) have been identified as having significant
wildlife viewing, all of them allowing some lion viewing. The two countries where one has
the best chance to view lions in the region are (i) Kenya and (ii) Tanzania (Table 26).
In Kenya, the lion is recognised as one of the first wildlife viewing attractions (Thresher,
1981).
In Tanzania, lions are a major attraction in Protected Areas, particularly in the Northern
tourist circuit (Serengeti, Lake Manyara and Tarangire National Parks, Ngorongoro Crater
Conservation Area), but also in the Southern tourist circuit (Selous Game Reserve, Mikumi
and Ruaha National Parks). The economic impact of tourism is certainly positive, but heavy
non-consumptive pressure in some highly frequented areas is thought to adversely affect
lions. Lion populations in Tanzania are also subject to research studies due to their easy
accessibility.
- Southern Africa
Out of the 8 countries of the region, 6 (three quarters) have been identified as having
significant wildlife viewing, all of them allowing some lion viewing. Five out of six offer a
good chance to view lions (Table 27).
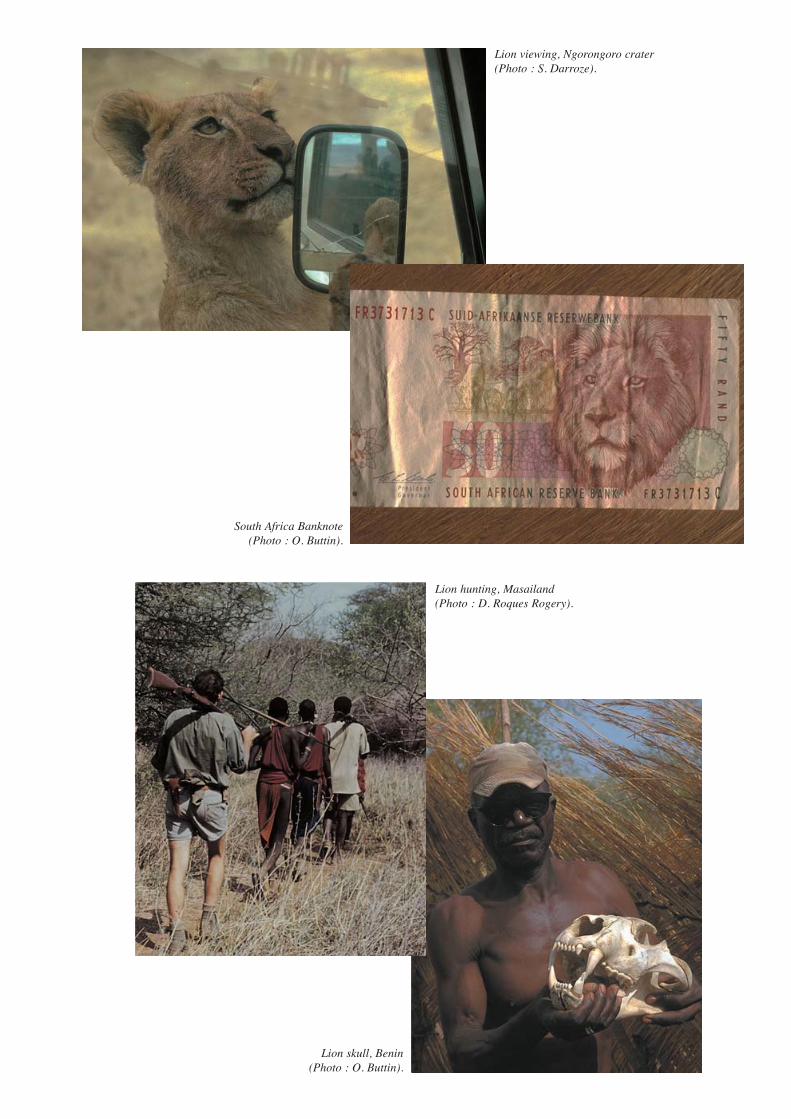
Lion viewing, Ngorongoro crater (Photo : S. Darroze).
South Africa Banknote (Photo : O. Buttin).
Lion skull, Benin (Photo : O. Buttin).
Lion hunting, Masailand (Photo : D. Roques Rogery).

122
In Botswana, there is a policy of low volume, high priced ecotourism and lions are a major
draw card for tourists in the National Parks. Photographic tourism is concentrated in the areas
with perennial water, i.e. the Okavango Delta and along the Linyanti/Chobe rivers. There are
virtually no photographic camps in the dry areas of Northern Botswana and a limited number
of camps in Central and Southern Botswana. In the Northern regions, the current ecotourism
use is beneficial due to income generation. The Central regions presently have a low rate of
ecotourism use that has little or no impact on lion conservation. There is a beneficial impact
on lion conservation in the Southern Kalahari/Kgalagadi Region. The economic viability of
community based Wildlife Management Areas in Southern Botswana (KD/1 and KD/2)
depends on a sustainable lion hunting quota because of the low value of the areas for
photographic tourism. No bids were received for photographic tourism in the KD/1 and KD/2
tenders until a lion hunting quota was allocated to these areas. If these areas return again to
not being economically viable, the communities would no doubt want to change their pattern
of land use from wildlife to livestock (P. Funston & C. Winterbach, pers. comm.).
In Malawi, active and good quality ecotourism is regarded as a positive factor in wildlife
protection, but only a minute number of lions are present in this heavily populated country.
The positive effect of ecotourism on lions is most noticeable in Liwonde National Park where
a large and active game lodge at Mvuu Camp is central to the country’s most successful
wildlife protection efforts. Two immigrant lions have established themselves within the last
year, presumably originating from Mozambique (T. Ferrar, pers. comm.). The tourism camp
in Liwonde NP provides considerable benefits to local communities and to the conservation
agencies and NGOs active in the area. It is the largest tourism operation in any of the Parks
holding lions. A much smaller tourism operation at Vwaza Marsh Wildlife Reserve also has a
beneficial effect on wildlife around Lake Kazuni, including lions.
In Zimbabwe, non-consumptive use of lion consists of wildlife viewing and wildlife
photography:
- In State lands: National Parks and some other Protected Areas such as Matetsi Hunting
Blocks;
- In some communal lands on the Kariba lake shore and in the Zambezi valley, and;
- Less so in private lands, except for a few conservancies.
The wildlife viewing tourism has declined steeply since 2000 following civil unrest, and
currently, non-consumptive tourism is at a low level while tourist hunting is remaining quite
stable.
In South Africa, most game reserves have tourism infrastructure and lions form an important
component of the wildlife experience and serve as a major draw card for tourists to the Parks
and Reserves. In general, the impact of use on lion conservation is positive in South Africa as
this is a mechanism by which revenue is created. In Kwandwe, the reintroduction of lions will
be beneficial provided the lions prey on the common species and do not kill the disease-free
buffalo and black rhino. Currently at Kwandwe, the lions are feeding on the endemic and
abundant kudu and warthog populations.
2.2. LION HUNTING
Several modes of hunting are practised in SSA, however two main categories are presented
here:
123
(i) Local hunting which is understood as the offtake of lions by local communities for
various purposes, either positive (source of any kind of benefit including social and
cultural) or negative (e.g. destruction of problem animals) and;
(ii) Tourist hunting considered as the cropping of lion (essentially adult males) for sport
and trophy collection by tourist hunters, either resident or expatriates.
• Local hunting
- Western Africa
In Western Africa there is probably relatively little local lion hunting occurring, although
pastoralists may shoot or poison lions in order to protect their stock. But not much data is
available about the overall effects of local hunting in the region. Data is sparse in this area,
which may account for the small number of lions hunted each year.
- Central Africa
The situation of Central Africa may be slightly different from that of West Africa, in that
more lions occur as well as more lion depredation. Very little quantitative data is available.
However it is safe to assume that a number of lions are killed each year in defence of stock,
especially in situations where transient cattle-herders enter into Protected Areas.
- Eastern Africa
In Kenya, there are widespread traditional cultural uses, notably of lions speared. In the Masai
communities, when a particularly large-maned lion is killed, the mane is taken and used at
ceremonies or hung upon the warrior’s village flag pole. When a lion is killed, the tail is cut
off and becomes the property of the warrior who put the first spear in. After the initial
celebrations this tail is discarded. Paws are also cut off and used in the celebrations and then
also discarded. Paws and teeth appear not to be kept. In the case of poisoning nothing is taken
(A. Radcliffe, pers. comm.).
- Southern Africa
The lion does not appear as a common major species for local hunting in this region.
However, more in-depth studies are needed to explore this interesting subject.
• Tourist hunting
- Sub-Saharan Africa
In SSA, out of 32 countries which are permanent lion Range States, a total of 13 countries
(40%) operate lion tourist hunting activities (Tables 24, 25, 26, 27).
In 2001, the Executive Director of UNEP, Dr. Klaus Töpfer, declared: “The sustainable
utilisation of wild animals through trophy hunting offers economic incentives to the local
rural population, reduces poaching and offers incentives to conserve critical habitat”. Tourist
hunting has quite different characteristics from other forms of off-take in that the harvest is
usually confined to a relatively minute segment of the population so that the impact on the
population is very small (Bell & McShane-Caluzi, 1984). In most cases, it is preferable to
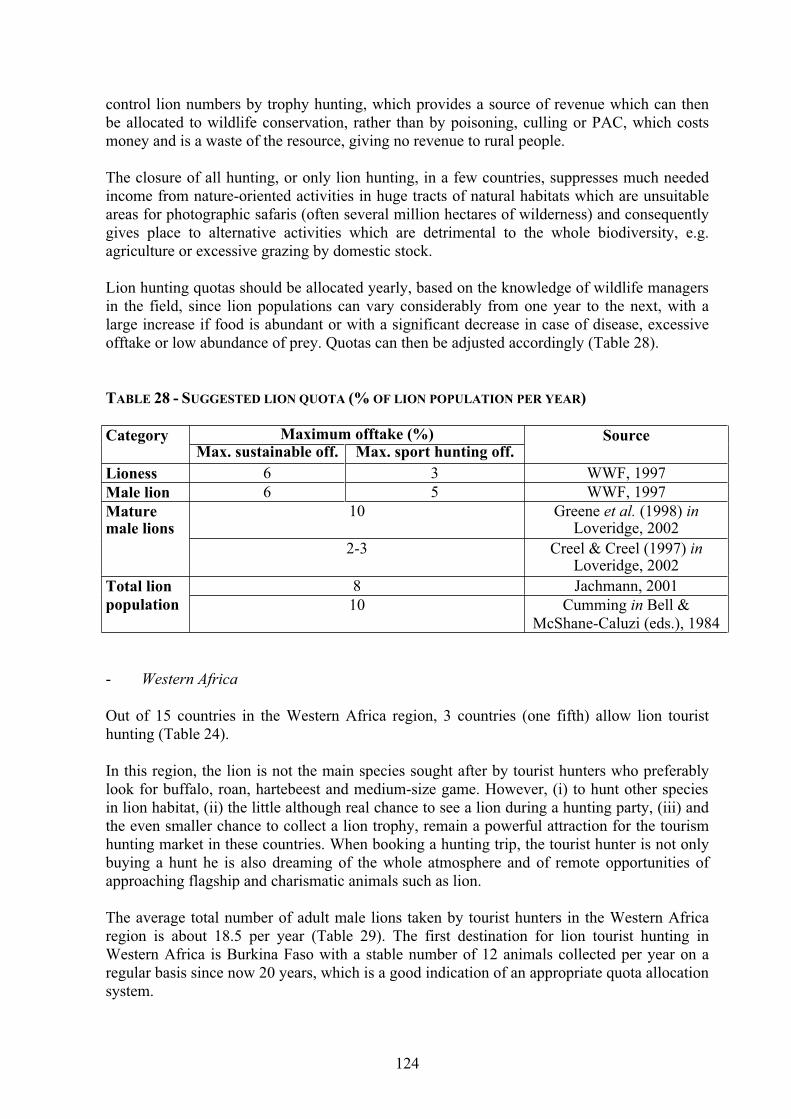
124
control lion numbers by trophy hunting, which provides a source of revenue which can then
be allocated to wildlife conservation, rather than by poisoning, culling or PAC, which costs
money and is a waste of the resource, giving no revenue to rural people.
The closure of all hunting, or only lion hunting, in a few countries, suppresses much needed
income from nature-oriented activities in huge tracts of natural habitats which are unsuitable
areas for photographic safaris (often several million hectares of wilderness) and consequently
gives place to alternative activities which are detrimental to the whole biodiversity, e.g.
agriculture or excessive grazing by domestic stock.
Lion hunting quotas should be allocated yearly, based on the knowledge of wildlife managers
in the field, since lion populations can vary considerably from one year to the next, with a
large increase if food is abundant or with a significant decrease in case of disease, excessive
offtake or low abundance of prey. Quotas can then be adjusted accordingly (Table 28).
TABLE 28 - SUGGESTED LION QUOTA (% OF LION POPULATION PER YEAR)
Maximum offtake (%)CategoryMax. sustainable off. Max. sport hunting off.
Source
Lioness 6 3 WWF, 1997
Male lion 6 5 WWF, 1997
10 Greene et al. (1998) inLoveridge, 2002
Maturemale lions
2-3 Creel & Creel (1997) inLoveridge, 2002
8 Jachmann, 2001Total lion
population 10 Cumming in Bell &
McShane-Caluzi (eds.), 1984
- Western Africa
Out of 15 countries in the Western Africa region, 3 countries (one fifth) allow lion tourist
hunting (Table 24).
In this region, the lion is not the main species sought after by tourist hunters who preferably
look for buffalo, roan, hartebeest and medium-size game. However, (i) to hunt other species
in lion habitat, (ii) the little although real chance to see a lion during a hunting party, (iii) and
the even smaller chance to collect a lion trophy, remain a powerful attraction for the tourism
hunting market in these countries. When booking a hunting trip, the tourist hunter is not only
buying a hunt he is also dreaming of the whole atmosphere and of remote opportunities of
approaching flagship and charismatic animals such as lion.
The average total number of adult male lions taken by tourist hunters in the Western Africa
region is about 18.5 per year (Table 29). The first destination for lion tourist hunting in
Western Africa is Burkina Faso with a stable number of 12 animals collected per year on a
regular basis since now 20 years, which is a good indication of an appropriate quota allocation
system.

125
In the region, only one out of 16 tourist hunters is lucky enough to collect a lion, which is a
rough assessment, since not all big game hunters are pursuing lion.
The total hunting area necessary to collect a single lion is about 26,000 km², the actual surface
area hunted for lion being 14,000 km² per lion collected.
TABLE 29 - LION TOURIST HUNTING IN WESTERN AFRICA
- Central Africa
Out of the 9 countries in the Central Africa region, 3 countries (one third) allow lion tourist
hunting (Table 25).
In this region, the lion is playing a similar role for tourist hunting as in the Western African
region. The lion is not the main species sought after by tourist hunters who preferably look
after elephant, giant eland, bongo, buffalo, roan, hartebeest, korrigum and medium-sized
game.
SenegalBurkina
FasoBenin
Total
Western
Africa
Number of
individuals1 12 5.5 18.5
% out of
estimatedpopulation
3.2 2.8 2.2
Number of
licenses per year
15 200 80 295
Average
duration of a
hunting safari (days)
6 6 9
Total hunting
area13,080 7,500 5,100 25,680
Area hunted
for lion2,000 7,500 4,500 14,000
Per license & per day 0.011 0.010 0.008
Per 100 km² 0.05 0.16 0.12
Average lion
offtake per year
Big game
tourist hunting
Surface (km²)
Hunting success
rates (n° of
lions hunted)

126
The average total number of adult male lions taken by tourist hunters in the Central Africa
region is about 17.4 per year, a number comparable to that of Western Africa (Table 30), so
that the total number of lions taken by tourist hunters in the whole Western and Central Africa
regions reaches about 36 animals per year.
The first destination for lion tourist hunting in Central Africa is Cameroon with a steady
number of 9 animals collected per year on a regular basis over the last 20 years, which is an
indication of a conservative quota allocation system.
In the region, only one out of 18 tourist hunters is lucky enough to collect a lion, which is a
rough assessment, since not all big game hunters are searching for lions.
The total hunting area necessary to collect a single lion is about 59,000 km², the actual surface
area hunted for lion being 34,000 km² per lion collected.
TABLE 30 - LION TOURIST HUNTING IN CENTRAL AFRICA
Cameroon Chad C.A.R.
Total
Central
Africa
Number ofindividuals 9.4 3 5 17.4
% out of
estimatedpopulation
2.7 3.2 2.8
Number of
licences peryear
150 10 150 310
Average
duration of a
hunting safari(days)
12 10 13
Total huntingarea 23,000 6,000 30,000 59,000
Area huntedfor lion 20,000 4,000 10,000 34,000
Per licence &per day 0.005 0.030 0.003
Per 100 km² 0.05 0.08 0.05
Average lion
offtake per year
Big game tourist
hunting
Surface (km²)
Hunting success
rates (n° of lions
hunted)

127
Lion hunting results in Western and Central Africa (Tables 20 & 30) provide interesting
parameters to evaluate lion densities. Measuring the catch-per-unit effort (CPUE) is one way
of assessing lion densities when the hunting efforts are stable year after year. In five
countries where lion hunting is conducted, the lion density has been respectively compared
with the lion hunting success (number of lions trophy-hunted per 100 km²) (Figure 6). The
comparison is based on the following facts:
- The number of lions hunted is the average of the last 10 years (Benin) or 20 years
(Burkina Faso) years, except for Chad (several years);
- The number of hunters is much higher than the number of lions hunted;
- The number of hunters is roughly stable, and;
- The number of hunting days per hunter is constant over the years.
Basically, the hunting effort may be considered as constant. In sustainable conditions, the 2
curves are closely parallel, which is the case for Burkina Faso, Benin and Cameroon. When
the hunting pressure increases, the two curves diverge, which is the case for CAR and Chad.
At this stage it may be useful to remind that an increase of hunting pressure may result from
either an increasing total number of hunting days with a stable lion propulation, or a
decreasing number of lions (for one reason or another) with a stable number of hunting days.
FIG. 6 - LION DENSITY AND HUNTING SUCCESS IN WESTERN AND CENTRAL AFRICA
1.6
1.2
0.6
3.4
5
0.16
0.12
0.08
0.050.05
0
1
2
3
4
5
6
Burkina Faso Benin Chad Cameroon CAR
Lio
n d
en
sit
y (
n°/
100 k
m²)
0
0.02
0.04
0.06
0.08
0.1
0.12
0.14
0.16
0.18
Hu
nti
ng
su
ccess (
n°
sh
ot/
100 k
m²)
Lion density
Hunting success

128
- Eastern Africa
Out of 8 countries in the Eastern Africa region, 2 countries only (one quarter) allow lion
tourist hunting (Table 26).
In Tanzania, consumptive use is not allowed in National Parks and in some Reserves
(Mkomasi, Saadani). The major form of consumptive use is through trophy hunting by
tourists, but lions are also destroyed through problem animal control (PAC) which is carried
out by wildlife officials. Lions are also poisoned by herdsmen, and get caught in snares laid
by poachers for other animals. Tourist hunters operate in allocated Hunting Blocks. Currently
around 110 Hunting Blocks are being utilised (the number of Hunting Blocks varies slightly
from year to year). The overall quota of lions is around 500 per year (516 in 1996). The
trophy hunting offtake is around 50 % of the quota: on the average 250 lions are taken every
year in Tanzania (236 in 1996). This offtake appears to be sustainable, as hunting success has
remained fairly even since safari hunting was fully re-established in the late 1980’s. The
tourist hunting quotas are set for each species allowed to be hunted during the year for each
Hunting Block. However, as hunting permits are issued on a block basis, hunting success
varies between blocks depending on the occurrence and distribution of lions, which in turn
depends on a multitude of environmental factors and can thus fluctuate from year to year.
Unless problems as to the availability of lions and hunting success are reported, the same
quota will be issued for the following season. This method implies that when there are
problems reported from certain Hunting Blocks, such as sickness amongst the lions or non-
availability of trophy males, the quota is adjusted downwards depending on local population
dynamics. In some cases additional animals have been added to the quota in particular blocks.
In Tanzania, sport hunting generally makes a positive contribution to the local economy.
Under the new laws (Wildlife Policy of Tanzania, WPT, 1998 and the new Wildlife
Management Area (WMA) Regulations, 2001), benefits from trophy hunting and ecotourism
will go directly to the local communities. Under these new laws, local communities can draw
up contracts with hunting companies and lodges etc. In pilot projects this has proven a major
incentive for villagers to conserve and protect game on their village land. Giving wildlife an
economic value from the perspective of the primary stakeholders namely the villagers
encourages sustainable management of the resource. At the same time socio-economic
development is furthered, as more cash is available in the village, villagers are empowered
and management capabilities strengthened. The Selous Game Reserve generated US$1.28
million in 1992. Lions generated 12% - 13% of this income (Creel & Creel, 1997).
In Somalia, tourist hunting was reported to occur during Siad Barre’s regime up until 1991
with hunters coming from the Arab States. The continuing civil unrest in Somalia has
reportedly stopped such hunting.
- Southern Africa
Out of 8 countries in the Southern Africa region, 5 countries (two thirds) allow lion tourist
hunting (Table 27). In the Southern African region, tourist hunting is often the main source of
profit generated by wildlife (Luxmoore, 1985).
In Namibia, the national total quota ranges between 0.4 and 0.9% of the overall lion
population. Local quotas do not exceed 5% of the adult and sub-adult numbers. Trophy
hunting quotas exist for Kaudom (Nyae Nyae Conservancy) and Caprivi sub-populations:
129
. Kaudom has a mean annual quota of between 0.7, which represents about 2.2% of the
population (1997-2001), and;
. Caprivi has a mean annual hunting quota of 1.4, which is about 2.8% of the population
(1996-2001).
In Namibia, lion quotas are often set based on the frequency of problems experienced with
lions. According to P. Stander (pers. comm.), trophy hunting in this country does not have a
measurable impact on lion conservation. An attempt is being made to involve local
communities and redirect financial benefits from trophy hunting fees to curb losses due to lion
predation on their livestock.
In Botswana, trophy hunting of lions with no baiting is traditionally allowed at a national
level. Generally trophy hunting takes place in the areas less suitable for photographic safaris.
Sustainable trophy hunting and problem animal control take place in the Okavango Delta.
Lion survey data are used to set quotas in the Okavango Delta Wildlife Management Areas.
The quota, set at less than 1% offtake for trophy hunting in the Okavango Delta, is determined
by the DWNP. Problem animal control along the boundaries of Protected Areas (National
Parks, Game Reserves and Wildlife Management Areas combined) forms the largest part of
the offtake. Hunting of lion in the Dry North is considered not sustainable and the quota is to
be reviewed after a proper survey has been conducted to ensure sustainability. There is no
trophy quota in the Pans region, but problem animal control was not thought to be sustainable.
A lion PAC and lion hunting ban was imposed in November 2000. The following sport
hunting quotas were given for the year 2000:
- Okavango Delta: 12
- Linyanti/Chobe river: 3
- Dry North: 14
- Pans: 0
- Central and Southern Botswana: 10
-----------------------------------------------------
Total (national): 39
In Botswana, commercial photographic and multiple use Wildlife Management Areas are on
15-year leases. An annual fee is paid to the Government and a resource utilisation fee to the
local Government. Community Wildlife Management Areas with a Community Trust Fund
are leased to operators or communities engaging in joint ventures with operators. A resource
fee is paid to local Government. A trophy hunting licence fee is paid to Government.
Financial benefits are not enough to accrue to the conservation body. Photographic camps and
hunting camps are, however, the largest job providers. The Northern Region's economy is
driven by tourism.
In South Africa, very limited hunting of lion takes place in Krugerís surrounding reserves.
Quotas are based on advisory committee meetings with limited availabilty of data. In
Mpumalanga Parks, offtake is reactive. The only offtake of lions in Hluhluwe-Umfolozi is for
research purposes when animals are sick or in poor condition. The removals in the North
West Parks are sporadic and no fixed annual quota exists for lion but rather animals are made
available for hunting to achieve various management objectives. In such cases individual
animals are identified for removal and then tendered to hunting operators who then offer a
ìclassic huntî within the reserve (less than one lion per year on average). In South Africa,
North West Parks and Hluhluwe-Umfolozi (Kwazulu-Natal) achieve their various
management objectives through lion utilization. Very limited benefits are derived from lion
130
utilization in Mpumalanga Parks. Phinda gains exposure through their relocation programmes
and revenue is derived (although lions are donated to state-owned reserves). In Kwandwe and
Shamwari, lions are flagship species and essential for photographic tourism operations.
Without them, benefits through revenue generation would be severely reduced as tourists
want to see the ‘Big 5”.
In Zimbabwe, consumptive use mainly consists of trophy hunting mostly by foreign tourists,
but also for problem animal control. Skins and skulls are taken as trophies. During the year
2000, foreign hunters paid a total of US$1,859,932 to the safari operators who conducted the
hunts, for a total of 91 lions trophy-hunted. Lions account for only about 2% of sport hunting
revenue earned by Rural District Councils in those Communal Lands where CAMPFIRE
programmes operate (Bond, 1994). No precise data are currently available on the total annual
offtake of lions, apart from the animals collected by tourist hunters. Therefore, no opinion can
be offered on the sustainability of the annual offtake of lions, but quotas give an upper limit.
At present, there is no evidence that consumptive and/or non-consumptive uses are having
any measurable impact on the number of lions in Zimbabwe (V. Booth, pers. comm.). Lion
sport hunting quotas for Parks and Wild Life Estate, Forest Lands and Communal Lands for
the year 2002 were the following (N. Masulani, pers. comm.):
- Unflooded Middle Zambezi Valley: 40
- Sebungwe: 17
- North-west Matabeleland: 66
- South-east Lowveld: 12
- Southern Zimbabwe: 4
---------------------------------------------------------
Total (national): 139
The quotas for year 2000 were reportedly similar to that planned for 2002 (above) (N.
Masulani, pers. comm.). The quotas for 2001 were reported to have been 224 (N. Monk, pers.
comm.). It is doubtful that the variation in these numbers actually closely reflects a variation
in the number of lions:
- In the Parks and Wildlife Estate, the Department of National Parks and Wildlife
Management (DNPWM) sets sport hunting quotas after consultation with stakeholders.
Information that is considered during quota setting includes: survey results (if any), the
perceived trend in lion numbers, trophy quality and animal condition data (if any) during
the previous year, and stakeholders' opinions on lion numbers and trends;
- In the Communal Areas, the appropriate authority proposes sport hunting quotas,
which are then sent to that DNPWM for approval, and;
- On privately owned land, sport-hunting quotas are proposed by the landowner and
then sent to the DNPWM for approval.
In Zambia, interest in lion from safari hunters is substantial and growing. Over the 1995-2000
period, lions have been hunted successfully in the prime, secondary and even some of the
under-stocked Game Management Areas (GMA's). It is interesting to note that fewer licences
for lion were issued than were available on quota. Hunting pressure on lion and their prey
(plains game species) in the GMA's is largely seasonal. Poor access by road and even on foot
(particularly in the floodplain areas), dense vegetation, and the dispersed nature of wildlife
populations during the wet season months between December and May, largely preclude
successful hunting of lion and their prey during this period. In contrast, throughout the dry

131
season months, hunting pressure on lion and other species is sustained at high levels, not only
from safari hunting, but also through hunting by Special Licence (often not accountable
against quotas), local hunting, poaching and snaring activity. With many GMA’s sharing
boundaries with the principal National Parks, particularly along the major rivers, this hunting
activity continues right along the boundaries of the National Parks. The total number of lions
hunted in 2000 amounted to 78. In Zambia, based on more than 20 years’ experience, it is
estimated that trophy male offtake quotas can be set up to 8 % of the adult lion population, in
order to obtain the best male trophy quality (Jachmann, 2001). The quotas allocated for safari
and resident hunting are broadly based on prior hunting success rates, but in some cases
purely on levels of demand. Systematic assessments of hunting returns can and have been
used fairly successfully by the authorities to determine sustainable hunting quotas, but this
procedure is likely to have lapsed in recent years during the process of institutional changes in
the wildlife authorities (R. Jeffery, pers. comm.; J. Pope, pers. comm.).
In Malawi, no sport or trophy hunting of lions is permitted and none has been considered for
many years, since lions are scarce in this country.
2.3. LION TRADE
An attempt is made to investigate the possible impact of both existing national and
international trade in lion products.
• Domestic trade
There appears to be very little poaching activity specifically aimed at lions. However, lions
are indirectly at risk as a result of illegal snaring operations, which are targeting large
ungulates, and some lions will inevitably get caught accidentally. As discussed before, lions
are also destroyed by cattle-herders for protection purposes and their by-products may then
appear on the market. One can find a few skulls, skins and claws, mainly for medicinal or
cultural purposes (the lion still carries a strong socio-cultural image for a number of ethnic
groups), on local markets in Africa, but they are probably mainly by-products of poached
stock-raiding lions. As far as lion is concerned, there is no evidence of any large-scale
demand driven commercial activity such as is seen in the trade in tiger bones in Asia.
At the national level, there is practically no trade in lions or their products, with the exception
in Southern Africa of some trade in live animals for translocation purposes from one wildlife
reserve to another (reinforcement, reintroduction or even introduction).
- Western and Central Africa
In this region a few lion products may be seen exposed on local markets here and there, but
never in large numbers. Claws are the most widespread, often in jeweller's shops. The odd
skull appears also for sale, usually in traditional medicine stands in local markets, but they
often look like they actually did not find any buyer for a number of years.
- Eastern Africa
In Tanzania, there is no legal trade of significant dimension and what does occur is unlikely to
impact on the overall lion populations. However, there is some illegal domestic trade with a

132
demand for claws, teeth and tails, mostly used for witchcraft. Lion fat is used for medicinal
purposes, e.g. to treat sore muscles. The extent of this trade cannot be estimated, but there are
reports of lions killed for these products, even though the official version may oftent be PAC.
The Wildlife Conservation Act 1974 controls the offtake and the trade in lion products.
Ownership of any lion product requires a certificate, which is only issued for legally acquired
lion products, for instance, from sales after PAC. Any change in ownership requires a change
of certificate.
- Southern Africa
In Namibia, keeping and trade in lions in captivity is regulated through the Ministry of
Environmental Affairs and Tourism Policy.
In Botswana, a limited number of lion pelts from PAC are sold at public auction by the
Department of Wildlife and National Parks (DWNP).
In South Africa, no trade in lions/lion products to/from Kruger National Park takes place
because the population is suffering from various diseases such as BTB or FIV, and very little
trade takes place in the surrounding areas for the same reason. The Kgalagadi Transfrontier
Park has no trade in lions/lion products. North West Parks lions have been sought after for
relocation because (i) of the absence of lion disease, (ii) their lions are of known genetic
origin (Etosha National Park) and (iii) their lions are tourist habituated. Phinda relocates
excess lions to reserves in the Northern Province and Mpumalanga. Reintroduction of lions
from Pilanesberg and Madikwe to Hluhluwe-Umfolozi has been ongoing since 2000.
• International trade
International trade is monitored to prevent trade from having a negative impact on the
conservation status of species, even though, in some cases, international wildlife trade can
provide a positive incentive for the conservation of wild fauna and flora (IUCN et al., 1991).
The Convention on International Trade in Endangered Species of Wild Fauna and Flora
(CITES or Washington Convention) was adopted in 1973 precisely to ensure that no species
disappeared because of international trade. This Convention, which operates under the
umbrella of the United Nations Environment Programme (UNEP) (158 countries are signatory
to the Convention) regulates international trade of about thirty thousand species of wild fauna
and flora listed under three Appendices.
Panthera leo was listed on CITES Appendix III in February 1976, at the request of Ghana.
Later, it was transferred to Appendix II of the Convention on the occasion of the first session
of the Conference of the Parties (Bern, Switzerland, November 1976).
This status implies that the export of any lion, alive or dead, or of parts or products of a lion,
is submitted to the delivery of a CITES permit prior to export by the authorities of the country
from where it is exported. Some countries or communities of countries have adopted a stricter
legislation than CITES itself. According to these "stricter domestic measures", the
introduction into their territory of specimens derived from species listed on Appendix II of the
Convention also requires for an import permit to be issued.

133
Every CITES Party must report yearly to the World Conservation Monitoring Centre
(WCMC) of the UNEP, on all permits delivered within the framework of the Convention.
Therefore, the WCMC database constitutes the best source of information available to
monitor legal international trade, notably from the point of view of the nature of trade, its
volume and origin. As far as lion trade is concerned, this survey is based on the data relative
to years 1991 to 2000, as provided by WCMC/UNEP.
The word “specimen” is used according to its CITES definition, i.e. it can refer to a live lion
as well as to a complete stuffed lion, to a trophy made of the skull, the skin and the claws,
only consisting of a skin, to a claw as jewellery or to a very small piece of skin collected for
scientific analysis purposes (Table 31).
TABLE 31 - EXPORTS OF Panthera leo ALL TYPES SPECIMENS, 1991-2000 WORLDWIDE
TRADE (Source: UNEP-WCMC CITES Trade Database, 2001)
Products Code 1991 1992 1993 1994 1995 1996 1997 1998 1999 2000 Total
Bone carvings BOC 0 0 0 1 1 1 0 0 0 0 3
Bodies BOD 2 4 5 7 20 7 12 1 6 20 84
Bones BON 1 1 0 0 6 1 2 3 0 6 20
Piece of bone BOP 0 0 0 0 0 0 0 3 0 0 3
Bone products BPR 2 0 0 0 0 0 0 0 0 0 2
Carvings CAR 148 1 18 0 0 0 0 0 0 0 167
Claws CLA 834 27 1,038 117 794 582 1,232 120 72 322 5,138
Cloth CLO 0 0 0 0 0 0 0 0 8 0 8
Derivatives DER 0 1 0 0 0 0 0 0 0 0 1
Feet FOO 4 0 0 0 1 0 0 0 0 56 61
Garments GAR 0 0 0 0 0 0 0 0 1 0 1
Hair HAI 0 0 0 0 0 0 0 0 0 1 1
Handbags HAN 0 0 3 0 0 0 1 0 0 0 4
Live specimens LIV 146 188 196 163 209 178 217 253 278 176 2,004
Leather product (large) LPL 0 0 0 0 0 0 1 0 1 2 4
Leather product (small) LPS 0 0 0 43 0 0 0 1 4 6 54
Plates PLA 0 3 0 0 2 1 0 0 0 1 7
Pairs of shoes SHO 0 0 0 0 0 0 0 0 0 0 0
Skeletons SKE 0 1 0 1 0 0 0 2 0 4 8
Skins SKI 52 49 63 93 192 313 203 178 214 233 1,590
Skin/leather items SKO 2 0 0 1 0 0 0 0 0 0 3
Skin pieces SKP 0 0 0 1 3 0 0 2 0 0 6
Skulls SKU 134 42 92 45 104 20 12 123 139 196 907
Scientific specimens SPE 0 341 217 237 407 235 149 219 179 6 1,990
Tails TAI 0 0 0 0 0 0 0 0 1 0 1
Teeth TEE 18 0 0 2 7 0 0 0 231 4 262
Trophies TRO 630 679 606 687 523 505 549 518 590 667 5,954
Unspecified UNS 0 0 0 2 0 1 0 0 0 0 3
Wallets WAL 1 0 0 0 0 0 0 0 0 0 1

134
It is safe however to assume that both a “live lion” (code LIV) and a “whole stuffed lion”
(code BOD) obviously correspond to an entire animal. However, the other specimen
categories unfortunately do not allow to determine an exact figure of animals collected since,
for example, when a skin and a skull are exported separately, these two specimens can
obviously correspond to the same lion. It is also possible that lion “parts” such as feet, teeth,
claws and tails, even though exported under the corresponding codes (FOO, TEE, CLA et
TAI), should be considered as “secondary” trophy components. Therefore, some of them can
correspond to a lion whose “main” elements have been exported under code TRO, SKI or
SKU. Consequently, the results below are based on the analysis of the exports registered by
WCMC as corresponding to “main” elements of trophies (bodies, trophies, skins and skulls).
The respective role of the Range and non Range States in the trade is clear in the difference
between live and non-live sales. While the hunting trophies obviously come from the Range
States (Figure 7), 85 % of the live lions which have been internationally traded during the
period under consideration (1991 - 2000) have been exported from non Range States of the
taxon (Figure 9), and reflects the number of captive animals being traded between zoos and
wildlife parks but is not necessarily germane to this report.
FIG. 7 - RANGE STATE EXPORTS OF Panthera leo HUNTING TROPHIES, 1991-2000 (Source:
UNEP-WCMC CITES Trade Database, 2001)
1991
1992
1993
1994
1995
1996
1997
1998
1999
2000
48
606
1
46
665
2
60
593
0
90
660
5
188
508
13
291
488
1
202
526
10
164
508
0
200
568
0
228
499
10
0
100
200
300
400
500
600
700
800
Nu
mber
of
spec
imen
s
bodies
trophies
skins
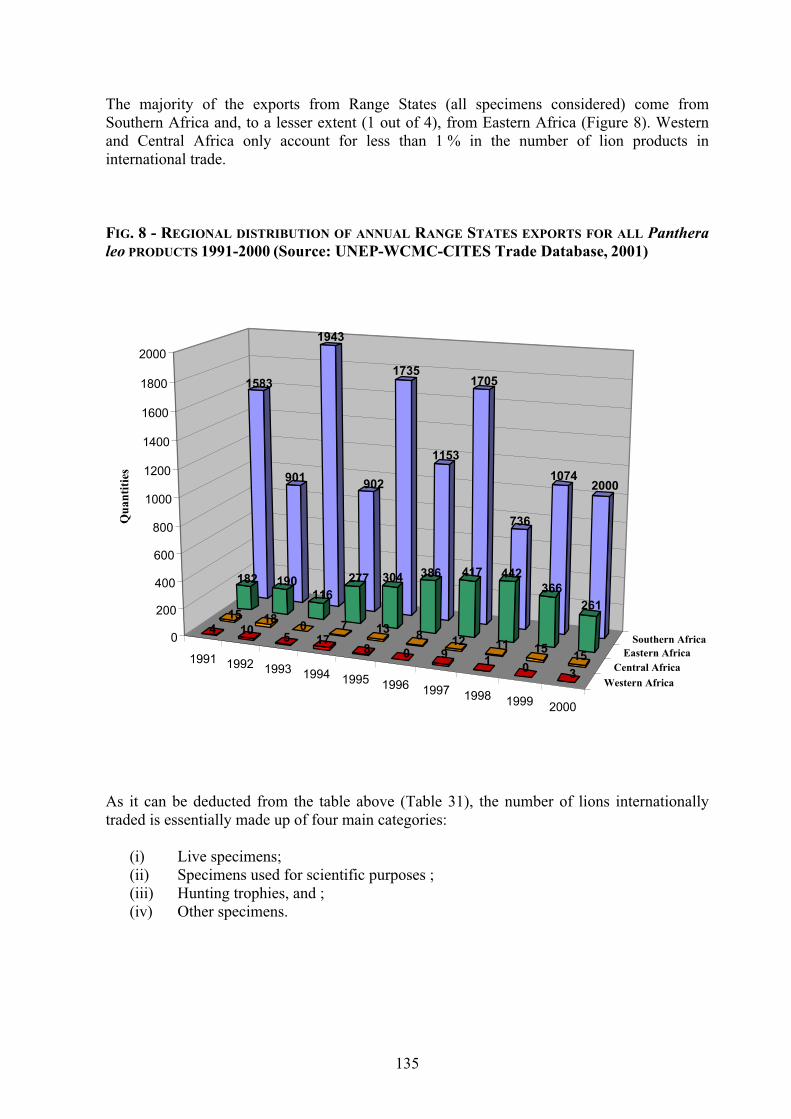
135
The majority of the exports from Range States (all specimens considered) come from
Southern Africa and, to a lesser extent (1 out of 4), from Eastern Africa (Figure 8). Western
and Central Africa only account for less than 1 % in the number of lion products in
international trade.
FIG. 8 - REGIONAL DISTRIBUTION OF ANNUAL RANGE STATES EXPORTS FOR ALL Panthera
leo PRODUCTS 1991-2000 (Source: UNEP-WCMC-CITES Trade Database, 2001)
As it can be deducted from the table above (Table 31), the number of lions internationally
traded is essentially made up of four main categories:
(i) Live specimens;
(ii) Specimens used for scientific purposes ;
(iii) Hunting trophies, and ;
(iv) Other specimens.
19911992
19931994
19951996
19971998
19992000
Western Africa
Central Africa
Eastern Africa
Southern Africa
1583
901
1943
902
1735
1153
1705
736
10742000
182 190116
277 304 386 417 442
366
26115 18
0 7 138 12 11 15
15
4 105 17
8 0 91
03
0
200
400
600
800
1000
1200
1400
1600
1800
2000
Qu
an
titi
es

136
(i) Live specimens
These specimens are mainly sold between zoos and wildlife parks, circuses or, for a very
small number, to be translocated into the wild for reinforcement (to increase numbers of an
existing population and to enlarge its gene pool), reintroduction or introduction purposes.
During the period under consideration (1991-2000) 2,004 live specimens (i.e. 2,004 lions)
have been exported, i.e. about 200 live lions per year. Only few of these have originated from
Range States: during the period under consideration, 10 Range States have exported a total
number of 305 live lions, representing only 15 % of the worldwide trade in this category of
specimens (Figure 9). South Africa (164), Namibia (84) and Zimbabwe (30) were the three
main exporters of live lions, but it can be seen that, out of that total, only 87 were taken from
the wild (Table 32). As a result, since exports of live lions mainly concern specimens
originating from zoos, wildlife parks or other establishments where they are bred in captivity,
it may be assessed that this trade has a negligible impact on free-ranging lion conservation
status.
TABLE 32 - EXPORT OF LIVE AFRICAN LIONS BY RANGE STATES BETWEEN 1991 AND 2000
(Source: UNEP-WCMC CITES Trade Database, 2001)
Number of live lions exported by Range States
between 1991 and 2000Country
Total number Number taken from the wild
Ethiopia 2 -
Kenya 13 4
Malawi 6 6
Namibia 84 25
Niger 2 -
Senegal 4 -
South Africa 164 29
Tanzania 4 2
Zambia 2 2
Zimbabwe 30 19
Total 305 87

137
FIG. 9 – SHARE OF RANGE STATES EXPORTS AS COMPARED TO WORLDWIDE TRADE IN
Panthera leo LIVE SPECIMENS (Source: UNEP-WCMC CITES Trade Database, 2001)
(ii) Specimens used for scientific purposes
A total number of 1,990 “specimens” belonging to this category were exported over the same
10 year period, i.e. about 200 per year.
It is worth noting that:
- Some of these scientific specimens may have been collected on live lions, and;
- They often correspond to small pieces of skin, hair, etc.
(iii) Hunting trophies
CITES Notification 2002/022 of 9 April 2002 states the following guidelines:
- Exports "of substantially dead animals, […] whole stuffed hunting trophies" must be
exported under code BOD;
- When all the trophy parts of one animal are exported together (as far as lion is
concerned: the skin, the skull, the feet, the claws, the teeth, the tail), it has to be
considered that they make up a trophy and that therefore they should be exported
under code TRO; however, when the skull and the skin are the sole specimens of an
animal which are exported, they should also be registered together as a trophy (TRO);
1991 1992 19931994
19951996
19971998
19992000
Exports from Range States
Exports Worldwide
146
188 194
163
209
178
217
251
278
172
14 14
46
6
35 3628
51 57
240
50
100
150
200
250
300
Qu
an
titi
es

138
- A skin alone should be registered under code SKI, and;
- Similarly, a skull alone should be registered under code SKU, claws under code CLA,
etc.
Therefore, a specimen exported under code BOD, either may be a hunting trophy, fully
mounted by a taxidermist in the Range State of origin, or it can be a whole stuffed lion which
is exchanged from one Museum to another.
Very often, CITES permits do not mention separately the different parts which make up a
hunting trophy. As far as lion are concerned, hunting trophies are essentially made up of the
skin, skull and claws (UNEP-WCMC CITES Trade Database, 2001). In spite of the guidelines
set out by the Convention, the skull, the skin and the claws exported as “hunting trophy” can
eventually be registered under three different codes (SKU, SKI or CLA) rather than under the
single code TRO (hunting trophy). This largely depends on the personal interpretation of the
agent in charge of the export permit issuance. For this reason, the annual average figure of
700 lions/year, exported by tourist hunters, is probably overestimated for the two main
following reasons:
- More than one permit may be issued under code TRO for a number of specimens
which are parts of the same lion, rather than corresponding to different lions, and;
- It is possible that some permits delivered under code BOD do not correspond to
hunting trophies.
The exporting Ranges States of lion hunting trophies may be classified in three categories,
over the ten-year period under consideration (1991-2000) (Table 33):
1st: 14 countries have exported less than 100 African lion hunting trophies over the
period, i.e. an average of 10 lions per year: Mali (0); Niger (0), Chad (1), DRC (1),
Sudan (2), Senegal (4), Malawi (11), Kenya (12), Benin (13), CAR (20), Burkina Faso
(34), Ethiopia (42), Mozambique (84), Cameroon (98);
2d: 2 countries exported between 100 and 1000 hunting trophies over the 10 year period:
Namibia (188) and Zambia (368), and;
3d: 4 countries exported more than 1000 trophies over the period: Botswana (1,008),
Zimbabwe (1,078), South Africa (1,990) and Tanzania (2,226).

139
TA
BL
E 3
3 -
EX
PO
RT
S O
F P
an
thera l
eo
HU
NT
ING
TR
OP
HIE
S B
Y R
AN
GE
ST
AT
ES
(S
ou
rce:
UN
EP
-WC
MC
CIT
ES
Tra
de
Data
base
, 2001)
Yea
rs
Pro
du
cts
SK
IT
RO
BO
DS
ub
-t.
SK
IT
RO
BO
DS
ub
-t.
SK
IT
RO
BO
DS
ub
-t.
SK
IT
RO
BO
DS
ub
-t.
SK
IT
RO
BO
DS
ub
-t.
Bu
rkin
a F
aso
11
88
33
14
14
88
Ben
in0
00
33
0
Bots
wan
a1
57
18
61
23
12
31
31
49
16
23
11
32
28
13
41
Cam
ero
on
15
15
18
18
01
16
6
Chad
00
00
0
CA
R0
00
66
77
DR
C0
00
00
Eth
iop
ia0
22
12
31
51
31
34
15
Ken
ya
22
12
33
31
10
Mal
awi
00
33
55
22
Mal
i0
00
00
Mo
zam
biq
ue
11
00
01
1
Nam
ibia
03
03
06
14
20
21
21
23
23
Nig
er0
00
00
Sen
egal
22
11
20
00
Su
dan
02
20
00
So
uth
Afr
ica
91
34
14
33
11
65
21
98
14
15
11
65
22
26
35
29
07
51
22
12
20
9
Tan
zan
ia1
16
51
16
71
70
17
09
59
55
24
92
54
20
52
05
Zam
bia
51
51
12
12
07
50
57
66
11
68
Zim
bab
we
21
16
61
87
91
36
14
59
17
81
87
20
38
58
73
61
13
4
To
tal
48
60
61
65
54
66
65
27
13
60
59
30
65
39
06
60
57
55
18
85
08
13
70
9
(co
nti
nu
ed)
1995
1991
19
92
19
93
1994

140
Yea
rs
Pro
du
cts
SK
IT
RO
BO
DS
ub
-t.
SK
IT
RO
BO
DS
ub
-t.
SK
IT
RO
BO
DS
ub
-t.
SK
IT
RO
BO
DS
ub
-t.
SK
IT
RO
BO
DS
ub
-t.
Bu
rkin
a F
aso
00
00
0
Ben
in0
99
11
00
Bo
tsw
ana
23
49
12
44
79
15
94
63
63
94
13
10
75
65
6
Cam
ero
on
88
12
12
99
15
15
14
14
Ch
ad0
00
01
1
CA
R0
02
25
50
DR
C0
00
01
1
Eth
iop
ia2
20
22
33
0
Ken
ya
00
11
11
20
Mal
awi
11
00
00
Mal
i0
00
00
Mo
zam
biq
ue
11
61
71
11
11
31
31
21
22
92
9
Nam
ibia
21
32
41
77
24
10
81
86
71
36
91
5
Nig
er0
00
00
Sen
egal
00
00
0
Su
dan
00
00
0
So
uth
Afr
ica
19
21
40
97
12
31
02
30
87
10
71
94
75
14
52
20
10
11
96
43
01
Tan
zan
ia2
97
29
72
68
26
82
63
26
32
61
26
12
46
24
6
Zam
bia
31
31
08
08
01
68
69
0
Zim
bab
we
13
10
31
16
98
19
02
24
26
11
50
61
65
36
74
To
tal
29
14
88
17
80
20
25
26
10
73
81
64
50
80
67
22
00
56
80
76
82
28
49
91
07
37
(en
d)
20
00
19
96
19
97
19
98
19
99
141
(iv) Other specimens derived from the African lion
As far as the lion is concerned, 23 other types of products (specimens) such as bones, small
items made of leather, teeth, feet, etc. enter in this category. Out of these 23 types of
specimens, 17 are the object of a very small number of exports, which, in the scope of this
study, can be considered as negligible with less than 10 specimens during the whole ten year
period of this study (Table 31).
Lion's bones and feet (respectively 20 specimens under code BON and 61 specimens under
code FOO), as well as small items made of lion leather (54 specimens, under code LPS) and
teeth (262 specimens under code TEE) also appear in the trade over the period of the present
study.
In fact, only the claws (5,138 specimens under code CLA) are exported in relatively high
numbers (510 claws on average per year), probably as jewellery items.
If it seems hazardous to assume that each claw of a single lion is exported, which would make
possible to deduce a corresponding number of animals from this figure, claws, teeth, feet and
tails have generally to be considered as secondary elements of a trophy and therefore the
number of corresponding lions are probably already accounted for in other categories.

142
3. LION CONSERVATION POLICIES
• International status
The African lion is categorised as vulnerable by IUCN in the Red List of Threatened Species
of the World (IUCN SSC, 2000).
The lion is currently listed in appendix II of CITES. This allows for continued international
trade in the species under the export permit system.
• Continental status
This study does not find evidence that the African lion, as a species, is threatened with
extinction.
However, the conservation status of the taxon appears clearly very uneven throughout its
range. The different situations faced by each respective sub-population demonstrate different
levels of threat. By breaking down the taxon into sub-populations, it appears that the different
sub-populations may be classified in all the various categories of conservation status: some
sub-populations are extinct, some are extinct in the wild, some are critically endangered, some
are endangered, some are vulnerable, some are near threatened, some are of least concern,
some have deficient data and some are not evaluated.
As a consequence, while a continental overwiew is no doubt useful, a more in-depth approach
is definitely needed to design a sound action plan for the long-term conservation of the lion.
Such an action plan is now urgently required to:
(i) Determine conservation priorities;
(ii) Define appropriate strategies on a continental, regional, national and sub-
population basis, and;
(iii) Design effective ways to implement these strategies.
• Regional and National status
The level of protection given to lions differs between Range States from strict protection to
very little protection at all. National legislation determines whether the lion may be hunted for
sport, be the object of PAC, or not at all. Most Range States allow the control of problem
animals. Traditional lion hunting is generally prohibited nowadays even though it is still often
practised. Some examples of the conservation status are given below in a limited number of
Range States.
- Western Africa
In Burkina Faso, by far the main “lion country” of the region, the taxon is managed by the
Direction de la Faune et des Chasses (Direction of Wildlife and Hunting) under the authority
of the Ministère de l’Environnement et de l’Eau (Ministry of Environment and Water).
143
In Senegal, the Direction des Parcs Nationaux (Direction of National Parks) is responsible for
the management of the lion. Two special licences for hunting lion may be issued annually by
the President of the Republic.
- Central Africa
In Central African Republic, maybe the main “lion country” of the region, wildlife in general
and lion in particular, fall under the responsibility of the Ministère des Eaux, Forêts, Chasses,
Pêches, Tourisme et Environnement (Ministry of Water, Forestry, Hunting, Fishing, Tourism
and Environment).
In Chad, the lion is managed by the Direction de la Protection de la Faune et des Parcs
Nationaux (Direction of Wildlife Protection and National Parks) under the auspices of the
Ministère de l’Environnement et de l’Eau (Ministry of Environment and Water). In this
country, the powerful Ministère de l’Elevage (Ministry of Livestock) has a say in the problem
of cattle depredation by lions and other predators.
- Eastern Africa
In Tanzania, lion management falls under the general management plans for the respective
habitats (Selous, Serengeti etc.) and hence under the respective responsible authorities:
- The Tanzania National Parks Authority (TANAPA), a para-statal organisation for
National Parks;
- The Wildlife Division (WD), a Government department of the Ministry of Natural
Resources and Tourism (MNRT) for all game outside National Parks and Ngorongoro
Crater, and;
- Ngorongoro Crater Area Authority (NCAA) for the Ngorongoro Crater.
There are no specific monitoring programmes of lion populations/habitat apart from the
registered research programmes discussed below. Lion monitoring falls under the general
monitoring activities of the respective authorities. The hunting offtake is monitored by the
respective area (Game Reserve or District) by controlling the hunting licenses issued by the
Wildlife Division, accompanying the hunting parties and checking the trophies taken out of
the hunting area against the licenses. The appropriate institution, depending on the CITES-
status of the animal, then issues certificates of ownership. Several lion research programmes
are active in Tanzania, e.g.:
- “Project Life Lion”, Serengeti NP (Sarah Cleveland, Principal Researcher);
- “Serengeti Lion Project”, Ngorongoro Crater, Lake Manyara NP, Serengeti NP
(Craig Packer, Principal Researcher);
- “Maswa Game Reserve Lion Project” (Karyl Witman, Principal Researcher);
- “Tarangire Lion Monitoring Programme” (Fondo per la Terra, Malcolm Ryen), and;
- Selous Game Reserve (Nancy M. Creel, Scott Creel, Goran Spong).
The general approach is to manage habitats to ensure that wildlife populations and wild areas
are retained. In this way, free ranging lion populations will continue to survive. Use of drugs
and other direct physical control methods are not favoured (L. Seige & R. Baldus, pers.
comm.).

144
In Sudan, hunting licences are reported as being issued by the Government in the North, but
are apparently not recognised in rebel controlled areas in the South, who are issuing their own
licences. It is not known if or how many licences are issued for lion. There are recent moves
to improve conservation in Southern Sudan, preliminary surveys being underway in Boma
National Park, and others are planned.
In Uganda, there is no hunting of lion. The Government recently reintroduced the licensing of
the trade in animal products, and it remains to be seen whether this will involve trade in lion
products.
In Kenya, the lion is classified as fully protected, but is subject to PAC.
- Southern Africa
In Zambia, in 2001, a Presidential Order banned all safari hunting for one year while the new
Zambia Wildlife Authority (ZAWA) was being set up. Safari hunting is now partly reopened
and will probably be fully so in May 2003, once the safari hunting concessions have been
allocated.
In Namibia, the lion is a protected species under Ordinance 4 of 1975. Trophy hunting is
authorised and regulated by permit. Lions may be shot in protection of livestock but any such
incident has to be reported to the authorities within ten days. There is no specific national lion
management plan in the country, although research and monitoring activities have been
launched in the mid-1990's (Predator Research Program) and are currently directed at
developing such a plan in 2002/3. A Namibia Large Carnivore Atlas has been produced in
2001. Detailed population ecology and demography studies are being conducted in Etosha,
Kunene and the Kaudom sub-populations. Community-based conservation programmes are
currently in place in all three areas to monitor and promote suitable habitat for lions (Stander,
1990).
In Malawi, all lions are protected. No form of hunting is permitted. There is only sparse
information available on lion utilisation, hunting or even Problem Animal Control in Malawi.
In this country, all lion conservation, management and monitoring is carried out by the State
conservation agency (DNPW) as an integral part of its management of all Protected Areas.
There is no specific official programme to manage or monitor lions and no available reports
on their status and trend within Malawi. What monitoring of lion activity does take place is ad
hoc/circumstantial by visitors and local staff. Problem animals are closely monitored but most
end up being shot.
In Zimbabwe, the hunting, capture and translocation of lions is permitted under permits issued
by the relevant Minister - Parks & Wildlife Act, Chapter 20:14, Revised edition 1996.
Notwithstanding this, the killing of lions in defence of human life is permitted without
possession of a permit. Landowners are permitted to kill lions that are a threat to domestic
livestock. There is no specific national management plan for lion. Generally, there is no
formal monitoring of lion population numbers or lion habitats. However, monitoring is a by-
product of some short to medium term research projects on predators. Sport hunting quotas
are set annually by area. Sport hunting quotas are set by, or subject to approval by the
Department of National Parks & Wildlife Management (DNPWM). Some data is collected for
exported lion trophies (NP9 forms). If the DNPWM records offtakes for reasons other than
sport hunting, it appears that these data are not readily available. More information is needed

145
on all offtake of lions (trophy hunting in all land categories, problem animal control and
poaching), as well as the annual trends in these data (V. Booth, pers. comm.).
In Botswana, a National Predator Management Strategy is in the process of being developed
by the Department of Wildlife and National Parks (DWNP). There is limited monitoring in
the Northern regions and little protection in the Central regions. Policies in place in the
Southern Kalahari/Kgalagadi region are primarily for the management of stock-raiding lions.
In Botswana, trophy hunting of lions is restricted to quota per Wildlife Management Area. A
temporary national ban on problem animal control and zero quota for trophy hunting of lions
was instituted in January 2001. The Northern regions had a hunting quota until 2000. In the
Southern Kalahari, a zero quota in Wildlife Management Areas surrounding the Kgalagadi
National Park has been imposed for about 8 years prior to the nationally imposed zero quota.
Lion surveys, utilizing calling stations, have been conducted by the DWNP in collaboration
with private researchers to establish population estimates and structure in Northern Botswana.
The proposed management strategy includes surveys every three years using calling stations
in high-density areas and spoor surveys in low-density areas. The wildlife off-take policy in
Botswana is one of sustainable use as long as it does not influence the conservation status of
those species utilised in conservation zones. Lethal PAC is normally allowed but a temporary
national ban on lethal problem animal control was established in November 2000. The
proposed strategy for healthy sub-populations is one of sustainable quotas and allowance of
lethal problem animal control. However, in areas adjacent to locally threatened populations,
lethal off-take would be prohibited and conflict resolution measures put in place. Between
1995 and 2000, in the Okavango Delta, localised surveys were conducted and comprehensive
surveys occurred in 1998 and 1999. Comprehensive surveys were also conducted in the
Kwando/Chobe river area in 1999 and 2000. The Dry North had a low sampling intensity in
1999 (the calling station technique is not suitable for low-density populations). The Southern
Kalahari/Kgalagadi region has very little sustained monitoring: population surveys have been
conducted in 1976 and again in 1998-2001. The surveys show little change in the population
size/structure. As a result, the population is not, nor does it maybe need to be, actively
managed. The current ban on killing lions resulted probably from an excessive destruction of
lions by livestock owners and farmers. Several poisoning incidents occurred, killing lion,
hyenas, jackals and vultures. The proposed predator management strategy is based on the
current mainstream thinking regarding predator conservation and conflict resolution. The
management measures taken in the Northern areas are probably sufficient, although habitat
destruction and increasing human population are of concern. The management measures taken
in the central areas are considered to be insufficient. In the Central region, the main
management issues are an increasing human population and reduced migratory ungulate
population. The vast migratory wildebeest populations of Central and Southern Botswana
were interrupted in the 1980’s due to expansion of the cattle farming industry and the erection
of game control fences. Springbok populations are now showing similar declines in this
country and are not receiving much conservation attention. The collective effect of this will be
(i) decline in lion, and other large predator populations, especially outside Protected Areas,
and (ii) increase in lion/livestock conflicts. There is little understanding of the impact of PAC
mortality, or the effect of high human densities and livestock populations in designated
conservation areas (Wildlife Management Areas). In the Southern Kalahari/Kgalagadi region,
current management measures manage situations in an ad hoc or crisis manner. In the
Northern and Central regions, PAC officers are insufficiently trained and equipped. There is
limited extension training. Management recommendations from a detailed study (Funston,
2001) have been made for the Southern Kalahari/Kgalagadi region. Community extension
programs and the capacity to deal with stock raiding lions are seen as imperative, but remain

146
insufficient. Improving capacity and working more closely with communities, especially in
Botswana, have been identified as crucial in terms of long-term lion conservation (P. Funston
& C. Winterbach, pers. comm.).
In South Africa, hunting of lion is allowed in some parts of the country. This is controlled and
regulated by the nature conservation authorities in the various Provinces. Generally hunting is
restricted to private and provincial Game Reserves. Hunting of lion is forbidden in Kruger
National Park (KNP), Kgalagadi Transfrontier Park, Hluhluwe-Umfolozi Game Reserve
(HUGR), Phinda, Kwandwe and Shamwari. Hunting is restricted in Madikwe and
Pilanesberg. In Mpumalanga Parks (MP), hunting of lion is legal provided that the size of the
reserve is larger than 2000 ha and lions are wild (i.e. not captive-bred or hand-reared). KNP
has no specific lion management programme in place. KNP believes that their current
management policies are appropriate, but that sub-populations in the park itself and
surrounding areas should be monitored more closely. Closure of artificial water points may
lead to a slight (10%) reduction in the over-inflated lion population. Disease monitoring and
research are currently conducted to evaluate the threat of bovine tuberculosis. MP believe that
Kruger lions are a non-reliable source for reintroduction due to disease and would like to see
more reintroductions from disease-free areas. HUGR, Kwandwe and Shamwari have been the
recipients of individuals from the Pilanesberg/Madikwe metapopulation. The motive behind
the recent introductions of 4 and 6 females from Pilanesberg/Madikwe into HUGR and to
other reserves in Zimbabwe has been to minimise the disturbance to pride dynamics.
Introduced females and resident females are captured and kept in a boma together to bond and
encourage pride integration and reduce escapes from the reserve. Kwandwe and Shamwari
have not yet reached the stage where they need to consider off-take of lions: the reserves’
carrying capacities are estimated to be approximately 15 lions based on similar-sized reserves
with comparable prey density. Introductions have been conservative because of the fear of
possible impact on cheetah. Kwandwe and Shamwari monitor what prey species are being
focused on through scat analysis studies. They are also monitoring the lion's home range
development. At Kwandwe, lions are routinely inoculated against rabies as a precautionary
measure because of surrounding domestic stock. HUGR's ad hoc reintroduction programme is
to enlarge the gene pool of lions in the HU complex. Lions are collared and monitoring takes
place both through tracking and regular call-ups. North West Parks believe their management
measures to be appropriate as lion populations are increasing, disease-free and bringing in
revenue. The recent introductions into HUGR have had a moderate success rate and the
females do settle down: they have not broken out of the Reserve (G. Kamasho et al., pers.
comm.).

147
4. CHALLENGES
4.1. CONTROVERSY AND PARADOX
• Divergent perceptions of lion conservation
Historically, lions have captured our imagination to the point that, in some societies,
especially in the North, they have become cultural icons and have been incorporated into
literature and language. As a result, their conservation is often a highly emotive issue. This
extra interest in the species can be a force in their favour when it comes to conservation.
Certainly, focusing on a single flagship charismatic species can often conserve a whole suite
of species and their habitats.
However, for those rural African communities that have to share their lives with lions, the
perception of the “King of Beasts” is often very different from those who do not live side by
side with wildlife. Lions may represent loss of livelihood, threat to life and suffering to rural
African communities. The communities therefore often view them in a negative perspective.
For instance, a study conducted in and around Queen Elizabeth National Park, Uganda,
showed the following results when asked about the best way to deal with stray lions that come
into the village (Dricuru, 2000):
- 37% of the respondents (156 questionnaires returned and analysed) advocated the
stray lions should be killed;
- 35% said a fence should be erected around the Protected Area, and;
- 28% felt people should be taught how to avoid lions.
• Adverse impact of lion conservation on rare species
When lions become over-abundant in comparison to the availability of wild prey species there
may be conflict between different conservation goals. In some cases, rare taxa may be
threatened due to too high predation by lions. However, this situation may arise in the context
of populations and other human induced factors and have possibly more to do with people's
perceptions and values than any real ecological rationale. For instance:
Antelopes
- Bongo (Boocercus euryceros)
"…the Kenya Wildlife Service has, over several months, culled some (30) lions from the
Aberdares National Park which is fenced, [where] the total number of lions is estimated to be
between 145 - 180. The principal reason for the culling is their having been the main
predators of the rare bongo population as well as inflicting serious depredation on the
bushpigs (and giant forest hogs) within this particular habitat…" (Nehemiah Rotich, in litt.
anon., 2001a).
- Giant sable (Hippotragus niger variani)
In Angola in the 1940s and 1950s, the lion was regarded as a pest in the Reserva do Luando,
threatening the giant sable, especially old males. Later, more accurate observations were

148
considering the lion as quite rare in the region with low impact on the giant sable (Silva,
1972).
- Roan antelope (Hippotragus equinus)
In South Africa, predation by lions is considered to be one of the causes of the roan antelope’s
decline in the Kruger National Park, South Africa (Harrington et al., 1999).
Carnivores
- Wild dog (Lycaon pictus)
In Botswana, "lions are known to be the single largest natural source of mortality of wild
dogs, with lion predation resulting in more than 80% of known mortality in this study. Lion
distribution and abundance is an important, and probably the most important, population-
limiting factor for the wild dog" (McNutt, 2001).
- Cheetah (Acinonyx jubatus)
In Tanzania, the lion factor plays a substantial role in the viability of the cheetah:
. "Of great importance is the heavy toll exacted by lions and hyenas on cheetah cubs;
for example, in the Serengeti, cubs have only a 5% chance of survival to independence"
(Laurenson, 1994 in Jackson, 1997).
. "At low lion density [in the Serengeti ecosystem], the cheetah population has very low
risk of extinction. At average and at high lion density, however, cheetah extinction risk
is very high" (Kelly, 2001).
Suids
The giant forest hog (Hylochoerus meinertzhageni) appears heavily predated by the lion in
Aberdares NP, Kenya.
4.2. INTENSIVE MANAGEMENT ISSUES
• Contraception
In response to some of the problems of managing small populations, particularly in South
Africa, there have been a number of attempts to sterilize male lions by vasectomy in order to
reduce the number of births to prevent overpopulation. However, these operations have met
with mixed results and generally seem to have resulted in more problems than they have
resolved. Most of these are as a result of the complex, and seemingly brutal, nature of social
hierarchy within lion society.
Apart from the cost implications and the logistical impossibility of carrying out such surgical
interventions over vast areas, the population structure of lions is highly dynamic and anything
that attempts to freeze this is in time is likely to throw up other problems. This technique is

149
probably most useful for managing small captive populations but is too intensive, costly and
intrusive to have any useful field application to wild populations.
• Captive breeding
There are more than 1,500 African lions in captivity worldwide, including breeding
populations in many wildlife parks. This figure probably registers "official" lions only,
overlooking lions kept by individuals. The value of these populations to conservation is
dependent on the quality of their management. Certainly in the future the captive management
of some small populations may benefit genetically the long-term survival of other small
populations and races that have become fragmented in their distribution.
• Reduction of lion population size and gene pool impoverishment
When wild populations of a species become small and geographically isolated, there is room
for some concerns about the genetic consequences of this isolation (Simberloff, 1988). In
lions, dispersal patterns of sub-adult males and the high turnover of breeding males in female
prides normally minimise the risk of inbreeding. Habitat fragmentation, human persecution
and in some instance epidemics have divided the former range of lion into distinct sub-
populations, some of them being almost ‘island’ populations. In these small isolated
populations, the rate of inbreeding can reach a level that may cause a decrease in reproductive
performance. This has been observed for the most isolated lion population, the unique Asiatic
population in the Gir forest, India, where the males show high levels of developmental sperm
abnormalities and diminished testosterone levels (O’Brien et al. 1987, Wildt et al. 1987). On
the other hand, in Africa, male lions get kicked out of their maternal pride and roam around or
migrate looking for available females, this mobility ensuring a mixture of genes, even over
long distances. For instance, in Etosha NP, where lion densities are estimated between 1 and 3
per 100 km2 according to the various authors, the home range of one pride of lions was stated
as covering 2,075 km² and overlapping the home range of a number of other prides (Stander
1991).
Long-term studies have been carried out in the Ngorongoro Conservation Area, demonstrating
that inbreeding does not have a significant effect on the survival of those populations.
However in this area, one of the best studied lion populations shows a low level of
heterozygosity compared to that of the Serengeti NP, as well as higher proportion of
morphologically abnormal spermatozoa (Packer et al., 1991). However, the low level of
heterozigosity may in fact reflect the history of the Ngorongoro population which developed
from a restricted set of founders (15 individuals), although its isolation may have amplified its
original low genetic variation (Packer et al., 1991). There is certainly an effect on
reproductive performance but the long term consequences for the population are difficult to
foresee, as there are several examples of large felids that have undergone such genetic
impoverishment as a consequence of population fragmentation or population bottlenecks and
are still widespread, although not all in a favourable conservation status (e.g. cheetah, puma)
(O’Brien et al., 1985, 1990).
Today, the risk of reduced genetic variability, and its consequences for the conservation of
lion populations, is still the focus of many researchers particularly because of the
development of introduced or re-introduced populations. The number of these ‘artificial’
populations has increased in the last decade, promoted by the increasing demand of the
tourism industry. Small founder populations in public or private game reserves in South

150
Africa have shown good reproductive rates, but the initial genetic variability is low and hence
managers of these small fenced populations are giving much attention to ensuring gene pool
diversity through translocation and introduction of new genetic stock from different origins
(Hunters and Slotow, 1999).
In small populations residing in unfenced areas, the occasional wandering lion could be
enough to promote heterozygosity. In a simulation ‘experiment’ based on lion population
dynamics and genetics, it was shown that only few exchanges (once every 5 years) could
maintain a reasonable level of heterozygosity (Starfield et al., 1981). The exercise of
Population and Habitat Viability Assessment (PHVA) may be of help to provide guidelines in
this regard.

Porcupine, Masai Mara (Photo : Ph. Chardonnet). Buffaloes, Virunga National Park (Photo : Ph. Chardonnet).
Ankole cattle, Akagera National Park (Photo : Ph. Chardonnet). Roan antelopes, Waza National Park (Photo : H. Planton).
Cattle-raider, Serengueti National Park(Photo : H. Planton).
Wildebeest as prey, Masai Mara National Park (Photo : Ph. Chardonnet).
Eland as prey, Kalahari (Photo : H. Fritz).
Buffalo as prey, Luangwa valley (Photo : B. Chardonnet).
Elephant as prey, Namibia (Photo : B. Chardonnet).

151
"Alors King s'en alla vers ses femelles qui le réclamaient. D'abord, et comme par
politesse envers nous, d'une foulée lente et digne. Mais à mesure qu'il s'éloignait, il
allongea le pas. Enfin, il s'élança et rejoignit en quelques bonds lionnes et
lionceaux. Ils s'enfoncèrent ensemble dans les fourrés."
Joseph Kessel, 1958. Le Lion

152
BIBLIOGRAPHY
AGIR, 2002. Dénombrement des moyens et grands mammifères de la zone intégralement
protégée Mafou, Parc National du Haut-Nifer, Guinée. Ministère de l'Agriculture et de
l'Elevage, Guinée.
Ahmed, E.O., S.A. Hakim & M.B. Nimir, (Eds.), 1991. Wildlife research in relation to conservation
and management in the Sudan. Proceedings, Seminar on wildlife conservation and management in
the Sudan, Khartoun, March 16-21, 1985, 101-111.
Amai, C.A., 1997. African Medicinal Trade Project - Uganda. TRAFFIC East/Southern Africa.
Unpublished report.
Anderson, J.L., 1981. The re-establishment and management of a lion (Panthera leo) population in
Zululand, South Africa. Biological Conservation, 19(2), 107-117.
Anon., 1994. Aerial census of animals in Botswana: wet season 1994. Wildlife conservation in
Northern Botswana. Technical report by ULG Consultants to the Dept. of Wildlife and National
Parks, Govt. of Botswana.
Anon., 1994. Plan directeur des aires protégées: les écosystèmes marocains et la situation de la flore et
de la faune. Eaux & Forêts: Tome 1, v.1.
Anon., 1996. Conservation of Namibia’s Cheetahs and Lions. Cat News, v.24- Spring, 11.
Anon., 1997. Villager Kill and Eat Kruger Park Lions. Cat News, v.26- Spring, 11.
Anon., 1997. Livestock Killers Translocated in Zimbabwe. Cat News, v.27 - Autumn, 13.
Anon., 1997. Man-eating Lions Shot in Kruger National Park. Cat News, v.27 - Autumn, 11.
Anon., 1998. Bovine tuberculosis in south Africa's lions. Cat News, v.29 - Autumn, 21-22.
Anon., 1999. Some South Africans like lions in their streets, but others shoot them. Cat News, v.31 -
Autumn, 10.
Anon., 2000. African Lion Working Group gets to work. Cat News, v.33 - Autumn, 2.
Anon., 2000. Kruger National Park. “General Park Information”,
http://www.ecoafrica.com/krugerpark/general.htm
Anon., 2000. Kenya culls lions to protect rare bongo. African Lion News, v.2 African Lion Working
Group website, http://www.african-lion.org/
Anon., 2001. Hunting ban in Botswana. African Lion News, v.3. African Lion Working Group
website, http://www.african-lion.org/
Anon., 2001. The hunters and the hunted: lions versus life stock farmers. African Lion News, v.3.
African Lion Working Group website, http://www.african-lion.org/
Anon., 2001. Limbe Lion Workshop, 2001, www.african-lion.org/limbe-lion-report.pdf
Anon., 2001. Hunting Quotas & Licence Returns, 1995-2001. Zambia Wildlife Authority, Chilanga.

153
Anon., 2001. Status and needs for conservation of lions in West and Central Africa. Information
Exchange Workshop, Limbe, Cameroon, www.african-lion.org/limbe-lion-report.pdf
Anon., 2001. Lions to be re-introduced in Tembe Elephant Park. Oct. 11, www.wildafrica.net
Anon., 2002. Panthera leo (Linnaeus 1758),
http://www.gisbau.uniroma1.it/data/amd/amd042/amd042.pdf
Anon., 2002. Serengeti Lions and Domestic Dogs, Trade and Environment Database,
http://www.american.edu/ted/afrdog.htm
Anon., 2002. Serengeti lion explosion. Hunting Report Supplement, April, Conservation Force.
Anon., 2002., March. Lion conservation further compromised in Botswana. Hunting ReportSupplement, March, Conservation Force.
Anon., 2002. Lion Research Center, University of Minnesota, http://www.lionresearch.org/
Anon., 2002. Pride and prejudice. Inside Africa, www.cnntraveller.com
Anon., 2002. African lion numbers are rapidly declining. Feb. 20, www.WildlifeDecisionSupport.com
Anon., 2002. Kenya to petition against indiscriminate hunting in Tanzania. Feb. 20.
www.WildlifeDecisionSupport.com
Anon., 2002. Serengeti lion population rises by over 1,000. Feb. 20,
www.WildlifeDecisionSupport.com
Anon., 2002. Lion Loose in Phalaborwa. WildNet Africa News Archive. March 4,
www.wildnetafrica.com
Ansell, W.F.H., 1978. The Mammals of Zambia. National Parks & Wildlife Service, Chilanga.
Aulagnier, S. & M. Thévenot, 1986. Les ongulés sauvages du Maroc. Constat d'une régression
alarmante. Le Courrier de la Nature, 104 (Juillet-Août), 16-37.
Averbeck, C., 2001. A park is not an island: combining different wildlife management strategies in the
area of Lake Mburo National Park, Uganda. Abstracts IUGB. XXVth Congress - Wildlife
management in the 21st century. Lemesos, Cyprus, September 3-7, 73.
Averbeck, G.A., Kathe E. Bjork & C. Packer, 1990. Prevalence of hematozoans in lions (Pantheraleo) and cheetah (Acinonyx jubatus) in Serengeti National Park and Ngorongoro Crater, Tanzania.
Journal of wildlife diseases, v.26 (3), 392.
Baldus, R.D., undated. Selous Game Reserve, a guide to the Northern sector, 26-27.
Barry, I. & B. Chardonnet, 1998. Recensement aérien de la faune de l’Unité de Conservation d’Arly.
Résultats et commentaires. Direction de la Faune et des Chasses, Ouagadougou, Burkina Faso.
Ref. 8, Elephant Bibliography, IUCN/SSC/African Elephant Specialist Group.
Bauer, H. & H.H. De Liongh, 2001. Status and Needs for Conservation of Lions in West and Central
Africa: Proceedings Information Exchange Workshop, Limbe, Cameroon, June 2001.

154
Bauer, H., S. van der Merwe & J. Naude, 2002. African Lion is becoming Endangered Species.
African Lion Working Group, http://african-lion.org/ald.pdf
Baumjohann, W., R.A. Treumann & U. Auster, 1999. Waveform and packet structure of lion roars.
Annales geophysicae, v.17 (12), 1528.
Bell, R.H.V. & E. McShane-Caluzi (Eds.), 1984. Conservation and wildlife management in Africa.
Proceedings of a Workshop organized by the US Peace Corps at Kasungu National Park, Malawi,
October 1984. 646pp.
Bengis, R.G., 1996. Emerging diseases of free ranging African wildlife. N. Am. Vet. Conf. Vet. Proc.,10, 890-891. The North American Veterinary Conference, Orlando, Florida, January 13-17.
Bennett, A.R. & D. Freeland, 1993. Severe diffuse pulmonary bullous emphysema secondary to
pulmonary papillary adenocarcinoma in an African lion (Panthera leo). Proceedings: AmericanAssociation of Zoo Veterinarians, 108.
Berry, H., 1981. Abnormal levels of disease and predation as limiting factors for wildebeest in the
Etosha National Park. Madoqua, v.12(4), 242-253.
Berry, H., 1996. Lions in Namibia. Cat News, v.24, Spring 1996, 13-14.
Bertram, B.C.R, 1973. Lion population regulation. East African Wildlife Journal, 11 (3&4), 215-225.
Bigourdan, J. & R. Prunier, 1937. Les Mammifères sauvages de l'Ouest Africain et leur milieu.
Encyclopédie biologique XXIII, Paul Lechevalier, Paris. 367pp.
Bjork, K.E., G.A. Averbeck & B.E. Stromberg, 2000. Parasites and Parasite Stages of Free-Ranging
Wild Lions (Panthera leo) of Northern Tanzania. Journal of Zoo and Wildlife Medicine, v.31 (1),
56.
Bond, I., 1994. The importance of sport hunted African Elephants to CAMPFIRE in Zimbabwe.
TRAFFIC, v.14 (3), 117-119.
Bothma, J. du P. & C. Walker, 1999. Larger Carnivores of the African Savannahs. J.L. van Schaik
Publishers, Pretoria. 277 pp.
Bourn, D. & R. Blench, 1999. Can Livestock and Wildlife Co-exist? An Interdisciplinary Approach.ODI, London. 251 pp.
Bowen, M.J., C.C. Platz Jr., C.D. Brown & D.C. Kraemer, 1982. Successful artificial insemination and
embryo collection in the African lion (Panthera leo). Annu. Proc. Am. Assoc. Zoo Vet., 57-59.
Bridgeford, P.A., 1985. Unusual diet of the lion Panthera leo in the Skeleton Coast Park. Madoqua,
v.14(2), 187-188.
Briggs, M. & A. Boynton, 1994. Studying Southern Africa's Lions. Brookfield Zoo bison. v.8 (1), 20.
Brown, E.W., N. Yuhki & S.J. O'Brien, 1994. A lion lentivirus related to feline immunodeficiency
virus: epidemiologic and phylogenetic aspects. Journal of Virology, v.68 (9), 5953.
Brown, J. L., M. Bush & C. Packer, 1991. Developmental changes in pituitary-gonadal function in
free-ranging lions (Panthera leo) of the Serengeti Plains and Ngorongoro Crater. Journal ofReproduction and Fertility, v.91 (1), 29.

155
Brown, J. L., M. Bush. & C. Packer, 1993. Hormonal characteristics of free-ranging female lions
(Panthera leo) of the Serengeti Plains and Ngorongoro Crater. Journal of Reproduction and
Fertility, v.97 n 1, 107.
Brugiere, D., M. Dia, M. Magassouba, S. Diakite, M. Gbansara, B. Saliou, & M. Mamy, 2002.
Dénombrement de la moyenne et grande faune dans la ZIP Mafou du Parc National du Haut
Niger. Rapport au projet AGIR, Conakry.
Caro, T.M., N. Pelkey, M. Borner, K.L.I. Campbell, B.L. Woodworth, B.P. Farm, J. Ole Kuwai, S.A.
Huish & E.L.M. Severre, 1998. Consequences of different forms of conservation for large
mammals in Tanzania: preliminary analyses. African Journal of Ecology, v.36(4), 303-320.
Caro, T.M., N. Pelkey, M. Borner, E.L.M. Severre, K.L.I. Campbell, S.A. Huish, J. Ole Kuwai, B.P.
Farm & B.L. Woodworth, 1998. The impact of tourist hunting on large mammals in Tanzania: an
initial assessment. African Journal of Ecology, v.36(4), 321-346.
Caro, T., 1999. Abundance and Distribution of Mammals in Katavi National Park, Tanzania. African
Journal of Ecology, v.37, 305 - 313.
Carpenter, M.A., M.J.G Appel, M.E. Roelke-Parker, L. Munson, H. Hofer, E. Marion & S.J. O'Brien,
1998. Genetic characterization of canine distemper virus in Serengeti carnivores. Veterinary
Immunology and Immunopathology, v.65(2-4), 259-266.
Chadeau, M.R., 1920. Remarques sur quelques mammifères du Sahara et du Nord du Soudan. Ass. Fr. Avanc. Sci., Strasbourg, T.44: 307-312.
Chaffard-Sylla, Solange, 2002. Des chasseurs aux abords d'une aire protégée : les Konon, les Manon
et la Réserve de Biosphère des Monts Nimba, République de Guinée. Thèse de Doctorat, Muséum
National d'Histoire Naturelle de Paris. 255 pp.
Chai, N., 1996. Projet de réhabilitation et d'aménagement du Parc National de Manda. Projet FAC.
Ministère de l'Environnement et du Tourisme, N'Djamena, Tchad. 112 pp.
Chardonnet, B., 1999. Recensement de la faune de l’Unité de Conservation d’Arly. Mise à jour de la
version 1998. Direction de la Faune et des Chasses, Ouagadougou, Burkina Faso.
Chardonnet, B., 2002. Rapport de mission au Katanga, République Démocratique du Congo.
OUA/IBAR/PACE, Bamako. 12pp.
Chardonnet, B., P. Rouamba, I. Barry, A. Ouagraogo & P. Nacoulima, 1999. Suivi écologique des
aires classées des bassins de l’Arly et du Singou. MEE, FFEM, FAC & AFD, Ouagadougou,
Burkina Faso. 124 pp.
Chardonnet, Ph. & F. Lamarque, 1997. La faune sauvage du Bassin du Lac Tchad In: Atlas du Bassin du Lac Tchad. CIRAD-EMVT, Montpellier (France) & CTA, Wageningen (Pays-Bas), 109-124.
Chardonnet, Ph., B. des Clers, J. Fisher, R. Gerhold, F. Jori & F. Lamarque, 2002. The value of
wildlife. In: Infectious diseases of wildlife: detection, diagnosis and management. Rev. Sci. Tech.
Off. Int. Epiz., v.21(1), 15-51.
Chauhan, N.P.S., V.B. Sawarkar & H.S. Pabla, 1995. Resolving human-large felid conflicts associated
with Protected Areas in India. Gt. Plains Agric. Counc. Publ., No. 153, 103.
Chazée, L., 1987. La faune en Somalie. Unpublished report.
156
Cilliers, S., 1999. Lion versus buffalo! African Wildlife, v.53 (3), 20-21.
Clarke, B.C. & H.H. Berry, 1992. Water flux in free-living lions (Panthera leo) in the Etosha National
Park, Namibia.. Journal of Mammalogy, v.73 (3), 552-558.
Cooper, S.M., 1991. Optimal hunting group size: the need for lions to defend their kills against loss to
spotted hyenas. African Journal of Ecology, v.29 (2), 130.
Crawford, C.J. & A. Paias Simoes, 1990. Distributional data and notes on Angolan carnivores.
Mammalia: Carnivora. II - Larger species. Garcia de Orta, Série de Zoologica: Lisboa v.15(2), 9-
20.
Creel, S. & N.M. Creel, 1997. Lion density and population structure in the Selous Game Reserve:
evaluation of hunting quotas and offtake. African Journal of Ecology, v.35(2), 83-93.
De Waal, H.O., P.L. Avenant, H.J. Fouché & S.J. van der Merwe, 2001. A comparison of the seeds
found in the scat of a Kalahari lion with the seeds of two well-known Cucurbitaceae families.
African Lion News, vol.3, August 2001: 21-22.
Dejace, P., L. Gauthier & P. Bouché, 2000. Les populations de grands mammifères et d'autruches du
Parc National de Zakouma au Tchad: statuts et tendances évolutives. Rev Ecol. (Terre Vie), v.55.
D'Huart, J.-P., 1991. Mission d'appui à la réhabilitation des Parcs Nationaux de l'Upemba et de
Kundelungu. République du Zaïre.
Din, N.A., 1978. Notes on two lion prides near Mweya in the Rwenzori National Park, Uganda.
Pakistan Journal of Zoology, v.10(2), 133-138.
Donkin, D., 2001. The effect of habitat on lion group dynamics, a long-term study in the Kruger
National Park. African Lion News, v.3, 11.
Draulans, D. & Ellen Van Krunkelsven, 2002. The impact of war on forest areas in the Democratic
Republic of Congo. Oryx, v.36 (1), 35-40.
Dricuru, M., 1999a. The Lions of Queen Elisabeth National Park, Uganda. Institute of Natural
Resources at Makerere University, Uganda.
Dricuru, M., 2000. The lions of Queen Elisabeth National Park - Uganda. Their demographic and
health status and relationships with people. African Lion News, v.2, 14-16.
Dricuru, M., D. Katabarwa, D. Kisolo, E. Lutaaya, D. Pomeroy & H. Tushabe, 1999. The Lions of
Queen Elizabeth National Park, Uganda: Their Demographic and Health Status and Relationships
with People. African Lion News, v.2., September 2000, African Lion Working Group, South
Africa.
Dubey, J.P. & O. Bwangamoi, 1994a. Sarcocystis felis (Rotozoa: sarcocystidae) from the African
Lion (Panthera leo). Journal of the Helminthological Society of Washington, v.61(1), 113.
Dubey, J.P. & O. Bwangamoi, 1994b. Microbesnoitia leoni Bwangamoi, 1989 from the African Lion
(Panthera leo) Redetermined as a Junior Synonym of Hepatozoon canis (James, 1905) Wenyon,
1926. The Journal of Parasitology, v 80(2), 333.
Dublin, H.T. & J.O. Ogutu, 1998. Demography of lions in relation to prey density and habitat factors
in Masai Mara National Reserve, Kenya. Advances in Ethology, 33, 88. Hofer, Heribert; Pitra,

157
Christian; Hofmann, Reinhold R., (Eds.). Contributions to the International Symposium on
Physiology and Ethology of Wild and Zoo Animals, Berlin, Germany, 7-10 October 1998.
Duckworth, J.W., 1992. Sighting frequencies of nocturnal mammals in an Ethiopian Rift Valley
National Park. Afr. J. Ecol., v.30, 90-97.
Dunham, K.M., 1992. Response of a lion (Panthera leo) population to changing prey availability.
Journal of Zoology, v.227(2), 330-333.
Dunham, K.M., 1994. The effect of drought on the larger mammal populations of Zambezi riverine
woodlands. J. Zool., Lond., v.234 (3), 489-526.
Dupuy, A.R., 1971. Le Niokolo-Koba, premier grand Parc National de la République du Sénégal.
G.I.A., Dakar.
Dupuy, A.R., 1972. Les Parcs Nationaux de la République du Sénégal. G.I.A., Dakar. 19 pp.
East, R., 1984. Rainfall, Soil Nutrient Status and Biomass of Large African Savannah Mammals. Afr.J. Ecol., v.22, 245 - 270.
El Badawi, M.A. & S.A. Hakim, (Eds.), 1991. The role of Protected Areas in wildlife conservation.
Proceedings, Seminar on wildlife conservation and management in the Sudan, Khartoum, March
16-21, 1985, 153-159.
Elliott, J.P. & I. Mc Taggart Cowan, 1978. Territoriality, density and prey of the lion in Ngorongoro
Crater, Tanzania. Can. J. Zool., v.56, 1726-1734.
Eloff, F.C., 1984. Food ecology of the Kalahari lion Panthera leo vernayi. Koedoe Suppl., v.2 (7),
249-258.
Enawgaw, Cherie, K. Argaw & T. Alem, 2001. Assessment of wildlife population in Tellalak-Dawe
and Fursi-Artuma proposed hunting bocks of Afar National Regional State.
Ernst, D. & M. Elwasila, (Eds.), 1991. Present situation of the "Dinder National Park" in the Sudan.
Proceedings, Seminar on wildlife conservation and management in the Sudan, Khartoun, March
16-21, 1985, 172-178.
Fagotto, F., 1985. The lion in Somalia. Mammalia, v.49(4), 587-588.
Falkena, H. & W. Van Hoven, 2000. Bulls, Bears and Lions. Game Ranch profitability in SouthernAfrica. ABSA. 69pp.
Féron, E.M., 1995. La Réserve de Faune de Binder-Lere (Mayo Kebbi, Tchad). Possibilités et entraves
de la conservation, gestion et mise en valeur compte tenu des groupes concernés. CIRAD/EMVT.
92 pp.
Flizot, P., 1971. Etude sur la situation actuelle des parcs nationaux, des réserves et de la chasse dans le
Nord-Cameroun. Rapport non publié.
Frank, L.G., 2000. Ranchers Learn to Coexist with Predators in Kenya. Laikipia Predator Project, The
Wildlife Conservation Society. http://wcs.org/home/wild/Africa/637/
Frank, L.G., 2001. Costs of lion depredation on an East African rangeland. National TechnicalPredator Management and Conservation Workshop Proceedings, Maun, Botswana, October 9-12.

158
Fuanioli, U. & A. M. Simonetta, 1967. The Mammalian Fauna of the Somali Republic, Mon. Zool. It, 74, Firenze.
Funaioli, U., 1971. Guida breve dei mammiferi della Somalia. Istituto Agronomico per l'Oltremare.
Biblioteca Agraria Tropicale.
Funston, P., 2001. The hunters and the hunted: lions versus life stock farmers. African Lion News, v.3,
1-2.
Funston, P., 2001. Kalahari Transfrontier Lion Project: Final Report. Endangered Wildlife Trust,
South Africa.
Funston, P., 2002. Kalahari Transfrontier Lion Project Reaches Conclusion. Wildlife N°39 January
2002: 18-24.
Gauze, R., 1958. Guide touristique et cynégétique de l'Oubangui-Chari. Imprimerie Ozanne & Cie,
Caen. 377pp.
Gelderblom, C.M., G.N. Bronner, A.T. Lombard & P.J. Taylor, 1995. Patterns of distribution and
current protection status of the Carnivora, Chiroptera and Insectivora in South Africa. In:
Vertebrate Conservation in South Africa. Papers presented at the ZSSA symposium, July 1994. S.Afr. J. Zool., v.30(3), 103-114.
Gilbert, D.A., C. Packer & A.E. Pusey, 1991. Analytical DNA Fingerprinting in Lions: Parentage,
Genetic Diversity and Kinship. The Journal of Heredity, v.82(5), 378.
Gillet, H., 1969. La végétation du Parc National de Zakouma (Tchad) et ses rapports avec les grands
mammifères. La Terre et la Vie, 4, 373-485.
Gogate, M.G., 1997. Conservation values of zoological parks/safaris-Lion Safari Park: a case study.
Indian Forester, v.123(10), 887-894.
Graham, J., 1996. National Parks of Ethiopia’s Southern Region, Agricultural Bureau, Southern
Nations Nationalities and Peoples Region, DHV Consultants, EU/Democratic Republic of
Ethiopia, Awasa, Ethiopia.
Grinnell, J. & K. McComb, 1996. Maternal grouping as a defence against infanticide by males:
evidence from field playback experiments on African lions. Behavioural ecology, v.7 (1), 55.
Grinnell, J., C. Packer & A.E. Pusey, 1995. Cooperation in male lions: kinship, reciprocity or
mutualism?, Anim. Behav., v.49, 1, 95.
GTZ/Selous Conservation Programme, 1995. Selous Game Reserve General Management Plan.
Department of Wildlife, Dar es Salaam, Tanzania, 145pp.
Hanby, J.P., 1987. Emigration of subadult lions. Anim. Behav., v.35, 161-169.
Hanssen, L. & F. Stander, 2000. Desert lions of Namibia. Cat News, v.33. IUCN/SSC Cat Specialist
Group.
Harder, T. C., M. Kenter & A.D.M.E. Osterhaus, 1995. Phylogenetic evidence of canine distemper
virus in Serengeti's lions. Vaccine, v.13 (6), 521.

159
Harrington, R., N. Owen-Smith, P.C. Viljoen, H.C. Biggs, D.R. Mason & P. Funston, 1999.Establishing the causes of the roan antelope decline in the Kruger National Park, South Africa.
Biological Conservation, v.90(1), 69-78.
Hassaballa, E.O. & M.B. Nimir, (Eds.), 1991. Towards a national conservation policy in the Sudan.
Proceedings, Seminar on wildlife conservation and management in the Sudan, Khartoun, March
16-21, 1985, 137-151.
Heath, D., 2001. A question of Lions in Africa. African Hunter Vol. 7 N°6: 40-42.
Heinsohn, R., 1997. Group territoriality in two populations of African lions. Animal Behaviour,
v.53(6), 1143-1147.
Heinsohn, R., 1997. The Pride of Africa. Rob Heinsohn reports on Australian efforts to preserve
Africa's lion population. The Australian way.
Heinsohn, R., C. Packer & A.E. Pusey A. E., 1996. Development of cooperative territoriality in
juvenile lions. Proceedings of the Royal Society of London, v 263 (1369), 475.
Hemson, G. & D. Macdonald, 2000. Diet and home range variation of lions in Makgadikgadi pans as
aspects of their interactions with the surrounding livestock farming communities, abstract, Project
8. Project summaries. Proceedings of the Southern Africa Lion Workshop.
Hemson, G., 2001. Lion/livestock conflict in the Makgadikgadi. National Technical Predator
Management and Conservation Workshop Proceedings, Oct. 9-12, Maun, Botswana.
Hill, A.C., 1992. Mycoplasma simbae sp. nov., Mycoplasma leopharyngis sp. nov. and Mycoplasma
leocaptivus sp. nov., isolated from lions. International Journal of Systematic Bacteriology,v.42(4), 518.
Hillman, J.C., 1982. Wildlife Information Booklet, Department of Wildlife Management, Democratic
Republic of the Sudan, Ministry of Wildlife Conservation and Tourism, Southern Region, Funded
by New York Zoological Society, U.S.A.
Hillman, J.C., (Eds.), 1991. Wildlife research in the Sudan in relation to conservation andmanagement. Proceedings, Seminar on wildlife conservation and management in the Sudan,
Khartoun, March 16-21, 1985, 77-100.
Hofmann-Lehmann, R., D. Fehr, M. Grob, C. Packer, J.S. Martenson, S.J. O'Brien & H. Lutz, 1996.
Prevalence of antibodies to feline parvovirus, herpesvirus, calici virus, coronavirus and
immunodeficiency virus and of feline leukemia virus antigen and the interrelationship of these
viral infections in free ranging lions in East Africa. Clinical Diagnostic Laboratory Immunology,v.3, 149.
Hunter, L. & R. Slotow, 1999. The socio-ecology of re-introduced lions in small reserves:
comparisons with established populations and the implications for management in enclosed
conservation areas. African Lion News, v.2.
Hunter, L., 1996. Reintroduction of lions and cheetahs in South Africa. Cat News, v.24, 14-15.
Hunter, L., 1998. The lion-Africa's great cat. Afr. Environ. Wildl., v.6(3), 50-63.
Hunter, L., 1999. Large felid restoration: lessons from the Phinda Resource Reserve, South Africa,
1992-1999. Madoqua, v.31, 20-21.
160
Hunter, L., 2001. The future of Africa's magnificent cats. Africa Geographic, June 2001: 48-57.
IUCN, 1996. African Lion-Panthera leo (Linnaeus 1758), Species Accounts, Cat Specialist
Group/Species Survival Commission. http://lynx.uio.no/catfolk/cat-spc1.htm
IUCN SSC, 1999. African Antelope Database 1998. Occasional Paper of the IUCN Species Survival
Commission N° 21.
IUCN SSC, 2000. 2000 IUCN Red List of Threatened Species. The IUCN Species Survival
Commission. 61pp.
IUCN & UNEP, 1987. The Directory of Afrotropical Protected Areas. IUCN, Gland, Switzerland and
Cambridge, UK. 134 pp.
Jachmann, H., 1991. Current status of the Gourma elephants in Mali: a proposal for an integrated
resource management project. IUCN. 74pp.
Jachmann, H., 2001. Estimating abundance of African Wildlife: an aid to adaptative management.
Kluwer Academic Publishers Group, The Netherlands. 285pp.
Jackson, P., 1996. Conservation of Namibia’s Cheetahs and Lions. Cat News, v.24, 11. IUCN/SSC Cat
Specialist Group.
Jackson, P., 1997. Lions of the Kalahari. Cat News, v.26, 11. IUCN/SSC Cat Specialist Group.
Jackson, P., 1997. The status of cats in the wild. International Zoo Yearbook, v.35: 17-27.
Jackson, P., 1999. Could the Lion go the way of the Tiger? Cat News, v.31, 1. IUCN/SSC Cat
Specialist Group.
Jackson, P., 2000. Tsavo lions became man eaters because of tooth aches? African Lion News, v.2, 9.
Jong-Boon, de C. & S.B. Tabidi, (Eds.), 1991. Use of Sudanese wildlife. Proceedings, Seminar on
wildlife conservation and management in the Sudan, Khartoun, March 16-21, 1985, 216-238.
Kadoi, K., M. Kiryu & Y. Inaba, 1998. Antibody response of lions inoculated with inactivated
calicivirus vaccine experimentally prepared. Microbiologica, v.21(2), 147.
Kahatano, D.E., 1997. Trade in Wildlife Medicinals in Tanzania. Report prepared for TRAFFIC
East/Southern Africa, unpublished.
Keet, D., 1998. Tuberculosis in Lions. African Wildlife, v.52 (2), 11.
Kelly, M., 2001. Serengeti cheetah viability and the lion factor. Cat News, v.34, 28-29.
Kennedy-Stoskopf, S., D.H. Gebhard, R.V. English, L. H. Spelman & M. Briggs, 1994. Clinical
implications of feline immunodeficiency virus infection in african lions (Panthera leo):
preliminary findings. Proceedings of the American Association of Zoo Veterinarians andAssociation of Reptilian and Amphibian Veterinarians Annual Conference. Randall E. Junge,
(Ed.), 345-346.
Kenyi, J.M., (Ed.), 1991. Status and distribution of important wildlife and habitats in the Sudan withemphasis on South Sudan. Proceedings, Seminar on wildlife conservation and management in the
Sudan, Khartoun, March 16-21, 1985, 127-129.
161
Kessel, J., 1958. Le lion.
Kingdon, J., 1997. The Kingdon field guide to African Mammals. Academic Press, London and New
York: Natural World.
Kingdon, J., 2001. The Kingdon field guide to African mammals. Academic Press, London, San Diego,
476 pp.
Kinsel, M.J., M.B. Briggs, R.D. Murnane, 1998. Gastric spiral bacteria and intramuscular Sarcocysts
in African lions from Namibia. Journal of Wildlife Diseases, v.34 (2), 317.
Kirda, Ph., 2000. Les activités cynégétiques dans la Province du Nord Cameroun entre 1983 et 1997.
WWF/Projet Savanes Soudaniennes du Nord.
Kitchener, A., 1991. The Natural History of the Wild Cats. Christopher Helm, London. Mamm. Series.
Kock, R., 1998. Canine distemper antibodies in lions of the Masai Mara., The veterinary record, v.142
(24), 662.
Krishnamurthy, R., H.J.L Orford. & M.R. Perrin, 1989. Contraception, reproduction and demography
of free-ranging Etosha lions (Panthera leo). Journal of Zoology, v 216 n 4, 717.
Lamprey, H., 1964. Estimation of the large mammal densities, biomass and energy exchange in the
Tarangire Game Reserve and the Masai Steppe in Tanganyika. E. Afr. Wildl. J., v.2, 1-46.
Lancia, R.A., J.W. Bishir, M.C. Conner, & C.S. Rosenberry, 1996. Use of catch-effort to estimate
population size. Wildlife Society Bulletin, 24(4): 731-737.
Lang, H. & J. Chapin, 1915. The Congo Expedition, May 1909-November 1915. The American
Museum of Natural History.
Lauginie, F., 1990. La faune des savanes de Cote d'Ivoire. Caractéristiques et role dans l'économie
régionale. Actes du seminaire international sur laproductivité des savanes, la conservation et
l'aménagement des aires protégées, Korhogo, 6-10 mai 1990: 269-279.
Laurent, A. & D., 2002. Djibouti, les mammifères d'hier à aujourd'hui pour demain. Editions BEIRA,
Toulouse, 178-179.
Le Berre, M., 1990. Faune du Sahara, Tome 2. Terres africaines, Lechevalier-Chabaud, Paris, 172-
173.
Legge, S., 1996. Cooperative lions escape the Prisoner's Dilemma. Trends in ecology & evolution,
v.11 (1), 2.
Lichtenfeld, L.L., 2001. Among humans and lions: Exploring biological and social relationships to the
lion in Northern Tanzania. 8th International Theriological Congress 2001.
Limoges, B., 2000. Atlas des espèces de la forêt de Banguassou, RCA. Première approximation. Projet
CAF/95/GB. Unpublished draft. 229pp.
Linnell, J.D.C., R. Aanes, J.E. Swenson, J. Odden & M.E. Smith, 1997. Translocation of carnivores as
a method for managing problem animals: a review. Biodiversity and Conservation, v.6, 1245-
1257.

162
Loveridge, A.J., T. Lynam T. & D.W. Macdonald, 2000. Proceedings of the Southern African LionResearch Symposium, Harare.
Loveridge, A.J., T. Lynam & D.W. Macdonald, 2001. Lion Conservation Research: SurveyTechniques, 2-3. Wildlife Conservation Research Unit, University of Oxford (UK), Russel
Brookes Print Ltd.
Loveridge, A.J., 2002. Hwange Lion Project. Wildlife Conservation Unit, Oxford. Workshop on
Ecological Research in Hwange NP, Main Camp, Hwange, June 2002.
Luxmoore, R., 1985. Game farming in South Africa as a force in conservation. Oryx 19(4), 225-231.
Lyons, J., R.J. Young & J.M. Deag, 1997. The effects of physical characteristics of the environment
and feeding regime on the behavior of captive felids. Zoo Biology, v.16(1), 71-83.
Maddock A., A. Anderson, F. Carlisle, N. Galli, A. James, A. Verster & W. Whitfield, 1996. Changes
in lion numbers in Hluhluwe-Umfolozi Park. Lammergeyer, v.44, 6-18.
Magin, C. & C. Burdette, 2001. Terrestrial Ecoregions - Hobyo grasslands and shrublands.
http://www.nationalgeographic.com/wildworld/terrestrial.html
Makacha, S. & G.B. Schaller, 1969. Observations on lions in the Lake Manyara National Park,
Tanzania. E. Afr. Wildl. J., v.7, 99-103.
Malbrant, R. & A. Maclatchy, 1949. Faune de l’Equateur Africain Français. Tome II: Mammifères.
Paul Lechevalier éditeur, Paris. 323 pp.
Marchant, J., 2001. Lions face extinction in large parts of Africa. The New Scientist, No.1/11/01,
http://www.newscientist.com/news/news.jsp
Marshall, T., 1998. Searching for a Cure: Conservation of Medicinal Wildlife Resources in East andSouthern Africa. TRAFFIC International.
Martin, G., 2001. In peace with predators. African Lion News, v.3, 14-16. African Lion Working
Group website, http://www.african-lion.org/
Martin, G., 2001. In Peace With Predators: UC biologists say people must learn to co-exist with
Africa’s carnivores if these animals are to survive. African Lion News, v.3.
Mashima, T.Y., H.L. Jordan & S. Kennedy-Stoskopf, 1996. Whole Blood Leukocyte Counts of
Domestic Cats and African Lions Utilizing a Disposable Hemacytometer. Veterinary Clinical
Pathology, v.5 n 3, 84.
Maydon, Major H.C., 1957. Big game shooting in Africa. Lonsdale Library, v.XIV, 237-245.
McComb, K., C. Packer & A. Pusey, 1994. Roaring and numerical assessment in contests between
groups of female lions, Panthera leo. Animal Behaviour, v.47 (2), 379.
McNutt, J.W., 2001. African wild dogs in Northern Botswana: 1989-Present. National Technical
Predator Management and Conservation Workshop Proceedings, Oct. 9-12, Maun, Botswana.
MEE, ME & FFEM, 2001. Intercations élevage-faune sauvage-environnement autour des aires
protégées (Sud-Est du Tchad). Rapport de présentation. N'Djaména. 58pp.
Michler, I., 1998. Mozambique's Niassa Reserve. Afr. Environ. Wildl., v.6(5), 66-73.
163
Mills, M.G.L., 1984. Prey selection and feeding habits of the large carnivores in the Southern
Kalahari. Koedoe Suppl., v.27, 281-294.
Mills, G.L., 1992. A comparison of methods used to study food habits of large African carnivores. In:
McCullough D.R., Barrett R.H. (Eds.). Wildlife 2001: populations. Proceed. of Wildlife 2001:populations, an International Conference on Population Dynamics and management of Vertebrates
(exclusive of primates and fish) held at Oakland, California. Elsevier, Amsterdam, 1112-1124.
Mills, M.G.L., 1995. Notes on wild dog Lycaon pictus and lion Panthera leo population trends during
a drought in the Kruger National Park. Koedoe, v.38(1), 95-99.
Mills, M.G.L., 2000. About lions - Conservation issues. African Lion Working Group website,
http://www.african-lion.org/
Mills, M.G.L., P. Wolf, E.A.N. Le Riche & I.J. Meyer, 1978. Some population characteristics of the
lion (Panthera leo) in the Kalahari Gemsbok National Park. Koedoe, v.21, 163-171.
Mills, M.G.L. & H.C. Biggs, 1993. Prey apportionment and related ecological relationships between
large carnivores in Krüger National Park. Zoological Society of London. Symposia, 65, 253-268.
Mills, M.G.L. & T.M. Shenk, 1992. Predator-prey relationships: the impact of lion predation on
wildebeest and zebra populations. Journal of Animal Ecology, v.61(3), 693-702.
Mills, M.G.L., H.C. Biggs & I.J. Whyte, 1995. The relationship between rainfall, lion predation and
population trends in African herbivores. Wildlife Research, v.22(1), 75-88.
Mitchell, B.L., J.B. Shenton & J.C.M. Uys, 1965. Predation on large mammals in the Kafue National
Park, Zambia. Zool. afr., v.1(2), 297-318.
Mollel, C.L., 1977. A probable case of anthrax in a Serengeti lioness. East African Wildlife, v.15(4),
331.
Morris, P.J., C.O. Thoen & A.M. Legendre, 1996. Pulmonary Tuberculosis in an African Lion
(Panthera leo). Journal of Zoo and Wildlife Medicine: official publication of the American
Association of Zoo Veterinarians. v.27(3), 392.
Mukherjee, G., T.K. Graczyk & J.D. Strandberg, 1999. Feline Asthma Syndrome in African Lions
(Panthera leo). Journal of Zoo and Wildlife Medicine, v.30(4), 555.
Muller-Graf, C.D.M., 1995. A Coprological Survey of Intestinal Parasites of Wild Lions Panthera leo)
in the Serengeti and the Ngorongoro Crater, Tanzania, East Africa. The Journal of Parasitology,
v.81(5), 812.
Myers, N., 1986. Conservation of Africa’s cats: problems and opportunities. Cats of the World:
Biology, Conservation and Management, 437-446.
Natoli, E., 1990. Mating strategies in cats: a comparison of the role and importance of infanticide in
domestic cats, Felis catus L., and lions Panthera leo L. Animal Behaviour, v.40(1), 183.
Neo-Mahupeleng, G., T. Dimakatso, H. Andreassen & P. Wegge, 2001. Population structure, group
dynamics, home ranges and habitat use of lions (Panthera leo), in northeast Chobe National Park,
Botswana. National Technical Predator Management and Conservation Workshop Proceedings,
Oct. 9-12, Maun, Botswana.
164
Nkulikiyinka, J.-B., 1993. La Chasse-Umuhigo. Spectacle et informations sur la chasse dans l'ancien
Rwanda. Mission Française de Coopération et d'Action Culturelle à Kigali. 246pp.
Nowell, K. & P. Jackson, 1996. Wild Cats. Status Survey and Conservation Action Plan, 382 pp.
Nowell, K., 1997. Namibia's Cheetah Conservation Strategy. Cat News, v.26, 12. IUCN/SSC Cat
Specialist Group.
Obat, D.A., (Eds.), 1991. Wildlife conservtion and management in the Upper Nile region of the Sudan.
Proceedings, Seminar on wildlife conservation and management in the Sudan, Khartoun, March
16-21, 1985, 179-182.
O’Brien, S.J., M.E. Roelke, L. Marker, A. Newman, C.A. Winkler, D. Meltzer, L. Colly, J.F.
Everman, M. Bush & D.E. Wildt, 1985. Genetic basis for species vulnerability in the cheetah.
Science 227: 1428-1434.
O’Brien, S.J., J.S. Martenson, C. Packer, L. Herbst, V. de Vos, P. Joslin, J. Ott-Joslin, D.E. Wildt &
M. Bush, 1987. Biochemical genetic variation in geographic isolates of African and Asiatic Lions.
Natl. Geogr. Res. 3: 114-124.
O’Brien, S.J., M.E. Roelke, N. Yukhi, K.W. Richards, W.E. Johnson, W.L. Franklin, A.E. Anderson,
O.L. Jr Bass, R.C. Belden & J.S. Martenson, 1990. Genetic introgression within the Florida
panther Felis concolor coryi. Natl. Geogr. Res. 6: 485-494.
O’Connell-Rodwell, C., T. Rodwell, M. Rice & L.A. Hart, 2000. Living with the modern conservation
paradigm: can agricultural communities co-exist with elephants? A five-year case study in East
Caprivi, Namibia. Biological Conservation, v.93 (2000), 381-391.
Ogutu, J.O. & H.T. Dublin, 1998. The response of lions and spotted hyaenas to sound playbacks as a
technique for estimating population size. Afr. J. Ecol. v.36, 83-95.
Orford, H.J.L., M.R. Perrin & H.H. Berry, 1988. Contraception, reproduction and demography of free-
ranging Etosha lions (Panthera leo). Journal of Zoology, v.216(4), 717-733.
Osemeobo, G.J., 1988. Animal wildlife conservation under multiple land-use systems in Nigeria.
Environ. Conserv., v.15(3), 239-249.
Osofsky, S.A., Karen J. Hirsch, Evelyn E. Zuckerman & W.D. Hardy Jr., 1996. Feline lentivirus and
feline oncovirus status of free-ranging lions (Panthera leo), leopards (Panthera pardus), and
cheetahs (Acinonyx jubatus) in Botswana: a regional perspective. Journal of Zoo and WildlifeMedicine, v.27(4), 453-467.
Osofsky, S.A., Karen J.Hirsch, Evelyn E. Zuckerman & W.D. Hardy Jr., 1997. Lentivirus infection in
lions, leopards and cheetahs in Botswana. Cat News, v.27, 25. IUCN/SSC Cat Specialist Group.
Osofsky, S.A., W.D. Hardy & Karen J. Hirsch, 1994. Serologic evaluation of free-ranging lions
(Panthera leo), leopards (panthera pardus) and cheetahs (acinonyx jubatus) for feline lentivirus
and feline leukemia virus in Botswana. Proceedings of the American Association of Zoo
Veterinarians and Association of Reptilian and Amphibian Veterinarians Annual Conference.
Randall E. Junge, editor., 398-402.
Oxford, H.J.L., M.R. Perrin & H.H. Berry, 1988. Contraception, reproduction and demography of free
ranging Ethosha lions (Panthera leo). J. Zool., Lond., v.216(4), 717-733.
165
Packer C., A.E. Pusey, H. Rowley, D.A. Gilbert, J. Martenson & S.J. O'Brien, 1991. Case study of a
population bottleneck: lions of the Ngorongoro Crater. Conservation Biology, v.5(2), 219-230.
Packer, C. & A.E. Pusey, 1983. Male takeovers and female reproductive parameters: a simulation of
oestrous synchrony in lions (Panthera leo). Anim. Behav., v.31, 334-340.
Packer, C. & A.E. Pusey, 1993. Dispersal, kinships, and inbreeding in african lions. Natural History
of Inbreeding and Outbreeding: Theoretical and Empirical Perspectives. Nancy Wilmsen
Thornhill, (Ed.)., 375-391.
Packer, C. & A.E. Pusey, 1997. Divided We Fall: Cooperation among Lions. Scientific American,
v.276 n 5, 52.
Packer, C., 1992. Captives in the Wild. National Geographic, v.181(4), 122.
Packer, C., 1996. Coping with a lion killer. Natural History, v.105(6), 14-17.
Packer, C., 1996. Who rules the Park? Africa's lions fight disease and displacement. Wildlifeconservation, v.99(3), 36.
Packer, C., D. Scheel & A.E. Pusey., 1990. Why lions form groups: food is not enough. The American Naturalist, v.136(1), 1.
Packer, C., D.A.Gilbert & A.E. Pusey, 1991. A molecular genetic analysis of kinship and cooperation
in African lions. Nature. v.351(6327), 562.
Packer, C., S. Altizer & H. Lutz, 1999. Viruses of the Serengeti: patterns of infection and mortality in
African lions. The Journal of Animal Ecology, v.68(6), 1161.
PDRN, 2000. Rapport final PDRN phase II - NORCADEV RCA: 56.
Peel, M.J.S. & G.P. Montagu, 1999. Modelling predator-prey interactions on a Northern Province
game ranch. South African Journal of Wildlife Research, v.29(2), 31-34.
Pennycuick, C.J. & J. Rudnai, 1970. A method of identifying individual lions Panthera leo with an
analysis of the reliability of identification. J. Zool. Lond. 160, 497-508.
Planton, H., 1994. Conservation et gestion de la biodiversité au Cameroun. Projet FAC/FEM.
Planton, H., 1999. Développement local et valorisation de la biodiversité au Nord Cameroun. Rapport
final de synthèse : mars 1995 - décembre 1998. Ministère de l'Environnement et des Forêts,
Cameroun & Ambassade de France au Cameroun. 80pp.
Poilecot, P., 1991. Un écosystème de savane soudanienne: le Parc National de la Comoé, Côte
d’Ivoire. UNESCO, PNUD, MAB. 346pp.
Pole, A, 2000. The behaviour and ecology of the African wild dog, Lycaon pictus, in an environment
with reduced competitor density. Ph.D. thesis, University of Aberdeen.
Poli, A., F. Abramo & M. Pistello, 1995. Lentivirus infection in an African lion: a clinical, pathologic
and virologic study. Journal of Wildlife Diseases, v.31(1), 70.
Powell, D.M., 1995. Preliminary evaluation of environmental enrichment techniques for African lions
(Panthera leo). Animal Welfare, v.4(4), 361-370.
166
Prévost, Y.A., 1987. Etudes sur la Faune, Mauritanie, Bilan et Recommandations. FAO, Rome. 57pp.
Purchase, G. (in prep.). Aspects of the ecology and behaviour of lions (Panthera leo) and spotted
hyaenas (Crocuta crocuta) in Matusadona National Park, a closed woodland savannah system. Is
there any evidence of competition between the two species? Chapter 4. In: Factors affecting the
ratio of lions (Panthera leo) to spotted hyaenas (Crocuta crocuta) in Protected Areas of Africa.
Ph.D. thesis, University of Aberdeen.
Pusey, A.E. & C. Packer, 1987. The evolution of sex-biased dispersal in lions. Behaviour, v.101, 275-
310.
Quandt, S.K.F., I.J. Van Rensburg & A.L. Leisewitz, 1992. Single Extrahepatic Portocaval Shunt in an
African Lion (Panthera leo). Journal of zoo and wildlife medicine, v.23(3), 336.
Raynaud, J. & G. Georgy, 1969. Nature et chasse au Dahomey. Secrétariat d’Etat aux Affaires
Etrangères. 320pp.
Rodgers, W.A., 1974. The lion (Panthera leo, Linn.) population of the eastern Selous Game Reserve.
East African Wildlife Journal, v.12(4), 313-317.
Roelke-Parker M.E., L. Munson & M.J.G. Appel, 1996. A canine distemper virus epidemic in
Serengeti lions (Panthera leo). Nature, v.379(6564), 441.
Roelke-Parker, M.E., L. Munson & M.J.G. Mgasa, 1996. A canine distemper virus epidemic in
Serengeti lions (Panthera leo). Nature, v.381(6578), 172.
Roure, 1956. Faune et chasse en Afrique occidentale française. Guide du tourisme de la nature vivante.
Editions G.I.A., Dakar. 412pp.
Rudnai, J., 1973. Reproductive biology of lions (Panthera leo massaica Neumann) in Nairobi National
Park. E. Afr. Wildl. J., v.11, 241-253.
Rudnai, J., 1974. The pattern of lion predation in Nairobi Park. E. Afr. Wildl. J., v.12, 213-225.
Rudnai, J. A.,1983. The ecology of lions in the Kitengela Conservation Unit, Kenya. NationalGeographic Society. Research Reports, v.15, 565-571.
Ruggiero, R.G., 1991. Prey selection of the lion (Panthera leo L.) in the Manovo-Gounda-St.Floris
National Park, Central African Republic. Mammalia, v.55(1), 23-33.
Schaller, G.B., 1972. The Serengeti Lion: a study of predator-prey relations. Univ. Chicago Press,
Chicago, 480 pp.
Scheel, D. & C. Packer, 1991. Group hunting behaviour of lions: a search for cooperation. AnimalBehaviour, v.41(4), 697.
Scheel, D., 1993. Profitability, encounter rates, and prey choice of African lions. Behavioural Ecology,
v.4(1), 90-97.
Scheel, D., 1993. Watching for lions in the grass: the usefulness of scanning and its effects during
hunts. Animal Behaviour, v.46(4), 695.
SECA, 1991. Parc National de Zakouma. Résultats des inventaires de la faune. Projet FED/Zakouma.
Ministère de l'Environnement & du Tourisme, 28pp.

167
Sechele, M.L., 2000. Coordinated survey of the lion population in the Okavango Delta. African LionNews, v.2, 11-12.
Sechele, M.L. & C.W. Winterbach, 2001. Lion surveys in Northern Botswana 1998-2000. NationalTechnical Predator Management and Conservation Workshop Proceedings, Oct. 9-12, Maun,
Botswana.
Shoemaker, A.H., 1996. New Age lions: the ex situ issues. Annual Conference. Proceedings;American Association of Zoological Parks & Aquariums, No. 1996, 314-318.
Siefert L., (Ed.), 2000. Uganda Large Predator & Scavenger Research & Management Project
Training Workshop Report: Large Predators - Data, Protocols, Viability, 23 July- 2 August 2000,
Mweya, Queen Elizabeth National Park, Uganda. LPP/WARM Dept., Makerere University,
Kampala, Uganda.
Siefert, L., (Ed.), 2000. Prof Ludwig Siefert lashes out at Internet sensation writer. African Lion News,
v.2, 9.
Siefert L., M. Driciru & D. Muwanguzi, 2001. The Uganda Large Predators and Scavengers Research
& Management Programme. Proceedings of the Information Exchange Workshop on the Statusand Needs for Conservation of Lions in West and Central Africa, Limbe, Cameroon, June 2001.
Silva, J. A., 1972. A palanca real. Junta de investigaçoes do ultramar, 54-59.
Simiyu S., E. Ouko, R. Achieng, J. Muasya., M. Mbuvi & P. Muthoka, 1996. African Medicinal Trade
Project: Kenyan Component. TRAFFIC East/Southern Africa, Unpublished report.
Simonetta, A.M., 1988. Chapter 6: Somalia. In: Antelopes - Global survey and regional action plans.Part 1. East and Northeast Africa. IUCN/SSC Antelope Specialist Group, 27-33.
Sindiga I., 1995. Wildlife-based Tourism in Kenya: Land use conflicts and Government compensation
policies over Protected Areas. The Journal of Tourism Studies, Vol.6, N°2, Dec. 95: 45-55.
Sinnary, A.W.S., (Eds.), 1991. The Jonglei Canal: impact on wildlife and people. Proceedings,
Seminar on wildlife conservation and management in the Sudan, Khartoun, March 16-21, 1985,
112-126.
Singh, H.S. & R.D. Kamboj, 1996. Predation pattern of the Asiatic lion on domestic livestock. IndianForester, v.122(10), 869-876.
Skinner, J. & R.H.N. Smithers, 1990. The Mammals of the Southern African Subregion. University of
Pretoria, South Africa, 771 pp.
Smithers, R.H.N. & J.L.P. Lobão Tello, 1976. Check List and Atlas of the Mammals of Moçambique.
Museum Memoir No 8, 88.
Smithers, R.H.N., 1983. The Mammals of the Southern African Subregion. University of Pretoria,
Pretoria, 736 pp.
Smuts, G.L., 1976. Population characteristics and recent history of lions in two parts of the Kruger
National Park. Koedoe, v.19, 153-164.
Smuts, G.L., J.L. Anderson & J.C. Austin, 1978. Age determination of the African lion (Panthera leo).Journal of Zoology, v.185(1), 115-146.

168
Spencer, J.A., 1991. Survey of antibodies to feline viruses in free-ranging lions. South African Journal of Wildlife Research, v.21(2), 59.
Spencer, J.A., A.A. Van Dijk, M. C. Horzinek, 1992. Incidence of feline immunodeficiency virus
reactive antibodies in free-ranging lions of the Kruger National Park and the Etosha National in
Southern Africa detected by recombinant FIV p24 antigen. The Onderstepoort Journal ofVeterinary Research, v.59(4), 315.
Spencer, J.A., P.D. Bouic, L. Colly, 1995. A comparison between T-helper (CD4) and T-suppressor
(CD8) cell ratios in FIV positive and negative lions Panthera leo and domestic cats Felis catus.
South African Journal of Wildlife Research, v.25(3), 111.
Stander, P.E., 1990. A suggested management strategy for stock-raiding lions in Namibia. SouthAfrican Journal of Wildlife Research, v.20(2), 37-43.
Stander, P.E., 1991. Demography of lions in the Etosha National Park, Namibia. Madoqua, v.18(1), 1-
9.
Stander, P.E., 1992. Cooperative hunting in lions: the role of the individual. Behavioral ecology and
sociobiology, v.29(6), 445.
Stander, P.E., 1997. The ecology of lions and conflict with people in north-eastern Namibia.
Proceedings of a Symposium on Lions and Leopards as Game Ranch animals, Onderstepoort, 10-
17.
Stander, P.E., 2000. Conservation of lions and other large carnivores in the Kunene region, Namibia.African Lion News, v.2, 8-9.
Stander, P., Jaqece//au, Nisa /ui, Tsisaba Dabe & Dam dabe, 1997. Non-consumptive utilisation of
leopards: community conservation and ecotourism in practice. Proceedings of a Symp. on lionsand leopards as game ranch animals, Onderstepoort, RSA, Oct. : 50-57.
Stander, P.E & L. Hanssen, 2001. Population ecology and long term monitoring of free-ranging
populations in Namibia's marginal and arid environments. Research Progress Report
Stander, P.E & L. Hanssen, 2001. Namibia Large Carnivore Atlas Progress Report. Unpublished
report.
Stander, P.E. & L. Hanssen, 2001. Desert Lions of Namibia. Cat News, v.33, 15.
Stander, P.E. & P. Morkel, 1991. Field immobilization of lions using disassociative anaesthetics in
combination with sedatives. African Journal of Ecology, v.29(2), 137.
Stander, P.E. & S.D. Albon, 1993. Hunting success of lions in a semi-arid environment. Zoological
Society of London. Symposia, v.65, 127-143.
Starfield, A.M., H.A. Rowley, H. Quadling & T.J. Foose, 1995. Genetic Risk Analysis of a Small
Wild Lion Population. In: Population Management for Survival and Recovery. Analytical Methods and Strategies in Small Population Conservation (Ballou J.D. et al, Eds); Columbia University
Press, New York, 155-179.
Starfield, A.M., J.D. Shiell & G.L. Smuts, 1981. Simulation of lion control strategies in a large game
reserve. Ecological Modelling, v.13(1-2), 17-28.

169
Starfield, A.M., P.R. Furniss & G.L. Smuts, 1981. A model of lion population dynamics as a function
of social behaviour. In: Fowler C.W. & T.D. Smith (Eds.). Dynamics of Large Mammal
Populations. Wiley, Chichester & New York, 121-134.
Stegmann, G.F., L. Bester & L. Venter, 2000. Halothane anaesthesia in an African lion. South African
Journal of Wildlife Research, v.30(2).
Stewart, C. & T., 2001. Lion situation in Zambia. African Lion News v.3, August 2001, 9-10.
Strang, A., 2002. Eric Pasanisi, guide de chasse professionnel. Jours de chasse, n°8, Eté 2002: 48.
Stuart, C.T., 1991. Lion. Unpubl. data sheet, Cat Specialist Group, Bougy-Villars, Switzerland.
Stuart, C.T., 2000. Lion situation in Zambia. African Lion News, v.2, September 2000, 9.
Stuart, C.T., I.A.W. Macdonald & M.G.L. Mills, 1985. History, current status and conservation of
large mammalian predators in Cape Province, Republic of South Africa. Biological Conservation,
v.31(1), 7-19.
Stuart-Hill, G. & D. Grossman, 1993. Parks, profits and professionalism. Lion return to Pilanesberg.
African Wildlife, v.47(6), 267-270.
Tacher, G., L. Letenneur & D. Viallet, 2001. Etude sur la compétitivité des filières de productions
animales en Afrique Sub-Saharienne. CIRAD-EMVT, Montpellier & Secrétariat d’Etat à la
Coopération, Paris.
Thresher, P., 1981. The economics of a lion. Unasylva, v.33(134), 34-35.
Thresher, P., 1981. Valeur actuelle d'un lion vivant. Revue Mondiale de Zootechnie. Oct.-Dec., v.40,
30-33.
Tiega, A. & T. Price, 1995. Wildlife use in Niger, West Africa: historical trends and future
perspectives. In: Bissonette, J.A. & P.R. Krausman (eds). Integrating people and wildlife for a
sustainable future. Preceedigs of the first International Wildlife Mnagement Congress. The
Wildlife Society, Bethesda, Md. 8-10.
Toure, S., S. Soumah, S. & A. Alberti, 1997. Inventaire, distribution et abondance des mammifères
dans le Parc National du Haut-Niger, Guinee. Rapport au projet PRABV, Conakry.
Traoré, C., 1993. L'impact écologique de la transhumance du bétail domestique dans le Parc National
de la Boucle du Baoulé au Mali. Rapport de stage. Ecole pour la formation de spécialistes de la
faune, Garoua, Cameroun. 47pp.
UNEP/WCMC, 1999. Species account: Panthera leo. African Mammals Data Bank.
UNEP/WCMC CITES Trade Database, 2001. CITES trade statistics 1991-2000.
UNESCO/PNUD, 2000. Plan d’aménagement global de la Réserve de la Biosphère de la Boucle du
Baoulé. Ministère de l’Environnement, Bamako, Mali, 97pp.
Van der Merwe, S., 2001. Hunting ban in Botswana. African Lion News, v.3, 5-6. African Lion
Working Group website, http://www.african-lion.org/
Van Der Meulen, J.H., 1977. Note on the capture and translocation of stock raiding lions in North
Eastern and North Western Rhodesia. South African Journal of Wildlife Research, v.7(1), 15-17.
170
Van Dyk, G., 2001. Achieving ecological and socio-economic objectives in Pilanesberg National
Park : lion re-introduction project. Wildlife and Livestock: disease and sustainability: what makes
sense? International Joint Conference - Society for Tropical Veterinary Medicine and the Wildlife
Disease Association. Pilanesberg National park, 22-27 July 2001. Book of abstract, 54.
Van Heerden, J., (Eds.), 1997. Proceedings of a Symposium on Lions and Leopards as Game Ranch
Animals. Onderstepoort, Republic of South Africa. 265 pp.
Van Orsdol, K.G., 1982. Ranges and food habits of lions in Rwenzori National Park, Uganda. Symp.zool. Soc. Lond., v.49, 325-340.
Van Orsdol, K.G., 1984a. Foraging behaviour and hunting success of lions in Queen Elizabeth
National Park, Uganda. Afr. J. Ecol., v.22, 79-99.
Van Orsdol, K.G., 1986. Feeding behavior and food intake of lions in Rwenzori National Park,
Uganda. In: Cats of the World: Biology, Conservation, and Management. S. Douglas Miller and
Daniel D. Everett, (Eds.), 377-388.
Van Orsdol, K.G., Jeannette P. Hanby & J. D. Bygott, 1985. Ecological correlates of lion social
organization (Panthera leo). Journal of Zoology. Series A, v.206(1), 97-112.
Van Schalkwyk, A.C., 1994. A survey of all lion colonies outside of National Parks in South Africa.
Centre for Wildlife Management, University of Pretoria. MSc Thesis.
Ventner, J. & M.E. Hopkins, 1988. Use of a simulation model in the management of a lion population.
S. Afr. J. Wildl. Res., v.18, 126-130.
Viljoen, P.C.,1993. The effects of changes in prey availability on lion predation in a large natural
ecosystem in Northern Botswana. Symp. Zool. Soc. Lond., v.65, 193-213.
Vincke, P.P. & M. Singleton (Eds), 1982. Gestion de la faune sauvage, facteur de développement ?
Actes du colloque des 5, 6 et 7 Mai. ISE, ENDA, UNESCO/MAB.
Vivien, J., 1991. Faune du Cameroun. Guide des mammifères et poissons. GICAM et Ministère de la
Coopération et du Développement, 271 pp.
Wagener, T. & M. Fouraker, 1996. The PHVA process: identifying in situ conservation strategies for
the Namibian lion. Proceedings; American Association of Zoological Parks & Aquariums. Annual
Conference. Proceedings, No.1996: 357-361.
Walker, C., 1996. Signs of the wild. A field guide to the spoor & signs of the mammals of SouthernAfrica. Struik Publishers (Pty) Ltd., Cape Town, 215 pp.
Wendo, C., 1999. Uganda lions have "AIDS". African Lion News, v.2, 8.
Wildt, D.E., S.J. O'Brien, C. Packer, J.L. Brown & M. Bush, 1986. A habitat-induced isolation
influences the reproductive and genetic characteristics of the free-ranging lion. Annu. Proc. Am.Assoc. Zoo Vet., 140-141.
Wildt, D.E., M. Bush, K.L. Goodrowe, C. Packer, A.E. Pusey, J.L. Brown, P. Joslin & S.J. O’Brien,
1987. Reproductive and genetic consequences of founding isolated lion populations. Nature 329:
328-331.

171
Wilkins, B., 1996. Kalahari tragedy. Namibian farmer kills 13 lions from the Kalahari Gemsbok
National Park. African Wildlife, v.50(5), 25.
Wilson, V.J., 1975. Mammals of the Wankie National Park, Rhodesia. Museum Memoir n°5, 52-55.
Wilson, V.J., 1997. Biodiversity of Hwange National Park, Part I, Large Mammals and Carnivores.
Chipangali Wildlife Trust, 87-98.
Wilson, V.J., 1993. A zoological survey of Mole National Park, North-Western Ghana. Part 1, Large
Mammals. Game and Wildlife DEPT/IUCN project 9786, Accra, Ghana. 87pp.
Winterbach, C.W. & H. Winterbach, 1999. Ecological Monitoring Report for CHA NG29 and NG30
1997-1998 Draft 1. Maun, Botswana.
Winterbach, C.W. & H. Winterbach, 2001. Okavango Delta lions: ecology, home range and
population dynamics. National Predator Workshop, Maun, Botswana.
Winterbach, C.W., H. Winterbach, P.W. Kat & L.M. Sechele, 2000. Coordinated dry season lion
survey for the Okavango Delta, 1998. Department of Wildlife and National Parks, Botswana.
Unpublished report.
Winterbach, C.W., H. Winterbach, P.W. Kat & L.M. Sechele, 2001. Coordinated dry season lion
survey for the Okavango Delta, 1999. Department of Wildlife and National Parks, Botswana.
Unpublished report.
Winterbach, H. & R. Kamnitzer, 2001. People and predators - Can they live together ? Conservation
Force' Hunting Report Supplement, Dec.
WWF, 1997. Quota Setting Manual. Wildlife Management Series, Harare, Zimbabwe, 41pp.
Yalden, D.W., M.J. Largen & D. Kock, 1980. Catalogue of the mammals of Ethiopia 4. Carnivora.Monitore Zoologico Italiano: suppl. XIII, 169-272.
Yalden, D.W., M.J. Largen, D. Kock & J.C. Hillman, 1996. Catalogue of the mammals of Ethiopia
and Eritrea. 7. Revised checklist, zoogeography and conservation. Tropical Zoology, v.9, 73-164.
Yamaguchi, N., 2000. Follow up: the Barbary lion project: its feasibility and potential. African Lion
News, v.2.
Yamazaki, K. & T. Bwalya, 1999. Fatal lion attacks on local people in the Luangwa Valley, Eastern
Zambia. South African Journal of Wildlife Research, v.29(1), 19-21.
Yamazaki, K., 1996. Social variation of lions in a male-depopulated area in Zambia. The Journal ofWildlife Management, v.60 n 3, 490.
Zahavi, A., 1996. Cooperation among lions: an overlooked theory. Trends in Ecology & Evolution,
v.11(6), 252.
Ziegler, S., G. Nikolaus & R. Hutterer, 2002. High mammalian diversity in the newly established
National Park of Upper Niger, Republic of Guinea. Oryx, v.36(1), 73-80.