Embed Size (px)
Citation preview
Consideration of funding proposals – Addendum X Funding proposal package for FP027
GCF/B.14/07/Add.10
27 September 2016
Meeting of the Board 12 – 14 October 2016 Songdo, Incheon, Republic of Korea Provisional agenda item 11(f)
Summary
This addendum contains the following three parts:
a) A funding proposal summary titled “Universal Green Energy Access Programme”
submitted by Deutsche Bank AG;
b) No-objection letters issued by the national designated authorities or focal points; and
c) Environmental and social report(s) disclosure;
These documents are presented as submitted by the accredited entity and the national designated authority(ies) or focal point(s), respectively. Pursuant to the Comprehensive Information Disclosure Policy of the Fund, the funding proposal titled “Universal Green Energy Access Programme” submitted by Deutsche Bank AG is being circulated on a limited distribution basis only to Board Members and Alternate Board Members to ensure confidentiality of certain proprietary, legally privileged or commercially sensitive information of the entity.

GCF/B.14/07/Add.10 Page b
Table of Contents
Funding proposal summary submitted by the accredited entity 1
No-objection letters issued by the national designated authorities or focal points 168
Environmental and social report(s) disclosure 175
Pl
2016
Contents
Section A PROJECT / PROGRAMME SUMMARY
Section B FINANCING / COST INFORMATION
Section C DETAILED PROJECT / PROGRAMME DESCRIPTION
Section D RATIONALE FOR GCF INVOLVEMENT
Section E EXPECTED PERFORMANCE AGAINST INVESTMENT CRITERIA
Section F APPRAISAL SUMMARY
Section G RISK ASSESSMENT AND MANAGEMENT
Section H RESULTS MONITORING AND REPORTING
Section I ANNEXES
Note to accredited entities on the use of the funding proposal template
Sections A, B, D, E and H of the funding proposal require detailed inputs from the accredited entity. For allother sections, including the Appraisal Summary in section F, accredited entities have discretion in how they wish to present the information. Accredited entities can either directly incorporate information into this proposal, or provide summary information in the proposal with cross-reference to other project documents such as project appraisal document.
The total number of pages for the funding proposal (excluding annexes) is expected not to exceed 50.
Please submit the completed form to:
FINANCING / COST INFORMATION GREEN CLIMATE FUND FUNDING PROPOSAL | PAGE 4 OF 165 B
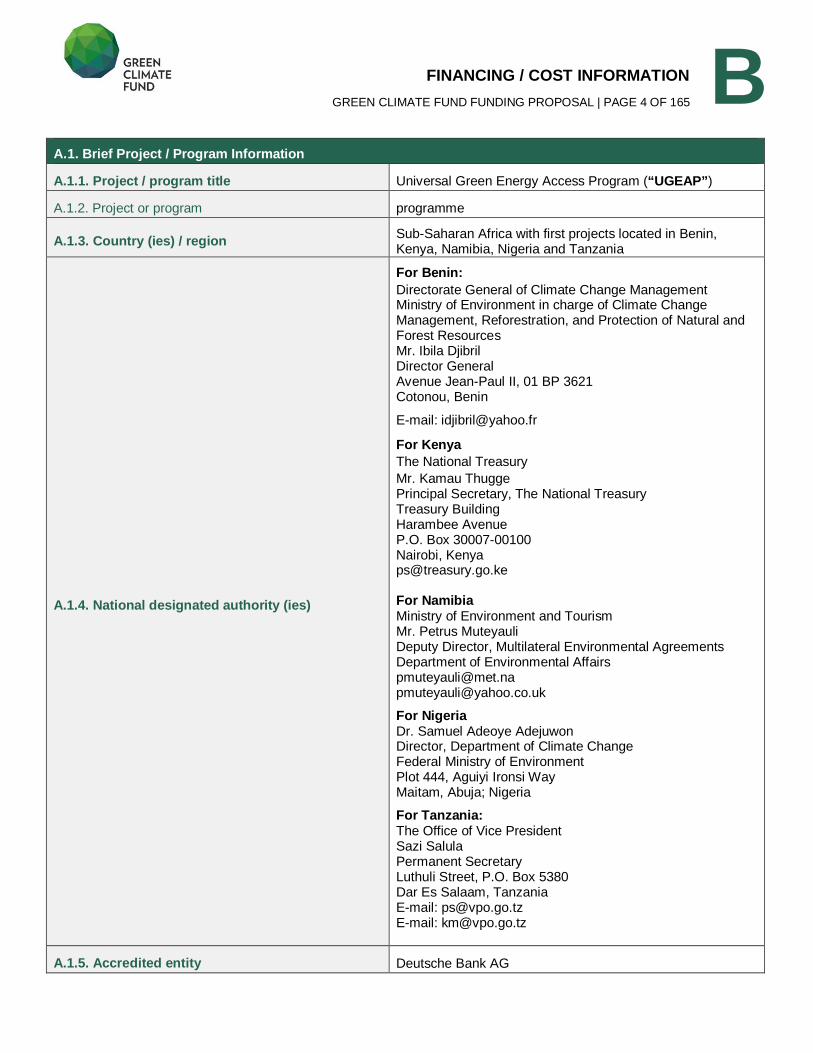
A.1. Brief Project / Program Information
A.1.1. Project / program title Universal Green Energy Access Program (“UGEAP”)
A.1.2. Project or program programme
A.1.3. Country (ies) / region Sub-Saharan Africa with first projects located in Benin, Kenya, Namibia, Nigeria and Tanzania
A.1.4. National designated authority (ies)
For Benin: Directorate General of Climate Change Management Ministry of Environment in charge of Climate Change Management, Reforestration, and Protection of Natural and Forest Resources Mr. Ibila Djibril Director General Avenue Jean-Paul II, 01 BP 3621 Cotonou, Benin
E-mail: [email protected]
For Kenya The National Treasury
Mr. Kamau Thugge Principal Secretary, The National Treasury Treasury Building Harambee Avenue P.O. Box 30007-00100 Nairobi, Kenya [email protected]
For Namibia Ministry of Environment and Tourism Mr. Petrus Muteyauli Deputy Director, Multilateral Environmental Agreements Department of Environmental Affairs [email protected] [email protected]
For Nigeria Dr. Samuel Adeoye Adejuwon Director, Department of Climate Change Federal Ministry of Environment Plot 444, Aguiyi Ironsi Way Maitam, Abuja; Nigeria
For Tanzania: The Office of Vice President Sazi Salula Permanent Secretary Luthuli Street, P.O. Box 5380 Dar Es Salaam, Tanzania E-mail: [email protected] E-mail: [email protected]
A.1.5. Accredited entity Deutsche Bank AG
FINANCING / COST INFORMATION GREEN CLIMATE FUND FUNDING PROPOSAL | PAGE 5 OF 165
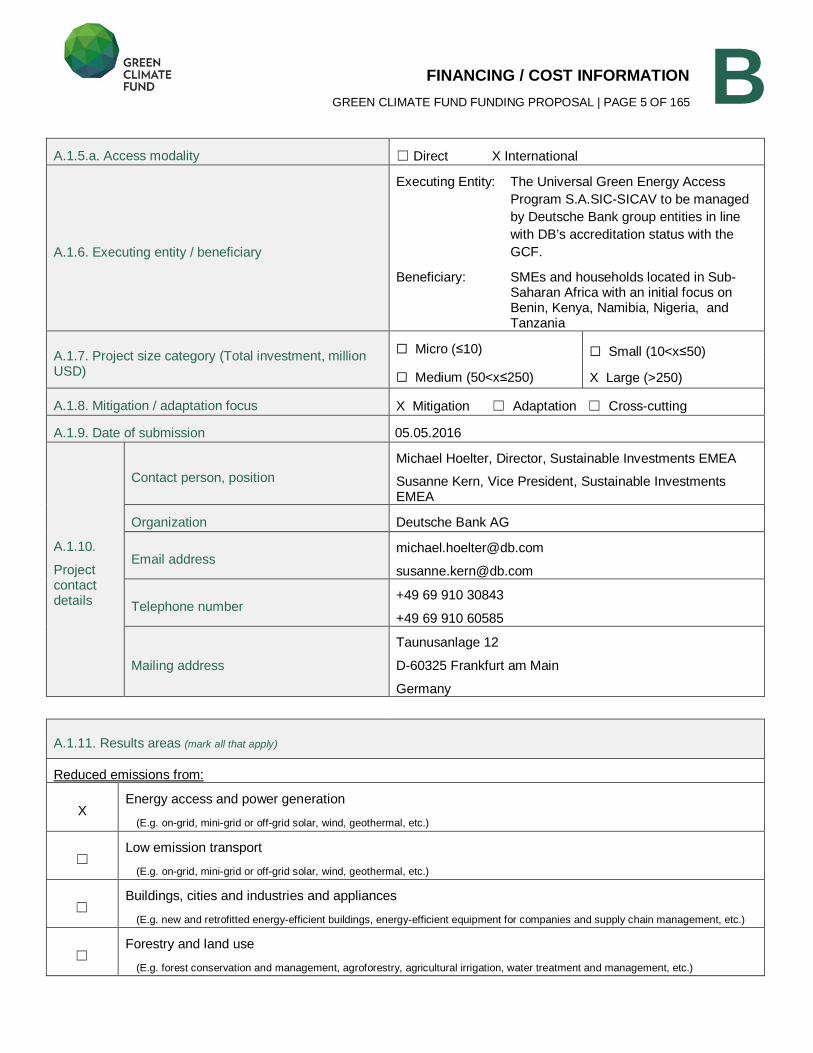
B A.1.5.a. Access modality Direct X International
A.1.6. Executing entity / beneficiary
Executing Entity: The Universal Green Energy Access
Program S.A.SIC-SICAV to be managed
by Deutsche Bank group entities in line
with DB’s accreditation status with the
GCF.
Beneficiary: SMEs and households located in Sub-Saharan Africa with an initial focus on Benin, Kenya, Namibia, Nigeria, and Tanzania
A.1.7. Project size category (Total investment, million USD)
Micro ( 10)
Medium (50<x 250)
Small (10<x 50)
X Large (>250)
A.1.8. Mitigation / adaptation focus X Mitigation Adaptation Cross-cutting
A.1.9. Date of submission 05.05.2016
A.1.10.
Project contact details
Contact person, position
Michael Hoelter, Director, Sustainable Investments EMEA
Susanne Kern, Vice President, Sustainable Investments EMEA
Organization Deutsche Bank AG
Email address [email protected]
Telephone number +49 69 910 30843
+49 69 910 60585
Mailing address
Taunusanlage 12
D-60325 Frankfurt am Main
Germany
A.1.11. Results areas (mark all that apply)
Reduced emissions from:
X Energy access and power generation
(E.g. on-grid, mini-grid or off-grid solar, wind, geothermal, etc.)
Low emission transport
(E.g. on-grid, mini-grid or off-grid solar, wind, geothermal, etc.)
Buildings, cities and industries and appliances
(E.g. new and retrofitted energy-efficient buildings, energy-efficient equipment for companies and supply chain management, etc.)
Forestry and land use
(E.g. forest conservation and management, agroforestry, agricultural irrigation, water treatment and management, etc.)
FINANCING / COST INFORMATION GREEN CLIMATE FUND FUNDING PROPOSAL | PAGE 6 OF 165
B
Increased resilience of:
Most vulnerable people and communities
(E.g. mitigation of operational risk associated with climate change – diversification of supply sources and supply chain management,
relocation of manufacturing facilities and warehouses, etc.)
Health and well-being, and food and water security
(E.g. climate-resilient crops, efficient irrigation systems, etc.)
Infrastructure and built environment
(E.g. sea walls, resilient road networks, etc.)
Ecosystem and ecosystem services
(E.g. ecosystem conservation and management, ecotourism, etc.)
FINANCING / COST INFORMATION GREEN CLIMATE FUND FUNDING PROPOSAL | PAGE 7 OF 165
B A.2. Program Executive Summary (max 300 words)
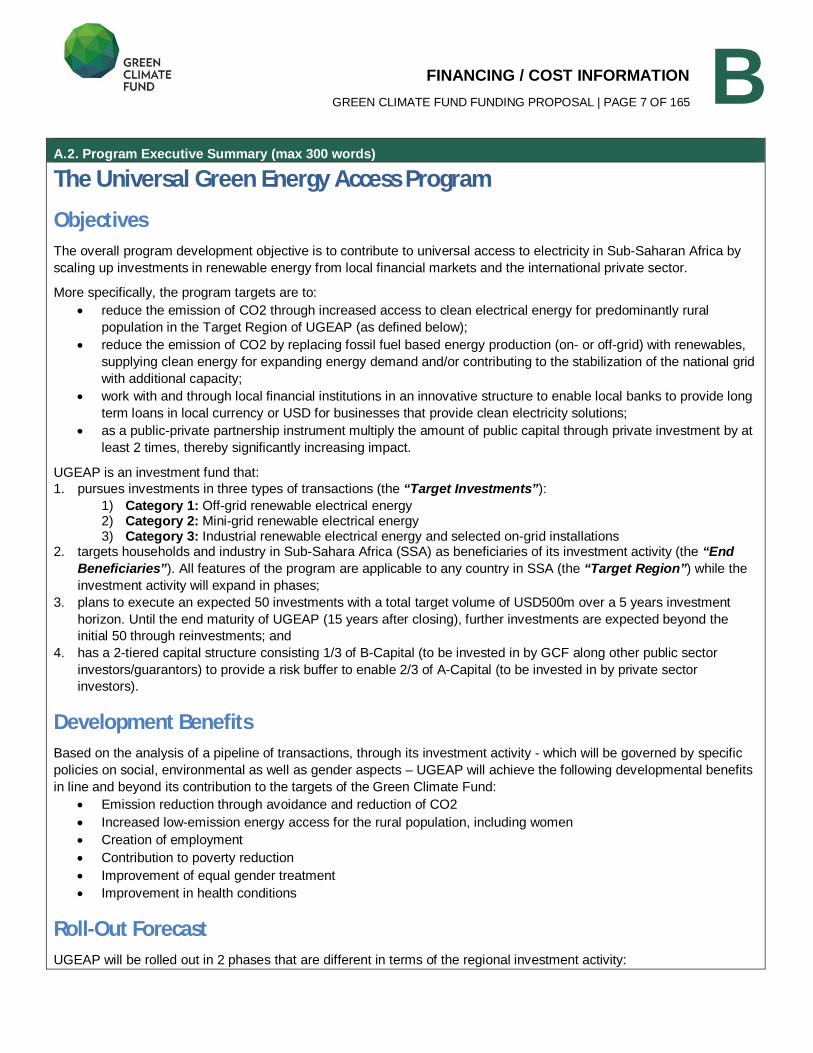
The Universal Green Energy Access Program
Objectives The overall program development objective is to contribute to universal access to electricity in Sub-Saharan Africa by
scaling up investments in renewable energy from local financial markets and the international private sector.
More specifically, the program targets are to:
reduce the emission of CO2 through increased access to clean electrical energy for predominantly rural
population in the Target Region of UGEAP (as defined below);
reduce the emission of CO2 by replacing fossil fuel based energy production (on- or off-grid) with renewables,
supplying clean energy for expanding energy demand and/or contributing to the stabilization of the national grid
with additional capacity;
work with and through local financial institutions in an innovative structure to enable local banks to provide long
term loans in local currency or USD for businesses that provide clean electricity solutions;
as a public-private partnership instrument multiply the amount of public capital through private investment by at
least 2 times, thereby significantly increasing impact.
UGEAP is an investment fund that:
1. pursues investments in three types of transactions (the “Target Investments”):
1) Category 1: Off-grid renewable electrical energy 2) Category 2: Mini-grid renewable electrical energy 3) Category 3: Industrial renewable electrical energy and selected on-grid installations
2. targets households and industry in Sub-Sahara Africa (SSA) as beneficiaries of its investment activity (the “End Beneficiaries”). All features of the program are applicable to any country in SSA (the “Target Region”) while the
investment activity will expand in phases;
3. plans to execute an expected 50 investments with a total target volume of USD500m over a 5 years investment
horizon. Until the end maturity of UGEAP (15 years after closing), further investments are expected beyond the
initial 50 through reinvestments; and
4. has a 2-tiered capital structure consisting 1/3 of B-Capital (to be invested in by GCF along other public sector
investors/guarantors) to provide a risk buffer to enable 2/3 of A-Capital (to be invested in by private sector
investors).
Development Benefits Based on the analysis of a pipeline of transactions, through its investment activity - which will be governed by specific
policies on social, environmental as well as gender aspects – UGEAP will achieve the following developmental benefits
in line and beyond its contribution to the targets of the Green Climate Fund:
Emission reduction through avoidance and reduction of CO2
Increased low-emission energy access for the rural population, including women
Creation of employment
Contribution to poverty reduction
Improvement of equal gender treatment
Improvement in health conditions
Roll-Out Forecast UGEAP will be rolled out in 2 phases that are different in terms of the regional investment activity:
FINANCING / COST INFORMATION GREEN CLIMATE FUND FUNDING PROPOSAL | PAGE 8 OF 165
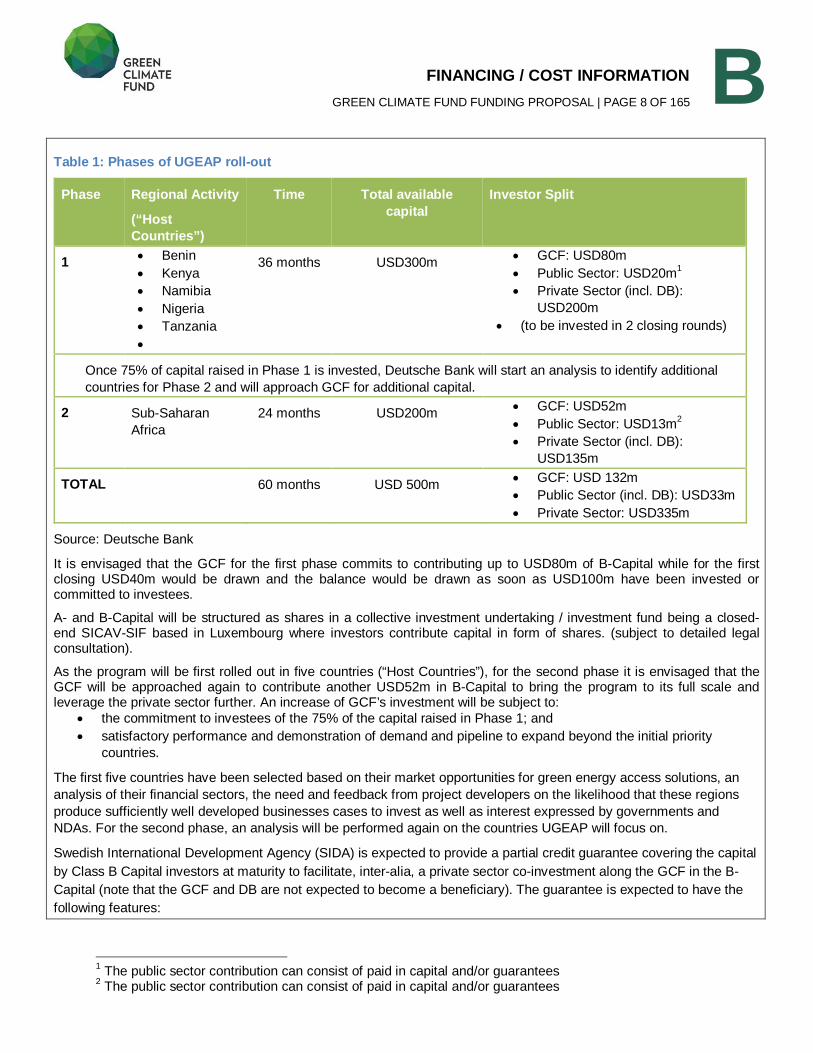
B Table 1: Phases of UGEAP roll-out
Phase Regional Activity
(“Host Countries”)
Time Total available capital
Investor Split
1 Benin
Kenya
Namibia
Nigeria
Tanzania
36 months USD300m GCF: USD80m
Public Sector: USD20m1
Private Sector (incl. DB):
USD200m
(to be invested in 2 closing rounds)
Once 75% of capital raised in Phase 1 is invested, Deutsche Bank will start an analysis to identify additional
countries for Phase 2 and will approach GCF for additional capital.
2 Sub-Saharan
Africa
24 months USD200m GCF: USD52m
Public Sector: USD13m2
Private Sector (incl. DB):
USD135m
TOTAL 60 months USD 500m GCF: USD 132m
Public Sector (incl. DB): USD33m
Private Sector: USD335m
Source: Deutsche Bank
It is envisaged that the GCF for the first phase commits to contributing up to USD80m of B-Capital while for the first closing USD40m would be drawn and the balance would be drawn as soon as USD100m have been invested or committed to investees.
A- and B-Capital will be structured as shares in a collective investment undertaking / investment fund being a closed-end SICAV-SIF based in Luxembourg where investors contribute capital in form of shares. (subject to detailed legal consultation).
As the program will be first rolled out in five countries (“Host Countries”), for the second phase it is envisaged that the GCF will be approached again to contribute another USD52m in B-Capital to bring the program to its full scale and leverage the private sector further. An increase of GCF’s investment will be subject to:
the commitment to investees of the 75% of the capital raised in Phase 1; and
satisfactory performance and demonstration of demand and pipeline to expand beyond the initial priority
countries.
The first five countries have been selected based on their market opportunities for green energy access solutions, an
analysis of their financial sectors, the need and feedback from project developers on the likelihood that these regions
produce sufficiently well developed businesses cases to invest as well as interest expressed by governments and
NDAs. For the second phase, an analysis will be performed again on the countries UGEAP will focus on.
Swedish International Development Agency (SIDA) is expected to provide a partial credit guarantee covering the capital
by Class B Capital investors at maturity to facilitate, inter-alia, a private sector co-investment along the GCF in the B-
Capital (note that the GCF and DB are not expected to become a beneficiary). The guarantee is expected to have the
following features:
1 The public sector contribution can consist of paid in capital and/or guarantees
2 The public sector contribution can consist of paid in capital and/or guarantees
FINANCING / COST INFORMATION GREEN CLIMATE FUND FUNDING PROPOSAL | PAGE 9 OF 165
B a) issued by a public entity benefiting from a ‘AAA’ credit rating;
b) being available pro-rata to all Class B Capital private sector investors;
c) available to be drawn upon first demand and at maturity of each Class B Capital tranche;
The Maximum Guarantee Amount equals the initial issue price of Class B Capital purchased by private sector investor
(with the exception of Deutsche Bank).
In return for the Partial Credit Guarantee, UGEAP will be obliged to pay a premium to SIDA to reflect the expected loss
in the amount of capital to be guaranteed by SIDA.
In addition and as compensation for putting in place the Partial Credit Guarantee, UGEAP is expected to be obliged to
pay a due diligence fee to SIDA.
Additional interest to invest in the B-Capital has been expressed by other public sector entities. DB is currently in
discussions with USAID which is considering support via a potential partnership, since outcomes of UEGEAP are aligned with
the Power Africa intiative and the Powering Agriculture energy grand challenge for development. DB also continues
additional discussions with other potential entities, inter alia the German Government (through its International Climate
Initiative), with regards to a potential participation in the program as investors or additional guarantors. Finally DB shall
co-invest along the capital structure (up to USD5m for B-Capital and USD10m for A-Capital) while financial market
regulation for Deutsche Bank limits the amount the bank is allowed to co-invest to 3% of total capital outstanding.
Structure of this Funding Proposal This application presents:
a) the UGEAP as an investment concept (the “Program Level”) designed to match funding needs of the Target Investments described above with the requirement of private sector investors for a stable, low risk return;
b) project types the UGEAP will target to invest debt capital into three different project categories that are referred to as “Category 1 Projects ”, “Category 2 Projects” and “Category 3 Projects”, respectively);
c) the climate mitigation and co-socio economic benefit targets of UGEAP. The analysis of three transactions, one out of each Category, that are in the pipeline for UGEAP was used as a basis for the expected outcomes and results. These sample transactions are referred to as “Project 1”, “Project 2” and “Project 3”, respectively.
Category 1 Projects: Solar Home Systems Solar Home Systems (SHS) are provided with an affordable payment plan via established payment means (ie.
mobile phones), comprehensive customer service and innovative remote monitoring technology, including after
sales services and maintenance.
(D)ESCOs offer low- to medium-income customers in SSA, including in remote areas, a clean and affordable
alternative to unhealthy, environmentally harmful, and expensive fossil fuels.
Private sector offers contribute to the targets of improved electrification while in some countries of the Target
Regions the market develops very quickly at this stage and capital is highly needed for expansion.
Category 2 Projects: Green Mini-Grids Companies that offer project 2 type transactions install, operate, and maintain photovoltaic (PV) based mini-
grids to sell energy services in rural communities.
Their technologies and processes enable companies to incrementally match generation capacity with
increasing consumer demand - effectively "growing" supply with consumption - in commercially viable, efficient,
and operationally scalable manner.
Category 3 Projects: Green industrial energy supply and selected on-grid projects
FINANCING / COST INFORMATION GREEN CLIMATE FUND FUNDING PROPOSAL | PAGE 10 OF 165 B
Companies in project 3 categories typically provide modular, transportable, often rented photovoltaic farms for
hybridization of diesel generators in frontier markets, deployed in containers or are small independent power
producers with typical sizes of 1-10 MW either as a captive power plant for industrial use or installations feeding
into the national electricity grid.
Companies offer remote small and medium enterprises (SMEs) and communities competitively-priced scalable
solar power, integrated intelligently with diesel generators, without up-front investment, on flexible rental
contracts.
UGEAP will invest only in companies with a sufficiently long track record employing proven technology and having the
necessary local presence and operations.
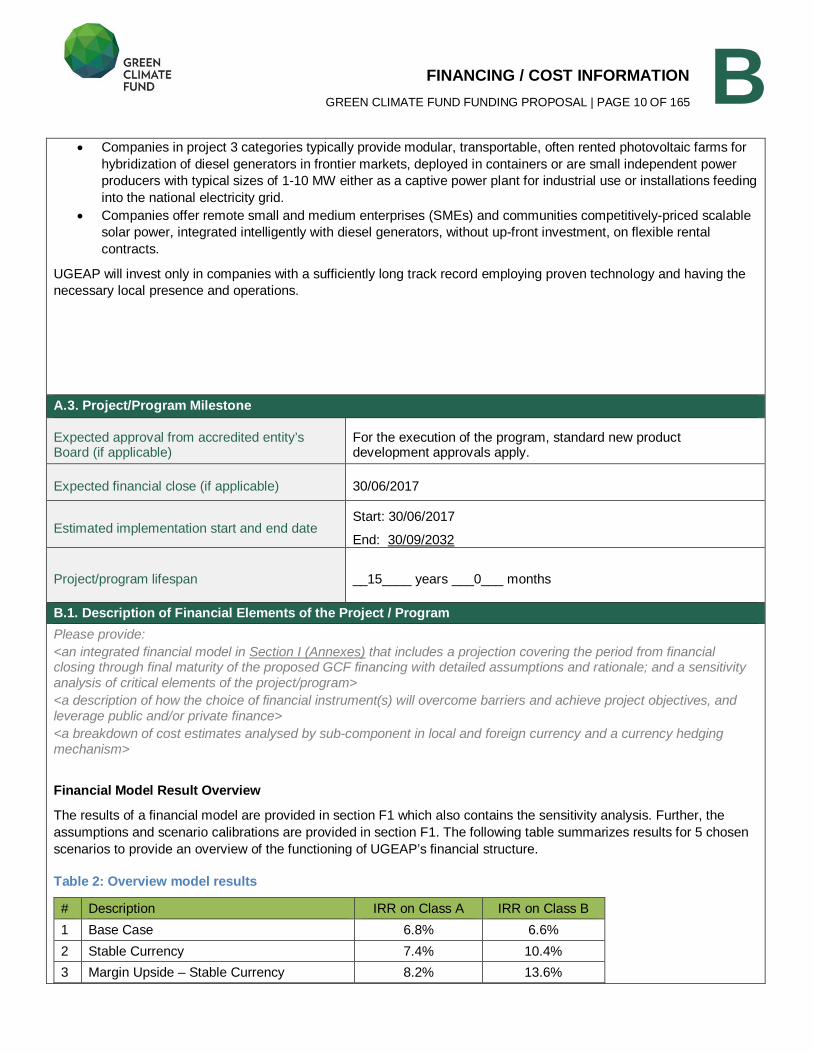
A.3. Project/Program Milestone
Expected approval from accredited entity’sBoard (if applicable)
For the execution of the program, standard new productdevelopment approvals apply.
Expected financial close (if applicable) 30/06/2017
Estimated implementation start and end dateStart: 30/06/2017
End: 30/09/2032
Project/program lifespan __15____ years ___0___ months
B.1. Description of Financial Elements of the Project / Program Please provide: <an integrated financial model in Section I (Annexes) that includes a projection covering the period from financial closing through final maturity of the proposed GCF financing with detailed assumptions and rationale; and a sensitivity analysis of critical elements of the project/program> <a description of how the choice of financial instrument(s) will overcome barriers and achieve project objectives, and leverage public and/or private finance> <a breakdown of cost estimates analysed by sub-component in local and foreign currency and a currency hedging mechanism>
Financial Model Result Overview
The results of a financial model are provided in section F1 which also contains the sensitivity analysis. Further, the
assumptions and scenario calibrations are provided in section F1. The following table summarizes results for 5 chosen
scenarios to provide an overview of the functioning of UGEAP’s financial structure.
Table 2: Overview model results
# Description IRR on Class A IRR on Class B
1 Base Case 6.8% 6.6%
2 Stable Currency 7.4% 10.4%
3 Margin Upside – Stable Currency 8.2% 13.6%
FINANCING / COST INFORMATION GREEN CLIMATE FUND FUNDING PROPOSAL | PAGE 11 OF 165
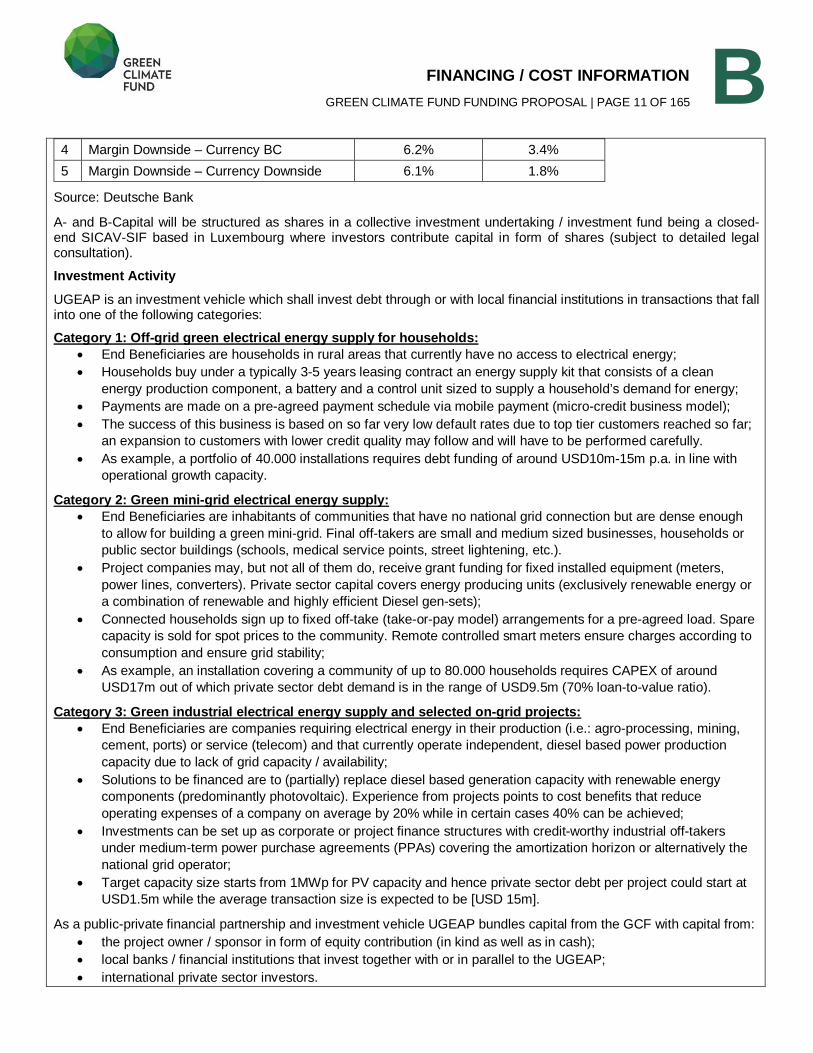
B 4 Margin Downside – Currency BC 6.2% 3.4%
5 Margin Downside – Currency Downside 6.1% 1.8%
Source: Deutsche Bank
A- and B-Capital will be structured as shares in a collective investment undertaking / investment fund being a closed-end SICAV-SIF based in Luxembourg where investors contribute capital in form of shares (subject to detailed legal consultation). Investment Activity
UGEAP is an investment vehicle which shall invest debt through or with local financial institutions in transactions that fall into one of the following categories:
Category 1: Off-grid green electrical energy supply for households: End Beneficiaries are households in rural areas that currently have no access to electrical energy;
Households buy under a typically 3-5 years leasing contract an energy supply kit that consists of a clean
energy production component, a battery and a control unit sized to supply a household’s demand for energy;
Payments are made on a pre-agreed payment schedule via mobile payment (micro-credit business model);
The success of this business is based on so far very low default rates due to top tier customers reached so far;
an expansion to customers with lower credit quality may follow and will have to be performed carefully.
As example, a portfolio of 40.000 installations requires debt funding of around USD10m-15m p.a. in line with
operational growth capacity.
Category 2: Green mini-grid electrical energy supply: End Beneficiaries are inhabitants of communities that have no national grid connection but are dense enough
to allow for building a green mini-grid. Final off-takers are small and medium sized businesses, households or
public sector buildings (schools, medical service points, street lightening, etc.).
Project companies may, but not all of them do, receive grant funding for fixed installed equipment (meters,
power lines, converters). Private sector capital covers energy producing units (exclusively renewable energy or
a combination of renewable and highly efficient Diesel gen-sets);
Connected households sign up to fixed off-take (take-or-pay model) arrangements for a pre-agreed load. Spare
capacity is sold for spot prices to the community. Remote controlled smart meters ensure charges according to
consumption and ensure grid stability;
As example, an installation covering a community of up to 80.000 households requires CAPEX of around
USD17m out of which private sector debt demand is in the range of USD9.5m (70% loan-to-value ratio).
Category 3: Green industrial electrical energy supply and selected on-grid projects: End Beneficiaries are companies requiring electrical energy in their production (i.e.: agro-processing, mining,
cement, ports) or service (telecom) and that currently operate independent, diesel based power production
capacity due to lack of grid capacity / availability;
Solutions to be financed are to (partially) replace diesel based generation capacity with renewable energy
components (predominantly photovoltaic). Experience from projects points to cost benefits that reduce
operating expenses of a company on average by 20% while in certain cases 40% can be achieved;
Investments can be set up as corporate or project finance structures with credit-worthy industrial off-takers
under medium-term power purchase agreements (PPAs) covering the amortization horizon or alternatively the
national grid operator;
Target capacity size starts from 1MWp for PV capacity and hence private sector debt per project could start at
USD1.5m while the average transaction size is expected to be [USD 15m].
As a public-private financial partnership and investment vehicle UGEAP bundles capital from the GCF with capital from:
the project owner / sponsor in form of equity contribution (in kind as well as in cash);
local banks / financial institutions that invest together with or in parallel to the UGEAP;
international private sector investors.
FINANCING / COST INFORMATION GREEN CLIMATE FUND FUNDING PROPOSAL | PAGE 12 OF 165
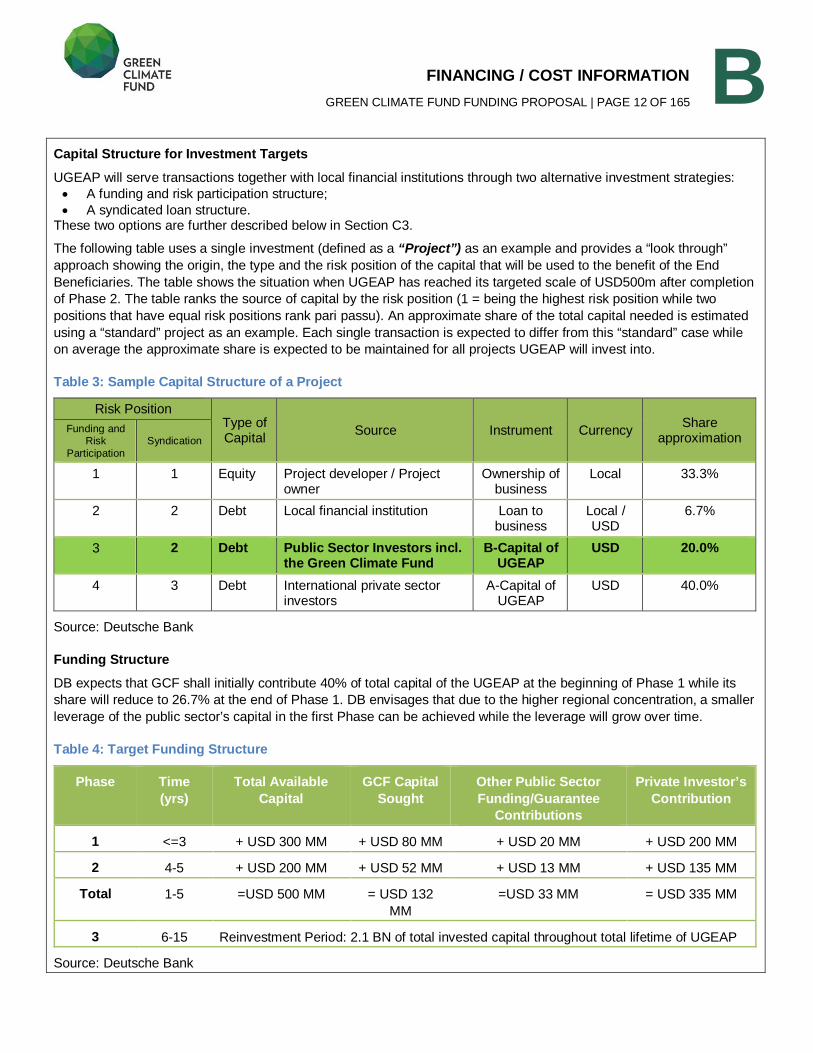
B Capital Structure for Investment Targets
UGEAP will serve transactions together with local financial institutions through two alternative investment strategies:
A funding and risk participation structure;
A syndicated loan structure. These two options are further described below in Section C3.
The following table uses a single investment (defined as a “Project”) as an example and provides a “look through”
approach showing the origin, the type and the risk position of the capital that will be used to the benefit of the End
Beneficiaries. The table shows the situation when UGEAP has reached its targeted scale of USD500m after completion
of Phase 2. The table ranks the source of capital by the risk position (1 = being the highest risk position while two
positions that have equal risk positions rank pari passu). An approximate share of the total capital needed is estimated
using a “standard” project as an example. Each single transaction is expected to differ from this “standard” case while
on average the approximate share is expected to be maintained for all projects UGEAP will invest into.
Table 3: Sample Capital Structure of a Project
Risk Position Type of Capital
Source Instrument Currency Share
approximation Funding and
Risk
Participation
Syndication
1 1 Equity Project developer / Project owner
Ownership of business
Local 33.3%
2 2 Debt Local financial institution Loan to business
Local / USD
6.7%
3 2 Debt Public Sector Investors incl. the Green Climate Fund
B-Capital of UGEAP
USD 20.0%
4 3 Debt International private sector investors
A-Capital of UGEAP
USD 40.0%
Source: Deutsche Bank
Funding Structure
DB expects that GCF shall initially contribute 40% of total capital of the UGEAP at the beginning of Phase 1 while its
share will reduce to 26.7% at the end of Phase 1. DB envisages that due to the higher regional concentration, a smaller
leverage of the public sector’s capital in the first Phase can be achieved while the leverage will grow over time.
Table 4: Target Funding Structure
Phase Time (yrs)
Total Available Capital
GCF Capital Sought
Other Public Sector Funding/Guarantee
Contributions
Private Investor’s Contribution
1 <=3 + USD 300 MM + USD 80 MM + USD 20 MM + USD 200 MM
2 4-5 + USD 200 MM + USD 52 MM + USD 13 MM + USD 135 MM
Total 1-5 =USD 500 MM = USD 132
MM
=USD 33 MM = USD 335 MM
3 6-15 Reinvestment Period: 2.1 BN of total invested capital throughout total lifetime of UGEAP
Source: Deutsche Bank
FINANCING / COST INFORMATION GREEN CLIMATE FUND FUNDING PROPOSAL | PAGE 13 OF 165
B For additional information on the closings please refer to Table 13: Overview of Closings in Section C.3 Project/
Programme Description
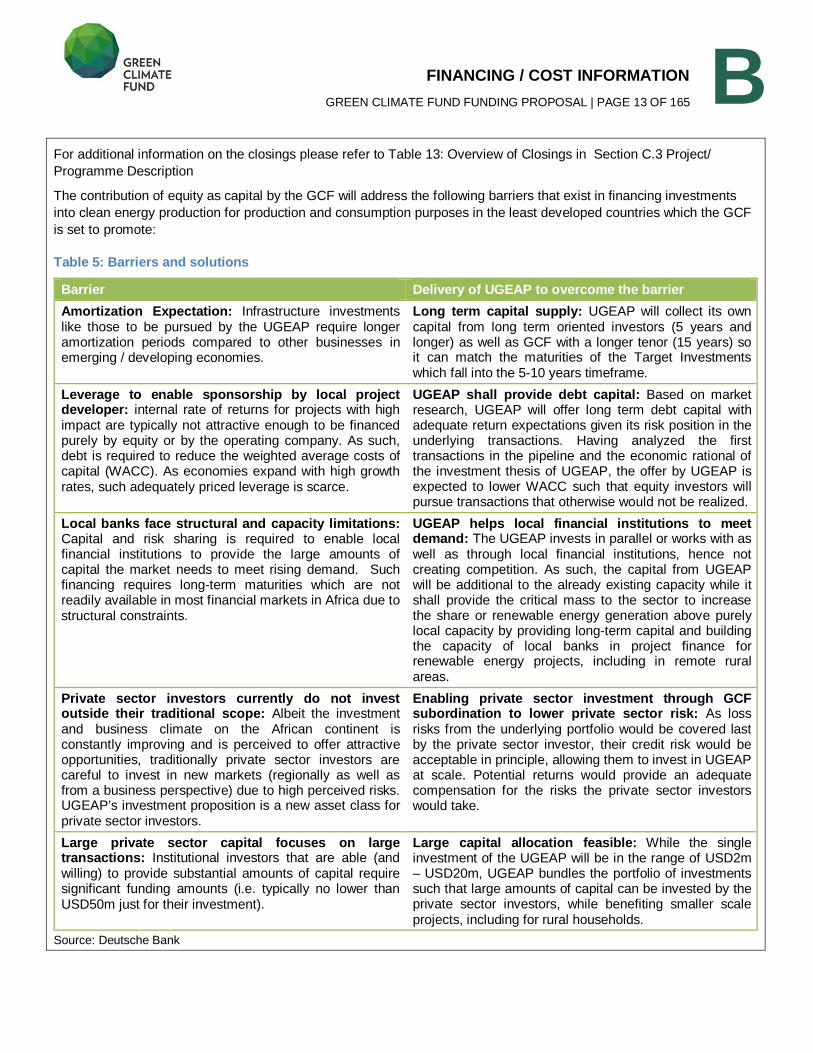
The contribution of equity as capital by the GCF will address the following barriers that exist in financing investments
into clean energy production for production and consumption purposes in the least developed countries which the GCF
is set to promote:
Table 5: Barriers and solutions
Barrier Delivery of UGEAP to overcome the barrier Amortization Expectation: Infrastructure investments like those to be pursued by the UGEAP require longer amortization periods compared to other businesses in emerging / developing economies.
Long term capital supply: UGEAP will collect its own capital from long term oriented investors (5 years and longer) as well as GCF with a longer tenor (15 years) so it can match the maturities of the Target Investments which fall into the 5-10 years timeframe.
Leverage to enable sponsorship by local project developer: internal rate of returns for projects with high impact are typically not attractive enough to be financed purely by equity or by the operating company. As such, debt is required to reduce the weighted average costs of capital (WACC). As economies expand with high growth rates, such adequately priced leverage is scarce.
UGEAP shall provide debt capital: Based on market research, UGEAP will offer long term debt capital with adequate return expectations given its risk position in the underlying transactions. Having analyzed the first transactions in the pipeline and the economic rational of the investment thesis of UGEAP, the offer by UGEAP is expected to lower WACC such that equity investors will pursue transactions that otherwise would not be realized.
Local banks face structural and capacity limitations: Capital and risk sharing is required to enable local financial institutions to provide the large amounts of capital the market needs to meet rising demand. Such financing requires long-term maturities which are not readily available in most financial markets in Africa due to structural constraints.
UGEAP helps local financial institutions to meet demand: The UGEAP invests in parallel or works with as well as through local financial institutions, hence not creating competition. As such, the capital from UGEAP will be additional to the already existing capacity while it shall provide the critical mass to the sector to increase the share or renewable energy generation above purely local capacity by providing long-term capital and building the capacity of local banks in project finance for renewable energy projects, including in remote rural areas.
Private sector investors currently do not invest outside their traditional scope: Albeit the investment and business climate on the African continent is constantly improving and is perceived to offer attractive opportunities, traditionally private sector investors are careful to invest in new markets (regionally as well as from a business perspective) due to high perceived risks. UGEAP’s investment proposition is a new asset class for private sector investors.
Enabling private sector investment through GCF subordination to lower private sector risk: As loss risks from the underlying portfolio would be covered last by the private sector investor, their credit risk would be acceptable in principle, allowing them to invest in UGEAP at scale. Potential returns would provide an adequate compensation for the risks the private sector investors would take.
Large private sector capital focuses on large transactions: Institutional investors that are able (and willing) to provide substantial amounts of capital require significant funding amounts (i.e. typically no lower than USD50m just for their investment).
Large capital allocation feasible: While the single investment of the UGEAP will be in the range of USD2m – USD20m, UGEAP bundles the portfolio of investments such that large amounts of capital can be invested by the private sector investors, while benefiting smaller scale projects, including for rural households.
Source: Deutsche Bank
FINANCING / COST INFORMATION GREEN CLIMATE FUND FUNDING PROPOSAL | PAGE 14 OF 165
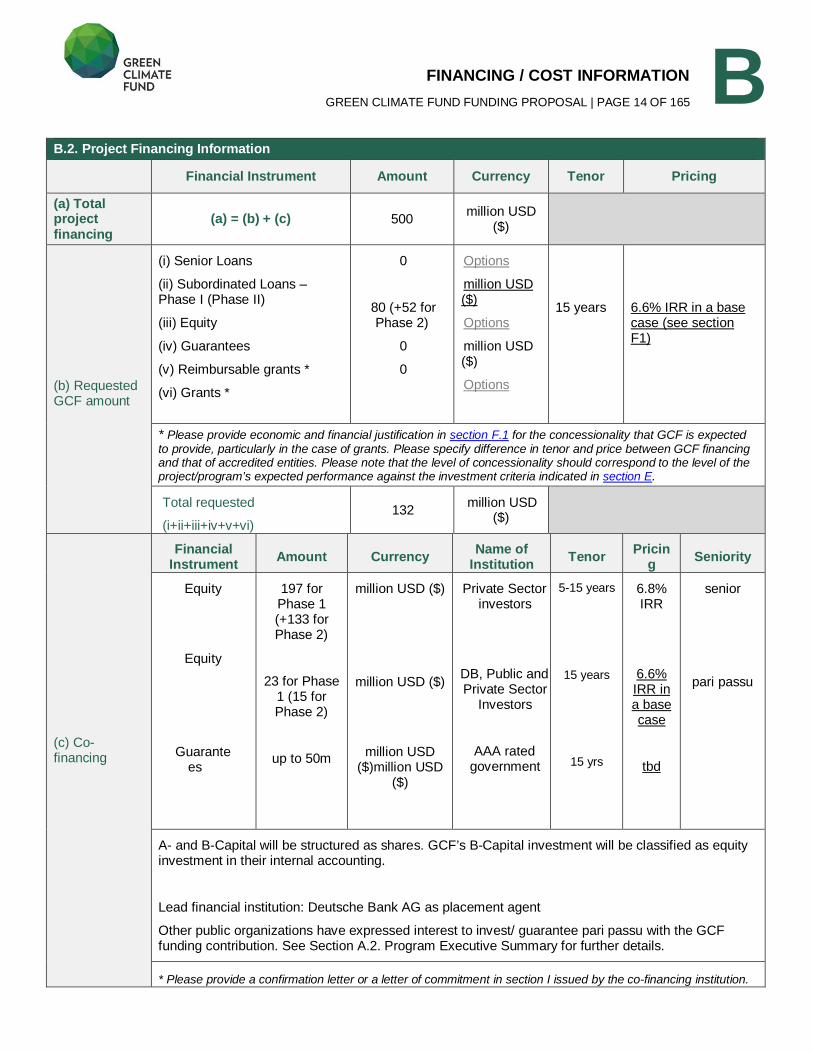
B B.2. Project Financing Information Financial Instrument Amount Currency Tenor Pricing
(a) Total project financing
(a) = (b) + (c) 500 million USD
($)
(b) Requested GCF amount
(i) Senior Loans
(ii) Subordinated Loans – Phase I (Phase II)
(iii) Equity
(iv) Guarantees
(v) Reimbursable grants *
(vi) Grants *
0
80 (+52 for Phase 2)
0
0
Options
million USD ($)
Options
million USD ($)
Options
15 years
6.6% IRR in a base case (see section F1)
* Please provide economic and financial justification in section F.1 for the concessionality that GCF is expected to provide, particularly in the case of grants. Please specify difference in tenor and price between GCF financing and that of accredited entities. Please note that the level of concessionality should correspond to the level of the project/program’s expected performance against the investment criteria indicated in section E.
Total requested
(i+ii+iii+iv+v+vi) 132
million USD ($)
(c) Co-financing
Financial Instrument Amount Currency Name of
Institution Tenor Pricing Seniority
Equity
Equity
Guarantees
197 for Phase 1 (+133 for Phase 2)
23 for Phase 1 (15 for Phase 2)
up to 50m
million USD ($)
million USD ($)
million USD ($)million USD
($)
Private Sector investors
DB, Public and Private Sector
Investors
AAA rated government
5-15 years
15 years
15 yrs
6.8% IRR
6.6% IRR in a base case
tbd
senior
pari passu
A- and B-Capital will be structured as shares. GCF’s B-Capital investment will be classified as equity investment in their internal accounting.
Lead financial institution: Deutsche Bank AG as placement agent
Other public organizations have expressed interest to invest/ guarantee pari passu with the GCF funding contribution. See Section A.2. Program Executive Summary for further details.
* Please provide a confirmation letter or a letter of commitment in section I issued by the co-financing institution.
FINANCING / COST INFORMATION GREEN CLIMATE FUND FUNDING PROPOSAL | PAGE 15 OF 165
B B.3. Fee Arrangement (if applicable) <Please specify the fee arrangement between the Fund and the accredited entity, in case it is project/program specific.>
Deutsche Bank (DB) will have two main roles in the UGEAP (and can assume further functions subject to a match
between the tasks to be covered and DB’s offer / capabilities), notably:
Investment manager of the UGEAP; and
Placement agent.
Investment Manager
As Investment manager, DB will provide investment origination, underwriting, structuring, execution, and administration
services. As compensation for the services, DB will receive a market based investment management fee. The fee will
equal the sum of (i) 1.5% p.a. on the outstanding balance of invested capital and (ii) 0.5% on committed capital, each at
the end of each quarter.
Placement Agent
Placing capital with private sector investors will be compensated for by a market based placement fee borne by the
investor. The placement fee is market driven and depends on the total amount placed, the amount placed with a single
investor, the type of investor who has acquired and the type of capital that shall be placed. Private sector investors shall
be offered Class A and Class B capital while GCF is foreseen to invest into Class B capital only.
The placement fee will equal 0.10% p.a. of the amount of subscribed capital for Class B to be acquired by the GCF
while outstanding.
Further Services
Beyond the core functions mentioned above, DB may also provide ancillary services to UGEAP (administrative agent,
cash management services, paying agent, trustee, etc.) Such services are typically tendered by DB and the respective
other product units of DB may be asked to participate in the tender. Reference is made to the procurement standards of
DB as detailed in the accreditation application.
B.4. Financial Market Overview (if applicable) <How market price or expected commercial rate return was (non-concessional) determined?> <Please provide an overview of the size of total banking assets, debt capital markets and equity capital markets.> <Please provide an overview of market rates (i.e. 1-year T-Bill, 5-year government bond, 5-year corporate bond (specify credit rating) and 5-year syndicate loan.> <Provide examples or information on comparable transactions.>
Program Level UGEAP targets to mobilize private sector capital for investments as described above. For investors, the investment
offer by UGEAP falls into the following investment bucket:
Infrastructure assets;
Debt product;
Unrated / expected to be sub-investment grade quality;
Long term;
USD denominated;
Variable return structure.
Investment Climate
FINANCING / COST INFORMATION GREEN CLIMATE FUND FUNDING PROPOSAL | PAGE 16 OF 165
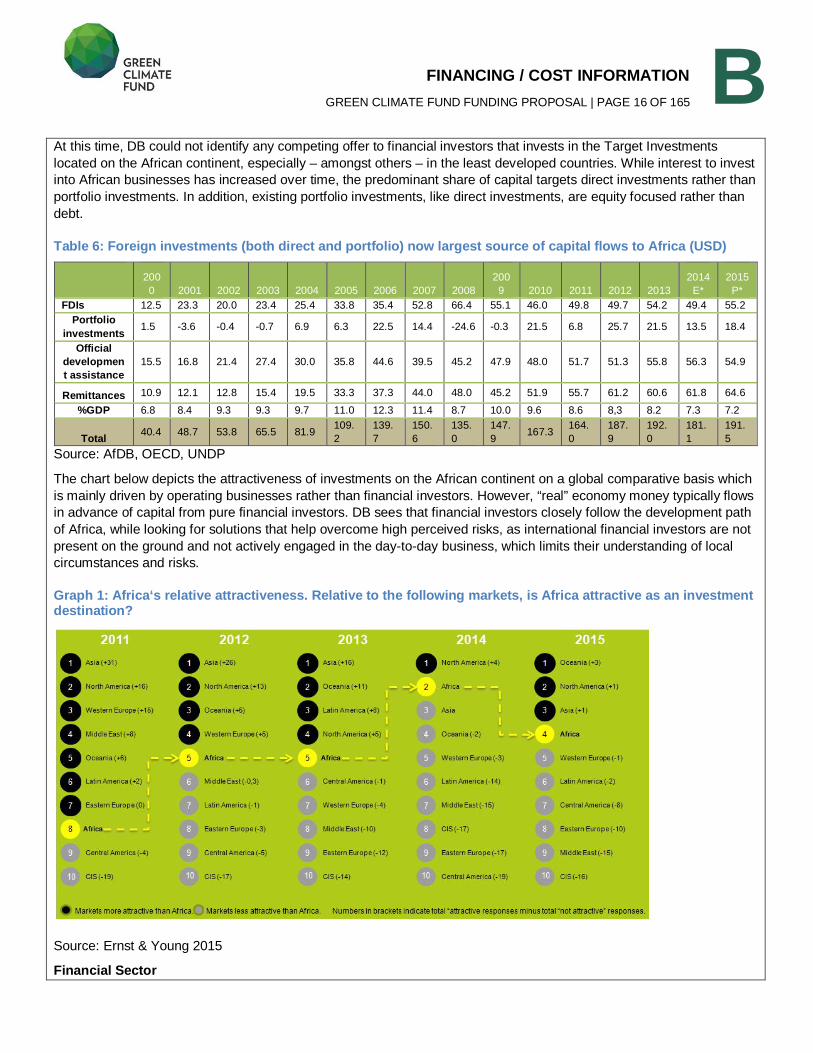
B At this time, DB could not identify any competing offer to financial investors that invests in the Target Investments
located on the African continent, especially – amongst others – in the least developed countries. While interest to invest
into African businesses has increased over time, the predominant share of capital targets direct investments rather than
portfolio investments. In addition, existing portfolio investments, like direct investments, are equity focused rather than
debt.
Table 6: Foreign investments (both direct and portfolio) now largest source of capital flows to Africa (USD)
200
0 2001 2002 2003 2004 2005 2006 2007 2008
200
9 2010 2011 2012 2013
2014
E*
2015
P*
FDIs 12.5 23.3 20.0 23.4 25.4 33.8 35.4 52.8 66.4 55.1 46.0 49.8 49.7 54.2 49.4 55.2
Portfolio investments 1.5 -3.6 -0.4 -0.7 6.9 6.3 22.5 14.4 -24.6 -0.3 21.5 6.8 25.7 21.5 13.5 18.4
Official development assistance
15.5 16.8 21.4 27.4 30.0 35.8 44.6 39.5 45.2 47.9 48.0 51.7 51.3 55.8 56.3 54.9
Remittances 10.9 12.1 12.8 15.4 19.5 33.3 37.3 44.0 48.0 45.2 51.9 55.7 61.2 60.6 61.8 64.6
%GDP 6.8 8.4 9.3 9.3 9.7 11.0 12.3 11.4 8.7 10.0 9.6 8.6 8,3 8.2 7.3 7.2
Total 40.4 48.7 53.8 65.5 81.9 109.
2
139.
7
150.
6
135.
0
147.
9 167.3
164.
0
187.
9
192.
0
181.
1
191.
5
Source: AfDB, OECD, UNDP
The chart below depicts the attractiveness of investments on the African continent on a global comparative basis which
is mainly driven by operating businesses rather than financial investors. However, “real” economy money typically flows
in advance of capital from pure financial investors. DB sees that financial investors closely follow the development path
of Africa, while looking for solutions that help overcome high perceived risks, as international financial investors are not
present on the ground and not actively engaged in the day-to-day business, which limits their understanding of local
circumstances and risks.
Graph 1: Africa‘s relative attractiveness. Relative to the following markets, is Africa attractive as an investment destination?
Source: Ernst & Young 2015
Financial Sector
FINANCING / COST INFORMATION GREEN CLIMATE FUND FUNDING PROPOSAL | PAGE 17 OF 165
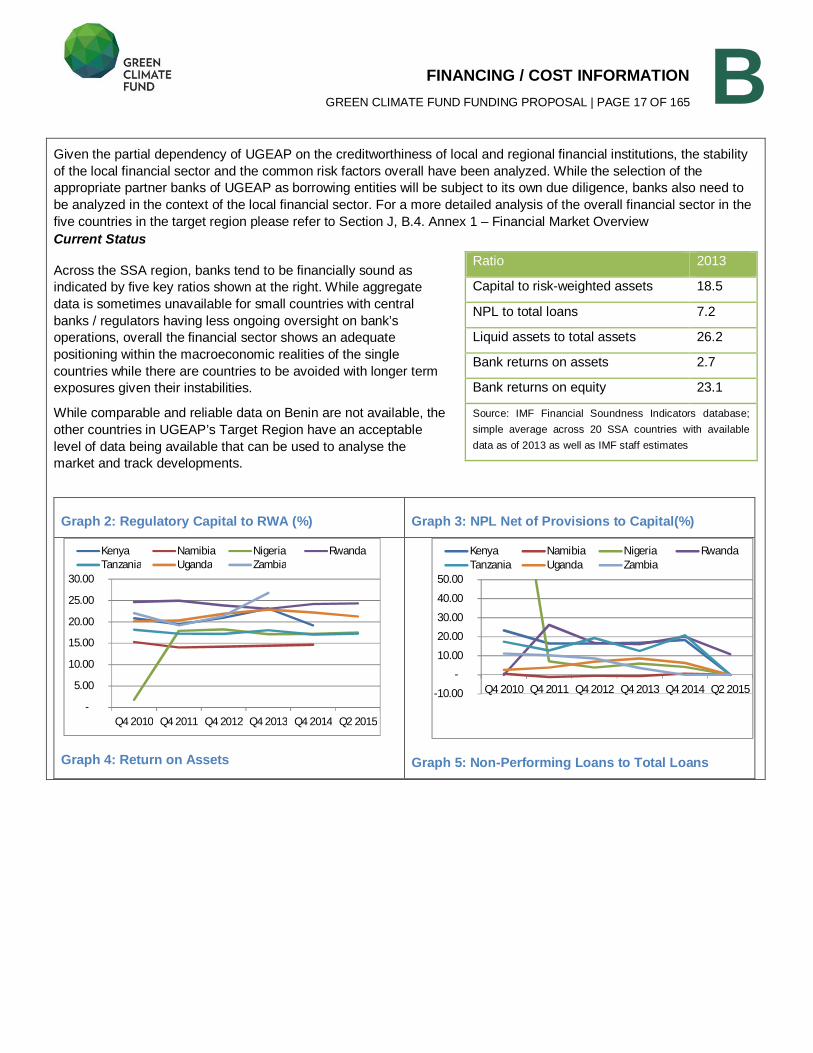
B Given the partial dependency of UGEAP on the creditworthiness of local and regional financial institutions, the stability
of the local financial sector and the common risk factors overall have been analyzed. While the selection of the
appropriate partner banks of UGEAP as borrowing entities will be subject to its own due diligence, banks also need to
be analyzed in the context of the local financial sector. For a more detailed analysis of the overall financial sector in the
five countries in the target region please refer to Section J, B.4. Annex 1 – Financial Market Overview
Current Status
Across the SSA region, banks tend to be financially sound as
indicated by five key ratios shown at the right. While aggregate
data is sometimes unavailable for small countries with central
banks / regulators having less ongoing oversight on bank’s
operations, overall the financial sector shows an adequate
positioning within the macroeconomic realities of the single
countries while there are countries to be avoided with longer term
exposures given their instabilities.
While comparable and reliable data on Benin are not available, the
other countries in UGEAP’s Target Region have an acceptable
level of data being available that can be used to analyse the
market and track developments.
Graph 2: Regulatory Capital to RWA (%) Graph 3: NPL Net of Provisions to Capital(%)
Graph 4: Return on Assets Graph 5: Non-Performing Loans to Total Loans
Ratio 2013
Capital to risk-weighted assets 18.5
NPL to total loans 7.2
Liquid assets to total assets 26.2
Bank returns on assets 2.7
Bank returns on equity 23.1
Source: IMF Financial Soundness Indicators database;
simple average across 20 SSA countries with available
data as of 2013 as well as IMF staff estimates
-
5.00
10.00
15.00
20.00
25.00
30.00
Q4 2010 Q4 2011 Q4 2012 Q4 2013 Q4 2014 Q2 2015
Kenya Namibia Nigeria RwandaTanzania Uganda Zambia
-10.00
-
10.00
20.00
30.00
40.00
50.00
Q4 2010 Q4 2011 Q4 2012 Q4 2013 Q4 2014 Q2 2015
Kenya Namibia Nigeria RwandaTanzania Uganda Zambia
FINANCING / COST INFORMATION GREEN CLIMATE FUND FUNDING PROPOSAL | PAGE 18 OF 165
B
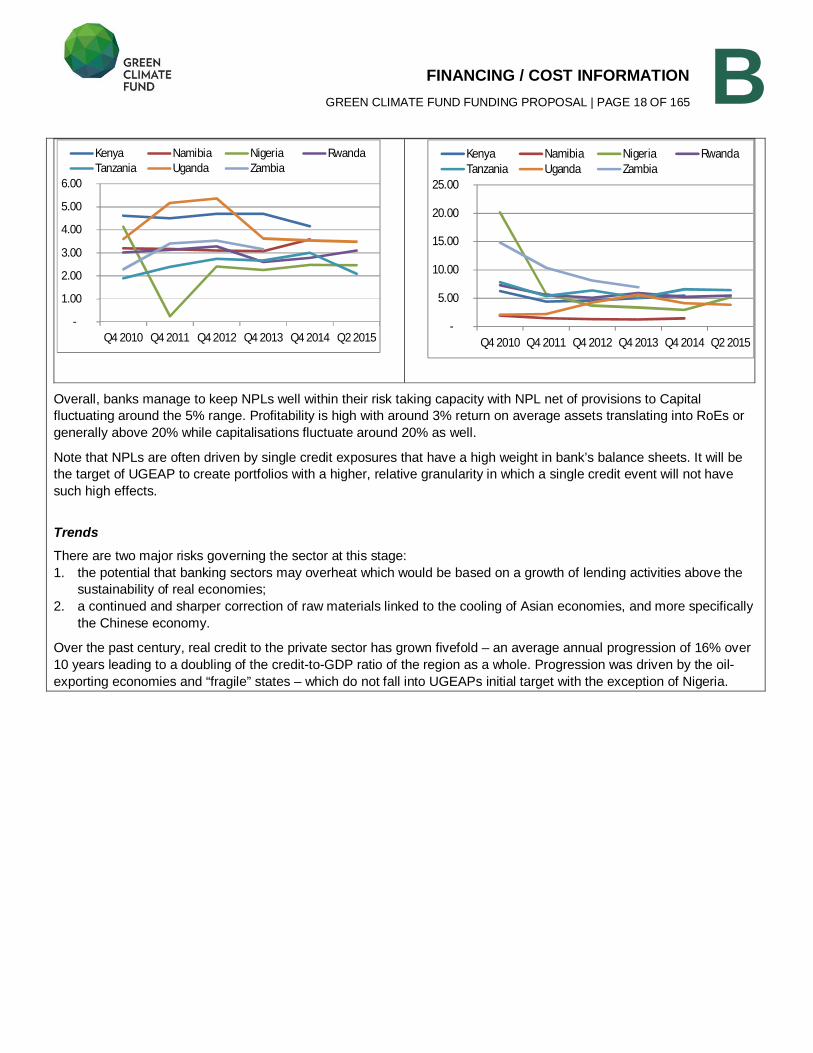
Overall, banks manage to keep NPLs well within their risk taking capacity with NPL net of provisions to Capital
fluctuating around the 5% range. Profitability is high with around 3% return on average assets translating into RoEs or
generally above 20% while capitalisations fluctuate around 20% as well.
Note that NPLs are often driven by single credit exposures that have a high weight in bank’s balance sheets. It will be
the target of UGEAP to create portfolios with a higher, relative granularity in which a single credit event will not have
such high effects.
Trends There are two major risks governing the sector at this stage:
1. the potential that banking sectors may overheat which would be based on a growth of lending activities above the
sustainability of real economies;
2. a continued and sharper correction of raw materials linked to the cooling of Asian economies, and more specifically
the Chinese economy.
Over the past century, real credit to the private sector has grown fivefold – an average annual progression of 16% over
10 years leading to a doubling of the credit-to-GDP ratio of the region as a whole. Progression was driven by the oil-
exporting economies and “fragile” states – which do not fall into UGEAPs initial target with the exception of Nigeria.
-
5.00
10.00
15.00
20.00
25.00
Q4 2010 Q4 2011 Q4 2012 Q4 2013 Q4 2014 Q2 2015
Kenya Namibia Nigeria RwandaTanzania Uganda Zambia
-
1.00
2.00
3.00
4.00
5.00
6.00
Q4 2010 Q4 2011 Q4 2012 Q4 2013 Q4 2014 Q2 2015
Kenya Namibia Nigeria RwandaTanzania Uganda Zambia
FINANCING / COST INFORMATION GREEN CLIMATE FUND FUNDING PROPOSAL | PAGE 19 OF 165
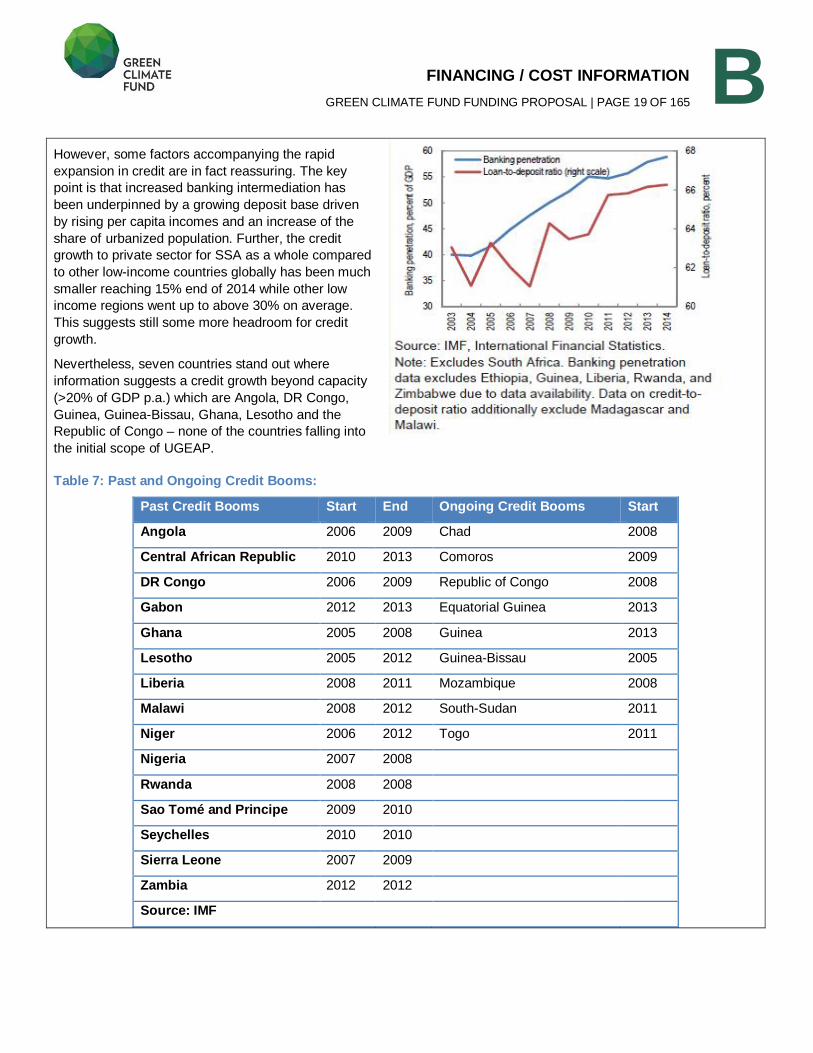
B However, some factors accompanying the rapid
expansion in credit are in fact reassuring. The key
point is that increased banking intermediation has
been underpinned by a growing deposit base driven
by rising per capita incomes and an increase of the
share of urbanized population. Further, the credit
growth to private sector for SSA as a whole compared
to other low-income countries globally has been much
smaller reaching 15% end of 2014 while other low
income regions went up to above 30% on average.
This suggests still some more headroom for credit
growth.
Nevertheless, seven countries stand out where
information suggests a credit growth beyond capacity
(>20% of GDP p.a.) which are Angola, DR Congo,
Guinea, Guinea-Bissau, Ghana, Lesotho and the
Republic of Congo – none of the countries falling into
the initial scope of UGEAP.
Table 7: Past and Ongoing Credit Booms:
Past Credit Booms Start End Ongoing Credit Booms Start
Angola 2006 2009 Chad 2008
Central African Republic 2010 2013 Comoros 2009
DR Congo 2006 2009 Republic of Congo 2008
Gabon 2012 2013 Equatorial Guinea 2013
Ghana 2005 2008 Guinea 2013
Lesotho 2005 2012 Guinea-Bissau 2005
Liberia 2008 2011 Mozambique 2008
Malawi 2008 2012 South-Sudan 2011
Niger 2006 2012 Togo 2011
Nigeria 2007 2008
Rwanda 2008 2008
Sao Tomé and Principe 2009 2010
Seychelles 2010 2010
Sierra Leone 2007 2009
Zambia 2012 2012
Source: IMF
DETAILED PROJECT / PROGRAMME DESCRIPTION GREEN CLIMATE FUND FUNDING PROPOSAL | PAGE 20 OF 165
C Please fill out applicable sub-sections and provide additional information if necessary, as these requirements may vary depending on the nature of the project / program.
C.1. Strategic Context <Please describe relevant national, sub-national, regional, global, political, and/or economic factors that help to contextualize the proposal, including existing national and sector policies and strategies.>
Program Level
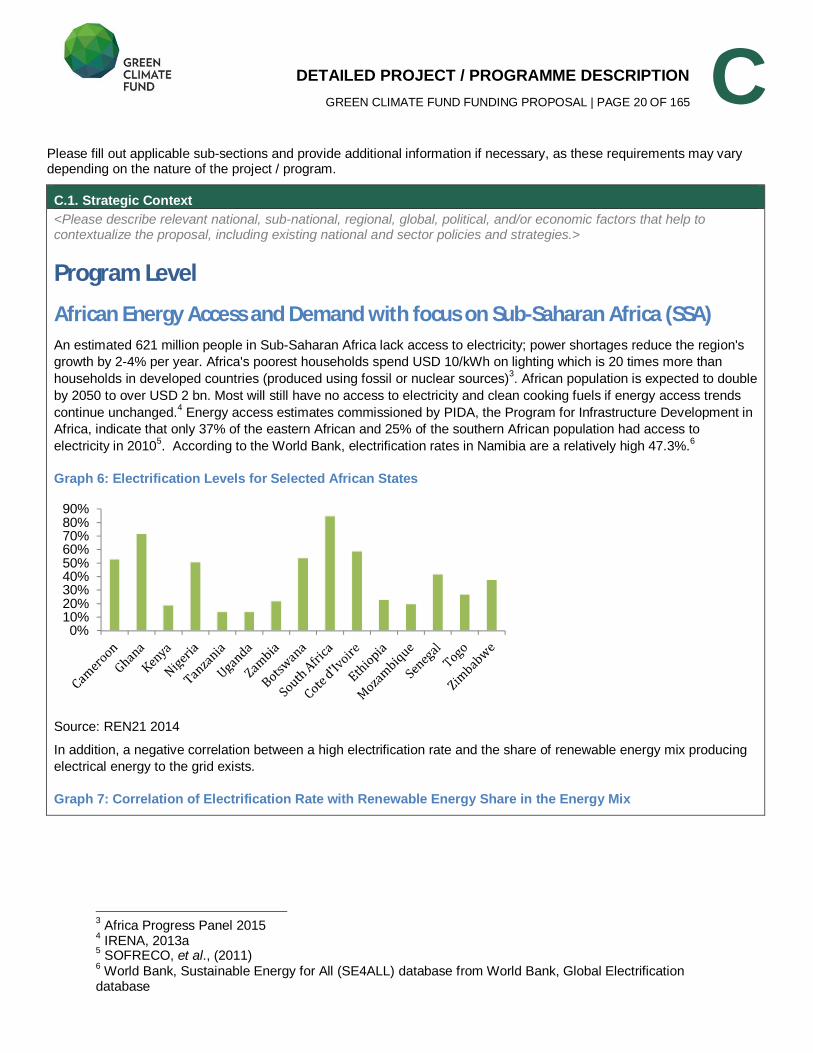
African Energy Access and Demand with focus on Sub-Saharan Africa (SSA) An estimated 621 million people in Sub-Saharan Africa lack access to electricity; power shortages reduce the region's
growth by 2-4% per year. Africa's poorest households spend USD 10/kWh on lighting which is 20 times more than
households in developed countries (produced using fossil or nuclear sources)3. African population is expected to double
by 2050 to over USD 2 bn. Most will still have no access to electricity and clean cooking fuels if energy access trends
continue unchanged.4 Energy access estimates commissioned by PIDA, the Program for Infrastructure Development in
Africa, indicate that only 37% of the eastern African and 25% of the southern African population had access to
electricity in 20105. According to the World Bank, electrification rates in Namibia are a relatively high 47.3%.
6
Graph 6: Electrification Levels for Selected African States
Source: REN21 2014
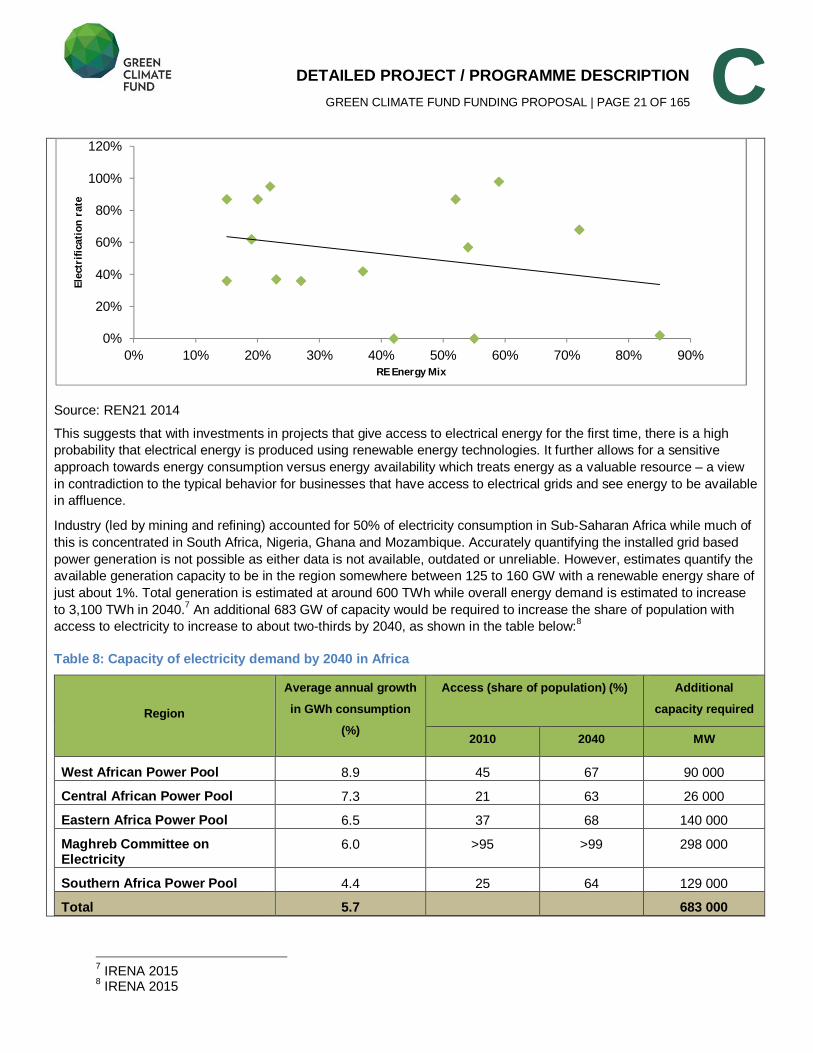
In addition, a negative correlation between a high electrification rate and the share of renewable energy mix producing
electrical energy to the grid exists.
Graph 7: Correlation of Electrification Rate with Renewable Energy Share in the Energy Mix
3 Africa Progress Panel 2015
4 IRENA, 2013a
5 SOFRECO, et al., (2011)
6 World Bank, Sustainable Energy for All (SE4ALL) database from World Bank, Global Electrification
database
0%10%20%30%40%50%60%70%80%90%
DETAILED PROJECT / PROGRAMME DESCRIPTION GREEN CLIMATE FUND FUNDING PROPOSAL | PAGE 21 OF 165
C
Source: REN21 2014
This suggests that with investments in projects that give access to electrical energy for the first time, there is a high
probability that electrical energy is produced using renewable energy technologies. It further allows for a sensitive
approach towards energy consumption versus energy availability which treats energy as a valuable resource – a view
in contradiction to the typical behavior for businesses that have access to electrical grids and see energy to be available
in affluence.
Industry (led by mining and refining) accounted for 50% of electricity consumption in Sub-Saharan Africa while much of
this is concentrated in South Africa, Nigeria, Ghana and Mozambique. Accurately quantifying the installed grid based
power generation is not possible as either data is not available, outdated or unreliable. However, estimates quantify the
available generation capacity to be in the region somewhere between 125 to 160 GW with a renewable energy share of
just about 1%. Total generation is estimated at around 600 TWh while overall energy demand is estimated to increase
to 3,100 TWh in 2040.7 An additional 683 GW of capacity would be required to increase the share of population with
access to electricity to increase to about two-thirds by 2040, as shown in the table below:8
Table 8: Capacity of electricity demand by 2040 in Africa
Region
Average annual growth
in GWh consumption
(%)
Access (share of population) (%) Additional
capacity required
2010 2040 MW
West African Power Pool 8.9 45 67 90 000
Central African Power Pool 7.3 21 63 26 000
Eastern Africa Power Pool 6.5 37 68 140 000
Maghreb Committee on Electricity
6.0 >95 >99 298 000
Southern Africa Power Pool 4.4 25 64 129 000
Total 5.7 683 000
7 IRENA 2015
8 IRENA 2015
0%
20%
40%
60%
80%
100%
120%
0% 10% 20% 30% 40% 50% 60% 70% 80% 90%
Elec
trifi
cati
onra
te
RE Energy Mix
DETAILED PROJECT / PROGRAMME DESCRIPTION GREEN CLIMATE FUND FUNDING PROPOSAL | PAGE 22 OF 165
C Source: Sofreco, et al. (2011)
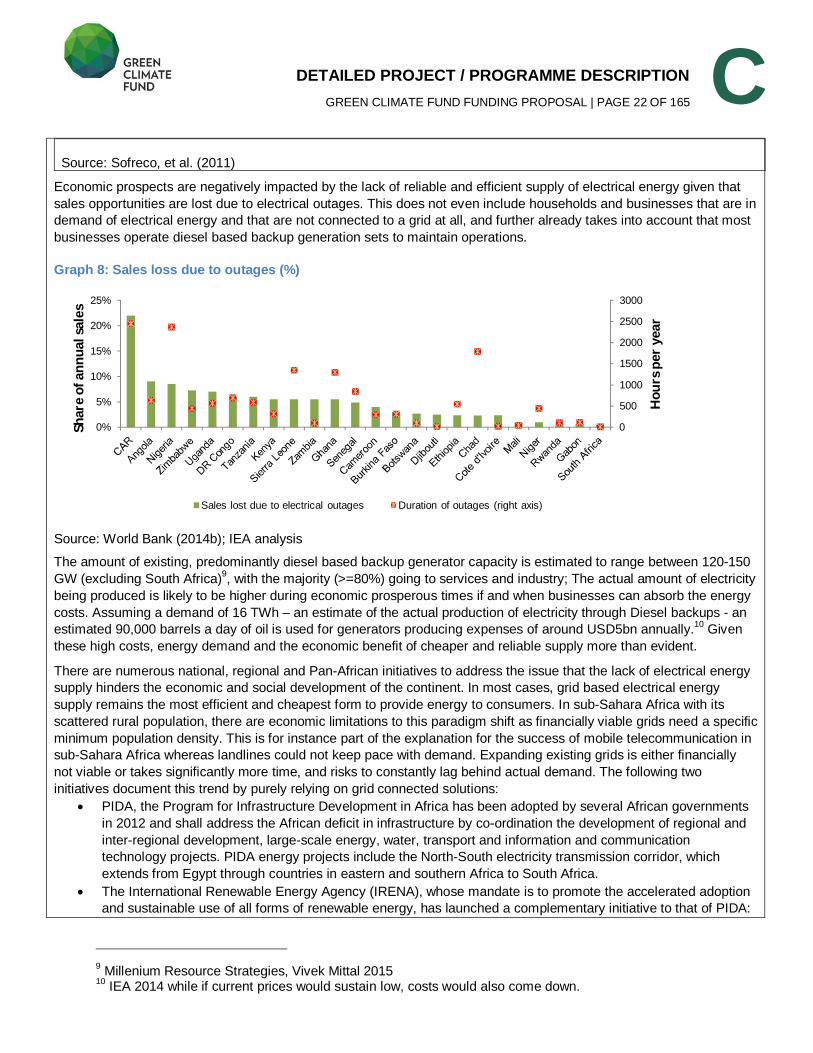
Economic prospects are negatively impacted by the lack of reliable and efficient supply of electrical energy given that
sales opportunities are lost due to electrical outages. This does not even include households and businesses that are in
demand of electrical energy and that are not connected to a grid at all, and further already takes into account that most
businesses operate diesel based backup generation sets to maintain operations.
Graph 8: Sales loss due to outages (%)
Source: World Bank (2014b); IEA analysis
The amount of existing, predominantly diesel based backup generator capacity is estimated to range between 120-150
GW (excluding South Africa)9, with the majority (>=80%) going to services and industry; The actual amount of electricity
being produced is likely to be higher during economic prosperous times if and when businesses can absorb the energy
costs. Assuming a demand of 16 TWh – an estimate of the actual production of electricity through Diesel backups - an
estimated 90,000 barrels a day of oil is used for generators producing expenses of around USD5bn annually.10
Given
these high costs, energy demand and the economic benefit of cheaper and reliable supply more than evident.
There are numerous national, regional and Pan-African initiatives to address the issue that the lack of electrical energy
supply hinders the economic and social development of the continent. In most cases, grid based electrical energy
supply remains the most efficient and cheapest form to provide energy to consumers. In sub-Sahara Africa with its
scattered rural population, there are economic limitations to this paradigm shift as financially viable grids need a specific
minimum population density. This is for instance part of the explanation for the success of mobile telecommunication in
sub-Sahara Africa whereas landlines could not keep pace with demand. Expanding existing grids is either financially
not viable or takes significantly more time, and risks to constantly lag behind actual demand. The following two
initiatives document this trend by purely relying on grid connected solutions:
PIDA, the Program for Infrastructure Development in Africa has been adopted by several African governments
in 2012 and shall address the African deficit in infrastructure by co-ordination the development of regional and
inter-regional development, large-scale energy, water, transport and information and communication
technology projects. PIDA energy projects include the North-South electricity transmission corridor, which
extends from Egypt through countries in eastern and southern Africa to South Africa.
The International Renewable Energy Agency (IRENA), whose mandate is to promote the accelerated adoption
and sustainable use of all forms of renewable energy, has launched a complementary initiative to that of PIDA:
9 Millenium Resource Strategies, Vivek Mittal 2015
10 IEA 2014 while if current prices would sustain low, costs would also come down.
0
500
1000
1500
2000
2500
3000
0%
5%
10%
15%
20%
25%
Hou
rspe
rye
ar
Shar
eof
annu
alsa
les
Sales lost due to electrical outages Duration of outages (right axis)
DETAILED PROJECT / PROGRAMME DESCRIPTION GREEN CLIMATE FUND FUNDING PROPOSAL | PAGE 23 OF 165
C Africa Clean Energy Corridor (ACEC). ACEC seeks to promote a regional approach to developing a greater
share of clean, indigenous, cost-effective renewable power in the energy mix.11
This would support African
economic development
PIDA, as an example, is based on present and projected electricity demand statistics that assume a 6% average annual
economic growth rate for Africa for 2010-40. It is estimated that this translates into electricity energy consumption
growth of 5.7% per year. Over the period to 2040, 950 million people are projected to gain access to electricity in sub-
Saharan Africa (SSA). Urban populations gain access via connections to the grid; in rural areas, mini-grid and off-grid
solutions, increasingly powered by renewable energies, will play a much larger role. Against a backdrop of strong
population growth, cumulative investment of more than USD200 bn is expected to lower the population without access
to energy by just 15% which still leaves 530 million people in the region, primarily in rural communities, without
electricity in 2040.12
DB estimates that around USD 20 bn was invested in renewable energy in the region between 2006 and 2014 (corresponding to roughly 1,800 MW of renewable energy installed capacity). Development finance institutions (DFIs), contributed more than a quarter of the total investment (USD 5 bn). Analysts expect the private sector needs to build up to a crucial role in the near future, growing the market significantly, up to USD 7 bn a year by 2016.
13
Positioning of UGEAP within the social and economic context Against this current situation, the UGEAP offers an instrument that aims to:
Enable access to electrical energy; and
Increase the share of renewable energy production in the national energy mix to meet the existing and growing
energy demand.
Research unanimously confirms that the capital expenditure required to meet the forecasted energy demand and the ambition to give access to electrical energy cannot be met with national funding sources by most of the SSA countries. Further, it becomes clear that the priority is to produce energy – which includes only a minor focus on shifting of the energy mix towards renewable energy.
Conclusion for UGEAP targeting the SSA region Based on our research, UGEAP fits well into the regional and national strategies, given its focus on the replacement of fossil fuels as energy carrier as well as targeting energy access programs while focusing on Sub-Saharan Africa.
In order to increase the likelihood for success, UGEAP will focus first on a selected number of countries within SSA (Phase 1). After having executed the first investments in these countries, the regional focus of UGEAP to invest will be expanded to countries selected based on:
demand;
regulatory feasibility; and
technical and business feasibility.
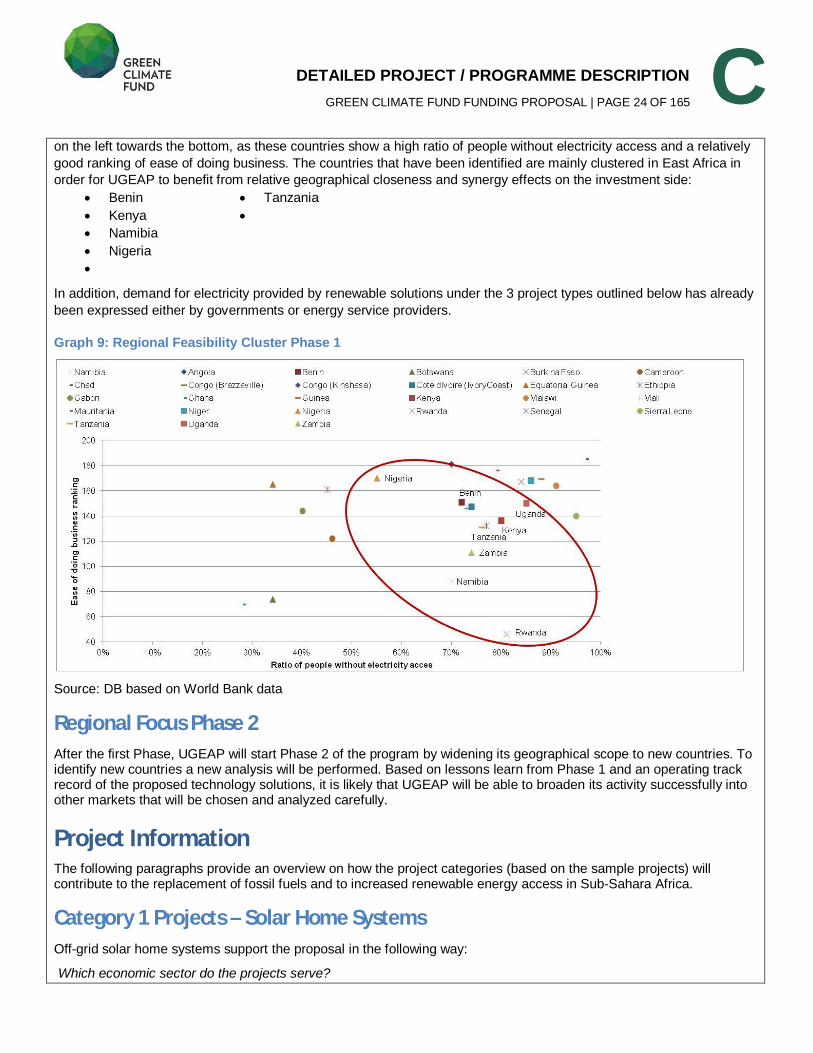
Regional Focus Phase 1 To underpin the choice of countries for Phase 1 beyond the actual pipeline and active demand by projects for debt
funding, an analysis of all countries in Sub-Sahara Africa (excluding South Africa and countries recommended to be
banned by OFAC) and their key economic as well as energy and climate related indicators has been performed. For
this, the ratio of people without electricity access has been put into correlation to the ease of doing business ranking by
the World Bank. A high ease of doing business ranking (1=best ranking) means the regulatory environment is more
conducive to the starting and operation of a local firm. Countries with a good investment case for UGEAP can be found
11
IRENA 2015 12
IEA 2014 13
“H2 2014 Sub-Saharan Africa Market Outlook”. Bloomberg New Energy Finance, London. July 2014.
DETAILED PROJECT / PROGRAMME DESCRIPTION GREEN CLIMATE FUND FUNDING PROPOSAL | PAGE 24 OF 165
C on the left towards the bottom, as these countries show a high ratio of people without electricity access and a relatively
good ranking of ease of doing business. The countries that have been identified are mainly clustered in East Africa in
order for UGEAP to benefit from relative geographical closeness and synergy effects on the investment side:
Benin
Kenya
Namibia
Nigeria
Tanzania
In addition, demand for electricity provided by renewable solutions under the 3 project types outlined below has already
been expressed either by governments or energy service providers.
Graph 9: Regional Feasibility Cluster Phase 1
Source: DB based on World Bank data
Regional Focus Phase 2 After the first Phase, UGEAP will start Phase 2 of the program by widening its geographical scope to new countries. To identify new countries a new analysis will be performed. Based on lessons learn from Phase 1 and an operating track record of the proposed technology solutions, it is likely that UGEAP will be able to broaden its activity successfully into other markets that will be chosen and analyzed carefully.
Project Information The following paragraphs provide an overview on how the project categories (based on the sample projects) will contribute to the replacement of fossil fuels and to increased renewable energy access in Sub-Sahara Africa.
Category 1 Projects – Solar Home Systems Off-grid solar home systems support the proposal in the following way:
Which economic sector do the projects serve?
DETAILED PROJECT / PROGRAMME DESCRIPTION GREEN CLIMATE FUND FUNDING PROPOSAL | PAGE 25 OF 165
C Off-grid solar electrification of households: creates electricity access for households, micro-enterprises, and
their communities, and thus enables socio-economic development and growth, substituting or complementing
other energy sources for low-income Sub-Saharan African households (like for instance charcoal for cooking
stoves).
Will be such projects part of a nationally organized strategy / policy? Such type of projects will be fully private sector projects that will contribute towards reaching the Target
Regions’s electricity access target.
Who are the end-beneficiaries of the projects’ outcome? Current focus: Sub-Saharan Africa rural households with relatively high energy expenses and no access to grid
electricity or other reliable and affordable electricity supply sources;
Off-grid population in Sub-Saharan Africa forecasted to grow from 600 million people in 2011 to 698 million in
203014
;
The majority of UGEAP’s phase 1 Target Region households are off-grid as by today;
First projects has started so far to electrify households but only on a small-scale compared to the potential
market sizes;
To ensure market acceptance different solar home system sizes are available to satisfy demand from different
household types:
1. small size Solar Home Systems (SHSs) (eg 80Wp) to fulfill the basic energy needs of those living close to the
poverty line;
2. medium size SHSs (eg 120 Wp) for the “middle” income segment of the poor population wanting to power
some basic additional appliances, like charging mobile phones or using a TV set;
3. large size SHSs (eg 200 Wp) for the population in the “higher” income segment of the lowest quintile of the
population, wishing to power heavier appliances such as a refridgerator;
Larger SHSs also have the ability to power micro and small business enterprises (MSME), enabling households
to strengthen their business activities or even to become entrepreneurs;
SHSs can grow with demand, upgrading from a smaller to a larger SHS, following social, economic and
environmental development.
What are the needs of final beneficiaries that are getting served? Electricity for lighting;
Electricity for phone charging;
Electricity for smaller appliances, including TVs and fans;
Electricity for larger appliances, like refrigerators or MSME machines;
Estimated electricity consumption of a typical rural household in Africa: far below 1 kWh per day as a baseline
but expected to grow over time.
What are the alternatives for final beneficiaries if such projects would either not exist or would not be preferred by them?
Households would otherwise use kerosene or candles for lighting, or pay a local entrepreneur to charge their
phone via a lead acid battery;
These costs can conservatively already range from USD 6-10/month without the possibility of using TVs, fans,
or other small home appliances;
Grid extension is expensive: estimates for Kenya indicate costs of USD 2,000/household15
and unlikely to be
implemented area-wide due to its economic limitations, i.e. it will not pay off;
Compared to these alternatives, even large size SHSs are cheaper with about USD 1,700 (including
14
AT Kearney/GOGLA: “Investment and Finance Study for Off-Grid Lighting”, June 2014 15
Information provided by Kenyan and Rwandan Ministries of Infrastructure. With growing grid access, these costs per household
are tending to grow because, first, ‘low-hanging fruits’ are given access before reaching a wider area.
DETAILED PROJECT / PROGRAMME DESCRIPTION GREEN CLIMATE FUND FUNDING PROPOSAL | PAGE 26 OF 165
C appliances) per household.
Sub-Saharan African Governments are working on several electrification projects in rural areas to increase
generation capacities, still supplying to only a minority of the national demand, mainly in urban areas.
Category 2 Projects – Green Mini Grids Green mini grid solutions support the proposal in the following way:
Which economic sector do the projects serve? Such type of projects serve rural electrification of remote off-grid villages in sub-Sahara Africa;
It implements off-grid solar power infrastructure in the form of mini-grids for households, micro-enterprises, and
their communities, and thus enables socio-economic development and growth, substituting or complementing
other energy sources for low-income sub-Saharan African households (like for instance charcoal for cooking
stoves).
Will be such projects part of a nationally organized strategy / policy? Such type of projects will be fully private sector projects that will contribute towards reaching the Target
Regions’ electricity access target;
Serving rural areas with alternative energy sources is in line with the Target Region’s policy strategies.
Who are the end-beneficiaries of the projects’ outcome? Off-grid households (especially rural) with relatively high energy expenses and no expected access to grid
electricity or no other existing reliable and affordable electricity supply source;
Basically, similar beneficiaries as off-grid solar home supply companies while mini-grid suppliers have a
stronger emphasis on the “Base of the Pyramid” (BoP) households with a daily income below USD 216
;
Off-grid, rural micro-enterprises such as village kiosks and agro-processors that are currently dependent on
diesel generation sets for electricity supply.
What are the needs of final beneficiaries that are getting served? Electricity for lighting;
Electricity for phone charging;
Electricity for small appliances including TVs and fans;
Electricity for micro-enterprise appliances, such as small fridges, sewing machines, and agro-processing;
Estimated electricity consumption of a typical rural household in Africa: far below 1 kWh per day as a baseline
but expected to grow over time.
What are the alternatives for final beneficiaries if such projects would either not exist or would not be preferred by them?
As regards households: see Category 1 Projects ;
Micro-enterprises would otherwise use a diesel generator to provide electricity to power small appliances. This
is costly for operators, a nuisance (as diesel generators must be stored indoors at night for security but run
outdoors during the day), and noisy for the community. Diesel is not always available and there is high price
volatility. Fuel and maintenance costs can conservatively range from USD 30-40/month.
Category 3 Projects – Green Industrial Energy Supply/ Selected On-Grid Projects Green industrial energy supply can be provided e.g. through rental solar power solutions that support the proposal in the following way:
Which economic sector do the projects serve?
16
People in the Bottom of the Pyramid live on less than 2 USD per day (as defined by Prahalad/Hart in 1998), i.e. more than 50% of the world‘s population.
DETAILED PROJECT / PROGRAMME DESCRIPTION GREEN CLIMATE FUND FUNDING PROPOSAL | PAGE 27 OF 165
C Rental solar power solutions to decentralized / rural business in remote locations;
Multipurpose solar-diesel hybrid farms, standalone high-output solar PV systems;
Providing cost-effective, convenient and clean rental solar farms to reduce fuel consumption of on-site diesel
generators;
Focusing on fast-growing, developing economies;
Target market: decentralized / rural businesses
Will be such projects part of a nationally organized strategy / policy? Such type of projects will be fully private sector projects;
However, serving rural areas with alternative energy sources is in line with the Target Region’s policy
strategies;
Providing reliable electricity supply to industries contributes towards achieving strong and competitive
economies
Who are the end-beneficiaries of the projects’ outcome? Off-grid SME industry operators in agro-processing, mining, wood processing and other sectors; even suitable
for on-grid businesses due to unreliable grid supply; lowering the cost of electricity generation frees up
resources that could be allocated towards increasing employment
Off-grid communities and their households as well as micro-enterprises that lack any form of electricity supply
or depend on a privately run diesel generator;
SHS providers redeploy-ability mitigates off-taker default risk as solar farms can be redeployed in case of end
of use or non-payment.
What are the needs of final beneficiaries that are getting served? In remote community customer segment: Such projects improve energy access by renting solar farms (with
generators and/or battery systems) to local partners who in turn provide first-time energy access to off-grid
communities, through hybrid mini-grids;
Reduce power costs and emissions for cost leaders;
Reduced price volatility and more robust/redundant energy supply chain will be also greatly valued benefits;
Partly replace unreliable, expensive and unhealthy fossil fuel-based power;
Rental solar farms hybridize existing diesel generators: reducing the diesel fuel consumption of the generators -
for every MWh of diesel power replaced, rental solar farms add to the reduction of carbon emissions;
Avoid up-front capital investment or long-term off-take obligations.
What are the alternatives for final beneficiaries if such type of projects would either not exist or would not be preferred by them?
Basically, SMEs face a poor electricity supply structure: The Target Region cannot keep up with growing
demand in power supply, a large base of non-environmentally friendly installed diesel generators are being
used as day-today or emergency solutions instead;
None of the existing power supply options are satisfactory: The Target Region’s electricity grids experience
frequent outages, alternative diesel power is expensive (although oil prices went down);
Solar: more cost effective than 100% diesel power or grid+diesel-backup “blended” power;
Rental solar farms: offer a kWh-cost below current costs while the solar farms integrate with existing diesel
generators to provide hybrid power, generating significant cost savings and CO2 mitigation;
Rental solar farms: well suited for deployment in developing countries due to their operational flexibility;
Redeploy-able rental solar farms: allow powering rural SMEs and residential users at attractive price levels, with
privately-financed, scalable business models, generating maximum CO2 mitigation.
C.2. Project / Program Objective against Baseline
DETAILED PROJECT / PROGRAMME DESCRIPTION GREEN CLIMATE FUND FUNDING PROPOSAL | PAGE 28 OF 165
C <Describe the baseline scenario (i.e. emissions baseline, climate vulnerability baseline, key barriers, challenges and/or policies) and the outcomes and the impact that the project/program will aim to achieve in improving the baseline scenario.>
Program Level Sub-Sahara Africa accounts for relatively small portion of CO2 emissions globally (0.6 gigatons (Gt)) which is expected
by the IEA to grow to 1.2Gt in 2040. This represents a share of 2-3% of global emissions. At the same time, the impact
of climate change on Africa is expected to be pronounced. Increase in temperatures is estimated to be higher for Africa
compared to other regions globally.17
The continent is already subject to weather extremes that will increase in weight
and frequency. Amongst those are droughts in some areas and extreme precipitation in others. In a scenario where sea
levels would actually rise, the coastal areas, that host large parts of population and where the majority of economic
activity is located, would be highly affected.
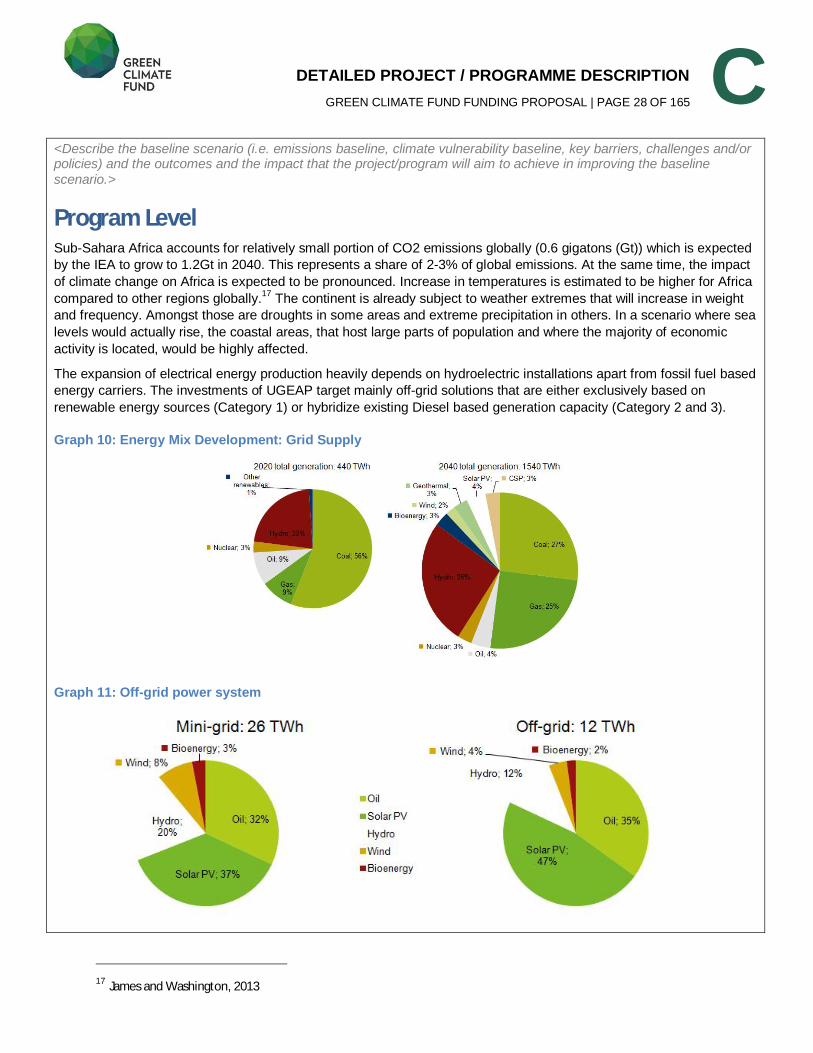
The expansion of electrical energy production heavily depends on hydroelectric installations apart from fossil fuel based
energy carriers. The investments of UGEAP target mainly off-grid solutions that are either exclusively based on
renewable energy sources (Category 1) or hybridize existing Diesel based generation capacity (Category 2 and 3).
Graph 10: Energy Mix Development: Grid Supply
Graph 11: Off-grid power system
17 James and Washington, 2013
DETAILED PROJECT / PROGRAMME DESCRIPTION GREEN CLIMATE FUND FUNDING PROPOSAL | PAGE 29 OF 165
C Source. IEA 2014
UGEAP targets a huge and largely untapped market of industrial off-grid diesel systems and areas that have no
electrical energy supply. UGEAP will serve the demand with long term debt capital that is required to match the
amortization horizons of the underlying assets.
The target of UGEAP is to mitigate lifetime CO2e emissions by more than 50m tCO2e (see below in section E for
further details) over the lifetime of the program by investing in renewable energy generation capacity and measured by
CO2e emissions saved and delivering towards the target to increase the share of renewable energies in the energy mix
of African economies.
Category 1 Projects – Solar Home Systems Projects’ baselines are outlined as follows:
Significant urban-rural gap: only a fraction of the total electrification reaches rural areas, while the vast majority
of the total population lives in these regions;
Based on market information households consume 0.2 liters of kerosene per day, yielding annual CO2e
emissions of 0.2t CO2e per household;
In the Target Regions rural households spend approx. 10-25% of income (USD 15/month) on energy –
excluding costs for mobile phone charging and travel expenses spent to buy fossil fuel; in comparison, off-grid
solar home system (SHS) users pay an average of USD 9-12/Wp equivalent to USD 21 per month, while after 3
years the SHS is paid off18
;
Rural households which depend on agriculture are highly affected by climate change;
Moreover: lack of electricity hinders children to study after dark, having negative impact on their education and
consequently their living standards;
Key barrier to overcome the barrier: lack of technical understanding of and experience in last mile electricity
distribution on the level of various stakeholders, e.g. policy makers;
Major barrier is access to funding.
Projects outcome/impact: SHS providers equip rural households that have different needs and willingness-to-pay (WTP) with suitable
SHSs, providing different sizes;
Many of them (up to 40%)19
utilize the SHS for income generation;
In doing this, SHS providers mitigate CO2e emission from kerosene lamps from every household it equips with
ensuring benefits for the end-users’ health;
SHS providers’ approach includes electrification of MSMEs;
SHS providers’ objective is to contribute to the paradigm shift to low-carbon technologies;
SHS providers’ major aim: provide reliable, sustainable and affordable solar energy technology to rural
households with funding from UGEAP;
A SHS provider’s offering has to be enabled by the following innovations: A comprehensive technological package, including the photovoltaic panel, the battery, the meter, the
standardized box kit to charge phones or connect electric appliances, the DC electric appliances themselves;
A comprehensive customer service with affordable monthly installments and a reasonable warranty after sales
service which can optionally be extended.
Category 2 Projects – Green Mini Grids
18
Based on market information 19
Market research
DETAILED PROJECT / PROGRAMME DESCRIPTION GREEN CLIMATE FUND FUNDING PROPOSAL | PAGE 30 OF 165
C Mini grid solution (MGS) providers’ baseline is outlined as follows:
Off-grid households consume 0.2 liters of kerosene per day, yielding annual CO2e emissions of 0.2T CO2e per
household;
Micro-enterprises consume 2 liters of diesel per day, yielding annual CO2e emissions of 1.44T CO2e per
micro-enterprise;
Main barrier: no readily available, accessible, and affordable low carbon energy alternatives to traditional fuels;
Projects’ outcome/impact: The projects displaces the use of fossil fuels through the provision of PV-based electricity services;
MGS providers’ approach includes electrification of MSMEs;
In doing this, MSG providers’ mitigate CO2e emission from fossil fuel from every household and MSME it
connect to its mini-grids;
Climate vulnerability is greatly reduced as access to electricity increases. Access to modern electricity services
improves incomes, access to information that can increase climate resilience (such as weather reports and
improved agricultural practices), and communications.
MSG providers’ offering requires the following innovations: A sophisticated though adjusted network design, tailor made to rural Sub-Saharan African conditions with
remote monitoring and metering,;
A comprehensive customer service at affordable rates and a contract lifetime service.
Category 3 Projects - Green Industrial Energy Supply/ Selected On-Grid Projects Rental solar power solution (RSPS) providers’ baselines are outlined as follows:
A RSPS provider’s baseline is either off-grid production of electricity on-site with diesel generator; e.g.
communities or industry sites (e.g. mines, timber saw mills, quarries and other companies in the extractive or
raw materials industry), or on-grid but with power shortages; production of electricity on-site with diesel
generator as back-up-system during power shortages (e.g. communities or industry sites);
Three barriers impeded fast scaling up of solar power in the African SME segment:
o Solar up-front costs are too high for local SME to shoulder themselves;
o Pre-financed “energy-sales” offers, based on power-purchase-agreements, require long, 20+-year off-take
agreements with investment-grade entities. SME’s, by definition, do not qualify investment-grade entities and
almost never have a 20-year decision horizon, and
o while solar can scale down to <1MW technically, small projects are difficult to be profitable due to large
project-level costs (permitting, engineering, financing) involved.
A RSPS providers’ project outcome/impact: RSPS provider’s approach overcoming these barriers: offering SMEs a standard, modular, and re-deployable
solar farm on a flexible, pre-financed rental basis, hence enabling customers, solid, but non-investment-grade
businesses, to benefit from solar cost savings without upfront investment and without the need for long-term
off-take agreements.
Table 9: Overview of Barriers and Solutions for Category 3
Baseline barriers which impede the application of solar opportunities
A RSPS provider’s solution to overcome the barriers and to support the objectives of the project
Up-front costs for buying a solar farm too high Lack of up front investments allows RSPS provider to reach
smaller, capital constrained SMEs and/or frees up customer
capital to invest in their growth.
Too few users with required credit quality / user cannot Business model integrates the technical solution AND the
DETAILED PROJECT / PROGRAMME DESCRIPTION GREEN CLIMATE FUND FUNDING PROPOSAL | PAGE 31 OF 165
C apply for loans, funds, etc. financial model, mitigating off-taker risk, so that rural SMEs
can also be served using scalable, market-based sources
of finance.
Too few users with 20+ year power demand which limits
the installation of a solar farm on a 20+ yr contract (to
avoid up-front costs)
Rental duration is matching with user’s power needs,
because, through redeployment, solar farms can be used at
changing customer sites if needed.
Cost per kWh of solar plus batteries (to manage solar
intermittency)too high
Storage-free solar-diesel hybrid solution does not require
power storage, and is therefore the lowest cost power
source for remote areas.
Solar based option does not save costs RSPS provider has to offers customers immediate cost
savings due to innovative technical, risk-mitigation and
financing model, which is suited to renting equipment to
frontier market SME’s.
"Clean & Green" business model with financial and
environmental win-win.
No subsidies needed.
Need for stable “on-site” grid Equipment need to include simple and easy software
for grid management.
Innovative developments such as skycams for cloud
detection together with professional software ensures a
stable on-site grid.
No complex grid management
24-7 availability Full-service installation and operation.
No trained staff for installation, operation and
maintenance available
Training concept for local technicians has to be in place.
Source: Market information
An RSPS provider example offer should include: Customer benefit by obtaining a lower cost, more reliable, convenient power service, at zero up-front cost,
when and where they want it
The climate benefits from significantly reducing CO2e and other harmful emissions
RSPS providers offer investors a risk-mitigated, sustainable way to invest in frontier markets’ economic growth
at attractive market-based rates
Rural communities benefit from enhance local employment and wealth creation, because unavailable,
expensive and/or unreliable power is the primary constraint on economic growth.
RSPS providers’ objectives are: To be sustainable by reducing CO2e and other emissions;
To be enabling: enables communities with no electricity supply to install their first grid which then is green from
the start;
To be cost-effective: Immediate cost savings and independence from subsidies;
To be Clean & Green by creating environmental and financial win-win plus customer satisfaction;
To reduce vulnerability of communities in remote areas or on islands towards climate change by unfolding a
low-carbon development path.
C.3. Project / Program Description <Describe the main activities and the planned measures of the project/program according to each of its components.>
DETAILED PROJECT / PROGRAMME DESCRIPTION GREEN CLIMATE FUND FUNDING PROPOSAL | PAGE 32 OF 165
C Program Level UGEAP’s objective is to contribute to universal access to electricity in Sub-Saharan Africa by scaling up investments in
renewable energy from local financial markets and the international private sector.
For this purpose, UGEAP mobilizes capital for local financial institutions to the benefit of End Beneficiaries in the Target
Region. This is achieved by providing debt capital to the Target Investments. As End Beneficiaries of each Category
have different financial ability and need profiles, DB has developed two instruments UGEAP can use in parallel to serve
the different sectors with a instruments that matches demand:
A Funding and Risk Participation Agreement structure (FRPA); and
Syndicated Loans (SL).
The structure is based on the following two financial elements local financial institutions require in order to serve the
sector on a larger scale than current status quo allows:
Long term debt
Risk taking capacity
Target Investments within the three project Categories, however, require different approaches how the long term debt
and the risk taking capacity actually is made available to the End Beneficiaries. This is as both “assets” need to come in
the right form to match how local financial institutions serve the businesses that serve the End Beneficiaries. The
differences are shown in the next table, while UGEAP will pursue two solutions: FRPA and the SL structures.
Table 10: Solutions of UGEAP to reach the Target Investments
Investment Category 1&2
(i.e. Project 1 and Project 2)
Investment Category 3
(i.e. Project 3)
Solve capital supply: long term capital to be provided to
local FIs.
Strengthen the access for local FIs outside their own
balance sheet by providing capital along with local FI.
Risk take-over to support local financial institutions to
serve regions, businesses and sectors it so far does not
cover.
Risk participation in parallel with local FI.
Funding and Risk Participation Agreement Structure
Syndication Structure
Source: Deutsche Bank
The need for two the different approaches are caused by the nature of the underlying businesses that are described
further in the following two sections.
Ad 1) Funding and Risk Participation Structure: This instrument has been developed to deliver toward the End Beneficiaries of Category 1 and 2 investments and to
serve the following business concepts:
End beneficiaries are local households as well as micro, small and medium sized businesses (MSME) that are
in need for light, heat (cooking), cooling (fridges) as well as electrical energy for mobile phones, IT equipment
or other equipment (i.e. sewing machines).
Households either
(i) Purchase energy kits (i.e. solar home systems with a typical capacity of 80 – 200MWp) that deliver electrical
energy under purchase contracts that require regular (weekly, monthly) installments or pre-payments over a
lifetime of up to 3-5 years after which the energy kit is legally owned by the household; or
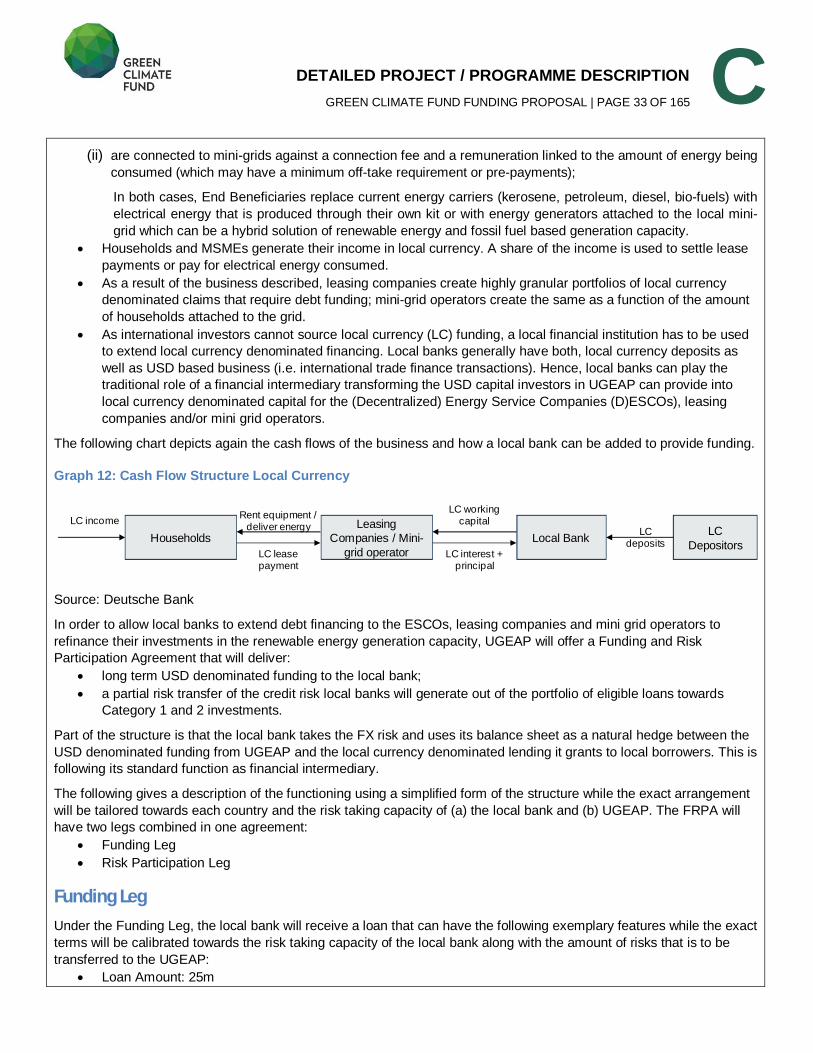
DETAILED PROJECT / PROGRAMME DESCRIPTION GREEN CLIMATE FUND FUNDING PROPOSAL | PAGE 33 OF 165
C (ii) are connected to mini-grids against a connection fee and a remuneration linked to the amount of energy being
consumed (which may have a minimum off-take requirement or pre-payments);
In both cases, End Beneficiaries replace current energy carriers (kerosene, petroleum, diesel, bio-fuels) with
electrical energy that is produced through their own kit or with energy generators attached to the local mini-
grid which can be a hybrid solution of renewable energy and fossil fuel based generation capacity.
Households and MSMEs generate their income in local currency. A share of the income is used to settle lease
payments or pay for electrical energy consumed.
As a result of the business described, leasing companies create highly granular portfolios of local currency
denominated claims that require debt funding; mini-grid operators create the same as a function of the amount
of households attached to the grid.
As international investors cannot source local currency (LC) funding, a local financial institution has to be used
to extend local currency denominated financing. Local banks generally have both, local currency deposits as
well as USD based business (i.e. international trade finance transactions). Hence, local banks can play the
traditional role of a financial intermediary transforming the USD capital investors in UGEAP can provide into
local currency denominated capital for the (Decentralized) Energy Service Companies (D)ESCOs), leasing
companies and/or mini grid operators.
The following chart depicts again the cash flows of the business and how a local bank can be added to provide funding.
Graph 12: Cash Flow Structure Local Currency
Source: Deutsche Bank
In order to allow local banks to extend debt financing to the ESCOs, leasing companies and mini grid operators to
refinance their investments in the renewable energy generation capacity, UGEAP will offer a Funding and Risk
Participation Agreement that will deliver:
long term USD denominated funding to the local bank;
a partial risk transfer of the credit risk local banks will generate out of the portfolio of eligible loans towards
Category 1 and 2 investments.
Part of the structure is that the local bank takes the FX risk and uses its balance sheet as a natural hedge between the
USD denominated funding from UGEAP and the local currency denominated lending it grants to local borrowers. This is
following its standard function as financial intermediary.
The following gives a description of the functioning using a simplified form of the structure while the exact arrangement
will be tailored towards each country and the risk taking capacity of (a) the local bank and (b) UGEAP. The FRPA will
have two legs combined in one agreement:
Funding Leg
Risk Participation Leg
Funding Leg Under the Funding Leg, the local bank will receive a loan that can have the following exemplary features while the exact
terms will be calibrated towards the risk taking capacity of the local bank along with the amount of risks that is to be
transferred to the UGEAP:
Loan Amount: 25m
Households
Leasing
Companies / Mini-
grid operator
Local Bank
LC incomeRent equipment /
deliver energy
LC lease payment
LC working capital
LC interest + principal
LC
Depositors
LC deposits
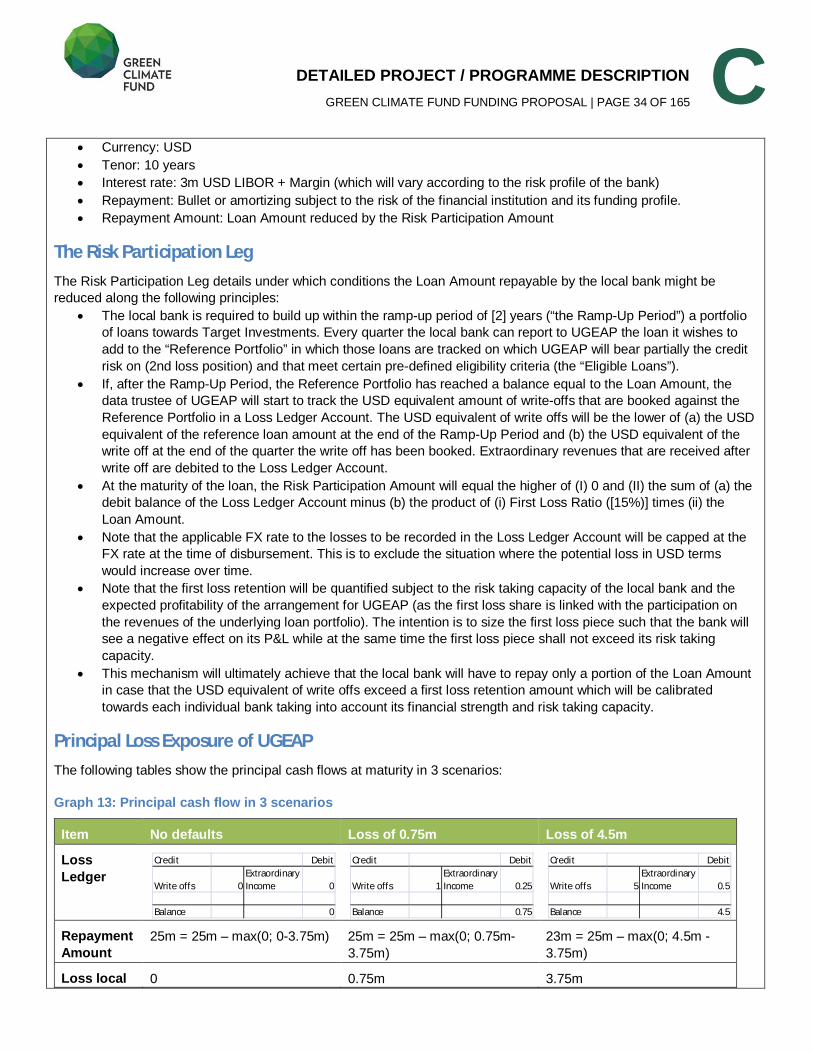
DETAILED PROJECT / PROGRAMME DESCRIPTION GREEN CLIMATE FUND FUNDING PROPOSAL | PAGE 34 OF 165
C Currency: USD
Tenor: 10 years
Interest rate: 3m USD LIBOR + Margin (which will vary according to the risk profile of the bank)
Repayment: Bullet or amortizing subject to the risk of the financial institution and its funding profile.
Repayment Amount: Loan Amount reduced by the Risk Participation Amount
The Risk Participation Leg The Risk Participation Leg details under which conditions the Loan Amount repayable by the local bank might be
reduced along the following principles:
The local bank is required to build up within the ramp-up period of [2] years (“the Ramp-Up Period”) a portfolio
of loans towards Target Investments. Every quarter the local bank can report to UGEAP the loan it wishes to
add to the “Reference Portfolio” in which those loans are tracked on which UGEAP will bear partially the credit
risk on (2nd loss position) and that meet certain pre-defined eligibility criteria (the “Eligible Loans”).
If, after the Ramp-Up Period, the Reference Portfolio has reached a balance equal to the Loan Amount, the
data trustee of UGEAP will start to track the USD equivalent amount of write-offs that are booked against the
Reference Portfolio in a Loss Ledger Account. The USD equivalent of write offs will be the lower of (a) the USD
equivalent of the reference loan amount at the end of the Ramp-Up Period and (b) the USD equivalent of the
write off at the end of the quarter the write off has been booked. Extraordinary revenues that are received after
write off are debited to the Loss Ledger Account.
At the maturity of the loan, the Risk Participation Amount will equal the higher of (I) 0 and (II) the sum of (a) the
debit balance of the Loss Ledger Account minus (b) the product of (i) First Loss Ratio ([15%)] times (ii) the
Loan Amount.
Note that the applicable FX rate to the losses to be recorded in the Loss Ledger Account will be capped at the
FX rate at the time of disbursement. This is to exclude the situation where the potential loss in USD terms
would increase over time.
Note that the first loss retention will be quantified subject to the risk taking capacity of the local bank and the
expected profitability of the arrangement for UGEAP (as the first loss share is linked with the participation on
the revenues of the underlying loan portfolio). The intention is to size the first loss piece such that the bank will
see a negative effect on its P&L while at the same time the first loss piece shall not exceed its risk taking
capacity.
This mechanism will ultimately achieve that the local bank will have to repay only a portion of the Loan Amount
in case that the USD equivalent of write offs exceed a first loss retention amount which will be calibrated
towards each individual bank taking into account its financial strength and risk taking capacity.
Principal Loss Exposure of UGEAP The following tables show the principal cash flows at maturity in 3 scenarios:
Graph 13: Principal cash flow in 3 scenarios
Item No defaults Loss of 0.75m Loss of 4.5m
Loss Ledger
Repayment Amount
25m = 25m – max(0; 0-3.75m) 25m = 25m – max(0; 0.75m-
3.75m)
23m = 25m – max(0; 4.5m -
3.75m)
Loss local 0 0.75m 3.75m
Credit Debit
Write offs 0Extraordinary Income 0
Balance 0
Credit Debit
Write offs 1Extraordinary Income 0.25
Balance 0.75
Credit Debit
Write offs 5Extraordinary Income 0.5
Balance 4.5
DETAILED PROJECT / PROGRAMME DESCRIPTION GREEN CLIMATE FUND FUNDING PROPOSAL | PAGE 35 OF 165
C bank
UGEAP loss
0 0 0.75m
Source: Deutsche Bank
Quantification of First Loss Coverage The amount of first loss retention that will be requested by UGEAP will be tailored towards:
- the local market;
- the operational financial capacity of the bank;
- the risk assessment by DB on the underlying transactions;
- the key origination channels and selection criteria;
- the regulatory framework the bank is working within;
- the requirement that the local bank will have significant and sufficient risk retention to align interest of UGEAP
with those of the local bank.
While the above examples make use of 15% first loss borne by the local bank to illustrate the functioning, UGEAP
expects to work with different risk participation levels by local banks along the principles laid out below. It should be
noted that UGEAP shall act as enabling investor. Hence the balance between prudent risk acceptance and mission
orientated target achievements is assessed on a case-by-case basis and after careful analysis of the credit risks
embedded in the portfolio expected to become part of the risk sharing mechanism.
The assessment of the appropriate first loss retention by the local partner bank will be conducted by DB as investment
manager based on its in-depth knowledge of and track record of working with local banks in Africa through the following
channels:
As part of its investment management mandate for the existing public-private partnership funds DB manages in
Africa, including the Africa Agriculture and Trade Investment Fund20
and the Global Climate Partnership Fund21
,
DB has invested in local banks in Africa;
DB entertains trade finance operations with over 250 banks in 31 African countries through its Trade Finance
Financial Institutions (TFFI) team which has long standing relationships with all major banks throughout Africa
and offers to their correspondent banks trade finance solutions such as Letters of Credit, trade-related
guarantees, emanating from banks as well as financing products. This in-depth banking sector knowledge of
the DB platform will be leveraged for UGEAP as well;
DB’s Africa banking teams cover the African financial markets including African banks through teams based in
Egypt, Lagos, Johannesburg, Mauritius and Dubai; the UGEAP investment management team has a track
record of collaborating closely with these teams, thus having first hand access to their knowledge;
DB’s investment management team for UGEAP is led by a director with long-standing experience in analyzing
and rating banks and microfinance institutions, including in Africa. The team has conducted in-depth
discussions with initial partner banks for UGEAP which have already been identified and continues the analysis
for additional partner banks.
To avoid any ‘free riding’ by local banks and ensure that they apply prudent credit and lending practices, UGEAP will
set the first loss share based on the following principles cumulatively:
1) The amount of regulatory capital the bank has to maintain against the loans to be extended shall not reduce as a
result of entering on into the FRPA structure. This generally will lead to a first loss piece to be as high as the current
equity capitalization of the local FI. Generally, banking regulation requires for first loss positions that are retained by
a regulated financial institution a 1:1 coverage of the first loss retention with regulatory capital. That means, if a
20 www.aatif.lu
21 GCPF was managed by DB until September 2014
DETAILED PROJECT / PROGRAMME DESCRIPTION GREEN CLIMATE FUND FUNDING PROPOSAL | PAGE 36 OF 165
C bank had to hold against a portfolio of loans a given amount of capital, after entering into the risk sharing with
UGEAP the amount of equity to be maintained shall not reduce. 2) If the portfolio of underlying assets will be granular, historical data may be used to assess the potential credit quality
of the portfolio in the future while stresses would be applied to historical delinquency, default as well as losses to
model the lifetime credit risk of the portfolio in a downturn scenario. Stresses will depend on the expected volatility
of the economy and the underlying business. 3) If the portfolio is of low granularity (i.e. portfolios of up to 10 assets), the first loss will be calibrated based on the
credit quality of the single transactions that shall become part of the reference portfolio.
Based on the above principles, if UGEAP were to serve average banks in its target markets, the first loss piece would
be different if banks are served for example in Namibia, where current regulatory capital of banks stands at 15%,
compared to Zambia where the capitalization exceeds 25%.
In addition, general credit analysis will be performed on the risk management practice of the bank. Generally, the
investment manager expects that the bank provisions 100% of the expected loss of its impaired loans while at the
same time the investment manager expects that the bank has remained profitable. This requirement in combination
with the link to regulatory equity generally provides a significant buffer of first loss compared to the expected losses of
the underlying loans UGEAP shall share the credit risk with. In a market average standard case, the first loss buffer
would generally provide protection against an increase of 5 times of expected losses before UGEAP’s risk position
would be reached. It should be noted, however, that risk assessments are orientated towards future developments and
hence are subject to uncertainty.
Revenues for UGEAP UGEAP will have the following sources of revenues:
3m USD LIBOR + Margin on the Loan Amount as compensation for providing funding to the local bank;
The local bank will be required to transfer the USD equivalent of a certain fraction of the interest collections of
all loans that are part of the Reference Portfolio after having deducted a loan administration fee while the
fraction will be calibrated towards the risk amount that UGEAP will take and the profitability of the underlying
loans;
The amount of UGEAP’s participation on the interest income of the underlying portfolio will depend on the amount of
the first loss the local bank will retain. The higher the percentage of first loss the local bank takes, the lower the return
participation will be by UGEAP. While the first loss risk portion will be calibrated towards the risk taking capacity of the
local bank and the country’s peculiarities, the most important element for determining the interest transfer is the risk
acceptance by UGEAP. Note that UGEAP will have to approve each single exposure on which UGEAP will participate
in the risk which will also be based on an assessment on the profitability of the underlying loans.
Under this structure, UGEAP will have revenues that are entirely based on the price for USD capital in the market and
interest income that is subject to fluctuations of the local currency versus USD.
Ad 2) Syndicated Loans The major difference between businesses that will benefit from the FRPA structure is that businesses typically falling
into the 3rd
project Category typically require:
Larger amounts of long term debt capital which single investors generally are not able to provide;
Can and would want to take USD denominated debt on board rather than local currency as their products are
oftentimes traded in international markets and hence the business has USD / hard currency income.
Businesses in this sector are oftentimes active in food processing, tourism, telecommunication, construction or raw
material sourcing and export, the latter being the largest industry segment African economies rely on to generate
foreign currency income through international trade. These companies are receptive towards energy-supply concepts.
At this stage, businesses are either grid-connected and operate their own Diesel based backup facilities to bridge the
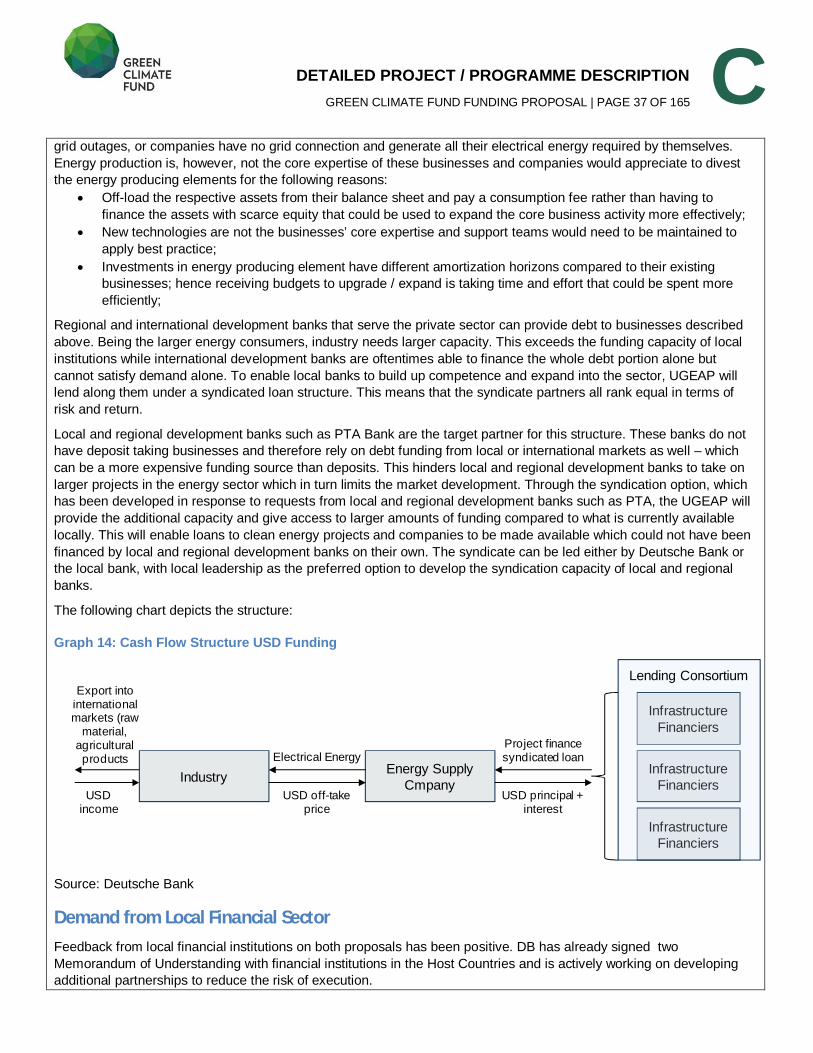
DETAILED PROJECT / PROGRAMME DESCRIPTION GREEN CLIMATE FUND FUNDING PROPOSAL | PAGE 37 OF 165
C grid outages, or companies have no grid connection and generate all their electrical energy required by themselves.
Energy production is, however, not the core expertise of these businesses and companies would appreciate to divest
the energy producing elements for the following reasons:
Off-load the respective assets from their balance sheet and pay a consumption fee rather than having to
finance the assets with scarce equity that could be used to expand the core business activity more effectively;
New technologies are not the businesses’ core expertise and support teams would need to be maintained to
apply best practice;
Investments in energy producing element have different amortization horizons compared to their existing
businesses; hence receiving budgets to upgrade / expand is taking time and effort that could be spent more
efficiently;
Regional and international development banks that serve the private sector can provide debt to businesses described
above. Being the larger energy consumers, industry needs larger capacity. This exceeds the funding capacity of local
institutions while international development banks are oftentimes able to finance the whole debt portion alone but
cannot satisfy demand alone. To enable local banks to build up competence and expand into the sector, UGEAP will
lend along them under a syndicated loan structure. This means that the syndicate partners all rank equal in terms of
risk and return.
Local and regional development banks such as PTA Bank are the target partner for this structure. These banks do not
have deposit taking businesses and therefore rely on debt funding from local or international markets as well – which
can be a more expensive funding source than deposits. This hinders local and regional development banks to take on
larger projects in the energy sector which in turn limits the market development. Through the syndication option, which
has been developed in response to requests from local and regional development banks such as PTA, the UGEAP will
provide the additional capacity and give access to larger amounts of funding compared to what is currently available
locally. This will enable loans to clean energy projects and companies to be made available which could not have been
financed by local and regional development banks on their own. The syndicate can be led either by Deutsche Bank or
the local bank, with local leadership as the preferred option to develop the syndication capacity of local and regional
banks.
The following chart depicts the structure:
Graph 14: Cash Flow Structure USD Funding
Source: Deutsche Bank
Demand from Local Financial Sector Feedback from local financial institutions on both proposals has been positive. DB has already signed two
Memorandum of Understanding with financial institutions in the Host Countries and is actively working on developing
additional partnerships to reduce the risk of execution.
IndustryEnergy Supply
Cmpany
Infrastructure
Financiers
Export into international markets (raw
material, agricultural products Electrical Energy
USD off-take price
Project finance syndicated loan
USD principal + interest
USD income
Infrastructure
Financiers
Infrastructure
Financiers
Lending Consortium
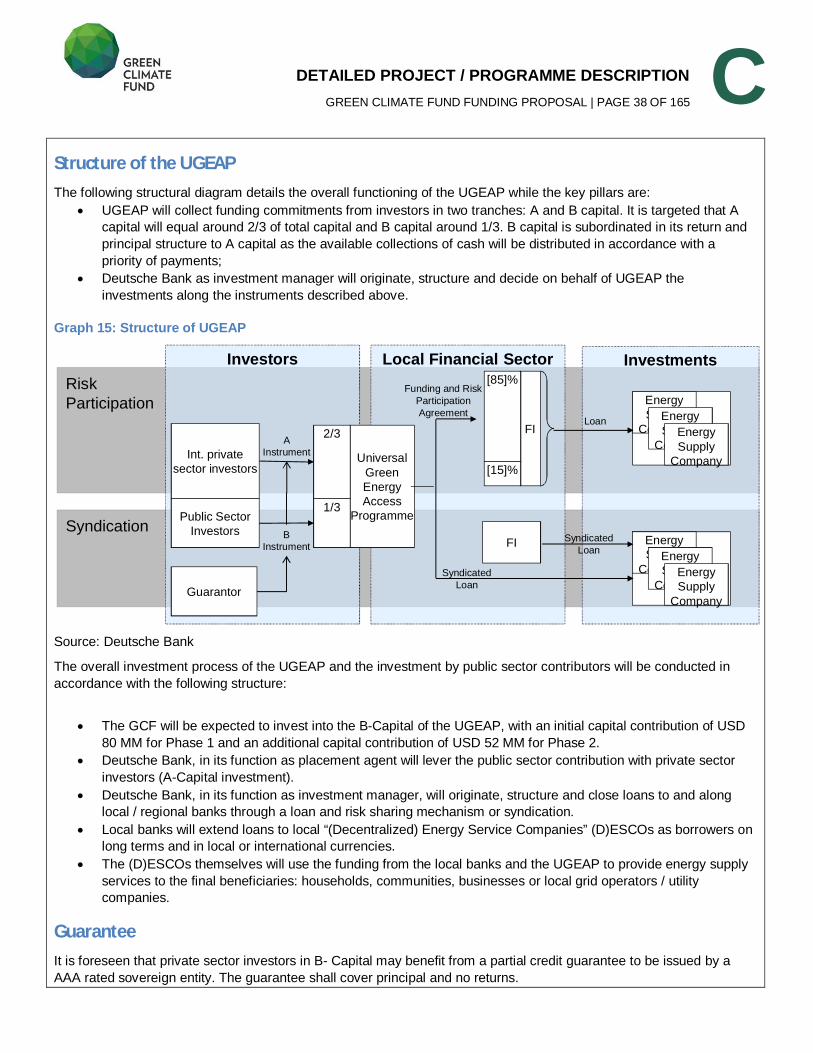
DETAILED PROJECT / PROGRAMME DESCRIPTION GREEN CLIMATE FUND FUNDING PROPOSAL | PAGE 38 OF 165
C Structure of the UGEAP The following structural diagram details the overall functioning of the UGEAP while the key pillars are:
UGEAP will collect funding commitments from investors in two tranches: A and B capital. It is targeted that A
capital will equal around 2/3 of total capital and B capital around 1/3. B capital is subordinated in its return and
principal structure to A capital as the available collections of cash will be distributed in accordance with a
priority of payments;
Deutsche Bank as investment manager will originate, structure and decide on behalf of UGEAP the
investments along the instruments described above.
Graph 15: Structure of UGEAP
Source: Deutsche Bank
The overall investment process of the UGEAP and the investment by public sector contributors will be conducted in
accordance with the following structure:
The GCF will be expected to invest into the B-Capital of the UGEAP, with an initial capital contribution of USD
80 MM for Phase 1 and an additional capital contribution of USD 52 MM for Phase 2.
Deutsche Bank, in its function as placement agent will lever the public sector contribution with private sector
investors (A-Capital investment).
Deutsche Bank, in its function as investment manager, will originate, structure and close loans to and along
local / regional banks through a loan and risk sharing mechanism or syndication.
Local banks will extend loans to local “(Decentralized) Energy Service Companies” (D)ESCOs as borrowers on
long terms and in local or international currencies.
The (D)ESCOs themselves will use the funding from the local banks and the UGEAP to provide energy supply
services to the final beneficiaries: households, communities, businesses or local grid operators / utility
companies.
Guarantee It is foreseen that private sector investors in B- Capital may benefit from a partial credit guarantee to be issued by a
AAA rated sovereign entity. The guarantee shall cover principal and no returns.
Risk
Participation
Syndication
Investors Local Financial Sector Investments
Energy
Supply
CompanyEnergy
Supply
CompanyEnergy
Supply
Company
Universal
Green
Energy
Access
Programme
Energy
Supply
CompanyEnergy
Supply
CompanyEnergy
Supply
Company
2/3
1/3Public Sector
Investors
Int. private
sector investors
FI
[85]%
[15]%
FI Syndicated
Loan
Loan
Funding and Risk
Participation
Agreement
Syndicated
Loan
A
Instrument
B
Instrument
Guarantor
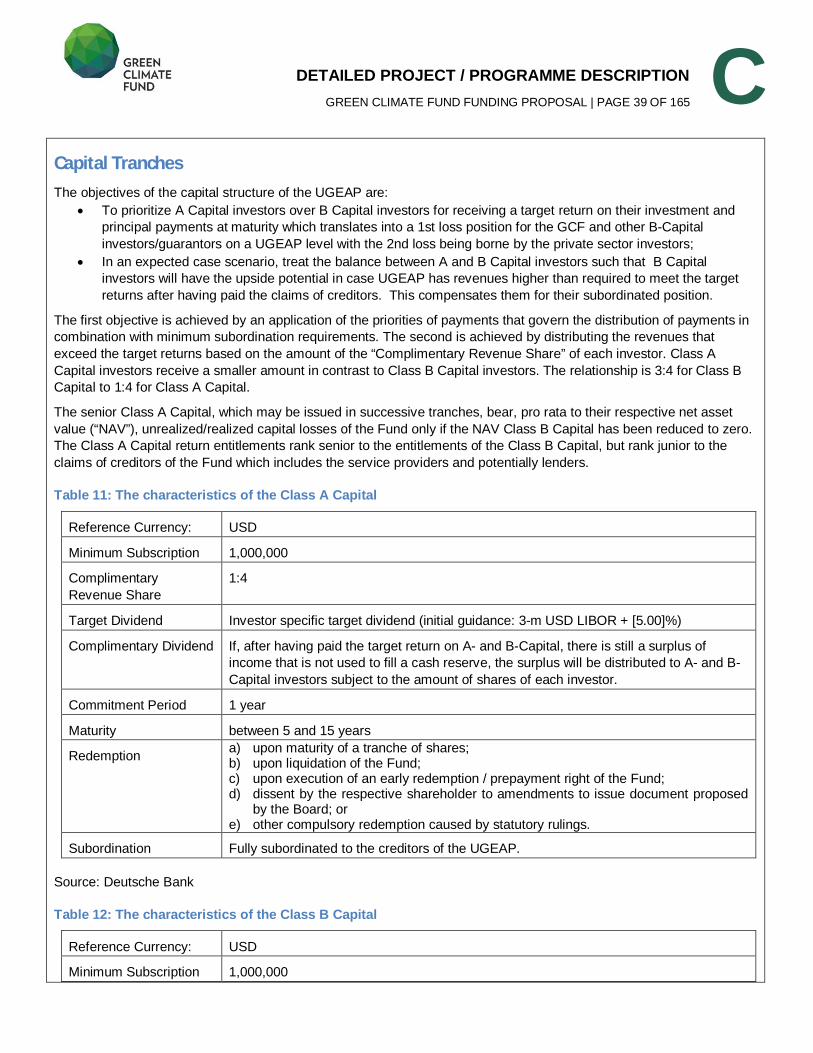
DETAILED PROJECT / PROGRAMME DESCRIPTION GREEN CLIMATE FUND FUNDING PROPOSAL | PAGE 39 OF 165
C Capital Tranches The objectives of the capital structure of the UGEAP are:
To prioritize A Capital investors over B Capital investors for receiving a target return on their investment and
principal payments at maturity which translates into a 1st loss position for the GCF and other B-Capital
investors/guarantors on a UGEAP level with the 2nd loss being borne by the private sector investors;
In an expected case scenario, treat the balance between A and B Capital investors such that B Capital
investors will have the upside potential in case UGEAP has revenues higher than required to meet the target
returns after having paid the claims of creditors. This compensates them for their subordinated position.
The first objective is achieved by an application of the priorities of payments that govern the distribution of payments in
combination with minimum subordination requirements. The second is achieved by distributing the revenues that
exceed the target returns based on the amount of the “Complimentary Revenue Share” of each investor. Class A
Capital investors receive a smaller amount in contrast to Class B Capital investors. The relationship is 3:4 for Class B
Capital to 1:4 for Class A Capital.
The senior Class A Capital, which may be issued in successive tranches, bear, pro rata to their respective net asset
value (“NAV”), unrealized/realized capital losses of the Fund only if the NAV Class B Capital has been reduced to zero.
The Class A Capital return entitlements rank senior to the entitlements of the Class B Capital, but rank junior to the
claims of creditors of the Fund which includes the service providers and potentially lenders.
Table 11: The characteristics of the Class A Capital
Reference Currency: USD
Minimum Subscription 1,000,000
Complimentary
Revenue Share
1:4
Target Dividend Investor specific target dividend (initial guidance: 3-m USD LIBOR + [5.00]%)
Complimentary Dividend If, after having paid the target return on A- and B-Capital, there is still a surplus of
income that is not used to fill a cash reserve, the surplus will be distributed to A- and B-
Capital investors subject to the amount of shares of each investor.
Commitment Period 1 year
Maturity between 5 and 15 years
Redemption a) upon maturity of a tranche of shares; b) upon liquidation of the Fund; c) upon execution of an early redemption / prepayment right of the Fund; d) dissent by the respective shareholder to amendments to issue document proposed
by the Board; or e) other compulsory redemption caused by statutory rulings.
Subordination Fully subordinated to the creditors of the UGEAP.
Source: Deutsche Bank
Table 12: The characteristics of the Class B Capital
Reference Currency: USD
Minimum Subscription 1,000,000
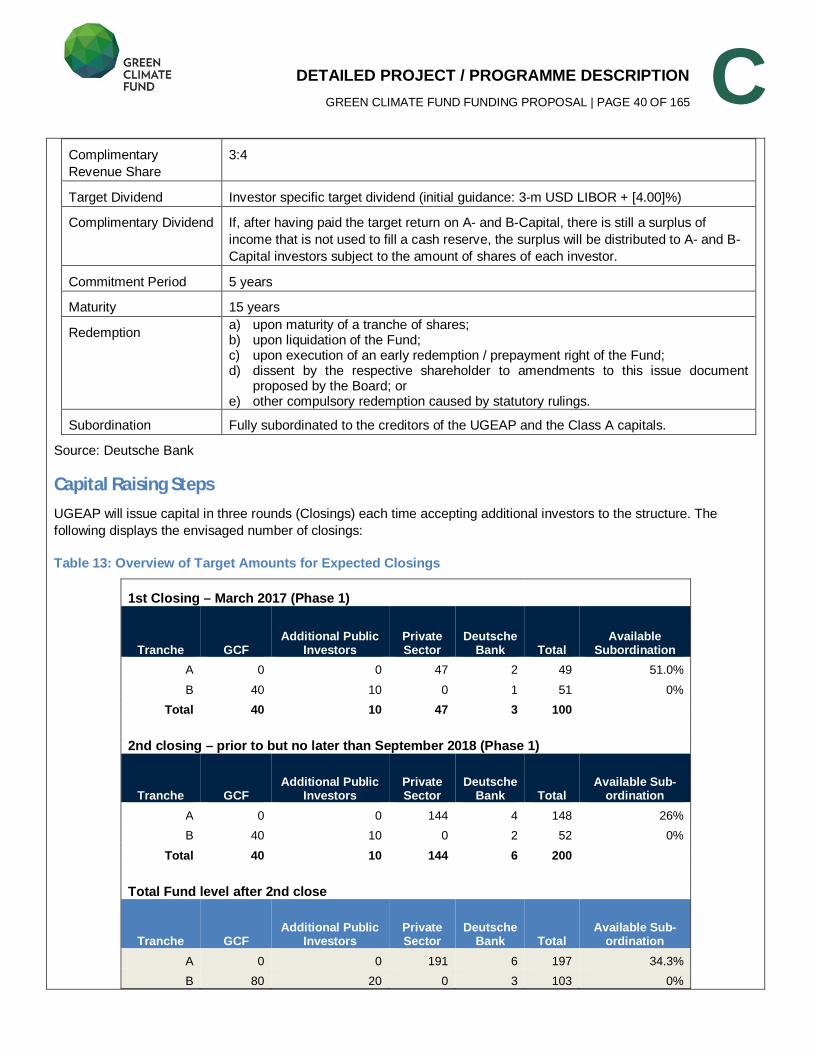
DETAILED PROJECT / PROGRAMME DESCRIPTION GREEN CLIMATE FUND FUNDING PROPOSAL | PAGE 40 OF 165
C Complimentary
Revenue Share
3:4
Target Dividend Investor specific target dividend (initial guidance: 3-m USD LIBOR + [4.00]%)
Complimentary Dividend If, after having paid the target return on A- and B-Capital, there is still a surplus of
income that is not used to fill a cash reserve, the surplus will be distributed to A- and B-
Capital investors subject to the amount of shares of each investor.
Commitment Period 5 years
Maturity 15 years
Redemption a) upon maturity of a tranche of shares; b) upon liquidation of the Fund; c) upon execution of an early redemption / prepayment right of the Fund; d) dissent by the respective shareholder to amendments to this issue document
proposed by the Board; or e) other compulsory redemption caused by statutory rulings.
Subordination Fully subordinated to the creditors of the UGEAP and the Class A capitals.
Source: Deutsche Bank
Capital Raising Steps UGEAP will issue capital in three rounds (Closings) each time accepting additional investors to the structure. The
following displays the envisaged number of closings:
Table 13: Overview of Target Amounts for Expected Closings
1st Closing – March 2017 (Phase 1)
Tranche GCF Additional Public
Investors Private Sector
Deutsche Bank Total
Available Subordination
A 0 0 47 2 49 51.0%
B 40 10 0 1 51 0%
Total 40 10 47 3 100
2nd closing – prior to but no later than September 2018 (Phase 1)
Tranche GCF Additional Public
Investors Private Sector
Deutsche Bank Total
Available Sub-ordination
A 0 0 144 4 148 26%
B 40 10 0 2 52 0%
Total 40 10 144 6 200
Total Fund level after 2nd close
Tranche GCF Additional Public
Investors Private Sector
Deutsche Bank Total
Available Sub-ordination
A 0 0 191 6 197 34.3%
B 80 20 0 3 103 0%
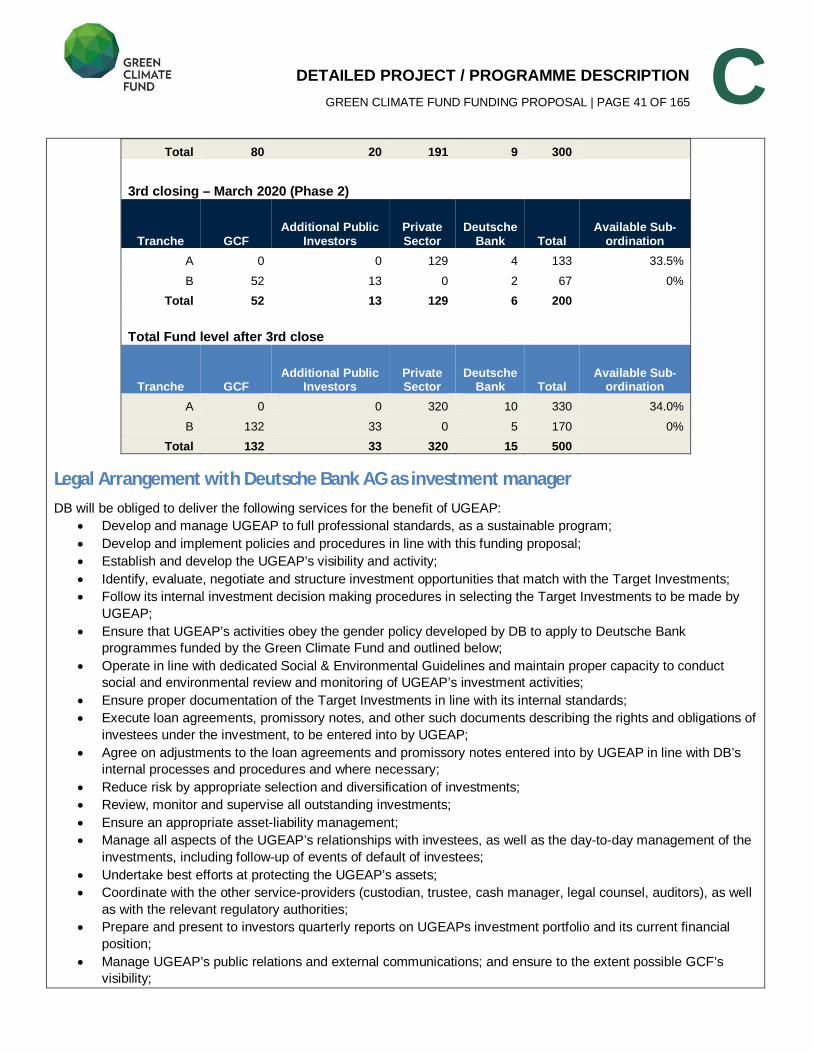
DETAILED PROJECT / PROGRAMME DESCRIPTION GREEN CLIMATE FUND FUNDING PROPOSAL | PAGE 41 OF 165
C Total 80 20 191 9 300
3rd closing – March 2020 (Phase 2)
Tranche GCF Additional Public
Investors Private Sector
Deutsche Bank Total
Available Sub-ordination
A 0 0 129 4 133 33.5%
B 52 13 0 2 67 0%
Total 52 13 129 6 200
Total Fund level after 3rd close
Tranche GCF Additional Public
Investors Private Sector
Deutsche Bank Total
Available Sub-ordination
A 0 0 320 10 330 34.0%
B 132 33 0 5 170 0%
Total 132 33 320 15 500
Legal Arrangement with Deutsche Bank AG as investment manager DB will be obliged to deliver the following services for the benefit of UGEAP:
Develop and manage UGEAP to full professional standards, as a sustainable program;
Develop and implement policies and procedures in line with this funding proposal;
Establish and develop the UGEAP’s visibility and activity;
Identify, evaluate, negotiate and structure investment opportunities that match with the Target Investments;
Follow its internal investment decision making procedures in selecting the Target Investments to be made by
UGEAP;
Ensure that UGEAP’s activities obey the gender policy developed by DB to apply to Deutsche Bank
programmes funded by the Green Climate Fund and outlined below;
Operate in line with dedicated Social & Environmental Guidelines and maintain proper capacity to conduct
social and environmental review and monitoring of UGEAP’s investment activities;
Ensure proper documentation of the Target Investments in line with its internal standards;
Execute loan agreements, promissory notes, and other such documents describing the rights and obligations of
investees under the investment, to be entered into by UGEAP;
Agree on adjustments to the loan agreements and promissory notes entered into by UGEAP in line with DB’s
internal processes and procedures and where necessary;
Reduce risk by appropriate selection and diversification of investments;
Review, monitor and supervise all outstanding investments;
Ensure an appropriate asset-liability management;
Manage all aspects of the UGEAP’s relationships with investees, as well as the day-to-day management of the
investments, including follow-up of events of default of investees;
Undertake best efforts at protecting the UGEAP’s assets;
Coordinate with the other service-providers (custodian, trustee, cash manager, legal counsel, auditors), as well
as with the relevant regulatory authorities;
Prepare and present to investors quarterly reports on UGEAPs investment portfolio and its current financial
position;
Manage UGEAP’s public relations and external communications; and ensure to the extent possible GCF’s
visibility;
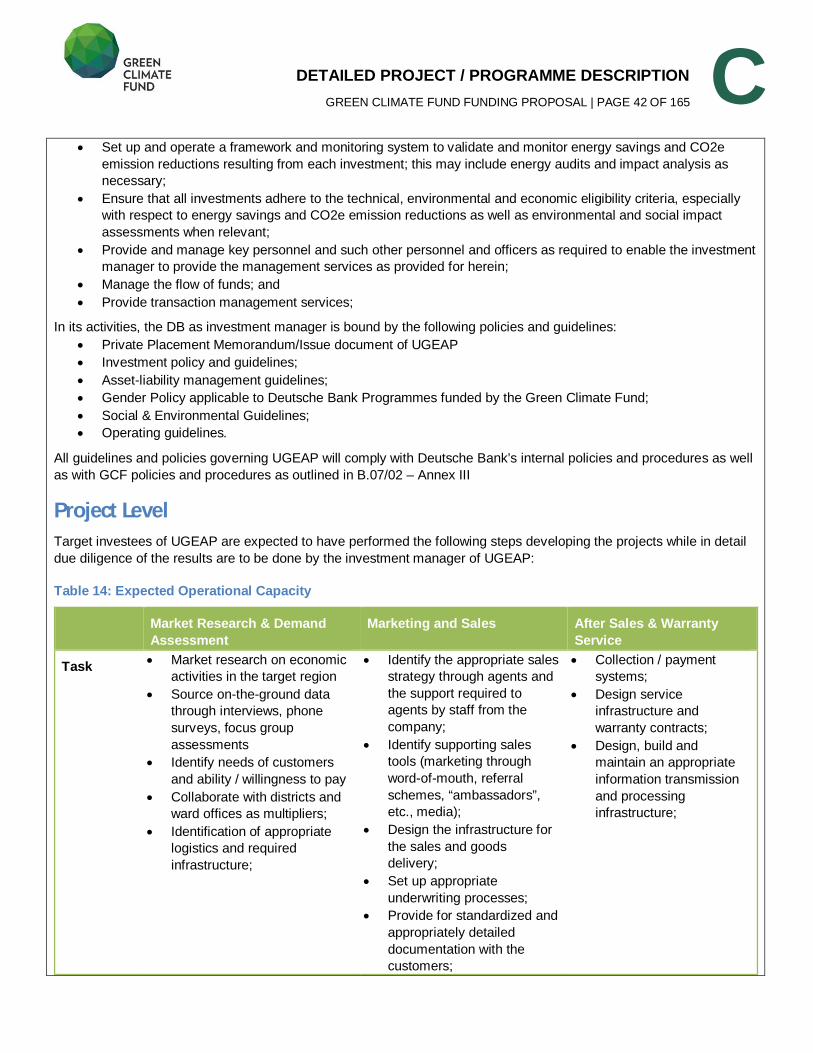
DETAILED PROJECT / PROGRAMME DESCRIPTION GREEN CLIMATE FUND FUNDING PROPOSAL | PAGE 42 OF 165
C Set up and operate a framework and monitoring system to validate and monitor energy savings and CO2e
emission reductions resulting from each investment; this may include energy audits and impact analysis as
necessary;
Ensure that all investments adhere to the technical, environmental and economic eligibility criteria, especially
with respect to energy savings and CO2e emission reductions as well as environmental and social impact
assessments when relevant;
Provide and manage key personnel and such other personnel and officers as required to enable the investment
manager to provide the management services as provided for herein;
Manage the flow of funds; and
Provide transaction management services;
In its activities, the DB as investment manager is bound by the following policies and guidelines:
Private Placement Memorandum/Issue document of UGEAP
Investment policy and guidelines;
Asset-liability management guidelines;
Gender Policy applicable to Deutsche Bank Programmes funded by the Green Climate Fund;
Social & Environmental Guidelines;
Operating guidelines.
All guidelines and policies governing UGEAP will comply with Deutsche Bank’s internal policies and procedures as well
as with GCF policies and procedures as outlined in B.07/02 – Annex III
Project Level Target investees of UGEAP are expected to have performed the following steps developing the projects while in detail
due diligence of the results are to be done by the investment manager of UGEAP:
Table 14: Expected Operational Capacity
Market Research & Demand Assessment
Marketing and Sales After Sales & Warranty Service
Task Market research on economic
activities in the target region
Source on-the-ground data
through interviews, phone
surveys, focus group
assessments
Identify needs of customers
and ability / willingness to pay
Collaborate with districts and
ward offices as multipliers;
Identification of appropriate
logistics and required
infrastructure;
Identify the appropriate sales
strategy through agents and
the support required to
agents by staff from the
company;
Identify supporting sales
tools (marketing through
word-of-mouth, referral
schemes, “ambassadors”,
etc., media);
Design the infrastructure for
the sales and goods
delivery;
Set up appropriate
underwriting processes;
Provide for standardized and
appropriately detailed
documentation with the
customers;
Collection / payment
systems;
Design service
infrastructure and
warranty contracts;
Design, build and
maintain an appropriate
information transmission
and processing
infrastructure;
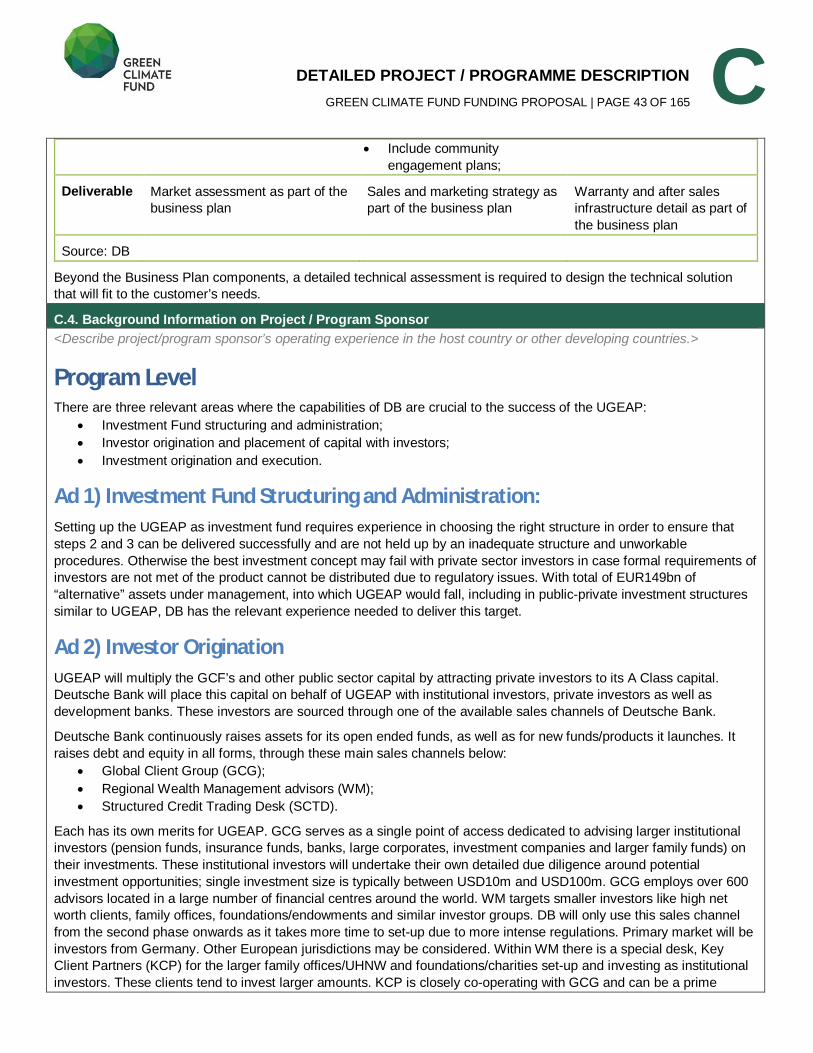
DETAILED PROJECT / PROGRAMME DESCRIPTION GREEN CLIMATE FUND FUNDING PROPOSAL | PAGE 43 OF 165
C Include community
engagement plans;
Deliverable Market assessment as part of the
business plan
Sales and marketing strategy as
part of the business plan
Warranty and after sales
infrastructure detail as part of
the business plan
Source: DB
Beyond the Business Plan components, a detailed technical assessment is required to design the technical solution
that will fit to the customer’s needs.
C.4. Background Information on Project / Program Sponsor <Describe project/program sponsor’s operating experience in the host country or other developing countries.>
Program Level There are three relevant areas where the capabilities of DB are crucial to the success of the UGEAP:
Investment Fund structuring and administration;
Investor origination and placement of capital with investors;
Investment origination and execution.
Ad 1) Investment Fund Structuring and Administration: Setting up the UGEAP as investment fund requires experience in choosing the right structure in order to ensure that
steps 2 and 3 can be delivered successfully and are not held up by an inadequate structure and unworkable
procedures. Otherwise the best investment concept may fail with private sector investors in case formal requirements of
investors are not met of the product cannot be distributed due to regulatory issues. With total of EUR149bn of
“alternative” assets under management, into which UGEAP would fall, including in public-private investment structures
similar to UGEAP, DB has the relevant experience needed to deliver this target.
Ad 2) Investor Origination UGEAP will multiply the GCF’s and other public sector capital by attracting private investors to its A Class capital.
Deutsche Bank will place this capital on behalf of UGEAP with institutional investors, private investors as well as
development banks. These investors are sourced through one of the available sales channels of Deutsche Bank.
Deutsche Bank continuously raises assets for its open ended funds, as well as for new funds/products it launches. It
raises debt and equity in all forms, through these main sales channels below:
Global Client Group (GCG);
Regional Wealth Management advisors (WM);
Structured Credit Trading Desk (SCTD).
Each has its own merits for UGEAP. GCG serves as a single point of access dedicated to advising larger institutional
investors (pension funds, insurance funds, banks, large corporates, investment companies and larger family funds) on
their investments. These institutional investors will undertake their own detailed due diligence around potential
investment opportunities; single investment size is typically between USD10m and USD100m. GCG employs over 600
advisors located in a large number of financial centres around the world. WM targets smaller investors like high net
worth clients, family offices, foundations/endowments and similar investor groups. DB will only use this sales channel
from the second phase onwards as it takes more time to set-up due to more intense regulations. Primary market will be
investors from Germany. Other European jurisdictions may be considered. Within WM there is a special desk, Key
Client Partners (KCP) for the larger family offices/UHNW and foundations/charities set-up and investing as institutional
investors. These clients tend to invest larger amounts. KCP is closely co-operating with GCG and can be a prime
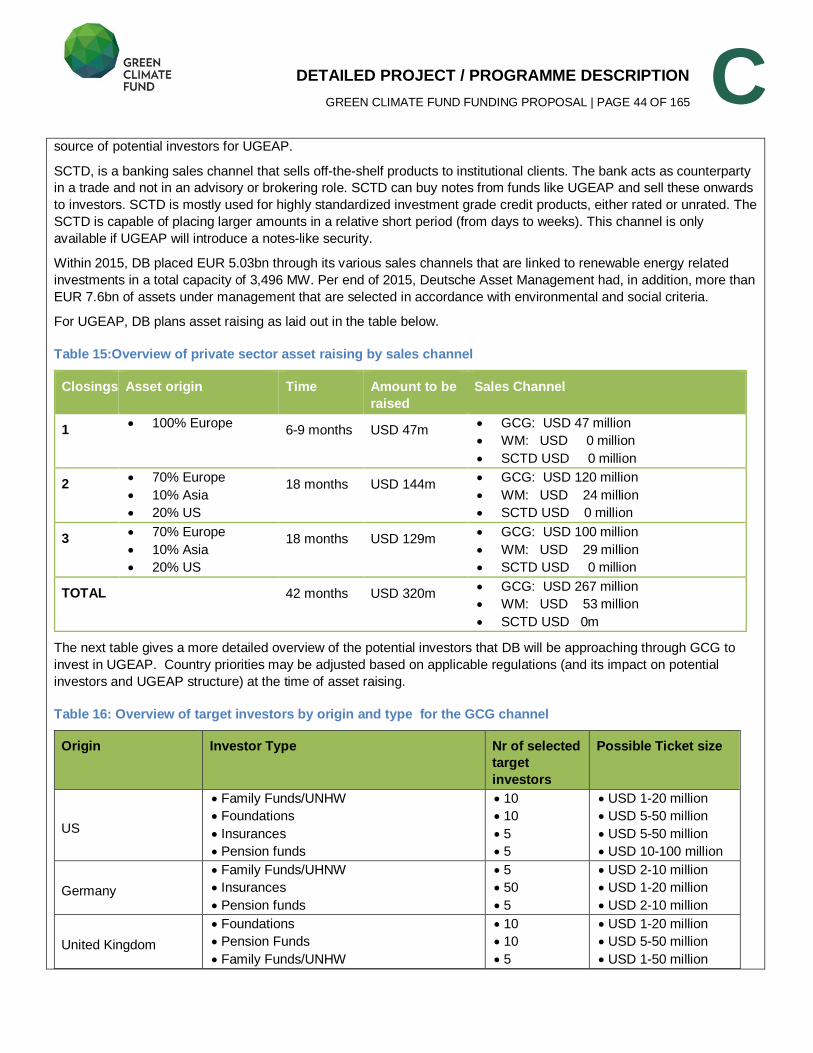
DETAILED PROJECT / PROGRAMME DESCRIPTION GREEN CLIMATE FUND FUNDING PROPOSAL | PAGE 44 OF 165
C source of potential investors for UGEAP.
SCTD, is a banking sales channel that sells off-the-shelf products to institutional clients. The bank acts as counterparty
in a trade and not in an advisory or brokering role. SCTD can buy notes from funds like UGEAP and sell these onwards
to investors. SCTD is mostly used for highly standardized investment grade credit products, either rated or unrated. The
SCTD is capable of placing larger amounts in a relative short period (from days to weeks). This channel is only
available if UGEAP will introduce a notes-like security.
Within 2015, DB placed EUR 5.03bn through its various sales channels that are linked to renewable energy related
investments in a total capacity of 3,496 MW. Per end of 2015, Deutsche Asset Management had, in addition, more than
EUR 7.6bn of assets under management that are selected in accordance with environmental and social criteria.
For UGEAP, DB plans asset raising as laid out in the table below.
Table 15:Overview of private sector asset raising by sales channel
Closings Asset origin Time Amount to be raised
Sales Channel
1 100% Europe 6-9 months USD 47m
GCG: USD 47 million
WM: USD 0 million
SCTD USD 0 million
2 70% Europe
10% Asia
20% US
18 months USD 144m GCG: USD 120 million
WM: USD 24 million
SCTD USD 0 million
3 70% Europe
10% Asia
20% US
18 months USD 129m GCG: USD 100 million
WM: USD 29 million
SCTD USD 0 million
TOTAL 42 months USD 320m GCG: USD 267 million
WM: USD 53 million
SCTD USD 0m
The next table gives a more detailed overview of the potential investors that DB will be approaching through GCG to
invest in UGEAP. Country priorities may be adjusted based on applicable regulations (and its impact on potential
investors and UGEAP structure) at the time of asset raising.
Table 16: Overview of target investors by origin and type for the GCG channel
Origin Investor Type Nr of selected target investors
Possible Ticket size
US
Family Funds/UNHW
Foundations
Insurances
Pension funds
10
10
5
5
USD 1-20 million
USD 5-50 million
USD 5-50 million
USD 10-100 million
Germany
Family Funds/UHNW
Insurances
Pension funds
5
50
5
USD 2-10 million
USD 1-20 million
USD 2-10 million
United Kingdom
Foundations
Pension Funds
Family Funds/UNHW
10
10
5
USD 1-20 million
USD 5-50 million
USD 1-50 million
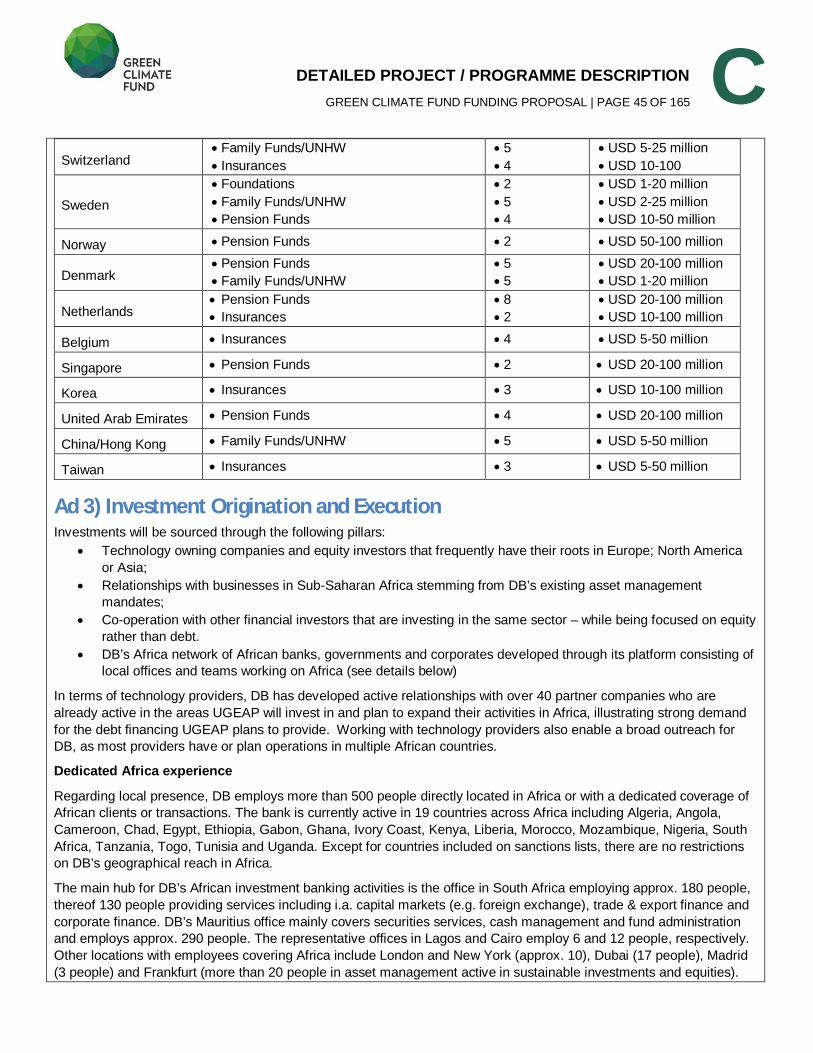
DETAILED PROJECT / PROGRAMME DESCRIPTION GREEN CLIMATE FUND FUNDING PROPOSAL | PAGE 45 OF 165
C Switzerland
Family Funds/UNHW
Insurances
5
4
USD 5-25 million
USD 10-100
Sweden
Foundations
Family Funds/UNHW
Pension Funds
2
5
4
USD 1-20 million
USD 2-25 million
USD 10-50 million
Norway Pension Funds 2 USD 50-100 million
Denmark Pension Funds
Family Funds/UNHW
5
5
USD 20-100 million
USD 1-20 million
Netherlands Pension Funds
Insurances
8
2
USD 20-100 million
USD 10-100 million
Belgium Insurances 4 USD 5-50 million
Singapore Pension Funds 2 USD 20-100 million
Korea Insurances 3 USD 10-100 million
United Arab Emirates Pension Funds 4 USD 20-100 million
China/Hong Kong Family Funds/UNHW 5 USD 5-50 million
Taiwan Insurances 3 USD 5-50 million
Ad 3) Investment Origination and Execution Investments will be sourced through the following pillars:
Technology owning companies and equity investors that frequently have their roots in Europe; North America
or Asia;
Relationships with businesses in Sub-Saharan Africa stemming from DB’s existing asset management
mandates;
Co-operation with other financial investors that are investing in the same sector – while being focused on equity
rather than debt.
DB’s Africa network of African banks, governments and corporates developed through its platform consisting of
local offices and teams working on Africa (see details below)
In terms of technology providers, DB has developed active relationships with over 40 partner companies who are
already active in the areas UGEAP will invest in and plan to expand their activities in Africa, illustrating strong demand
for the debt financing UGEAP plans to provide. Working with technology providers also enable a broad outreach for
DB, as most providers have or plan operations in multiple African countries.
Dedicated Africa experience
Regarding local presence, DB employs more than 500 people directly located in Africa or with a dedicated coverage of
African clients or transactions. The bank is currently active in 19 countries across Africa including Algeria, Angola,
Cameroon, Chad, Egypt, Ethiopia, Gabon, Ghana, Ivory Coast, Kenya, Liberia, Morocco, Mozambique, Nigeria, South
Africa, Tanzania, Togo, Tunisia and Uganda. Except for countries included on sanctions lists, there are no restrictions
on DB’s geographical reach in Africa.
The main hub for DB’s African investment banking activities is the office in South Africa employing approx. 180 people,
thereof 130 people providing services including i.a. capital markets (e.g. foreign exchange), trade & export finance and
corporate finance. DB’s Mauritius office mainly covers securities services, cash management and fund administration
and employs approx. 290 people. The representative offices in Lagos and Cairo employ 6 and 12 people, respectively.
Other locations with employees covering Africa include London and New York (approx. 10), Dubai (17 people), Madrid
(3 people) and Frankfurt (more than 20 people in asset management active in sustainable investments and equities).
DETAILED PROJECT / PROGRAMME DESCRIPTION GREEN CLIMATE FUND FUNDING PROPOSAL | PAGE 46 OF 165
C Within Deutsche Asset Management, Deutsche Bank has a dedicated Sustainable Investments team of 28 people
based in Amsterdam, Frankfurt, Hong Kong, London, Luxembourg and New York with Assets under Management
(AuMs) of approx. USD 1.8bn. A team of 5 investment managers located in Frankfurt – while working closely with DB’s
Africa teams – locally acts as investment advisor to Africa Agriculture and Trade Investment Fund (AATIF), a
Luxembourg-based investment company funded by public and private investors (including Deutsche Bank ) providing
debt financing to the agriculture sector in Africa through local banks and direct investments. AATIF has committed
capital of approx. USD 172m. AATIF successfully sources its investments through the contacts of the investment team,
the DB platform as well as a number of financial, E&S and industry partners with local presence in Africa.
Furthermore, a fund investing in African equities (Deutsche Invest I Africa) is managed out of Frankfurt with AuMs of
EUR 120m (approx. USD 132m).
DB has an award-winning track record in African bonds and between 2013-2015 issued 33 bonds in Africa for
governments, corporate and banks, ranking number 1 in league tables and raising over USD8 bn in total. This provides
DB with strong relationships with Ministries of Finance, African corporate and banks which can be leveraged for
UGEAP as well.
Through its corporate and project finance track record in Africa, DB entertains close contacts with African corporate in
the mining, infrastructure and manufacturing sectors. These contacts will be leveraged to identify investments for
Category 3.
Finally, DB’s trade & export finance teams (i) handle documentary credits issued by nearly 250 banks across 31 African
countries and (ii) are able to issue guarantees and letters of credits into most African countries (currently 24). The
UGEAP investment team can leverage this banking network together with the portfolio banks of the existing Africa
funds to source partner banks for UGEAP.
DB’s track-record in the off-grid space
DB’s Sustainable Investment’s team based in New York has managed global microfinance funds including investments
in microfinance institutions in Africa since the mid 1990s. SI covers all activities related to social investments, and it is
known for its innovative financings in the field, particularly in microfinance and financing social businesses.
Within the latter the team has built up substantial track-record in the very early stage of the off-grid market by providing
a loan to d.light design, the world’s leading manufacturer of solar lighting solutions for off-grid households (through its
Consortium I Fund). SI’s experience in the off-grid market also includes a 2010 partnership with the Shell Foundation to
establish the Carbon Initiative for Community Impact (CI)², a revolving credit facility that pre-financed carbon revenues
to small/medium-sized emission reduction projects that benefit vulnerable communities in developing countries. SI also
manages a $4 million revolving fund which was initiated jointly with the Global Alliance for Clean Cookstoves that will
deploy working capital loans and loan guarantees to enterprises along the clean cookstove and clean fuels value chain.
Furthermore, SI has directly lent to solar home light distributors servicing the BoP such as d.Light, Greenlight Planet
and Orb Energy.
SI’s most recent fund in the off-grid space is the Essential Capital Consortium (ECC) Fund that focuses on Social
Businesses established with the intent of benefitting poor communities and directly impacting on the poor through the
production of goods and/or the provision of services in three sectors: Base of the Pyramid (“BoP”) financial services,
energy, and health. ECC’s current portfolio includes off-grid companies such as Mobisol, Off-grid-Electric, Sunfunder,
Green Light Plant, SolarNow, most of which are potential borrowers under UGEAP.
The Frankfurt-based Sustainable Investment Team has gained experience in the off-grid space mainly through its
investment mandates covered by SI where the team financed the first captive photovoltaic power plant for a mining
operation in South Africa that is not based on any form of public financial support. Additionally one of the investment
funds covered by SI has supported a mini-grid project development led by Jumeme and Inensus through its technical
assistance facility.
UGEAP’s dedicated investment management team will make use of all the channels listed above for the sourcing and
DETAILED PROJECT / PROGRAMME DESCRIPTION GREEN CLIMATE FUND FUNDING PROPOSAL | PAGE 47 OF 165
C monitoring of investments, while also bringing its own network of relevant contacts. DB foresees that about 6
investment specialists would be allocated to UGEAP full time while staff will be chosen that has the relevant knowledge
and experience. DB further envisages local presence to be of importance and hence would probably add staff located
in one of the hubs of DB to the investment management team,
For a more detailed process description on the origination and execution of investment (opportunities), please refer to
C.3 Annex 1 – Investment Process.
Project Level Part of the selection of appropriate investments by the investment manager will be a satisfactory review of the existing
operational capacity of the investee / the relevant service providers. The following indicators suggest a positive result of
this assessment while concrete cases may differ:
Several years of already existing activity;
Existing operations in the country to ensure that customer satisfaction is maintained high level;
Trial phase in the target regions successfully passed as part of the market testing approach;
Pilot projects running with sufficient run-times to ensure technical feasibility;
Management team and staff with the relevant experience to handle the projects / targeted customers;
Network or local, qualified service providers;
Up-to-date IT infrastructure allowing a 24/7 monitoring of the operations of the installations;
<Describe financial status and how the project/program sponsor will support the project/program in terms of equity, management, operations, production and marketing.>
Program Level In order to align interests of Deutsche Bank acting as investment manager with the interests of investors, the bank shall
co-invests into the UGEAP. Deutsche Bank envisages investing an amount of up to 3% of the total amount of capital to
be raised by UGEAP (up to USD500m while DB’s commitment shall reach USD15m in total) for which it has received
internal approvals. Please note that US regulation limits the amount an investment manager of an investment fund is
entitled to invest into (Volcker regulation). The DB co-investment is expected to be equal to 1/3 in Class B and 2/3 in
Class A Capital.
C.5. Market Overview (if applicable) <Describe the market for the product(s) or services including the historical data and forecasts.>
Program Level As investment vehicle, UGEAP has two markets that are relevant to it:
On the asset side, the investments are loans to projects in the categories mentioned above. The relevant
market is that of long term debt capital for businesses located in the Target Region with the following
characteristics:
1) Amount: USD 5m – USD 30m debt portion; 2) Tenor: 5-10 years; 3) Currency: Local currency or USD; 4) Target interest rates: 6-10% in USD equivalent; 5) Collateral: Assets that are financed by the loan; 6) Small sized businesses in a new industry expanding to oftentimes unbanked customers (Category 1 and 2)
or companies that are pure project finance companies (Category 3).
On the liabilities side, the market is that of capital invested into funds that invest in infrastructure assets located
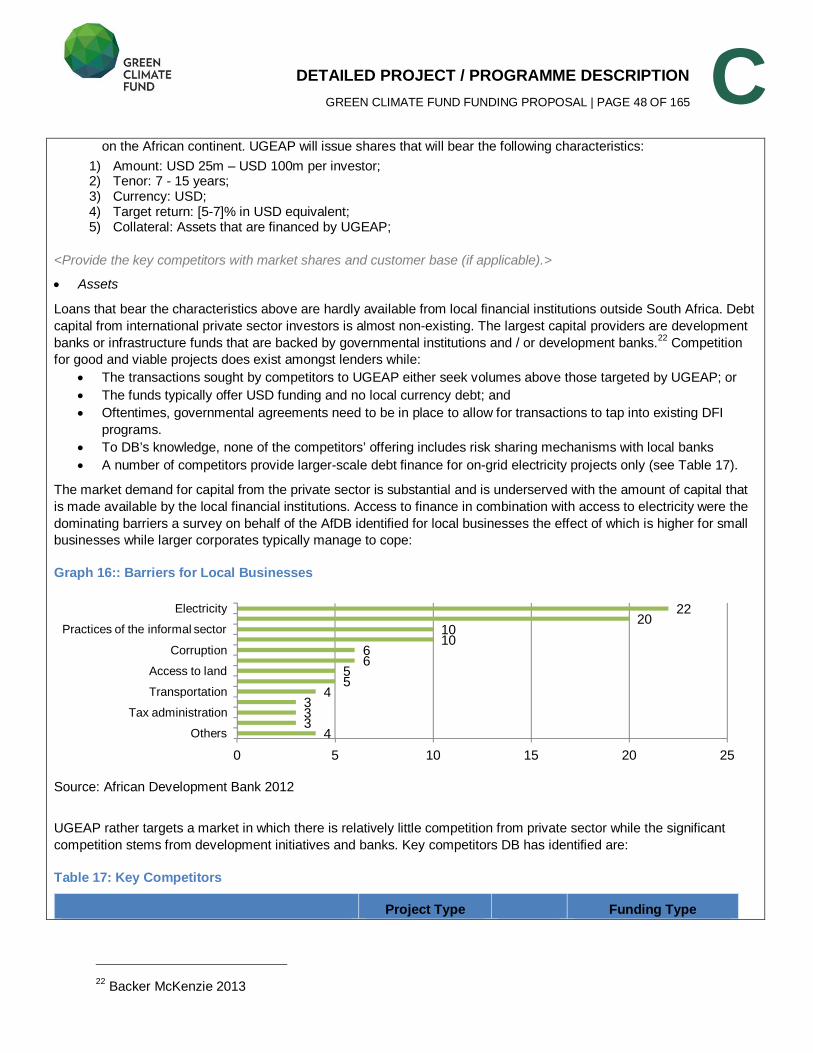
DETAILED PROJECT / PROGRAMME DESCRIPTION GREEN CLIMATE FUND FUNDING PROPOSAL | PAGE 48 OF 165
C on the African continent. UGEAP will issue shares that will bear the following characteristics:
1) Amount: USD 25m – USD 100m per investor; 2) Tenor: 7 - 15 years; 3) Currency: USD; 4) Target return: [5-7]% in USD equivalent; 5) Collateral: Assets that are financed by UGEAP;
<Provide the key competitors with market shares and customer base (if applicable).>
Assets
Loans that bear the characteristics above are hardly available from local financial institutions outside South Africa. Debt
capital from international private sector investors is almost non-existing. The largest capital providers are development
banks or infrastructure funds that are backed by governmental institutions and / or development banks.22
Competition
for good and viable projects does exist amongst lenders while:
The transactions sought by competitors to UGEAP either seek volumes above those targeted by UGEAP; or
The funds typically offer USD funding and no local currency debt; and
Oftentimes, governmental agreements need to be in place to allow for transactions to tap into existing DFI
programs.
To DB’s knowledge, none of the competitors’ offering includes risk sharing mechanisms with local banks
A number of competitors provide larger-scale debt finance for on-grid electricity projects only (see Table 17).
The market demand for capital from the private sector is substantial and is underserved with the amount of capital that
is made available by the local financial institutions. Access to finance in combination with access to electricity were the
dominating barriers a survey on behalf of the AfDB identified for local businesses the effect of which is higher for small
businesses while larger corporates typically manage to cope:
Graph 16:: Barriers for Local Businesses
Source: African Development Bank 2012
UGEAP rather targets a market in which there is relatively little competition from private sector while the significant
competition stems from development initiatives and banks. Key competitors DB has identified are:
Table 17: Key Competitors
Project Type Funding Type
22 Backer McKenzie 2013
4333
455
66
1010
2022
0 5 10 15 20 25Others
Tax administration
Transportation
Access to land
Corruption
Practices of the informal sector
Electricity
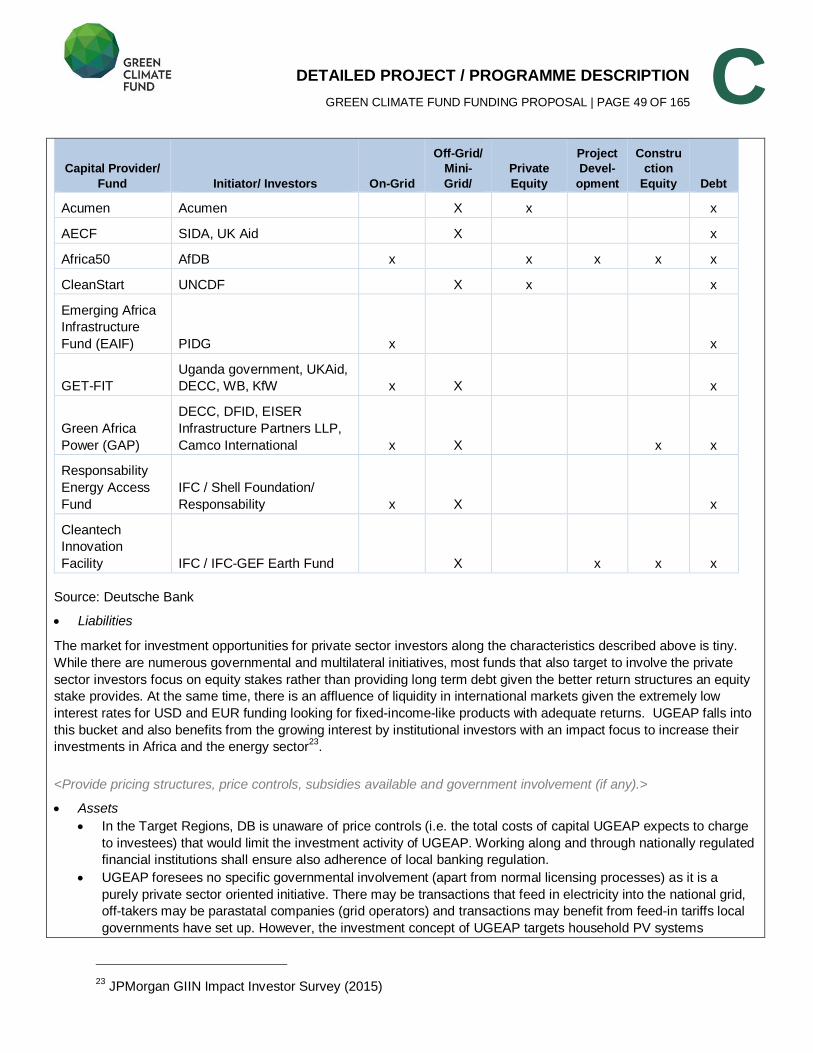
DETAILED PROJECT / PROGRAMME DESCRIPTION GREEN CLIMATE FUND FUNDING PROPOSAL | PAGE 49 OF 165
C Capital Provider/
Fund Initiator/ Investors On-Grid
Off-Grid/ Mini-Grid/
Private Equity
Project Devel-
opment
Construction
Equity Debt
Acumen Acumen X x x
AECF SIDA, UK Aid X x
Africa50 AfDB x x x x x
CleanStart UNCDF X x x
Emerging Africa
Infrastructure
Fund (EAIF) PIDG x x
GET-FIT
Uganda government, UKAid,
DECC, WB, KfW x X x
Green Africa
Power (GAP)
DECC, DFID, EISER
Infrastructure Partners LLP,
Camco International x X x x
Responsability
Energy Access
Fund
IFC / Shell Foundation/
Responsability x X x
Cleantech
Innovation
Facility IFC / IFC-GEF Earth Fund X x x x
Source: Deutsche Bank
Liabilities
The market for investment opportunities for private sector investors along the characteristics described above is tiny.
While there are numerous governmental and multilateral initiatives, most funds that also target to involve the private
sector investors focus on equity stakes rather than providing long term debt given the better return structures an equity
stake provides. At the same time, there is an affluence of liquidity in international markets given the extremely low
interest rates for USD and EUR funding looking for fixed-income-like products with adequate returns. UGEAP falls into
this bucket and also benefits from the growing interest by institutional investors with an impact focus to increase their
investments in Africa and the energy sector23
.
<Provide pricing structures, price controls, subsidies available and government involvement (if any).>
Assets In the Target Regions, DB is unaware of price controls (i.e. the total costs of capital UGEAP expects to charge
to investees) that would limit the investment activity of UGEAP. Working along and through nationally regulated
financial institutions shall ensure also adherence of local banking regulation.
UGEAP foresees no specific governmental involvement (apart from normal licensing processes) as it is a
purely private sector oriented initiative. There may be transactions that feed in electricity into the national grid,
off-takers may be parastatal companies (grid operators) and transactions may benefit from feed-in tariffs local
governments have set up. However, the investment concept of UGEAP targets household PV systems
23 JPMorgan GIIN Impact Investor Survey (2015)
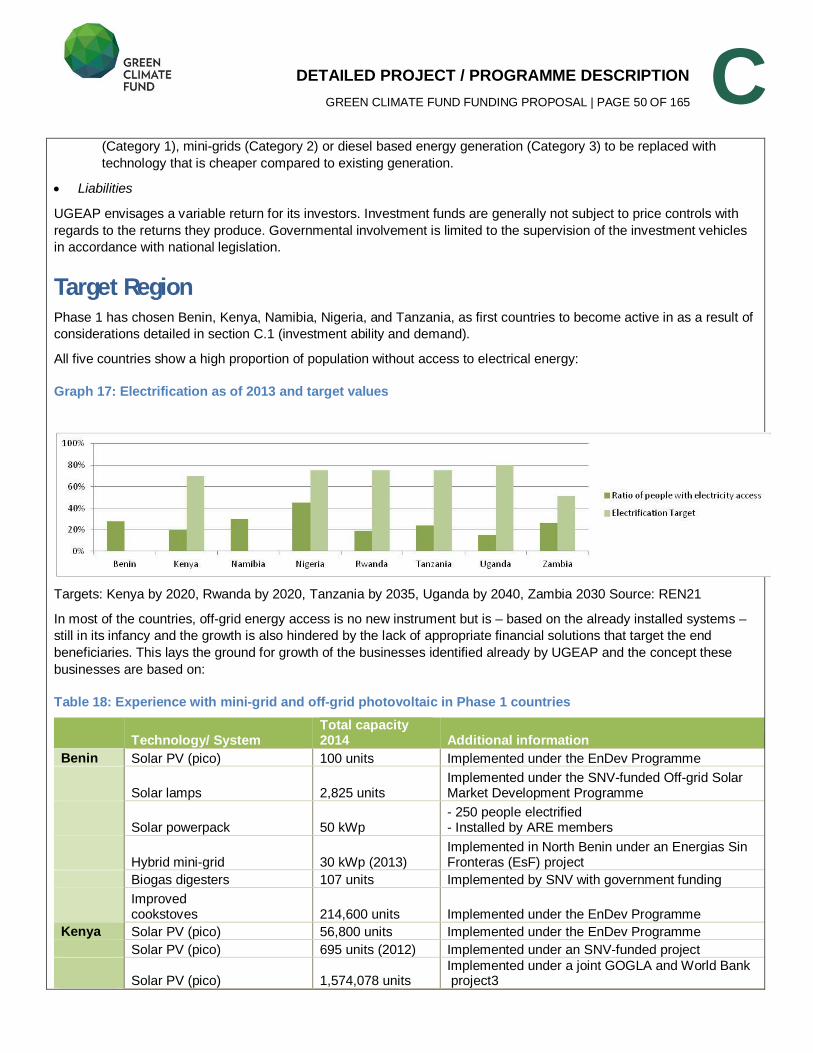
DETAILED PROJECT / PROGRAMME DESCRIPTION GREEN CLIMATE FUND FUNDING PROPOSAL | PAGE 50 OF 165
C (Category 1), mini-grids (Category 2) or diesel based energy generation (Category 3) to be replaced with
technology that is cheaper compared to existing generation.
Liabilities
UGEAP envisages a variable return for its investors. Investment funds are generally not subject to price controls with
regards to the returns they produce. Governmental involvement is limited to the supervision of the investment vehicles
in accordance with national legislation.
Target Region Phase 1 has chosen Benin, Kenya, Namibia, Nigeria, and Tanzania, as first countries to become active in as a result of
considerations detailed in section C.1 (investment ability and demand).
All five countries show a high proportion of population without access to electrical energy:
Graph 17: Electrification as of 2013 and target values
Targets: Kenya by 2020, Rwanda by 2020, Tanzania by 2035, Uganda by 2040, Zambia 2030 Source: REN21
In most of the countries, off-grid energy access is no new instrument but is – based on the already installed systems –
still in its infancy and the growth is also hindered by the lack of appropriate financial solutions that target the end
beneficiaries. This lays the ground for growth of the businesses identified already by UGEAP and the concept these
businesses are based on:
Table 18: Experience with mini-grid and off-grid photovoltaic in Phase 1 countries
Technology/ System Total capacity 2014 Additional information
Benin Solar PV (pico) 100 units Implemented under the EnDev Programme
Solar lamps 2,825 units Implemented under the SNV-funded Off-grid Solar Market Development Programme
Solar powerpack 50 kWp - 250 people electrified - Installed by ARE members
Hybrid mini-grid 30 kWp (2013) Implemented in North Benin under an Energias Sin Fronteras (EsF) project
Biogas digesters 107 units Implemented by SNV with government funding
Improved cookstoves 214,600 units Implemented under the EnDev Programme
Kenya Solar PV (pico) 56,800 units Implemented under the EnDev Programme
Solar PV (pico) 695 units (2012) Implemented under an SNV-funded project
Solar PV (pico) 1,574,078 units Implemented under a joint GOGLA and World Bank project3
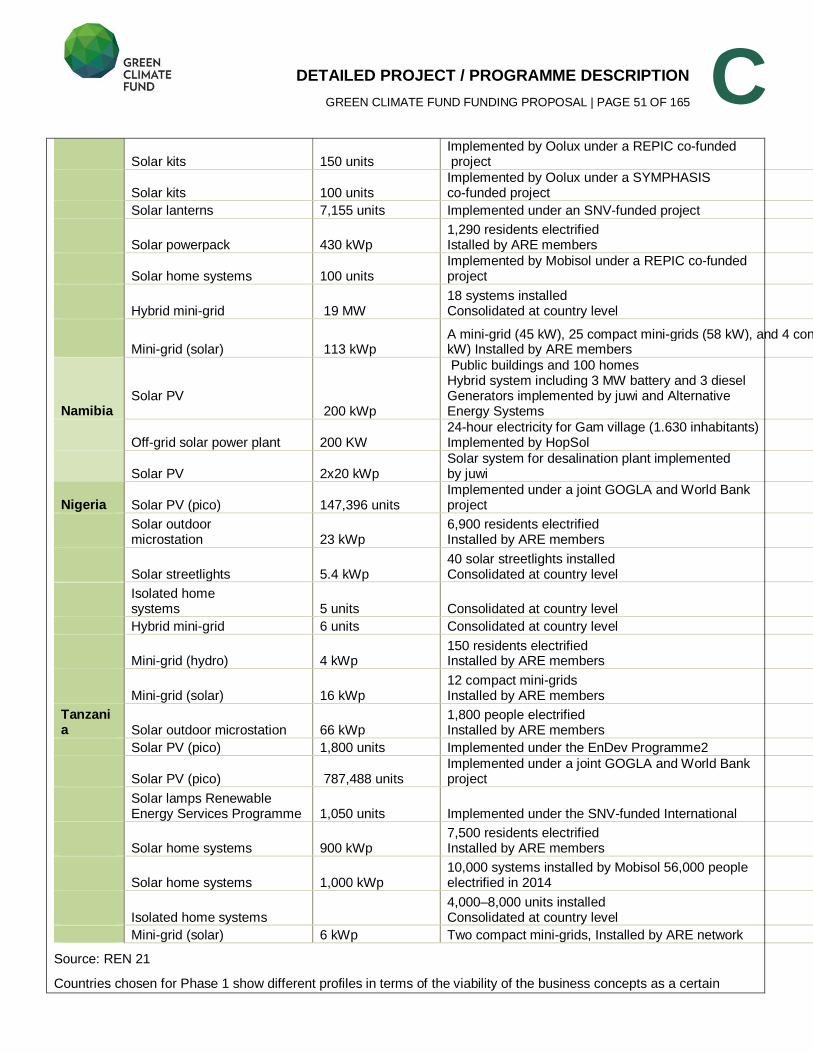
DETAILED PROJECT / PROGRAMME DESCRIPTION GREEN CLIMATE FUND FUNDING PROPOSAL | PAGE 51 OF 165
C Solar kits 150 units
Implemented by Oolux under a REPIC co-funded project
Solar kits 100 units Implemented by Oolux under a SYMPHASIS co-funded project
Solar lanterns 7,155 units Implemented under an SNV-funded project
Solar powerpack 430 kWp 1,290 residents electrified Istalled by ARE members
Solar home systems 100 units Implemented by Mobisol under a REPIC co-funded project
Hybrid mini-grid 19 MW 18 systems installed Consolidated at country level
Mini-grid (solar) 113 kWp A mini-grid (45 kW), 25 compact mini-grids (58 kW), and 4 containerised minikW) Installed by ARE members
Namibia Solar PV 200 kWp
Public buildings and 100 homes Hybrid system including 3 MW battery and 3 diesel Generators implemented by juwi and Alternative Energy Systems
Off-grid solar power plant 200 KW
24-hour electricity for Gam village (1.630 inhabitants) Implemented by HopSol
Solar PV 2x20 kWp
Solar system for desalination plant implemented by juwi
Nigeria Solar PV (pico) 147,396 units Implemented under a joint GOGLA and World Bank project
Solar outdoor microstation 23 kWp
6,900 residents electrified Installed by ARE members
Solar streetlights 5.4 kWp 40 solar streetlights installed Consolidated at country level
Isolated home systems 5 units Consolidated at country level
Hybrid mini-grid 6 units Consolidated at country level
Mini-grid (hydro) 4 kWp 150 residents electrified Installed by ARE members
Mini-grid (solar) 16 kWp 12 compact mini-grids Installed by ARE members
Tanzania Solar outdoor microstation 66 kWp
1,800 people electrified Installed by ARE members
Solar PV (pico) 1,800 units Implemented under the EnDev Programme2
Solar PV (pico) 787,488 units Implemented under a joint GOGLA and World Bank project
Solar lamps Renewable Energy Services Programme 1,050 units Implemented under the SNV-funded International
Solar home systems 900 kWp 7,500 residents electrified Installed by ARE members
Solar home systems 1,000 kWp 10,000 systems installed by Mobisol 56,000 people electrified in 2014
Isolated home systems 4,000–8,000 units installed Consolidated at country level
Mini-grid (solar) 6 kWp Two compact mini-grids, Installed by ARE network
Source: REN 21
Countries chosen for Phase 1 show different profiles in terms of the viability of the business concepts as a certain
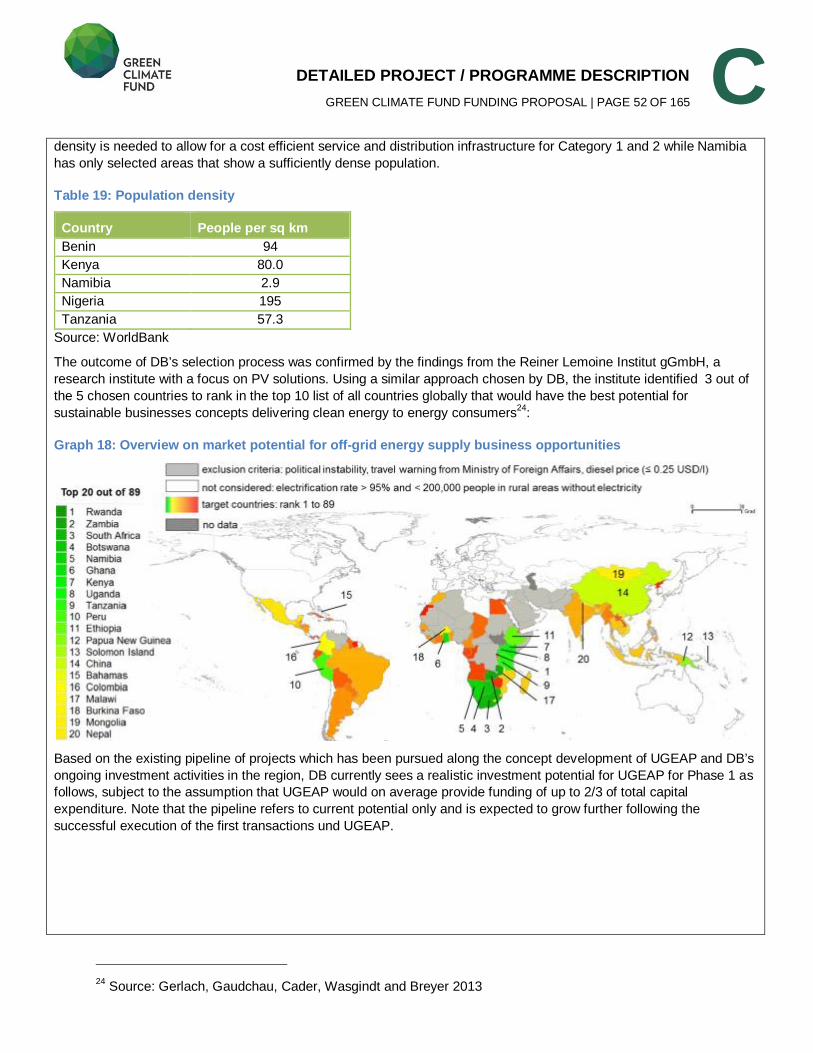
DETAILED PROJECT / PROGRAMME DESCRIPTION GREEN CLIMATE FUND FUNDING PROPOSAL | PAGE 52 OF 165
C density is needed to allow for a cost efficient service and distribution infrastructure for Category 1 and 2 while Namibia
has only selected areas that show a sufficiently dense population.
Table 19: Population density
Country People per sq km Benin 94
Kenya 80.0
Namibia 2.9
Nigeria 195
Tanzania 57.3
Source: WorldBank
The outcome of DB’s selection process was confirmed by the findings from the Reiner Lemoine Institut gGmbH, a
research institute with a focus on PV solutions. Using a similar approach chosen by DB, the institute identified 3 out of
the 5 chosen countries to rank in the top 10 list of all countries globally that would have the best potential for
sustainable businesses concepts delivering clean energy to energy consumers24
:
Graph 18: Overview on market potential for off-grid energy supply business opportunities
Based on the existing pipeline of projects which has been pursued along the concept development of UGEAP and DB’s
ongoing investment activities in the region, DB currently sees a realistic investment potential for UGEAP for Phase 1 as
follows, subject to the assumption that UGEAP would on average provide funding of up to 2/3 of total capital
expenditure. Note that the pipeline refers to current potential only and is expected to grow further following the
successful execution of the first transactions und UGEAP.
24 Source: Gerlach, Gaudchau, Cader, Wasgindt and Breyer 2013
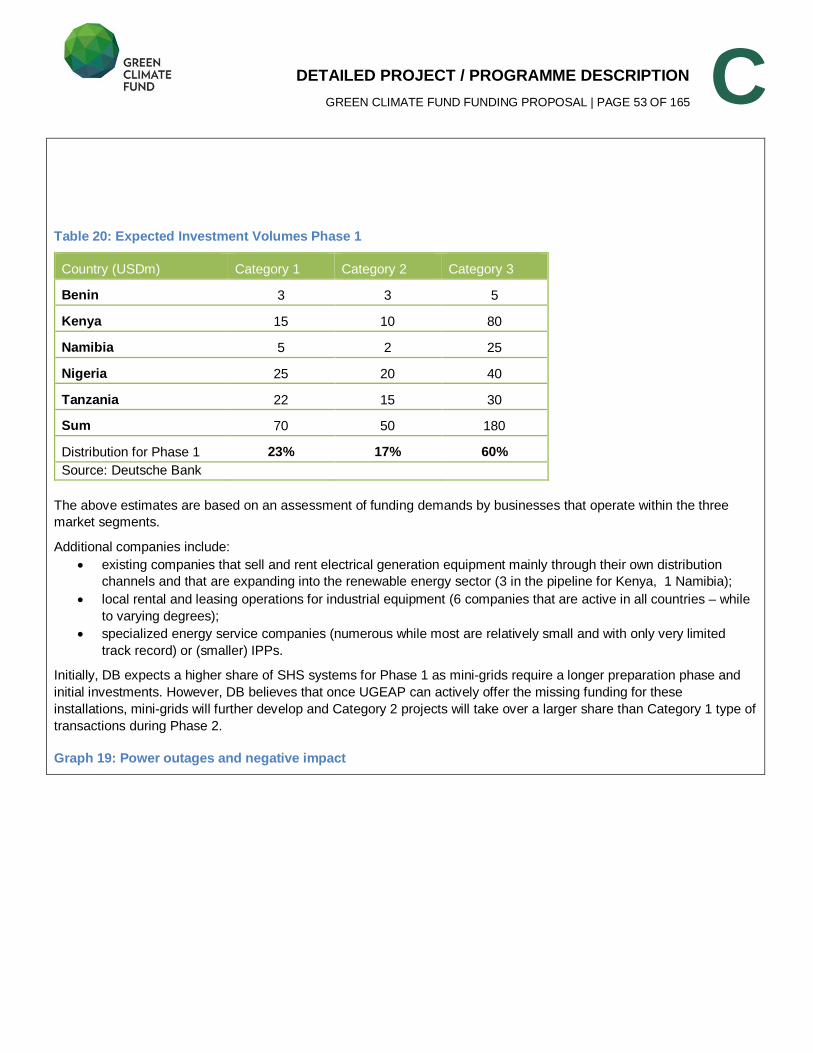
DETAILED PROJECT / PROGRAMME DESCRIPTION GREEN CLIMATE FUND FUNDING PROPOSAL | PAGE 53 OF 165
C
Table 20: Expected Investment Volumes Phase 1
Country (USDm) Category 1 Category 2 Category 3
Benin 3 3 5
Kenya 15 10 80
Namibia 5 2 25
Nigeria 25 20 40
Tanzania 22 15 30
Sum 70 50 180
Distribution for Phase 1 23% 17% 60% Source: Deutsche Bank
The above estimates are based on an assessment of funding demands by businesses that operate within the three
market segments.
Additional companies include:
existing companies that sell and rent electrical generation equipment mainly through their own distribution
channels and that are expanding into the renewable energy sector (3 in the pipeline for Kenya, 1 Namibia);
local rental and leasing operations for industrial equipment (6 companies that are active in all countries – while
to varying degrees);
specialized energy service companies (numerous while most are relatively small and with only very limited
track record) or (smaller) IPPs.
Initially, DB expects a higher share of SHS systems for Phase 1 as mini-grids require a longer preparation phase and
initial investments. However, DB believes that once UGEAP can actively offer the missing funding for these
installations, mini-grids will further develop and Category 2 projects will take over a larger share than Category 1 type of
transactions during Phase 2.
Graph 19: Power outages and negative impact
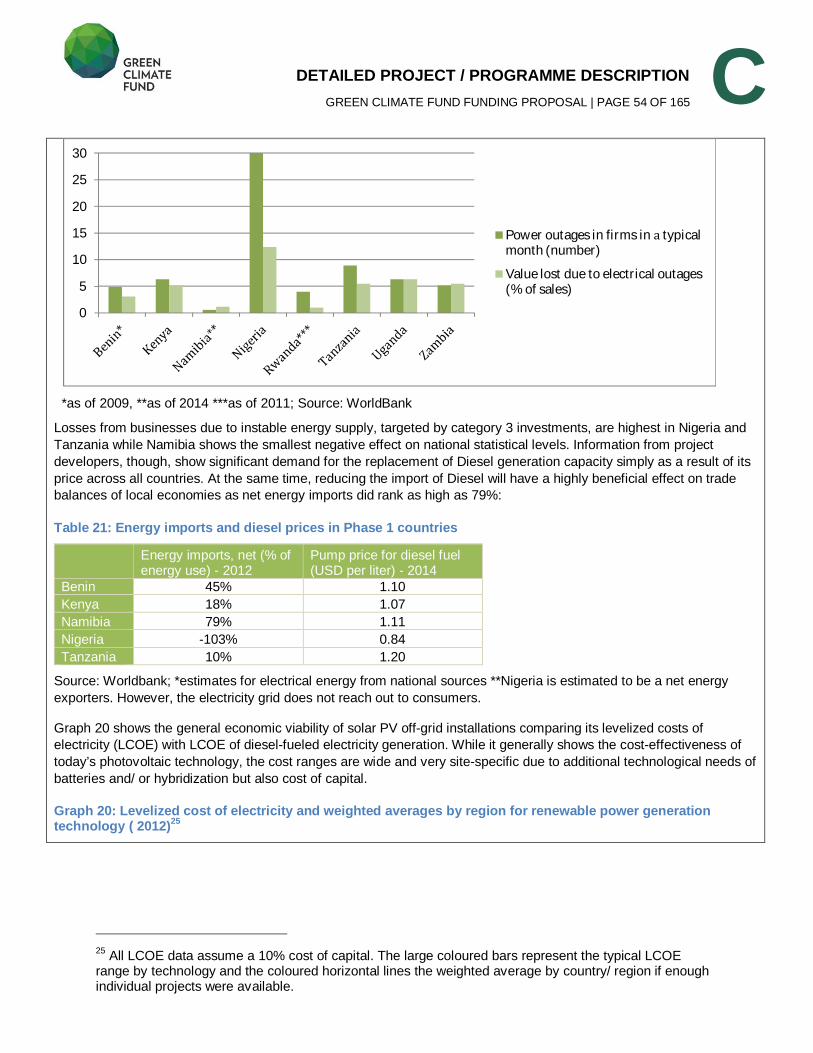
DETAILED PROJECT / PROGRAMME DESCRIPTION GREEN CLIMATE FUND FUNDING PROPOSAL | PAGE 54 OF 165
C
*as of 2009, **as of 2014 ***as of 2011; Source: WorldBank
Losses from businesses due to instable energy supply, targeted by category 3 investments, are highest in Nigeria and
Tanzania while Namibia shows the smallest negative effect on national statistical levels. Information from project
developers, though, show significant demand for the replacement of Diesel generation capacity simply as a result of its
price across all countries. At the same time, reducing the import of Diesel will have a highly beneficial effect on trade
balances of local economies as net energy imports did rank as high as 79%:
Table 21: Energy imports and diesel prices in Phase 1 countries
Energy imports, net (% of energy use) - 2012
Pump price for diesel fuel (USD per liter) - 2014
Benin 45% 1.10
Kenya 18% 1.07
Namibia 79% 1.11
Nigeria -103% 0.84
Tanzania 10% 1.20
Source: Worldbank; *estimates for electrical energy from national sources **Nigeria is estimated to be a net energy
exporters. However, the electricity grid does not reach out to consumers.
Graph 20 shows the general economic viability of solar PV off-grid installations comparing its levelized costs of
electricity (LCOE) with LCOE of diesel-fueled electricity generation. While it generally shows the cost-effectiveness of
today’s photovoltaic technology, the cost ranges are wide and very site-specific due to additional technological needs of
batteries and/ or hybridization but also cost of capital.
Graph 20: Levelized cost of electricity and weighted averages by region for renewable power generation technology ( 2012)25
25 All LCOE data assume a 10% cost of capital. The large coloured bars represent the typical LCOE
range by technology and the coloured horizontal lines the weighted average by country/ region if enough individual projects were available.
0
5
10
15
20
25
30
Power outages in firms in typicalmonth (number)
Value lost due to electrical outages(% of sales)
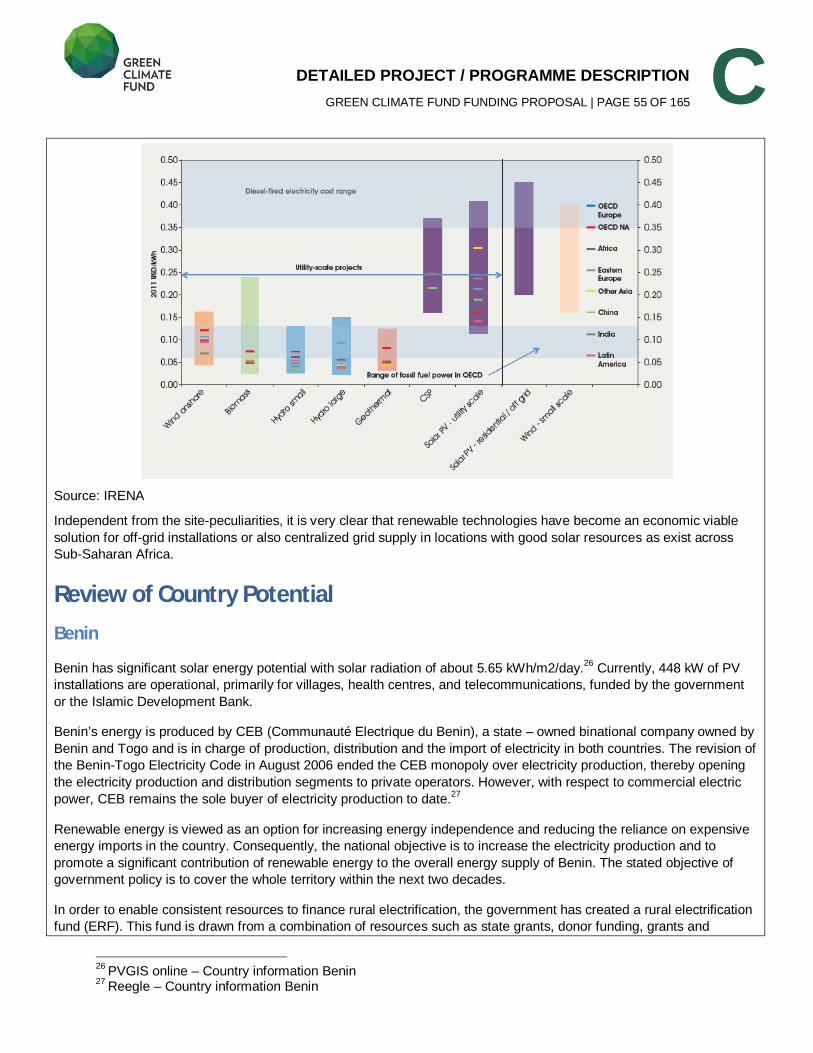
DETAILED PROJECT / PROGRAMME DESCRIPTION GREEN CLIMATE FUND FUNDING PROPOSAL | PAGE 55 OF 165
C
Source: IRENA
Independent from the site-peculiarities, it is very clear that renewable technologies have become an economic viable
solution for off-grid installations or also centralized grid supply in locations with good solar resources as exist across
Sub-Saharan Africa.
Review of Country Potential Benin
Benin has significant solar energy potential with solar radiation of about 5.65 kWh/m2/day.26
Currently, 448 kW of PV
installations are operational, primarily for villages, health centres, and telecommunications, funded by the government
or the Islamic Development Bank.
Benin’s energy is produced by CEB (Communauté Electrique du Benin), a state – owned binational company owned by
Benin and Togo and is in charge of production, distribution and the import of electricity in both countries. The revision of
the Benin-Togo Electricity Code in August 2006 ended the CEB monopoly over electricity production, thereby opening
the electricity production and distribution segments to private operators. However, with respect to commercial electric
power, CEB remains the sole buyer of electricity production to date.27
Renewable energy is viewed as an option for increasing energy independence and reducing the reliance on expensive
energy imports in the country. Consequently, the national objective is to increase the electricity production and to
promote a significant contribution of renewable energy to the overall energy supply of Benin. The stated objective of
government policy is to cover the whole territory within the next two decades.
In order to enable consistent resources to finance rural electrification, the government has created a rural electrification
fund (ERF). This fund is drawn from a combination of resources such as state grants, donor funding, grants and
26
PVGIS online – Country information Benin
27 Reegle – Country information Benin
DETAILED PROJECT / PROGRAMME DESCRIPTION GREEN CLIMATE FUND FUNDING PROPOSAL | PAGE 56 OF 165
C bequests and taxes on electricity production. Furthermore, the Solar Electric Light Fund (SELF) has promoted “solar
market gardens” in the country. The SELF project couples solar PV units (1.5–3 kW) with drip irrigation systems. In
sum, Benin added 100 units of solar PV (pico) and set up 50 kWp solar powerpacks in 2014 that resulted in the
electrification of 250 people.28
Kenya The potential for photovoltaic energy for Kenya is good with an irradiation of 6.32kW/m2/day
29. Currently, PV
installations are mainly used for telecommunication, cathodic protection of pipelines, lighting and water pumping.30
There is an abundance of solar power potential given sufficient non-cultivated land available.
The regulatory framework for renewable energy production has become more attractive. The Ministry of Energy is
actively promoting the use of solar energy for off-grid electrification. In particular, it has funded the Solar for Schools
Program and is targeting to extend this to off-grid clinics and dispensaries. Through the Sessional Paper No. 4 of 2004,
the Energy Act of 2006 and the Feed-in-Tariff (FiT) policy, the Government is committed to promoting electricity
generation from Renewable Energy Sources (RES).31
Additionally, according to the Draft Energy Bill 2015, the
government has proposed a net metering system agreement for renewable power generation of 1MW or below. Finally
tax-based policy offers an exemption from value added tax (VAT) for supplies bought or imported for the construction of
power-generating plants.
The electricity sector in Kenya is relatively modern with independent power producers (IPPs) providing around 27% of
the generated energy. However, the main problem in the sector is that existing capacity is barely able to meet peak
demand, thus small-scale renewables have a role to play.32
According to “Kenya Vision 2030” it is intended that
renewable energy will play an increasingly important role in mini-grids also. The development of hybrid mini-grids is one
of the Kenya’s important projects within the Scaling-Up Renewable Energy Program (SREP).
Kenya remains the primary target for impact investors. There are about 4 million households in rural Kenya alone which
present a vast potential for this virtually untapped technology. The off grid market is estimated to be over 40MW.
Namibia Namibia has one of the best solar regimes in the world with an average solar irradiation of 6.33 kWh/m2/day
33. There is
sufficient non-cultivated land available, so potential competition against arable land is very unlikely and should be
assessed prior to any investment within the Environmental and Social Impact Assessment.
The Namibian national government supports (renewable) rural energy production primarily by means of feed-in tariffs,
capital subsidies, and reduction in taxes, mainly through the Ministry of Mines and Energy supported by the Renewable
Energy and Energy Efficiency Institute and mandated by the Energy White Paper of 1998. In addition the country has
launched an Off-Grid Energisation Master Plan (OGEMP) to support the roll-out of renewable energy systems to
provide access to appropriate energy technologies to communities living in off-grid areas, through solar electrification of
public institutions, establishment of Energy Shops and credit financing for solar technologies.
Despite numerous efforts, the experience to date of RE powered mini grids in Namibia is limited to government and
donor initiated pilot projects. Regional electricity distributors appear to be unwilling to take ownership of mini-grids citing
lack of viability.34
28
REN 21 – Global report 29
PVGIS online – Country information Kenya 30
Scaling-up Renewable Energy Program (SREP). Investment plan for Kenya, 2011 31
Bloomberg New Energy Finance, 2015 32
Technical and Economical Study for the Development of Small Scale Grid Connected Renewable Energy in Kenya, 2012 33
PVGIS online – Country information Namibia
DETAILED PROJECT / PROGRAMME DESCRIPTION GREEN CLIMATE FUND FUNDING PROPOSAL | PAGE 57 OF 165
C Although the current energy market is strongly dominated by the national energy supplier NamPower, the government’s
energy policy clearly seeks to stimulate the involvement of independent power producers (IPPs) in the Namibian
electricity market to help overcome the forecast short-/mid-term deficit. Namibia’s Vision 2030 policy document states
that the government’s objective is that by 2030 Namibia will be “largely self sufficient with reliable and competitively
priced energy, meeting industry demands, plus some export of energy”. Namibia’s Electricity Act provides for private
participation in the sector.
NamPower has engaged in negotiations for Power Purchase Agreements and Transmission Connection Agreements
with Diaz Power (wind power generation) and GreeNam (solar PV). Moreover, the Ministry of Mines and Energy has
implemented the Renewable Energy Procurement Mechanism that requires tendering for all renewable energy projects
larger than 5MW in size.35
Nigeria Nigeria has an enormous solar energy potential with solar radiation of about 5410 kWh/m2/day
36. The government is in
charge of the electricity distribution and generation in the nation under the umbrella of Power Holding Company of
Nigeria PHCN, which was formerly called National Electric Power Authority. During 2012/2013 Nigeria has been
privatizing the state-owned Power Holding Company of Nigeria (PHCN) with the intention to increase investments and
increase the total generation capacity.
While the development of renewable energy technologies in Nigeria has been slow to date, liberalization has led to
private sector participation in the electricity generation sector in general, and a number of operational IPPs in the
country today. Establishment of off-grid generation is encouraged by the government through a moratorium on import
duties for renewable energy technologies, tax credits, capital incentives and preferential loan opportunities for
renewable energy projects, feed-in tariffs for solar energy, wind power and small-hydro. There are several on-grid
photovoltaic projects in the pipeline which are expected to be constructed over the next years.
Tanzania Tanzania has high levels of solar irradiation of 6.43kWh/m2/day
37. Solar resources are especially good in the central
region of the country, and are being developed both for off-grid and grid-connected solutions. There is sufficient non-
cultivated land available, so potential competition against arable land is very unlikely and should be assessed prior to
any investment within the Environmental and Social Impact Assessment.
The Tanzanian national government supports (renewable) rural energy production, primarily by means of feed-in tariffs,
capital subsidies, and reduction in taxes, mainly through the Ministry of Energy and Minerals, mandated by Rural
Energy Act (2005) and the Electricity Act (2008). These mandates aim to increase energy access through the
Renewable Energy Board, Fund and Agency, exemplified by the procurement of a USD 250m loan to fund roads and
rural electrification.
The contribution of the private sector is significant and encouraged. Only 59% of total capacity is supplied by
TANESCO, while IPPs and Emergency Power Producers (EPPs) provide 26% and 13% respectively, which they sell
wholesale to TANESCO.
Since 2009, Tanzania has been implementing the so-called Small Power Projects (SPP) program geared towards the
promotion of private sector participation in the power sector, but also for renewable energy scale-up and accelerated
electricity access to the Tanzanian population. The SPP program allows small renewable and co-generation facilities of
34
Economic Consulting Associates: Namibia Case Study – Gap Analysis and National Action Plan; January 2014 35
GIIN The landscape for impact investing in East Africa Tanzania, August 2015 36
PVGIS online – Country information Nigeria
37 PVGIS online – Country information Tanzania
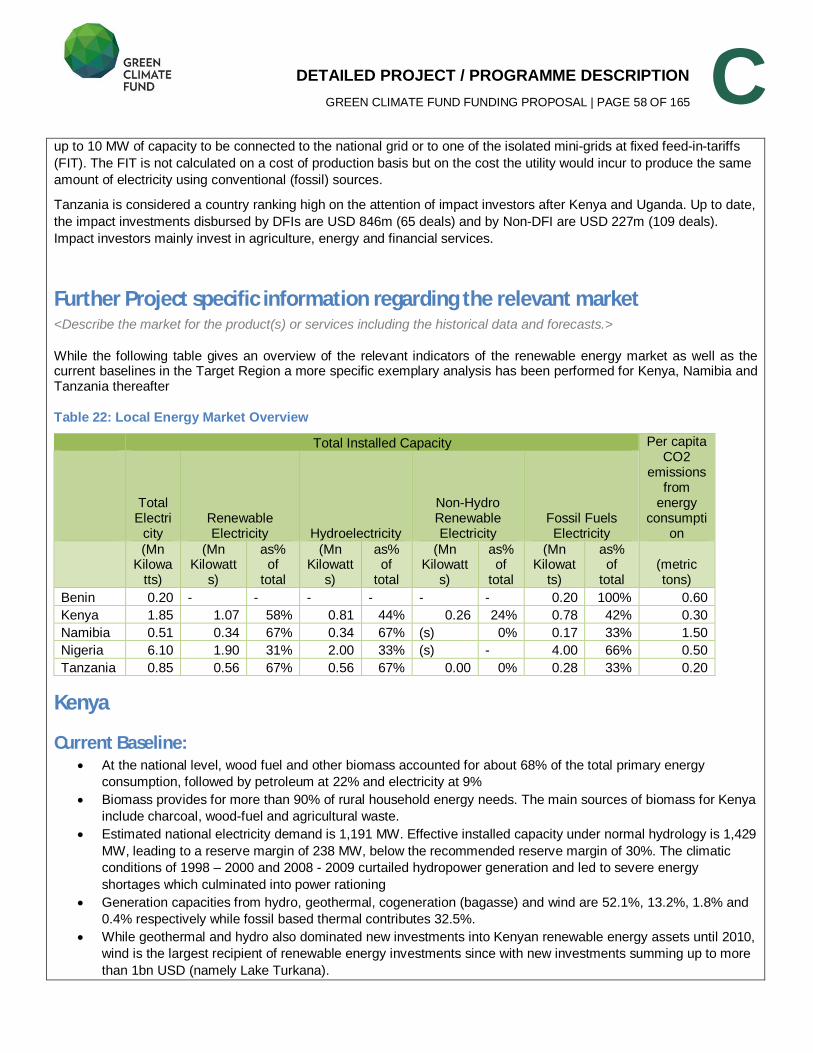
DETAILED PROJECT / PROGRAMME DESCRIPTION GREEN CLIMATE FUND FUNDING PROPOSAL | PAGE 58 OF 165
C up to 10 MW of capacity to be connected to the national grid or to one of the isolated mini-grids at fixed feed-in-tariffs
(FIT). The FIT is not calculated on a cost of production basis but on the cost the utility would incur to produce the same
amount of electricity using conventional (fossil) sources.
Tanzania is considered a country ranking high on the attention of impact investors after Kenya and Uganda. Up to date,
the impact investments disbursed by DFIs are USD 846m (65 deals) and by Non-DFI are USD 227m (109 deals).
Impact investors mainly invest in agriculture, energy and financial services.
Further Project specific information regarding the relevant market <Describe the market for the product(s) or services including the historical data and forecasts.>
While the following table gives an overview of the relevant indicators of the renewable energy market as well as the current baselines in the Target Region a more specific exemplary analysis has been performed for Kenya, Namibia and Tanzania thereafter
Table 22: Local Energy Market Overview
Total Installed Capacity Per capita CO2
emissions from
energy consumpti
on
Total Electri
city Renewable Electricity Hydroelectricity
Non-Hydro Renewable Electricity
Fossil Fuels Electricity
(Mn Kilowa
tts)
(Mn Kilowatt
s)
as% of
total
(Mn Kilowatt
s)
as% of
total
(Mn Kilowatt
s)
as% of
total
(Mn Kilowat
ts)
as% of
total (metric tons)
Benin 0.20 - - - - - - 0.20 100% 0.60
Kenya 1.85 1.07 58% 0.81 44% 0.26 24% 0.78 42% 0.30
Namibia 0.51 0.34 67% 0.34 67% (s) 0% 0.17 33% 1.50
Nigeria 6.10 1.90 31% 2.00 33% (s) - 4.00 66% 0.50
Tanzania 0.85 0.56 67% 0.56 67% 0.00 0% 0.28 33% 0.20
Kenya
Current Baseline: At the national level, wood fuel and other biomass accounted for about 68% of the total primary energy
consumption, followed by petroleum at 22% and electricity at 9%
Biomass provides for more than 90% of rural household energy needs. The main sources of biomass for Kenya
include charcoal, wood-fuel and agricultural waste.
Estimated national electricity demand is 1,191 MW. Effective installed capacity under normal hydrology is 1,429
MW, leading to a reserve margin of 238 MW, below the recommended reserve margin of 30%. The climatic
conditions of 1998 – 2000 and 2008 - 2009 curtailed hydropower generation and led to severe energy
shortages which culminated into power rationing
Generation capacities from hydro, geothermal, cogeneration (bagasse) and wind are 52.1%, 13.2%, 1.8% and
0.4% respectively while fossil based thermal contributes 32.5%.
While geothermal and hydro also dominated new investments into Kenyan renewable energy assets until 2010,
wind is the largest recipient of renewable energy investments since with new investments summing up to more
than 1bn USD (namely Lake Turkana).
DETAILED PROJECT / PROGRAMME DESCRIPTION GREEN CLIMATE FUND FUNDING PROPOSAL | PAGE 59 OF 165
C Government is undertaking efforts to provide lighting and water pumping PV installations to public institutions in
Arid and Semi-Arid Lands where there is no access to the grid. These institutions are mainly primary and
secondary schools, Dispensaries, Health Centres, Administration units and public water wells. According to the
National Energy Plan targets for solar energy are 100MW by 2017, 200MW by 2022 and 500MW by 2030.
The national electrification rate is only about 23%, in rural areas lower.
Over 80% of households in the rural areas rely on firewood for cooking compared to 10% of urban households.
Charcoal is the second most popular type of cooking fuel used by 13.3 % of households.
Kerosene-based lamps are the leading source of lighting for Kenyan households2. Over 79% of households use
paraffin lamps. Electricity is the second most common source of lighting about 14% while paraffin is the most
predominant in rural areas (87% of rural households).
Market Potential Population density of 80 persons living per km² makes it economically unviable to build a national grid that
reaches out to 100% of the population;
Isolated grids or decentralized production facilities will have to be an inherent component of the Kenyan energy
supply system and actually include the opportunity to “by-pass” the Northern design of electricity supply through
a distribution network all over the country, similar to the mobile telecommunication networks;
The national electrification target of the Government of Kenya as set out in the Vision 2030 is to achieve 100%
connectivity by 2030 with an interim target of 65% by 2020. Currently, only 30% of the households are
connected to electricity.38
At this stage, mini-grids are only playing a relatively minor role in supplying electricity to Kenyan households.
Currently 21 mini-grid stations are in operation, another 10 are under construction. These mini-grids are mainly
supplied through diesel-based generation and are operated by Kenya Power and Lighting Company (KPLC),
the electricity distribution company also responsible for managing the national grid. That means that electricity
consumption in the existing mini-grid systems is heavily subsidized through the tariff structure (cross subsidies).
The Kenyan Ministry of Energy and Petroleum (MoEP) plans to convert the existing mini-grids from diesel-
based generation to hybrid generation (based on Solar PV and/or wind) to improve the cost efficiency of
operations and to reduce carbon emissions. Government seeks to actively integrate the private sector to
achieve this goal.
The UGEAP offers the chance to challenge this forecast and contribute to further increasing the share of
renewable energies in the Kenyan energy mix by addressing the following market segments:
Retail segment (B2C):
Less than 20% of the rural population have access to electricity and are not connected to the national grid. In the
off-grid areas, mainly in the north and east of Kenya, KPLC and KenGen provide power by means of diesel power
plants which supply a small isolated distribution network. However, the off-grid power plants listed in Table 7 only
generate energy for 0.8% of the total electricity sales in the country. This leaves a significant market potential for
investments of Category 1 and 2 Project types with a peak demand of 9,040kW in off-grid areas which is expected
to increase to over 15,000kW by 2020.
Table 23: Off-Grid Power Plants Kenya39
38
Government of Kenya, “ Vision 2030”, 2007 39
The Kenya Power & Lighting Company Limited, “Kenya Distribution Master Plan Vol. I”, April 2013
DETAILED PROJECT / PROGRAMME DESCRIPTION GREEN CLIMATE FUND FUNDING PROPOSAL | PAGE 60 OF 165
C
Commercial segment (B2B)
As outlined in the table below, diesel oil, which is mainly used for backup generators, still plays a decisive role in
the industrial energy mix (on average 12%) in Kenya. Therefore there is a large demand for Project No. 3 which
will play a key role in reducing the use of diesel oil and therewith contribute to lower energy costs and less carbon
emissions.
Namibia Current Baseline:40
Estimated national energy demand is 1,713 mtoe;
Biomass fuels (i.e. wood and charcoal) account for over 18% of primary energy supply, oil products 64%, hydro
7% and electricity 7%;
Total grid installed capacity 393 MW and the interconnector capacity stands at 900 MW
Of the total production and grid capacity, 63% hydropower and 37% thermal (coal, diesel & gas); share of
renewable energy other than hydro is negligible;
Fuel and mining imports account for 19% of total imports of Namibia which makes RE transaction highly
beneficial from a macroeconomic standpoint;
40% of population without access to electricity, in rural areas 75%;
90 % of rural households use firewood for cooking, 34 % LPG, 9 % paraffin, 8% electricity;
Diesel generators or solar photovoltaic home systems are alternatives not readily available for at least 95% of
the rural population due to high upfront costs and supply chain challenges;
Overall expected growth in power demand lies at 4% per annum reaching a 430MW power deficit by 2015
The share of renewable energy seems particularly high with 71 % of the total primary energy supply (TPES) in
2009 and 98 % of the electricity generated in the country. However traditional biomass accounts for 64 % of the
TPES.
Draft net metering rules are prepared allowing to feed in electricity into the grid (with capacity below 500kW)
which may contribute to the stabilization of the grid as well as support the decentralized expansion of capacity.
Market Potential Population density of 2.8 persons living per km² makes it economically unviable to build a national grid that
40
Sustainable Energy for All, “Rapid Assessment and Gap Analysis for Namibia”, June 2012
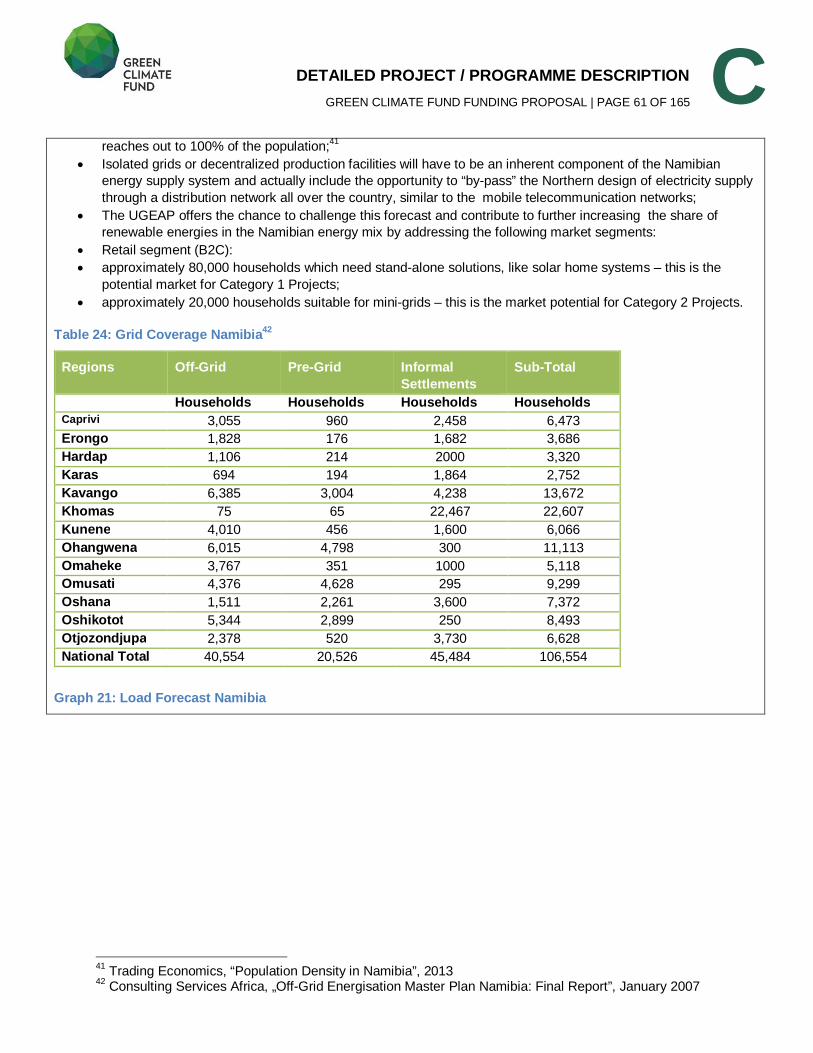
DETAILED PROJECT / PROGRAMME DESCRIPTION GREEN CLIMATE FUND FUNDING PROPOSAL | PAGE 61 OF 165
C reaches out to 100% of the population;
41
Isolated grids or decentralized production facilities will have to be an inherent component of the Namibian
energy supply system and actually include the opportunity to “by-pass” the Northern design of electricity supply
through a distribution network all over the country, similar to the mobile telecommunication networks;
The UGEAP offers the chance to challenge this forecast and contribute to further increasing the share of
renewable energies in the Namibian energy mix by addressing the following market segments:
Retail segment (B2C):
approximately 80,000 households which need stand-alone solutions, like solar home systems – this is the
potential market for Category 1 Projects;
approximately 20,000 households suitable for mini-grids – this is the market potential for Category 2 Projects.
Table 24: Grid Coverage Namibia42
Regions Off-Grid Pre-Grid Informal Settlements
Sub-Total
Households Households Households Households Caprivi 3,055 960 2,458 6,473
Erongo 1,828 176 1,682 3,686
Hardap 1,106 214 2000 3,320
Karas 694 194 1,864 2,752
Kavango 6,385 3,004 4,238 13,672
Khomas 75 65 22,467 22,607
Kunene 4,010 456 1,600 6,066
Ohangwena 6,015 4,798 300 11,113
Omaheke 3,767 351 1000 5,118
Omusati 4,376 4,628 295 9,299
Oshana 1,511 2,261 3,600 7,372
Oshikotot 5,344 2,899 250 8,493
Otjozondjupa 2,378 520 3,730 6,628
National Total 40,554 20,526 45,484 106,554
Graph 21: Load Forecast Namibia
41
Trading Economics, “Population Density in Namibia”, 2013 42
Consulting Services Africa, „Off-Grid Energisation Master Plan Namibia: Final Report”, January 2007
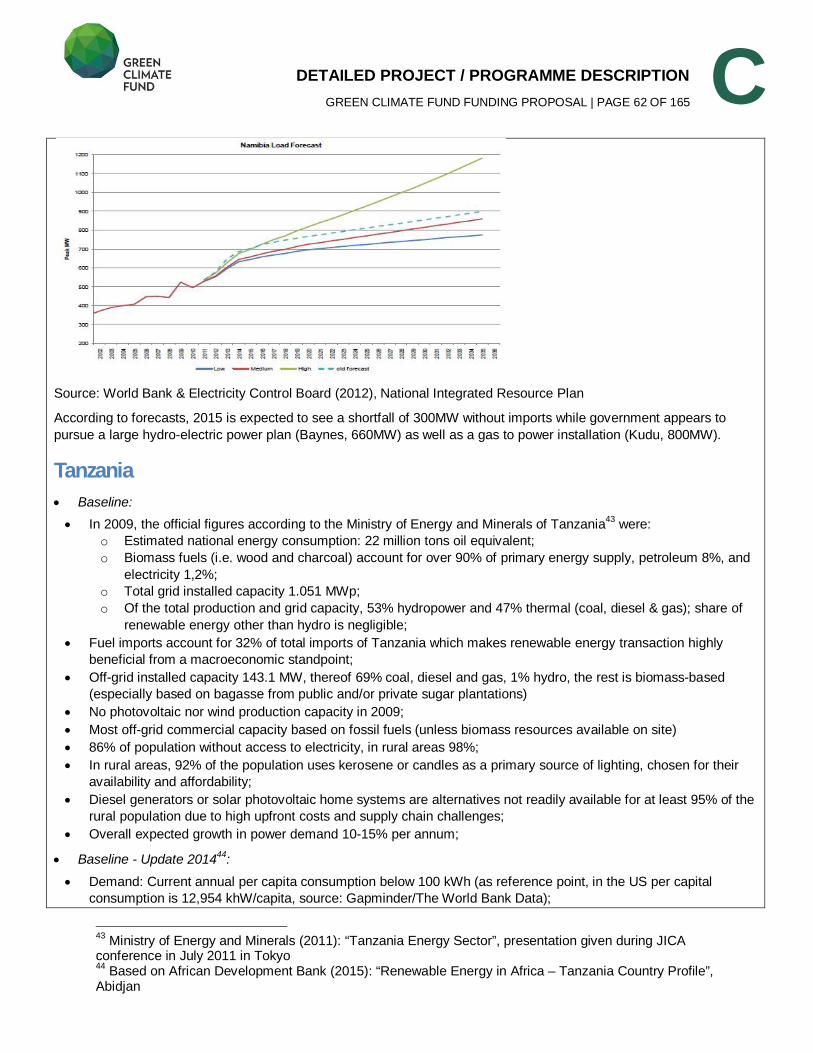
DETAILED PROJECT / PROGRAMME DESCRIPTION GREEN CLIMATE FUND FUNDING PROPOSAL | PAGE 62 OF 165
C
Source: World Bank & Electricity Control Board (2012), National Integrated Resource Plan
According to forecasts, 2015 is expected to see a shortfall of 300MW without imports while government appears to
pursue a large hydro-electric power plan (Baynes, 660MW) as well as a gas to power installation (Kudu, 800MW).
Tanzania Baseline:
In 2009, the official figures according to the Ministry of Energy and Minerals of Tanzania43
were:
o Estimated national energy consumption: 22 million tons oil equivalent;
o Biomass fuels (i.e. wood and charcoal) account for over 90% of primary energy supply, petroleum 8%, and
electricity 1,2%;
o Total grid installed capacity 1.051 MWp;
o Of the total production and grid capacity, 53% hydropower and 47% thermal (coal, diesel & gas); share of
renewable energy other than hydro is negligible;
Fuel imports account for 32% of total imports of Tanzania which makes renewable energy transaction highly
beneficial from a macroeconomic standpoint;
Off-grid installed capacity 143.1 MW, thereof 69% coal, diesel and gas, 1% hydro, the rest is biomass-based
(especially based on bagasse from public and/or private sugar plantations)
No photovoltaic nor wind production capacity in 2009;
Most off-grid commercial capacity based on fossil fuels (unless biomass resources available on site)
86% of population without access to electricity, in rural areas 98%;
In rural areas, 92% of the population uses kerosene or candles as a primary source of lighting, chosen for their
availability and affordability;
Diesel generators or solar photovoltaic home systems are alternatives not readily available for at least 95% of the
rural population due to high upfront costs and supply chain challenges;
Overall expected growth in power demand 10-15% per annum;
Baseline - Update 201444:
Demand: Current annual per capita consumption below 100 kWh (as reference point, in the US per capital
consumption is 12,954 khW/capita, source: Gapminder/The World Bank Data);
43
Ministry of Energy and Minerals (2011): “Tanzania Energy Sector”, presentation given during JICA conference in July 2011 in Tokyo 44
Based on African Development Bank (2015): “Renewable Energy in Africa – Tanzania Country Profile”, Abidjan
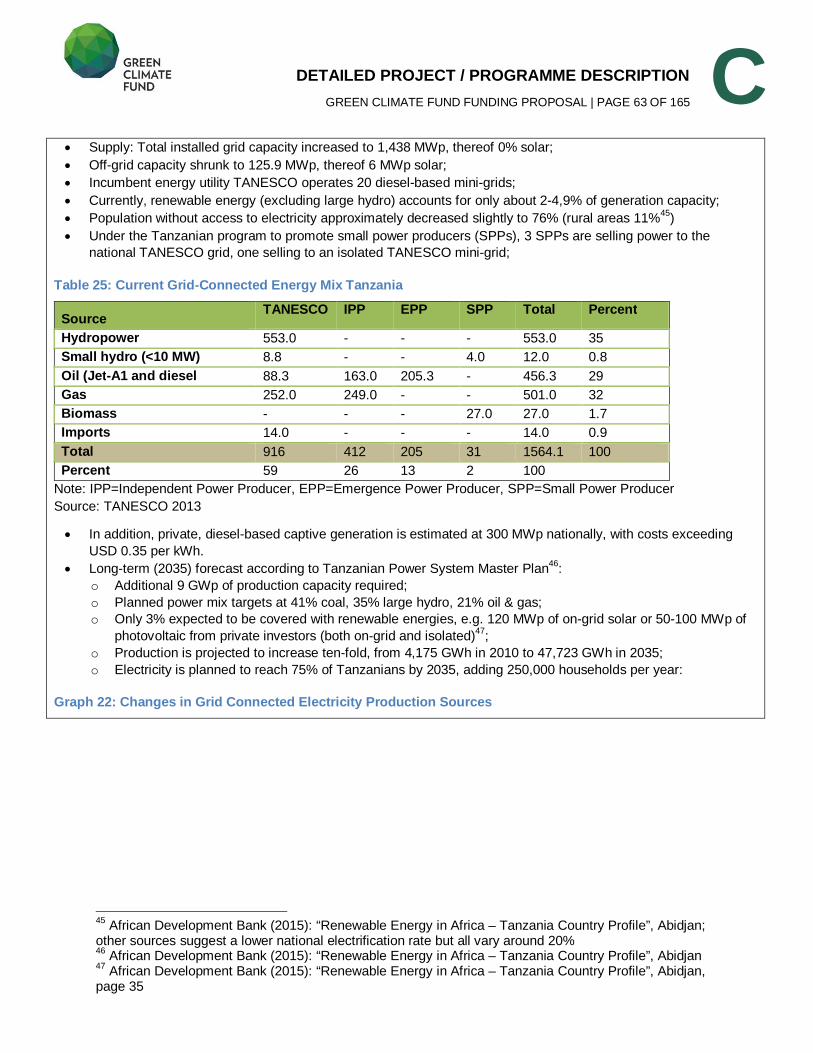
DETAILED PROJECT / PROGRAMME DESCRIPTION GREEN CLIMATE FUND FUNDING PROPOSAL | PAGE 63 OF 165
C Supply: Total installed grid capacity increased to 1,438 MWp, thereof 0% solar;
Off-grid capacity shrunk to 125.9 MWp, thereof 6 MWp solar;
Incumbent energy utility TANESCO operates 20 diesel-based mini-grids;
Currently, renewable energy (excluding large hydro) accounts for only about 2-4,9% of generation capacity;
Population without access to electricity approximately decreased slightly to 76% (rural areas 11%45
)
Under the Tanzanian program to promote small power producers (SPPs), 3 SPPs are selling power to the
national TANESCO grid, one selling to an isolated TANESCO mini-grid;
Table 25: Current Grid-Connected Energy Mix Tanzania
Source TANESCO IPP EPP SPP Total Percent
Hydropower 553.0 - - - 553.0 35 Small hydro (<10 MW) 8.8 - - 4.0 12.0 0.8 Oil (Jet-A1 and diesel 88.3 163.0 205.3 - 456.3 29 Gas 252.0 249.0 - - 501.0 32 Biomass - - - 27.0 27.0 1.7 Imports 14.0 - - - 14.0 0.9 Total 916 412 205 31 1564.1 100 Percent 59 26 13 2 100
Note: IPP=Independent Power Producer, EPP=Emergence Power Producer, SPP=Small Power Producer
Source: TANESCO 2013
In addition, private, diesel-based captive generation is estimated at 300 MWp nationally, with costs exceeding
USD 0.35 per kWh.
Long-term (2035) forecast according to Tanzanian Power System Master Plan46
:
o Additional 9 GWp of production capacity required;
o Planned power mix targets at 41% coal, 35% large hydro, 21% oil & gas;
o Only 3% expected to be covered with renewable energies, e.g. 120 MWp of on-grid solar or 50-100 MWp of
photovoltaic from private investors (both on-grid and isolated)47
;
o Production is projected to increase ten-fold, from 4,175 GWh in 2010 to 47,723 GWh in 2035;
o Electricity is planned to reach 75% of Tanzanians by 2035, adding 250,000 households per year:
Graph 22: Changes in Grid Connected Electricity Production Sources
45
African Development Bank (2015): “Renewable Energy in Africa – Tanzania Country Profile”, Abidjan; other sources suggest a lower national electrification rate but all vary around 20% 46
African Development Bank (2015): “Renewable Energy in Africa – Tanzania Country Profile”, Abidjan 47
African Development Bank (2015): “Renewable Energy in Africa – Tanzania Country Profile”, Abidjan, page 35
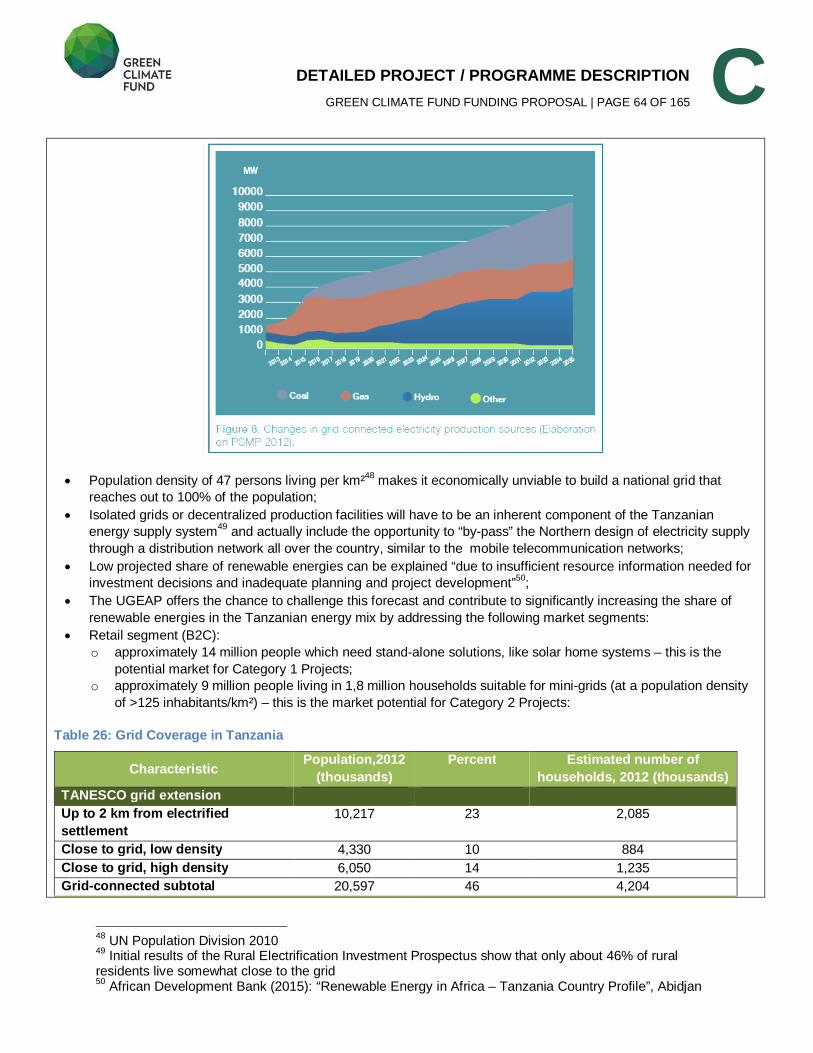
DETAILED PROJECT / PROGRAMME DESCRIPTION GREEN CLIMATE FUND FUNDING PROPOSAL | PAGE 64 OF 165
C
Population density of 47 persons living per km²48
makes it economically unviable to build a national grid that
reaches out to 100% of the population;
Isolated grids or decentralized production facilities will have to be an inherent component of the Tanzanian
energy supply system49
and actually include the opportunity to “by-pass” the Northern design of electricity supply
through a distribution network all over the country, similar to the mobile telecommunication networks;
Low projected share of renewable energies can be explained “due to insufficient resource information needed for
investment decisions and inadequate planning and project development”50
;
The UGEAP offers the chance to challenge this forecast and contribute to significantly increasing the share of
renewable energies in the Tanzanian energy mix by addressing the following market segments:
Retail segment (B2C):
o approximately 14 million people which need stand-alone solutions, like solar home systems – this is the
potential market for Category 1 Projects;
o approximately 9 million people living in 1,8 million households suitable for mini-grids (at a population density
of >125 inhabitants/km²) – this is the market potential for Category 2 Projects:
Table 26: Grid Coverage in Tanzania
Characteristic Population,2012
(thousands) Percent Estimated number of
households, 2012 (thousands) TANESCO grid extension
Up to 2 km from electrified settlement
10,217 23 2,085
Close to grid, low density 4,330 10 884
Close to grid, high density 6,050 14 1,235
Grid-connected subtotal 20,597 46 4,204
48
UN Population Division 2010 49
Initial results of the Rural Electrification Investment Prospectus show that only about 46% of rural residents live somewhat close to the grid 50
African Development Bank (2015): “Renewable Energy in Africa – Tanzania Country Profile”, Abidjan
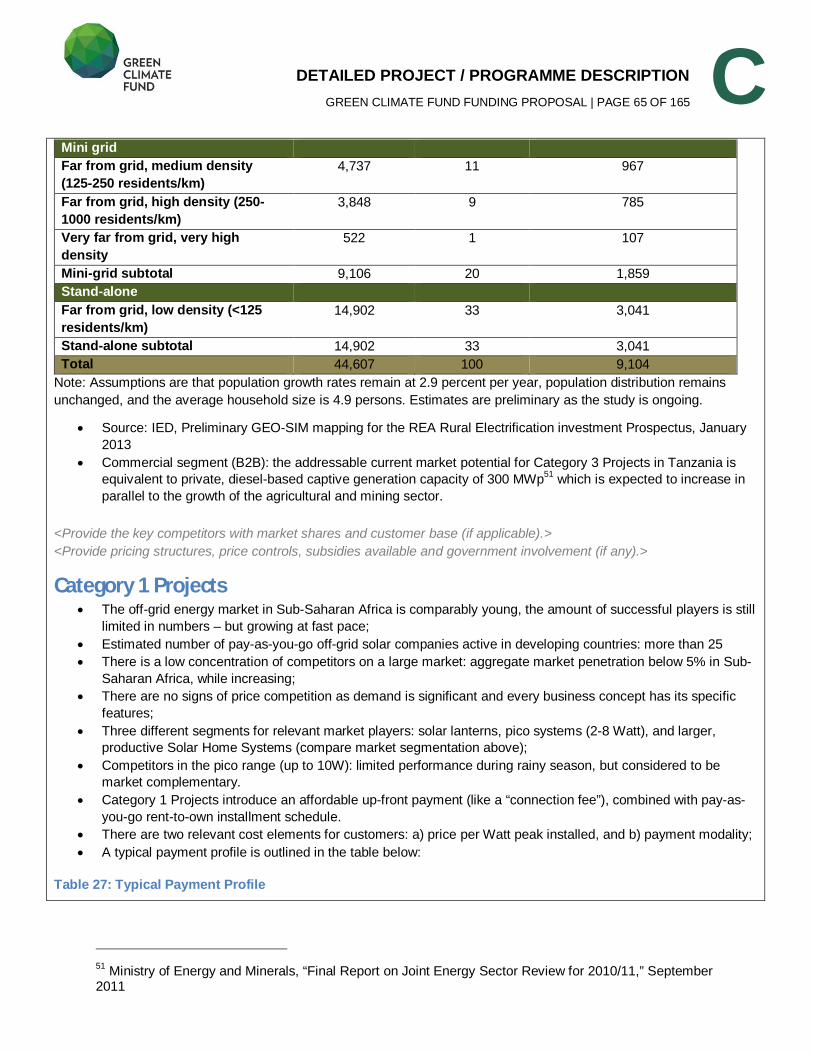
DETAILED PROJECT / PROGRAMME DESCRIPTION GREEN CLIMATE FUND FUNDING PROPOSAL | PAGE 65 OF 165
C Mini grid
Far from grid, medium density (125-250 residents/km)
4,737 11 967
Far from grid, high density (250-1000 residents/km)
3,848 9 785
Very far from grid, very high density
522 1 107
Mini-grid subtotal 9,106 20 1,859
Stand-alone
Far from grid, low density (<125 residents/km)
14,902 33 3,041
Stand-alone subtotal 14,902 33 3,041
Total 44,607 100 9,104
Note: Assumptions are that population growth rates remain at 2.9 percent per year, population distribution remains
unchanged, and the average household size is 4.9 persons. Estimates are preliminary as the study is ongoing.
Source: IED, Preliminary GEO-SIM mapping for the REA Rural Electrification investment Prospectus, January
2013
Commercial segment (B2B): the addressable current market potential for Category 3 Projects in Tanzania is
equivalent to private, diesel-based captive generation capacity of 300 MWp51
which is expected to increase in
parallel to the growth of the agricultural and mining sector.
<Provide the key competitors with market shares and customer base (if applicable).> <Provide pricing structures, price controls, subsidies available and government involvement (if any).>
Category 1 Projects The off-grid energy market in Sub-Saharan Africa is comparably young, the amount of successful players is still
limited in numbers – but growing at fast pace;
Estimated number of pay-as-you-go off-grid solar companies active in developing countries: more than 25
There is a low concentration of competitors on a large market: aggregate market penetration below 5% in Sub-
Saharan Africa, while increasing;
There are no signs of price competition as demand is significant and every business concept has its specific
features;
Three different segments for relevant market players: solar lanterns, pico systems (2-8 Watt), and larger,
productive Solar Home Systems (compare market segmentation above);
Competitors in the pico range (up to 10W): limited performance during rainy season, but considered to be
market complementary.
Category 1 Projects introduce an affordable up-front payment (like a “connection fee”), combined with pay-as-
you-go rent-to-own installment schedule.
There are two relevant cost elements for customers: a) price per Watt peak installed, and b) payment modality;
A typical payment profile is outlined in the table below:
Table 27: Typical Payment Profile
51 Ministry of Energy and Minerals, “Final Report on Joint Energy Sector Review for 2010/11,” September
2011
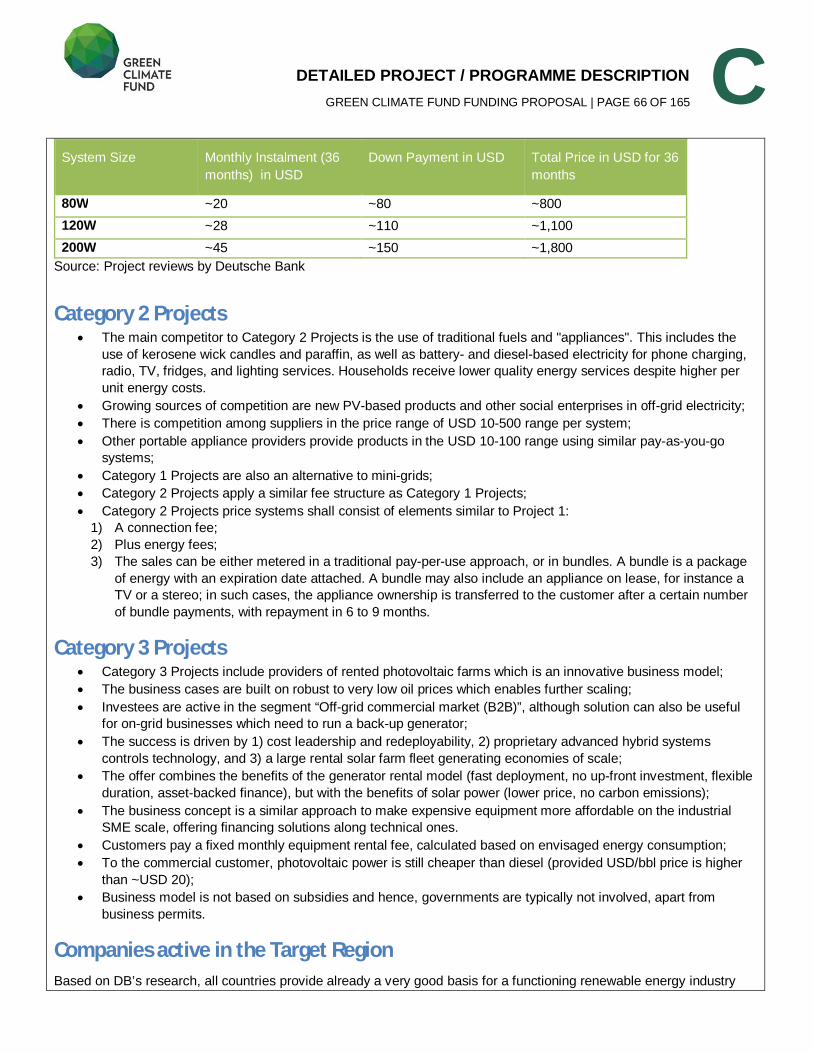
DETAILED PROJECT / PROGRAMME DESCRIPTION GREEN CLIMATE FUND FUNDING PROPOSAL | PAGE 66 OF 165
C System Size Monthly Instalment (36
months) in USD
Down Payment in USD Total Price in USD for 36
months
80W ~20 ~80 ~800 120W ~28 ~110 ~1,100 200W ~45 ~150 ~1,800
Source: Project reviews by Deutsche Bank
Category 2 Projects The main competitor to Category 2 Projects is the use of traditional fuels and "appliances". This includes the
use of kerosene wick candles and paraffin, as well as battery- and diesel-based electricity for phone charging,
radio, TV, fridges, and lighting services. Households receive lower quality energy services despite higher per
unit energy costs.
Growing sources of competition are new PV-based products and other social enterprises in off-grid electricity;
There is competition among suppliers in the price range of USD 10-500 range per system;
Other portable appliance providers provide products in the USD 10-100 range using similar pay-as-you-go
systems;
Category 1 Projects are also an alternative to mini-grids;
Category 2 Projects apply a similar fee structure as Category 1 Projects;
Category 2 Projects price systems shall consist of elements similar to Project 1:
1) A connection fee;
2) Plus energy fees;
3) The sales can be either metered in a traditional pay-per-use approach, or in bundles. A bundle is a package
of energy with an expiration date attached. A bundle may also include an appliance on lease, for instance a
TV or a stereo; in such cases, the appliance ownership is transferred to the customer after a certain number
of bundle payments, with repayment in 6 to 9 months.
Category 3 Projects Category 3 Projects include providers of rented photovoltaic farms which is an innovative business model;
The business cases are built on robust to very low oil prices which enables further scaling;
Investees are active in the segment “Off-grid commercial market (B2B)”, although solution can also be useful
for on-grid businesses which need to run a back-up generator;
The success is driven by 1) cost leadership and redeployability, 2) proprietary advanced hybrid systems
controls technology, and 3) a large rental solar farm fleet generating economies of scale;
The offer combines the benefits of the generator rental model (fast deployment, no up-front investment, flexible
duration, asset-backed finance), but with the benefits of solar power (lower price, no carbon emissions);
The business concept is a similar approach to make expensive equipment more affordable on the industrial
SME scale, offering financing solutions along technical ones.
Customers pay a fixed monthly equipment rental fee, calculated based on envisaged energy consumption;
To the commercial customer, photovoltaic power is still cheaper than diesel (provided USD/bbl price is higher
than ~USD 20);
Business model is not based on subsidies and hence, governments are typically not involved, apart from
business permits.
Companies active in the Target Region Based on DB’s research, all countries provide already a very good basis for a functioning renewable energy industry
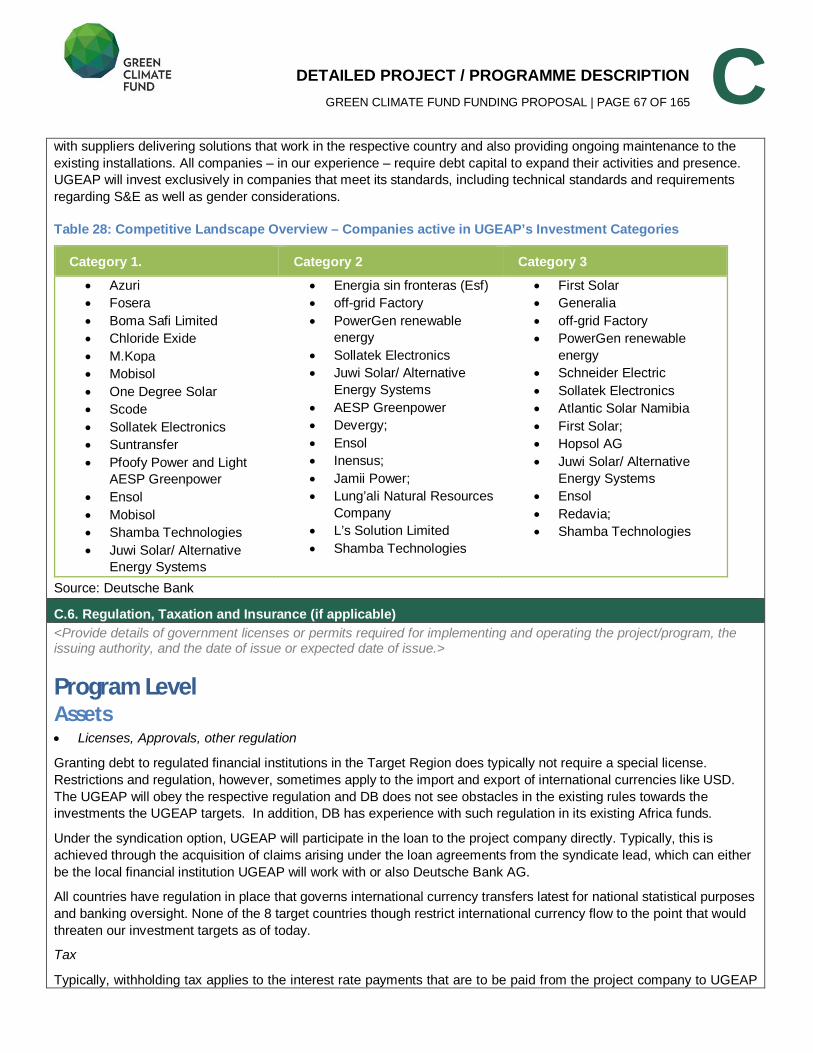
DETAILED PROJECT / PROGRAMME DESCRIPTION GREEN CLIMATE FUND FUNDING PROPOSAL | PAGE 67 OF 165
C with suppliers delivering solutions that work in the respective country and also providing ongoing maintenance to the
existing installations. All companies – in our experience – require debt capital to expand their activities and presence.
UGEAP will invest exclusively in companies that meet its standards, including technical standards and requirements
regarding S&E as well as gender considerations.
Table 28: Competitive Landscape Overview – Companies active in UGEAP’s Investment Categories
Category 1. Category 2 Category 3
Azuri
Fosera
Boma Safi Limited
Chloride Exide
M.Kopa
Mobisol
One Degree Solar
Scode
Sollatek Electronics
Suntransfer
Pfoofy Power and Light
AESP Greenpower
Ensol
Mobisol
Shamba Technologies
Juwi Solar/ Alternative
Energy Systems
Energia sin fronteras (Esf)
off-grid Factory
PowerGen renewable
energy
Sollatek Electronics
Juwi Solar/ Alternative
Energy Systems
AESP Greenpower
Devergy;
Ensol
Inensus;
Jamii Power;
Lung’ali Natural Resources
Company
L’s Solution Limited
Shamba Technologies
First Solar
Generalia
off-grid Factory
PowerGen renewable
energy
Schneider Electric
Sollatek Electronics
Atlantic Solar Namibia
First Solar;
Hopsol AG
Juwi Solar/ Alternative
Energy Systems
Ensol
Redavia;
Shamba Technologies
Source: Deutsche Bank
C.6. Regulation, Taxation and Insurance (if applicable) <Provide details of government licenses or permits required for implementing and operating the project/program, the issuing authority, and the date of issue or expected date of issue.>
Program Level Assets Licenses, Approvals, other regulation
Granting debt to regulated financial institutions in the Target Region does typically not require a special license.
Restrictions and regulation, however, sometimes apply to the import and export of international currencies like USD.
The UGEAP will obey the respective regulation and DB does not see obstacles in the existing rules towards the
investments the UGEAP targets. In addition, DB has experience with such regulation in its existing Africa funds.
Under the syndication option, UGEAP will participate in the loan to the project company directly. Typically, this is
achieved through the acquisition of claims arising under the loan agreements from the syndicate lead, which can either
be the local financial institution UGEAP will work with or also Deutsche Bank AG.
All countries have regulation in place that governs international currency transfers latest for national statistical purposes
and banking oversight. None of the 8 target countries though restrict international currency flow to the point that would
threaten our investment targets as of today.
Tax
Typically, withholding tax applies to the interest rate payments that are to be paid from the project company to UGEAP
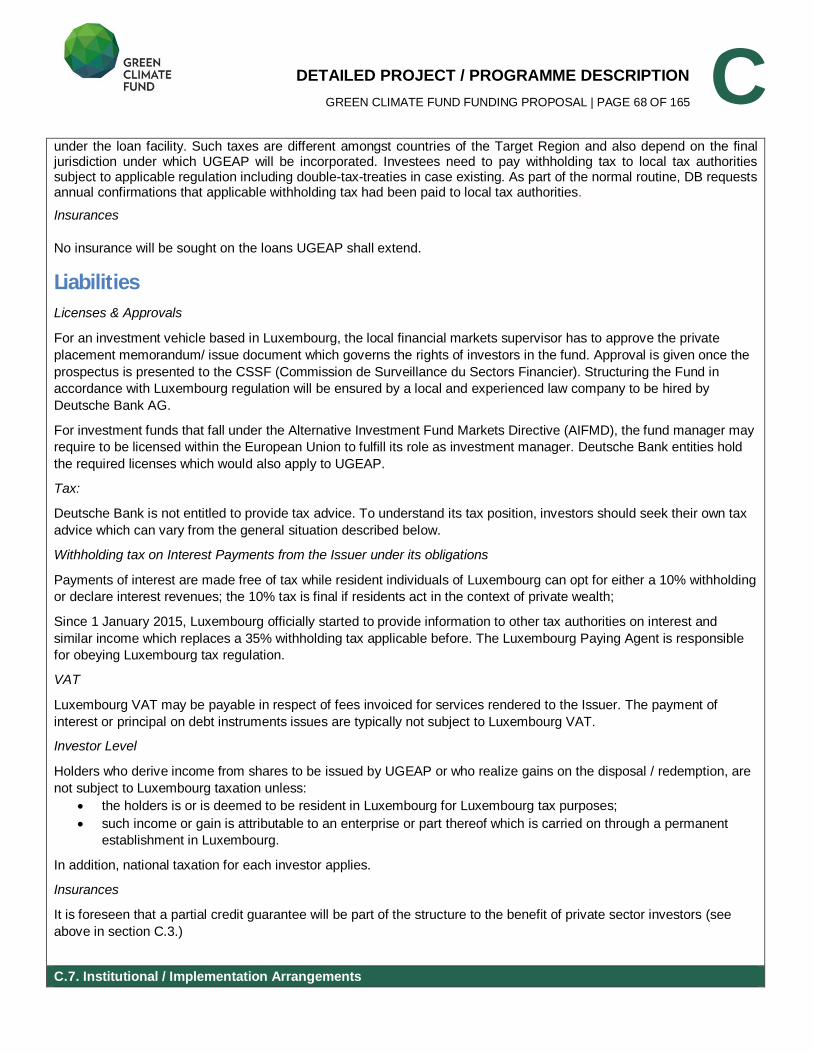
DETAILED PROJECT / PROGRAMME DESCRIPTION GREEN CLIMATE FUND FUNDING PROPOSAL | PAGE 68 OF 165
C under the loan facility. Such taxes are different amongst countries of the Target Region and also depend on the final jurisdiction under which UGEAP will be incorporated. Investees need to pay withholding tax to local tax authorities subject to applicable regulation including double-tax-treaties in case existing. As part of the normal routine, DB requests annual confirmations that applicable withholding tax had been paid to local tax authorities.
Insurances
No insurance will be sought on the loans UGEAP shall extend.
Liabilities Licenses & Approvals
For an investment vehicle based in Luxembourg, the local financial markets supervisor has to approve the private
placement memorandum/ issue document which governs the rights of investors in the fund. Approval is given once the
prospectus is presented to the CSSF (Commission de Surveillance du Sectors Financier). Structuring the Fund in
accordance with Luxembourg regulation will be ensured by a local and experienced law company to be hired by
Deutsche Bank AG.
For investment funds that fall under the Alternative Investment Fund Markets Directive (AIFMD), the fund manager may
require to be licensed within the European Union to fulfill its role as investment manager. Deutsche Bank entities hold
the required licenses which would also apply to UGEAP.
Tax:
Deutsche Bank is not entitled to provide tax advice. To understand its tax position, investors should seek their own tax
advice which can vary from the general situation described below.
Withholding tax on Interest Payments from the Issuer under its obligations
Payments of interest are made free of tax while resident individuals of Luxembourg can opt for either a 10% withholding
or declare interest revenues; the 10% tax is final if residents act in the context of private wealth;
Since 1 January 2015, Luxembourg officially started to provide information to other tax authorities on interest and
similar income which replaces a 35% withholding tax applicable before. The Luxembourg Paying Agent is responsible
for obeying Luxembourg tax regulation.
VAT
Luxembourg VAT may be payable in respect of fees invoiced for services rendered to the Issuer. The payment of
interest or principal on debt instruments issues are typically not subject to Luxembourg VAT.
Investor Level
Holders who derive income from shares to be issued by UGEAP or who realize gains on the disposal / redemption, are
not subject to Luxembourg taxation unless:
the holders is or is deemed to be resident in Luxembourg for Luxembourg tax purposes;
such income or gain is attributable to an enterprise or part thereof which is carried on through a permanent
establishment in Luxembourg.
In addition, national taxation for each investor applies.
Insurances
It is foreseen that a partial credit guarantee will be part of the structure to the benefit of private sector investors (see
above in section C.3.)
C.7. Institutional / Implementation Arrangements
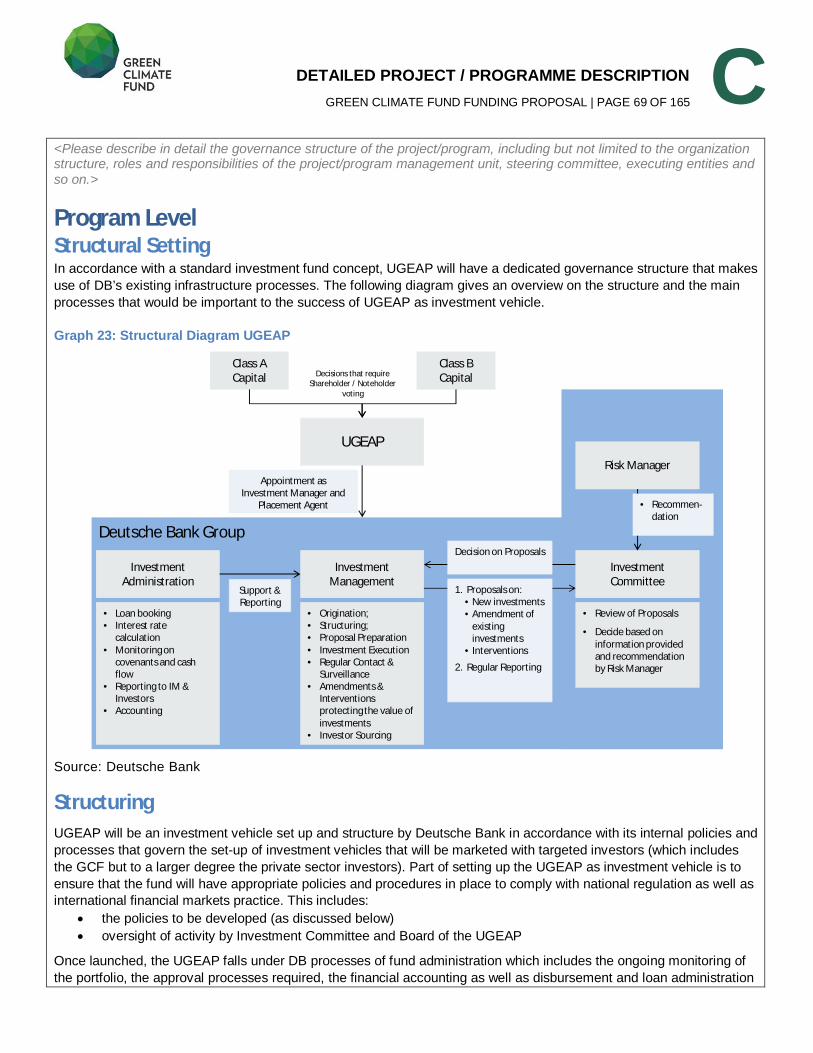
DETAILED PROJECT / PROGRAMME DESCRIPTION GREEN CLIMATE FUND FUNDING PROPOSAL | PAGE 69 OF 165
C <Please describe in detail the governance structure of the project/program, including but not limited to the organization structure, roles and responsibilities of the project/program management unit, steering committee, executing entities and so on.>
Program Level Structural Setting In accordance with a standard investment fund concept, UGEAP will have a dedicated governance structure that makes
use of DB’s existing infrastructure processes. The following diagram gives an overview on the structure and the main
processes that would be important to the success of UGEAP as investment vehicle.
Graph 23: Structural Diagram UGEAP
Source: Deutsche Bank
Structuring UGEAP will be an investment vehicle set up and structure by Deutsche Bank in accordance with its internal policies and
processes that govern the set-up of investment vehicles that will be marketed with targeted investors (which includes
the GCF but to a larger degree the private sector investors). Part of setting up the UGEAP as investment vehicle is to
ensure that the fund will have appropriate policies and procedures in place to comply with national regulation as well as
international financial markets practice. This includes:
the policies to be developed (as discussed below)
oversight of activity by Investment Committee and Board of the UGEAP
Once launched, the UGEAP falls under DB processes of fund administration which includes the ongoing monitoring of
the portfolio, the approval processes required, the financial accounting as well as disbursement and loan administration
Deutsche Bank Group
UGEAP
Class A Capital
Class B CapitalDecisions that require
Shareholder / Noteholdervoting
Investment Management
Risk Manager
Investment Administration
• Origination;• Structuring;• Proposal Preparation• Investment Execution• Regular Contact &
Surveillance• Amendments &
Interventionsprotecting the value ofinvestments
• Investor Sourcing
1. Proposals on:• New investments• Amendment of
existinginvestments
• Interventions
2. Regular Reporting
• Loan booking• Interest rate
calculation• Monitoring on
covenants and cash flow
• Reporting to IM & Investors
• Accounting
Decision on Proposals
Support & Reporting
• Review of Proposals
• Decide based on information providedand recommendationby Risk Manager
Investment Committee
• Recommen-dation
Appointment asInvestment Manager and
Placement Agent
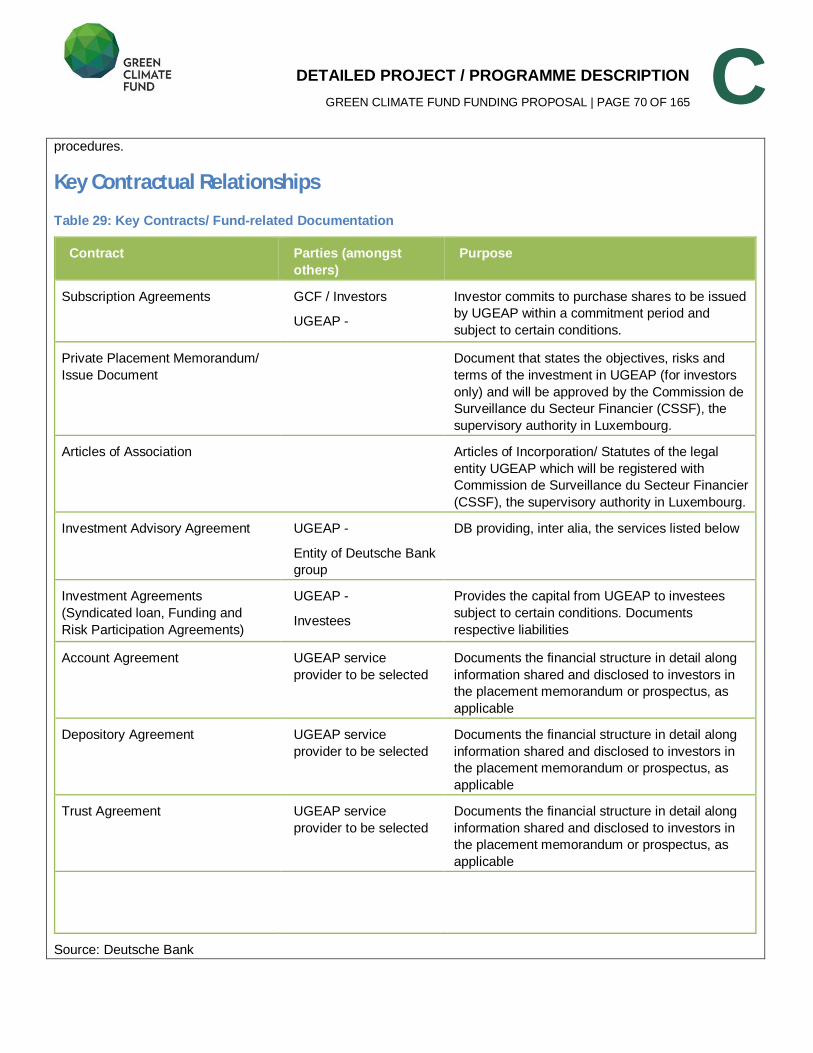
DETAILED PROJECT / PROGRAMME DESCRIPTION GREEN CLIMATE FUND FUNDING PROPOSAL | PAGE 70 OF 165
C procedures.
Key Contractual Relationships
Table 29: Key Contracts/ Fund-related Documentation
Contract Parties (amongst others)
Purpose
Subscription Agreements GCF / Investors
UGEAP -
Investor commits to purchase shares to be issued
by UGEAP within a commitment period and
subject to certain conditions.
Private Placement Memorandum/
Issue Document
Document that states the objectives, risks and
terms of the investment in UGEAP (for investors
only) and will be approved by the Commission de
Surveillance du Secteur Financier (CSSF), the
supervisory authority in Luxembourg.
Articles of Association Articles of Incorporation/ Statutes of the legal
entity UGEAP which will be registered with
Commission de Surveillance du Secteur Financier
(CSSF), the supervisory authority in Luxembourg.
Investment Advisory Agreement UGEAP -
Entity of Deutsche Bank
group
DB providing, inter alia, the services listed below
Investment Agreements
(Syndicated loan, Funding and
Risk Participation Agreements)
UGEAP -
Investees
Provides the capital from UGEAP to investees
subject to certain conditions. Documents
respective liabilities
Account Agreement UGEAP service
provider to be selected
Documents the financial structure in detail along
information shared and disclosed to investors in
the placement memorandum or prospectus, as
applicable
Depository Agreement UGEAP service
provider to be selected
Documents the financial structure in detail along
information shared and disclosed to investors in
the placement memorandum or prospectus, as
applicable
Trust Agreement UGEAP service
provider to be selected
Documents the financial structure in detail along
information shared and disclosed to investors in
the placement memorandum or prospectus, as
applicable
Source: Deutsche Bank
DETAILED PROJECT / PROGRAMME DESCRIPTION GREEN CLIMATE FUND FUNDING PROPOSAL | PAGE 71 OF 165
C Board of UGEAP As an investment fund, UGEAP will have a Board of Directors that will be proposed by Deutsche Bank to shareholders
investing in the Fund. The Board of Directors will oversee the activity of the investment manager and other service
providers. Board members do not represent interests of a single shareholder. This is to protect minority shareholders
and their interests. It is not foreseen that representatives of the GCF will receive a board seat. The fund documentation
will include the rule that board members will need to include members proposed by DB. In accordance with
Luxembourg legislation, board members represent no single shareholder but are responsible to all shareholders
simultaneously.
Investment Management UGEAP as investment vehicle will appoint Deutsche Bank as Investment Manager (either Deutsche Alternative Asset
Management (Global) Limited (United Kingdom), Reef Spezial Invest GmbH (Germany) or another legal entity being
part of Deutsche Bank group). A sample list of tasks is provided in section C3 above. Under the investment advisory
agreement, UGEAP assigns full authority to the investment manager to execute investments on its behalf and
administer the portfolio of investments.
Certain decisions will require a positive voting from the investors in UGEAP. In line with local legislation (Luxembourg)
this includes mainly changes to the prospectus, which governs the relationship between UGEAP and investors, and that
will be proposed by the investment manager with a recommendation.
The investment management team will be led by a fund manager who will have the overall responsibility of the
mandate. The Fund Manager will oversee a team of investment managers that have the task to support delivery
towards the mandate. The investment management team will have the task to prepare new investments as well as
monitor the existing portfolio of investments, a function which is supported by Investment Administration. Decisions on:
applicable guidelines and policies,
new investments, and
amendments and interventions on existing investments that have an economic impact to the performance of
the investment
require the approval of the “Investment Committee” (IC) which is staffed by about 3 investment specialists with
knowledge and experience regarding the underlying type of investments. The IC will receive a recommendation from
the Risk Manager who will perform an independent review of the proposal submitted by the investment management
team. Decisions from the IC are binding for the Fund Manager who represents the investment management team in the
IC.
The role of the risk manager is to review the proposal from the investment management team and provide his
recommendation to the IC independently. The risk manager will participate in IC meetings.
Guidelines and Policies As mentioned in section C3, the Investment Manager’s actions will be governed, amongst others, further by the
following internally developed and maintained policies and guidelines:
Investment policy;
Asset-liability management policy;
Gender policy applicable to Deutsche Bank Programmes funded by the Green Climate Fund;
Social & Environmental Guidelines;
Operating Guidelines.
All Guidelines and Policies governing UGEAP comply with Deutsche Bank’s internal policies and procedures as
well as with GCF policies and procedures as outlined in B.07/02 – Annex III.
DETAILED PROJECT / PROGRAMME DESCRIPTION GREEN CLIMATE FUND FUNDING PROPOSAL | PAGE 72 OF 165
C Investment Policy The investment policy contains a range of rulings and is prepared by the investment management team:
Investment thesis and targets;
Relevant parties of mandate which include the staffing of the investment management team and the IC;
Detailing the investment decision making process described above;
Definition of eligible investments (including definition of eligible investees) in line with the definition on the
Target Investments;
Ensure that investees will fall within the capacity of DB as accredited entity of the GCF in accordance with the
respective fiduciary principles and standards;
Target region of investment activity (subject to limits);
Definition of eligible investment instruments;
Definition of terms and conditions investment instruments may contain;
Limits on maturities and guidance on pricing structure (which is reviewed routinely);
A range of portfolio composition restrictions and limits to be obeyed during the lifetime of the investment
activities;
Monitoring and reporting process, routines and content of reports to be produced to the benefit of the IC as well
as investors.
The investment policy sets a number of limits that are designed to protect investors against a lack of granularity within
the investment portfolio. Certain limits are also documented in the draft Term Sheet that would apply to the GCF
investment. Additionally, limits apply to the following layers:
Country Level Limits
Single country concentration increases the risks UGEAP is exposed to through its investment activity. Country specific
risk factors are events where sovereigns impose transfer and convertibility restrictions on foreign currency exchange
(measured by T&C risk ratings) as well as systemic risks that affect the whole economy, which includes political and
legal risks (measured by the credit rating of a country).
The investment policy of UGEAP will foresee to limit the exposure of disbursed and committed capital to a single
country as a percentage of the cumulative amount of all investments (disbursed and committed) of UGEAP. The limit is
binding 36 months after the first investments have been executed to allow the portfolio to build up while it is subject to
non-objection statements having been provided by the National Designated Authorities (NDAs) of the five Host
Countries. Limits will apply subject to the internal grading category a country falls into. While the grade is denoted using
the rating scale of international rating agencies, the internal grade would apply:
Table 30: Concentration Limits
Credit Grading Category Investment Grade Investment Grade 30%
BBi 20%
Bi and CCCi 15%
Unratedi 5%
Single Financial Institution Limit
UGEAP is exposed to the credit risk of banks UGEAP lends to under the FRPA structure. A limit will be set to in relation
to the invested capital into a single financial institution in relation to the total investment portfolio of UGEAP.
Investment Instrument Limits
DETAILED PROJECT / PROGRAMME DESCRIPTION GREEN CLIMATE FUND FUNDING PROPOSAL | PAGE 73 OF 165
C UGEAP offers two investment instruments that bear different risk profiles. A relative limit to the total investment portfolio
applicable 36 months after the first investments having being executed will be set.
Single-/Sub-Borrower Limits
Finally, UGEAP is exposed to the credit risk from single borrowers that are either part of the Reference Portfolio or
UGEAP lends to directly through the syndicated loan structure. A relative limit to the total investment portfolio applicable
36 months after the first investments having being executed will be set on the exposure to single borrowers (either as
being part of the Reference Portfolio or via the syndicated loan structure).
Selection of Financial Institutions The investment policy will further detail the selection criteria for the single transactions the UGEAP will take a risk
position on as well as the local financial institutions UGEAP will either finance (FRP structure) or work jointly with
(Syndication Option).
Bank’s are chosen after a careful risk analysis that spans over the following areas:
Financial position and strength
Governance and ownership structure
Quality of management
Risk controls and procedures
Regulatory status and quality of local regulator
S&E Management Systems
Financial Analysis
Deutsche Bank will employ a detailed financial risk analysis that covers the following areas:
growth of the bank;
loan book quality / customer type / NPL, provisions, collateral / related party exposure
granularity of the loan book / industry concentrations / regional concentration
liquidity position of the bank
profitability split by types of income (interest, fee, other)
cost base and development
funding base including costs of funding and maturity structure
recourse to “lenders of last resort” or other connections with long term capital providers like DFIs
equity (ideally Basel III standards)
Banks have to show the financial capability to serve the debt capital UGEAP would invest through and with the bank.
Governance & Ownership Structure Banks are screened against the international standards on AML & ATF;
Further, banks are expected to have a transparent and shareholder value orientated governance structure.
Related party exposures have to stay below a given minimum;
Banks with a strong ownership structure are preferred in order to allow for growth of the bank beyond the
inherent profitability;
Quality of Management Management capabilities will be screened across the hierarchy to assess the technical capabilities and the
required experience to manage the bank on the back of its market position and size;
Board members are screened in line with international AML & ATF standards;
Risk Controls and Procedures On-site due diligence is performed to analyze the routines and procedures that are in place;
DETAILED PROJECT / PROGRAMME DESCRIPTION GREEN CLIMATE FUND FUNDING PROPOSAL | PAGE 74 OF 165
C Processes have to be adequate for the size and the complexity the bank is active in.
Regulatory Status Banks are expected to be regulated by local banking supervising authorities;
quality and effectiveness of the supervision is analyzed as part of the due diligence process;
Banks are expected to be in compliance with prudential ratios in accordance with local banking regulation.
S&E Management Systems All banks UGEAP will work with are expected to have an appropriate Social and Environmental Management
System to be in place;
In case of deviations between UGEAP’s standards and the bank’s processes, remedial actions may be agreed
in the loan documentation;
Documentation The agreements between the UGEAP and (i) banks under the Funding and Risk Participation Agreement as well as (ii)
borrowers under the syndicated loans will include, based on templates that will have been developed by a reputable,
internationally active legal counsel, a clear documentation of the following points::
financial rights and liabilities;
maturities and time lines;
reporting requirements
warranties and covenants which includes adherence to S&E standards, financial covenants as well as
adherence to national law and international best practice;
conditions precedent to the first disbursement (which includes the requirement for all licenses and permits to be
valid as well as an social and environmental impact assessment in case standards of UGEAP require this);
conditions subsequent for follow up disbursements;
rights for investigation and inspection by the investment manager;
event of defaults and mandatory prepayment clauses;
a list of exclusions on both, the bank wide level as well as the portfolio of loans that are granted using the
funding facilitated by UGEAP which will match the one UGEAP will be bound to;
eligibility criteria that will be matched with those of the UGEAP on the selection of projects that deliver to the
targets on:
o CO2e emission reductions within the limits that would apply to the UGEAP;
o gender specific targets and requirements;
o additional socio-economic benefits UGEAP targets
Essentially loan documentation is a mirror of the setting of the UGEAP in terms of targets and limitations with regards to
the businesses it expects to finance and the S&E as well as gender specific aspects to be obeyed.
In case due diligence on banks identifies weaknesses, like a still acceptable deviation from UGEAP’s expectations on a
working and acceptable S&E management system with the bank, the agreement may include covenants on pre-defined
action to be taken.
Non-adherence may lead to a mandatory prepayment event or an event of default.
Asset-Liability Management Policy UGEAP is a closed end investment vehicle with a changing asset and liability profile. The yield for investors will depend
on the interest income actually received from the invested assets and expenses to various service providers of the
UGEAP. It is the task of the Fund Manager to maximize the available interest income. Certain risks can be hedged and
are subject to management and discretion of the Fund Manager hedging them or not while other risks are to be
mitigated structurally through decisions on capital demand and supply.
DETAILED PROJECT / PROGRAMME DESCRIPTION GREEN CLIMATE FUND FUNDING PROPOSAL | PAGE 75 OF 165
C Assets and liabilities of the UGEAP are expected to have different financial and credit terms. Hence, investors are
exposed to the following risks that can negatively impact their return as well as potentially the capital repayments
UGEAP would be able to make:
Maturity Mismatch: Mismatch in the timing of payments UGEAP is entitled to receive and the timing of
payments UGEAP is expected or required to make.
Currency Risks: The currency in which assets are denominated may be different to that of the shares.
Interest Rate Risk: interest income on the assets may be different to expected coupon payments on the
shares.
Assets: UGEAP holds assets mainly in the forms of cash equivalents and debt towards financial institutions and / or
companies in the Target Region. Loans may be priced at either a variable or fixed rate of interest. Loans may be
denominated in USD exclusively.
Liabilities: UGEAP will issue capital in form of shares. Shares will have a fixed redemption date at which UGEAP owes
full capital repayment. The ability to pay will rely on the performance of the investments to generate liquidity upon
maturity. The return on the capital issued by UGEAP will be variable and will equal to the amount available for
distribution in accordance with a Priority of Payments, after having covered senior operating expenses of the UGEAP.
A more detailed description on the management of ALM risks can be found in C.7 – Annex 1 - ALM Risk Management
Gender Policy Please refer to Annex F.3 – Annex 1 –Gender Policy applicable to Deutsche Bank Programmes funded by the Green
Climate Fund for a draft of the gender policy to apply.
Social & Environmental Policy Please refer to section F3 of this Funding Proposal on a description on the applicable S&E policy.
Operating Guideline The operating guideline documents in detail the routines and processes as well as the departments in charge of the
tasks allocated under these routines. This is an internal requirement to ensure that procedures are clear to relevant
staff and enable replacements to take over tasks as backups in case of need.
Risk Management & Workout Processes The risk management framework of DB as investment manager of UGEAP follows a three step approach to deal with
non-performing assets:
Identification
Mitigation
Workout
In the following sections these steps will be explained in more detail.
Identification
As part of quarterly reporting, all projects are required to report on their covenants. These covenants are typically
designed to cover the different aspects of both financial risk (such as capital structure, liquidity risk etc) as well
as non-financial risks (S&E criteria, operating progress, reporting obligations etc). In addition, regular interaction
with the borrowers and occasional onsite supervision in the field also help identify warning signs and potential
credit quality issues early on.
DETAILED PROJECT / PROGRAMME DESCRIPTION GREEN CLIMATE FUND FUNDING PROPOSAL | PAGE 76 OF 165
C Whenever covenants breach pre-defined thresholds, whether financial or non-financial covenants, this will lead to
a re-classification of the underlying asset as non-performing and provisions will be made accordingly. Another
reason for a re-classification is a payment delay of more than 90 days following Basel II default definitions. This
re-classification and provisioning will also be communicated to the Fund during the consecutive regular quarterly
reporting.
Mitigation
Following the identification of a non-performing asset DB aims to assess the overall financial and operating
strength and the social and environmental implications of the project. For that a more detailed analysis of the
latest financial statements, financial projects and the current operating and financial strategy are performed.
Based on that analysis DB’s investment management team typically recommends one of the following options to
the Investment Committee: (Temporarily) Waive the covenant breach, in particular if the breach is expected to be healed in the foreseeable
future and no significantly adverse effects are expected.
Adjust the covenants, if particular if the current thresholds are not considered realistic and/or achievable any
more, but no further adverse effects are expected for the project. This can typically be observed in merger &
acquisition cases which tend to have a significant impact on key financial covenants.
Propose remedial action by the management of the project to avoid further deterioration of the financial
strength. These proposals are highly idiosyncratic, but range from complete strategic reviews and adjustments
of the underlying business plan, possibly including management changes, to ensure the going concern of the
company to tactical adjustments to ensure the availability of sufficient capital and liquidity for example. Part of
the proposal could be a request for injection of additional capital if the business case justifies this measure.
Such remedial actions are monitored closely in regular interaction with the borrower.
Demand complete or partial capital repayment, if remedial actions are considered insufficient or impossible.
Before any repayment can be effected an assessment of the potential social and environmental implications
must be conducted.
Workout
If UGEAP demands a complete or partial repayment of capital, the likelihood of complete repayment must be
assessed based on the analysis in 2. Mitigation. If a complete repayment is unlikely, workout teams will be
created. These teams can access dedicated experts from legal and risk departments in DB. In particular, DB’s
RMA (Risk Management Advisory) team has a successful track record in workouts and can support the
investment management team on workout cases.
In a workout scenario, the team re-negotiates the contracts, assesses the collateral values available and starts
their liquidation if necessary. Given the relatively weak legal enforceability in some countries under consideration
liquidation of collateral will most likely result in relatively low recovery value and/or only with a significant time
delay. Furthermore liquidation of collateral against our contract partner (i.e. financial institutions) could impact the
ultimate beneficiaries of the projects and stress vulnerable groups. Against this background DB considers a
workout process to be the ultimo ratio only.
Benefiting from DB’s global network and significant in-house Africa expertise, DB’s investment management
teams have a track record of finding solutions for critical exposures that ensure their going concern and avoid
workouts.
Work-Out Scenarios under the Funding and Risk Participation Structure:
Once UGEAP has given consent for an exposure to become part of the Reference Portfolio, the credit risk arising from
the underlying exposure is partially borne by UGEAP while the servicing of the loan remains with the local bank.
Quarterly, the bank will be obliged the report risk indicators on the underlying transactions to UGEAP that will become
part of the ongoing credit surveillance process. Local banks will be obliged to manage exposures in line with their
DETAILED PROJECT / PROGRAMME DESCRIPTION GREEN CLIMATE FUND FUNDING PROPOSAL | PAGE 77 OF 165
C standard practice – while UGEAP’s mission is to expand the bank’s practice into sectors that can be new to the bank.
Loss Allocation
In case the bank (partially-) writes off claims for principal payments it has against the underlying borrowers, the
following conditions need to be fulfilled for UGEAP to bear partially the losses:
- the write off is determined in line with international accounting practice;
- the write offs are limited to claims for principal repayments;
- UGEAP shall have the right to verify the amount of the write-off which in practice would be performed by a local
auditing company mandated by UGEAP.
Work-Out Actions
In case of a default or bankruptcy, local banks are generally best positioned to deal with the situation under local law
while UGEAP shall receive a right to intervene with decisions by the local bank that, subject to a materiality clause, will
require the approval by UGEAP. Such decisions shall include, inter alia:
- give consent to the replacement of management or other action by management of the creditor requiring
approval by the lender;
- agree to the appointment of a liquidator required under local law;
- agree to the restructuring of the cash flow profile of the loan;
- initiate the redirection of cash;
- initiate and effect the foreclosure of security and
- agree to the sale of the exposure to an enforcement agent / non-performing assets specialised company.
In principle, any action by the local bank to give up its rights, release security or dispose of the assets will require the
consent by UGEAP. Failure of the bank to receive the pre-consent will cause the exposure to retroactively become
ineligible to be part of the Reference Portfolio and UGEAP shall contractually have no risk exposure any more to the
loan.
Operationally, three elements will be employed to reduce the probability of incurring non-performing assets:
a) Selection of the right local bank as a partner institution of UGEAP based on DB’s comprehensive experience with
partner banks in Africa and the SI Europe team’s analytical background in banking analysis (with the fund manager
having rating agency experience for financial institutions); and
b) Acceptance of exposures to be added to the Reference Portfolio to include ideally only simple funding structures;
c) A close and ongoing interaction with the lending department of the local bank as part of supervision.
Projects <Please describe in detail the governance structure of the project, including but not limited to the organization structure, roles and responsibilities of the project management unit, steering committee, executing entities and so on.> <Describe construction and supervision methodology with key contractual agreements.> <Describe operational arrangements with key contractual agreements following the completion of construction. If applicable, provide the credit analysis of key counterparties of key contractual agreements and/or structural mitigants to cover the counterparty risks.>
Details on the project level can be found in Annex C.7
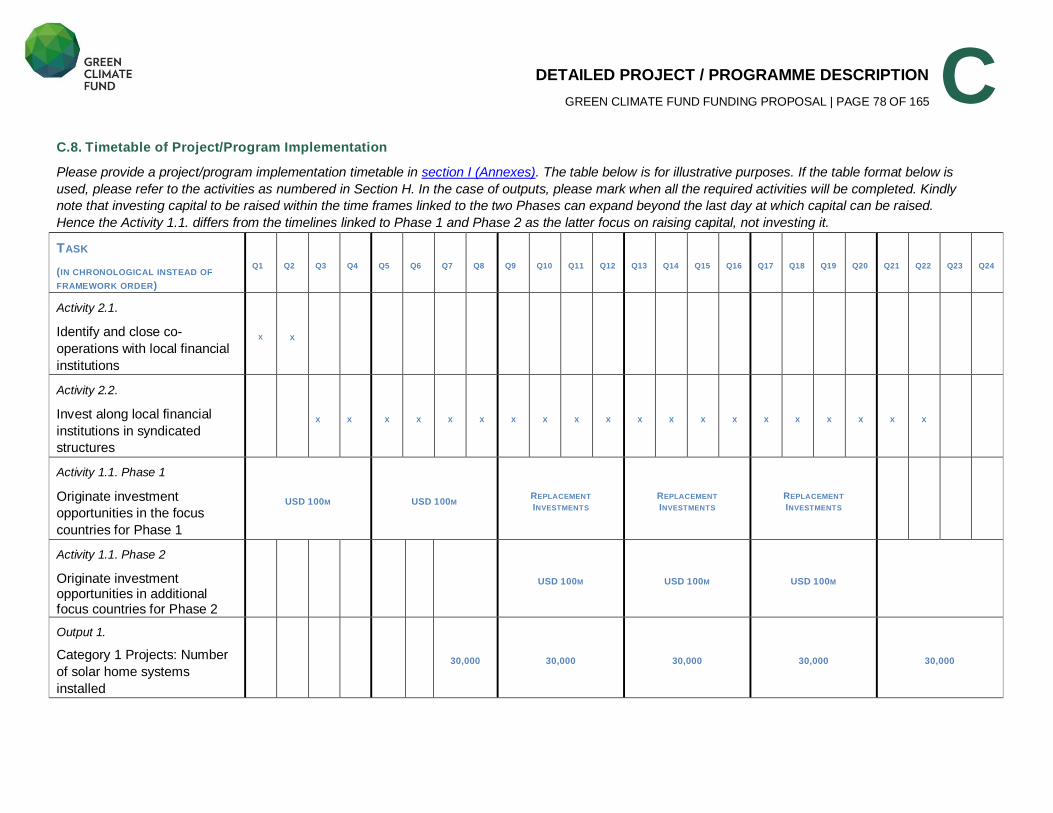
DETAILED PROJECT / PROGRAMME DESCRIPTION GREEN CLIMATE FUND FUNDING PROPOSAL | PAGE 78 OF 165
C C.8. Timetable of Project/Program Implementation
Please provide a project/program implementation timetable in section I (Annexes). The table below is for illustrative purposes. If the table format below is used, please refer to the activities as numbered in Section H. In the case of outputs, please mark when all the required activities will be completed. Kindly note that investing capital to be raised within the time frames linked to the two Phases can expand beyond the last day at which capital can be raised. Hence the Activity 1.1. differs from the timelines linked to Phase 1 and Phase 2 as the latter focus on raising capital, not investing it.
TASK (IN CHRONOLOGICAL INSTEAD OF FRAMEWORK ORDER)
Q1 Q2 Q3 Q4 Q5 Q6 Q7 Q8 Q9 Q10 Q11 Q12 Q13 Q14 Q15 Q16 Q17 Q18 Q19 Q20 Q21 Q22 Q23 Q24
Activity 2.1.
Identify and close co-
operations with local financial
institutions
X X
Activity 2.2.
Invest along local financial
institutions in syndicated
structures
X X X X X X X X X X X X X X X X X X X X
Activity 1.1. Phase 1
Originate investment
opportunities in the focus
countries for Phase 1
USD 100M USD 100M REPLACEMENT INVESTMENTS
REPLACEMENT INVESTMENTS
REPLACEMENT INVESTMENTS
Activity 1.1. Phase 2
Originate investment opportunities in additional focus countries for Phase 2
USD 100M USD 100M USD 100M
Output 1.
Category 1 Projects: Number
of solar home systems
installed
30,000 30,000 30,000 30,000 30,000
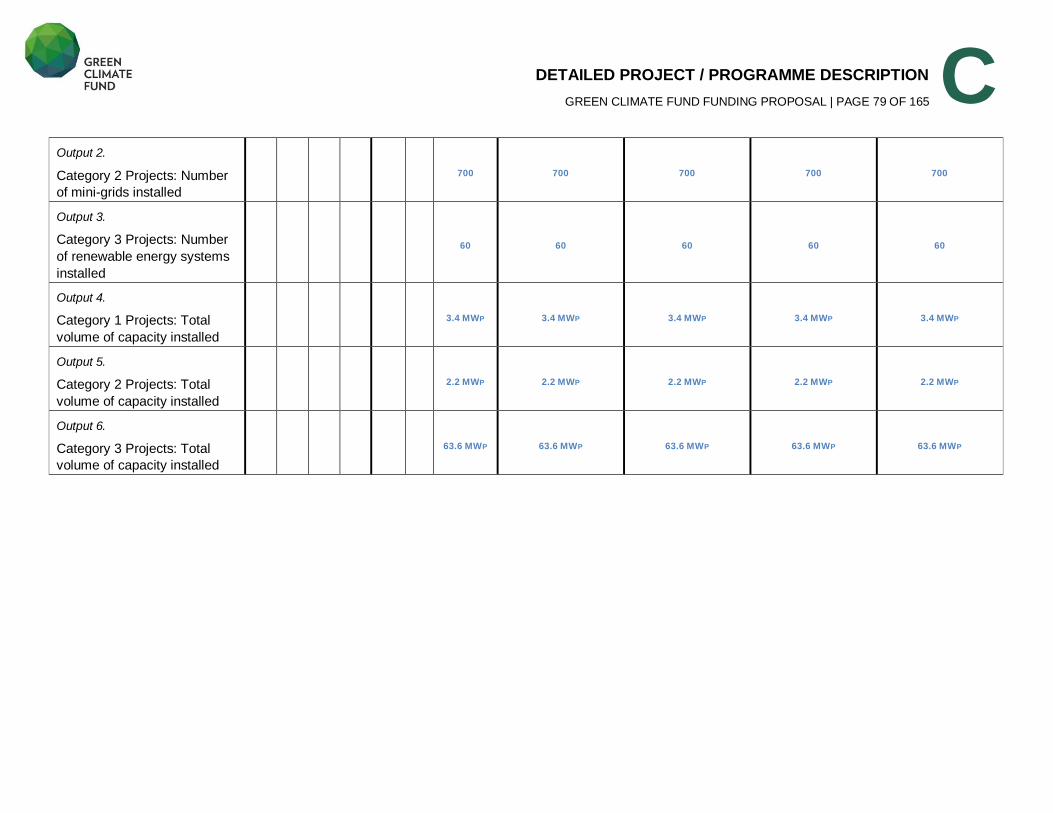
DETAILED PROJECT / PROGRAMME DESCRIPTION GREEN CLIMATE FUND FUNDING PROPOSAL | PAGE 79 OF 165
C Output 2.
Category 2 Projects: Number
of mini-grids installed 700 700 700 700 700
Output 3.
Category 3 Projects: Number
of renewable energy systems
installed
60 60 60 60 60
Output 4.
Category 1 Projects: Total
volume of capacity installed 3.4 MWP 3.4 MWP 3.4 MWP 3.4 MWP 3.4 MWP
Output 5.
Category 2 Projects: Total
volume of capacity installed 2.2 MWP 2.2 MWP 2.2 MWP 2.2 MWP 2.2 MWP
Output 6.
Category 3 Projects: Total
volume of capacity installed 63.6 MWP 63.6 MWP 63.6 MWP 63.6 MWP 63.6 MWP
RATIONALE FOR GCF INVOLVEMENT GREEN CLIMATE FUND FUNDING PROPOSAL | PAGE 80 OF 165
D D.1. Value Added for GCF Involvement
<Please specify why the GCF involvement is critical for the project/program.>
The GCF involvement in UGEAP is critical for the following reasons:
Facilitating the transition of the private sector into a new asset class
Overcoming structural limitations of local financial markets and international investors
Triggering private investment at scale through the appropriate risk-return profile
No alternative source of public sector funding at scale is available
Local banks require training and capability building measures to deal with renewable energy related businesses
Facilitating the transition of the private sector into a new asset class:
Financing access to electricity in Africa has traditionally been a public sector mandate. In remote areas, the approach to
electricity access was typically grid-based and thus not economic, requiring investment grants from the public sector to
enable private management and additional private investment in operations and maintenance. Technological progress
and associated cost reduction in off-grid renewable energy solutions have now created the opportunity for Africa to
leapfrog to 100% private sector based off-grid access solutions. Nevertheless, these technology solutions are new, with
a short operational track record, currently limited in scale and operating in an untested regulatory environment. The
private sector, i.e. local financial institutions and international institutional investors, therefore will not provide 100% of
the required debt financing from the beginning, especially not for category 1 and 2 projects, while technology risks also
remain for category 3 projects. A public-private partnership with the support from the GCF is therefore required to
provide private sector debt providers with support and comfort to enter into financing this new asset class.
Overcoming structural limitations of local financial markets and international investors:
UGEAP will provide local currency debt finance to (D)ESCOS through local financial institutions (FIs) with a 5-10 year
maturity, depending on project requirements. The majority of local financial markets are not yet developed enough to
provide a similar offer to local businesses. Further, the capacity of local markets to offer the:
maturity
pricing and
volumes
are well below the needs to bring clean energy access projects to fruition at the scale intended.
In terms of maturity, the loan maturities provided by local banks average around 5 years and therefore typically
cannot meet the loan maturity requirements of 7-10 years of the proposed investments. This is largely due to
the fact that the largest funding source for local banks are short-term liabilities, the majority of which are demand
deposits, while even term deposits typically do not exceed maturities of 1-2 years. GCF through UGEAP will
therefore provide much-needed long-term funding for local banks, allowing them to extend loans to energy
supply companies with the required 7-10 year maturity.
Consistent data on the asset-liability mismatch of local banks is not available as banks differ in their positions.
However, two examples represent the situation well: o
In both countries, the weighted average life of liabilities fluctuate between 2-3 years – which is in significant
contrast to the required terms of 5-10 years for the businesses UGEAP anticipates to invest into.
In terms of pricing, even in case loans are available with the required maturities, local currency loans provided
by local financial institutions typically carry interest rates which jeopardize the financial viability of the projects in
question. GCF’s involvement in UGEAP will allow local banks to extend loans with interest rates of 8-10% (USD
equivalent) which are affordable vis-à-vis the expected return of the proposed investments.
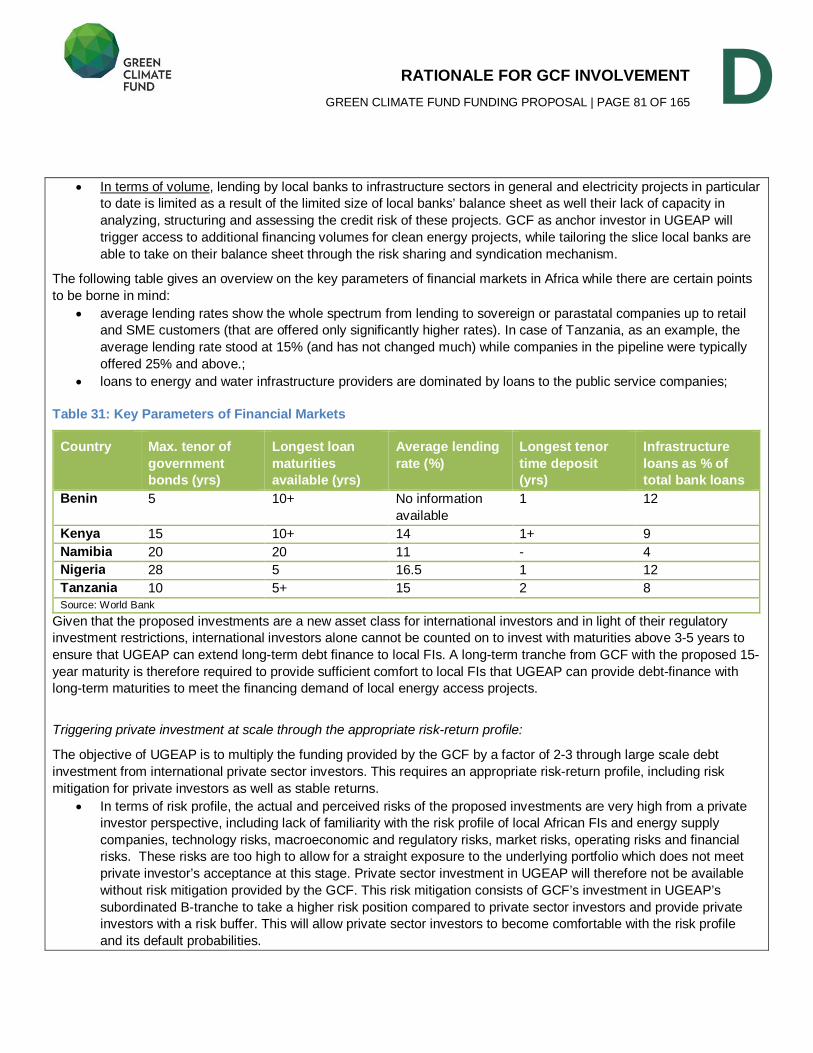
RATIONALE FOR GCF INVOLVEMENT GREEN CLIMATE FUND FUNDING PROPOSAL | PAGE 81 OF 165
D In terms of volume, lending by local banks to infrastructure sectors in general and electricity projects in particular
to date is limited as a result of the limited size of local banks’ balance sheet as well their lack of capacity in
analyzing, structuring and assessing the credit risk of these projects. GCF as anchor investor in UGEAP will
trigger access to additional financing volumes for clean energy projects, while tailoring the slice local banks are
able to take on their balance sheet through the risk sharing and syndication mechanism.
The following table gives an overview on the key parameters of financial markets in Africa while there are certain points
to be borne in mind:
average lending rates show the whole spectrum from lending to sovereign or parastatal companies up to retail
and SME customers (that are offered only significantly higher rates). In case of Tanzania, as an example, the
average lending rate stood at 15% (and has not changed much) while companies in the pipeline were typically
offered 25% and above.;
loans to energy and water infrastructure providers are dominated by loans to the public service companies;
Table 31: Key Parameters of Financial Markets
Country Max. tenor of government bonds (yrs)
Longest loan maturities available (yrs)
Average lending rate (%)
Longest tenor time deposit (yrs)
Infrastructure loans as % of total bank loans
Benin 5 10+ No information
available
1 12
Kenya 15 10+ 14 1+ 9
Namibia 20 20 11 - 4
Nigeria 28 5 16.5 1 12
Tanzania 10 5+ 15 2 8
Source: World Bank
Given that the proposed investments are a new asset class for international investors and in light of their regulatory
investment restrictions, international investors alone cannot be counted on to invest with maturities above 3-5 years to
ensure that UGEAP can extend long-term debt finance to local FIs. A long-term tranche from GCF with the proposed 15-
year maturity is therefore required to provide sufficient comfort to local FIs that UGEAP can provide debt-finance with
long-term maturities to meet the financing demand of local energy access projects.
Triggering private investment at scale through the appropriate risk-return profile:
The objective of UGEAP is to multiply the funding provided by the GCF by a factor of 2-3 through large scale debt
investment from international private sector investors. This requires an appropriate risk-return profile, including risk
mitigation for private investors as well as stable returns.
In terms of risk profile, the actual and perceived risks of the proposed investments are very high from a private
investor perspective, including lack of familiarity with the risk profile of local African FIs and energy supply
companies, technology risks, macroeconomic and regulatory risks, market risks, operating risks and financial
risks. These risks are too high to allow for a straight exposure to the underlying portfolio which does not meet
private investor’s acceptance at this stage. Private sector investment in UGEAP will therefore not be available
without risk mitigation provided by the GCF. This risk mitigation consists of GCF’s investment in UGEAP’s
subordinated B-tranche to take a higher risk position compared to private sector investors and provide private
investors with a risk buffer. This will allow private sector investors to become comfortable with the risk profile
and its default probabilities.
RATIONALE FOR GCF INVOLVEMENT GREEN CLIMATE FUND FUNDING PROPOSAL | PAGE 82 OF 165
D In terms of return expectations, debt investors require stable returns being paid on their capital that should also
be linked to floating rate returns in order to stabilize the present value of their investment while yield-curves
change. UGEAP proposes to private sector investors to have access to the total amount of interest income from
the investments in the following way:
1) fixed target return: 5% - ranking senior (after having paid for senior operating expenses);
2) a 1:4 share in the returns that are left after the target returns on the Class B capital has been paid.
The volatility in African economies is deemed to be outstandingly high and single defaults may occur without creditors
having the option and chance to influence them. Investors would typically respond to such a situation by expecting
“equity like” returns above 20% which the projects UGEAP targets cannot provide for debt investors.
GCFs involvement as risk cushion investor is therefore needed to stabilize the return profile of the A-tranche by
removing the risk that the default of a single investment will destroy the return expectations of the private sector
investors and lower the probability of write-offs for private investors which would negatively impact UGEAP’s ability to
raise additional private investment. As long as single defaults do not directly impact the private sector investor,
acceptance for portfolio investments are realistic and DB believes that a significant portion of the capital refinancing the
underlying transactions can come from the private sector based on its experience with similar structures.
No alternative source of public sector funding at scale is available:
Given the large investment needs and opportunities estimated in total at USD 500m, a sizeable amount is required as
investment into the subordinated B-tranche which currently only the GCF is able to provide within the given timeframe.
This is because no other DFI has ever considered a structure proposed by UGEAP and could encounter challenges in
adequately programming the proposed structure which is a hybrid of local FI risk and direct project risk; no single DFI
has similar financing capacity; and DFI programming requires a longer time horizon.
In addition, UGEAP establishes GCF as leading innovator in climate finance as no other program to date has managed
to combine the elements of developing local financial markets and tapping into large scale international debt investment
for the benefit of energy access in Africa. GCF’s investment in the B-tranche of UGEAP triggers this innovation.
Capability of local banks to underwrite renewable energy base businesses:
The transactions UGEAP targets are not in the focus of financial institutions yet which has various reasons. Most banks
have raised the concern that their in-house experience to deal with (a) consumer based lending in rural areas and (b)
long term project finance structures is limited and would require external support from knowledgeable and experienced
consultants. Further DB sees the need to build capacity across the sector by connecting financial institutions amongst
each other. This will not only strengthen the capacity of banks but also produce competition which would improve the
availability of funding for businesses UGEAP targets to promote.
D.2. Exit Strategy <Please explain how the project/program sustainability will be ensured in the long run, after the project/program is implemented with support from the GCF and other sources, taking into consideration the long-term financial viability demonstrated in E.6.3.>
The GCF investment will be repaid at maturity (15 years after closing). The capital invested by GCF will become due and payable by the UGEAP at maturity. The repayment of the maturing capital will be made out of principal repayments from investments by UGEAP and the ability of UGEAP meeting the repayment obligation is a function of the Asset-Liability Management described above.
Once the business case has been proven, sustainability for UEGAP could be achieved by private sector investors
RATIONALE FOR GCF INVOLVEMENT GREEN CLIMATE FUND FUNDING PROPOSAL | PAGE 83 OF 165
D investing in the A-tranche with longer maturities and also in the higher yielding B-tranche, so that UGEAP would continue operations without the need for a public sector risk taker. It would be an expectation that investors would include African pension funds, insurance companies and other local institutional investors at that point in time.
Alternatively, as the investment proposition, associated investments requirements and electricity access situation can be expected to have changed significantly after 15 years, sustainability could be achieved through alternative development pathways:
local financial institutions would have developed sufficient capabilities, investment expertise and long-term
funding sources to finance the energy supply businesses by themselves without the need for a financial
contribution by UGEAP;
other international capital market investors start investing into the sector UGEAP covers;
local financial markets would have developed in terms of depth and the capital available which translates into an
environment that the need for external funding in the form of UGEAP is no longer required;
businesses under category 3 investments would be in a position to finance their clean energy access from their
own cash flow and no longer require an investment from UGEAP;
the wealth of End Beneficiaries has increased such that they can afford investments in clean energy sources
from their own cash flows without the need to make use of the energy supply companies UGEAP will invest into,
which may be more unlikely for Category 1 and 2 transactions, though.
In addition, the business case for UGEAP will need to be re-assessed after 15 years in light of the then applicable national electrification strategy.
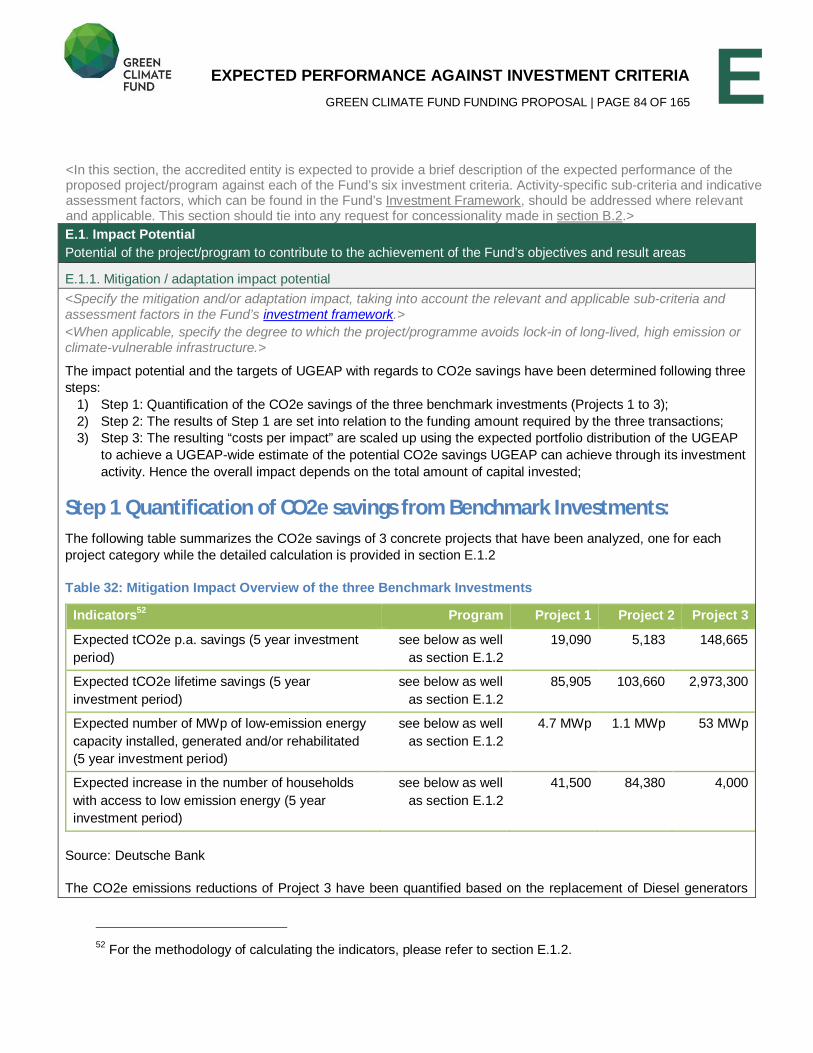
EXPECTED PERFORMANCE AGAINST INVESTMENT CRITERIA GREEN CLIMATE FUND FUNDING PROPOSAL | PAGE 84 OF 165
E <In this section, the accredited entity is expected to provide a brief description of the expected performance of the proposed project/program against each of the Fund’s six investment criteria. Activity-specific sub-criteria and indicative assessment factors, which can be found in the Fund’s Investment Framework, should be addressed where relevant and applicable. This section should tie into any request for concessionality made in section B.2.>
E.1. Impact Potential Potential of the project/program to contribute to the achievement of the Fund’s objectives and result areas
E.1.1. Mitigation / adaptation impact potential <Specify the mitigation and/or adaptation impact, taking into account the relevant and applicable sub-criteria and assessment factors in the Fund’s investment framework.> <When applicable, specify the degree to which the project/programme avoids lock-in of long-lived, high emission or climate-vulnerable infrastructure.>
The impact potential and the targets of UGEAP with regards to CO2e savings have been determined following three
steps:
1) Step 1: Quantification of the CO2e savings of the three benchmark investments (Projects 1 to 3);
2) Step 2: The results of Step 1 are set into relation to the funding amount required by the three transactions;
3) Step 3: The resulting “costs per impact” are scaled up using the expected portfolio distribution of the UGEAP
to achieve a UGEAP-wide estimate of the potential CO2e savings UGEAP can achieve through its investment
activity. Hence the overall impact depends on the total amount of capital invested;
Step 1 Quantification of CO2e savings from Benchmark Investments: The following table summarizes the CO2e savings of 3 concrete projects that have been analyzed, one for each
project category while the detailed calculation is provided in section E.1.2
Table 32: Mitigation Impact Overview of the three Benchmark Investments
Indicators52 Program Project 1 Project 2 Project 3
Expected tCO2e p.a. savings (5 year investment
period)
see below as well
as section E.1.2
19,090 5,183 148,665
Expected tCO2e lifetime savings (5 year
investment period)
see below as well
as section E.1.2
85,905 103,660 2,973,300
Expected number of MWp of low-emission energy
capacity installed, generated and/or rehabilitated
(5 year investment period)
see below as well
as section E.1.2
4.7 MWp 1.1 MWp 53 MWp
Expected increase in the number of households
with access to low emission energy (5 year
investment period)
see below as well
as section E.1.2
41,500 84,380 4,000
Source: Deutsche Bank
The CO2e emissions reductions of Project 3 have been quantified based on the replacement of Diesel generators
52 For the methodology of calculating the indicators, please refer to section E.1.2.
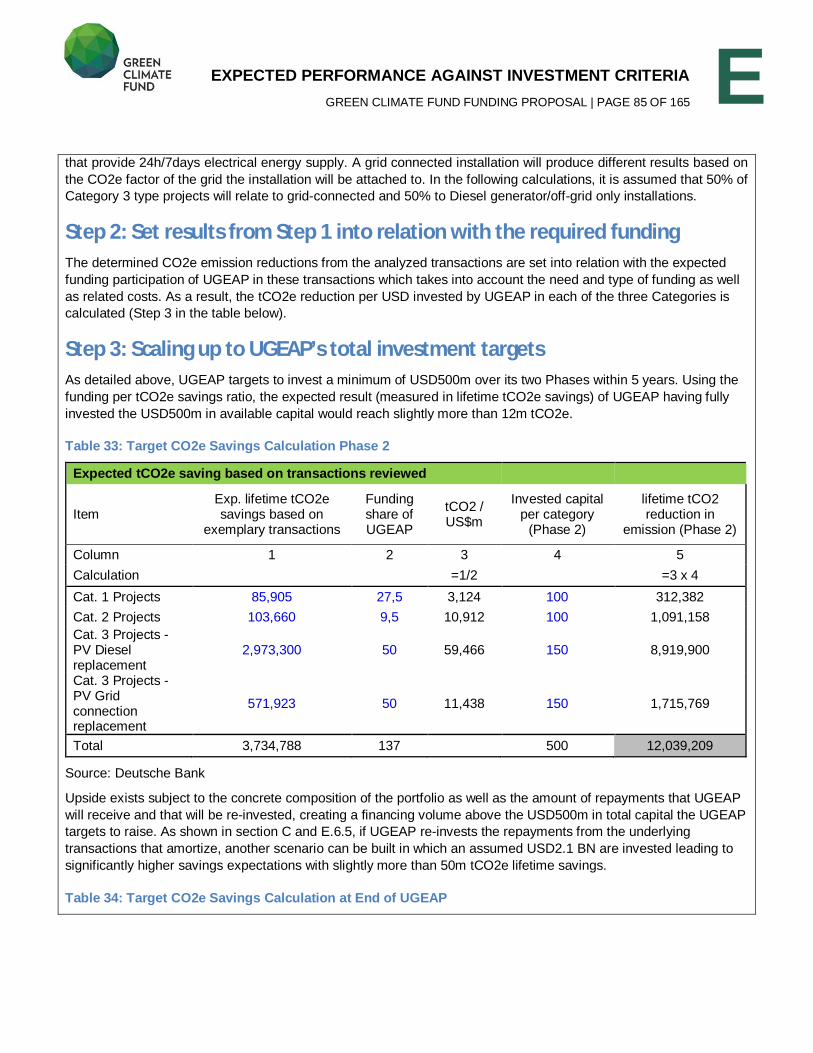
EXPECTED PERFORMANCE AGAINST INVESTMENT CRITERIA GREEN CLIMATE FUND FUNDING PROPOSAL | PAGE 85 OF 165
E that provide 24h/7days electrical energy supply. A grid connected installation will produce different results based on
the CO2e factor of the grid the installation will be attached to. In the following calculations, it is assumed that 50% of
Category 3 type projects will relate to grid-connected and 50% to Diesel generator/off-grid only installations.
Step 2: Set results from Step 1 into relation with the required funding The determined CO2e emission reductions from the analyzed transactions are set into relation with the expected
funding participation of UGEAP in these transactions which takes into account the need and type of funding as well
as related costs. As a result, the tCO2e reduction per USD invested by UGEAP in each of the three Categories is
calculated (Step 3 in the table below).
Step 3: Scaling up to UGEAP’s total investment targets As detailed above, UGEAP targets to invest a minimum of USD500m over its two Phases within 5 years. Using the
funding per tCO2e savings ratio, the expected result (measured in lifetime tCO2e savings) of UGEAP having fully
invested the USD500m in available capital would reach slightly more than 12m tCO2e.
Table 33: Target CO2e Savings Calculation Phase 2
Expected tCO2e saving based on transactions reviewed
Item Exp. lifetime tCO2e savings based on
exemplary transactions
Funding share of UGEAP
tCO2 / US$m
Invested capital per category
(Phase 2)
lifetime tCO2 reduction in
emission (Phase 2)
Column 1 2 3 4 5
Calculation =1/2 =3 x 4
Cat. 1 Projects 85,905 27,5 3,124 100 312,382
Cat. 2 Projects 103,660 9,5 10,912 100 1,091,158
Cat. 3 Projects - PV Diesel replacement
2,973,300 50 59,466 150 8,919,900
Cat. 3 Projects - PV Grid connection replacement
571,923 50 11,438 150 1,715,769
Total 3,734,788 137 500 12,039,209
Source: Deutsche Bank
Upside exists subject to the concrete composition of the portfolio as well as the amount of repayments that UGEAP
will receive and that will be re-invested, creating a financing volume above the USD500m in total capital the UGEAP
targets to raise. As shown in section C and E.6.5, if UGEAP re-invests the repayments from the underlying
transactions that amortize, another scenario can be built in which an assumed USD2.1 BN are invested leading to
significantly higher savings expectations with slightly more than 50m tCO2e lifetime savings.
Table 34: Target CO2e Savings Calculation at End of UGEAP
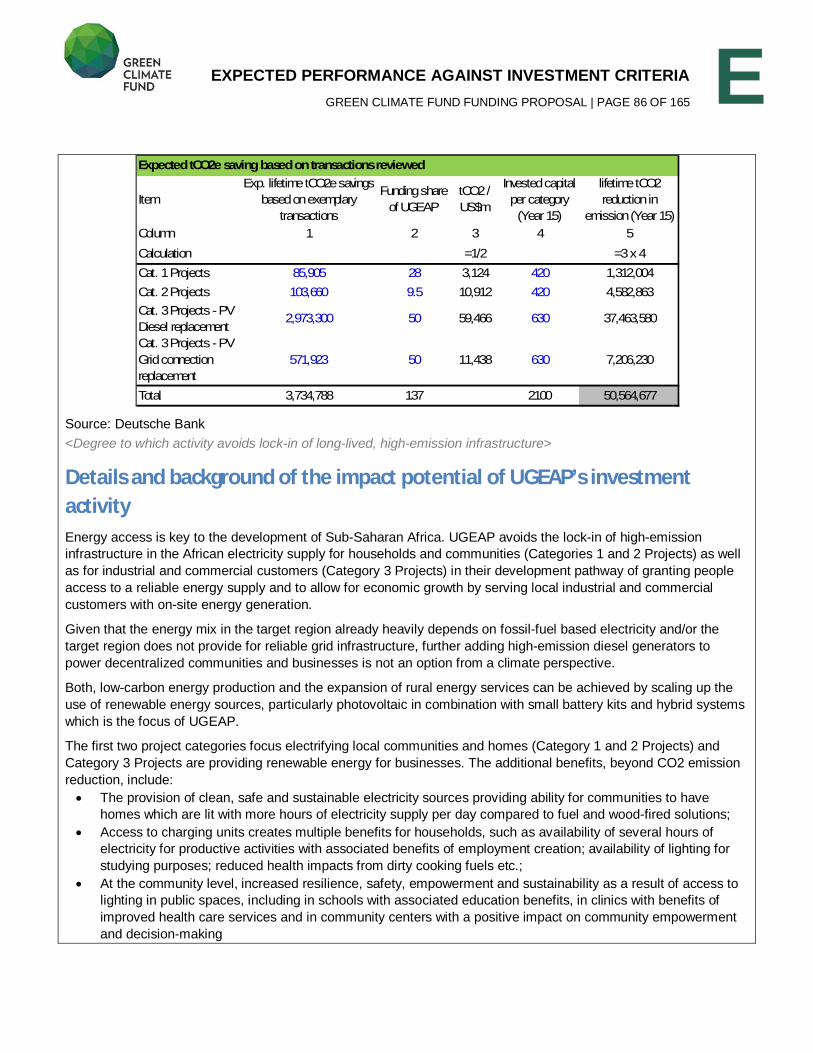
EXPECTED PERFORMANCE AGAINST INVESTMENT CRITERIA GREEN CLIMATE FUND FUNDING PROPOSAL | PAGE 86 OF 165
E
Source: Deutsche Bank
<Degree to which activity avoids lock-in of long-lived, high-emission infrastructure>
Details and background of the impact potential of UGEAP’s investment activity Energy access is key to the development of Sub-Saharan Africa. UGEAP avoids the lock-in of high-emission
infrastructure in the African electricity supply for households and communities (Categories 1 and 2 Projects) as well
as for industrial and commercial customers (Category 3 Projects) in their development pathway of granting people
access to a reliable energy supply and to allow for economic growth by serving local industrial and commercial
customers with on-site energy generation.
Given that the energy mix in the target region already heavily depends on fossil-fuel based electricity and/or the
target region does not provide for reliable grid infrastructure, further adding high-emission diesel generators to
power decentralized communities and businesses is not an option from a climate perspective.
Both, low-carbon energy production and the expansion of rural energy services can be achieved by scaling up the
use of renewable energy sources, particularly photovoltaic in combination with small battery kits and hybrid systems
which is the focus of UGEAP.
The first two project categories focus electrifying local communities and homes (Category 1 and 2 Projects) and
Category 3 Projects are providing renewable energy for businesses. The additional benefits, beyond CO2 emission
reduction, include:
The provision of clean, safe and sustainable electricity sources providing ability for communities to have
homes which are lit with more hours of electricity supply per day compared to fuel and wood-fired solutions;
Access to charging units creates multiple benefits for households, such as availability of several hours of
electricity for productive activities with associated benefits of employment creation; availability of lighting for
studying purposes; reduced health impacts from dirty cooking fuels etc.;
At the community level, increased resilience, safety, empowerment and sustainability as a result of access to
lighting in public spaces, including in schools with associated education benefits, in clinics with benefits of
improved health care services and in community centers with a positive impact on community empowerment
and decision-making
Expected tCO2e saving based on transactions reviewed
Item
Exp. lifetime tCO2e savings
based on exemplary
transactions
Funding share
of UGEAP
tCO2 /
US$m
Invested capital
per category
(Year 15)
lifetime tCO2
reduction in
emission (Year 15)
Column 1 2 3 4 5
Calculation =1/2 =3 x 4
Cat. 1 Projects 85,905 28 3,124 420 1,312,004
Cat. 2 Projects 103,660 9.5 10,912 420 4,582,863
Cat. 3 Projects - PV
Diesel replacement2,973,300 50 59,466 630 37,463,580
Cat. 3 Projects - PV
Grid connection
replacement
571,923 50 11,438 630 7,206,230
Total 3,734,788 137 2100 50,564,677
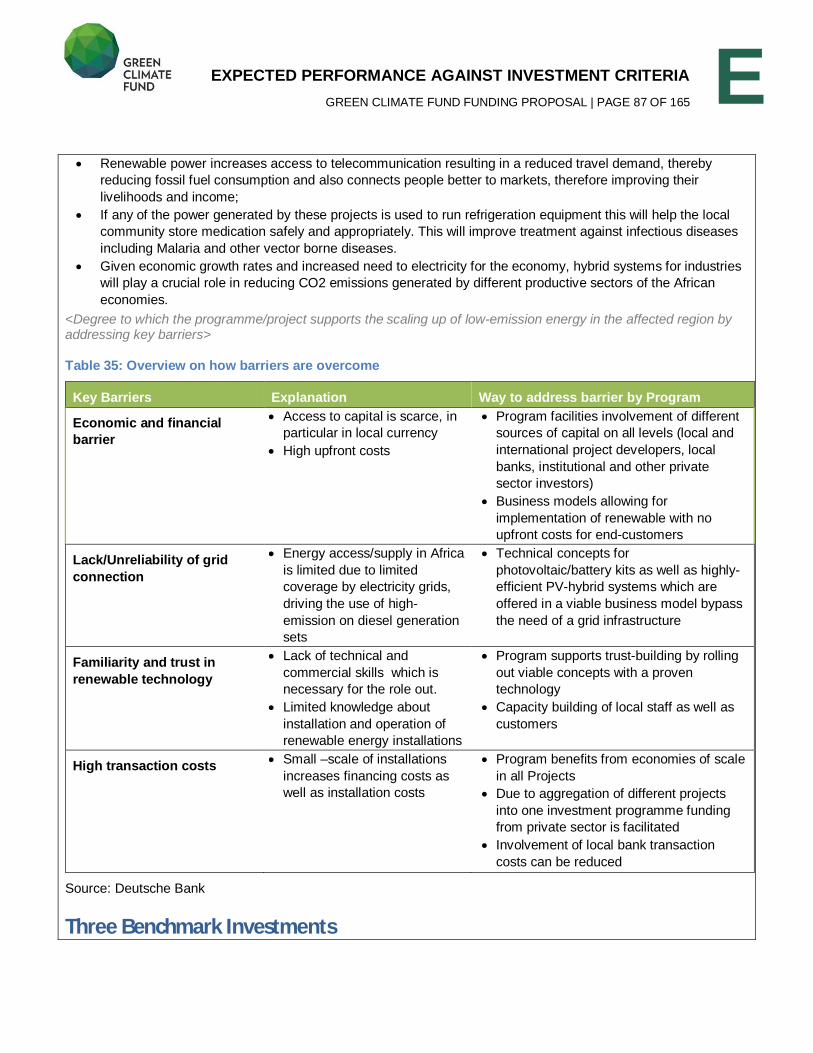
EXPECTED PERFORMANCE AGAINST INVESTMENT CRITERIA GREEN CLIMATE FUND FUNDING PROPOSAL | PAGE 87 OF 165
E Renewable power increases access to telecommunication resulting in a reduced travel demand, thereby
reducing fossil fuel consumption and also connects people better to markets, therefore improving their
livelihoods and income;
If any of the power generated by these projects is used to run refrigeration equipment this will help the local
community store medication safely and appropriately. This will improve treatment against infectious diseases
including Malaria and other vector borne diseases.
Given economic growth rates and increased need to electricity for the economy, hybrid systems for industries
will play a crucial role in reducing CO2 emissions generated by different productive sectors of the African
economies.
<Degree to which the programme/project supports the scaling up of low-emission energy in the affected region by addressing key barriers>
Table 35: Overview on how barriers are overcome
Key Barriers Explanation Way to address barrier by Program
Economic and financial barrier
Access to capital is scarce, in
particular in local currency
High upfront costs
Program facilities involvement of different
sources of capital on all levels (local and
international project developers, local
banks, institutional and other private
sector investors)
Business models allowing for
implementation of renewable with no
upfront costs for end-customers
Lack/Unreliability of grid connection
Energy access/supply in Africa
is limited due to limited
coverage by electricity grids,
driving the use of high-
emission on diesel generation
sets
Technical concepts for
photovoltaic/battery kits as well as highly-
efficient PV-hybrid systems which are
offered in a viable business model bypass
the need of a grid infrastructure
Familiarity and trust in renewable technology
Lack of technical and
commercial skills which is
necessary for the role out.
Limited knowledge about
installation and operation of
renewable energy installations
Program supports trust-building by rolling
out viable concepts with a proven
technology
Capacity building of local staff as well as
customers
High transaction costs Small –scale of installations
increases financing costs as
well as installation costs
Program benefits from economies of scale
in all Projects
Due to aggregation of different projects
into one investment programme funding
from private sector is facilitated
Involvement of local bank transaction
costs can be reduced
Source: Deutsche Bank
Three Benchmark Investments
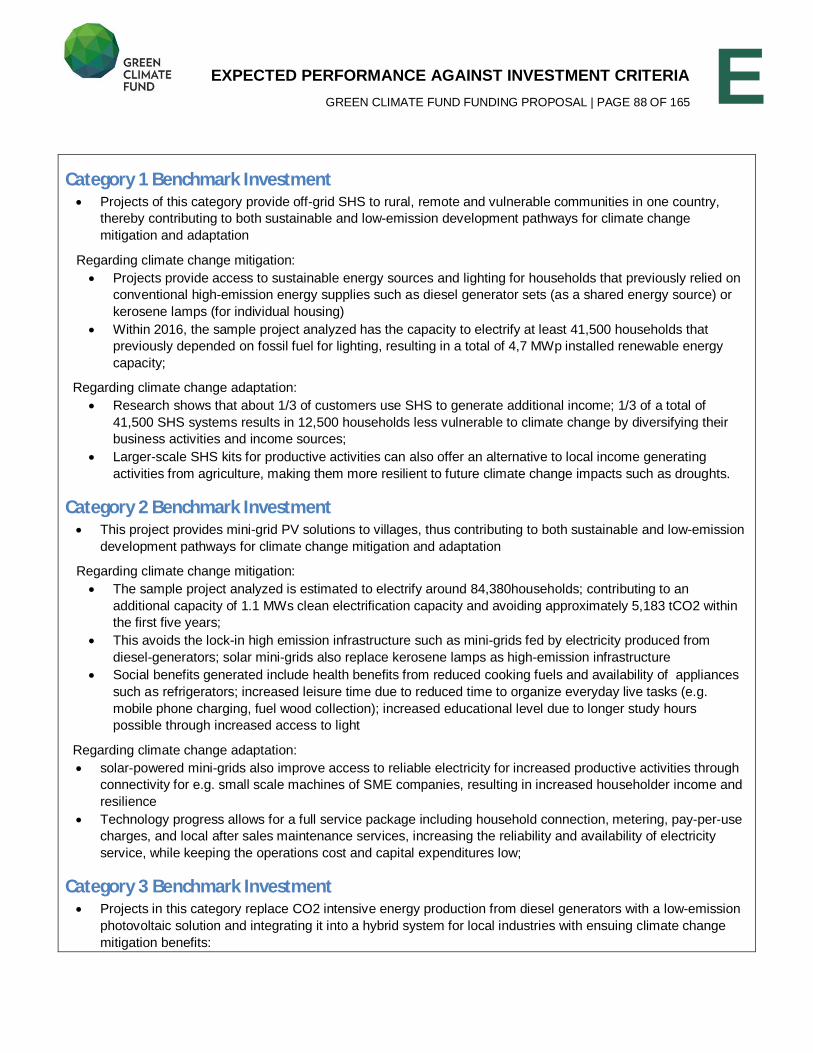
EXPECTED PERFORMANCE AGAINST INVESTMENT CRITERIA GREEN CLIMATE FUND FUNDING PROPOSAL | PAGE 88 OF 165
E Category 1 Benchmark Investment
Projects of this category provide off-grid SHS to rural, remote and vulnerable communities in one country,
thereby contributing to both sustainable and low-emission development pathways for climate change
mitigation and adaptation
Regarding climate change mitigation:
Projects provide access to sustainable energy sources and lighting for households that previously relied on
conventional high-emission energy supplies such as diesel generator sets (as a shared energy source) or
kerosene lamps (for individual housing)
Within 2016, the sample project analyzed has the capacity to electrify at least 41,500 households that
previously depended on fossil fuel for lighting, resulting in a total of 4,7 MWp installed renewable energy
capacity;
Regarding climate change adaptation:
Research shows that about 1/3 of customers use SHS to generate additional income; 1/3 of a total of
41,500 SHS systems results in 12,500 households less vulnerable to climate change by diversifying their
business activities and income sources;
Larger-scale SHS kits for productive activities can also offer an alternative to local income generating
activities from agriculture, making them more resilient to future climate change impacts such as droughts.
Category 2 Benchmark Investment This project provides mini-grid PV solutions to villages, thus contributing to both sustainable and low-emission
development pathways for climate change mitigation and adaptation
Regarding climate change mitigation:
The sample project analyzed is estimated to electrify around 84,380households; contributing to an
additional capacity of 1.1 MWs clean electrification capacity and avoiding approximately 5,183 tCO2 within
the first five years;
This avoids the lock-in high emission infrastructure such as mini-grids fed by electricity produced from
diesel-generators; solar mini-grids also replace kerosene lamps as high-emission infrastructure
Social benefits generated include health benefits from reduced cooking fuels and availability of appliances
such as refrigerators; increased leisure time due to reduced time to organize everyday live tasks (e.g.
mobile phone charging, fuel wood collection); increased educational level due to longer study hours
possible through increased access to light
Regarding climate change adaptation:
solar-powered mini-grids also improve access to reliable electricity for increased productive activities through
connectivity for e.g. small scale machines of SME companies, resulting in increased householder income and
resilience
Technology progress allows for a full service package including household connection, metering, pay-per-use
charges, and local after sales maintenance services, increasing the reliability and availability of electricity
service, while keeping the operations cost and capital expenditures low;
Category 3 Benchmark Investment Projects in this category replace CO2 intensive energy production from diesel generators with a low-emission
photovoltaic solution and integrating it into a hybrid system for local industries with ensuing climate change
mitigation benefits:
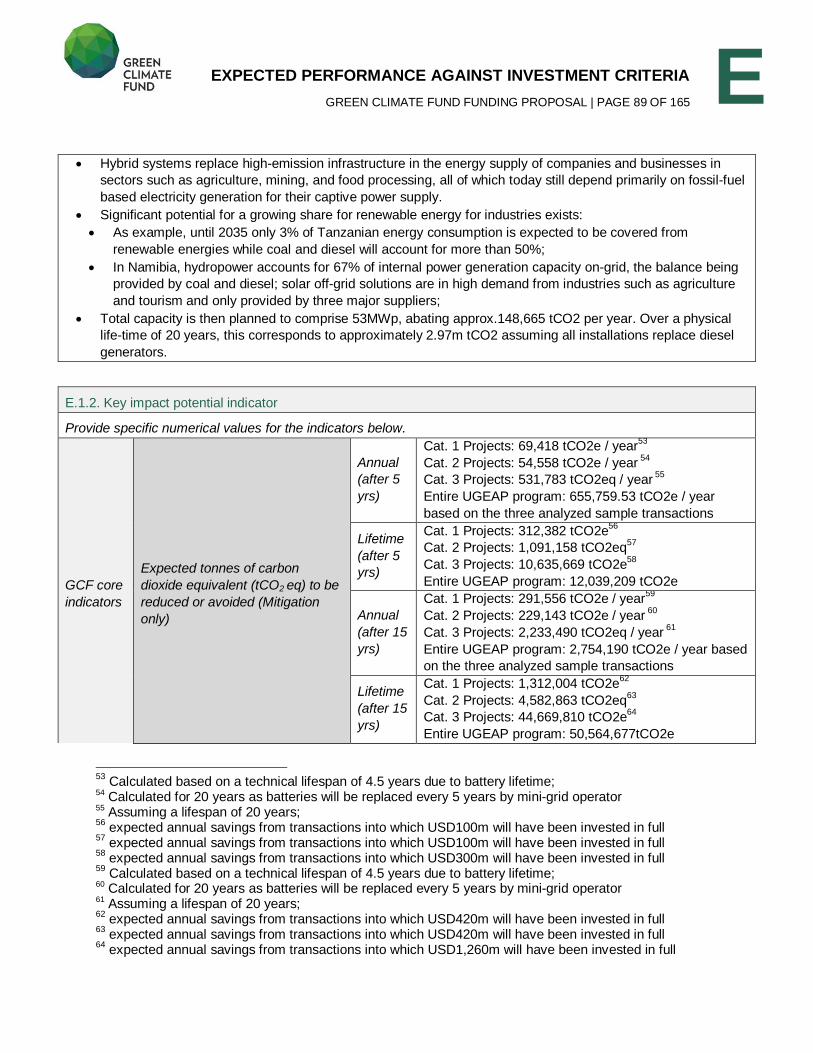
EXPECTED PERFORMANCE AGAINST INVESTMENT CRITERIA GREEN CLIMATE FUND FUNDING PROPOSAL | PAGE 89 OF 165
E Hybrid systems replace high-emission infrastructure in the energy supply of companies and businesses in
sectors such as agriculture, mining, and food processing, all of which today still depend primarily on fossil-fuel
based electricity generation for their captive power supply.
Significant potential for a growing share for renewable energy for industries exists:
As example, until 2035 only 3% of Tanzanian energy consumption is expected to be covered from
renewable energies while coal and diesel will account for more than 50%;
In Namibia, hydropower accounts for 67% of internal power generation capacity on-grid, the balance being
provided by coal and diesel; solar off-grid solutions are in high demand from industries such as agriculture
and tourism and only provided by three major suppliers;
Total capacity is then planned to comprise 53MWp, abating approx.148,665 tCO2 per year. Over a physical
life-time of 20 years, this corresponds to approximately 2.97m tCO2 assuming all installations replace diesel
generators.
E.1.2. Key impact potential indicator
Provide specific numerical values for the indicators below.
GCF core indicators
Expected tonnes of carbon dioxide equivalent (tCO2 eq) to be reduced or avoided (Mitigation only)
Annual (after 5 yrs)
Cat. 1 Projects: 69,418 tCO2e / year53
Cat. 2 Projects: 54,558 tCO2e / year 54
Cat. 3 Projects: 531,783 tCO2eq / year 55
Entire UGEAP program: 655,759.53 tCO2e / year
based on the three analyzed sample transactions
Lifetime (after 5 yrs)
Cat. 1 Projects: 312,382 tCO2e56
Cat. 2 Projects: 1,091,158 tCO2eq57
Cat. 3 Projects: 10,635,669 tCO2e58
Entire UGEAP program: 12,039,209 tCO2e
Annual (after 15 yrs)
Cat. 1 Projects: 291,556 tCO2e / year59
Cat. 2 Projects: 229,143 tCO2e / year 60
Cat. 3 Projects: 2,233,490 tCO2eq / year 61
Entire UGEAP program: 2,754,190 tCO2e / year based
on the three analyzed sample transactions
Lifetime (after 15 yrs)
Cat. 1 Projects: 1,312,004 tCO2e62
Cat. 2 Projects: 4,582,863 tCO2eq63
Cat. 3 Projects: 44,669,810 tCO2e64
Entire UGEAP program: 50,564,677tCO2e
53
Calculated based on a technical lifespan of 4.5 years due to battery lifetime; 54
Calculated for 20 years as batteries will be replaced every 5 years by mini-grid operator 55
Assuming a lifespan of 20 years; 56
expected annual savings from transactions into which USD100m will have been invested in full 57
expected annual savings from transactions into which USD100m will have been invested in full 58
expected annual savings from transactions into which USD300m will have been invested in full 59
Calculated based on a technical lifespan of 4.5 years due to battery lifetime; 60
Calculated for 20 years as batteries will be replaced every 5 years by mini-grid operator 61
Assuming a lifespan of 20 years; 62
expected annual savings from transactions into which USD420m will have been invested in full 63
expected annual savings from transactions into which USD420m will have been invested in full 64
expected annual savings from transactions into which USD1,260m will have been invested in full
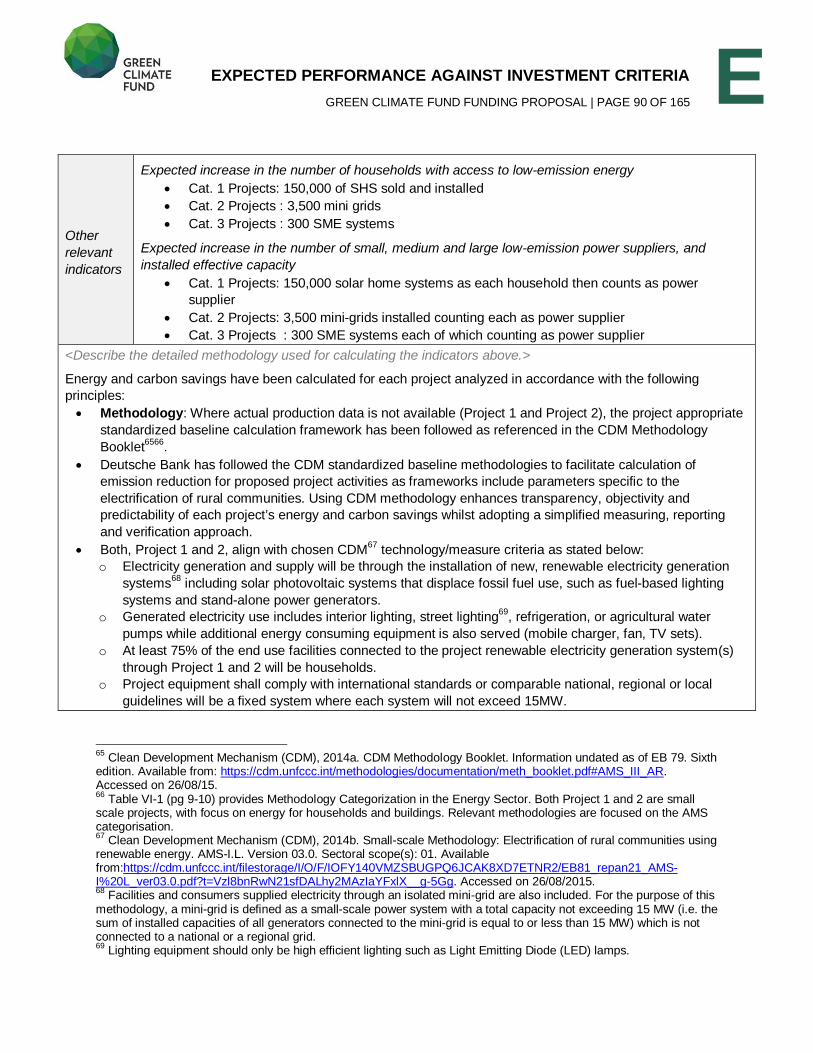
EXPECTED PERFORMANCE AGAINST INVESTMENT CRITERIA GREEN CLIMATE FUND FUNDING PROPOSAL | PAGE 90 OF 165
E Other relevant indicators
Expected increase in the number of households with access to low-emission energy Cat. 1 Projects: 150,000 of SHS sold and installed
Cat. 2 Projects : 3,500 mini grids
Cat. 3 Projects : 300 SME systems
Expected increase in the number of small, medium and large low-emission power suppliers, and installed effective capacity
Cat. 1 Projects: 150,000 solar home systems as each household then counts as power
supplier
Cat. 2 Projects: 3,500 mini-grids installed counting each as power supplier
Cat. 3 Projects : 300 SME systems each of which counting as power supplier
<Describe the detailed methodology used for calculating the indicators above.>
Energy and carbon savings have been calculated for each project analyzed in accordance with the following
principles:
Methodology: Where actual production data is not available (Project 1 and Project 2), the project appropriate
standardized baseline calculation framework has been followed as referenced in the CDM Methodology
Booklet6566
.
Deutsche Bank has followed the CDM standardized baseline methodologies to facilitate calculation of
emission reduction for proposed project activities as frameworks include parameters specific to the
electrification of rural communities. Using CDM methodology enhances transparency, objectivity and
predictability of each project’s energy and carbon savings whilst adopting a simplified measuring, reporting
and verification approach.
Both, Project 1 and 2, align with chosen CDM67
technology/measure criteria as stated below:
o Electricity generation and supply will be through the installation of new, renewable electricity generation
systems68
including solar photovoltaic systems that displace fossil fuel use, such as fuel-based lighting
systems and stand-alone power generators.
o Generated electricity use includes interior lighting, street lighting69
, refrigeration, or agricultural water
pumps while additional energy consuming equipment is also served (mobile charger, fan, TV sets).
o At least 75% of the end use facilities connected to the project renewable electricity generation system(s)
through Project 1 and 2 will be households.
o Project equipment shall comply with international standards or comparable national, regional or local
guidelines will be a fixed system where each system will not exceed 15MW.
65
Clean Development Mechanism (CDM), 2014a. CDM Methodology Booklet. Information undated as of EB 79. Sixth edition. Available from: https://cdm.unfccc.int/methodologies/documentation/meth_booklet.pdf#AMS_III_AR. Accessed on 26/08/15. 66
Table VI-1 (pg 9-10) provides Methodology Categorization in the Energy Sector. Both Project 1 and 2 are small scale projects, with focus on energy for households and buildings. Relevant methodologies are focused on the AMS categorisation. 67
Clean Development Mechanism (CDM), 2014b. Small-scale Methodology: Electrification of rural communities using renewable energy. AMS-I.L. Version 03.0. Sectoral scope(s): 01. Available from:https://cdm.unfccc.int/filestorage/I/O/F/IOFY140VMZSBUGPQ6JCAK8XD7ETNR2/EB81_repan21_AMS-I%20L_ver03.0.pdf?t=Vzl8bnRwN21sfDALhy2MAzIaYFxlX__g-5Gg. Accessed on 26/08/2015. 68
Facilities and consumers supplied electricity through an isolated mini-grid are also included. For the purpose of this methodology, a mini-grid is defined as a small-scale power system with a total capacity not exceeding 15 MW (i.e. the sum of installed capacities of all generators connected to the mini-grid is equal to or less than 15 MW) which is not connected to a national or a regional grid. 69
Lighting equipment should only be high efficient lighting such as Light Emitting Diode (LED) lamps.
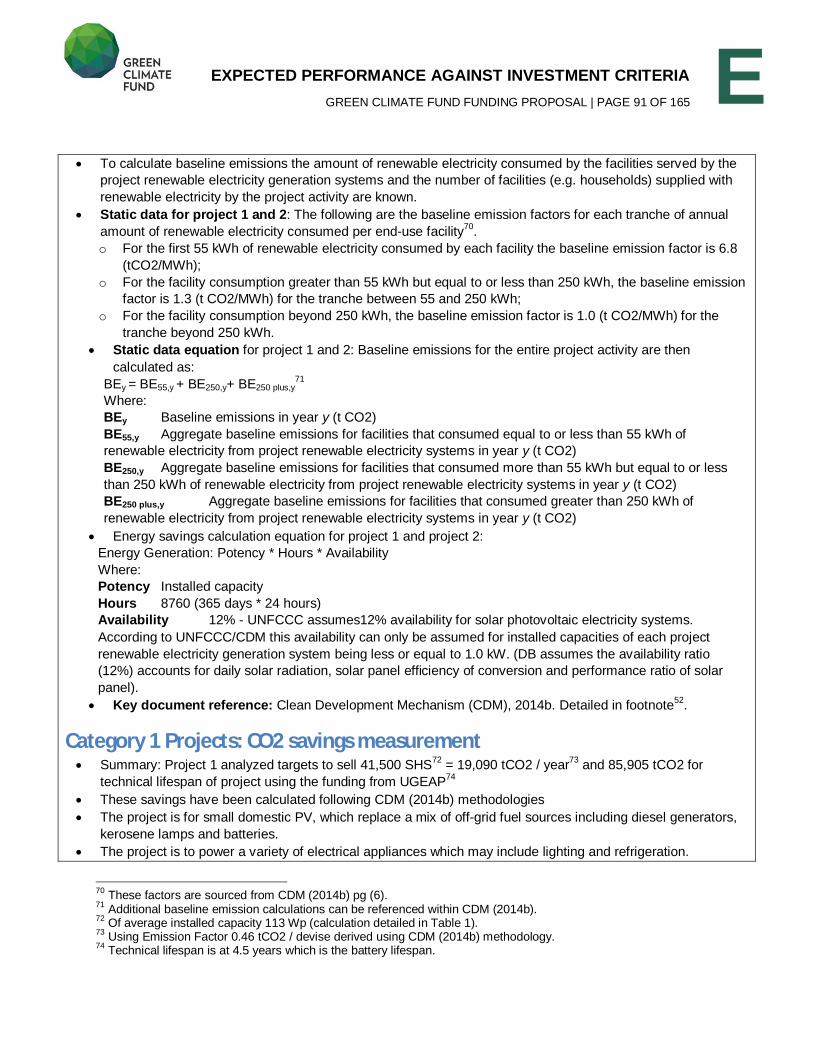
EXPECTED PERFORMANCE AGAINST INVESTMENT CRITERIA GREEN CLIMATE FUND FUNDING PROPOSAL | PAGE 91 OF 165
E To calculate baseline emissions the amount of renewable electricity consumed by the facilities served by the
project renewable electricity generation systems and the number of facilities (e.g. households) supplied with
renewable electricity by the project activity are known.
Static data for project 1 and 2: The following are the baseline emission factors for each tranche of annual
amount of renewable electricity consumed per end-use facility70
.
o For the first 55 kWh of renewable electricity consumed by each facility the baseline emission factor is 6.8
(tCO2/MWh);
o For the facility consumption greater than 55 kWh but equal to or less than 250 kWh, the baseline emission
factor is 1.3 (t CO2/MWh) for the tranche between 55 and 250 kWh;
o For the facility consumption beyond 250 kWh, the baseline emission factor is 1.0 (t CO2/MWh) for the
tranche beyond 250 kWh.
Static data equation for project 1 and 2: Baseline emissions for the entire project activity are then
calculated as:
BEy = BE55,y + BE250,y+ BE250 plus,y71
Where:
BEy Baseline emissions in year y (t CO2) BE55,y Aggregate baseline emissions for facilities that consumed equal to or less than 55 kWh of
renewable electricity from project renewable electricity systems in year y (t CO2)
BE250,y Aggregate baseline emissions for facilities that consumed more than 55 kWh but equal to or less
than 250 kWh of renewable electricity from project renewable electricity systems in year y (t CO2) BE250 plus,y Aggregate baseline emissions for facilities that consumed greater than 250 kWh of
renewable electricity from project renewable electricity systems in year y (t CO2)
Energy savings calculation equation for project 1 and project 2:
Energy Generation: Potency * Hours * Availability
Where:
Potency Installed capacity
Hours 8760 (365 days * 24 hours)
Availability 12% - UNFCCC assumes12% availability for solar photovoltaic electricity systems.
According to UNFCCC/CDM this availability can only be assumed for installed capacities of each project
renewable electricity generation system being less or equal to 1.0 kW. (DB assumes the availability ratio
(12%) accounts for daily solar radiation, solar panel efficiency of conversion and performance ratio of solar
panel).
Key document reference: Clean Development Mechanism (CDM), 2014b. Detailed in footnote52
.
Category 1 Projects: CO2 savings measurement Summary: Project 1 analyzed targets to sell 41,500 SHS
72 = 19,090 tCO2 / year
73 and 85,905 tCO2 for
technical lifespan of project using the funding from UGEAP74
These savings have been calculated following CDM (2014b) methodologies
The project is for small domestic PV, which replace a mix of off-grid fuel sources including diesel generators,
kerosene lamps and batteries.
The project is to power a variety of electrical appliances which may include lighting and refrigeration.
70
These factors are sourced from CDM (2014b) pg (6). 71
Additional baseline emission calculations can be referenced within CDM (2014b). 72
Of average installed capacity 113 Wp (calculation detailed in Table 1). 73
Using Emission Factor 0.46 tCO2 / devise derived using CDM (2014b) methodology. 74
Technical lifespan is at 4.5 years which is the battery lifespan.
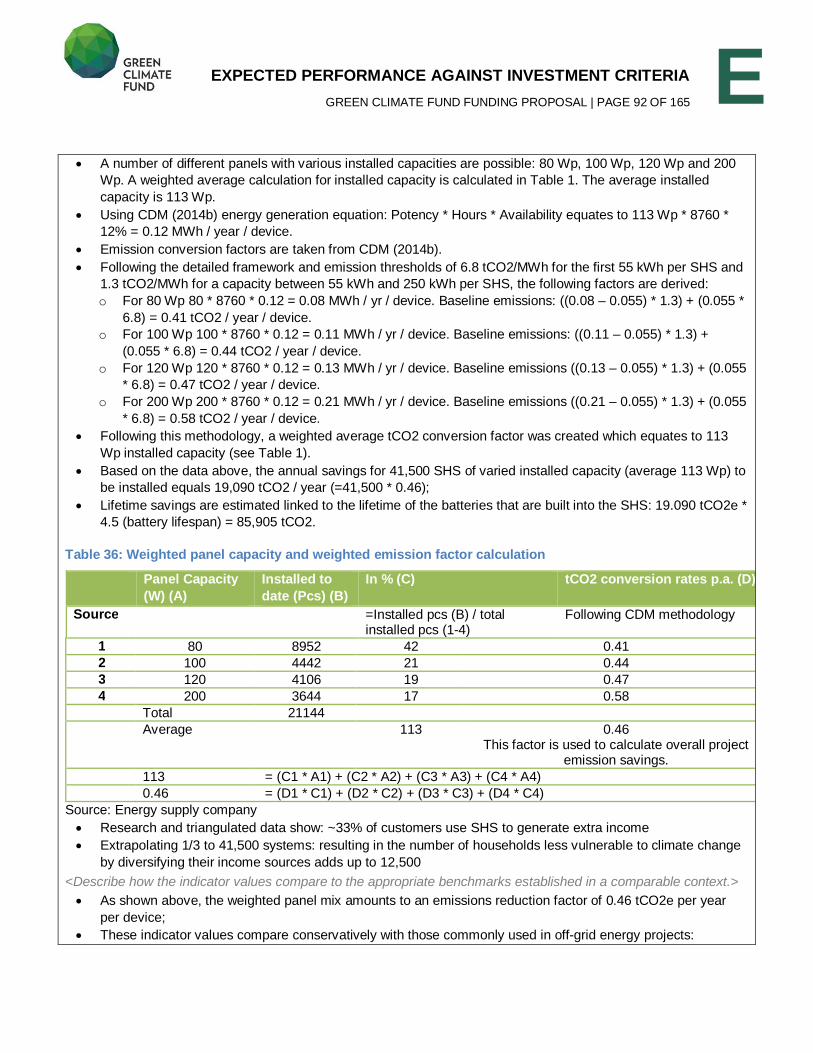
EXPECTED PERFORMANCE AGAINST INVESTMENT CRITERIA GREEN CLIMATE FUND FUNDING PROPOSAL | PAGE 92 OF 165
E A number of different panels with various installed capacities are possible: 80 Wp, 100 Wp, 120 Wp and 200
Wp. A weighted average calculation for installed capacity is calculated in Table 1. The average installed
capacity is 113 Wp.
Using CDM (2014b) energy generation equation: Potency * Hours * Availability equates to 113 Wp * 8760 *
12% = 0.12 MWh / year / device.
Emission conversion factors are taken from CDM (2014b).
Following the detailed framework and emission thresholds of 6.8 tCO2/MWh for the first 55 kWh per SHS and
1.3 tCO2/MWh for a capacity between 55 kWh and 250 kWh per SHS, the following factors are derived:
o For 80 Wp 80 * 8760 * 0.12 = 0.08 MWh / yr / device. Baseline emissions: ((0.08 – 0.055) * 1.3) + (0.055 *
6.8) = 0.41 tCO2 / year / device.
o For 100 Wp 100 * 8760 * 0.12 = 0.11 MWh / yr / device. Baseline emissions: ((0.11 – 0.055) * 1.3) +
(0.055 * 6.8) = 0.44 tCO2 / year / device.
o For 120 Wp 120 * 8760 * 0.12 = 0.13 MWh / yr / device. Baseline emissions ((0.13 – 0.055) * 1.3) + (0.055
* 6.8) = 0.47 tCO2 / year / device.
o For 200 Wp 200 * 8760 * 0.12 = 0.21 MWh / yr / device. Baseline emissions ((0.21 – 0.055) * 1.3) + (0.055
* 6.8) = 0.58 tCO2 / year / device.
Following this methodology, a weighted average tCO2 conversion factor was created which equates to 113
Wp installed capacity (see Table 1).
Based on the data above, the annual savings for 41,500 SHS of varied installed capacity (average 113 Wp) to
be installed equals 19,090 tCO2 / year (=41,500 * 0.46);
Lifetime savings are estimated linked to the lifetime of the batteries that are built into the SHS: 19.090 tCO2e *
4.5 (battery lifespan) = 85,905 tCO2.
Table 36: Weighted panel capacity and weighted emission factor calculation
Panel Capacity (W) (A)
Installed to date (Pcs) (B)
In % (C) tCO2 conversion rates p.a. (D)
Source =Installed pcs (B) / total installed pcs (1-4)
Following CDM methodology
1 80 8952 42 0.41
2 100 4442 21 0.44
3 120 4106 19 0.47
4 200 3644 17 0.58
Total 21144 Average 113 0.46
This factor is used to calculate overall project emission savings.
113 = (C1 * A1) + (C2 * A2) + (C3 * A3) + (C4 * A4)
0.46 = (D1 * C1) + (D2 * C2) + (D3 * C3) + (D4 * C4)
Source: Energy supply company
Research and triangulated data show: ~33% of customers use SHS to generate extra income
Extrapolating 1/3 to 41,500 systems: resulting in the number of households less vulnerable to climate change
by diversifying their income sources adds up to 12,500
<Describe how the indicator values compare to the appropriate benchmarks established in a comparable context.> As shown above, the weighted panel mix amounts to an emissions reduction factor of 0.46 tCO2e per year
per device;
These indicator values compare conservatively with those commonly used in off-grid energy projects:
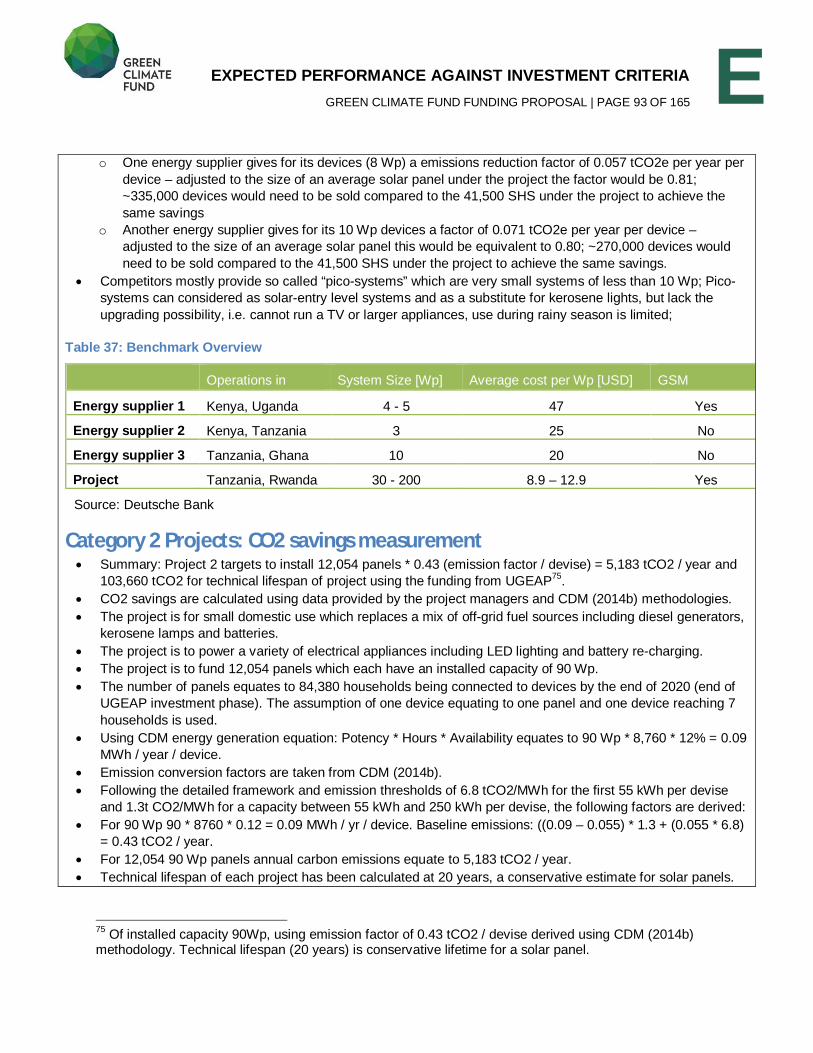
EXPECTED PERFORMANCE AGAINST INVESTMENT CRITERIA GREEN CLIMATE FUND FUNDING PROPOSAL | PAGE 93 OF 165
E o One energy supplier gives for its devices (8 Wp) a emissions reduction factor of 0.057 tCO2e per year per
device – adjusted to the size of an average solar panel under the project the factor would be 0.81;
~335,000 devices would need to be sold compared to the 41,500 SHS under the project to achieve the
same savings
o Another energy supplier gives for its 10 Wp devices a factor of 0.071 tCO2e per year per device –
adjusted to the size of an average solar panel this would be equivalent to 0.80; ~270,000 devices would
need to be sold compared to the 41,500 SHS under the project to achieve the same savings.
Competitors mostly provide so called “pico-systems” which are very small systems of less than 10 Wp; Pico-
systems can considered as solar-entry level systems and as a substitute for kerosene lights, but lack the
upgrading possibility, i.e. cannot run a TV or larger appliances, use during rainy season is limited;
Table 37: Benchmark Overview
Operations in System Size [Wp] Average cost per Wp [USD] GSM Energy supplier 1 Kenya, Uganda 4 - 5 47 Yes Energy supplier 2 Kenya, Tanzania 3 25 No Energy supplier 3 Tanzania, Ghana 10 20 No Project Tanzania, Rwanda 30 - 200 8.9 – 12.9 Yes Source: Deutsche Bank
Category 2 Projects: CO2 savings measurement Summary: Project 2 targets to install 12,054 panels * 0.43 (emission factor / devise) = 5,183 tCO2 / year and
103,660 tCO2 for technical lifespan of project using the funding from UGEAP75
.
CO2 savings are calculated using data provided by the project managers and CDM (2014b) methodologies.
The project is for small domestic use which replaces a mix of off-grid fuel sources including diesel generators,
kerosene lamps and batteries.
The project is to power a variety of electrical appliances including LED lighting and battery re-charging.
The project is to fund 12,054 panels which each have an installed capacity of 90 Wp.
The number of panels equates to 84,380 households being connected to devices by the end of 2020 (end of
UGEAP investment phase). The assumption of one device equating to one panel and one device reaching 7
households is used.
Using CDM energy generation equation: Potency * Hours * Availability equates to 90 Wp * 8,760 * 12% = 0.09
MWh / year / device.
Emission conversion factors are taken from CDM (2014b).
Following the detailed framework and emission thresholds of 6.8 tCO2/MWh for the first 55 kWh per devise
and 1.3t CO2/MWh for a capacity between 55 kWh and 250 kWh per devise, the following factors are derived:
For 90 Wp 90 * 8760 * 0.12 = 0.09 MWh / yr / device. Baseline emissions: ((0.09 – 0.055) * 1.3 + (0.055 * 6.8)
= 0.43 tCO2 / year.
For 12,054 90 Wp panels annual carbon emissions equate to 5,183 tCO2 / year.
Technical lifespan of each project has been calculated at 20 years, a conservative estimate for solar panels.
75
Of installed capacity 90Wp, using emission factor of 0.43 tCO2 / devise derived using CDM (2014b) methodology. Technical lifespan (20 years) is conservative lifetime for a solar panel.
EXPECTED PERFORMANCE AGAINST INVESTMENT CRITERIA GREEN CLIMATE FUND FUNDING PROPOSAL | PAGE 94 OF 165
E Therefore 5,183 tCO2e / year * 20 = 103,660 tCO2.
Added value 12,054 panels are estimated to reach 84,380 homes (7 households per panel system). Assuming 5 people per
household, this investment could enhance the lives of over 421,900 people.
<Describe how the indicator values compare to the appropriate benchmarks established in a comparable context.>
Mini-grid indicator values under Project 2 are close to those under Project 1 while CO2e lifetimes savings are
higher as the battery is owned and maintained (replaced). This allows to model lifetime savings over 20 years
rather than capping the results at the expected lifetime of a battery which would need to be replaced in Project
1 by the owner of the solar home system. This allows the mini-grid supplier to produce 1.2 times higher
lifetime savings with 3.4 times less panels being installed;
Mini-grid systems connect various panels and batteries and therefore are able to better cope with load
volatility in the grid;
Category 3 Projects: CO2 savings measurement Project 3 produces annually 236 MWh (101 MWh + 135 MWh) in its existing installations. 236 MWh * 1.7
tCO2 = 401 tCO2 / year. Technical lifespan for solar panel is 20 years = 8,024 tCO2 for technical lifespan.
Projected energy and carbon savings are based upon actual data collated from other solar panels which are
currently installed and electricity generation metered.
It is assumed that solar panels are replacing previous electrical generation from diesel generators.
With reference to the standardized baseline value from UNDP (2014)76
for rural off-grid electrification in Sub-
Saharan Africa, when diesel generators are replaced by renewable energy (including solar) the emission
factor of 1.7 tCO2/MWh is to be applied.
Two reference projects had the following electricity production for 2014 which was metered on site i.e. the
data points below are actual:
o A mining project: 1,600 kWh/kWp/yr * 63 kWp = 101 MWh/y
o A forestry & timber project: 1,550 kWh/kWp/yr * 87 kWp = 135 MWh/yr
To ensure that carbon calculations are conservative and take into account actual rural locations, these
measured values have been taken forward.
Carbon savings from these two projects: 101 MWh + 135 MWh = 236 MWh. 236 MWh * 1.7 tCO2 = 401 tCO2
/ year.
A conservative technical lifespan for a solar panel is 20 years.
Therefore 401 tCO2 * 20 years = 8,024 tCO2 for project technical lifespan of the two installed projects.
Future estimations 50 similar SME customers are assumed, reaching an installed capacity of 53 MWp with funding from UGEAP
i.e. the average capacity of each installation will be 1.06 MWp.
1,650 hours of operation * 53 MWp = 87,450 MWh.
87,450 * 1.7 emissions factor = 148,665 tCO2 from 2020 onwards.
Technical lifespan for a solar panel is 20 years. 148,665 * 20 = 2.97m tCO2 for a lifespan of 20 years.
76 United Nations Development Programme, 2014. Standardized baseline assessment for rural off-grid-electrification
in Sub-Saharan Africa.
EXPECTED PERFORMANCE AGAINST INVESTMENT CRITERIA GREEN CLIMATE FUND FUNDING PROPOSAL | PAGE 95 OF 165
E Almost 4,000 households could be served through 13 mini-grid off-takers from 2020 onwards, based on the
assumption that 230 households will be served with 87 kWp containers deployed in the (mini-)grids segment,
and that out of the 50 SME customers 13 will be mini-grid operators.
E.2. Paradigm Shift Potential Degree to which the proposed activity can catalyze impact beyond a one-off project/program investment
E.2.1. Potential for scaling up and replication (Provide a numerical multiple and supporting rationale) <Describe expected contributions to global low-carbon and/or climate-resilient development pathways through a theory of change for scaling up and replication (e.g. in terms of multiples of initial impact of the proposed project/programme).>
Program Level UGEAP will leverage GCF resources by a factor of 1:3.3 as part of the proposed program, creating the first program
for public-private climate finance in Africa at scale, with a target volume of USD 500 million. In addition, successful
investments by UGEAP will further multiply its impact inside and outside of the program as new markets have been
created which will move towards sustainability and continue beyond UGEAP.
UGEAP contributes to the paradigm shift towards low-emission and climate-resilient development pathways through
the following paradigm shift:
Mobilizing private climate finance in partnership and at scale for climate-smart electricity access investments: Private sector capital can be invested alongside existing local capacity from project developers as well as local banks to the benefit of climate-smart electricity access projects.
Private sector investors at this stage have currently no opportunity to invest into climate-relevant mitigation
projects (like those UGEAP targets) on the African continent and therefore do not cover the region with the
necessary attention and capital. On the other hand the current demand for debt of businesses in the targeted
categories is not met by local financial institutions.
Paradigm shift: UGEAP provides the first integrated platform to link private sector investors, local financial
institutions and local and international project developers/climate businesses for the benefit of scaling up
universal electricity access in Africa. UGEAP - on the active side - will indirectly add profitable assets to the
balance sheets of local banks and enable them to serve larger transactions that are not reachable with their own
capital sources and – on the passive side – shall provide institutional and other private sector investors with the
opportunity to tap the climate mitigation market in Africa with higher certainty. Successful investments through
UGEAP will allow for further transactions to follow from 3 sources: first, from local financial institutions who will
allocate further (own) capital once they built up a successful track-record in lending to these projects; from
international investors who will feel more comfortable to invest at scale after early successes and from
equity/project sponsors who will invest more in projects with a proven market and technology.
Innovation through local and international financial market development: At the local level, UGEAP will provide local banks with long-term funding for cash-flow based lending. At the international level, UGEAP provides the first structure to allow international investors to finance green electricity access in Africa. Both are new markets.
Local banks in Africa face an asset-liability mismatch: in many African economies, financial markets are still
predominantly short-term, in some cases even without a long-term financing benchmark (such as long-term
government bonds) and in most cases lacking long-term deposits which banks could intermediate into long-term
lending to projects which require a longer time horizon.
EXPECTED PERFORMANCE AGAINST INVESTMENT CRITERIA GREEN CLIMATE FUND FUNDING PROPOSAL | PAGE 96 OF 165
E In addition, local banks’ lending practices are not conducive to financing new technologies. In mature renewable
energy markets financial institutions finance renewable energy projects of all sizes in cash-flow based (project)
finance structures. However, the financial sector in the Target Region is used to grant loans for business
operations mostly against hard collateral (the value of which is often higher than the loan amount) but is not yet
open to granting loans for which the repayment relies on the cash that is produced by companies’ operations. In
addition, interest rates from local financial institutions are calibrated towards cash rich business.
In an emerging economy, a Debt to EBITDA multiple of 1-2 times the earnings minus net operational costs (i.e.
before interest, tax and depreciation (EBITDA)), is typical. Businesses with high turnover (trade, agriculture,
retail, manufacturing) and in low capital intensive businesses (machinery is already amortized / not expensive)
comfortably fall into this target range.
This is in contrast to climate businesses that are producing less cash (and are less profitable) and can offer less
hard collateral or proven market fundamentals in Africa. To enable these transactions to produce adequate
returns, 8-10 times EBITDA is a typical requirement for the amount of required debt at interest rates that are
typically offered to corporates with established operations. This Local financial institutions currently do not
provide such financing due to:
o Lack of knowledge on how to structure debt / underwrite;
o Not foreseen in the credit procedures of the local financial institutions;
o Long term execution horizons while other business (such as real estate) allows to earn higher interest
rates with shorter maturities;
o Perception of high risk – low return combination;
o Interest rate and other subsidies by international development banks can make it unattractive to start
lending to these businesses.
On the side of international investors, they currently do not invest in green electricity access projects in Africa
directly as the associated actual and perceived risks are too high, including political, market, technology and
operating risks and the expected returns to compensate for such risks cannot be provided by the projects.
Paradigm Shift: UGEAP creates both new markets for local banks as well as investors by overcoming the
barriers outlined above through:
Providing long-term debt finance to local financial institutions which they can intermediate into long-term
loans with the maturities required by green electricity access projects
Partnering with local banks in project analysis and credit assessments, thereby building their capacity in
cash-flow based lending to these projects
Providing an adequate risk-return profile for international investors to start investing at scale in
renewable energy access projects in Africa
Building up both these local and international financial markets and creating a growing capital flow through them
will drive prices for capital (interest rates) down given that the available capital will over time compete for these
projects.
Innovation to the traditional “on-lending scheme”: Providing long term debt to local financial institutions in an existing and proven concept to enable banks to provide long term capital into specifically targeted sectors. While this leaves banks with the full risk, a risk participation provides an even stronger incentive to serve industries and clients that have not yet been covered by the local banks
In order to mobilise funding for local businesses in the targeted categories of the UGEAP, banks are expected
to provide loans to sectors that are currently outside of their target and comfort zone. Local economies are
evolving very quickly which is also reflected in lending standards. Banks tend to show high growth rates and
EXPECTED PERFORMANCE AGAINST INVESTMENT CRITERIA GREEN CLIMATE FUND FUNDING PROPOSAL | PAGE 97 OF 165
E growth requires equity and profitability. Profitability in the markets is high as banks are able to charge relatively
high fees and interest from underpenetrated businesses segments. The target businesses need, however,
interest rates that are not at the top of the offer range from local banks and hence become less attractive to
expand into – although their business models come with significant growth prospects from the local banks.
In addition, lending standards of local banks generally are not adapted to the business types UGEAP targets to
support – while these businesses are vital for an economy that is fuelled by green energy from a granular
number of small energy companies. In order to expand the lending practices, local risk procedures need to
adjust to the risk characteristics of these companies. As local banks would be accompanied in the risk take-over
by UGEAP, the offer provides sufficient incentive to initiate the transition.
Paradigm Shift: UGEAP allows local banks to expand their scope of services and customer outreach, supports
the financial inclusion of currently unbanked customers and transforms the lending / credit acceptance criteria of
local banks towards the businesses that are typical for an economy backed by many de-centralized green
energy providers.
UGEAP delivers long term capital through debt: While international investors focus on equity investments in the Target Region, UGEAP offers long term debt which supports local entrepreneurs and stabilizes national account balances.
Typically, investments by international investors (tracked by the “foreign direct investments” statistics) come in
with a relatively short term orientation and the ability to divest in case macroeconomic conditions turn negative.
Further, local businesses that have oftentimes borne development costs have to bring on board further equity
investors in order to fund the capital expenditures required to grow the businesses in line with the market
potential. This reduces the amount of up-side and returns local entrepreneurs can retain. Debt is also used to
reduce the total funding costs of a company and therefore makes businesses feasible that otherwise would not
succeed.
In addition, on a national level, equity investments leaving the economy in case of a downturn lead to a further
de-stabilization of the situation. In contrast, debt has a maturity schedule and therefore would flow “only” on
expected terms.
Paradigm Shift: Provide long term, stable and foreseeable capital contributions to the expanding economic
activity of economies in the Target Region rather than short term orientated capital flows.
Sustainability and Scalability: Renewable energy is a competitive, scalable technology:
Businesses and households are still skeptical toward renewable energy, particularly toward photovoltaics, in
Sub-Sahara Africa which is perceived to be:
o Expensive;
o Unreliable;
o Unproven;
o High maintenance;
compared to the traditional Diesel based alternative which they are familiar with.
Paradigm Shift: UGEAP will scale up successful renewable energy access models in off-grid, mini-grid and
industry solutions. UGEAP will act based on private sector, market-based principles and only finance
transactions that are economically and financially viable on their own. UGEAP shall have an initial investment
horizon of five years which will allow not only investing in the first of its kind of projects under commercial terms,
but also supply capital to the market followers. This will create multiple benefits, including:
o Fiscal space for governments as no subsidies for the green electricity access projects financed by UGEAP
are required
EXPECTED PERFORMANCE AGAINST INVESTMENT CRITERIA GREEN CLIMATE FUND FUNDING PROPOSAL | PAGE 98 OF 165
E o Competition amongst project developers which will drive technology and financing costs down;
o Broaden the technical service base available in the regions due to higher demand and respectively build a
perspective for well-educated staff;
o Give a competitive advantage to businesses that decide to use the new technology at an early stage
o Ultimately further decrease costs of implementation for photovoltaic and hybrid systems and roll out a
viable climate-smart business concept that will be one component for increasing photovoltaic usage in
Africa’s electricity mix beyond EIA’s scenario of only 4% in 2040.77
Project Level Combining sustainable economic growth and climate change mitigation: rising economic growth rates further
increase power needs - small business entrepreneurs in remote areas can be served especially well by PV
based electricity supply linking small businesses and the country’s general economic growth to renewable
energy sources;
Innovation / technology transfer: All installations make use of state-of-the-art technology while proven and
hence support building up an industry around clean energy generation and supply.
Sustainability and Scalability: All installations are highly standardized and are delivered in very short time; ie.
Installations UGEAP looks at typically take only one week to set up a village mini-grid after approval by the
village council. Business models are all scalable due to the simple technology and the very good applicability in
the national context.
Financial service: All investees of the UGEAP provide indirectly financial services to end-users which removes
the need for high up-front investments while local banks are reluctance to finance on long terms.
E.2.2. Potential for knowledge and learning
<Describe how the project/programme contributes to the creation or strengthening of knowledge, collective learning processes, or institutions.>
Program Level UGEAP is creating a unique public-private partnership consisting of multiple stakeholders who will work together in
a collective learning process. For example, part of this process is that local financial institutions, DB and
international investor work together to jointly underwrite transactions that originate new climate-smart businesses for
the benefit of increased green electricity access in Africa. In this context, the following learning and know-how
transfers and benefits will be achieved: :
Project Developers: Understand how debt capital can be built into their clean energy business;
Receive guidance on how to structure climate business to make it bankable (either project finance structures
or Leasing business models);
Benefit from network and international relationships through UGEAP, including regional banks, GCF, DB as
investment manager, other technology providers et al.
Local Financial Institutions & DB:
77 EIA, Africa Energy Outlook, 2014, p. 82
EXPECTED PERFORMANCE AGAINST INVESTMENT CRITERIA GREEN CLIMATE FUND FUNDING PROPOSAL | PAGE 99 OF 165
E Receive support from DB as investment manager of UGEAP underwriting transactions for UGEAP how to
structure and analyze climate mitigation business proposals;
Get exposure to new clean technologies and applications and exchange experience on it amongst the
financing consortium;
Systematic approach to energy access projects and business models;
Develop internal risk underwriting around the new business concepts (local FI);
Gain experience in geographies not yet covered systematically.
International Investors: Understand and participate in risk-return structures which allow to enter investment opportunities in unknown
markets
Understand the features of a sustainable business opportunity in renewable electricity access in Africa;
Gain exposure to and overcome undue perceived risks related to Africa by frequently being updated on
developments, including the underlying portfolio of investments through UGEAP.
Develop knowledge and skills that can be transferred to potential similar investments in other geographies
End Beneficiaries: Gain comfort in the RE technologies employed;
Improve local technical skills through support and maintenance requirements that are coming together with the
businesses financed.
Dedicate the time gained through electrification to other learning opportunities, such as education and
improved health care
Local governments: Learn about climate-friendly models to reach national electrification targets
Learn about lower-cost models for electrification in remote rural areas
Understand the benefits of private-sector led green electrification models
As a result, possibly review national electrification strategies to increase the focus on renewable energy
sources and low-cost alternatives to grid extensions
GCF: Understand how GCF can multiply its resources through leveraging in the local and international private sector
Develop an understanding of a program structure that can be scaled up and replicated in other geographies
Act as and deepen its skills as natural convener for a multi-party approach to developing and financing
sustainable climate mitigation and adaptation projects
DB: Connecting its renewable energy finance expertise with knowledge on local context in Africa, further
deepening its skills in climate finance in Africa
During implementation, learn about the opportunities and challenges of the UGEAP program structure for
potential replication in other regions and knowledge sharing with other stakeholders
Transfer transaction structuring and credit approval knowledge to local banks and knowledge about climate-
smart electricity access opportunities in Africa to international investors
Project Level Each business UGEAP will facilitate with its capital, delivers to the target in different ways, while the following points
are common:
EXPECTED PERFORMANCE AGAINST INVESTMENT CRITERIA GREEN CLIMATE FUND FUNDING PROPOSAL | PAGE 100 OF 165
E Individuals are trained towards technicians, sales staff or entrepreneurs as sub-contractors of the
companies;
Businesses provide knowledge to effectively service customers and represent the sustainable energy
industry;
Local SMEs are trained towards using the PV based electricity to expand / improve their economic activities
(expand offers and opening times);
Community representatives and regulatory bodies are educated towards the peculiarities of the industry / its
needs.
E.2.3. Contribution to the creation of an enabling environment <Describe how proposed measures will create conditions that are conducive to effective and sustained participation of private and public sector actors in low-carbon and/or resilient development.>
Program Level Technological sustainability: UGEAP offers long term capital only to businesses that mitigate
greenhouse gas emissions. Promoting the respective technologies and scaling them up as the basis for
economic development supports the end-beneficiaries in building a low-carbon environment as part of
sustainable development. . In addition, after amortization of initial investments, renewable energy is almost
free for the end-user and endlessly available during the lifetime of the equipment. This creates a competitive
advantages for its users and empowerment at the local level due to self-sustainability.
Accelerated local development path: Investments in all Categories deliver climate-smart infrastructure
assets to end-beneficiaries without grid extensions to satisfy energy demand using fossil based energy
carriers. Current projections suggest that local electrical energy grids are too far away to supply electricity
within the same time frame, even if renewable sources would have a majority share in the energy
generation mix. The UGEAP therefore accelerates the expected development path for local economies and
will allow policy makers to include renewable off- and mini-grid solutions in national electrification strategies.
Environmental and social sustainability: All investments of UGEAP have to be in line with strict social,
environmental and governance standards. Hence climate-smart businesses can be showcases for local
regulators which activities are worth receiving supportive regulation. Successful precedents can therefore
facilitate supportive local regulation for clean energy infrastructure solutions.
Building local capacity: UGEAP supports local solutions to local needs. All businesses to be invested into
have local maintenance and operations (with global sourcing of technology and components) thereby
mainstreaming and disseminating knowledge and capacity on photovoltaic technology into African energy
supply.
Building local financial markets for climate finance: By partnering with local banks, UGEAP builds the
capacity of local banks to assess and lend to climate-smart projects. Once local banks understand this
business model, they are expected to continue providing finance to these businesses even without UGEAP
participation.
Project Level
Project Category 1 and 2 Target investees that offer solar-home-systems as well as mini-grids support conditions that are conducive to
effective and sustained participation of mainly low-income populations towards low-carbon development by:
EXPECTED PERFORMANCE AGAINST INVESTMENT CRITERIA GREEN CLIMATE FUND FUNDING PROPOSAL | PAGE 101 OF 165
E Fostering participative community-life by educating and enabling rural households, which opens doors for
further socio-economic development;
Raising awareness for environmentally friendly and sustainable business practices through customer
education and village presentations;
Their business model for customer ownership of solar home systems which is empowering people,
especially women, accelerating local democratization processes and contributing to low-income rural
populations;
Engaging local population/self-employed entrepreneurs in workshops and training courses for local
technicians and marketing agents, likewise acting as multipliers for the use of modern solar technology as a
reliable power source.
Adding to technical and engineering capacity in rural areas through the development of a strong pipeline of
engagement opportunities for local SMEs. This will have a follow-on effect of stimulating greater interest in
rural electrification as a vocational field to be pursued in rural employment centers or at local universities.
Enabling new business opportunities: craftsmen can expand working hours during the evening, shops can
extend their opening hours without using candles or kerosene lamps, and new businesses emerge which
could not exist without electricity;
Category 3 Projects Energy supply for industrial used mainly delivers towards the target to improve the operational conditions for
companies while two sectors can serve as examples:
Agri-business sector: Farming operations as well as third party suppliers to SME agro-processors, like private farmers, including
out-growers and small-holder farmers, prefer to have their produce processed on an environmental friendly
site and thus contribute to public awareness building;
Due to thin margins for processed agricultural products, cost awareness and the need for cost efficient
solutions is high, and PV provides a cost-efficient solution;
All parties involved in the supply chain will benefit from cost-efficient and environmental friendly produce;
Mining sector Mine operators are increasingly aware of their ecological footprint and of their image which suffered from
recent incidents and the media;
It is an observation that many mine operators across sub-Saharan Africa are revising their Corporate Social
Responsibility (CSR) strategies, including environmental concerns:
o The improvement of health conditions improvement for their workers is a major ambition within this
context; mining companies in SS usually have their own or tailor-made medical aid and employee
wellness schemes – the reduction of CO2 emissions can reduce the prevalence of respiratory diseases;
o The reduction of their carbon footprint through hybridized power production equipment fits very well into
this strategy;
o Due to declining prices on global mineral markets, mine operators also need to be more cost effective
than during the previous decade; PV project developers enhances this development and offer viable
solutions;
UGEAP will very carefully and diligently chose which mine would be served based on would only consider
energy solutions for mining companies which the GCF’s Environmental and Social Safeguards that will be
reflected in UGEAPs own standards;
Mines that will be served are those that exploit non-carbon raw material and are exploiting raw material for
industrial use mainly; a strong preference exists to serve mining operations that are embedded in a national
EXPECTED PERFORMANCE AGAINST INVESTMENT CRITERIA GREEN CLIMATE FUND FUNDING PROPOSAL | PAGE 102 OF 165
E value chain and where the raw material gets refined / used locally rather than purely exported;
<Describe how the proposal contributes to innovation, market development and transformation. Examples include: Introducing and demonstrating a new market or a new technology in a country or a region Using innovative funding scheme such as initial public offerings and/or bond markets for projects/programme>
Program Level UGEAP introduces the following innovation to the respective markets:
Technology innovation: UGEAP will be the first program to roll out renewable energy solutions in off-grid, mini-grid and industry
settings at scale and across African countries. Building on the pilot investments, new technologies will
consolidate their successful track record which will serve as reference for rolling them out to meet pent-up
demand in other African countries.
Financial innovation:
For private sector investors, the first opportunity to invest in renewable African energy access projects,
unlocking access to a new large-scale financing source through appropriate terms regarding investment
size and risk-return profiles;
Using limited public funds for climate-smart electricity access solutions and multiplying them through
additional private finance, thereby creating fiscal space for local governments to invest in other sectors
relevant to sustainable development;
Working with local banks to build capacity and scale up local currency finance to climate change mitigation
projects, thereby creating a new market in financial intermediation
Invest capital jointly with local financial institutions, international investors and the Green Climate Fund,
hence creating network and know-how transfer effects through the investment activity;
Filling the gap of much needed long-term debt capital for the targeted investments, while equity solutions
already exist.
Project Level All target investees will be assessed to contribute to innovation, market development and transformation. Examples
from the pipeline transactions include:
One (D)ESCO has the first-of-its-kind technical solution for solar home systems including an IT backend
where the technical solution and its software is embedded in a viable business model.
Offering a range of business kits and appliances/products developed to support entrepreneurs in
establishing small business i.e. cooling drinks, charging mobile phones, powering an office laptop, etc.;
Research from customers confirms that energy generated is used by customers to offer services to their
community, therefore enhancing community development through new small businesses;
Transformative change towards a low-carbon energy supply is supported by increasing the interest in and
roll-out of solar power and solar power solutions, which are leading to greater social and economic benefits;
Many local entrepreneurial activities started as a result of a PV system are managed by women,
contributing to women empowerment in local communities;
Connections to a local mini-grid, single houses do not depend on their own photovoltaic panel; electricity
supply is ensured from the grid; smart meters ensure correct charges;
Mini-grid operator comprise all of the three pillars of a typical utility company, including management of
EXPECTED PERFORMANCE AGAINST INVESTMENT CRITERIA GREEN CLIMATE FUND FUNDING PROPOSAL | PAGE 103 OF 165
E installed assets, operations and maintenance and services, all through a computerized system from
anywhere in the world plus international management and local customer service;
Village schools embrace the model and create a new learning environment with a library and computers or
tablets;
Pupils can study after dark and improve their knowledge skills and productivity;
Village health posts can operate 24/7 and provide improved services, like pharmacies with extended
opening hours, basic laboratory services or even basic surgery services;
Traditional electrical energy producing installations typically require high up-front investment in equipment
(i.e. purchasing of equipment);
PV installations for industrial use will be designed to inject more photovoltaic power into the hybrid system
compared to having Diesel generators running on low load, creating further cost savings and emissions
reductions;
E.2.4. Contribution to regulatory framework and policies
Describe how the project/programme strengthens the national / local regulatory or legal frameworks to systematically drive investment in low-emission technologies or activities, promote development of additional low-emission policies, and/or improve climate-responsive planning and development.
Program Level UGEAP will strengthen the national / local regulatory or legal frameworks to systematically drive investment in low-
emission technologies or activities by applying the following measures:
Invests directly into small-scale renewable energy projects that are viable under existing regulation;
Invests only in transactions that are economically sustainable and therefore does not require subsidies;
Where relevant, will work with local regulators (and other donors as applicable) to create simplified
regulatory frameworks for off-grid and mini-grid renewable energy solutions
Will contribute to increasing the share renewables have in the respective national energy mix and national
electrification targets;
Upon their demand, will work with government planning authorities / economic development agencies (and
other donors as applicable) to promote scaling up renewable energy solutions as basis for industrial and
other economic development initiatives Works under commercial terms and does not crowd out local
financial institutions or other investors into the projects;
Promotes competition amongst project developers for the best technology along its S&E standards;
Reduces through its investments the requirement to import / produce fossil fuel carriers and therefore
reduces existing trade deficits that are caused by the import of refined oil products;
Invests in local businesses that create revenue and jobs – and as a result increased household income as
well as tax revenues; and
Works strictly in line with national legislation and international best practice, e.g. regarding licensing,
taxation/import duties or social and environmental standards, and therefore strengthens national
frameworks.
E.3. Sustainable Development Potential Wider benefits and priorities
EXPECTED PERFORMANCE AGAINST INVESTMENT CRITERIA GREEN CLIMATE FUND FUNDING PROPOSAL | PAGE 104 OF 165
E E.3.1. Environmental, social and economic co-benefits, including gender-sensitive development impact
<Describe environmental, social and economic co-benefits listed above, including the gender-sensitive development impact.>
UGEAP will create substantial environmental, social and economic co-benefits. While impacts are diverse and touch
upon different aspects within the four categories environmental, social, economic and gender-related benefits DB
has identified certain sub-criteria for each categories and outline the type of impact the three projects will have:
Economic Co-Benefits UGEAP and its three project categories generates the following wider economic co-benefits:
Total number of jobs created: these include the number of direct permanent and temporary employment created by the program, including a growing
share of female employment, as laid out in section H.
additional employment created through entrepreneurial activities and/or increased productivity created as a
result of access to electricity through UGEAP; for example, records show that more than one-third of
customers in Project 1 in off-grid regions started a business by selling their excess energy produced each
day
indirect employment created in the suppliers to UGEAP’s investment projects and through the increased
spending power from the GDP contribution of UGEAP’s investments.
Amount of foreign currency savings:
Most Sub-Saharan economies rely on the import of Diesel as there are no national refining capacities. This drives
the trade deficits up, imports inflation subject to the volatility of the oil prices and further weighs on the need to
produce foreign currency inflows into the country to finance the trade deficit.
Based on a conversion factor of 1l Diesel to kWh of 10.63, the expected 94MWh production stemming from the
three analyzed transactions alone could save 8.8m litres of Diesel. At an assumed price of 0.50USD per litre, the
contribution from the three existing businesses would amount to USD4.4m in savings annually.
Scaling up the calculation with UGEAPs target to finance the MWp capacity as detailed in section E and H, an
annual amount of produced electricity of 556,133MWh could be achieved. Using the assumptions above, annually
52,317m litres of Diesel could be saved if all installations were to replace Diesel generators. This would reduce the
annual import requirement by USD26m annually. Over a lifetime expectation of 20 years, this would reduce total
import funding requirements by USD532m – more than the amount UGEAP targets to invest in the economies.
Poverty reduction:
As a result of growing employment and household income, it is expected that UGEAP contributes to decreasing
poverty, especially extreme poverty, in the local communities and regions where its investments take place.
Social Co-Benefits Numerous studies show a positive correlation between rural electrification and improvement of living conditions and
promotion of development. The range of positive social benefits of rural electrification and a reliable electricity
supply to SMEs and corporate to local communities includes
Poverty reduction by providing a long term income through new jobs and increased productivity
New opportunities for leisure (through time savings, TV and lighting);
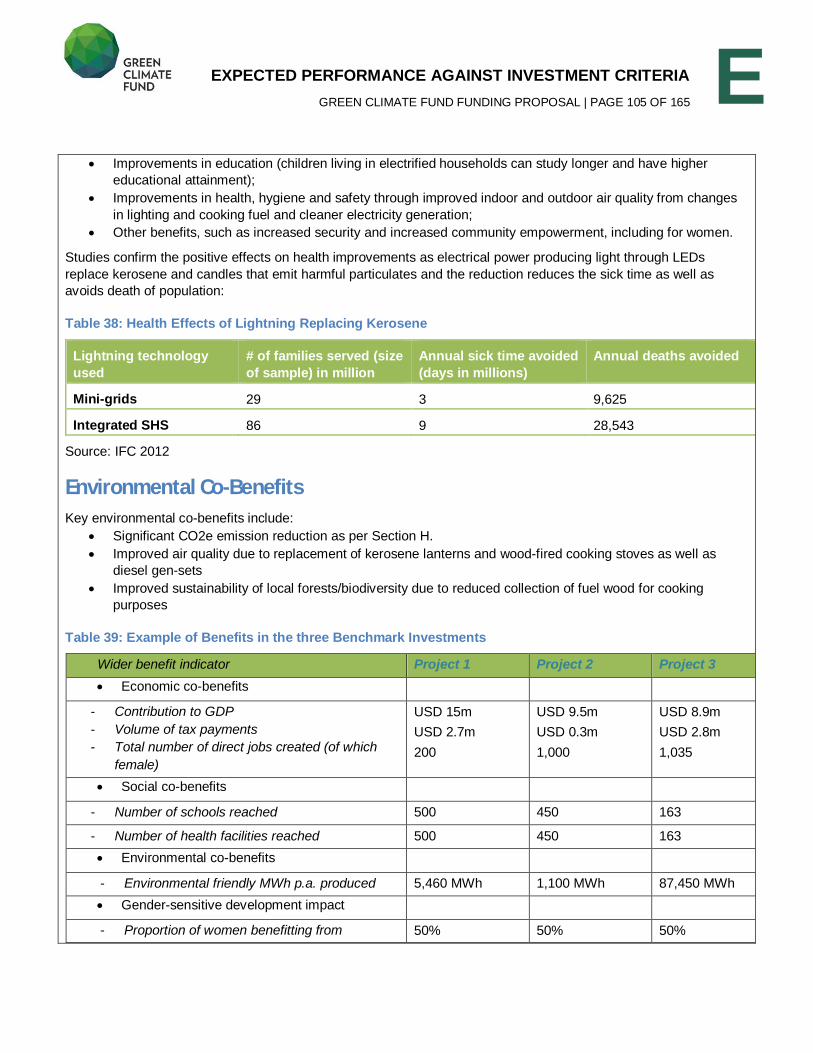
EXPECTED PERFORMANCE AGAINST INVESTMENT CRITERIA GREEN CLIMATE FUND FUNDING PROPOSAL | PAGE 105 OF 165
E Improvements in education (children living in electrified households can study longer and have higher
educational attainment);
Improvements in health, hygiene and safety through improved indoor and outdoor air quality from changes
in lighting and cooking fuel and cleaner electricity generation;
Other benefits, such as increased security and increased community empowerment, including for women.
Studies confirm the positive effects on health improvements as electrical power producing light through LEDs
replace kerosene and candles that emit harmful particulates and the reduction reduces the sick time as well as
avoids death of population:
Table 38: Health Effects of Lightning Replacing Kerosene
Lightning technology used
# of families served (size of sample) in million
Annual sick time avoided (days in millions)
Annual deaths avoided
Mini-grids 29 3 9,625
Integrated SHS 86 9 28,543
Source: IFC 2012
Environmental Co-Benefits Key environmental co-benefits include:
Significant CO2e emission reduction as per Section H.
Improved air quality due to replacement of kerosene lanterns and wood-fired cooking stoves as well as
diesel gen-sets
Improved sustainability of local forests/biodiversity due to reduced collection of fuel wood for cooking
purposes
Table 39: Example of Benefits in the three Benchmark Investments
Wider benefit indicator Project 1 Project 2 Project 3 Economic co-benefits
- Contribution to GDP - Volume of tax payments - Total number of direct jobs created (of which
female)
USD 15m
USD 2.7m
200
USD 9.5m
USD 0.3m
1,000
USD 8.9m
USD 2.8m
1,035
Social co-benefits
- Number of schools reached 500 450 163
- Number of health facilities reached 500 450 163
Environmental co-benefits
- Environmental friendly MWh p.a. produced 5,460 MWh 1,100 MWh 87,450 MWh
Gender-sensitive development impact
- Proportion of women benefitting from 50% 50% 50%
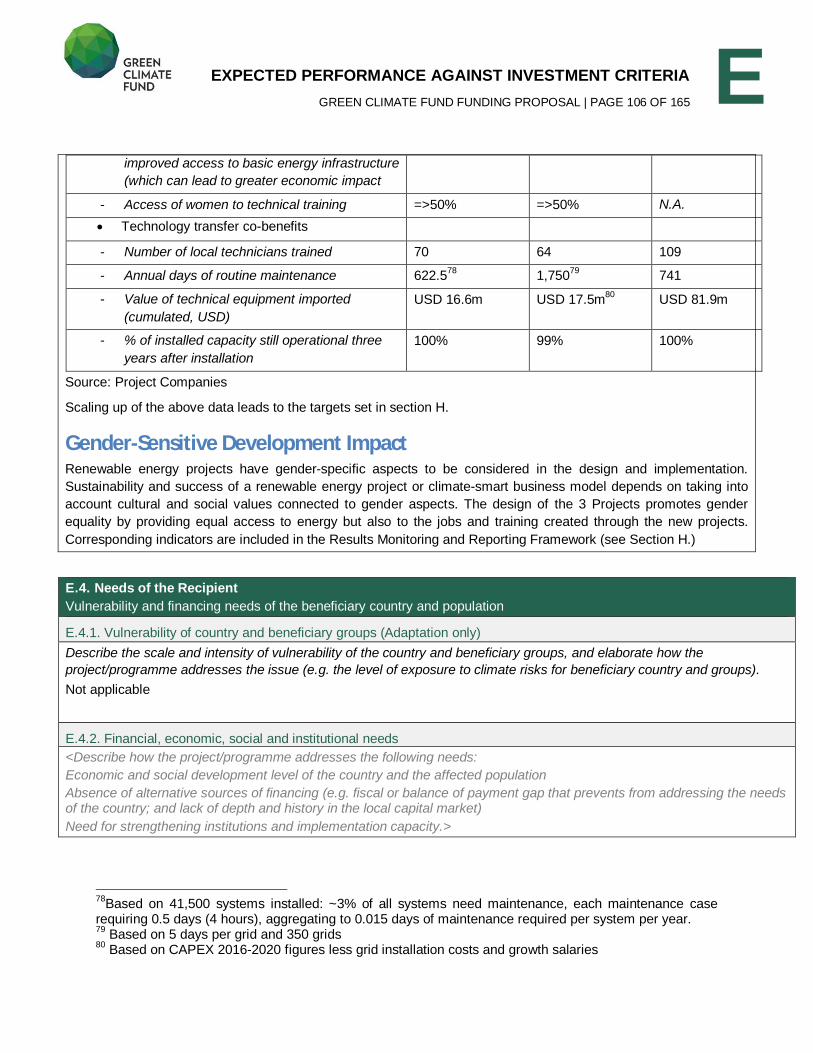
EXPECTED PERFORMANCE AGAINST INVESTMENT CRITERIA GREEN CLIMATE FUND FUNDING PROPOSAL | PAGE 106 OF 165
E improved access to basic energy infrastructure (which can lead to greater economic impact
- Access of women to technical training =>50% =>50% N.A. Technology transfer co-benefits
- Number of local technicians trained 70 64 109
- Annual days of routine maintenance 622.578
1,75079
741
- Value of technical equipment imported (cumulated, USD)
USD 16.6m USD 17.5m80
USD 81.9m
- % of installed capacity still operational three years after installation
100% 99% 100%
Source: Project Companies
Scaling up of the above data leads to the targets set in section H.
Gender-Sensitive Development Impact Renewable energy projects have gender-specific aspects to be considered in the design and implementation.
Sustainability and success of a renewable energy project or climate-smart business model depends on taking into
account cultural and social values connected to gender aspects. The design of the 3 Projects promotes gender
equality by providing equal access to energy but also to the jobs and training created through the new projects.
Corresponding indicators are included in the Results Monitoring and Reporting Framework (see Section H.)
E.4. Needs of the Recipient Vulnerability and financing needs of the beneficiary country and population
E.4.1. Vulnerability of country and beneficiary groups (Adaptation only) Describe the scale and intensity of vulnerability of the country and beneficiary groups, and elaborate how the project/programme addresses the issue (e.g. the level of exposure to climate risks for beneficiary country and groups). Not applicable
E.4.2. Financial, economic, social and institutional needs <Describe how the project/programme addresses the following needs: Economic and social development level of the country and the affected population Absence of alternative sources of financing (e.g. fiscal or balance of payment gap that prevents from addressing the needs of the country; and lack of depth and history in the local capital market) Need for strengthening institutions and implementation capacity.>
78
Based on 41,500 systems installed: ~3% of all systems need maintenance, each maintenance case requiring 0.5 days (4 hours), aggregating to 0.015 days of maintenance required per system per year. 79
Based on 5 days per grid and 350 grids 80
Based on CAPEX 2016-2020 figures less grid installation costs and growth salaries
EXPECTED PERFORMANCE AGAINST INVESTMENT CRITERIA GREEN CLIMATE FUND FUNDING PROPOSAL | PAGE 107 OF 165
E Program Level
Economic and Social Development UGEAP addresses the following needs for social and economic development:
Access to electrical energy (Category 1 and 2 projects) of population and businesses that have no access to
electricity and are also unlikely to be connected to the national electricity grid in the near future; UGEAP hence
contribute to delivering national electrification targets to increase the share for population with access to electrical
energy; this is expected to also increase household income through new entrepreneurial activity with positive
benefits for poverty reduction.
For Category 3 projects: improve electrical energy supply, increase productivity and reduce costs, improve local
health conditions by reducing CO2 emissions from mainly Diesel based gen-sets through hybrid electricity
generation or diesel replacement with renewable energy technology.
All projects reduce further the dependency of the population towards Diesel. Hence, the projects also have the benefit of
reducing:
Trade deficits of affected countries and generating foreign currency savings;
Avoid negative ecological effects from transport related accidents;
The above effects have numerous co-benefits as laid out in section E.3. above and also portrayed in the three sample
transactions chosen and described below.
Absence of Alternative Sources of Financing Local currency debt funding with the required tenors and interest rates is scarce to non-existent for the businesses
identified, even though their investments are economically and financially profitable. UGEAP works through and with local
banks, lending in parallel or taking over risks which allow the local financial institutions to unlock access to the required
debt capital for the sector.
Need for Strengthening Institutions and Implementation Capacity Local financial institutions are strengthened and increase capacity by working along with UGEAP on transactions that fall
into the respective Categories. Strengthening is further achieved by supplying long term capital to the local banks that
stabilize their funding base and balance sheets – which is a pre-condition for long term lending. As a further benefit, the
risk transfer to UGEAP allows for a more efficient use of the available equity of the local financial institutions, which also
generates higher taxable returns of the local banks.
In addition, by scaling up renewable energy solutions for households and industry, UGEAP contributes towards the
capacity of local governments and regulators to understand the benefits of off-grid and mini-grid solar power solutions as
well as diesel replacement from renewable energy sources and to improve the enabling framework for such transactions
implemented by the private sector.
Category 1 and 2 Projects These projects contribute to the economic and social development level of the country and the affected population,
especially as these relate to:
The need for electrification: Serving rural households with electricity, otherwise being off-grid/relying on high-
EXPECTED PERFORMANCE AGAINST INVESTMENT CRITERIA GREEN CLIMATE FUND FUNDING PROPOSAL | PAGE 108 OF 165
E emission power sources, increase employment, poverty reduction and health benefits, including especially for
women and children;
The need for development of local businesses: projects enable local entrepreneurs in rural areas by providing
necessary tools and knowledge for the productive use of a SHS;
Economic development in remote off-grid areas: projects with innovative system of affordable but effective and
efficient PV mini-grids.
In respect to strengthening financing institutions and growing implementation capacity:
Pre-financed solar home systems allow for micro-credits for the local rural population to finance SHS (otherwise
impossible) with 36 months finance rates, plus customer affordability score assessment to avoid private customer
debts;
Solid growth needs to be supported by loans through local financial institutions or directly from UGEAP as the
“usual” means of financing growth after the start-up phase;
With the UGEAP platform and funding, local financial institutions will be incentivized to provide financing to the
development of aggregators who pool financing needs of villages and communities as well as multiple customer
relationship.
In respect to improving knowledge of local governments and regulators:
Where appropriate, work with local regulators to set / meet technical standards applicable to off-grid and mini-grid
solutions
Report on the impact of these projects and their contribution towards meeting the national (renewable) electrification
target
Category 3 Project These projects contribute to the economic and social development level of the country and the affected population,
especially as these relate to:
Innovative system of easy deployable and removable PV systems,driving economic development in remote off-grid
areas, reducing dependence on Diesel and improving health conditions.
In respect to strengthening financing institutions and growing implementation capacity:
With the UGEAP platform and funding, local financial institutions will be incentivized to provide financing to
community grids;
Strengthening of the understanding of the value added of renewable energy based power supply on the side of
commercial customers;
Training of local service providers for installation, operations and maintenance strengthens the local
implementation capacity for similar projects.
Through all of the above, investments in Categories 1, 2 and 3 will not just contribute to socio-economic development, but
also to Millennium Development Goals 7a (as regards the reduction in carbon dioxide emissions) and 8F (as regards
benefits of new technologies), respectively Goal 7 “Ensure access to affordable, reliable, sustainable and modern energy
for all” and Goal 13 “Take urgent action to combat climate change and its impact” of the new 2030 Sustainable
Development Goals, adopted by world leaders in September 2015.
E.5. Country Ownership
Beneficiary country (ies) ownership of, and capacity to implement, a funded project or programme
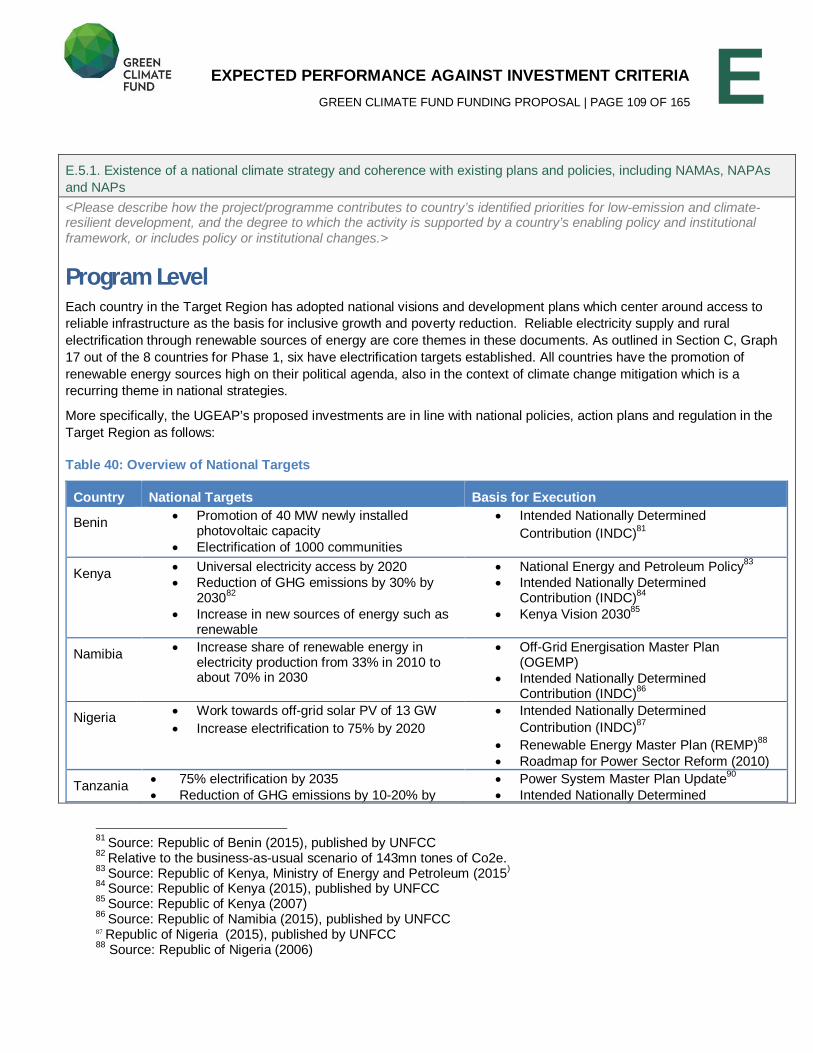
EXPECTED PERFORMANCE AGAINST INVESTMENT CRITERIA GREEN CLIMATE FUND FUNDING PROPOSAL | PAGE 109 OF 165
E E.5.1. Existence of a national climate strategy and coherence with existing plans and policies, including NAMAs, NAPAs
and NAPs <Please describe how the project/programme contributes to country’s identified priorities for low-emission and climate-resilient development, and the degree to which the activity is supported by a country’s enabling policy and institutional framework, or includes policy or institutional changes.>
Program Level Each country in the Target Region has adopted national visions and development plans which center around access to
reliable infrastructure as the basis for inclusive growth and poverty reduction. Reliable electricity supply and rural
electrification through renewable sources of energy are core themes in these documents. As outlined in Section C, Graph
17 out of the 8 countries for Phase 1, six have electrification targets established. All countries have the promotion of
renewable energy sources high on their political agenda, also in the context of climate change mitigation which is a
recurring theme in national strategies.
More specifically, the UGEAP’s proposed investments are in line with national policies, action plans and regulation in the
Target Region as follows:
Table 40: Overview of National Targets
Country National Targets Basis for Execution
Benin
Promotion of 40 MW newly installed photovoltaic capacity
Electrification of 1000 communities
Intended Nationally Determined
Contribution (INDC)81
Kenya Universal electricity access by 2020
Reduction of GHG emissions by 30% by 2030
82
Increase in new sources of energy such as renewable
National Energy and Petroleum Policy83
Intended Nationally Determined Contribution (INDC)
84
Kenya Vision 203085
Namibia Increase share of renewable energy in electricity production from 33% in 2010 to about 70% in 2030
Off-Grid Energisation Master Plan (OGEMP)
Intended Nationally Determined Contribution (INDC)
86
Nigeria Work towards off-grid solar PV of 13 GW
Increase electrification to 75% by 2020
Intended Nationally Determined
Contribution (INDC)87
Renewable Energy Master Plan (REMP)88
Roadmap for Power Sector Reform (2010)
Tanzania 75% electrification by 2035
Reduction of GHG emissions by 10-20% by
Power System Master Plan Update90
Intended Nationally Determined
81
Source: Republic of Benin (2015), published by UNFCC 82
Relative to the business-as-usual scenario of 143mn tones of Co2e. 83
Source: Republic of Kenya, Ministry of Energy and Petroleum (2015)
84 Source: Republic of Kenya (2015), published by UNFCC
85 Source: Republic of Kenya (2007)
86 Source: Republic of Namibia (2015), published by UNFCC
87 Republic of Nigeria (2015), published by UNFCC 88
Source: Republic of Nigeria (2006)
EXPECTED PERFORMANCE AGAINST INVESTMENT CRITERIA GREEN CLIMATE FUND FUNDING PROPOSAL | PAGE 110 OF 165
E 2030
89 Contribution (INDC)
91
Source: Deutsche Bank
Benin Benin submitted its Intended Nationally Determined Contribution (INDC) on 7 August 2015, committing to lower emissions
in its production, energy consumption, transport, and agriculture and forestry sectors. The country signed up to adapt its
national development agenda in order to reduce its CO2 emissions substantially and to undertake the necessary mitigation
measures. Therewith, the country offers to cut 5 Mt from the energy sector and 115 Mt from the land use and forestry
sector between the years 2020-2030. This shall be achieved within the framework of the national targets that preview the
promotion of 40MW newly installed photovoltaic capacity which will ultimately lead to the electrification of 1000
communities. 92
Benin commits to improve its energy efficiency by using renewable energy sources in all sectors especially in the fields of
agriculture and transport and is working on a program to valorize renewable energies at large scale. The recently created
national agency for the development of renewable energies (ANADER) plans to create 105 solar mini-grids for villages not
connected to the national grid. Renewable energy development measures foresee among others the implementation of 1
million solar lamps in Beninese households in rural and peri – urban areas until 2030 (“Lights for All” Program). Ultimately,
solar energy is planned to be used for the extraction of salt in order to restore the country´s fragile ecosystems such as
mangroves.
Namibia The goal of Namibia’s Vision 2030 is a “prosperous and industrialized Namibia, developed by her human resources,
enjoying peace, harmony and political stability”. The National Development Plan which serves as the implementation
framework for Vision 2030 identified 5 “Basic Enablers” which are critical to achieve this vision, including reducing extreme
poverty and infrastructure. Within infrastructure, Namibia seeks to have in place adequate base load energy to support
industry development through the construction of energy infrastructure and the production capacity from 400 to more than
750 mega watts by 2017. Furthermore, Namibia seeks to increase access to energy from 60% in 2012 to 65% in 2017. To
achieve this goal the government will “promote the use of economically viable renewable technologies, as a complement
to grid electrification, to improve energy provision to rural areas.” As women represent over 50% of the population, Vision
2030 seeks to ensure that minimum standards ensure equitable access for both men and women.93
Namibia has set itself am Off-Grid Energisation Master Plan (OGEMP) and the Ministry of Environment and Tourism and
have recently issued the Nationally Appropriate Mitigation Action (NAMA): Rural Development in Namibia through
electrification with renewable energies, namely to provide access to appropriate energy technologies to everyone living or
working in off-grid areas.94
In its INDC, Namibia undertakes to Namibia aims at a reduction of about 89% of its GHG emissions at the 2030 time
90
Source: Republic of Tanzania (2012)
89 Relative to the business-as- usual scenario of 138-153 mn tones of Co2e.
91 Source: Republic of Tanzania (2015), published by UNFCC
92 The Road to Paris.org (2015) 93
Source: 1) Republic of Namibia (2013): Namibia’s Fourth National Development Plan. 2) Republic of Namibia (2004): Namibia Vision 2030. 94
http://www.undp.org/content/undp/en/home/librarypage/environment-energy/mdg-carbon/nama-on-rural-development-in-namibia-through-electrification-wit.html
EXPECTED PERFORMANCE AGAINST INVESTMENT CRITERIA GREEN CLIMATE FUND FUNDING PROPOSAL | PAGE 111 OF 165
E horizon resulting in a projected GCG emission reduction of 20 00o Gt. As part of the required measures, Namibia plan to
to increase the share of renewables in electricity production from 33% to 70%.
Nigeria Nigeria’s Vision20:2020 aims to launch Nigeria on a path towards becoming a strong, diversified, sustainable and
competitive economy among the top 20 economies in the world. Access to reliable electricity for households and
industries is a cornerstone to achieve this vision and meet the needs of Nigeria’s 140 million inhabitants. Vision 20:2020
also undertakes to promote the use of ‘green technology’ to ensure sustainable production in the electricity and agricultural
sectors.
Nigeria offers in its INDC a pledge to reduce its emissions by 20% from business as usual levels in 2030, rising to a
possible 45% contingent upon adequate international support. The country commits to work towards off-grid solar
photovoltaic systems of 13GW that shall result in an electrification increase to 75% by 2020.
Nigeria, which became the largest economy in sub-Sahara Africa in 2014, chose to adopt these renewable energy
measures in its national development agenda in order to prevent incurring costs that would result from exacerbated climate
change. With regard to this, renewable energy measures would lead to a potential 31m tones reduction of GHG per year in
2030.
Nigeria is host to a number of Clean Development Mechanism projects, as well as projects financed by the Adaptation
Fund. With regard to this, the Federal Executive Council approved the Nigeria Climate Change Policy Response and
Strategy in September 2012 thus underlining the efforts that the country is undertaking in the field of renewable energy.95
Tanzania According to its national development plan, Vision 2025, Tanzania seeks to “graduate from a least developed country to a
middle income country by 2025 with a high level of human development”. Scaling up investments in energy and transport
infrastructure is one of the five strategic pillars of Vision 2025 with the objective to unleash the country’s resource potential
to fast-track the provision of the basic conditions for broad-based and pro-poor growth, with a targeted GDP growth rate of
8% p.a. Energy has been identified as an essential service whose availability and quality determines success or failure of
development. The main source of energy in Tanzania is biomass (fuel-wood and charcoal) which accounts for about
85.5% of total energy consumption. More than 80% of energy derived from biomass is consumed in rural areas. Electricity
accounts for 6% of total energy consumption. So far very few alternative renewable energy resources, such as mini-hydro,
wind, coal, solar and geothermal, have been commercially exploited, despite their potential availability in the country. The
national grid supplies only about 12% of urban and 2.5% of rural households. The National Five Year Development Plan
therefore seeks to work on new sources of energy production across the country. The proposed interventions target the
development of alternative sources of cleaner and renewable energy sources, including natural gas, solar, and wind. The
Plan also calls for additional emphasis on scaling-up rural electrification for district headquarters, townships, villages, and
commercial centers as the basis for improved growth, economic development, and enhanced living standards.
Crosscutting goals of the Five Year Development Plan are climate change mitigation and adaptation and gender
considerations, as both play a crucial role in achieving the goals of Vision 2025. Preservation of the rich ecological base of
Tanzania and mitigating and adapting to the impact of climate change are of prime importance in ensuring sustainable
growth. The costs from draught is expected to as high as 2% of GDP by 2030 and owing to rising sea level a loss of 274
km2 of land is forecast. Therefore, environmental concerns will be mainstreamed in all future policy measures and
henceforth they will be given utmost priority along with climate-wise economic development policies.
95 Republic of Nigeria (2015), published by UNFCC
EXPECTED PERFORMANCE AGAINST INVESTMENT CRITERIA GREEN CLIMATE FUND FUNDING PROPOSAL | PAGE 112 OF 165
E Tanzania has put a comprehensive framework in place to develop transparent sector regulation, promote rural
electrification and increase private sector participation in renewable energy projects:
Key policies and legislation for electricity supply in Tanzania are the Energy and Water Utilities Authority Act, 2001
and 2006; National Energy Policy, 2003; Rural Energy Act, 2005; Electricity Act, 2008; and Public Private
Partnership Act. No. 18, 2010;
The Rural Energy Agency (REA) is processing additional grant-co-funding to prepare 60 stand-alone solar projects
and mini-grid projects to benefit more consumers, also preparing a Rural Electrification Investment Prospectus that
is for the first time integrating grid-based electricity access planning with renewable energy-based mini-grid and
stand-alone electrification options;
The Ministry of Energy and Minerals (MEM) and the Rural Energy Agency (REA) have policies and procedures in
place to ensure compliance with social and environmental safeguards;
The National Electrification Program Prospectus estimates that about half of the rural population might be more
cost-effectively served by mini grids and off-grid options, 20% could benefit from renewable energy mini grids and
32% from stand-alone and mini-grid PV. The prospectus will define a least-cost investment plan for 2013–22,
aimed at electrifying 1,200 development centers (about 6,000 localities) with the highest potential. The prospectus
will define the least cost path for grid electrification and will identify those districts and communities that cannot be
cost-effectively reached by grid and should be targeted for private sector–driven, off-grid electrification
investments. The prospectus guides the SREP-Tanzania off-grid electrification investments96;
The three top priority choices that emerged to support national development priorities were geothermal power
development, renewable energy for rural electrification (RERE), and alternative biomass supply options. The
Government of Tanzania decided to focus on the first two priorities, with the understanding that additional SREP
resources, if they become available, would be used to implement the strategy to emerge from the Biomass Energy
Strategy Tanzania (BEST) initiative now under development97
;
The National Climate Change Strategy will integrate the climate change dimension into national policies and
programs.
Kenya Kenya Vision 2030 aims to transform Kenya into a newly industrializing, “middle-income country providing a high quality
life to all its citizens by the year 2030”. A focus on energy; science, technology and innovation underpins the Vision as
strategic pillar. The National Energy and Petroleum Policy clearly states that the range of development projects identified
under Vision 2030 will require Kenya to generate more energy at a lower cost and increase efficiency in energy
consumption. With electricity being the most sought after energy service and crucial to the socio-economic development of
the country, Kenya has developed a roadmap “5,000+ MW by 2016 – Power to Transform Kenya” to raise the generation
capacity by at least 5,000MW from 1,664MW as at October, 2013 to slightly over 6,700 MW by 2016. Through this
roadmap the generation cost is projected to reduce from US¢ 11.30 to 7.41, while the indicative end-user tariffs are
projected to reduce from US¢ 14.14 to 9.00 for commercial/industrial customers and from US¢ 19.78 to 10.45 for domestic
customers. In achieving this goal, renewable energies will play a critical role as in addition to having the potential to
enhance energy security. Kenya acknowledges the potential of renewable energies to mitigate climate change, generate
income, create employment and generate foreign exchange savings. The percentage of renewable energy harnessed is
insignificant relative to its potential. Kenya offers one of the largest and most dynamic markets for solar energy in Africa.
The Kenya Renewable Energy Association (KEREA) estimates that approximately 300,000 rural households in the country
have solar home systems installed, and between 10,000 and 20,000 PV systems are currently being sold annually. The
96
SREP Tanzania, 2013,p. 15 97
Ibid, p. 16
EXPECTED PERFORMANCE AGAINST INVESTMENT CRITERIA GREEN CLIMATE FUND FUNDING PROPOSAL | PAGE 113 OF 165
E Energy Regulatory Commission (ERC) is responsible for the economic and technical regulations and their enforcement in
the renewable energy sector.
To further combat climate change, the Ministry of Energy and the Kenya Association of Manufacturers signed a
Memorandum of Agreement to establish a Centre for Energy Efficiency and Conservation (CEEC) with the goal to avoid
cumulative emissions of CO2 to the tune of 7.0 million tonnes by the end of year 2016, equivalent to more than
20,000GWh in energy savings. As the lack of access to affordable energy services disproportionately affects women and
girls due to their traditional roles, household responsibilities, and low socio-political status, the government will target to
mainstream gender, youth and persons with special needs issues in energy and petroleum policy formulation, planning,
production, distribution and use.98
In its INDC, Kenya seeks to abate its GHG emissions by 30% by 2030. Kenya’s planned mitigation activities include the
expansion of wind, hydro, solar and other renewable and clean energy options.
Category 1 & 2 Projects Home solar system activities deliver towards a country’s target to increase the number of population that has
access to clean energy, thereby contributing to emission reduction targets, while it is a purely private sector
initiative and is not based on public sector support in terms of funding;
The companies obeys all applicable regulation with regards to consumer protection and electrical supply;
The activity of the companies do not officially qualify as energy supply as components are household appliances;
however, the company carefully considers consumer protection and waste management;
The mini-grid provider’s roadmap is fully in line with the Scaling-Up Renewable Energy Program in Low Income
Countries (SREP), funded by the World Bank through the Climate Investment Fund;
The program also is coherent with countries” Vision 2030 which in most Phase I countries aims to ensure
availability of affordable and reliable energy supplies as the basis for economic growth and to attract private sector
participation in the development of the power sector.
The program corresponds to the mitigation strategies of all countries included in their INDCs which focus on
increasing the share of renewable energy in total electricity production as well as a programmatic focus on
renewable off-grid and mini-grid solutions in most countries, including solar technologies.
Category 3 Projects The project developer contributes to meeting future energy demand and improved productivity as a basis for socio-
economic development;
The project developer contributes to filling the supply gap in off-grid regions;
Helps to attract substantial private sector participation in the development of the power sector;
The project developer’s roadmap is also fully in line with the Scaling-Up Renewable Energy Program in Low
Income Countries (SREP), funded by the World Bank through the Climate Investment Fund;
The project developer further drives the development of the legal and regulatory framework as well as it also
engages further in the dialogue with relevant government authorities, thus strengthening their capacity as off-grid
solutions are on their agenda.
The project developer contributes to national emission reduction targets and strategies as laid out in the INDCs.
E.5.2. Capacity of accredited entities and executing entities to deliver
98
Sources: 1) Government of the Republic of Kenya (2007).Kenya Vision 2030: the popular version. 2) Ministry of Energy and Petroleum (2015). Draft National Energy and Petroleum Policy.
EXPECTED PERFORMANCE AGAINST INVESTMENT CRITERIA GREEN CLIMATE FUND FUNDING PROPOSAL | PAGE 114 OF 165
E <Please describe experience and track record of the accredited entity and executing entities with respect to the activities that they are expected to undertake in the proposed project/programme.>
Program Level There are four crucial aspects for the success of UGEAP with respect to Deutsche Bank as executing agent for the
program:
1. Ability to set up investment vehicles that can execute the Target Investments working through and with local financial
institutions;
2. Attract and place capital with private sector investors for UGEAP.
3. Ability to structure the refinancing arrangement with local financial institutions;
4. Ability to originate, structure and underwrite the Target Investments with a first focus on Benin, Tanzania, , Kenya,
Nigeria andNamibia
Ad 1) Deutsche Bank has a proven track record to set up investment vehicles in various jurisdictions, including
Luxembourg, that meet investors demand, including public-private investment vehicles such as UGEAP. Ad 2) DB
continuously raises funds for its open ended funds and as well as for new funds/products it launches. It raises debt and
equity in all forms, through multiple sales channels, each with its own merits. The three primary sales channels for funds
like UGEAP are:
Global Client Group (GCG) for large-scale institutional investors like pension funds and insurance companies;
Structured Credit Trading Desk (SCTD) for all types of investors;
Regional Wealth Management advisors (WM) for medium-scale investors such as foundations, churches or family
offices.
The cumulative amount of capital raised by these sales units reaches several billions per year through all three sales
channels while DB expects that UGEAP will be placed predominantly with investors covered by GCG and SCTD.
Together, these units place around EUR 130-150bn of capital with investors. For its Alternatives division, which manages
funds similar to UGEAP, Deutsche Asset Management has raised over EUR 23 billion since 2015 (as of March 2016).”
Ad 3) DB has already identified partner institutions that are willing and keen to deliver towards the success of UGEAP. DB
attaches the memorandum of understandings with two institutions that represent each one of the two options UGEAP shall
offer:
Syndication;
Funding and risk participation.
Ad 4) DB has the required expertise structuring the Target Investments relying on its infrastructure, corporate finance and
trade finance business units which includes the Sustainable Investments team that is in charge to manage concepts like
UGEAP. The team includes investment professionals that focus on Africa (and already manage investments in Africa
through existing funds). In total the Sustainable Investments team already covers sustainable assets under management
of USD 1.8bn as of today.
Project Level Each investee will need to fulfill the following requirements:
The company has an established track record of activity over the time of its existence
The company has a track record in working on the technology offered
The company is active in the local market for a satisfactorily long period of time already
EXPECTED PERFORMANCE AGAINST INVESTMENT CRITERIA GREEN CLIMATE FUND FUNDING PROPOSAL | PAGE 115 OF 165
E The company has successfully performed a pilot phase or implemented projects
The company has local presence in the respective country and follows national employment laws
E.5.3. Engagement with civil society organizations and other relevant stakeholders <Please specify the multi-stakeholder engagement plan and the consultations that were conducted when this proposal was developed.>
Program Level In the current development state of the UGEAP Program, consultations at the Program level continue to take place with
the NDAs of countries in the Target Region, international private investors for the A Capital and public investors for the B
Capital, local financial institutions as well as renewable energy technology providers.
Regarding the NDAs, final draft versions of this funding proposal containing all material information have been shared with
NDAs and discussed with representatives of the NDAs. The following countries have provided non-objection letters for
UGEAP:
- Benin
- Kenya
- Namibia
- Nigeria
- Tanzania
The concept and this proposal has been presented and discussed in more detail to and with selected NDAs at the Green
Climate Fund 2015 Africa – Middle East Regional Workshop hosted in Alexandria which took place from 6-8 September
2015.
Beyond an exchange with the NDAs, Deutsche Bank has began to organize stakeholder workshops to introduce the
UGEAP as a concept to local project developers as well as local and regional financial institutions and further strengthen
government awareness and understanding. Workshops target:
- to establish a broader knowledge of the concept of UGEAP;
- connect to local companies active in certain regions or sectors only with a view to adequately involve the
local/regional private sector;
- understand any local peculiarities to be taken into account for the detailed offering of the UGEAP based on
national regulation, priorities and realities; and
- engage with local associations to establish a working-relationship and active information exchange.
Stakeholder workshops and events have already been held in the following target countries:
Tanzania
A first workshop has been held in Dar-Es-Salaam 16 February 2016 co-operation with the Tanzanian Private Sector
Foundation (TPSF), while the Renewable Energy Association is a member of the TPSF. About 50 participants included
representatives from local project companies already active or planning to become active in the sector, local banks,
international companies and local advisers, most of them members of the TPSF. The workshop confirmed the strong
demand for UGEAP both from the local private sector and local banks. The overall feedback received from workshop
participants mirrors the market assessment outlined in this funding proposal that local markets do not provide sufficient
debt capital in general and to companies active in the clean energy access space in particular, including the limited
availability of local currency financing for local businesses.
Benin
EXPECTED PERFORMANCE AGAINST INVESTMENT CRITERIA GREEN CLIMATE FUND FUNDING PROPOSAL | PAGE 116 OF 165
E Similarly, in-depth stakeholder engagement took place in Benin in February 2016 through meetings with local banks, the
Renewable Energy Association, project developers, corporates active in the sector and relevant government stakeholders.
The meetings also confirmed demand for longer term debt finance for UGEAP’s investment categories from the private
sector and from local banks to increase their clean energy finance capabilities.
Kenya and Nigeria
On May 31 and July 2 DB held events in Nairobi and Lagos hosting around 40-50 participants ranging from (mini-grid)
project developers and decentralized energy service companies and industry associations to local banks, consultants,
technical assistance provider as well as multilaterals and donor agencies. While attendance from all types of energy
access businesses was very positive; local banks attendance – as to be expected – was more restrained with around 4 -6
banks per event. The workshop sessions and following discussion confirmed our investment thesis that we need to work
with local banks to finance energy access locally by bringing bankable transactions to the local banks rather than awaiting
them proactively approaching the sector.
DB will continue the discussion with NDAs in the remaining to obtain the non-objection statements respectively. Further,
DB targets to engage with countries during the first roll-out phase of the UGEAP that are prospective potentials for phase
II.
Regarding international private investors, the UGEAP concept was discussed with select institutional investors in
Germany, the Netherlands, the UK and the US and met with strong interest, as investors perceive the renewable energy
sector in Africa, including off-grid solutions, as a growing and attractive investment opportunity.
In terms of local financial institutions, the concept was shared and discussed with several local and regional banks in Africa
and met with positive feedback. Memorandum of Understanding with a regional partner bank as well as a Kenyan bank for
phase I have been finalized and additional discussions with potential partner banks are ongoing.
Regarding energy technology providers, a comprehensive consultation took place with several providers who are already
active in the Target Region and are interested to expand their activities. DB entertains a dialogue with over 40 technology
providers who have the potential to become partner companies of UGEAP.
Once approved, UGEAP will continue its consultations in each of its country of operations with all relevant stakeholders,
including stakeholders from national and local government, local and national agencies including regulatory agencies,
business associations/representatives, civil society organizations as well as academic and research institutes. These
stakeholders will also be consulted for the Program’s mid-term review and its final impact evaluation. UGEAP will organize
meetings or workshops to discuss best practices and challenges, identify opportunities for further facilitation e.g. through
regulatory measures, and integrate lessons learned into the Program’s further development.
At the level of the initial investment projects, a multi-stakeholder engagement process has been conducted.
For each of Project 1-3 different stakeholders on local and national level have been heard and integrated through
dialogues, meetings, need assessment studies based on interviews on household as well as community level in the project
concept development. Especially for Project 1 and 2 this approach proved valuable already in the project concept
development phase in order to create trust between the actors (project developers and communities/ households) and to
come to solutions that provide mutual benefits and a greater sense of ownership. For all Projects, multi-stakeholder
engagement is an integral part of the Social and Environmental Management System (SEMS) that establishes a process
of stakeholder engagement and disclosure as outlined in F.3. Environmental, Social Assessment, including Gender
Considerations, and will be considered and integrated in the entire Project cycle from concept phase, preparation,
implementation to the operational phase as well as ongoing monitoring and evaluation.
Project 1
EXPECTED PERFORMANCE AGAINST INVESTMENT CRITERIA GREEN CLIMATE FUND FUNDING PROPOSAL | PAGE 117 OF 165
E For multi-stakeholder engagement, the home solar system provider of Project 1 builds the following aspects and
consultations into their business model:
A close contact to all stakeholder groups such as local population, customers, employees and staff;
Before entering new markets/regions, the home solar system provider engages with ward executive officers,
regional governments and village communities and their respective leaders;
The home solar system provider uses feed-back channels by conducting surveys, gathering feedback through its
hotline, interacting with potential and existing customer on the ground via contractors and staff (mainly Installation
Technicians, Sales Agent, Market Hub Operators and Loan Field Officers);
Feed-back is used for further improvement of services, products, target areas, etc.
Project 2 For multi-stakeholder engagement, mini-grid providers of Project 2 build-in the following aspects and consultations into the
development of their projects:
The mini-grid provider maintains close contact with relevant national authorities;
Community outreach and engagement is ensured through capturing local approval for installed projects from
village committees, and through the implementation of community level dialogues around project introduction;
The mini-grid provider has established a process for effective and participatory community engagement prior to the
building of new mini-grids;
The mini-grid provider partners with local SMEs, NGOs, universities and CSOs to implement its corporate
operations as well as innovation projects;
The mini-grid provider remains connected to the broader Sustainable Energy for all (SE4ALL) community via
conferences and networking events in order to learn from best practice examples and follow current
developments.
Project 3 As a basis for their interacting with their stakeholders, the project developer of Project 3 has created a stakeholder map,
based on interest of stakeholders and influence of stakeholders:
Key stakeholders are those with a high interest as well as a high influence on a project’s success, like customers,
suppliers, and investors.
The project developer also pays special attention to stakeholders with a lower initial interest but with a high
influence, especially city councils or other (higher) authorities;
The project developer interacts with nearby city councils, i.e. use local customer contacts to set up meeting with
relevant council members and/or key administrators, give a presentation on the project and its socio-economic
impact, highlights benefits of solar hybridization to local economy and SMEs, discusses, clears and alleviates any
concerns that are raised;
As regards the regulatory authority in Namibia, the project developer and its customers aim to obtain any
necessary permits quickly, while ensuring compliance with local and national legislation, regulations, as well as
local and global technical standards.
This stakeholder mapping serves as the basis for the project developer’s ongoing local engagement.
E.6. Efficiency and Effectiveness
Economic and, if appropriate, financial soundness of the project/programme
E.6.1. Cost-effectiveness and efficiency
EXPECTED PERFORMANCE AGAINST INVESTMENT CRITERIA GREEN CLIMATE FUND FUNDING PROPOSAL | PAGE 118 OF 165
E <Describe how the financial structure is adequate and reasonable in order to achieve the proposal’s objectives, including addressing existing bottlenecks and/or barriers; providing the least concessionality; and without crowding out private and other public investment.>
Barriers As described in section B and D.1 there is a strong need to mobilise debt capital to the benefit of low-emission electricity
supply to End Beneficiaries. Public sector funding through developmental institutions will not suffice to serve the capital by
investments that are needed and viable in order reach a transformative scale towards low-emission electricity supply in the
Target Region. Private sector capital is required to be mobilised but is held back by:
the high risk perception of private sector investors;
the relatively small investment amounts the added-value investments require;
A local barrier is the high capital intensity of the investments and the lending practices local banks follow that oftentimes
focus on collateral based lending for lower margin business or acceptance of a lack of “acceptable” collateral against a
higher risk charge (retail business).
Additionality
Close Co-Operation with Local Financial Institutions UGEAP provides two solutions to local financial institutions to overcome the local barriers. In cases where local banks are
able and willing to serve the sector with local currency funding, UGEAP will not compete with local banks but crowd-in local
sources of financing through local banks and support them with:
long term debt capital;
risk sharing to free up regulatory / economic equity.
This offers a tailored solution to local banks while details will be tailored to the capacity of local financial institutions.
UGEAP is not crowding out, but crowding in local financial institutions. Co-operations with local banks will not be on an
exclusive basis. In fact, UGEAP has an interest to sign up as many local partner banks as possible in a single market.
UGEAP will not exclude financial institutions for reasons other than its international credit and quality expectations against
the screening criteria which UGEAP will use.
In case energy supply businesses require USD funding, UGEAP will offer an opportunity to local financial institutions to
make use of UGEAP as a source of funding together with local bank funding.
Private Sector Orientation Investments are private sector oriented, while public sector elements are not excluded (for example: PPA’s with national
grid operators as an income basis for private independent power producers). There is no competition with public sector
initiatives or crowding out public sector services. Rather, Target Investments deliver infrastructure where public bodies are
unable to provide it.
UGEAP involves private sector investors on its own funding side, while GCF’s contribution would allow to trigger access to
such private investment by providing a risk buffer and stabilise the returns. An adequate risk-return profile, including a risk
buffer against first losses and stable returns and low provision rates are pre-requisites to tap into the large debt market that
has a vast amount of funding available for deployment in transactions that produce predictable and stable revenues.
Concessionality
EXPECTED PERFORMANCE AGAINST INVESTMENT CRITERIA GREEN CLIMATE FUND FUNDING PROPOSAL | PAGE 119 OF 165
E The concessionality GCF is supposed to provide is minimal and consists of tolerance for variable returns. In the base
case, GCF’s returns are commensurate with those of the private sector. In addition, GCF is asked to accept the down-side
first loss risk for the subordinate B tranche which can lower the base case return. In an upside scenario, GCF will be
compensated partly for the high downside risk by receiving a larger share of additional returns beyond the target returns
for A and B tranche investors. From a risk-return and contribution perspective, this is the least concessionality that was
identified in the value stream of capital mobilisation for End Beneficiaries.
<Please describe the efficiency and effectiveness, taking into account the total project financing and the mitigation/ adaptation impact that the project/program aims to achieve, and explain how this compares to an appropriate benchmark. For mitigation, please make a reference to E.6.5 (core indicator for the cost per tCO2eq).>
The efficiency of UGEAP is measured based on two indicators:
The amount of projects that are financed with the support from and capital by UGEAP.
The amount of tCO2e emissions being mitigated in absolute numbers.
Investments / Capital Mobilised As described in section E.6.2 in combination with section B.3, the capital contribution by GCF and other public investors
providing about 1/3 of capital of UGEAP’s total volume and around 20% of total capital expenditures of the Target
Investments. Forecasts under an expected scenario suggest that GCF’s and other public capital could mobilise 24 times its
own contribution given that the repayments from existing investments would not be used to repay capital but rather would
be re-invested. The multiple would reduce in case investments cannot be effected with the anticipated volumes or at the
expected speed, however, the ratio could even go up in case investments amortise faster than an assumed 8 years on
average.
In addition, UGEAP is expected to raise 2/3 of private investment from international investors on top of the planned 1/3 of
public investment.
Finally, local financial institutions are expected to contribute their own capital to the projects financed by UGEAP either
through the risk sharing mechanism or through straight co-financing in a syndication structure.
CO2 Savings DB as investment manager of UGEAP will track the amount of tCO2e emissions being mitigated by the investments
financed. DB already operates a proprietary carbon accounting system which has been used in other public-private
partnership funds. Based on the quantification of emission reductions from the 3 transactions that represent the Target
Investments, the “value for money” is shown in section E.6.5.
Each investment will be subject to a pre-assessment that will determine the expected lifetime CO2e savings based on the
measurement framework applied by the investment manager. Minimum thresholds will apply subject to the technology
being used:
Table 41: CO2 Funding Limits
Category Applicable Limit
1 USD400
2 USD150
3 – off-grid USD25
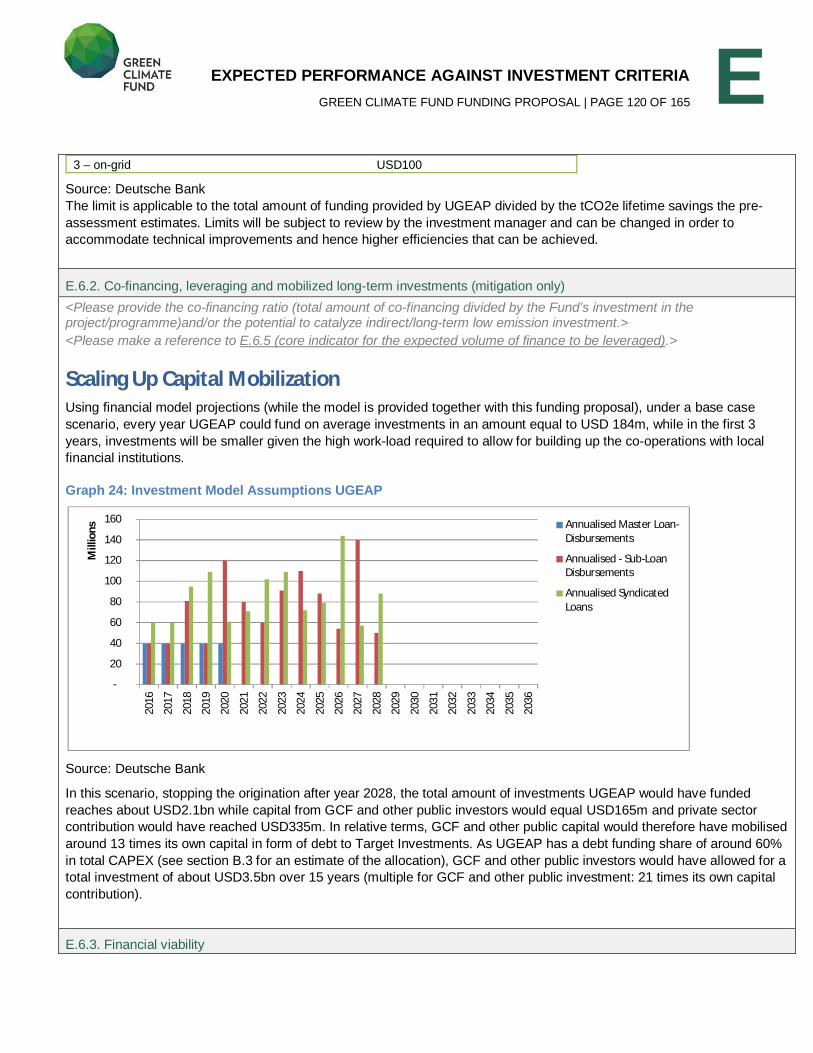
EXPECTED PERFORMANCE AGAINST INVESTMENT CRITERIA GREEN CLIMATE FUND FUNDING PROPOSAL | PAGE 120 OF 165
E 3 – on-grid USD100
Source: Deutsche Bank
The limit is applicable to the total amount of funding provided by UGEAP divided by the tCO2e lifetime savings the pre-
assessment estimates. Limits will be subject to review by the investment manager and can be changed in order to
accommodate technical improvements and hence higher efficiencies that can be achieved.
E.6.2. Co-financing, leveraging and mobilized long-term investments (mitigation only) <Please provide the co-financing ratio (total amount of co-financing divided by the Fund’s investment in the project/programme)and/or the potential to catalyze indirect/long-term low emission investment.> <Please make a reference to E.6.5 (core indicator for the expected volume of finance to be leveraged).>
Scaling Up Capital Mobilization Using financial model projections (while the model is provided together with this funding proposal), under a base case
scenario, every year UGEAP could fund on average investments in an amount equal to USD 184m, while in the first 3
years, investments will be smaller given the high work-load required to allow for building up the co-operations with local
financial institutions.
Graph 24: Investment Model Assumptions UGEAP
Source: Deutsche Bank
In this scenario, stopping the origination after year 2028, the total amount of investments UGEAP would have funded
reaches about USD2.1bn while capital from GCF and other public investors would equal USD165m and private sector
contribution would have reached USD335m. In relative terms, GCF and other public capital would therefore have mobilised
around 13 times its own capital in form of debt to Target Investments. As UGEAP has a debt funding share of around 60%
in total CAPEX (see section B.3 for an estimate of the allocation), GCF and other public investors would have allowed for a
total investment of about USD3.5bn over 15 years (multiple for GCF and other public investment: 21 times its own capital
contribution).
E.6.3. Financial viability
-
20
40
60
80
100
120
140
160
2016
2017
2018
2019
2020
2021
2022
2023
2024
2025
2026
2027
2028
2029
2030
2031
2032
2033
2034
2035
2036
Mill
ions Annualised Master Loan-
Disbursements
Annualised - Sub-Loan Disbursements
Annualised Syndicated Loans
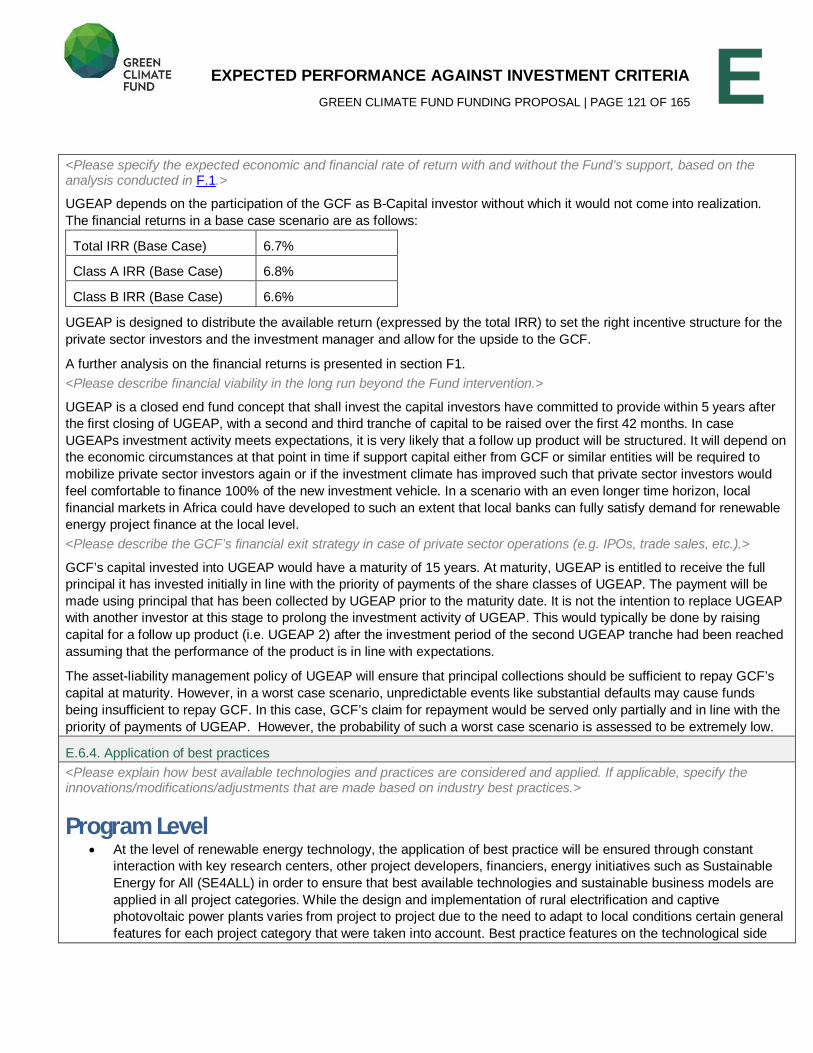
EXPECTED PERFORMANCE AGAINST INVESTMENT CRITERIA GREEN CLIMATE FUND FUNDING PROPOSAL | PAGE 121 OF 165
E <Please specify the expected economic and financial rate of return with and without the Fund’s support, based on the analysis conducted in F.1.>
UGEAP depends on the participation of the GCF as B-Capital investor without which it would not come into realization.
The financial returns in a base case scenario are as follows:
Total IRR (Base Case) 6.7%
Class A IRR (Base Case) 6.8%
Class B IRR (Base Case) 6.6%
UGEAP is designed to distribute the available return (expressed by the total IRR) to set the right incentive structure for the
private sector investors and the investment manager and allow for the upside to the GCF.
A further analysis on the financial returns is presented in section F1.
<Please describe financial viability in the long run beyond the Fund intervention.>
UGEAP is a closed end fund concept that shall invest the capital investors have committed to provide within 5 years after
the first closing of UGEAP, with a second and third tranche of capital to be raised over the first 42 months. In case
UGEAPs investment activity meets expectations, it is very likely that a follow up product will be structured. It will depend on
the economic circumstances at that point in time if support capital either from GCF or similar entities will be required to
mobilize private sector investors again or if the investment climate has improved such that private sector investors would
feel comfortable to finance 100% of the new investment vehicle. In a scenario with an even longer time horizon, local
financial markets in Africa could have developed to such an extent that local banks can fully satisfy demand for renewable
energy project finance at the local level.
<Please describe the GCF’s financial exit strategy in case of private sector operations (e.g. IPOs, trade sales, etc.).>
GCF’s capital invested into UGEAP would have a maturity of 15 years. At maturity, UGEAP is entitled to receive the full
principal it has invested initially in line with the priority of payments of the share classes of UGEAP. The payment will be
made using principal that has been collected by UGEAP prior to the maturity date. It is not the intention to replace UGEAP
with another investor at this stage to prolong the investment activity of UGEAP. This would typically be done by raising
capital for a follow up product (i.e. UGEAP 2) after the investment period of the second UGEAP tranche had been reached
assuming that the performance of the product is in line with expectations.
The asset-liability management policy of UGEAP will ensure that principal collections should be sufficient to repay GCF’s
capital at maturity. However, in a worst case scenario, unpredictable events like substantial defaults may cause funds
being insufficient to repay GCF. In this case, GCF’s claim for repayment would be served only partially and in line with the
priority of payments of UGEAP. However, the probability of such a worst case scenario is assessed to be extremely low.
E.6.4. Application of best practices <Please explain how best available technologies and practices are considered and applied. If applicable, specify the innovations/modifications/adjustments that are made based on industry best practices.>
Program Level At the level of renewable energy technology, the application of best practice will be ensured through constant
interaction with key research centers, other project developers, financiers, energy initiatives such as Sustainable
Energy for All (SE4ALL) in order to ensure that best available technologies and sustainable business models are
applied in all project categories. While the design and implementation of rural electrification and captive
photovoltaic power plants varies from project to project due to the need to adapt to local conditions certain general
features for each project category that were taken into account. Best practice features on the technological side
EXPECTED PERFORMANCE AGAINST INVESTMENT CRITERIA GREEN CLIMATE FUND FUNDING PROPOSAL | PAGE 122 OF 165
E have been integrated into the technical solution already in the business development. Given technological
development but also changes in behavior of end clients’ applied technologies have to be adapted on an ongoing
basis.
Best practices in UGEAP’s financial arrangements are being adhered to by (i) providing local currency loans to
projects which generate local currency revenues, (ii) providing USD long-term funding to local banks with USD
business, so that they can manage the foreign exchange risk on their balance sheet, (iii) ensuring that local banks’
lending practices correspond to international standards and (iv) transparent and frequent reporting to all public and
private investors on a regular basis.
Best practices in terms of social, environmental and gender-aspects will be covered through the Social and
Environmental Policy of UGEAP and the Gender Policy applicable to Deutsche Bank Programmes funded by the
Green Climate Fund as well as UGEAP’s Results Monitoring Framework (see Section H.).
Project 1 Amongst solar home systems and rural electrification concepts, the solar home system technology is considered among
the best available technology that combines all components necessary to run a technical reliable electricity supply. The
technology provides sufficient capacity for small-scale productive activities, thereby providing opportunities for
diversification of household income. The solar home systems provider has also implemented a software database to
monitor and control the system performance of each SHS, follow up customer payments, and supervise company
operations across the globe. In addition, the provider is training local people in installation and maintenance of the solar
home systems, thereby creating sustainable local employment.
Project 2 The mini-grid provider uses best available practices in terms of its technology and commercial operations in three major
ways:
First, all solar PV systems are sized appropriately for anticipated loads, localized irradiation, and annual
seasonality. Best practices in terms of system design, installation, and maintenance are ensured through rigorous
quality testing and trainings for both employees and customers.;
Second, community outreach and engagement is ensured through capturing local approval for installed projects
from village committees, and through the implementation of community level dialogues around project introduction.
These steps are well established in rural development and are critical for the sustainability of newly introduced
technologies into rural contexts;
Third, the provider works with local PV enterprises to deliver its solution in remote areas. This collaboration with
local businesses increases the speed and efficiency at which the provider can deploy electricity connections, while
leveraging local knowledge, networks, and trust to preclude feelings of ill-well from established enterprises in
target communities.
Project 3 The project developer provides best practice in different aspects:
A robust and easy to handle technology which is reliable, tried-and-tested and technically up to date;
Hybrid operation, avoiding expensive and operationally difficult storage devices (adding batteries would render the
solar power system more expensive than diesel-only power, and would need regular maintenance, contain toxic
substances that should be recycled);
In many cases, communities and industries already have diesel generators in operation; The project developer’s
PV plants integrate existing equipment into an environmental much more friendly and more cost-effective hybrid
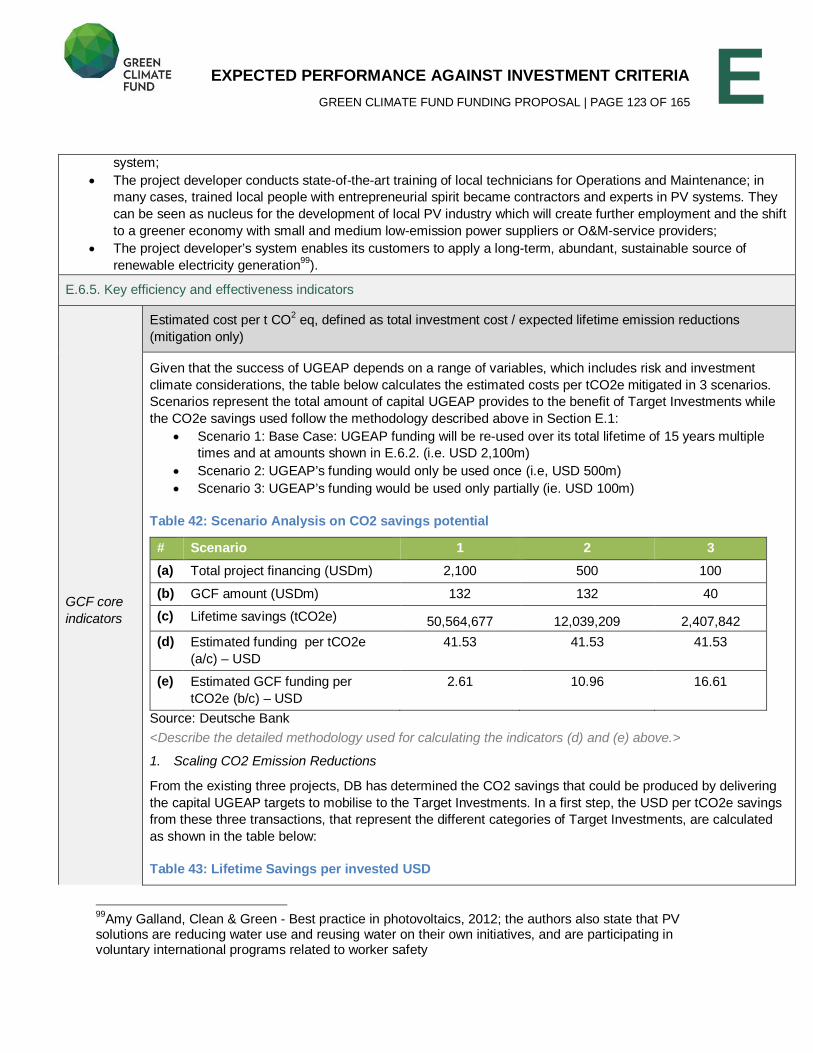
EXPECTED PERFORMANCE AGAINST INVESTMENT CRITERIA GREEN CLIMATE FUND FUNDING PROPOSAL | PAGE 123 OF 165
E system;
The project developer conducts state-of-the-art training of local technicians for Operations and Maintenance; in
many cases, trained local people with entrepreneurial spirit became contractors and experts in PV systems. They
can be seen as nucleus for the development of local PV industry which will create further employment and the shift
to a greener economy with small and medium low-emission power suppliers or O&M-service providers;
The project developer’s system enables its customers to apply a long-term, abundant, sustainable source of
renewable electricity generation99
).
E.6.5. Key efficiency and effectiveness indicators
GCF core indicators
Estimated cost per t CO2 eq, defined as total investment cost / expected lifetime emission reductions
(mitigation only)
Given that the success of UGEAP depends on a range of variables, which includes risk and investment
climate considerations, the table below calculates the estimated costs per tCO2e mitigated in 3 scenarios.
Scenarios represent the total amount of capital UGEAP provides to the benefit of Target Investments while
the CO2e savings used follow the methodology described above in Section E.1:
Scenario 1: Base Case: UGEAP funding will be re-used over its total lifetime of 15 years multiple
times and at amounts shown in E.6.2. (i.e. USD 2,100m)
Scenario 2: UGEAP’s funding would only be used once (i.e, USD 500m)
Scenario 3: UGEAP’s funding would be used only partially (ie. USD 100m)
Table 42: Scenario Analysis on CO2 savings potential
# Scenario 1 2 3 (a) Total project financing (USDm) 2,100 500 100
(b) GCF amount (USDm) 132 132 40
(c) Lifetime savings (tCO2e) 50,564,677 12,039,209 2,407,842
(d) Estimated funding per tCO2e
(a/c) – USD
41.53 41.53 41.53
(e) Estimated GCF funding per
tCO2e (b/c) – USD
2.61 10.96 16.61
Source: Deutsche Bank
<Describe the detailed methodology used for calculating the indicators (d) and (e) above.>
1. Scaling CO2 Emission Reductions
From the existing three projects, DB has determined the CO2 savings that could be produced by delivering
the capital UGEAP targets to mobilise to the Target Investments. In a first step, the USD per tCO2e savings
from these three transactions, that represent the different categories of Target Investments, are calculated
as shown in the table below:
Table 43: Lifetime Savings per invested USD
99
Amy Galland, Clean & Green - Best practice in photovoltaics, 2012; the authors also state that PV solutions are reducing water use and reusing water on their own initiatives, and are participating in voluntary international programs related to worker safety
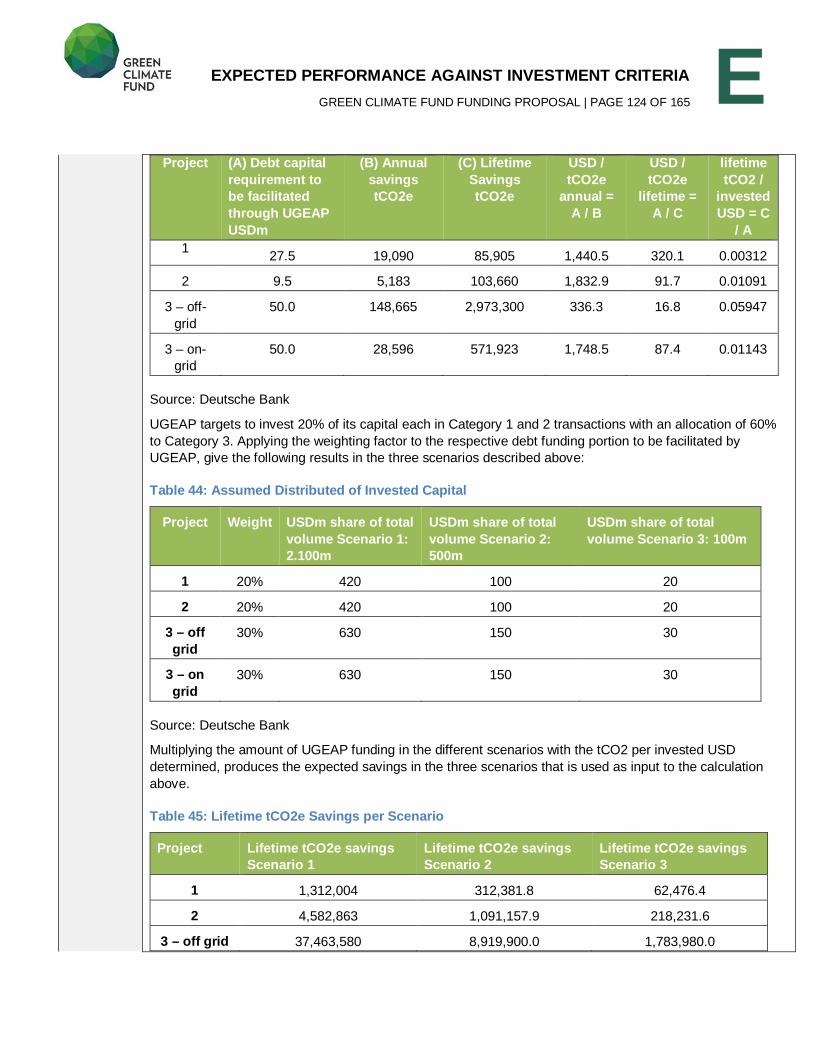
EXPECTED PERFORMANCE AGAINST INVESTMENT CRITERIA GREEN CLIMATE FUND FUNDING PROPOSAL | PAGE 124 OF 165
E Project (A) Debt capital
requirement to be facilitated through UGEAP USDm
(B) Annual savings tCO2e
(C) Lifetime Savings tCO2e
USD / tCO2e
annual = A / B
USD / tCO2e
lifetime = A / C
lifetime tCO2 /
invested USD = C
/ A 1
27.5 19,090 85,905 1,440.5 320.1 0.00312
2 9.5 5,183 103,660 1,832.9 91.7 0.01091
3 – off-
grid
50.0 148,665 2,973,300 336.3 16.8 0.05947
3 – on-
grid
50.0 28,596 571,923 1,748.5 87.4 0.01143
Source: Deutsche Bank
UGEAP targets to invest 20% of its capital each in Category 1 and 2 transactions with an allocation of 60%
to Category 3. Applying the weighting factor to the respective debt funding portion to be facilitated by
UGEAP, give the following results in the three scenarios described above:
Table 44: Assumed Distributed of Invested Capital
Project Weight USDm share of total volume Scenario 1: 2.100m
USDm share of total volume Scenario 2: 500m
USDm share of total volume Scenario 3: 100m
1 20% 420 100 20
2 20% 420 100 20
3 – off grid
30% 630 150 30
3 – on grid
30% 630 150 30
Source: Deutsche Bank
Multiplying the amount of UGEAP funding in the different scenarios with the tCO2 per invested USD
determined, produces the expected savings in the three scenarios that is used as input to the calculation
above.
Table 45: Lifetime tCO2e Savings per Scenario
Project Lifetime tCO2e savings Scenario 1
Lifetime tCO2e savings Scenario 2
Lifetime tCO2e savings Scenario 3
1 1,312,004 312,381.8 62,476.4
2 4,582,863 1,091,157.9 218,231.6
3 – off grid 37,463,580 8,919,900.0 1,783,980.0
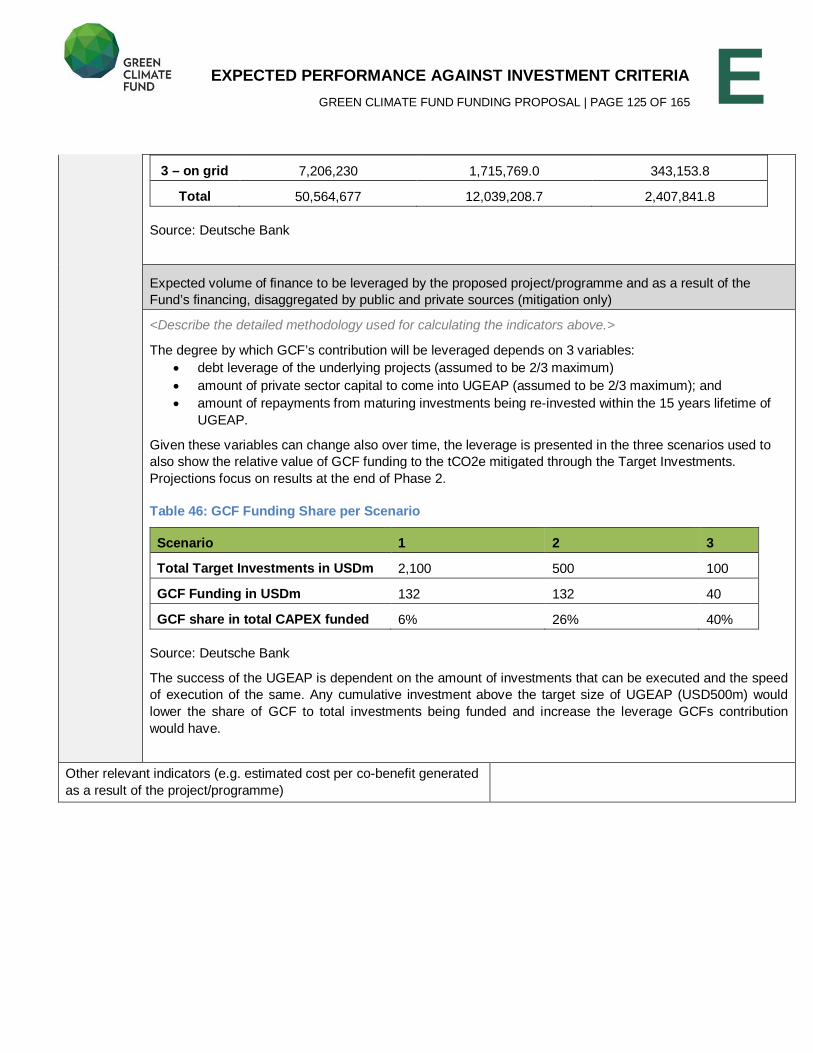
EXPECTED PERFORMANCE AGAINST INVESTMENT CRITERIA GREEN CLIMATE FUND FUNDING PROPOSAL | PAGE 125 OF 165
E 3 – on grid 7,206,230 1,715,769.0 343,153.8
Total 50,564,677 12,039,208.7 2,407,841.8
Source: Deutsche Bank
Expected volume of finance to be leveraged by the proposed project/programme and as a result of the
Fund’s financing, disaggregated by public and private sources (mitigation only)
<Describe the detailed methodology used for calculating the indicators above.>
The degree by which GCF’s contribution will be leveraged depends on 3 variables:
debt leverage of the underlying projects (assumed to be 2/3 maximum)
amount of private sector capital to come into UGEAP (assumed to be 2/3 maximum); and
amount of repayments from maturing investments being re-invested within the 15 years lifetime of
UGEAP.
Given these variables can change also over time, the leverage is presented in the three scenarios used to
also show the relative value of GCF funding to the tCO2e mitigated through the Target Investments.
Projections focus on results at the end of Phase 2.
Table 46: GCF Funding Share per Scenario
Scenario 1 2 3
Total Target Investments in USDm 2,100 500 100
GCF Funding in USDm 132 132 40
GCF share in total CAPEX funded 6% 26% 40%
Source: Deutsche Bank
The success of the UGEAP is dependent on the amount of investments that can be executed and the speed
of execution of the same. Any cumulative investment above the target size of UGEAP (USD500m) would
lower the share of GCF to total investments being funded and increase the leverage GCFs contribution
would have.
Other relevant indicators (e.g. estimated cost per co-benefit generated
as a result of the project/programme)
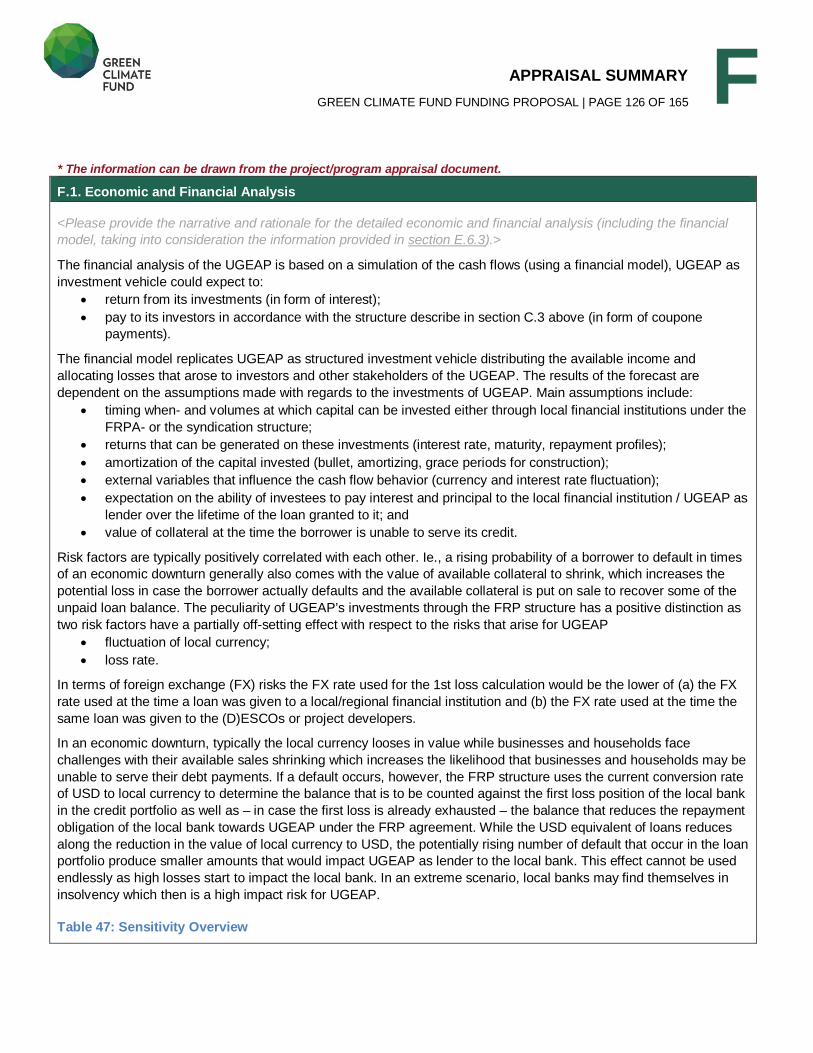
APPRAISAL SUMMARY GREEN CLIMATE FUND FUNDING PROPOSAL | PAGE 126 OF 165
F * The information can be drawn from the project/program appraisal document.
F.1. Economic and Financial Analysis
<Please provide the narrative and rationale for the detailed economic and financial analysis (including the financial model, taking into consideration the information provided in section E.6.3).>
The financial analysis of the UGEAP is based on a simulation of the cash flows (using a financial model), UGEAP as
investment vehicle could expect to:
return from its investments (in form of interest);
pay to its investors in accordance with the structure describe in section C.3 above (in form of coupone
payments).
The financial model replicates UGEAP as structured investment vehicle distributing the available income and
allocating losses that arose to investors and other stakeholders of the UGEAP. The results of the forecast are
dependent on the assumptions made with regards to the investments of UGEAP. Main assumptions include:
timing when- and volumes at which capital can be invested either through local financial institutions under the
FRPA- or the syndication structure;
returns that can be generated on these investments (interest rate, maturity, repayment profiles);
amortization of the capital invested (bullet, amortizing, grace periods for construction);
external variables that influence the cash flow behavior (currency and interest rate fluctuation);
expectation on the ability of investees to pay interest and principal to the local financial institution / UGEAP as
lender over the lifetime of the loan granted to it; and
value of collateral at the time the borrower is unable to serve its credit.
Risk factors are typically positively correlated with each other. Ie., a rising probability of a borrower to default in times
of an economic downturn generally also comes with the value of available collateral to shrink, which increases the
potential loss in case the borrower actually defaults and the available collateral is put on sale to recover some of the
unpaid loan balance. The peculiarity of UGEAP’s investments through the FRP structure has a positive distinction as
two risk factors have a partially off-setting effect with respect to the risks that arise for UGEAP
fluctuation of local currency;
loss rate.
In terms of foreign exchange (FX) risks the FX rate used for the 1st loss calculation would be the lower of (a) the FX
rate used at the time a loan was given to a local/regional financial institution and (b) the FX rate used at the time the
same loan was given to the (D)ESCOs or project developers.
In an economic downturn, typically the local currency looses in value while businesses and households face
challenges with their available sales shrinking which increases the likelihood that businesses and households may be
unable to serve their debt payments. If a default occurs, however, the FRP structure uses the current conversion rate
of USD to local currency to determine the balance that is to be counted against the first loss position of the local bank
in the credit portfolio as well as – in case the first loss is already exhausted – the balance that reduces the repayment
obligation of the local bank towards UGEAP under the FRP agreement. While the USD equivalent of loans reduces
along the reduction in the value of local currency to USD, the potentially rising number of default that occur in the loan
portfolio produce smaller amounts that would impact UGEAP as lender to the local bank. This effect cannot be used
endlessly as high losses start to impact the local bank. In an extreme scenario, local banks may find themselves in
insolvency which then is a high impact risk for UGEAP.
Table 47: Sensitivity Overview
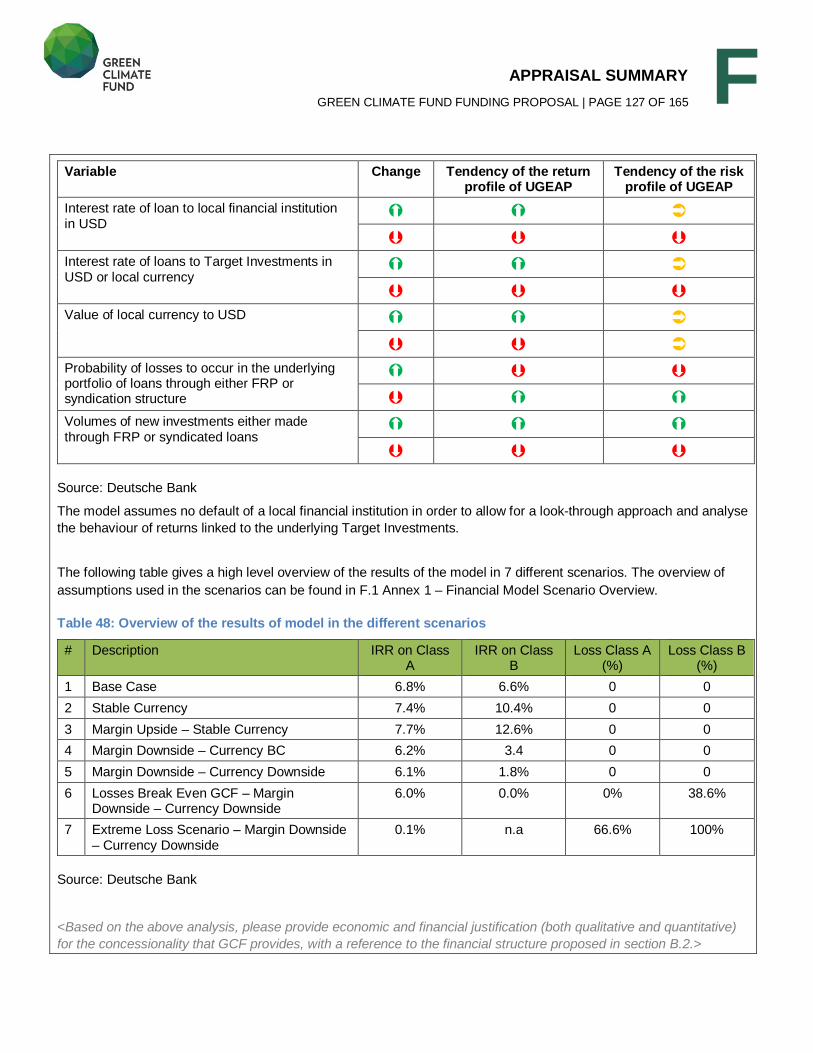
APPRAISAL SUMMARY GREEN CLIMATE FUND FUNDING PROPOSAL | PAGE 127 OF 165
F Variable Change Tendency of the return
profile of UGEAP Tendency of the risk
profile of UGEAP Interest rate of loan to local financial institution in USD
Interest rate of loans to Target Investments in USD or local currency
Value of local currency to USD
Probability of losses to occur in the underlying portfolio of loans through either FRP or syndication structure
Volumes of new investments either made through FRP or syndicated loans
Source: Deutsche Bank
The model assumes no default of a local financial institution in order to allow for a look-through approach and analyse
the behaviour of returns linked to the underlying Target Investments.
The following table gives a high level overview of the results of the model in 7 different scenarios. The overview of
assumptions used in the scenarios can be found in F.1 Annex 1 – Financial Model Scenario Overview.
Table 48: Overview of the results of model in the different scenarios
# Description IRR on Class A
IRR on Class B
Loss Class A (%)
Loss Class B (%)
1 Base Case 6.8% 6.6% 0 0
2 Stable Currency 7.4% 10.4% 0 0
3 Margin Upside – Stable Currency 7.7% 12.6% 0 0
4 Margin Downside – Currency BC 6.2% 3.4 0 0
5 Margin Downside – Currency Downside 6.1% 1.8% 0 0
6 Losses Break Even GCF – Margin Downside – Currency Downside
6.0% 0.0% 0% 38.6%
7 Extreme Loss Scenario – Margin Downside – Currency Downside
0.1% n.a 66.6% 100%
Source: Deutsche Bank
<Based on the above analysis, please provide economic and financial justification (both qualitative and quantitative) for the concessionality that GCF provides, with a reference to the financial structure proposed in section B.2.>
APPRAISAL SUMMARY GREEN CLIMATE FUND FUNDING PROPOSAL | PAGE 128 OF 165
F The concessionality of GCF’s funding comes from investing capital at returns that private sector investors may deem
to be insufficient for the risks to be borne. Please see section D1 for a description of this aspect. The position of GCF
as investor into the UGEAP would, however, align with the interests of the party that would take the higher amount of
risks with the expectation to also benefit from the up-side of the opportunities. This is reflected in the returns for Class
B capital being higher in the up-side scenarios compared to Class A capital.
F.2. Technical Evaluation
<Please provide an assessment from the technical perspective. If a particular technological solution has been chosen, describe why it is the most appropriate for this project/program.>
UGEAP will only finance proven, bankable technology and sustainable business concepts. All used technologies and
hardware components are sourced from well-known and reputable companies within the photovoltaic and battery
industry and have been adapted to the local needs for off-grid installations. Supply contracts will foresee industry
standard warranties that will either (1) remain with the project developer (Project 1 and 2) and will be integrated into
an end beneficiary warranty concept to be provided from the project developer to the end beneficiary (Project 1) be
transferred to the project (Project 3).
Part of the due diligence of the local banks together with DB as investment manager will be a screening of the
technologies applied; credit officers will therefore be trained. Additionally UGEAP will work with internationally
recognized technical advisors that will ensure proper installation and give a final acceptance to a pre-defined number
of installations.
Operational concepts follow best practice industry standards. O&M services are done either by the respective project
developers that apply international standards (Project 1 and 2) or external O&M contractors (Project 3) that are well-
known and have a track-record in the PV energy market.
Category 1 & 2 Projects
Technology Solar Home Systems are typically made up of panel, battery, smart controller, light sets and further
appliances, can be easily installed and need no connection to other devices, e.g. no mini-grid. Core element
is the proprietary software to monitor and control solar systems, company operations and payments.
SHS makes use of mobile communication in 3 ways: (a) inclusion of mobile banking technology to allow for
microcredit, (b) a SHS embedded monitoring system to remotely track usage and payment patterns, battery
and panel data etc. to facilitate maintenance, increase the system durability and provide input for design
improvements, and (c) a PV panel embedded switch to control its power output via mobile network, allowing
the system to be turned off remotely in case of non-payment.
An embedded GSM in SHS’s controller allowing for worldwide fast and reliable data access as well as
permitting for an outstanding payment to be registered.
Solar photovoltaic-based mini-grids consist of controllers, distribution connections, and individual smart
meters for both households and micro-enterprise clients. Other components are photovoltaic panels,
batteries, and control units that are installed strategically throughout a target village. Distribution cables then
connect the production elements its new customers.
Direct Current (DC)-based mini-grids are highly cost effective solution for an easily and efficiently scalable
solution for energy access. However, larger communities will require AC for generation and distribution which
increases the capital expenditure and the technical requirements.
APPRAISAL SUMMARY GREEN CLIMATE FUND FUNDING PROPOSAL | PAGE 129 OF 165
F DC based mini grids often serve very basic needs such as lighting, phone charging, entertainment (radios,
stereos, TVs, cinema-enabling beamers) and productive use (hair cutters, sewing machines, refrigerators for
cold drinks, corn/rice shellers and grinders).
Alternating Current (AC) based grids have a higher range of use but also come with significantly higher
requirements for permitting and planning. Hence the roll-out is less effective and likely on a large scale.
Quality management; quality control system; supply chain Processes have to be in place to control both service and product quality which typically spans from a quality
assurance division monitoring the quality of supplied components while local customer care and assembly staff does
the quality testing on a daily basis on the ground.
Design of product: The envisaged technological concept shall be as basic as possible with a focus on an
easy customer friendly plug-in installation. While the design the initial engineering of the technical solution is
expected to have been performed already prior to the delivery, companies typically partner with local solar
SMEs to quickly and cost-efficiently install mini-grids.
Training of technicians and sales staff: Frequently self-employed entrepreneurs who are planning to work as
sales representatives or solar technicians are generally trained intensively followed by an accreditation
assessment. Necessary training to partner company technicians is provided in order to perform all the tasks
required for deployment of the mini-grids also subject to grids working on low voltage (DC only). For AC grids,
certified technicians are required to perform the installation and the ongoing maintenance work.
Suppliers: Suppliers are screened by the investment manager also for quality purposes while generally
companies perform also onsite inspections of factories. ISO9001 certification is desired to apply. Technology
and hardware components are sourced from well-known and reputable companies. Components (panels,
batteries, smart controllers, light sets) are standardized and mass produced with all the advantages regarding
cost reduction, high quality level, etc.. Framework contracts with suppliers are standard. These contracts
usually oblige the suppliers to be able to deliver a certain quantity of goods in a given time frame if ordered.
In case of components or products with long lead times, purchase orders are made a bigger quantity in due
time. An ongoing communication with suppliers about capacity is important to maintain the operations of the
company. Supply contracts generally include warranties over the lifetime of the financing by UGEAP.
Distributors: Training provided by companies to distributors and agents is reviewed by the investment
manager to assess their satisfaction. Additionally, distributors shall be monitored on a regular basis with
regards to their compliance to the existing rules that are part of the distributor’s contracts.
Maintenance: Technical failures are generally dealt with by a local network of maintenance technicians that
can fix smaller issues and replace broken components, as well as central locations, where these broken
components are fixed and brought back into the spare part stock.
Monitoring of product: Generally, data regarding system performance and payment status is transmitted from
the SHS‘s controller via the mobile network and stored in data warehouse systems of the company.
Category 3 Projects The main focus of these projects is the combination of solar and diesel to a hybrid solution.
Technology Solar diesel hybrid power generation which integrates a solar farm (to be installed on-site) into existing diesel
generator based on-site / add to existing grid connection.
Solar PV alone is not load-following, meaning that users need either a power storage device (battery) and/or
APPRAISAL SUMMARY GREEN CLIMATE FUND FUNDING PROPOSAL | PAGE 130 OF 165
F a generator "in between" the PV or the load, in order to match power supply with power demand. Currently,
storage solutions are too expensive vs. diesel generators, despite major cost reductions in storage tech (e.g.
recent Tesla powers battery is available at 350 USD/kWh);
PV modules are standardized and pre-assembled with a mass-production / lean manufacturing mindset
which improve quality and installation time. Usually, solar farms are built in a “project-by-project” approach,
where each project is technically different and site-specific. To reduce costs, container based solutions are
also available;
Deployments in remote area, meaning getting trained labor in and out is very expensive, create a preference
for containerized, preassembled solutions that are much more robust and lower cost and costs also much
easier to estimate in advance;
Quality management; quality control system; supply chain Quality management and supply chain elements are the same as for Category 1 and 2 projects.
F.3. Environmental, Social Assessment, including Gender Considerations
<Describe the main outcome of the environment and social impact assessment. Specify the Environmental and Social Management Plan, and how the project/program will avoid or mitigate negative impacts at each stage (e.g. preparation, implementation and operation), in accordance with the Fund’s Environmental and Social Safeguard (ESS) standard. Also describe how the gender aspect is considered in accordance with the Fund’s Gender Policy and Action Plan.>
Program Level UGEAP will implement a Social and Environemntal Management System (SEMS) on the level of UGEAP as well as
at the level of each Investment. The SEMS will be based on GCF’s Social and Environmental Safeguards and strictly
follow IFC’s Performance Standards.
Operational Procedures Deutsche Bank will classify each project that UGEAP shall invest into according to the categories as set out below:
Category A: A proposed investment is classified as Category A if it is likely to have significant adverse social
and environmental impacts that are sensitive,100
diverse, or unprecedented. These impacts may affect an
area broader than the sites or facilities subject to the investment.
Category B: A proposed investment is classified as Category B if its potential adverse social and
environmental impacts on human populations or environmentally important areas including wetlands, forests,
grasslands, and other natural habitats are less adverse than those of Category A investments. These
impacts are site-specific; few if any of them are irreversible; and in most cases mitigation measures can be
put in place more readily than for Category A investments.
Category C: A proposed investment is classified as Category C if it is likely to have minimal or no adverse
social and environmental impacts.
UGEAP does not expect to consider Category A projects, while through the syndicated loan structure, UGEAP may
100 A potential impact is considered "sensitive" if it may be irreversible (e.g., lead to loss of a major natural habitat) or raise issues
related to, Natural Habitats; Indigenous Peoples; Physical Cultural Resources or Involuntary Resettlement.
APPRAISAL SUMMARY GREEN CLIMATE FUND FUNDING PROPOSAL | PAGE 131 OF 165
F have exposure to larger installations that could potentially be categorised A. Projects 1 and 2 are categorized C due
to the small size of the single sub-projects. Some sub-projects in Project 3 could potentially lead to Category B due to
a certain project size which will be reached.
As most projects replace diesel-fueled power generation, this will undo the negative effects on air quality associated
with diesel generator emissions and will aid in cleaner energy production for the community or site.
All projects will either have an external and independent Environmental Impact Assessment Study, or alternatively in
case single projects are below a threshold of 10 MWp installed capacity an assessment according to the following 8
IFC Performance Standards will be performed and impacts in each performance standard will be highlighted and
managed throughout the project’s lifetime:
Performance Standard 1: Assessment and Management of Environmental and Social Risks and Impacts
Performance Standard 2: Labor and Working Conditions
Performance Standard 3: Resource Efficiency and Pollution Prevention
Performance Standard 4: Community Health, Safety, and Security
Performance Standard 5: Land Acquisition and Involuntary Resettlement
Performance Standard 6: Biodiversity Conservation and Sustainable Management of Living Natural
Resources
Performance Standard 7: Indigenous Peoples Performance Standard 8: Cultural Heritage
Gender is considered a cross-cutting topic and will be addressed across multiple Performance Standards. A separate
Gender Policy has been drafted for all of DB’s programs with the GCF to which UGEAP will need to company (the
“DB-GCF Gender Policy”). The policy is attached as annex F.3 Annex 1 – DB-GCF Gender Policy. Within its
appraisal of the Performance Standards the external study and/or Deutsche Bank as executing agency will develop a
mitigation and action plan to manage impacts of the sub-projects.
Deutsche Bank will also produce annual reports of the Program’s compliance and incidents throughout the
investment cycle. The reports will be based on site visits and information received from the project developers and.
The social and environmental report will be produced annually by Deutsche Bank.
Additionally Deutsche Bank will assess and report on wider impacts as outlined in section E. 1. Impact Potential.
Exemplary S&E Summary As part of their project development, projects commission either an external Environmental & Social Impact
Assessment or the investment manager reviews the adherence to the S&E standards of the UGEAP. Below are the
summaries of the findings from three sample transactions in each Category:
Project 1 Benchmark Investments The company of Project 1 has not prepared an Environmental and Social Impact Assessment study as the project is
rather a business model that builds upon the sale of small-scale photovoltaic kits. National regulation does not
foresee any need for an environmental impact assessment for their business model. However, Project 1 does have
environmental and social impacts which have been benchmarked against IFC Performance standards in the
following.
Table 49: S&E Summary Project 1

APPRAISAL SUMMARY GREEN CLIMATE FUND FUNDING PROPOSAL | PAGE 132 OF 165
F PS Environmental and Social
Management Plan Assessment Score (1 = high; 3 = low)
Findings and Corrective Measures
Project Categorization C Due to the very small size of each Solar Home System and its
connection to a specific house, the Project 1 is classified as
Category C
1 Assessment and management of
environmental and social risks and
impacts
1 The company is carefully managing risk on the CEO and Business
Development level as well in the Quality Assurance department.
Specific risk is related to electronic waste production, or the
“gender-energy-poverty” nexus.
Measure: disposal service, SHSs affect the education of households
by extending study time and reading hours to after dark, and by that
especially enabling girls involved in daytime household chores to do
their homework
2 Labour and working conditions 1 In order to ensure safe working conditions, training about safety
measures is performed. Moreover, the company has internal safety
policies. the company provides full health insurance coverage for all
employees. In order to address equal opportunity employment of the
company, focuses on job opportunities for women, promotes them
actively and fosters their inclusion into male-dominated employment
sectors, such as the technical area and promoting jobs for women.
3 Resource efficiency and pollution
prevention
1 Risk: Electronic waste production
Measure: disposal service for components that are surplus of
installation or other was.
4 Community health, safety and
security
1 The company’s business model actively increases community
health, safety and security by preventing burn injuries, structural
fires and unintentional ingestion of kerosene by children, indoor
pollutants, such as carbon monoxide, nitrogen dioxide and
formaldehyde, through substitution of kerosene.
Risk of theft and burglary after dark reduced through substitution of
kerosene lamps, diesel generators, and the resulting pollution,
lighting external facades and housing in order to improve community
security.
5 Land acquisition and involuntary
resettlement
1 The company is not involved in land acquisitions; the Solar Home
Systems are installed on customers’ homes or parcels.
6 Biodiversity conservation and
sustainable management of living
natural resources
N/A No biodiversity impact as the company’s systems do not fall into
critical habitats.
7 Indigenous peoples N/A No cultural resources of indigenous people will be used or affected
by the company.
8 Cultural heritage N/A No cultural heritage sites will be used or affected. No cultural
heritage sites have been affected so far; in the event that would
change in the future, appropriate actions will be taken and tracked.
Source: Deutsche Bank
APPRAISAL SUMMARY GREEN CLIMATE FUND FUNDING PROPOSAL | PAGE 133 OF 165
F Gender Considerations The following gender related impact features have been identified for the company.
Energy access disproportionately tends to benefit women as they are typically responsible for household tasks,
e.g. procuring kerosene or candles;
Basically, equal chances to create jobs both for men and women:
Local employees, customers and sub-contractors are equally trained in solar energy;
The company itself is an equal opportunity employer with a recruitment policy that provides equal chances for
both women and men;
To-date approximately one third of the company’s workforce is female, there is still a lack of qualified female
technicians.
The company targets the roots of gender inequality by:
1) improving the livelihoods of women and girls through access to clean and efficient home energy sources;
2) empowering women and girls:
3) by improving learning conditions: SHSs affect the education level of private households by extending
reading hours, particularly enabling girls involved in daytime household chores to do their school homework;
4) the company targets to lift the dual constraints impacting women: a) lack of working capital and b) inability to
afford a PV system – the company’s pricing and monthly payment system makes energy more affordable for
women to use their potential as entrepreneurs;
5) The company will also track new entrepreneurial activity by women as a result of their access to electricity
Positive impact on health especially for women and children who spend more time in the house: substituting kerosene/fuel by SHS minimizes indoor pollutant such as carbon monoxide, nitrogen dioxide and formaldehyde.
Project 2 Benchmark Investments As part of their project development, the company of Project 2 commissioned an external Environmental and Social
Impact Assessment study for two village mini-grids in order to receive regional or possibly national accreditation with
the national council for future similar mini-grids to be built by the company, While the study is still in a draft version
and will be submitted to NEMC soon, the study has been screened and benchmarked to the IFC Performance
Standards in the following table.
Table 50: S&E Summary Project 2
PS Environmental and Social Management Plan Assessment
Score (1 = high; 3 = low)
Findings and Corrective Measures
Project Categorization 1 Most of the company’s photovoltaic mini-grids are Very Small Power
Producers (VSPP) under 100 kW and therefore fall into Category C,
having a minor environmental and social impact.
Requirement due to category of
project:
ESIA assessment draft available
by external consultant
1 An Environmental Impact Assessment in accordance with the National
Environmental Management Council (NEMC) Performance Standards
has been conducted by City Engineering Company Limited (CECL), Dar
es Salaam/Tanzania, for the mini-grid located in Melela-Mlandizi village,
Melela Ward, Mvomero District, Morogoro Region, Tanzania;
Final draft to be submitted to the National Environmental Management
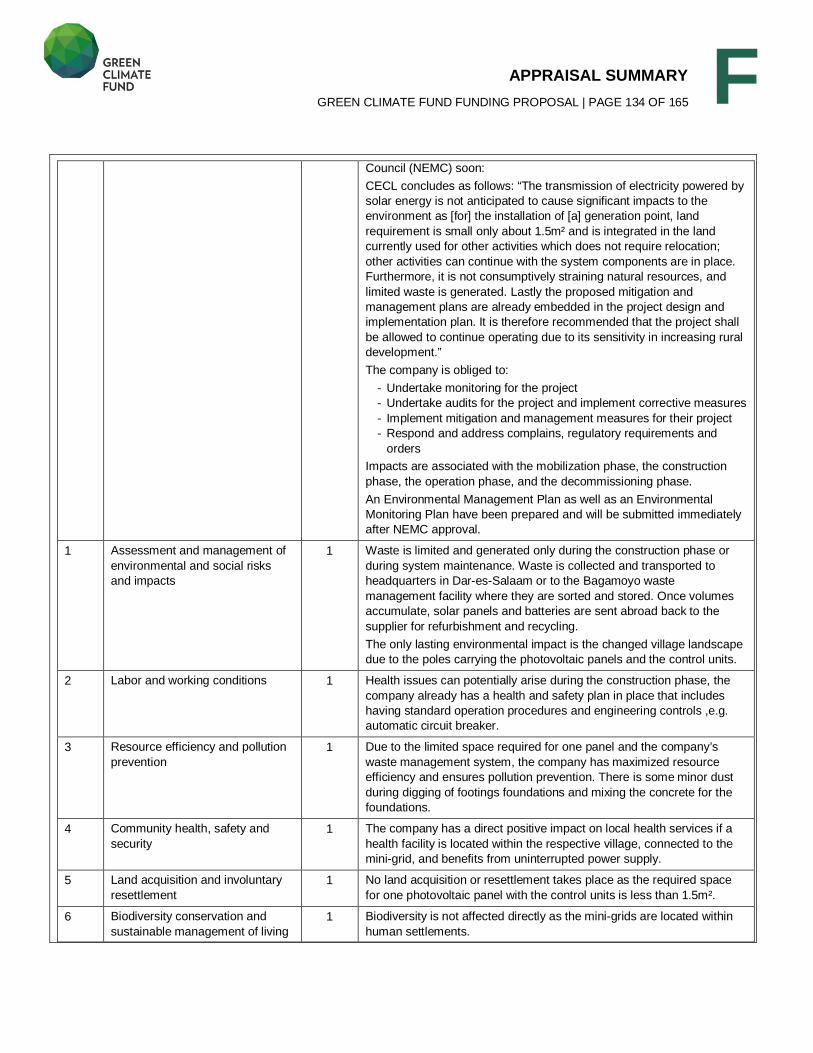
APPRAISAL SUMMARY GREEN CLIMATE FUND FUNDING PROPOSAL | PAGE 134 OF 165
F Council (NEMC) soon:
CECL concludes as follows: “The transmission of electricity powered by
solar energy is not anticipated to cause significant impacts to the
environment as [for] the installation of [a] generation point, land
requirement is small only about 1.5m² and is integrated in the land
currently used for other activities which does not require relocation;
other activities can continue with the system components are in place.
Furthermore, it is not consumptively straining natural resources, and
limited waste is generated. Lastly the proposed mitigation and
management plans are already embedded in the project design and
implementation plan. It is therefore recommended that the project shall
be allowed to continue operating due to its sensitivity in increasing rural
development.”
The company is obliged to:
- Undertake monitoring for the project
- Undertake audits for the project and implement corrective measures
- Implement mitigation and management measures for their project
- Respond and address complains, regulatory requirements and
orders
Impacts are associated with the mobilization phase, the construction
phase, the operation phase, and the decommissioning phase.
An Environmental Management Plan as well as an Environmental
Monitoring Plan have been prepared and will be submitted immediately
after NEMC approval.
1 Assessment and management of
environmental and social risks
and impacts
1 Waste is limited and generated only during the construction phase or
during system maintenance. Waste is collected and transported to
headquarters in Dar-es-Salaam or to the Bagamoyo waste
management facility where they are sorted and stored. Once volumes
accumulate, solar panels and batteries are sent abroad back to the
supplier for refurbishment and recycling.
The only lasting environmental impact is the changed village landscape
due to the poles carrying the photovoltaic panels and the control units.
2 Labor and working conditions 1 Health issues can potentially arise during the construction phase, the
company already has a health and safety plan in place that includes
having standard operation procedures and engineering controls ,e.g.
automatic circuit breaker.
3 Resource efficiency and pollution
prevention
1 Due to the limited space required for one panel and the company’s
waste management system, the company has maximized resource
efficiency and ensures pollution prevention. There is some minor dust
during digging of footings foundations and mixing the concrete for the
foundations.
4 Community health, safety and
security
1 The company has a direct positive impact on local health services if a
health facility is located within the respective village, connected to the
mini-grid, and benefits from uninterrupted power supply.
5 Land acquisition and involuntary
resettlement
1 No land acquisition or resettlement takes place as the required space
for one photovoltaic panel with the control units is less than 1.5m².
6 Biodiversity conservation and
sustainable management of living
1 Biodiversity is not affected directly as the mini-grids are located within
human settlements.
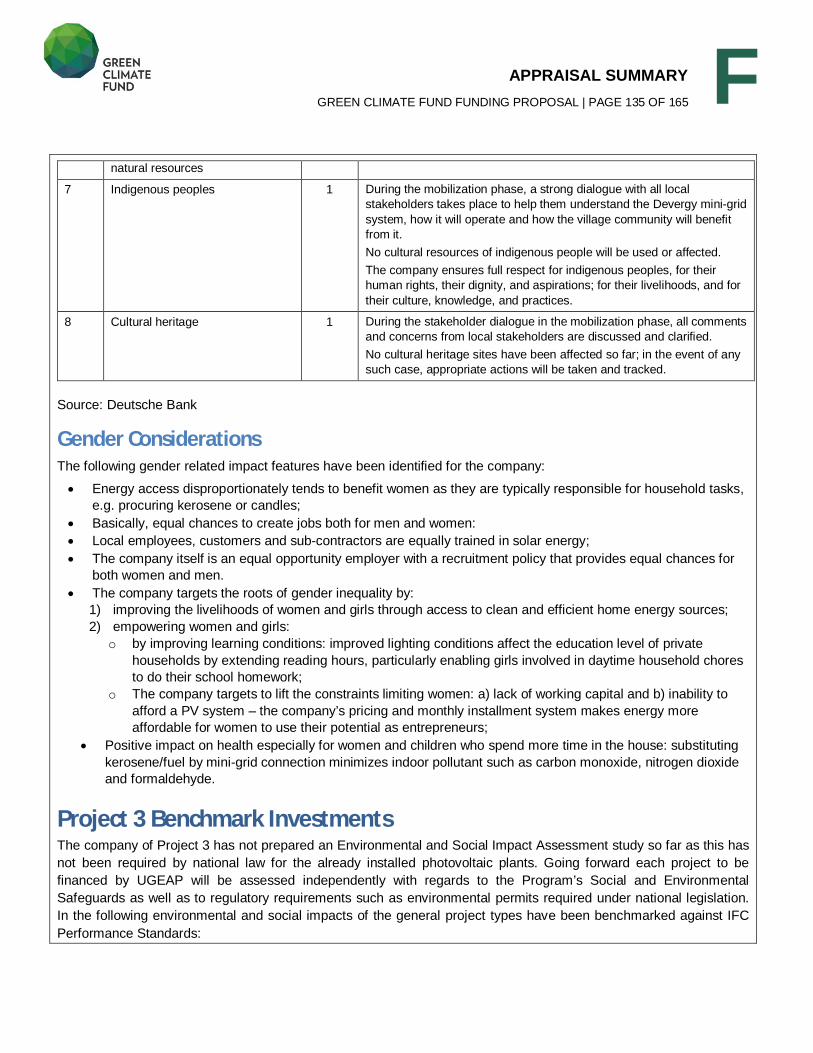
APPRAISAL SUMMARY GREEN CLIMATE FUND FUNDING PROPOSAL | PAGE 135 OF 165
F natural resources
7 Indigenous peoples 1 During the mobilization phase, a strong dialogue with all local
stakeholders takes place to help them understand the Devergy mini-grid
system, how it will operate and how the village community will benefit
from it.
No cultural resources of indigenous people will be used or affected.
The company ensures full respect for indigenous peoples, for their
human rights, their dignity, and aspirations; for their livelihoods, and for
their culture, knowledge, and practices.
8 Cultural heritage 1 During the stakeholder dialogue in the mobilization phase, all comments
and concerns from local stakeholders are discussed and clarified.
No cultural heritage sites have been affected so far; in the event of any
such case, appropriate actions will be taken and tracked.
Source: Deutsche Bank
Gender Considerations The following gender related impact features have been identified for the company:
Energy access disproportionately tends to benefit women as they are typically responsible for household tasks,
e.g. procuring kerosene or candles;
Basically, equal chances to create jobs both for men and women:
Local employees, customers and sub-contractors are equally trained in solar energy;
The company itself is an equal opportunity employer with a recruitment policy that provides equal chances for
both women and men.
The company targets the roots of gender inequality by:
1) improving the livelihoods of women and girls through access to clean and efficient home energy sources;
2) empowering women and girls:
o by improving learning conditions: improved lighting conditions affect the education level of private
households by extending reading hours, particularly enabling girls involved in daytime household chores
to do their school homework;
o The company targets to lift the constraints limiting women: a) lack of working capital and b) inability to
afford a PV system – the company’s pricing and monthly installment system makes energy more
affordable for women to use their potential as entrepreneurs;
Positive impact on health especially for women and children who spend more time in the house: substituting
kerosene/fuel by mini-grid connection minimizes indoor pollutant such as carbon monoxide, nitrogen dioxide
and formaldehyde.
Project 3 Benchmark Investments The company of Project 3 has not prepared an Environmental and Social Impact Assessment study so far as this has
not been required by national law for the already installed photovoltaic plants. Going forward each project to be
financed by UGEAP will be assessed independently with regards to the Program’s Social and Environmental
Safeguards as well as to regulatory requirements such as environmental permits required under national legislation.
In the following environmental and social impacts of the general project types have been benchmarked against IFC
Performance Standards:
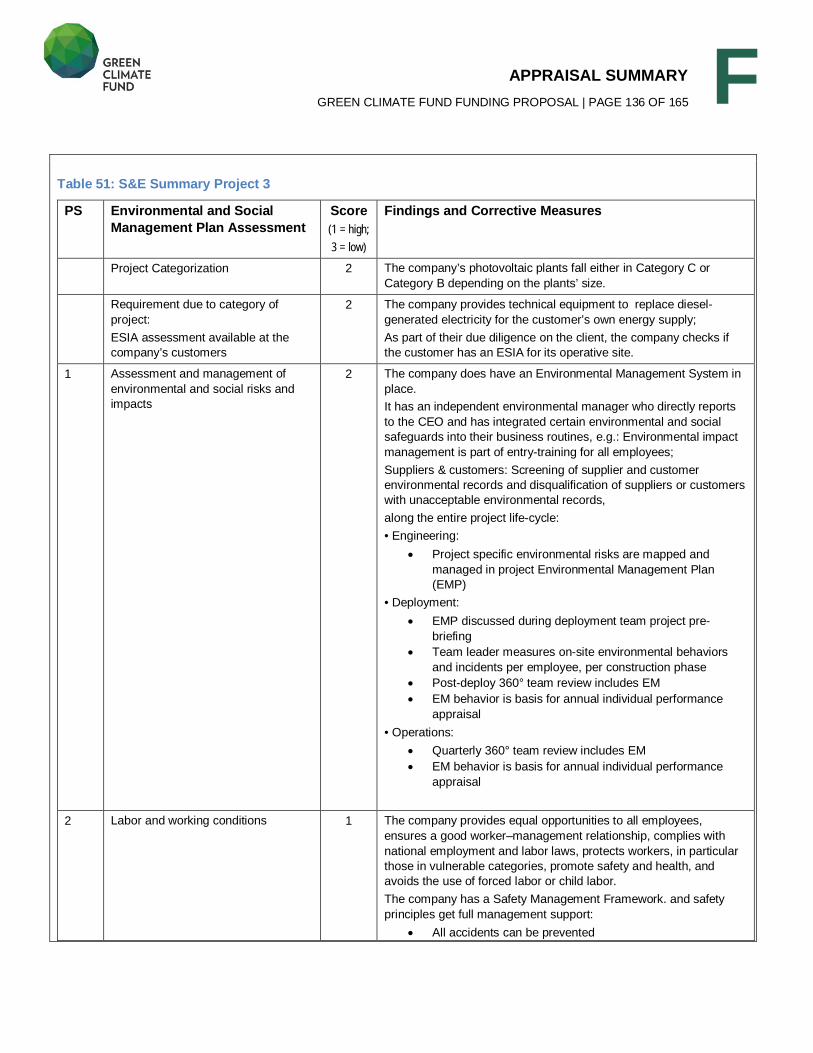
APPRAISAL SUMMARY GREEN CLIMATE FUND FUNDING PROPOSAL | PAGE 136 OF 165
F Table 51: S&E Summary Project 3
PS Environmental and Social Management Plan Assessment
Score (1 = high; 3 = low)
Findings and Corrective Measures
Project Categorization 2 The company’s photovoltaic plants fall either in Category C or
Category B depending on the plants’ size.
Requirement due to category of
project:
ESIA assessment available at the
company’s customers
2 The company provides technical equipment to replace diesel-
generated electricity for the customer’s own energy supply;
As part of their due diligence on the client, the company checks if
the customer has an ESIA for its operative site.
1 Assessment and management of
environmental and social risks and
impacts
2 The company does have an Environmental Management System in
place.
It has an independent environmental manager who directly reports
to the CEO and has integrated certain environmental and social
safeguards into their business routines, e.g.: Environmental impact
management is part of entry-training for all employees;
Suppliers & customers: Screening of supplier and customer
environmental records and disqualification of suppliers or customers
with unacceptable environmental records,
along the entire project life-cycle:
• Engineering:
Project specific environmental risks are mapped and
managed in project Environmental Management Plan
(EMP)
• Deployment:
EMP discussed during deployment team project pre-
briefing
Team leader measures on-site environmental behaviors
and incidents per employee, per construction phase
Post-deploy 360° team review includes EM
EM behavior is basis for annual individual performance
appraisal
• Operations:
Quarterly 360° team review includes EM
EM behavior is basis for annual individual performance
appraisal
2 Labor and working conditions 1 The company provides equal opportunities to all employees,
ensures a good worker–management relationship, complies with
national employment and labor laws, protects workers, in particular
those in vulnerable categories, promote safety and health, and
avoids the use of forced labor or child labor.
The company has a Safety Management Framework. and safety
principles get full management support:
All accidents can be prevented

APPRAISAL SUMMARY GREEN CLIMATE FUND FUNDING PROPOSAL | PAGE 137 OF 165
F Safety is a management priority
Safety is right and good business
the company has a responsibility to train employees to
work safely
Safety goals are:
Zero accidents and injuries
Individual accountability through measurement of every
activity of every project
Continuous 10% annual improvement, individually and
collectively
Project-independent safety management:
Safety is part of entry-training for all employees
Role-specific installation-safety training at Weisweil
reference site
There is a project-cycle safety management in place:
Engineering:
Project specific safety risks are engineering deliverable
• Deployment:
Deployment team safety project pre-briefing
Team leader measures on-site safety (accident, near-miss,
unsafe behavior) per employee, per construction phase
Post-deploy 360° team review includes safety
Safe behavior is basis for annual individual performance
appraisal
• Operations:
Quarterly 360° team review includes safety
Safe behavior is basis for annual individual performance appraisal
3 Resource efficiency and pollution
prevention
1 The company defines a series of activities to prevent/ abate
pollution in wetland, ground water etc. as well as the handling of
waste, effluent, emissions and other pollutants
4 Community health, safety and
security
2 The company adheres to the IFC Sector Specific and General
Environmental Health and Safety (EHS) Guidelines; compliance is
monitored via the quarterly 360° team meeting. Security and safety
issues beyond legal requirements will be instantly addressed.
5 Land acquisition and involuntary
resettlement
1 The company is not involved in land acquisitions; the photovoltaic
farms are installed on land owned by its direct customer.
6 Biodiversity conservation and
sustainable management of living
natural resources
1 Biodiversity issues are part of the Environmental Management
System. Special attention will be paid to protected areas to avoid
any adverse impact on critical habitats, rare or protected species, or
water use.
7 Indigenous peoples 1 No cultural resources of indigenous people will be used or affected
The company ensures full respect for indigenous peoples, for their
human rights, their dignity, and aspirations; for their livelihoods, and
for their culture, knowledge, and practices.
8 Cultural heritage 1 No cultural heritage sites have been affected so far; in the event of
any such case, appropriate actions will be taken and tracked
Source: Deutsche Bank
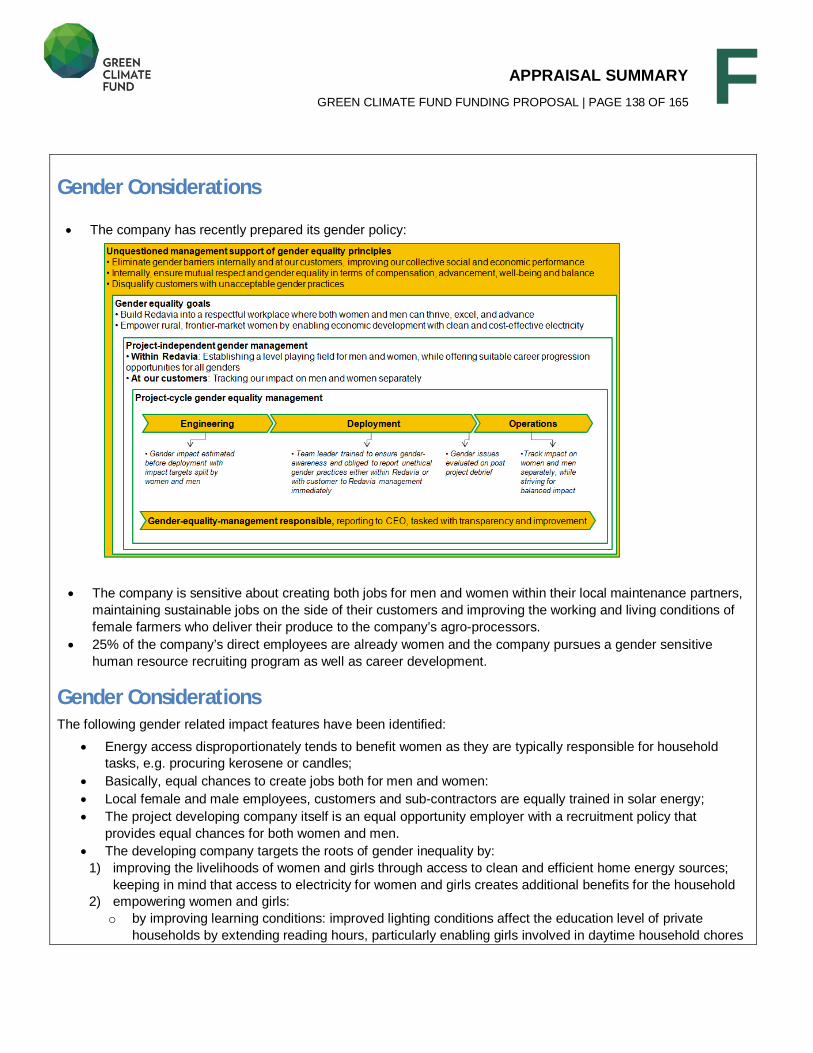
APPRAISAL SUMMARY GREEN CLIMATE FUND FUNDING PROPOSAL | PAGE 138 OF 165
F Gender Considerations
The company has recently prepared its gender policy:
The company is sensitive about creating both jobs for men and women within their local maintenance partners,
maintaining sustainable jobs on the side of their customers and improving the working and living conditions of
female farmers who deliver their produce to the company’s agro-processors.
25% of the company’s direct employees are already women and the company pursues a gender sensitive
human resource recruiting program as well as career development.
Gender Considerations The following gender related impact features have been identified:
Energy access disproportionately tends to benefit women as they are typically responsible for household
tasks, e.g. procuring kerosene or candles;
Basically, equal chances to create jobs both for men and women:
Local female and male employees, customers and sub-contractors are equally trained in solar energy;
The project developing company itself is an equal opportunity employer with a recruitment policy that
provides equal chances for both women and men.
The developing company targets the roots of gender inequality by:
1) improving the livelihoods of women and girls through access to clean and efficient home energy sources;
keeping in mind that access to electricity for women and girls creates additional benefits for the household
2) empowering women and girls:
o by improving learning conditions: improved lighting conditions affect the education level of private
households by extending reading hours, particularly enabling girls involved in daytime household chores
APPRAISAL SUMMARY GREEN CLIMATE FUND FUNDING PROPOSAL | PAGE 139 OF 165
F to do their school homework;
o The developing company targets to lift the constraints limiting women: a) lack of working capital and b)
inability to afford a PV system – the company’s pricing and monthly installment system makes energy
more affordable for women to use their potential as entrepreneurs;
Positive impact on health especially for women and children who typically spend more time in the house: substituting kerosene/fuel by mini-grid connection minimizes indoor pollutant such as carbon monoxide, nitrogen dioxide and formaldehyde.
F.4. Financial Management and Procurement
<Describe the project/program’s financial management and procurement, including financial accounting, disbursement methods and auditing.>
Program Level UGEAP as investment vehicle will appoint Deutsche Bank as Investment Manager. Additional Deutsche Bank will act
as Investment Administrator. A list of tasks including financial management and procurement is listed in C.3. above.
The Investment Administration team is a separate team within Deutsche Bank (alternatively such services could be
performed by an external service provider) that will operate under a service level agreement thus guaranteeing a four
eyes principle and adherence to DB standards in line with DB’s policies covering conditions and requirements
towards outsourced services.
Tasks belonging to the Investment Administration include:
financial accounting incl. NAV calculation;
custodian services;
administrative portfolio management (loan booking, interest rate calculation and monitoring on covenants and
cash-flow of underlying investments);
reporting based on input from Investment Management team.
Disbursement Process For a new underlying investment the Investment Administration team will verify that the investee complies with all
legal and regulatory requirements including AML and KYC provisions. For UGEAP the Investment Manager will apply
Deutsche Bank’s AML and KYC requirement which follow the OFAC recommendations. The Investment Management
team will provide the respective documentation from the potential investee to the Investment Administration team.
Upon positive investment decision by the Investment Committee, the Investment Manager performs all necessary
measures to enable the loan from an assets liability management perspective in terms of liquidity and mitigation of
arising market risks, e.g. by entering into derivative instruments. The Investment Manager provides the Investment
Administration team with the scanned version of the Investment Committee approval, the signed Financing
Documents, Signing Certificate and Condition Precedent Documents (i.e. articles of incorporation, extract of trade
register / banking license, authorized signatures with signatures samples or passport copies) as outlined in the loan
agreement to the Investment Administration team and informs about the scheduled disbursement dates.
Upon completeness and sign-off of the respective documents and after receiving the signed payment instruction the
Investment Manger instructs the payments, the Investment Administration team executes the payment from UGEAP’s
account to the investee.
Detailed processes on financial management and administrative management tasks will be outlined in the key
APPRAISAL SUMMARY GREEN CLIMATE FUND FUNDING PROPOSAL | PAGE 140 OF 165
F operational manual and will build on DB’s existing systems being used in the management of existing public-private
partnership funds.
Financial Management The investment vehicle will apply IFRS standards. An annual audit of the financials will be performed by an
independent auditor to be appointed by the Board of UGEAP following the Procurement Guidelines. The Investment
Manager will provide the auditor with the required information. On the discretion of the Board of UGEAP further audits
on social and economic safeguards or impact shall be performed on an ad-hoc or regular basis.
Reporting Within the Investment advisory agreement certain reporting processes, routines and recipients will be defined.
Reports to be prepared include:
Financial Reports Quarterly Net Asset Value Report required under IFRS;
Quarterly financial statements (non-audited) which includes information on non-performing assets;
Annual Statements (audited)
Asset-related Reports Annual report on portfolio development and portfolio performance indicators
Quarterly report on portfolio development and portfolio performance indicators
Annual report on social and environmental compliance and impact
Procurement Services to be procured by UGEAP include but are not limited to:
Administrative Services
Custodian Services
Auditing Services
Legal Advisor Services on Investment vehicle level
Legal Advisor Services Investment level
Board Secretary Services
Other (e.g. Advisory Services on tax or accounting matters)
UGEAP as investment vehicle will have Procurement Guidelines that provide information on the requirements for the
assignment of service providers and consultants. These Guidelines lay down the conditions to ensure transparent
and fair competition that will offer equal opportunities to all participating service providers and consultants. Further
details are given in each request for proposals.
Types of Procurement Procedures Ancillary Services can be procured by UGEAP in four different ways, depending on the size of the transaction:
1. Tendering:
Project/services are awarded through a tendering process allowing candidates invited by the Investment Manager
and/or the Board to submit a proposal choosing service providers and consultants from a short list of experts. The
APPRAISAL SUMMARY GREEN CLIMATE FUND FUNDING PROPOSAL | PAGE 141 OF 165
F short list is typically prepared through a pre-qualification exercise.
Selective Tendering:
The Investment Manager is allowed to consult candidates of his choice and negotiates the terms of the contract with
one or more of them. The selection of candidates can be directly established by the Investment Manager based on
prior contacting of two to five service providers/ consultants, depending on the project/services budget as specified
below.
Single Sourcing:
The Investment Manager is allowed to consult one candidate of his choice to negotiate the terms of the contract.
Direct Implementation:
The Investment Manager carries the activities out directly, where needed complemented by additional expertise
coming from external service providers and consultants. Such activities primarily include those that are related to
specific strategic, commercial, or confidential objectives of the Investment vehicle.
Selection of applicable Procurement Procedures The Investment Manager shall give preference to the Tendering or Selective Tendering processes, whereby:
Tendering should be used for project/services above USD 280,000 (excl. value-added tax)
Selective Tendering for project/services ranging from USD 50,000 to USD 280,000 (excl. value-added tax). For the
avoidance of doubt, Selective Tendering shall be applied, if it can be reliably estimated at the time of project/services
procurement that the aggregate of projects/services to be provided by a service provider or consultant will exceed the
threshold of USD50,000. Selective Tendering shall be the preferred procurement procedure in case of selecting
providers of (i) administrative, (ii) custodian, (iii) auditing and (iv) legal advisor services. Notwithstanding such limit of
USD 50,000, the role of the Board Secretary shall not be subject to Selective Tendering due to the sensitive nature of
documents such Board Secretary will be required to review including but not limited to private sector investor
commitment agreements.
Single Sourcing or Direct Implementation should be used for project/services below USD 50,000. Direct
Implementation shall be regarded as the most effective procedure for:
Research & Analyses, whenever such project/services are close to the core project/services of the
Investment vehicle or inform the Investment vehicle in defining its strategic direction.
Other activities related to strategic, commercial, or confidential objectives of the Investment vehicle as
approved from time to time by the Board or the Investment Committee.
Tenders and the decisions on procurements will be overseen by a procurement committee. Tenders will be orientated
towards ICB and NCBs to the degree possible and feasible.
Evaluation and Selection The preparation of the tender documents, the conduction of the entire tender process and procedure as well as the
evaluation of proposals will be carried out by the Investment Manager. The evaluation of service providers’ and
consultants’ expertise and proposals is based on a series of factors. In the case of Tendering, these must be
specified, with their respective weights in the request for proposals issued to potential respondents. Indicative factors
include the service provider’s/consultant’s specific experience, the understanding of the terms of reference, the
methodology proposed for the services, qualifications and experience of key personnel included to render the
APPRAISAL SUMMARY GREEN CLIMATE FUND FUNDING PROPOSAL | PAGE 142 OF 165
F services, regional experience, and proposed work program. In the procurement procedure the Investment Manager
shall apply a weight of not more than 70% to the aggregate of qualitative factors while pricing shall be assigned at
least a weight of 30%. In the case of changes of up to 10% of the initially approved budget with a maximum of USD
20,000, the Investment Manager may accept these changes. Evaluation reports can be made available to the UGEAP
Board upon request.
Monitoring, Reporting and Terms & Conditions, Review Periodicity The Investment Manager shall review conditions of each UGEAP service provider and shall procure competitive bids
according to the procurement procedures set out above when considered necessary by the Board. Based on the
approval of the Board the Investment Manager is responsible for supervising and managing the service provider’s
and/or consultants activities within the budget framework approved by the Board. For all service agreements with a
duration of more than one year, the Investment Manager should assess the cooperation with the service providers,
considering the underlying terms of reference and timeline for the services and report once a year to the Board. The
report shall be delivered to the Board on an annual basis.
Details on the single projects with regards to the Financial Management can be found in F.4 Annex 1 – Project Level
Information on Financial Management
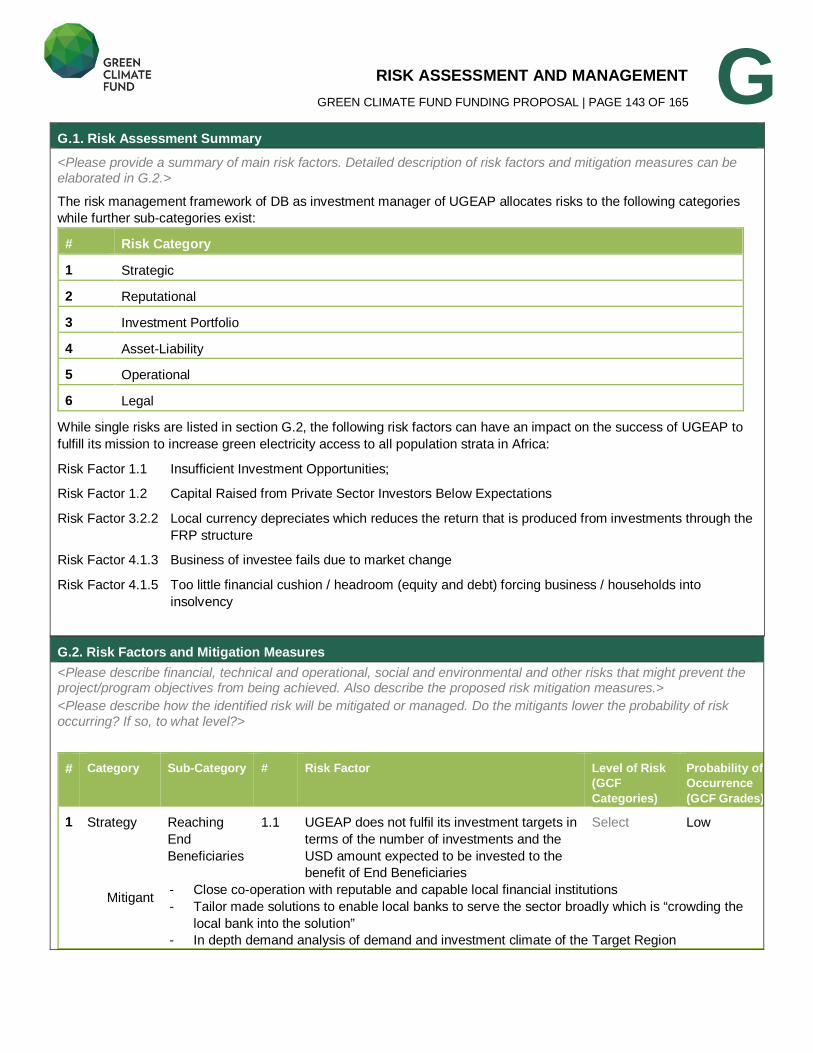
RISK ASSESSMENT AND MANAGEMENT GREEN CLIMATE FUND FUNDING PROPOSAL | PAGE 143 OF 165
G
G.2. Risk Factors and Mitigation Measures <Please describe financial, technical and operational, social and environmental and other risks that might prevent the project/program objectives from being achieved. Also describe the proposed risk mitigation measures.> <Please describe how the identified risk will be mitigated or managed. Do the mitigants lower the probability of risk occurring? If so, to what level?>
# Category Sub-Category # Risk Factor Level of Risk (GCF Categories)
Probability of Occurrence (GCF Grades)
1 Strategy Reaching
End
Beneficiaries
1.1 UGEAP does not fulfil its investment targets in
terms of the number of investments and the
USD amount expected to be invested to the
benefit of End Beneficiaries
Select Low
Mitigant - Close co-operation with reputable and capable local financial institutions
- Tailor made solutions to enable local banks to serve the sector broadly which is “crowding the
local bank into the solution”
- In depth demand analysis of demand and investment climate of the Target Region
G.1. Risk Assessment Summary
<Please provide a summary of main risk factors. Detailed description of risk factors and mitigation measures can be elaborated in G.2.> The risk management framework of DB as investment manager of UGEAP allocates risks to the following categories
while further sub-categories exist:
# Risk Category
1 Strategic
2 Reputational
3 Investment Portfolio
4 Asset-Liability
5 Operational
6 Legal
While single risks are listed in section G.2, the following risk factors can have an impact on the success of UGEAP to
fulfill its mission to increase green electricity access to all population strata in Africa:
Risk Factor 1.1 Insufficient Investment Opportunities;
Risk Factor 1.2 Capital Raised from Private Sector Investors Below Expectations
Risk Factor 3.2.2 Local currency depreciates which reduces the return that is produced from investments through the
FRP structure
Risk Factor 4.1.3 Business of investee fails due to market change
Risk Factor 4.1.5 Too little financial cushion / headroom (equity and debt) forcing business / households into
insolvency
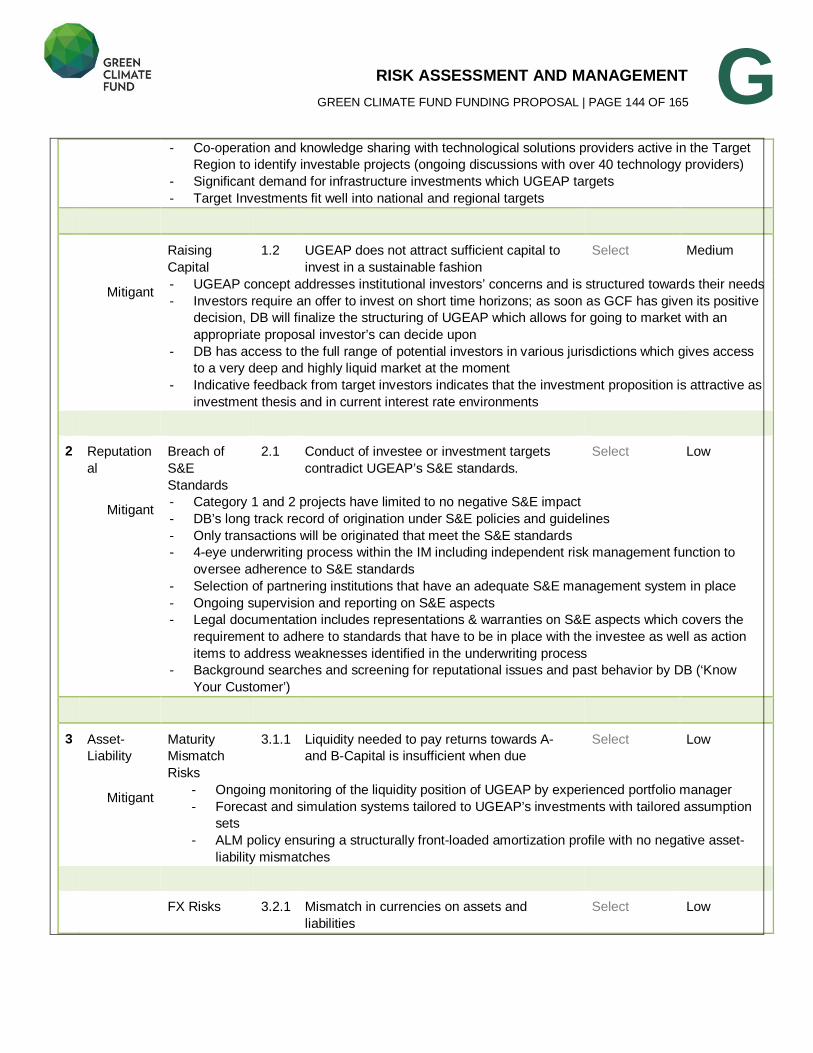
RISK ASSESSMENT AND MANAGEMENT GREEN CLIMATE FUND FUNDING PROPOSAL | PAGE 144 OF 165
G - Co-operation and knowledge sharing with technological solutions providers active in the Target
Region to identify investable projects (ongoing discussions with over 40 technology providers)
- Significant demand for infrastructure investments which UGEAP targets
- Target Investments fit well into national and regional targets
Raising
Capital
1.2 UGEAP does not attract sufficient capital to
invest in a sustainable fashion
Select Medium
Mitigant - UGEAP concept addresses institutional investors’ concerns and is structured towards their needs
- Investors require an offer to invest on short time horizons; as soon as GCF has given its positive
decision, DB will finalize the structuring of UGEAP which allows for going to market with an
appropriate proposal investor’s can decide upon
- DB has access to the full range of potential investors in various jurisdictions which gives access
to a very deep and highly liquid market at the moment
- Indicative feedback from target investors indicates that the investment proposition is attractive as
investment thesis and in current interest rate environments
2 Reputation
al
Breach of
S&E
Standards
2.1 Conduct of investee or investment targets
contradict UGEAP’s S&E standards.
Select Low
Mitigant - Category 1 and 2 projects have limited to no negative S&E impact
- DB’s long track record of origination under S&E policies and guidelines
- Only transactions will be originated that meet the S&E standards
- 4-eye underwriting process within the IM including independent risk management function to
oversee adherence to S&E standards
- Selection of partnering institutions that have an adequate S&E management system in place
- Ongoing supervision and reporting on S&E aspects
- Legal documentation includes representations & warranties on S&E aspects which covers the
requirement to adhere to standards that have to be in place with the investee as well as action
items to address weaknesses identified in the underwriting process
- Background searches and screening for reputational issues and past behavior by DB (‘Know
Your Customer’)
3 Asset-
Liability
Maturity
Mismatch
Risks
3.1.1 Liquidity needed to pay returns towards A-
and B-Capital is insufficient when due
Select Low
Mitigant - Ongoing monitoring of the liquidity position of UGEAP by experienced portfolio manager
- Forecast and simulation systems tailored to UGEAP’s investments with tailored assumption
sets
- ALM policy ensuring a structurally front-loaded amortization profile with no negative asset-
liability mismatches
FX Risks 3.2.1 Mismatch in currencies on assets and
liabilities
Select Low
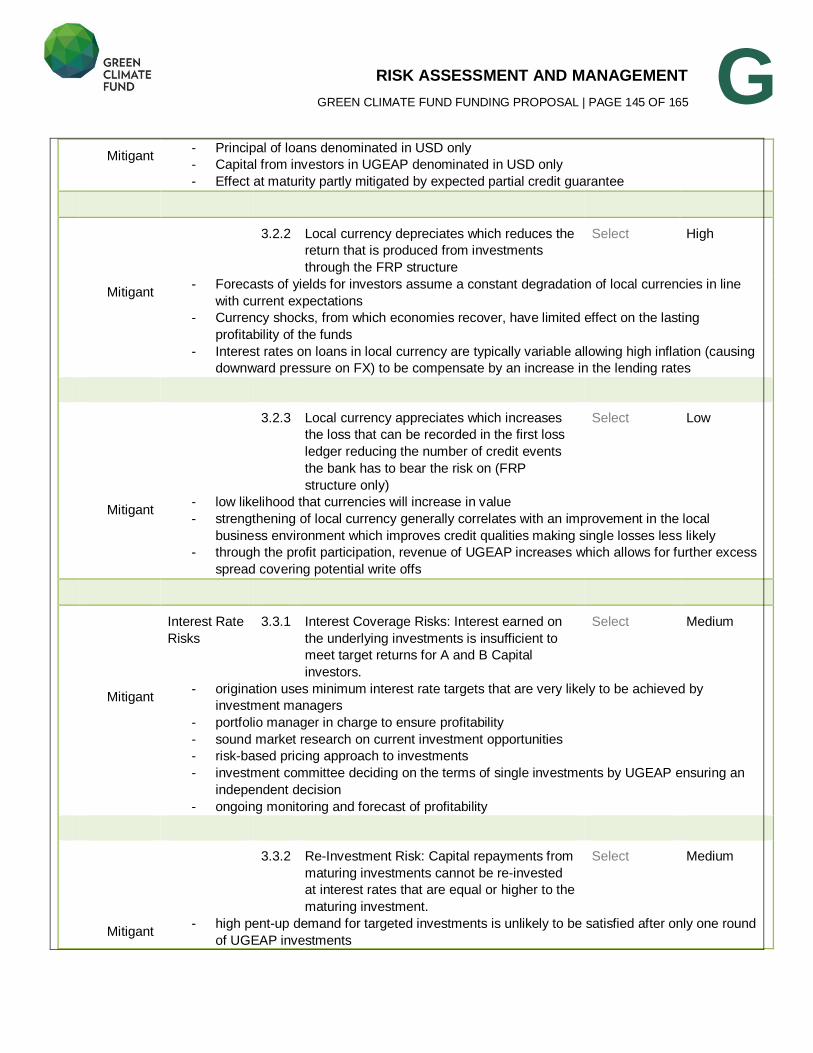
RISK ASSESSMENT AND MANAGEMENT GREEN CLIMATE FUND FUNDING PROPOSAL | PAGE 145 OF 165
G Mitigant
- Principal of loans denominated in USD only
- Capital from investors in UGEAP denominated in USD only
- Effect at maturity partly mitigated by expected partial credit guarantee
3.2.2 Local currency depreciates which reduces the
return that is produced from investments
through the FRP structure
Select High
Mitigant - Forecasts of yields for investors assume a constant degradation of local currencies in line
with current expectations
- Currency shocks, from which economies recover, have limited effect on the lasting
profitability of the funds
- Interest rates on loans in local currency are typically variable allowing high inflation (causing
downward pressure on FX) to be compensate by an increase in the lending rates
3.2.3 Local currency appreciates which increases
the loss that can be recorded in the first loss
ledger reducing the number of credit events
the bank has to bear the risk on (FRP
structure only)
Select Low
Mitigant - low likelihood that currencies will increase in value
- strengthening of local currency generally correlates with an improvement in the local
business environment which improves credit qualities making single losses less likely
- through the profit participation, revenue of UGEAP increases which allows for further excess
spread covering potential write offs
Interest Rate
Risks
3.3.1 Interest Coverage Risks: Interest earned on
the underlying investments is insufficient to
meet target returns for A and B Capital
investors.
Select Medium
Mitigant - origination uses minimum interest rate targets that are very likely to be achieved by
investment managers - portfolio manager in charge to ensure profitability - sound market research on current investment opportunities - risk-based pricing approach to investments - investment committee deciding on the terms of single investments by UGEAP ensuring an
independent decision - ongoing monitoring and forecast of profitability
3.3.2 Re-Investment Risk: Capital repayments from
maturing investments cannot be re-invested
at interest rates that are equal or higher to the
maturing investment.
Select Medium
Mitigant - high pent-up demand for targeted investments is unlikely to be satisfied after only one round
of UGEAP investments
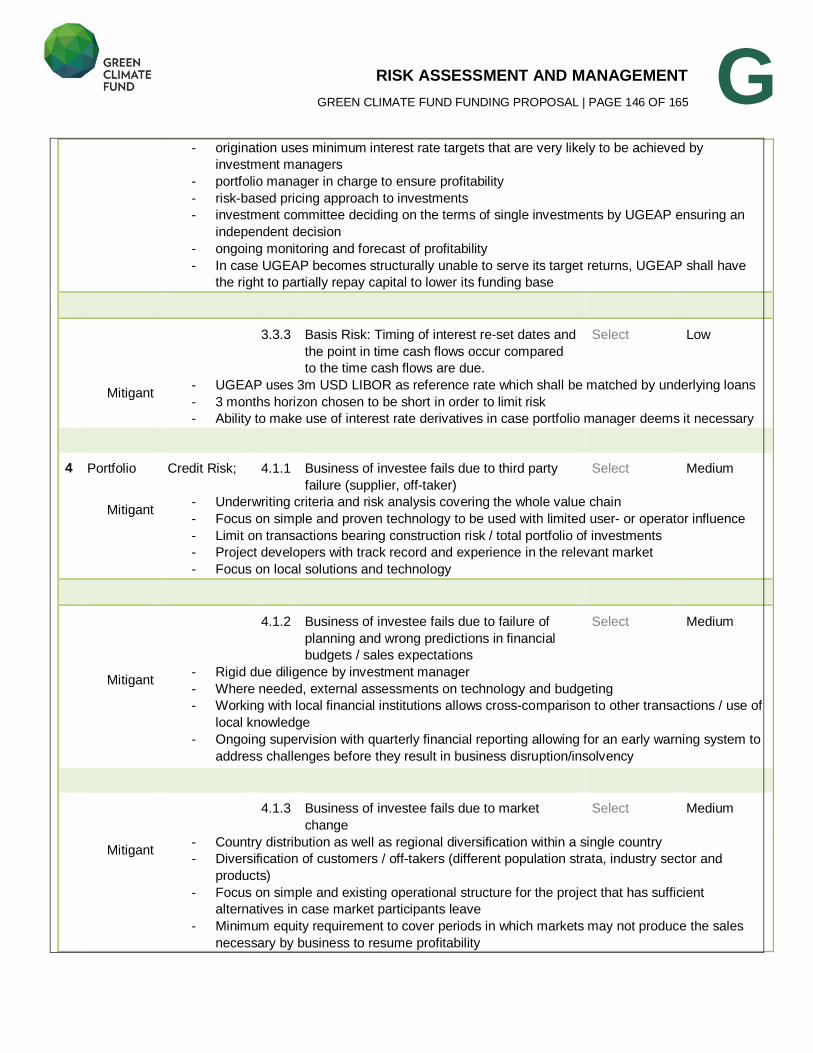
RISK ASSESSMENT AND MANAGEMENT GREEN CLIMATE FUND FUNDING PROPOSAL | PAGE 146 OF 165
G - origination uses minimum interest rate targets that are very likely to be achieved by
investment managers
- portfolio manager in charge to ensure profitability
- risk-based pricing approach to investments - investment committee deciding on the terms of single investments by UGEAP ensuring an
independent decision
- ongoing monitoring and forecast of profitability
- In case UGEAP becomes structurally unable to serve its target returns, UGEAP shall have
the right to partially repay capital to lower its funding base
3.3.3 Basis Risk: Timing of interest re-set dates and
the point in time cash flows occur compared
to the time cash flows are due.
Select Low
Mitigant - UGEAP uses 3m USD LIBOR as reference rate which shall be matched by underlying loans
- 3 months horizon chosen to be short in order to limit risk
- Ability to make use of interest rate derivatives in case portfolio manager deems it necessary
4 Portfolio Credit Risk; 4.1.1 Business of investee fails due to third party
failure (supplier, off-taker)
Select Medium
Mitigant - Underwriting criteria and risk analysis covering the whole value chain
- Focus on simple and proven technology to be used with limited user- or operator influence
- Limit on transactions bearing construction risk / total portfolio of investments
- Project developers with track record and experience in the relevant market
- Focus on local solutions and technology
4.1.2 Business of investee fails due to failure of
planning and wrong predictions in financial
budgets / sales expectations
Select Medium
Mitigant - Rigid due diligence by investment manager - Where needed, external assessments on technology and budgeting - Working with local financial institutions allows cross-comparison to other transactions / use of
local knowledge - Ongoing supervision with quarterly financial reporting allowing for an early warning system to
address challenges before they result in business disruption/insolvency
4.1.3 Business of investee fails due to market
change
Select Medium
Mitigant - Country distribution as well as regional diversification within a single country
- Diversification of customers / off-takers (different population strata, industry sector and
products)
- Focus on simple and existing operational structure for the project that has sufficient
alternatives in case market participants leave
- Minimum equity requirement to cover periods in which markets may not produce the sales
necessary by business to resume profitability
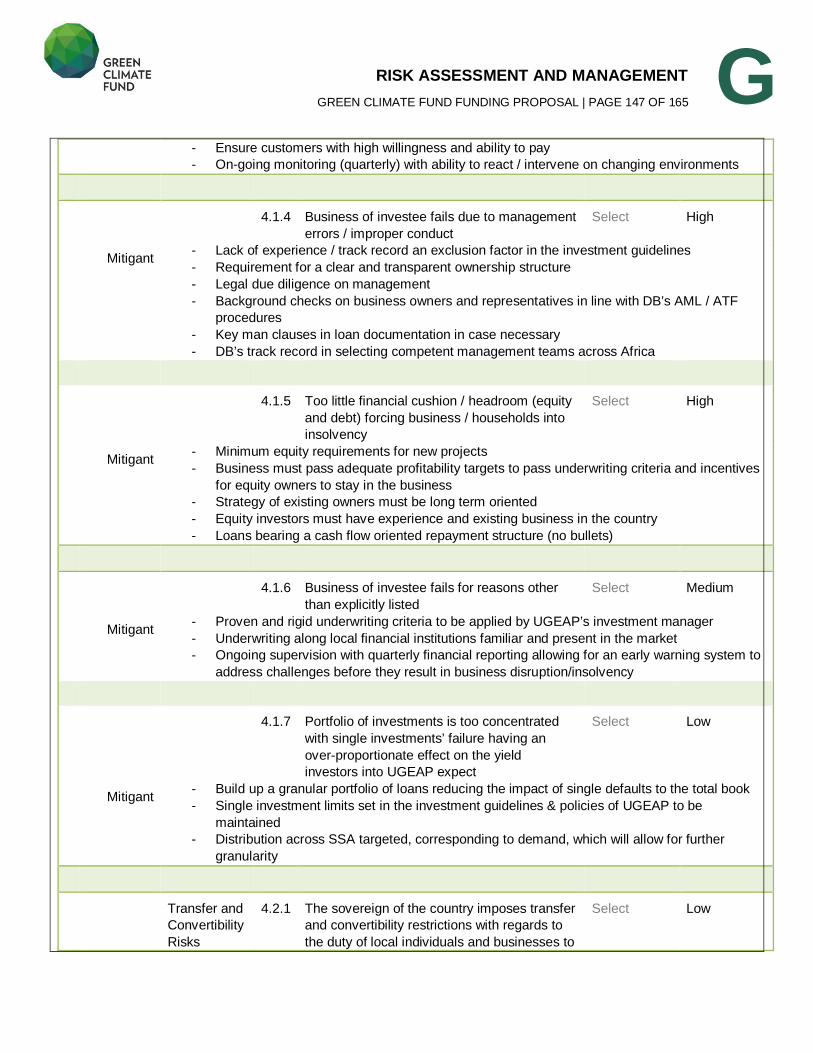
RISK ASSESSMENT AND MANAGEMENT GREEN CLIMATE FUND FUNDING PROPOSAL | PAGE 147 OF 165
G - Ensure customers with high willingness and ability to pay
- On-going monitoring (quarterly) with ability to react / intervene on changing environments
4.1.4 Business of investee fails due to management
errors / improper conduct
Select High
Mitigant - Lack of experience / track record an exclusion factor in the investment guidelines - Requirement for a clear and transparent ownership structure - Legal due diligence on management - Background checks on business owners and representatives in line with DB’s AML / ATF
procedures - Key man clauses in loan documentation in case necessary - DB’s track record in selecting competent management teams across Africa
4.1.5 Too little financial cushion / headroom (equity
and debt) forcing business / households into
insolvency
Select High
Mitigant - Minimum equity requirements for new projects
- Business must pass adequate profitability targets to pass underwriting criteria and incentives
for equity owners to stay in the business
- Strategy of existing owners must be long term oriented
- Equity investors must have experience and existing business in the country
- Loans bearing a cash flow oriented repayment structure (no bullets)
4.1.6 Business of investee fails for reasons other
than explicitly listed
Select Medium
Mitigant - Proven and rigid underwriting criteria to be applied by UGEAP’s investment manager
- Underwriting along local financial institutions familiar and present in the market
- Ongoing supervision with quarterly financial reporting allowing for an early warning system to
address challenges before they result in business disruption/insolvency
4.1.7 Portfolio of investments is too concentrated
with single investments’ failure having an
over-proportionate effect on the yield
investors into UGEAP expect
Select Low
Mitigant - Build up a granular portfolio of loans reducing the impact of single defaults to the total book
- Single investment limits set in the investment guidelines & policies of UGEAP to be
maintained
- Distribution across SSA targeted, corresponding to demand, which will allow for further
granularity
Transfer and
Convertibility
Risks
4.2.1 The sovereign of the country imposes transfer
and convertibility restrictions with regards to
the duty of local individuals and businesses to
Select Low
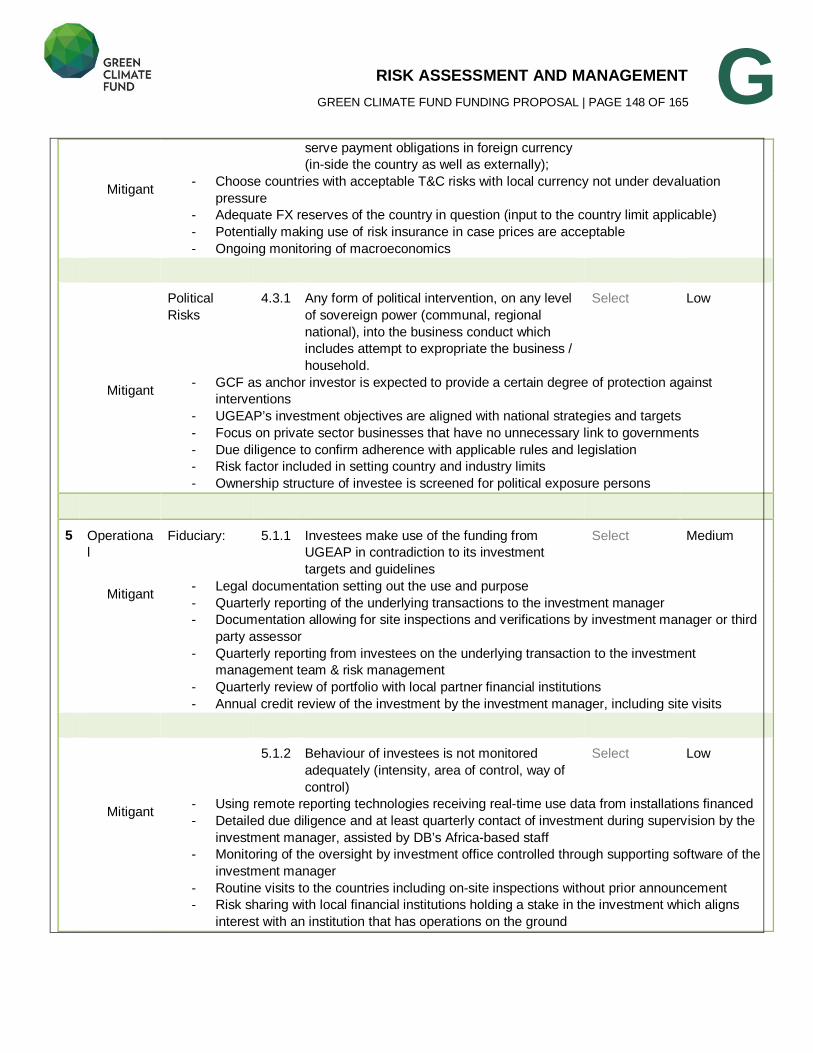
RISK ASSESSMENT AND MANAGEMENT GREEN CLIMATE FUND FUNDING PROPOSAL | PAGE 148 OF 165
G serve payment obligations in foreign currency
(in-side the country as well as externally);
Mitigant - Choose countries with acceptable T&C risks with local currency not under devaluation
pressure
- Adequate FX reserves of the country in question (input to the country limit applicable)
- Potentially making use of risk insurance in case prices are acceptable
- Ongoing monitoring of macroeconomics
Political
Risks
4.3.1 Any form of political intervention, on any level
of sovereign power (communal, regional
national), into the business conduct which
includes attempt to expropriate the business /
household.
Select Low
Mitigant - GCF as anchor investor is expected to provide a certain degree of protection against
interventions
- UGEAP’s investment objectives are aligned with national strategies and targets
- Focus on private sector businesses that have no unnecessary link to governments
- Due diligence to confirm adherence with applicable rules and legislation
- Risk factor included in setting country and industry limits
- Ownership structure of investee is screened for political exposure persons
5 Operationa
l
Fiduciary:
5.1.1 Investees make use of the funding from
UGEAP in contradiction to its investment
targets and guidelines
Select Medium
Mitigant - Legal documentation setting out the use and purpose
- Quarterly reporting of the underlying transactions to the investment manager
- Documentation allowing for site inspections and verifications by investment manager or third
party assessor
- Quarterly reporting from investees on the underlying transaction to the investment
management team & risk management
- Quarterly review of portfolio with local partner financial institutions
- Annual credit review of the investment by the investment manager, including site visits
5.1.2 Behaviour of investees is not monitored
adequately (intensity, area of control, way of
control)
Select Low
Mitigant - Using remote reporting technologies receiving real-time use data from installations financed
- Detailed due diligence and at least quarterly contact of investment during supervision by the
investment manager, assisted by DB’s Africa-based staff
- Monitoring of the oversight by investment office controlled through supporting software of the
investment manager
- Routine visits to the countries including on-site inspections without prior announcement
- Risk sharing with local financial institutions holding a stake in the investment which aligns
interest with an institution that has operations on the ground
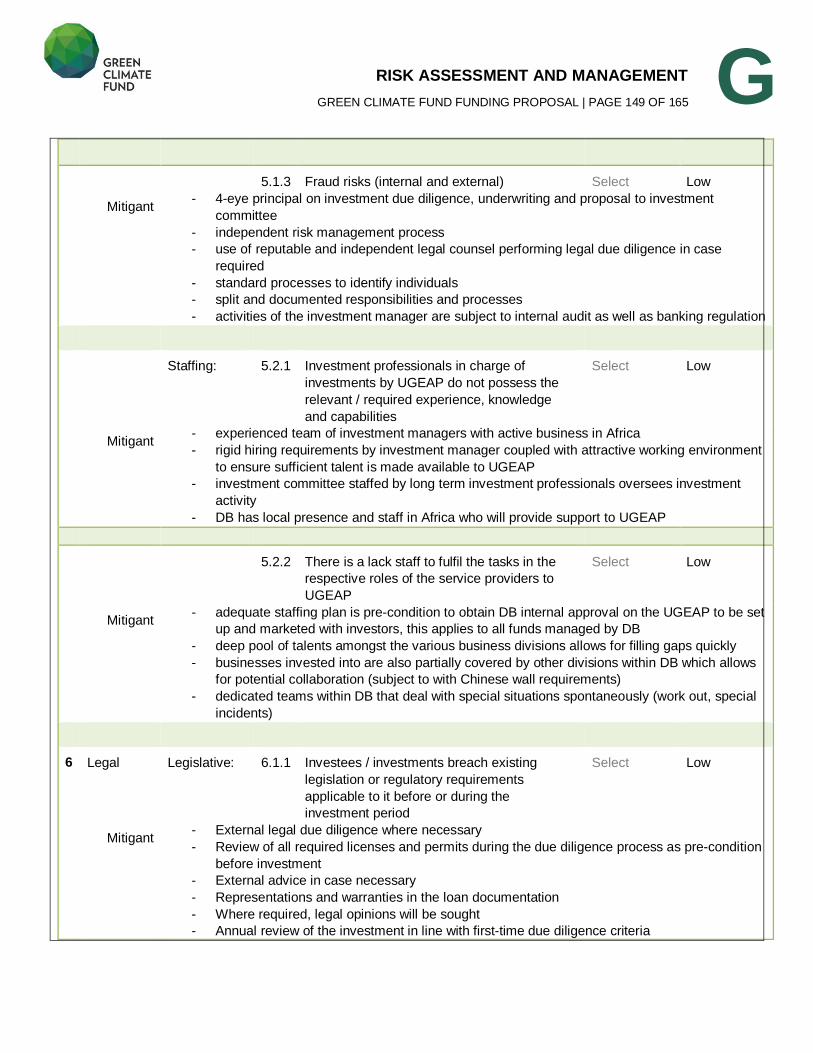
RISK ASSESSMENT AND MANAGEMENT GREEN CLIMATE FUND FUNDING PROPOSAL | PAGE 149 OF 165
G
5.1.3 Fraud risks (internal and external) Select Low
Mitigant - 4-eye principal on investment due diligence, underwriting and proposal to investment
committee
- independent risk management process
- use of reputable and independent legal counsel performing legal due diligence in case
required
- standard processes to identify individuals
- split and documented responsibilities and processes
- activities of the investment manager are subject to internal audit as well as banking regulation
Staffing:
5.2.1 Investment professionals in charge of
investments by UGEAP do not possess the
relevant / required experience, knowledge
and capabilities
Select Low
Mitigant - experienced team of investment managers with active business in Africa
- rigid hiring requirements by investment manager coupled with attractive working environment
to ensure sufficient talent is made available to UGEAP
- investment committee staffed by long term investment professionals oversees investment
activity
- DB has local presence and staff in Africa who will provide support to UGEAP
5.2.2 There is a lack staff to fulfil the tasks in the
respective roles of the service providers to
UGEAP
Select Low
Mitigant - adequate staffing plan is pre-condition to obtain DB internal approval on the UGEAP to be set
up and marketed with investors, this applies to all funds managed by DB - deep pool of talents amongst the various business divisions allows for filling gaps quickly
- businesses invested into are also partially covered by other divisions within DB which allows
for potential collaboration (subject to with Chinese wall requirements)
- dedicated teams within DB that deal with special situations spontaneously (work out, special
incidents)
6 Legal Legislative:
6.1.1 Investees / investments breach existing
legislation or regulatory requirements
applicable to it before or during the
investment period
Select Low
Mitigant - External legal due diligence where necessary
- Review of all required licenses and permits during the due diligence process as pre-condition
before investment
- External advice in case necessary
- Representations and warranties in the loan documentation
- Where required, legal opinions will be sought
- Annual review of the investment in line with first-time due diligence criteria
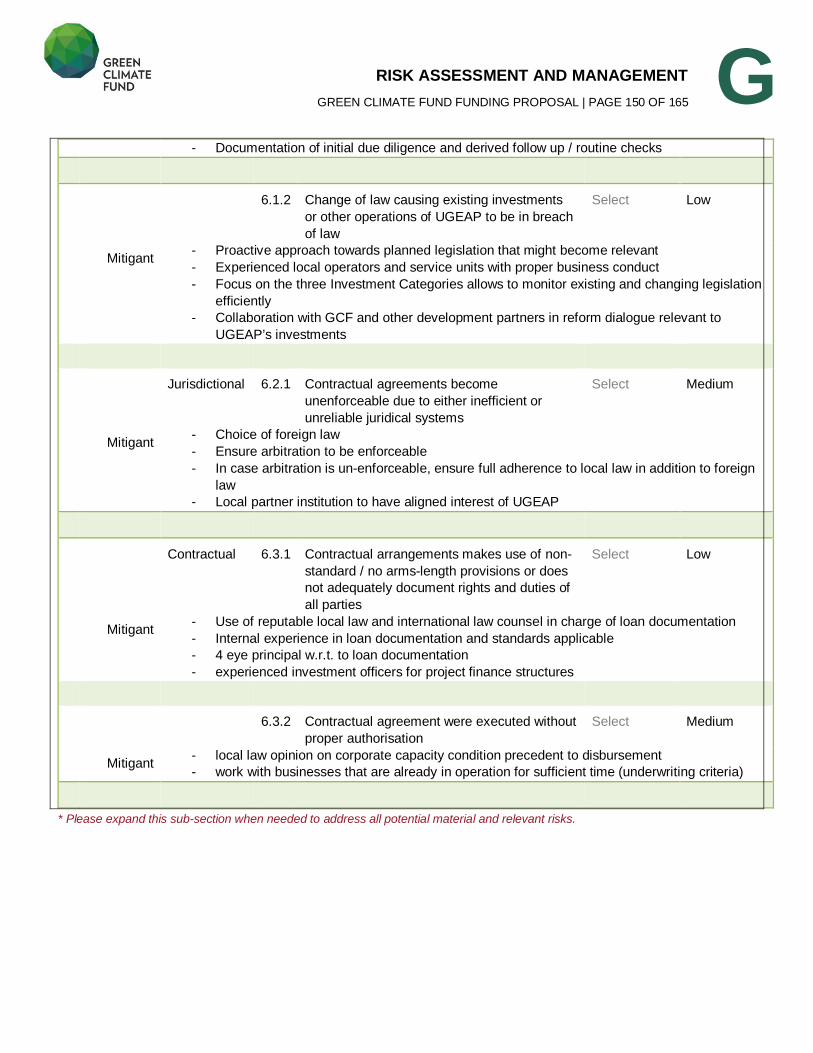
RISK ASSESSMENT AND MANAGEMENT GREEN CLIMATE FUND FUNDING PROPOSAL | PAGE 150 OF 165
G - Documentation of initial due diligence and derived follow up / routine checks
6.1.2 Change of law causing existing investments
or other operations of UGEAP to be in breach
of law
Select Low
Mitigant - Proactive approach towards planned legislation that might become relevant
- Experienced local operators and service units with proper business conduct
- Focus on the three Investment Categories allows to monitor existing and changing legislation
efficiently
- Collaboration with GCF and other development partners in reform dialogue relevant to
UGEAP’s investments
Jurisdictional 6.2.1 Contractual agreements become
unenforceable due to either inefficient or
unreliable juridical systems
Select Medium
Mitigant - Choice of foreign law
- Ensure arbitration to be enforceable
- In case arbitration is un-enforceable, ensure full adherence to local law in addition to foreign
law
- Local partner institution to have aligned interest of UGEAP
Contractual
6.3.1 Contractual arrangements makes use of non-
standard / no arms-length provisions or does
not adequately document rights and duties of
all parties
Select Low
Mitigant - Use of reputable local law and international law counsel in charge of loan documentation
- Internal experience in loan documentation and standards applicable
- 4 eye principal w.r.t. to loan documentation
- experienced investment officers for project finance structures
6.3.2 Contractual agreement were executed without
proper authorisation
Select Medium
Mitigant - local law opinion on corporate capacity condition precedent to disbursement
- work with businesses that are already in operation for sufficient time (underwriting criteria)
* Please expand this sub-section when needed to address all potential material and relevant risks.
RESULTS MONITORING AND REPORTING GREEN CLIMATE FUND FUNDING PROPOSAL | PAGE 151 OF 165
H H.1. Logic Framework. <Please specify the logic framework in accordance with the GCF’s Performance Measurement Framework under the Results Management Framework.>
H.1.1. Paradigm Shift Objectives and Impacts at the Fund level101
Paradigm shift objectives
Shift to low-emission sustainable
development pathways
At the program level, UGEAP supports the paradigm shift to a low-emission sustainable development pathway by:
Enabling local financial institutions to grow their financing activities of businesses in the clean energy sector through the supply of long term risk taking capital to local banks and hence innovate the traditional on-lending model;
Tapping into the deep pool of international capital supply and triggering access to private capital at scale for clean energy supply to local end beneficiaries (households and (V)SMEs); thereby facilitating impact at a larger scale and within shorter timeframes;
Increasing the efficiency of GCF’s capital which will be leveraged by a factor of 4, thereby providing a show-case for blended public-private finance in SSA.
At the level of single transactions and projects, the shift of the paradigm to a low-emission sustainable development pathway is
supported by the following:
Combining sustainable economic growth and climate change mitigation by financing clean energy supply; Technology transfer and innovation by financing state-of-the art proven technology and thereby support the rapidly growing
industry to gain scale; Scalability of the business models and the related technologies due to high standardization and proven business cases in the
national context; Bundle financial service with technical solutions which overcomes the barrier of high up-front costs for households and
businesses that in the past favored fossil fuel based solutions due to their significantly lower or no up-front investment needs; and Availability of local currency debt finance for projects generating local currency revenues.
101Information on the Fund’s expected results and indicators can be found in its Performance Measurement Frameworks available at the following link (Please note
that some indicators are under refinement): http://www.gcfund.org/fileadmin/00_customer/documents/Operations/5.3_Initial_PMF.pdf
RESULTS MONITORING AND REPORTING GREEN CLIMATE FUND FUNDING PROPOSAL | PAGE 152 OF 165
H Expected Result Indicator
Means of Verification
(MoV) Baseline
Target
Assumptions Mid-term
(24m)
(if
applicable)
Final)
Fund-level impacts
M1.0 Reduced emissions through increased low-emission energy access and power generation
1.1 Tons of carbon dioxide equivalent (t Co2 eq) reduced or avoided as a result of Fund-funded projects/program
DB Carbon
Measurement
Tool results
based on
project
developers’
input
Fossil-fuel-
based specific
indicator in
line with
IMPVP stan-
dards102
5m
tCO2e
12m
tCO2e
after
year 5
50m
tCO2e
after
year 15
UGEAP fulfils its investment targets in terms of the number
of investments and the USD amount expected to be
invested.
annual savings
distribution of projects in the spilt 20/20/60 over the 3
categories
Assume 50% of Category 3 transactions to be grid-
connected and not replacing Diesel generation sets (which
lowers the CO2e reduction)
Final target based on the target to invest USD500m
annually over the 5 year fund raising period while re-
investments over the remaining 10 years increase upside
mid target based on an investment of USD 200mn after 24
month
no change in the CO2 quantification approach and
consumer behavior
If USD2,100m would be invested through reinvestments103
,
significantly higher savings could be achieved which
provides upside potential to the targets (year 15 scenario)
Private sector capital mobilized
Volume of finance leveraged (or
Total CAPEX
as recorded
0 (currently no
private sector
UGEAP
invested
UGEAP
invested
UGEAP does attract sufficient capital from private sector
investors
102 IMPVP is the International Performance Measurment and Verification Protocol accounting and reporting standard.
103 Based on a cash flow model forecast on the available repayments from amortizing transactions that would produce cash to UGEAP which can
be re-invested.
RESULTS MONITORING AND REPORTING GREEN CLIMATE FUND FUNDING PROPOSAL | PAGE 153 OF 165
H mobilized) by UGEAP funding
in the DB
Carbon
Measurement
Tool based
on project
developers’
input
capital
contribution
for debt
funding
towards
Target
Investments)
capital:
200m
Share of
GCF /
Total
Capital
<=0.2
capital:=
>500m
Share of
GCF /
Total
Capital
<=0.2
Actual measurement over program lifetime
If USD2,100m would be invested through reinvestments, the
share of GCFs funding would be significantly lower – which
provides an upside.
Given the targets of UGEAP, DB has expanded the Paradigm Shift Objectives to be tracked by the M&V framework to include the amount of funding by
which GCF’s contribution will be leveraged.
H.1.2. Outcomes, Outputs, Activities and Inputs at Project/Programme level
Expected Result Indicator Means of
Verification (MoV)
Baseline
Target Assumptions
Mid-term (24m) Final
Project/ programme outcomes
Outcomes that contribute to Fund-level impacts
M6.0 Increased
number of
small, medium
and large low-
emission power
suppliers
6.2 Number of households and individuals with improved access to low-emission energy sources
quarterly
report by
project
developer on
the number of
off-take points
0 61,520
energy
consumer
s
153,800
energy
consumers
after year 5
461,400
energy
consumers
after year 15
UGEAP fulfils its investment targets in terms of the number of
investments and the USD amount expected to be invested.
Business of investees is successful and does not fail due to
market changes, third party failure, regulatory changes etc.
distribution of projects in the spilt 20/20/60 over the 3 categories
based on the target to invest USD500m annually over the 5
year fund raising period while re-investments over the remaining
10 years increase upside
capital can be employed entirely
If USD2,100m would be invested through reinvestments, more
consumers could be reached (year 15 upside scenario)
RESULTS MONITORING AND REPORTING GREEN CLIMATE FUND FUNDING PROPOSAL | PAGE 154 OF 165
H 6.3 MWs of low-
emission energy capacity installed, generated and/ or rehabilitated as result of GCF support
quarterly
report by
project
developer on
the installed
capacity
0 140MWp 346MWp
after year 5
1,500 MWp
after year 15
UGEAP fulfils its investment targets in terms of the number of
investments and the USD amount expected to be invested.
Business of investees is successful and does not fail due to
market changes, third party failure, regulatory changes etc.
distribution of projects in the spilt 20/20/60 over the 3 categories
based on the target to invest USD500m annually over the 5
year fund raising period while re-investments over the remaining
10 years increase upside
capital can be employed entirely
If USD2,100m would be invested through reinvestments, a
higher MWp amount could be achieved ( year 15 upside
scenario)
Employment
created Number of direct jobs created
Annual report
by project
developer on
number of
jobs created
0 2,000 5,000 after
year 5
15,000 after
year 15
Progress of this outcome is affected by conduct of investees
distribution of projects in the spilt 20/20/60 over the 3 categories
based on the target to invest USD500m annually over the 5
year fund raising period while re-investments over the remaining
10 years increase upside
capital can be employed entirely
If USD2,100m would be invested through reinvestment, more
jobs could be created ( year 15 upside scenario)
Share of female
employed Number of female over total number of employees
Annual report
by project
developer
current
(prior to first
close) % of
female
employees
>=25% >=40% Progress of this outcome is affected by conduct of investees
Direct jobs only
Access to
electricity for
women
(Category 1 and
2 only)
Females that have first time access to electrical energy as a percentage of the total number of population electrified first time
Annual report
by project
developer
0 >=0.5 >=0.5 UGEAP fulfils its investment targets in terms of the number of
investments and the USD amount expected to be invested.
Business of investees is successful and does not fail due to
market changes, third party failure, regulatory changes etc.
Progress of this outcome is affected by conduct of investees
Taxable
revenues
created within
Amount of tax paid within the Target Region
Annual
financial
reports by
current
(prior to first
close) tax
Positive
trend
Positive trend UGEAP fulfils its investment targets in terms of the number of
investments and the USD amount expected to be invested.
Business of investees is successful and does not fail due to
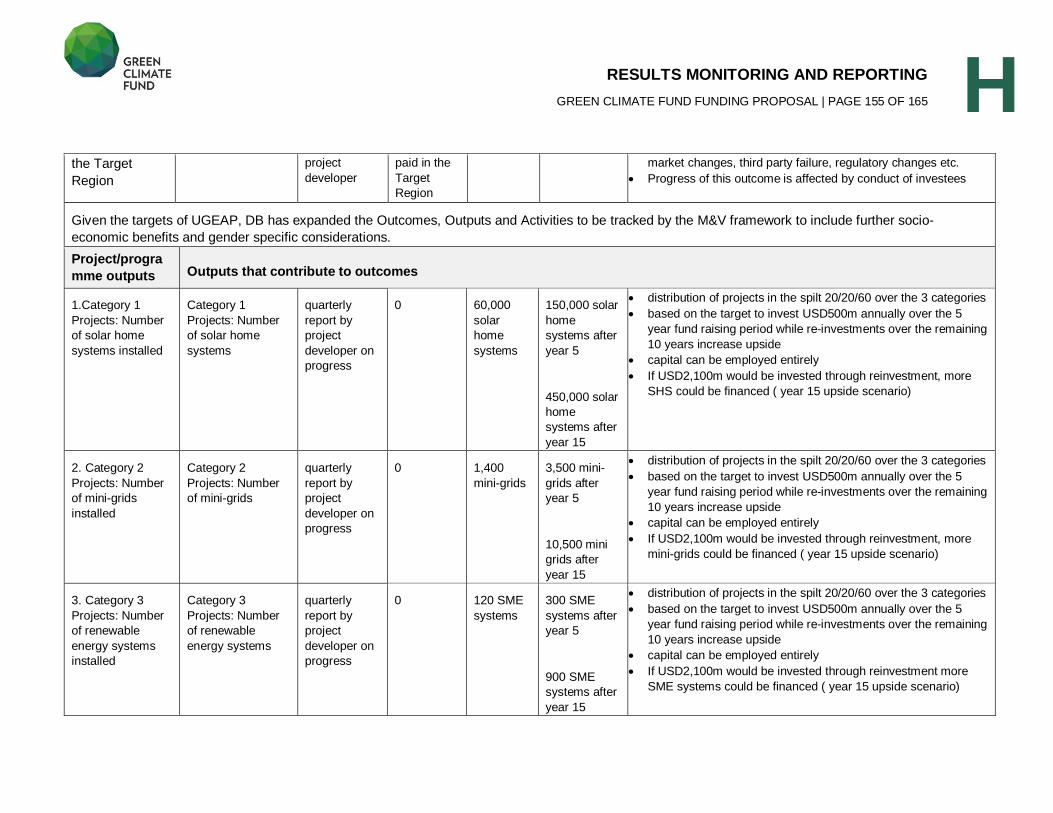
RESULTS MONITORING AND REPORTING GREEN CLIMATE FUND FUNDING PROPOSAL | PAGE 155 OF 165
H the Target
Region project
developer
paid in the
Target
Region
market changes, third party failure, regulatory changes etc.
Progress of this outcome is affected by conduct of investees
Given the targets of UGEAP, DB has expanded the Outcomes, Outputs and Activities to be tracked by the M&V framework to include further socio-
economic benefits and gender specific considerations. Project/programme outputs Outputs that contribute to outcomes
1.Category 1
Projects: Number
of solar home
systems installed
Category 1
Projects: Number
of solar home
systems
quarterly
report by
project
developer on
progress
0 60,000
solar
home
systems
150,000 solar
home
systems after
year 5
450,000 solar
home
systems after
year 15
distribution of projects in the spilt 20/20/60 over the 3 categories
based on the target to invest USD500m annually over the 5
year fund raising period while re-investments over the remaining
10 years increase upside
capital can be employed entirely
If USD2,100m would be invested through reinvestment, more
SHS could be financed ( year 15 upside scenario)
2. Category 2
Projects: Number
of mini-grids
installed
Category 2
Projects: Number
of mini-grids
quarterly
report by
project
developer on
progress
0 1,400
mini-grids
3,500 mini-
grids after
year 5
10,500 mini
grids after
year 15
distribution of projects in the spilt 20/20/60 over the 3 categories
based on the target to invest USD500m annually over the 5
year fund raising period while re-investments over the remaining
10 years increase upside
capital can be employed entirely
If USD2,100m would be invested through reinvestment, more
mini-grids could be financed ( year 15 upside scenario)
3. Category 3
Projects: Number
of renewable
energy systems
installed
Category 3
Projects: Number
of renewable
energy systems
quarterly
report by
project
developer on
progress
0 120 SME
systems
300 SME
systems after
year 5
900 SME
systems after
year 15
distribution of projects in the spilt 20/20/60 over the 3 categories
based on the target to invest USD500m annually over the 5
year fund raising period while re-investments over the remaining
10 years increase upside
capital can be employed entirely
If USD2,100m would be invested through reinvestment more
SME systems could be financed ( year 15 upside scenario)
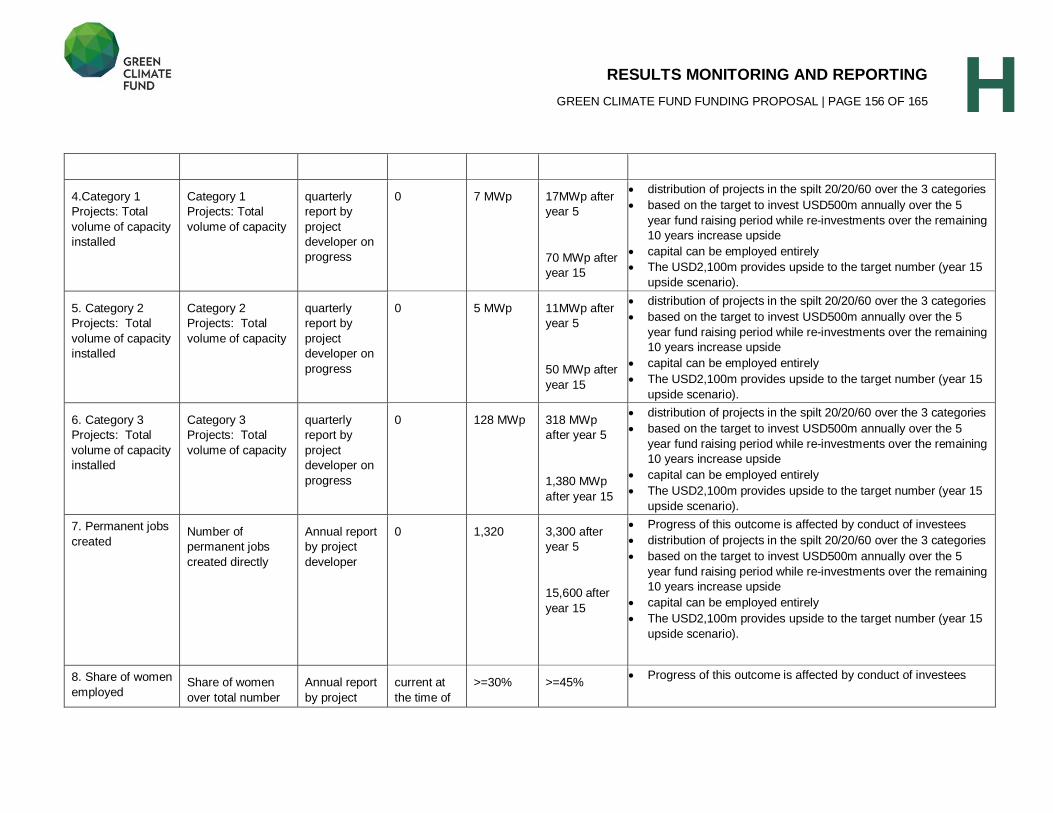
RESULTS MONITORING AND REPORTING GREEN CLIMATE FUND FUNDING PROPOSAL | PAGE 156 OF 165
H
4.Category 1
Projects: Total
volume of capacity
installed
Category 1
Projects: Total
volume of capacity
quarterly
report by
project
developer on
progress
0 7 MWp 17MWp after
year 5
70 MWp after
year 15
distribution of projects in the spilt 20/20/60 over the 3 categories
based on the target to invest USD500m annually over the 5
year fund raising period while re-investments over the remaining
10 years increase upside
capital can be employed entirely
The USD2,100m provides upside to the target number (year 15
upside scenario).
5. Category 2
Projects: Total
volume of capacity
installed
Category 2
Projects: Total
volume of capacity
quarterly
report by
project
developer on
progress
0 5 MWp 11MWp after
year 5
50 MWp after
year 15
distribution of projects in the spilt 20/20/60 over the 3 categories
based on the target to invest USD500m annually over the 5
year fund raising period while re-investments over the remaining
10 years increase upside
capital can be employed entirely
The USD2,100m provides upside to the target number (year 15
upside scenario).
6. Category 3
Projects: Total
volume of capacity
installed
Category 3
Projects: Total
volume of capacity
quarterly
report by
project
developer on
progress
0 128 MWp 318 MWp
after year 5
1,380 MWp
after year 15
distribution of projects in the spilt 20/20/60 over the 3 categories
based on the target to invest USD500m annually over the 5
year fund raising period while re-investments over the remaining
10 years increase upside
capital can be employed entirely
The USD2,100m provides upside to the target number (year 15
upside scenario).
7. Permanent jobs
created Number of
permanent jobs
created directly
Annual report
by project
developer
0 1,320 3,300 after
year 5
15,600 after
year 15
Progress of this outcome is affected by conduct of investees
distribution of projects in the spilt 20/20/60 over the 3 categories
based on the target to invest USD500m annually over the 5
year fund raising period while re-investments over the remaining
10 years increase upside
capital can be employed entirely
The USD2,100m provides upside to the target number (year 15
upside scenario).
8. Share of women
employed Share of women
over total number
Annual report
by project
current at
the time of
>=30% >=45% Progress of this outcome is affected by conduct of investees
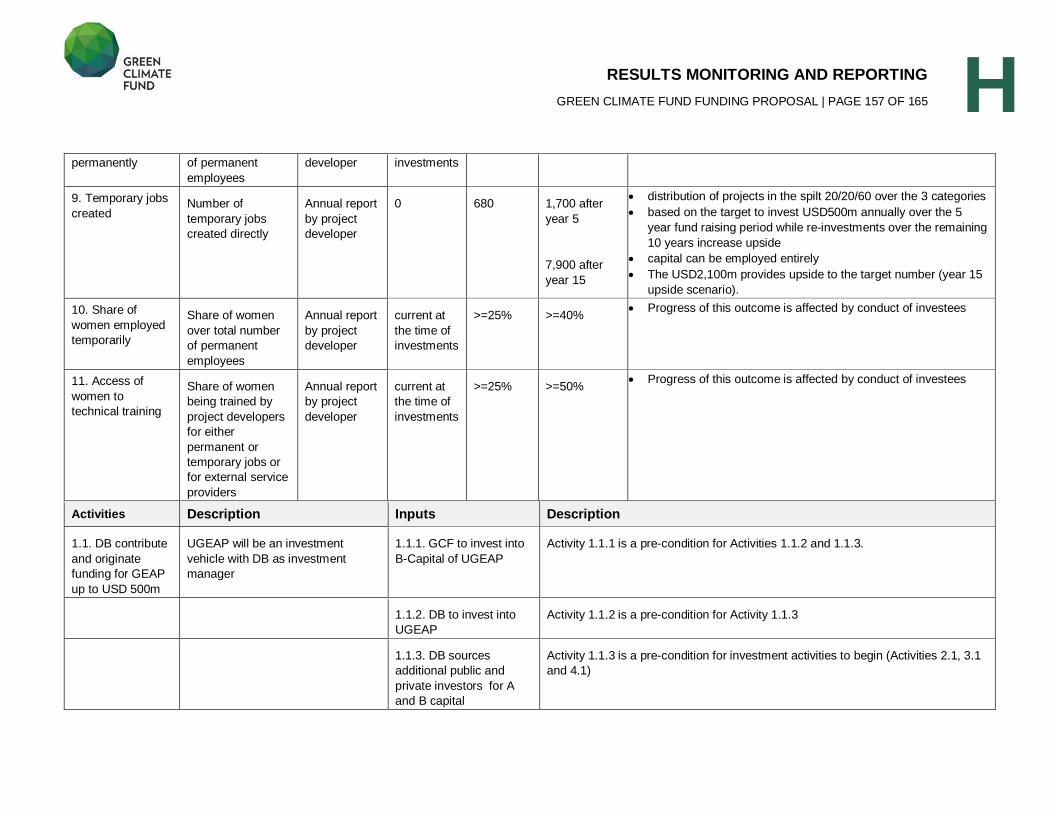
RESULTS MONITORING AND REPORTING GREEN CLIMATE FUND FUNDING PROPOSAL | PAGE 157 OF 165
H permanently of permanent
employees
developer investments
9. Temporary jobs
created Number of
temporary jobs
created directly
Annual report
by project
developer
0 680 1,700 after
year 5
7,900 after
year 15
distribution of projects in the spilt 20/20/60 over the 3 categories
based on the target to invest USD500m annually over the 5
year fund raising period while re-investments over the remaining
10 years increase upside
capital can be employed entirely
The USD2,100m provides upside to the target number (year 15
upside scenario).
10. Share of
women employed
temporarily
Share of women
over total number
of permanent
employees
Annual report
by project
developer
current at
the time of
investments
>=25% >=40% Progress of this outcome is affected by conduct of investees
11. Access of
women to
technical training
Share of women
being trained by
project developers
for either
permanent or
temporary jobs or
for external service
providers
Annual report
by project
developer
current at
the time of
investments
>=25% >=50% Progress of this outcome is affected by conduct of investees
Activities Description Inputs Description
1.1. DB contribute
and originate
funding for GEAP
up to USD 500m
UGEAP will be an investment
vehicle with DB as investment
manager
1.1.1. GCF to invest into
B-Capital of UGEAP
Activity 1.1.1 is a pre-condition for Activities 1.1.2 and 1.1.3.
1.1.2. DB to invest into
UGEAP
Activity 1.1.2 is a pre-condition for Activity 1.1.3
1.1.3. DB sources
additional public and
private investors for A
and B capital
Activity 1.1.3 is a pre-condition for investment activities to begin (Activities 2.1, 3.1
and 4.1)
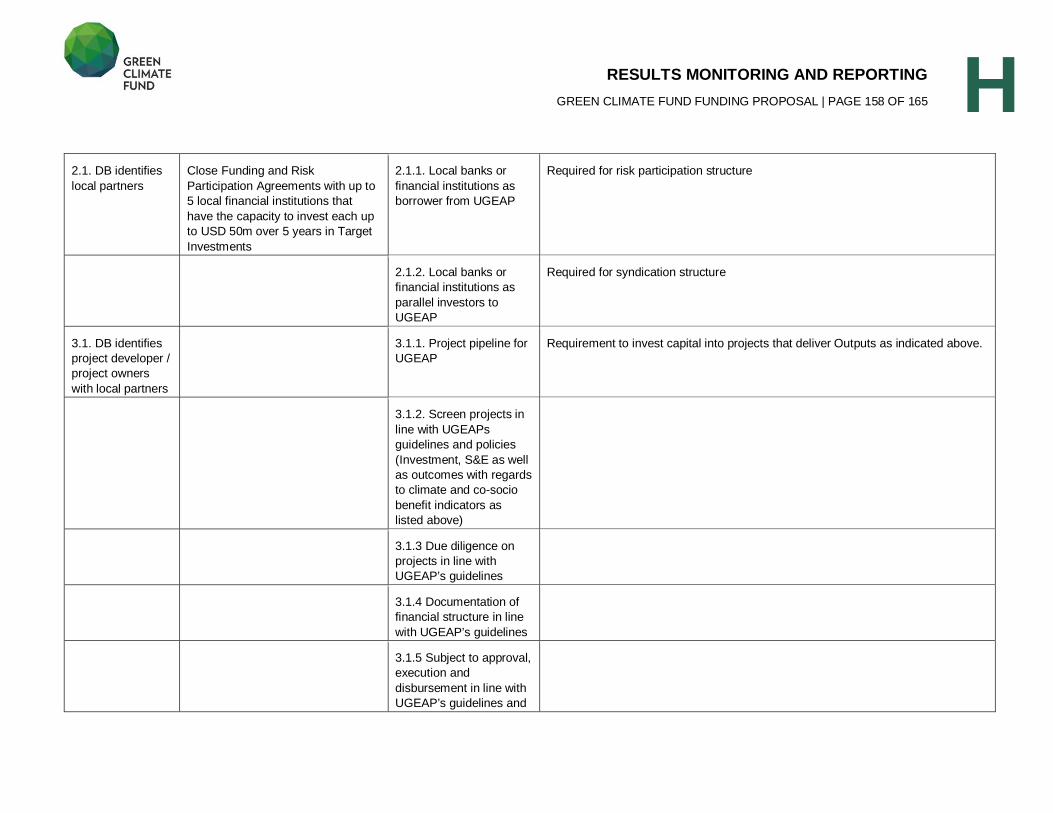
RESULTS MONITORING AND REPORTING GREEN CLIMATE FUND FUNDING PROPOSAL | PAGE 158 OF 165
H 2.1. DB identifies
local partners
Close Funding and Risk
Participation Agreements with up to
5 local financial institutions that
have the capacity to invest each up
to USD 50m over 5 years in Target
Investments
2.1.1. Local banks or
financial institutions as
borrower from UGEAP
Required for risk participation structure
2.1.2. Local banks or
financial institutions as
parallel investors to
UGEAP
Required for syndication structure
3.1. DB identifies
project developer /
project owners
with local partners
3.1.1. Project pipeline for
UGEAP
Requirement to invest capital into projects that deliver Outputs as indicated above.
3.1.2. Screen projects in
line with UGEAPs
guidelines and policies
(Investment, S&E as well
as outcomes with regards
to climate and co-socio
benefit indicators as
listed above)
3.1.3 Due diligence on
projects in line with
UGEAP’s guidelines
3.1.4 Documentation of
financial structure in line
with UGEAP’s guidelines
3.1.5 Subject to approval,
execution and
disbursement in line with
UGEAP’s guidelines and
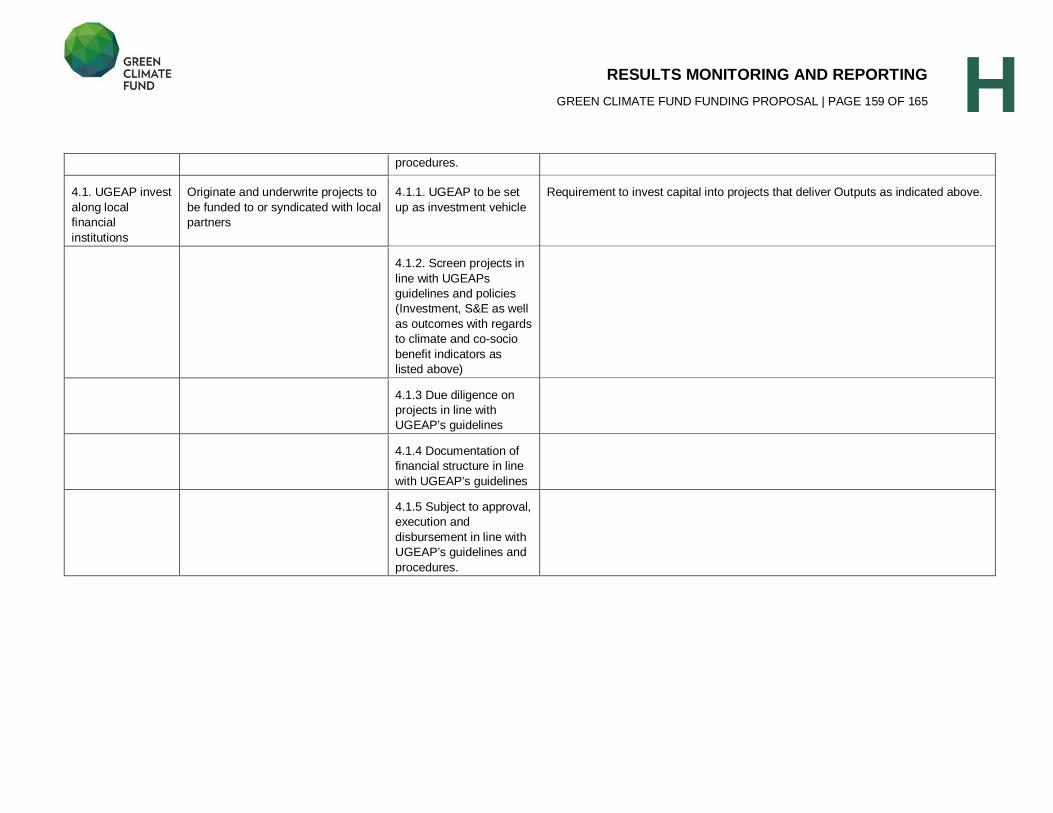
RESULTS MONITORING AND REPORTING GREEN CLIMATE FUND FUNDING PROPOSAL | PAGE 159 OF 165
H procedures.
4.1. UGEAP invest
along local
financial
institutions
Originate and underwrite projects to
be funded to or syndicated with local
partners
4.1.1. UGEAP to be set
up as investment vehicle
Requirement to invest capital into projects that deliver Outputs as indicated above.
4.1.2. Screen projects in
line with UGEAPs
guidelines and policies
(Investment, S&E as well
as outcomes with regards
to climate and co-socio
benefit indicators as
listed above)
4.1.3 Due diligence on
projects in line with
UGEAP’s guidelines
4.1.4 Documentation of
financial structure in line
with UGEAP’s guidelines
4.1.5 Subject to approval,
execution and
disbursement in line with
UGEAP’s guidelines and
procedures.
RESULTS MONITORING AND REPORTING
GREEN CLIMATE FUND FUNDING PROPOSAL | PAGE 160 OF 165
H H.2. Arrangements for Monitoring, Reporting and Evaluation
<Please specify institutional setting and implementation arrangements for monitoring and reporting. Please indicate how you will organize mid-term and final evaluations.>
Information and Reporting Framework Within the Investment advisory agreement certain reporting processes, routines and recipients will be defined.
Communication channels of the UGEAP will be a dedicated website of the fund to be maintained by the
Investment Manager. The website will act as information exchange platform targeting investors as well as
stakeholders. In parallel to the information that will be made public, reports will also be distributed to specific
recipients only on a non-public basis.
Overall, key reports to be prepared include:
Quarterly To be published online:
o Key fact sheet outlining the Fund’s activities in the reporting quarter, including information on new
investments, portfolio performance, defined impact indicators such as CO2 savings;
o Each investment will be presented in a summary on the website;
For investors only through the custodian:
o Quarterly, non-audited financial statements prepared according to requirements under IFRS;
o Quarterly, non-audited valuation report detailing the net asset value of each investor’s share at
quarters’ end;
Annual Report To be published online:
o An annual report on the operations of the UGEAP covering the following sections;
o Activities report on investments;
o Activities report on funding;
o Social & Environmental compliance report including impact reporting;
o Financial results (balance sheet and profit & loss calculation) according to requirements under
IFRS;
For investors only through the custodian:
o Audited financial statements in accordance with IFRS;
o Audited valuation report detailing the net asset value of each investor’s share at the end of the
financial year.
Quarterly and annual investor reports will include data on the leverage GCF would have achieved with its
investment into the UGEAP.
An impact evaluation can be conducted at the end of the investment term.
Institutional Setting and Implementation Arrangement for Carbon Reporting In its function as investment manager of the UGEAP, Deutsche Bank will further assume the obligation to:
assess the expected CO2e savings from a single investment prior to the investment (forward-looking
assessment) and form a decision in line with the guidelines of the UGEAP that also define eligible
investments from a carbon emission reduction perspective;
monitor / estimate the actual CO2e savings as a result of UGEAP’s investment over the lifetime of the
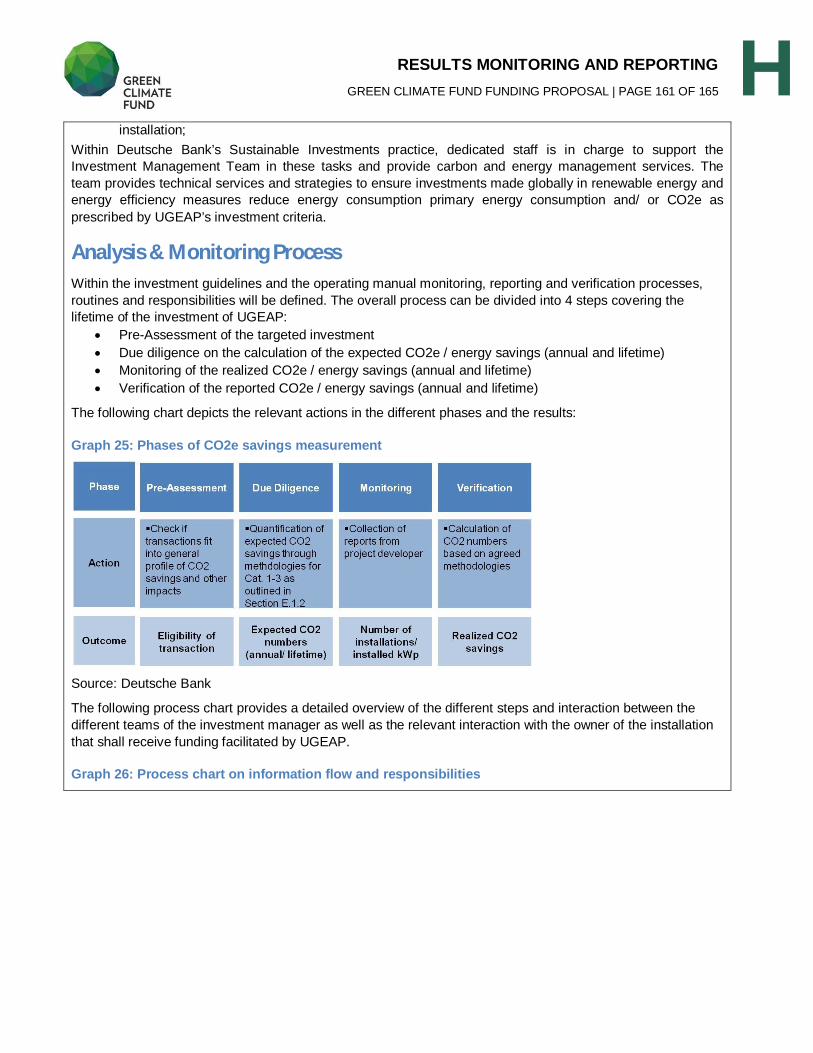
RESULTS MONITORING AND REPORTING
GREEN CLIMATE FUND FUNDING PROPOSAL | PAGE 161 OF 165
H installation;
Within Deutsche Bank’s Sustainable Investments practice, dedicated staff is in charge to support the
Investment Management Team in these tasks and provide carbon and energy management services. The
team provides technical services and strategies to ensure investments made globally in renewable energy and
energy efficiency measures reduce energy consumption primary energy consumption and/ or CO2e as
prescribed by UGEAP’s investment criteria.
Analysis & Monitoring Process Within the investment guidelines and the operating manual monitoring, reporting and verification processes,
routines and responsibilities will be defined. The overall process can be divided into 4 steps covering the
lifetime of the investment of UGEAP:
Pre-Assessment of the targeted investment
Due diligence on the calculation of the expected CO2e / energy savings (annual and lifetime)
Monitoring of the realized CO2e / energy savings (annual and lifetime)
Verification of the reported CO2e / energy savings (annual and lifetime)
The following chart depicts the relevant actions in the different phases and the results:
Graph 25: Phases of CO2e savings measurement
Source: Deutsche Bank
The following process chart provides a detailed overview of the different steps and interaction between the
different teams of the investment manager as well as the relevant interaction with the owner of the installation
that shall receive funding facilitated by UGEAP.
Graph 26: Process chart on information flow and responsibilities
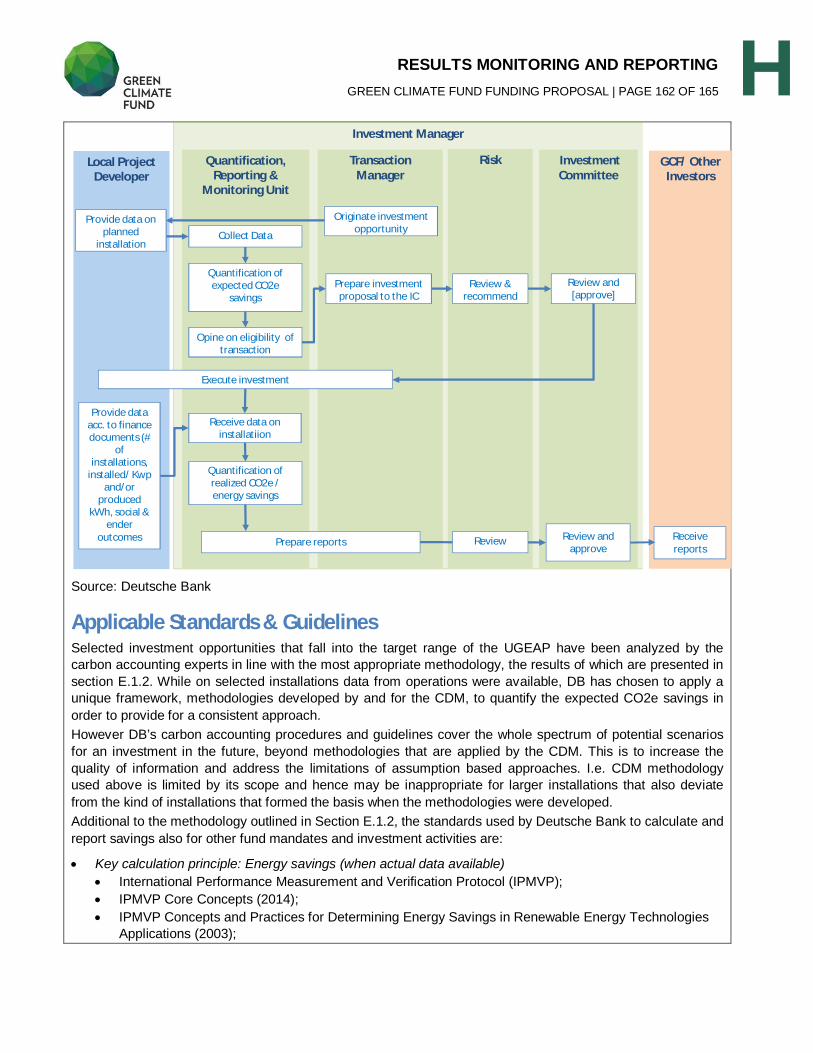
RESULTS MONITORING AND REPORTING
GREEN CLIMATE FUND FUNDING PROPOSAL | PAGE 162 OF 165
H
Source: Deutsche Bank
Applicable Standards & Guidelines Selected investment opportunities that fall into the target range of the UGEAP have been analyzed by the
carbon accounting experts in line with the most appropriate methodology, the results of which are presented in
section E.1.2. While on selected installations data from operations were available, DB has chosen to apply a
unique framework, methodologies developed by and for the CDM, to quantify the expected CO2e savings in
order to provide for a consistent approach.
However DB’s carbon accounting procedures and guidelines cover the whole spectrum of potential scenarios
for an investment in the future, beyond methodologies that are applied by the CDM. This is to increase the
quality of information and address the limitations of assumption based approaches. I.e. CDM methodology
used above is limited by its scope and hence may be inappropriate for larger installations that also deviate
from the kind of installations that formed the basis when the methodologies were developed.
Additional to the methodology outlined in Section E.1.2, the standards used by Deutsche Bank to calculate and
report savings also for other fund mandates and investment activities are:
Key calculation principle: Energy savings (when actual data available) International Performance Measurement and Verification Protocol (IPMVP);
IPMVP Core Concepts (2014);
IPMVP Concepts and Practices for Determining Energy Savings in Renewable Energy Technologies
Applications (2003);
Investment Manager
Quantification, Reporting &
Monitoring Unit
Transaction Manager
Investment Committee
Review and[approve]
RiskLocal Project Developer
Review & recommend
Collect Data
GCF/ Other Investors
Receivereports
Execute investment
Receive data on installatiion
Prepare reports Review andapprove
Prepare investment proposal to the IC
Quantification of expected CO2e
savings
Opine on eligibility of transaction
Provide data acc. to finance documents (#
of installations,
installed/ Kwpand/or
produced kWh, social &
ender outcomes
Quantification of realized CO2e / energy savings
Originate investment opportunity
Provide data on planned
installation
Review
RESULTS MONITORING AND REPORTINGGREEN CLIMATE FUND FUNDING PROPOSAL | PAGE 163 OF 165 H
IPMVP Concepts and Practices for Determining Energy Savings in New Construction (2006)
Key calculation principle: Energy savings (estimated approach in case actual data is not available ) Clean Development Mechanism
Focus calculation: Measurement and verification standards EU Directive 2006/32/EC
Key calculation principle: Carbon savings and accounting ISO 14064-2 (2009)
Static data sources GHG Protocol Stationary Combustion Tool (2014)
DEFRA (2015)
DB foresees that these standards would also be applicable to UGEAP since the existing CO2e savings
reporting infrastructure shall be used of UGEAP also.
For each investment the baseline and savings calculations will be aligned with the most appropriate
international standards and protocols. These decisions will be influenced by the type of technology, available
data and size of investment.
Institutional arrangements for monitoring socio-economic benefits Through its existing investment funds DB has experience in requesting reporting from investees on socio-
economic indicators and monitoring their development. KPIs are clearly defined at the time of financial
documentation and investees are asked to report on them in regular intervals. In some cases, DB collaborates
with experienced parties as compliance advisors. UGEAP can follow a similar model, whereby regular
reporting will need to be provided by the investees, while DB with the support of a qualified external party
(such as the International Labor Organization or a local university or research institute) can verify and
triangulate the data provided.
BibliographyGREEN CLIMATE FUND FUNDING PROPOSAL | PAGE 164 OF 165 I
Bibliography
AfDB, OECD, UNDP. "African Economic Outlook 2015." 2014.http://www.africaneconomicoutlook.org
African Development Bank. "African Economic Outlook 2012." 2012.http://www.africaneconomicoutlook.org (accessed 08 24, 2015).
African Development Bank Group. "Renewable Energy in Africa. Tanzania Country Profile." 2015.http://www.afdb.org/fileadmin/uploads/afdb/Documents/Generic-Documents/Renewable_Energy_in_Africa_-_Tanzania.pdf (accessed 08 24, 2015).
Africa Progress Panek. "Power People Planet, Seizing Africa's Energy and Climate Opportunitites,Africa Progress Report 2015"http://app-cdn.acwupload.co.uk/wp-content/uploads/2015/06/APP_REPORT_2015_FINAL_low1.pdf
Baker McKenzie. "The Future for Clean Energy in Africa." 2013.http://www.bakermckenzie.com/files/upload/The%20future%20for%20clean%20energy%20in%20Africa%20%28Final%29.pdf (accessed 08 24, 2015).
Bloomberg New Energy Finance. H2 2014 Sub-Saharan Africa Market Outlook. London, 2104.
CDM Executive Board. Indicative Simplified Baseline and Monitoring Methodologies for SelectecSmall-Scale CDM Project Activitiy Categories, Version 01.0, 02. March 2012.
CRDB Annual Report. 2014. http://crdbbank.com/tz/reports-financial/send/9-annual-reports/36-annual-report-2014.html.
Delegation of German Industry and Commerce in Kenya. Target Market Study Tanzania Solar PVWind Power. Nairobi, 2013.
Dr. Greacen, Chris. "World Bank Africa Energy Unit." Presentation during GIZ workshop held on19. April 2014 in Berlin, n.d.
Economist Intelligence Unit. "Country Risk Service." April 2015. www.eiu.com (accessed 08 24,2015).
Ernst Young. "EY’s attractiveness survey Africa 2015 Making Choices." 2015.http://www.ey.com/Publication/vwLUAssets/EY-africa-attractiveness-survey-june-2015-final/$FILE/EY-africa-attractiveness-survey-june-2015-final.pdf (accessed 08 24, 2015).
Galland, Amy. Clean Green Best practice in Photovoltaics. 2012.
Gerlach, Gaudchau, Cader, Wasgindt and Breyer 2013: Comprehensive Country Ranking ForRenewable Energy Based Mini-Grids Providing Rural Off-Grid Electrification; preprintpublished at the 28th European Photovoltaic Solar Energy Conference, September 30October 4, 2013, Paris, France; availale on: http://www.reiner-lemoine-
BibliographyGREEN CLIMATE FUND FUNDING PROPOSAL | PAGE 165 OF 165 I
institut.de/sites/default/files/5do.13.2_gerlach2013_paper_compcountryrankingre-basedmini-gridsprovruraloff-gridelec_28theupvsec_5do.13.2_paris_preprint.pdf
Government of Tanzania, Ministry of Energy and Minerals. "Final Report on Joint Energy SectorReview for 2010/11." 2011.
—. Scaling-Up Renewable Energy Programme (SREP). Investment Plan for Tanzania. Dar es Salaam,2013.
—. "Tanzania Energy Sector." Presentation given during JICA conference in July 2011 in Tokyo. Tokyo,2011.
IFC 2012: From Gap to Opportunity: Business Models for Scaling Up Energy Access; The InternationalFinance Corporation, Washington D.C.
International Energy Agency (IEA). "Africa Energy Outlook." 2014.
International Labour Organisation (ILO). n.d.http://www.ilo.org/public/english/employment/strat/kilm/download.htm (accessed 0824, 2015).
International Monetary Fund. Global Financial Stability Report. n.d.
International Monetary Fund. International Financial Statistics and Data Files. And World Bank andOECD GDP estimates: IMF, World Bank, OECD, n.d.
International Monetary Fund. World Economic Outlook Database. n.d.
IRENA. "Africa’s Renewable Future the Path to Sustainable Growth." 2013.https://www.irena.org/DocumentDownloads/Publications/Africa_renewable_future.pdf(accessed 08 24, 2015).
—. "Analysis of Infrastructure for Renewable Power in Eastern and Southern Africa." 2015.http://www.irena.org/DocumentDownloads/Publications/IRENA_Africa_CEC_infrastructure_2015.pdf.
—. "Working Together to Build an East and Southern African Clean Energy Corridor." 2013.https://www.irena.org/DocumentDownloads/Publications/Africa%20Clean%20Energy%20Corridor%20brochure.pdf (accessed 08 28, 2015).
James, Rachel, and Richard Washington. "Changes in African Temperature and PrecipitationAssociated with Degrees of Global Warming." Climatic Change 2013: 859-872.
JPMorgan GIIN "Eyes on the Horizon, The Impact Investor Survey", May 2015https://thegiin.org/assets/documents/pub/2015.04%20Eyes%20on%20the%20Horizon.pdf
Lighting Africa Tanzania Market Intelligence Report. 2013. http://sun-connect-news.org/fileadmin/DATEIEN/Dateien/New/TANZANIA-Market.pdf (accessed 08 24,2015).
BibliographyGREEN CLIMATE FUND FUNDING PROPOSAL | PAGE 166 OF 165 I
—. 2013. http://sun-connect-news.org/fileadmin/DATEIEN/Dateien/New/TANZANIA-Market.pdf.
Millenium Resource Strategies, Vivek Mittal 2015. Implementing Renewable Energy Initiatives inAfrica. Background Paper for the 2015 ICA Annual Meeting in Abidjan, Cote d'Ivoire.
REN21. "Renewables 2014 Global Status Report." Renewable Energy Policy Network for the 21stcentury. 2014.http://www.ren21.net/Portals/0/documents/Resources/GSR/2014/GSR2014_full%20report_low%20res.pdf (accessed 08 24, 2015).
SOFRECO, et al. "Study on Programme for Infrastructure Development in Africa (PIDA): Phase III."2011. http://www.afdb.org/fileadmin/uploads/afdb/Documents/Project-and-Operations/PIDA%20Study%20Synthesis.pdf (accessed 08 24, 2015).
The Observatory of Economic Complexity. n.d. https://atlas.media.mit.edu (accessed 08 24, 2015).
United Nations Development Programme. Standardized baseline assessment for Rural Off-Grid-Electrification in Sub-Saharan Africa. 2014.
United Nations. UNFCCC. Indicative simplified baseline and monitoring methodoloeies for selectedsmall-scale CDM project activity categories. III.AR. Substituting fuel based lighting withLED/CFL lighting systems. Sectoral Scope: 01. Version: 02. EB 65. 2010.
World Bank 2009, Local Sources of Financing for Infrastructure in Africa, Policy Research Working Paper 4878, World Bank, March 2009
World Bank. 2011. http://data.worldbank.org/indicator/NV.AGR.TOTL.ZS (accessed 08 24, 2015).
AnnexesGREEN CLIMATE FUND FUNDING PROPOSAL | PAGE 167 OF 165 J
* Please note that a funding proposal will be considered complete only upon receipt of all the applicable supportingdocuments.
I. Supporting Documents for Funding Proposal (not part of the public version)
NDA No-objection Letter
Integrated Financial Model that provides sensitivity analysis of critical elements (xls format)
Term Sheet
Environmental and Social Impact Assessment (ESIA) or Environmental and Social Management Plan
Map indicating the location of the project/program
Timetable of project/program implementation
Page 168
Page 169

Page 170
Page 171

Page 172
Page 173

Page 174
Page 175
Environmental and social report(s) disclosure
Basic project/programme information
Project/programme title Universal Green Energy Access Programme (UGEAP)
Accredited entity Deutsche Bank AG
Environmental and social safeguards (ESS) category
Intermediation 2 (I2)
Environmental and Social Risk Management Report (ESRM)
Date of disclosure on accredited entity’s website
2016-06-20
Language(s) of disclosure English and French
Link to disclosure ESMR:
https://www.db.com/cr/de/konkret-alternative-investments.htm
Other link(s) http://
________