Embed Size (px)
Citation preview

Considerations for Analysis of NAEP Data
Page 1 of 20
Slide 1 of 40
Considerations for Analysis of NAEP Data
Slide 2 of 40
Module Objectives
Describe the use of NAEPEX Software
Describe the use of AM Software
Describe considerations for analyzing NAEP data

Considerations for Analysis of NAEP Data
Page 2 of 20
Slide 3 of 40
Use Caution When Analyzing NAEP Data
Many statistical packages assume simple random sampling
NAEP data should not be analyzed using such procedures
o May result in biased estimates
o Can also result in underestimated sampling errors that will produce incorrect p values, which can incorrectly indicate differences that are statistically significant when they are not
It is necessary to use special statistical software that accounts for the NAEP study design
This module will focus on teaching you two particular tools
o NAEPEX Software
o AM Software
Slide 4 of 40
NAEPEX Software
NAEPEX is a data extraction program for choosing variables, extracting data, and generating SPSS, SAS, or Stata syntax
It is part of the NAEP Data Toolkit
o Or it can be accessed directly from the NAEP restricted-use CD-ROM
NAEPEX also functions as NAEP’s Electronic Code Book (ECB) and can be used to
o Select variables you need for analysis
o Produce syntax/script to generate
NAEPEX Tutorial and User Guide

Considerations for Analysis of NAEP Data
Page 3 of 20
Slide 5 of 40
AM Software
Statistical software developed by the American Institutes for Research (AIR)
Designed for use with large-scale assessments
AM Software can be downloaded from AIR’s AM website
AM uses SPSS, SAS, or Stata syntax to perform statistical analyses with NAEP data files
Generates code that appropriately uses Plausible Values and takes into account complex sampling design in computation of sampling variance
Use AM when analyzing NCES data that contain plausible values
Slide 6 of 40
Data Selection Methods and Sources
1. Create SPSS, SAS, or Stata dataset using NAEPEX
o Extract variables of interest from flat file on NAEP CD by creating SPSS, SAS, or Stata syntax file
o Edit data (e.g., cleaning, recoding)
2. Import SPSS, SAS, or Stata dataset into AM Software
3. Analyze data with AM Software

Considerations for Analysis of NAEP Data
Page 4 of 20
Slide 7 of 40
NIES 2007 Example Questions
Is there a difference in 2007 reading achievement among public school 8th grade students based on the student gender and the amount of time the teacher spends on reading skills and strategies?
What is the proportion distribution for days absent from school by gender for public school 8th grade students in 2007?
Is there a relationship between 2007 reading achievement in the Midwest region among 8th grade public school students and absenteeism, and the number of books at home, while controlling for student’s gender and the percentage of American Indian students in the school?
Slide 8 of 40
Load Data into NAEPEX

Considerations for Analysis of NAEP Data
Page 5 of 20
Slide 9 of 40
Select Data Sources
For encrypted data source CD/DVD, first enter NCES-provided password to unzip CD/DVD to hard drive
Slide 10 of 40
Open Data Set
Select data source and click “Open”
o Example: 2007 National Indian Education Study (NIES) parts I and II, grades 4 and 8
Select data and click “Open Data File”
o Example: National Reading Assessment: Grade 8 Student, Teacher & School data

Considerations for Analysis of NAEP Data
Page 6 of 20
Slide 11 of 40
Define the Data File
Slide 12 of 40
Pre-selected Variables
RRPCM1-RRPCM5: Plausible NAEP reading values
ORIGWT: Student weight
JKUNIT: Jackknife variance unit
REPGRP1: Jackknife variance stratum
SRWT01-SRWT62: Replicate weights
CENSREG: Census region of the country
DSEX: Gender
FIPS: FIPS state code

Considerations for Analysis of NAEP Data
Page 7 of 20
Slide 13 of 40
Select Variables
Slide 14 of 40
Select Variables (Continued)
Variables for school type and percent American Indian selected (for example analysis)
DSEX and CENSREG pre-selected
Must select RPTSAMP (reporting sample flag)
Select all needed variables before creating SPSS or SAS syntax

Considerations for Analysis of NAEP Data
Page 8 of 20
Slide 15 of 40
Generate Syntax File
Slide 16 of 40
Open SPSS Syntax File

Considerations for Analysis of NAEP Data
Page 9 of 20
Slide 17 of 40
Open SPSS Syntax File (Continued)
Slide 18 of 40
Starting AM Software

Considerations for Analysis of NAEP Data
Page 10 of 20
Slide 19 of 40
Import SPSS File into AM Software
Slide 20 of 40
Save SPSS File in AM

Considerations for Analysis of NAEP Data
Page 11 of 20
Slide 21 of 40
Identify Design Role Variables
Slide 22 of 40
Identify Replicate Weights

Considerations for Analysis of NAEP Data
Page 12 of 20
Slide 23 of 40
Define Missing Values
Slide 24 of 40
Define Missing Values (Continued)

Considerations for Analysis of NAEP Data
Page 13 of 20
Slide 25 of 40
Collapse Categories
Slide 26 of 40
Dummy Code Variables
DSEX
1 DSEX0 (Male)
2 DSEX1 (Female)

Considerations for Analysis of NAEP Data
Page 14 of 20
Slide 27 of 40
Dummy Code Variables (Continued)
Slide 28 of 40
Create Dummy Variables

Considerations for Analysis of NAEP Data
Page 15 of 20
Slide 29 of 40
Set a Filter
Slide 30 of 40
Run a Crosstab
Is there a difference in 2007 reading achievement among public school 8th grade students based on the student gender and the amount of time the teacher spends on reading skills and strategies?

Considerations for Analysis of NAEP Data
Page 16 of 20
Slide 31 of 40
Crosstab Results
Slide 32 of 40
Conduct a T-Test
Considerations for Analysis of NAEP Data
Page 17 of 20
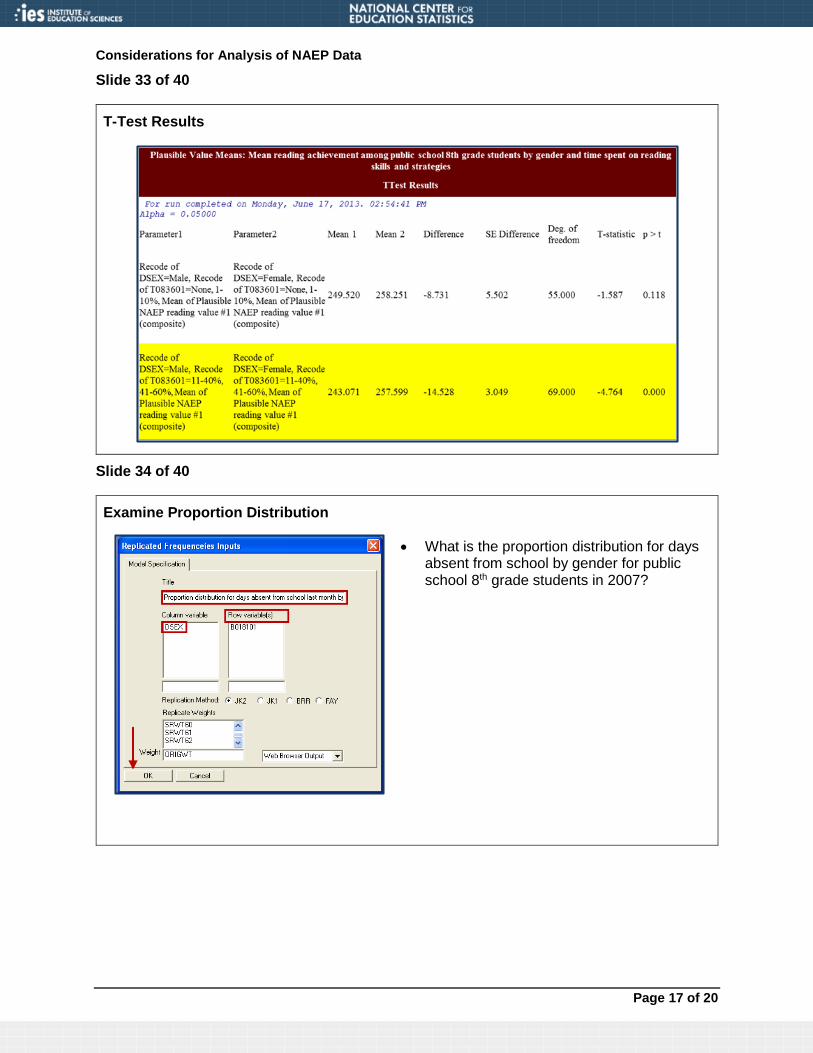
Slide 33 of 40
T-Test Results
Slide 34 of 40
Examine Proportion Distribution
What is the proportion distribution for days absent from school by gender for public school 8th grade students in 2007?

Considerations for Analysis of NAEP Data
Page 18 of 20
Slide 35 of 40
Frequencies Results
Slide 36 of 40
Regression Analysis
Is there a relationship between 2007 reading achievement in the Midwest region among 8th grade public school students and absenteeism, and the number of books at home, while controlling for student’s gender and the percentage of American Indian students in the school?

Considerations for Analysis of NAEP Data
Page 19 of 20
Slide 37 of 40
Regression Analysis (Continued)
Slide 38 of 40
Regression Result

Considerations for Analysis of NAEP Data
Page 20 of 20
Slide 39 of 40
AM Software Resource
AM Online Manual/Help System
Slide 40 of 40
Module Summary and Resources
Summary
This module has:
Described the use of NAEPEX Software
Described the use of AM Software
Described considerations for analyzing NAEP data
Resources
NAEP Data Toolkit
NAEPEX Tutorial and User Guide
AM Software Website
NIES 2007 Example Questions
AM Online Manual/Help System