Embed Size (px)
Citation preview
Considerations for the Global Chemicals Industry Amid the COVID-19 Outbreak
April 2020
Introduction
2
Dear Clients and Friends,
Firstly, we hope this finds you and your families safe and well. We recognize that these are uncertain and
unprecedented times for you and your families, friends, colleagues, businesses, and investments. All of us are facing
unique challenges and threats in this new environment—some of you, quite acutely.
In recent weeks, markets have been facing significant volatility due to COVID-19 that is expected to continue for the
foreseeable future. Substantial disruptions to business operations, supply chains, demand, international trade flows,
and travel, along with lockdowns and collapsing stock prices have occurred—all resulting from the COVID-19
outbreak—and all sectors of the global economy have been impacted, including the chemicals sector.
What was a relatively benign low-growth, low-interest-rate environment before the outbreak has morphed into what is
expected to be a large-scale, negative-growth shock. Governments are trying to counter the impact by unprecedented
financial support programs (e.g. currently, the amount earmarked for cheap business loans and guarantees by
governments in the U.S., Britain, France, Germany, and Italy is at least $4 trillion, or a fifth of their outstanding non-
financial corporate debt).
The near-term outlook for the global chemical industry is deeply concerning, and uncertainty is likely to persist until the
duration and overall impact of COVID-19 can be determined. There is a glimmer of hope, however, as we see the
Chinese market getting back to operations and order volumes are selectively increasing again—keeping in mind that
China represents 30% of global petrochemicals production and 37% of the global demand, and that a 1% decline in
China GDP growth translates into c. 2.5mt lost base chemicals demand.(1)
At this point, it is impossible for us to know how long the outbreak and lockdown or the lingering effects on businesses,
the economy, and the credit and M&A markets, will last. However, we are hopeful that recent actions will have the
positive effect of “flattening the curve” for new cases in the short term and minimize the impact of business operations.
We understand the anxiety created by these uncertain times, and as COVID-19 and the resulting economic
consequences continue to evolve, we are here to share our perspective based on our real-time conversations with
industry executives and business owners across the chemicals industry as well as our comprehensive views on the
M&A and capital markets.
Even in far less trying times, our firm specializes in helping clients navigate change and uncertainty. We will continue
to be a sounding board for our clients and other market participants as we collectively assess opportunities and
challenges in the current environment. We bring to bear a broad range of product and service solutions across the
capital structures, and we stand ready to discuss the impact and potential opportunities created by this crisis on the
industry and your business.
Martin Bastian
Managing Director
+49 (0) 69 256 246 171
Leland Harrs
Managing Director
212.497.7842
Steve Wang
Senior Vice President
212.497.7807
Houlihan Lokey Chemicals Team Contacts
(1) IHS Markit

Market Update (1/2)
1. Weakness in key end markets, such as automotive, construction, and oil and gas, will increase over the next 12
months, driving low-capacity utilizations.
o The PMI indexes as of February/March 2020 of major geographic markets, as well as key chemicals end
markets, have fallen in the range of 20% to 50% since the beginning of 2020.
o February data signaled widespread disruption across sectors stemming from the COVID-19 outbreak.
Eight sectors posted the fastest falls in output on record during the month, since the global sector data
were first compiled in October 2009. Automobiles and auto parts, construction, metals and mining, and
chemicals registered the strongest rates of decline.
o This is also reflected in the respective share price developments of companies in the major end markets
(auto minus 26%, construction minus 37%, metals and mining minus 31%, industrial goods minus 26%,
chemicals minus 27%).
2. Chemical product supply chains are globally facing pressure. High volatility in inventory levels will filter through
to downstream chemicals over the next two quarters and beyond. Crisis planning has included inventory build-
up for raw materials that could experience supply chain interruptions from COVID-19.
o Manufacturers are taking actions to protect employees and ensure there is business continuity, while
distributors are realigning logistics and redirecting shipments towards key supply shortages for critical
product chains.
o Many of the chemical plants are still running, and white-collar employees operate remotely.
o For downstream chemicals companies, the disruption to global supply chains—notably from mainland
China and India—is expected to be a further catalyst to the trend toward relocating of fine chemicals
production.
3. Given the precipitous drop in oil prices and unprecedented oil supply surplus over the last few weeks, the
chemicals sector—in particular, the commodity chemicals companies—is facing a “double-whammy” impact to
valuation in line with the oil price drop (minus 59% since mid-February).
4. In the short term, the oil-price collapse is expected to trigger a sharp and broad decline in the prices of
petrochemicals, accentuating the recent trend.
o In Asia, naphtha prices hit 18-year lows, while paraxylene (PX) values reached levels not seen since
2008. A similar development has taken place in Europe and the U.S., where chemicals such as
ethylene, propylene, and toluene stand at lows not seen since 2008 or earlier.
o However, not every market is dropping; some raw materials that are key to fighting the pandemic (e.g.
masks, filters, disinfectants, microbial, etc.) are seeing high demand and thus higher prices.
o For example, isopropanol (IPA), a key component in the production of hand sanitizers, is in such high
demand that IPA prices in Europe and the U.S. have increased in recent weeks—doubling in some
instances.
o Several manufacturers have taken initiatives, are diverting workforce and production capacity to these
areas, and support local communities.
5. Estimates for the oil-supply surplus in the first half of 2020 are currently difficult to forecast and range from 770
million to 1.3 billion barrels. Even at the low end, this surplus is more than double the previous record-high
surplus of 320 million barrels in the first half of 2015, during the 2014–2015 oil-price collapse (while the global
oil demand was still increasing, not falling).(1)
(1) IHS Markit3
Based on multiple touchpoints with sector companies, industry consultants, and financial market sources, the
following summarizes some industry perspectives and key developments affecting companies and investors:
1
2
3
4
5
Market Update (2/2)
6. Monthly global oil demand from February through May is expected to be as much as 4 million to 10 million
barrels per day (c. 4%–10% of total daily demand) fewer than year-earlier levels.
o These will be the largest declines in oil demand ever.
o Immediate and steep production cuts and international collaboration are selectively taken to somewhat
mitigate the impact.
o In addition, capex budgets getting revisited and create additional uncertainty over medium-term demand.
o Regardless of potential benefits to the competitiveness of oil-derived products such as plastics and
synthetic fibers, it is also expected to lead to a short-term drop in chemical demand as companies
throughout the chain destock in anticipation of lower prices to come.
7. Since mid-February, share prices are down 8%–45%, whereas the commodity and catalyst chemicals stocks as
well as the more leveraged companies have been hit the hardest, and the more defensive subsegments like industrial gases or ingredients fared relatively better (commodity minus 38%, catalysts minus 36%, coatings minus 30%, diversified/industrial chemicals minus 34% vs. ingredients minus 19%, and industrial gases minus 25%). The impact of the COVID-19 outbreak has not yet been fully reflected in EBITDA estimate changes, with the largest earnings revisions to diversified/industrial chemicals and commodity chemicals companies.
8. So far, selective companies have announced cuts or postponements to dividends and share buy-backs. Many
companies have significantly cut back capex spending. However, few have stated exactly how much cash flow
they expect to burn.
o Companies are scenario testing adequacy of cash buffers and maximizing liquidity by drawing on lines
of credit and evaluating all cash outflows, including capital expenditure programs, labor costs, and debt
payments.
o Further, lack of vendor financing, unhedged FX risks, and unwinding factoring facilities (among others)
need to be taken into consideration as well.
9. Due to current market volatility, many opportunistic refinancing transactions have been shelved as issuers and
underwriters opt to wait to understand how the financial performance will be impacted and for stable markets.
o The direct lending community continues to be a focus as the syndicated market has seen an effective
shutdown.
o A limited number of unitranche providers will opportunistically invest in new companies with potential for
higher return over the long term.
10. Most private equity firms are foremost focused on their existing portfolio companies, while also seeking
opportunities to deploy significant dry powder in their funds to meet liquidity and balance-sheet needs and seek
value and dislocation opportunities.
11. Most of the M&A processes have been put on hold, and new launches have been postponed until there is more
visibility on the financial impact of the crisis as well as overall business performance and valuation levels.
o As valuations fall and capital gets pricier, we do expect a healthy pipeline of chemicals M&A, particularly
non-core and/or underperforming businesses
o Some (well-capitalized) companies are also expected to pursue takeovers—encouraged by
governments—which put the survival of foundering companies (and jobs) ahead of antitrust concerns.
4
6
7
8
9
10
11
Long-Term Market Performance
Chemicals Share Price Performance
Source: S&P Capital IQ as of 03/27/2020
(1) Relative performance for calendar year 2001
(2) Relative performance for calendar year 2008–2009
(3) Relative performance since 02/17/2020
(4) Indexed as of 01/01/2000
Indexed share price
development(4)
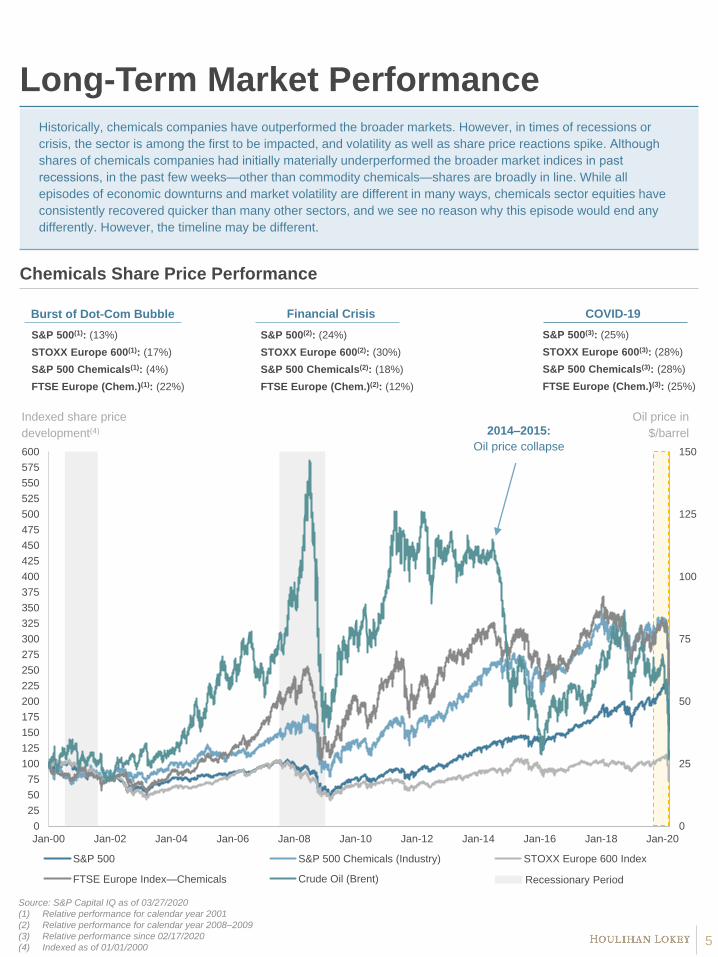
Historically, chemicals companies have outperformed the broader markets. However, in times of recessions or
crisis, the sector is among the first to be impacted, and volatility as well as share price reactions spike. Although
shares of chemicals companies had initially materially underperformed the broader market indices in past recessions, in the past few weeks—other than commodity chemicals—shares are broadly in line. While all
episodes of economic downturns and market volatility are different in many ways, chemicals sector equities have
consistently recovered quicker than many other sectors, and we see no reason why this episode would end any
differently. However, the timeline may be different.
Burst of Dot-Com Bubble Financial Crisis
2014–2015:
Oil price collapse
5
S&P 500(1): (13%)
STOXX Europe 600(1): (17%)
S&P 500 Chemicals(1): (4%)
FTSE Europe (Chem.)(1): (22%)
S&P 500(2): (24%)
STOXX Europe 600(2): (30%)
S&P 500 Chemicals(2): (18%)
FTSE Europe (Chem.)(2): (12%)
Oil price in
$/barrel
COVID-19
S&P 500(3): (25%)
STOXX Europe 600(3): (28%)
S&P 500 Chemicals(3): (28%)
FTSE Europe (Chem.)(3): (25%)
0
25
50
75
100
125
150
0
25
50
75
100
125
150
175
200
225
250
275
300
325
350
375
400
425
450
475
500
525
550
575
600
Jan-00 Jan-02 Jan-04 Jan-06 Jan-08 Jan-10 Jan-12 Jan-14 Jan-16 Jan-18 Jan-20
S&P 500 S&P 500 Chemicals (Industry) STOXX Europe 600 Index
FTSE Europe Index—Chemicals Crude Oil (Brent) Recessionary Period

Performance of Selected Chemicals End Markets
Automobiles
and Parts
Construction
Materials
Household
and
Personal-
Use
Products
Industrial
Goods
Pharma-
ceuticals
Metals and
Mining
Chemicals
Select Chemicals
End Markets PMI Output (Feb ‘20) Stock Mkt. Perf.(1)(vs. PMI Dec ’19)
Note: PMI = Purchasing manager index
Source: IHS Markit, Bloomberg
(1) Utilizes MSCI world index
(2) Current PMI Output data for U.S. and Europe (as of March) and China (as of February)
Since Jan-20
6
(17%)
(20%)
(18%)
(12%)
(14%)
2%
2%
(26%)
(31%)
(27%)
(26%)
(10%)
(37%)
(15%)
39
40
41
43
43
51
55
20 25 30 35 40 45 50 55 60
Regional PMI Output(2)
Weakness in key end markets, such as automotive, construction, and chemicals, will increase over the next 12
months, driving low capacity utilizations.
28 31 41

Chemicals Public Market Sentiments
Share Price Performance Over the Last Five Years(1)
LTM Share Price Performance(2)
Source: S&P Capital IQ as of 03/27/2020
(1) Portfolios indexed at 100 on 03/27/2015; (2) Dark color indicates European and bright color U.S. companies;
(3) Performance since Corteva spin off on 03/06/2019; (4) Performance since spin off on 04/02/2019
(19%)
+4%
+1%
(36%)
+40%
(56%)
Diversified/Industrial Chemicals
(55.5%)
(38.8%)
(36.7%)
(27.7%)
(39.6%)
(37.3%)
(33.2%)
(29.7%)
(25.6%)
(24.9%)
(24.5%)
(21.5%)
1.3% Koninklijke DSM
Kemira
Evonik Industries
Clariant
Celanese
Arkema
DuPont(3)
Synthomer
Eastman Chem.
BASF
Huntsman
Solvay
LANXESS
Median:
(29.7%)
0
50
100
150
200
250
Mar-15 Sep-15 Mar-16 Sep-16 Mar-17 Sep-17 Mar-18 Sep-18 Mar-19 Sep-19 Mar-20
Diversified/Industrial Chemicals CommoditiesIndustrial Gases/Catalysts Coatings/Construction ChemicalsIngredients Oil Price
20
40
60
80
100
120
17-Feb-20 28-Feb-20 10-Mar-20 21-Mar-20
2 3
(32%)
(30%)
(29%)
(36%)
(19%)
(59%)
Commodities
(57.9%)
(50.4%)
(49.2%)
(42.7%)
(44.5%)
(41.2%)LyondellBasell
Westlake Chem.
Covestro
Dow(4)
Olin
Trinseo
Median:
(46.9%)
Coatings/Construction Chemicals
(44.9%)
(44.4%)
(29.8%)
(24.7%)
3.3%
6.7%
(26.7%)
(1.4%)
Sherwin-Williams
RPM Intern.
Sika
PPG Industries
Akzo Nobel
GCP
H.B. Fuller
Axalta Coating
Median:
(25.7%)
Ingredients
(38.1%)
(35.4%)
(14.4%)
(27.0%)
(19.2%)
(1.2%)
(0.5%)
8.5%
12.6%
23.6% Lonza
GivaudanSiegfriedNovozymesSymrise
IFF
Croda Intern.Chr. HansenAshland GlobalSensient Techn.
Median:
(7.8%)
7
Over the last few weeks, a significant sell-off in chemicals shares occurred across all subsectors exacerbated by
the precipitous drop in oil price. Only a handful of companies’ shares are still in positive territory on a LTM basis.
2 3-Mar-20: Federal Reserve lowers interest rates by 0.5%1 17-Nov-19: First-known case of COVID-19 in China
18-Mar-20: ECB purchases bonds worth €750 billion to calm down sovereign debt
markets43 9-Mar-20: Italy imposes a national quarantine
4
1
27-Mar-20: Germany puts together a rescue package worth €156 billion5 26-Mar-20: U.S. Senate passes $2 trillion rescue package 6
6
5
(20%)(20%)
(19%)
(18%)(15%)
(10%)(8%)
(37%)(25%)
(19%)
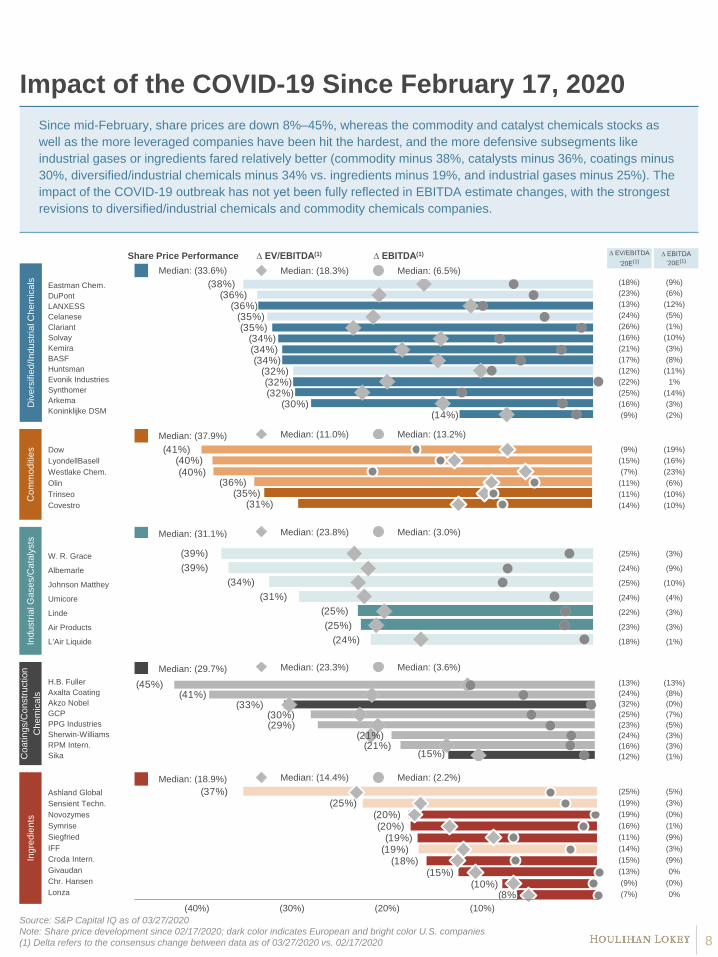
Impact of the COVID-19 Since February 17, 2020
Since mid-February, share prices are down 8%–45%, whereas the commodity and catalyst chemicals stocks as
well as the more leveraged companies have been hit the hardest, and the more defensive subsegments like
industrial gases or ingredients fared relatively better (commodity minus 38%, catalysts minus 36%, coatings minus
30%, diversified/industrial chemicals minus 34% vs. ingredients minus 19%, and industrial gases minus 25%). The
impact of the COVID-19 outbreak has not yet been fully reflected in EBITDA estimate changes, with the strongest
revisions to diversified/industrial chemicals and commodity chemicals companies.
Source: S&P Capital IQ as of 03/27/2020
Note: Share price development since 02/17/2020; dark color indicates European and bright color U.S. companies
(1) Delta refers to the consensus change between data as of 03/27/2020 vs. 02/17/2020 8
Ind
ustr
ial G
ase
s/C
ata
lysts
Ing
red
ien
tsC
oa
tin
gs/C
onstr
uction
Ch
em
ica
ls
Median: (37.9%)
Median: (29.7%)
Median: (11.0%) Median: (13.2%)
Median: (23.3%) Median: (3.6%)
Median: (18.9%) Median: (14.4%) Median: (2.2%)
Median: (31.1%) Median: (23.8%) Median: (3.0%)
Median: (33.6%) Median: (18.3%) Median: (6.5%)
(18%) (9%)
(23%) (6%)
(13%) (12%)
(24%) (5%)
(26%) (1%)
(16%) (10%)
(21%) (3%)
(17%) (8%)
(12%) (11%)
(22%) 1%
(25%) (14%)
(16%) (3%)
(9%) (2%)
(9%) (19%)
(15%) (16%)
(7%) (23%)
(11%) (6%)
(11%) (10%)
(14%) (10%)
(25%) (3%)
(24%) (9%)
(25%) (10%)
(24%) (4%)
(22%) (3%)
(23%) (3%)
(18%) (1%)
∆ EBITDA
‘20E(1)
∆ EV/EBITDA
‘20E(1)
(10%)(20%)(30%)(40%)
Share Price Performance ∆ EBITDA(1)∆ EV/EBITDA(1)
Co
mm
od
itie
sD
ive
rsifie
d/I
nd
ustr
ial C
he
mic
als
(35%)(31%)
(41%)(40%)
(40%)(36%)
(25%)
(25%)
(39%)
(39%)
(34%)
(31%)
(24%)
(33%)
(15%)
(45%)(41%)
(30%)(29%)
(21%)(21%)
Eastman Chem.
DuPont
LANXESS
Celanese
Clariant
Solvay
Kemira
BASF
Huntsman
Evonik Industries
Synthomer
Arkema
Koninklijke DSM
Dow
LyondellBasell
Westlake Chem.
Olin
Trinseo
Covestro
W. R. Grace
Albemarle
Johnson Matthey
Umicore
Linde
Air Products
L'Air Liquide
H.B. Fuller
Axalta Coating
Akzo Nobel
GCP
PPG Industries
Sherwin-Williams
RPM Intern.
Sika
Ashland Global
Sensient Techn.
Novozymes
Symrise
Siegfried
IFF
Croda Intern.
Givaudan
Chr. Hansen
Lonza
(25%) (5%)
(19%) (3%)
(19%) (0%)
(16%) (1%)
(11%) (9%)
(14%) (3%)
(15%) (9%)
(13%) 0%
(9%) (0%)
(7%) 0%
(13%) (13%)
(24%) (8%)
(32%) (0%)
(25%) (7%)
(23%) (5%)
(24%) (3%)
(16%) (3%)
(12%) (1%)
(36%)
(35%)(34%)(34%)(34%)
(32%)(32%)
(30%)(14%)
(38%)(36%)
(35%)
(32%)
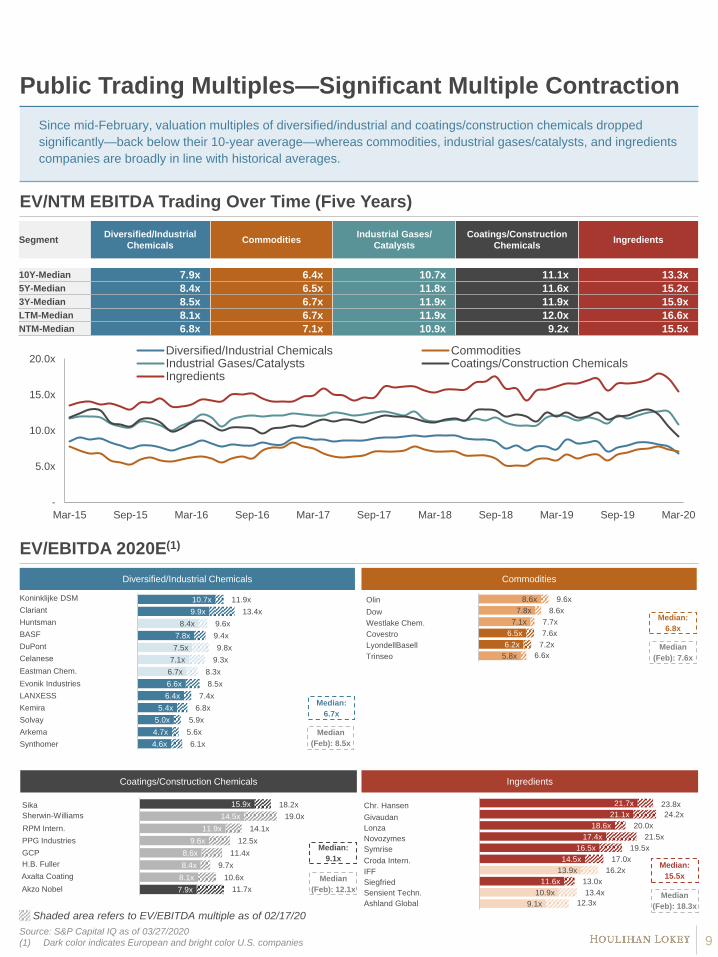
Public Trading Multiples—Significant Multiple Contraction
EV/NTM EBITDA Trading Over Time (Five Years)
Shaded area refers to EV/EBITDA multiple as of 02/17/20
Source: S&P Capital IQ as of 03/27/2020
(1) Dark color indicates European and bright color U.S. companies
Ingredients
Diversified/Industrial Chemicals
6.7x
7.1x
7.5x
8.4x
4.6x
4.7x
5.0x
5.4x
6.4x
6.6x
7.8x
9.9x
10.7x
6.1x
5.6x
5.9x
6.8x
7.4x
8.5x
9.4x
13.4x
11.9x
8.3x
9.3x
9.8x
9.6x
Median
(Feb): 8.5x
Median:
6.7x
Koninklijke DSM
Clariant
BASF
DuPont
Celanese
Eastman Chem.
Synthomer
Arkema
Solvay
Kemira
LANXESS
Evonik Industries
Huntsman
Commodities
5.8x
7.1x
7.8x
8.6x
6.2x
6.5x
7.2x
7.6x
6.6x
7.7x
8.6x
9.6x Olin
Dow
Westlake Chem.
Covestro
LyondellBasell
Trinseo
Median
(Feb): 7.6x
Median:
6.8x
Coatings/Construction Chemicals
8.1x
8.4x
8.6x
9.6x
11.9x
14.5x
7.9x
15.9x
11.7x
18.2x
10.6x
9.7x
11.4x
12.5x
14.1x
19.0x
Sika
Sherwin-Williams
RPM Intern.
PPG Industries
GCP
H.B. Fuller
Axalta Coating Median
(Feb): 12.1xAkzo Nobel
Median:
9.1x
9.1x
10.9x
13.9x
11.6x
14.5x
16.5x
17.4x
18.6x
21.1x
21.7x
13.0x
17.0x
19.5x
21.5x
20.0x
24.2x
23.8x
12.3x
13.4x
16.2x
Chr. Hansen
Givaudan
Lonza
Novozymes
Symrise
Croda Intern.
IFF
Siegfried
Sensient Techn.
Ashland GlobalMedian
(Feb): 18.3x
Median:
15.5x
EV/EBITDA 2020E(1)
-
5.0x
10.0x
15.0x
20.0x
Mar-15 Sep-15 Mar-16 Sep-16 Mar-17 Sep-17 Mar-18 Sep-18 Mar-19 Sep-19 Mar-20
Diversified/Industrial Chemicals CommoditiesIndustrial Gases/Catalysts Coatings/Construction ChemicalsIngredients
9
Since mid-February, valuation multiples of diversified/industrial and coatings/construction chemicals dropped
significantly—back below their 10-year average—whereas commodities, industrial gases/catalysts, and ingredients
companies are broadly in line with historical averages.
SegmentDiversified/Industrial
ChemicalsCommodities
Industrial Gases/
Catalysts
Coatings/Construction
ChemicalsIngredients
10Y-Median 7.9x 6.4x 10.7x 11.1x 13.3x
5Y-Median 8.4x 6.5x 11.8x 11.6x 15.2x
3Y-Median 8.5x 6.7x 11.9x 11.9x 15.9x
LTM-Median 8.1x 6.7x 11.9x 12.0x 16.6x
NTM-Median 6.8x 7.1x 10.9x 9.2x 15.5x
50
100
150
200
250
Mar-15 Sep-15 Mar-16 Sep-16 Mar-17 Sep-17 Mar-18 Sep-18 Mar-19 Sep-19 Mar-20
Diversified/Industrial Chemicals Commodities
Industrial Gases/Catalysts Coatings/Construction Chemicals
Ingredients
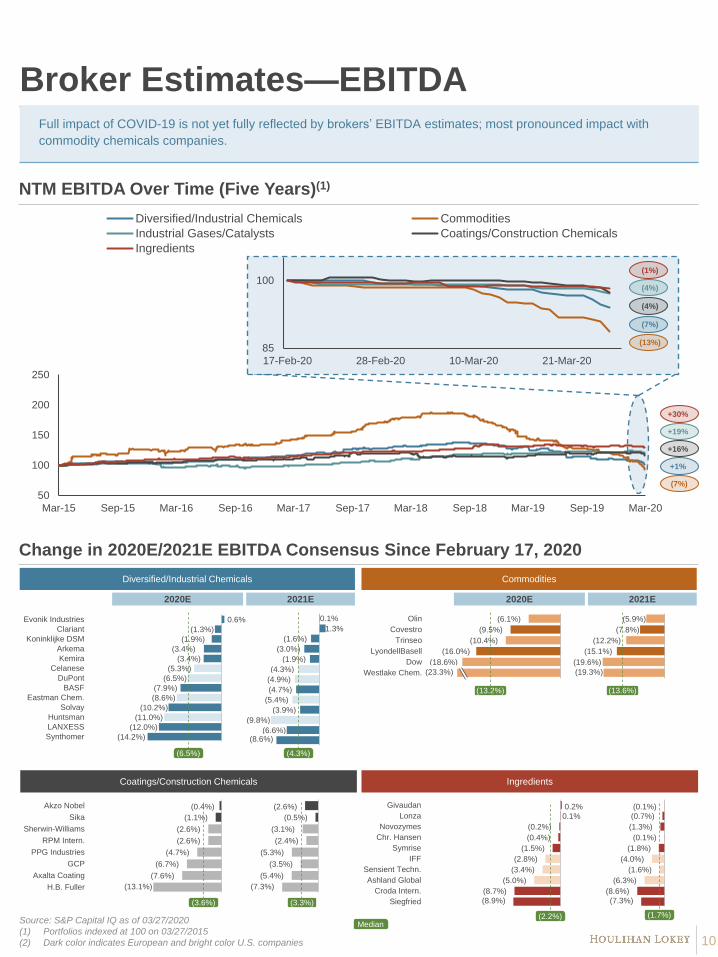
Broker Estimates—EBITDAFull impact of COVID-19 is not yet fully reflected by brokers’ EBITDA estimates; most pronounced impact with
commodity chemicals companies.
NTM EBITDA Over Time (Five Years)(1)
2020E 2021E
Median
0.6%
(1.3%)
(1.9%)
(3.4%)
(3.4%)
(5.3%)
(6.5%)
(7.9%)
(8.6%)
(10.2%)
(11.0%)
(12.0%)
(14.2%)
Evonik Industries
Clariant
Koninklijke DSM
Arkema
Kemira
Celanese
DuPont
BASF
Eastman Chem.
Solvay
Huntsman
LANXESS
Synthomer (8.6%)
0.1%
1.3%
(1.6%)
(3.0%)
(1.9%)
(4.3%)
(4.9%)
(4.7%)
(5.4%)
(3.9%)
(9.8%)
(6.6%)
(6.5%) (4.3%)
(0.1%)
(0.7%)
(1.3%)
(0.1%)
(1.8%)
(4.0%)
(1.6%)
(6.3%)
(8.6%)
(7.3%)
0.2%
0.1%
(0.2%)
(0.4%)
(1.5%)
(2.8%)
(3.4%)
(5.0%)
(8.7%)
(8.9%)
Givaudan
Lonza
Novozymes
Chr. Hansen
Symrise
IFF
Sensient Techn.
Ashland Global
Croda Intern.
Siegfried
(2.2%) (1.7%)Source: S&P Capital IQ as of 03/27/2020
(1) Portfolios indexed at 100 on 03/27/2015
(2) Dark color indicates European and bright color U.S. companies
(16.0%)
(18.6%)
(23.3%)
(6.1%)
(9.5%)
(10.4%)
Olin
Covestro
Trinseo
LyondellBasell
Dow
Westlake Chem.
(13.2%)
(19.6%)
(19.3%)
(5.9%)
(7.8%)
(12.2%)
(15.1%)
(13.6%)
(2.6%)
(0.5%)
(3.1%)
(2.4%)
(5.3%)
(3.5%)
(5.4%)
(7.3%)(13.1%)
(0.4%)
(1.1%)
(2.6%)
(2.6%)
(4.7%)
(6.7%)
(7.6%)
Akzo Nobel
Sika
Sherwin-Williams
RPM Intern.
PPG Industries
GCP
Axalta Coating
H.B. Fuller
(3.6%) (3.3%)
85
100
17-Feb-20 28-Feb-20 10-Mar-20 21-Mar-20
+30%
Change in 2020E/2021E EBITDA Consensus Since February 17, 2020
10
+1%
+19%
+16%
(7%)
Ingredients
Diversified/Industrial Chemicals Commodities
Coatings/Construction Chemicals
2020E 2021E
(7%)
(4%)
(4%)
(13%)
(1%)
50
100
150
200
250
300
Mar-15 Sep-15 Mar-16 Sep-16 Mar-17 Sep-17 Mar-18 Sep-18 Mar-19 Sep-19 Mar-20
Diversified/Industrial Chemicals CommoditiesIndustrial Gases/Catalysts Coatings/Construction ChemicalsIngredients
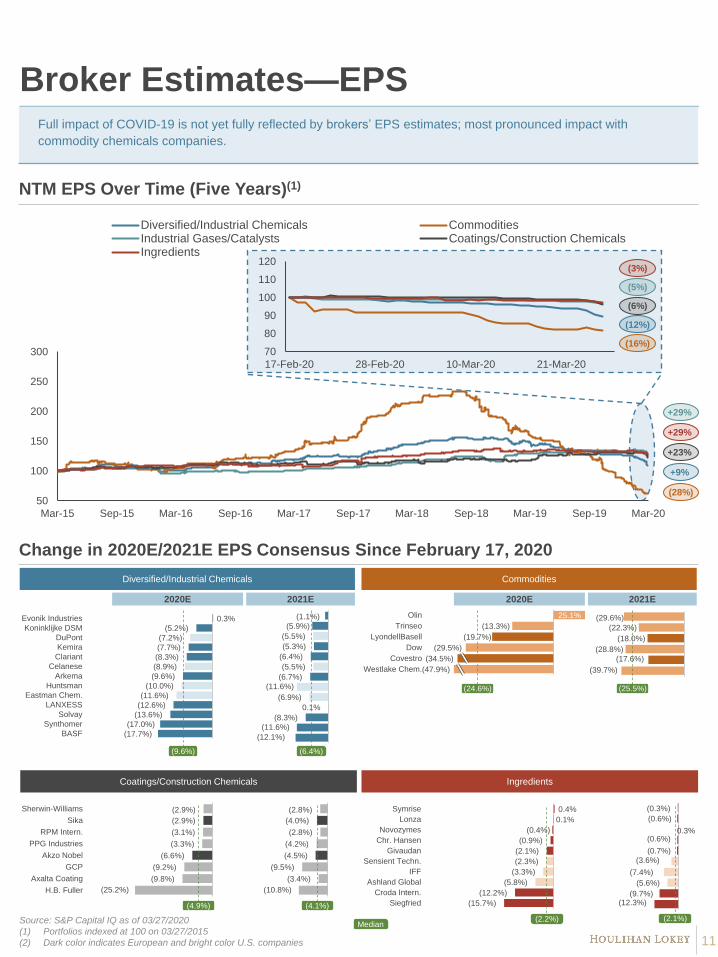
Broker Estimates—EPSFull impact of COVID-19 is not yet fully reflected by brokers’ EPS estimates; most pronounced impact with
commodity chemicals companies.
NTM EPS Over Time (Five Years)(1)
Source: S&P Capital IQ as of 03/27/2020
(1) Portfolios indexed at 100 on 03/27/2015
(2) Dark color indicates European and bright color U.S. companies
Change in 2020E/2021E EPS Consensus Since February 17, 2020
+9%
+29%
+23%
(28%)
+29%
70
80
90
100
110
120
17-Feb-20 28-Feb-20 10-Mar-20 21-Mar-20
(12%)
(5%)
(6%)
(16%)
(3%)
25.1%
(47.9%)
(13.3%)
(19.7%)
(29.5%)
(34.5%)
Olin
Trinseo
LyondellBasell
Dow
Covestro
Westlake Chem.
(24.6%)
(29.6%)
(28.8%)
(39.7%)
(22.3%)
(18.0%)
(17.6%)
(25.5%)
0.3%
(5.2%)
(7.2%)
(7.7%)
(8.3%)
(8.9%)
(9.6%)
(10.0%)
(11.6%)
(12.6%)
(13.6%)
(17.0%)
(17.7%)
Evonik Industries
Koninklijke DSM
DuPont
Kemira
Clariant
Celanese
Arkema
Huntsman
Eastman Chem.
LANXESS
Solvay
Synthomer
BASF
(9.6%) (6.4%)
(1.1%)
(5.9%)
(5.5%)
(5.3%)
(6.4%)
(5.5%)
(6.7%)
(11.6%)
(6.9%)
0.1%
(8.3%)
(11.6%)
(12.1%)
(2.8%)
(4.0%)
(2.8%)
(4.2%)
(4.5%)
(9.5%)
(3.4%)
(10.8%)(25.2%)
(2.9%)
(2.9%)
(3.1%)
(3.3%)
(6.6%)
(9.2%)
(9.8%)
Sherwin-Williams
Sika
RPM Intern.
PPG Industries
Akzo Nobel
GCP
Axalta Coating
H.B. Fuller
(4.9%) (4.1%)
0.4%
0.1%
(0.4%)
(0.9%)
(2.1%)
(2.3%)
(3.3%)
(5.8%)
(12.2%)
(15.7%)
Symrise
Lonza
Novozymes
Chr. Hansen
Givaudan
Sensient Techn.
IFF
Ashland Global
Croda Intern.
Siegfried
(2.2%)
(0.3%)
(0.6%)
0.3%(0.6%)
(0.7%)
(3.6%)
(7.4%)
(5.6%)
(9.7%)(12.3%)
(2.1%)
11
Median
2020E 2021E
Ingredients
Diversified/Industrial Chemicals Commodities
Coatings/Construction Chemicals
2020E 2021E
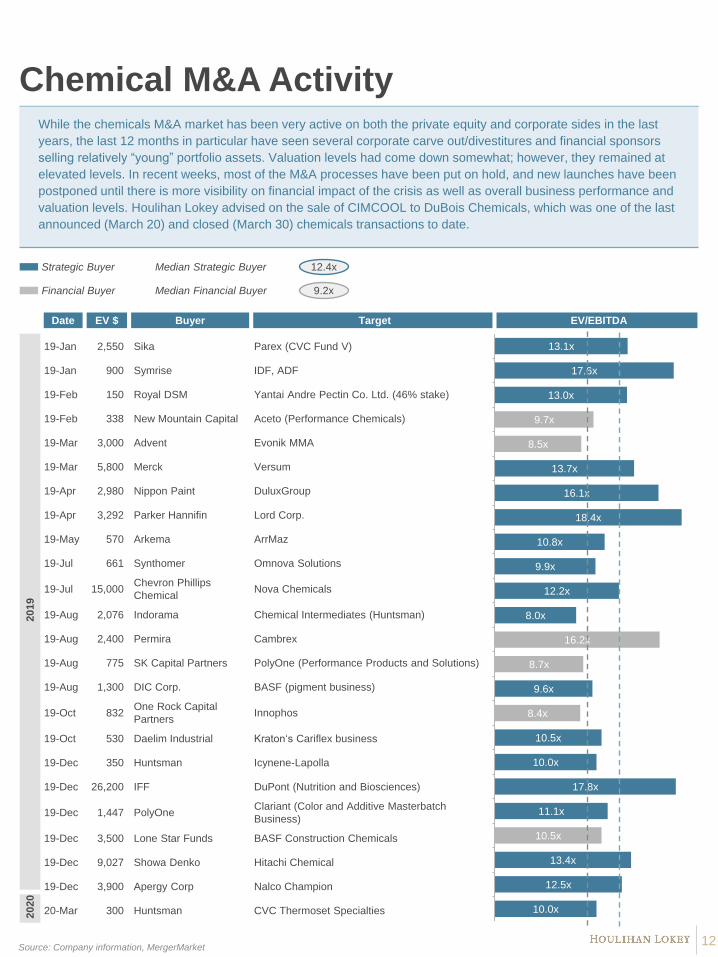
Chemical M&A Activity
19-Jan 2,550 Sika Parex (CVC Fund V)
19-Jan 900 Symrise IDF, ADF
19-Feb 150 Royal DSM Yantai Andre Pectin Co. Ltd. (46% stake)
19-Feb 338 New Mountain Capital Aceto (Performance Chemicals)
19-Mar 3,000 Advent Evonik MMA
19-Mar 5,800 Merck Versum
19-Apr 2,980 Nippon Paint DuluxGroup
19-Apr 3,292 Parker Hannifin Lord Corp.
19-May 570 Arkema ArrMaz
19-Jul 661 Synthomer Omnova Solutions
19-Jul 15,000Chevron Phillips
ChemicalNova Chemicals
19-Aug 2,076 Indorama Chemical Intermediates (Huntsman)
19-Aug 2,400 Permira Cambrex
19-Aug 775 SK Capital Partners PolyOne (Performance Products and Solutions)
19-Aug 1,300 DIC Corp. BASF (pigment business)
19-Oct 832One Rock Capital
PartnersInnophos
19-Oct 530 Daelim Industrial Kraton‘s Cariflex business
19-Dec 350 Huntsman Icynene-Lapolla
19-Dec 26,200 IFF DuPont (Nutrition and Biosciences)
19-Dec 1,447 PolyOneClariant (Color and Additive Masterbatch
Business)
19-Dec 3,500 Lone Star Funds BASF Construction Chemicals
19-Dec 9,027 Showa Denko Hitachi Chemical
19-Dec 3,900 Apergy Corp Nalco Champion
20-Mar 300 Huntsman CVC Thermoset Specialties
13.1x
17.6x
13.0x
9.7x
8.5x
13.7x
16.1x
18.4x
10.8x
9.9x
12.2x
8.0x
16.2x
8.7x
9.6x
8.4x
10.5x
10.0x
17.8x
11.1x
10.5x
13.4x
12.5x
10.0x
20
19
20
20
Source: Company information, MergerMarket12
While the chemicals M&A market has been very active on both the private equity and corporate sides in the last
years, the last 12 months in particular have seen several corporate carve out/divestitures and financial sponsors
selling relatively “young” portfolio assets. Valuation levels had come down somewhat; however, they remained at
elevated levels. In recent weeks, most of the M&A processes have been put on hold, and new launches have been
postponed until there is more visibility on financial impact of the crisis as well as overall business performance and
valuation levels. Houlihan Lokey advised on the sale of CIMCOOL to DuBois Chemicals, which was one of the last
announced (March 20) and closed (March 30) chemicals transactions to date.
Strategic Buyer
Financial Buyer
Median Strategic Buyer
Median Financial Buyer 9.2x
12.4x
BuyerEV $Date Target EV/EBITDA

Case Study: CIMCOOLCimcool is a leading global formulator and manufacturer of high-performance specialty metalworking fluids,
including removal, forming, protective, and cleaning fluids
Business and Transaction Highlights
On March 20, 2020, Hillenbrand, Inc. (NYSE:HI; “Hillenbrand” or the “company”)
announced the signing of an agreement to sell Cimcool to DuBois Chemicals, Inc.
(DuBois), a portfolio company of Altas Partners. The transaction closed on March 30
DuBois acquired Cimcool at a purchase price of approximately $224 million in cash.
In addition, DuBois has agreed to pay up to $26 million in contingent purchase price,
upon the future sale of the combined DuBois and Cimcool businesses
Cimcool is a leading global manufacturer of high-performance specialty
metalworking fluids, including removal, forming, protective, and cleaning fluids
Serves a global and wide range of customers across diverse end markets
Four manufacturing facilities in the U.S., the Netherlands, China, and South Korea
Transaction expands DuBois’ facility footprint into Europe and Asia
Keys to Process and Valuation Success
Conducted a highly competitive and global sales process with a focus on U.S. and European strategics and
sponsors
Customized and tight process timeline to drive competitive tension throughout the process
Significant upfront preparation of diligence deliverables, including a QoE report and a robust data room allowed
for immediate due diligence on an accelerated timeline
Maintained significant deal momentum to drive both valuation and speed to signing, even after the outbreak of
COVID-19
Limited incremental stand-alone costs simplified carve-out complexities
Nov 2019
Closing of Milacron/
Hillenbrand transaction;
announcement of review of
strategic options for Cimcool
Nov 2019 Mar 2020Jan 2020 Feb 2020
Feb 2020
IOI submission
deadline
Mar 2020
Rapid COVID-
19 outbreak in
Western
Hemisphere
Jan 2020
Market
outreach
Mar 2020
Closing
Dec 2019
Mar 2020
Signed definitive
agreement
Dec 2019
Thorough
process
preparation
13
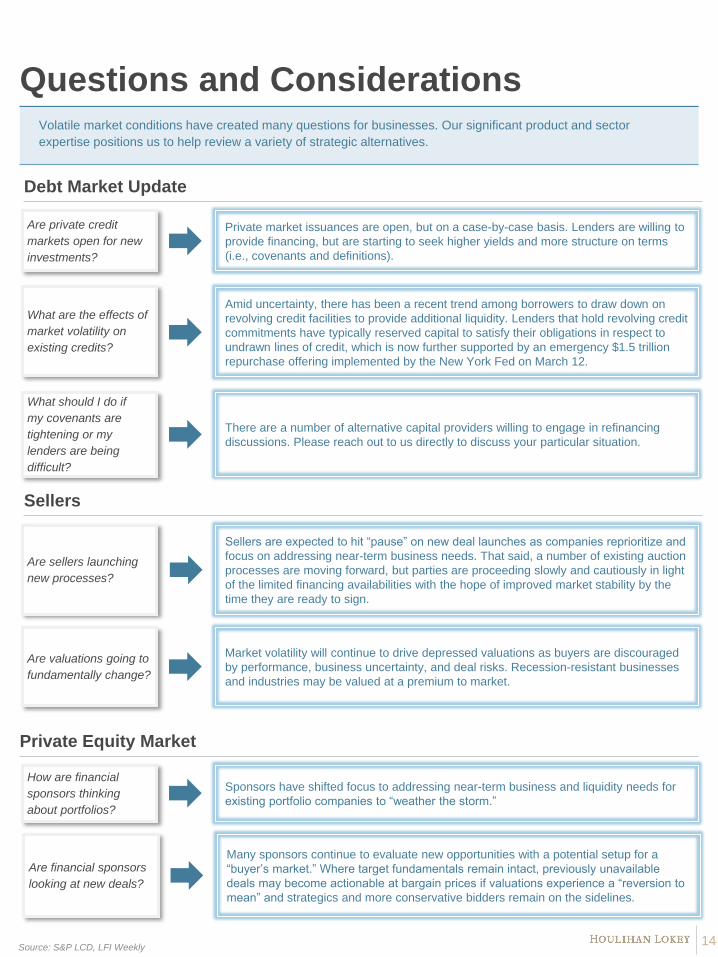
Questions and Considerations
Are private credit
markets open for new
investments?
Private market issuances are open, but on a case-by-case basis. Lenders are willing to
provide financing, but are starting to seek higher yields and more structure on terms
(i.e., covenants and definitions).
What are the effects of
market volatility on
existing credits?
Amid uncertainty, there has been a recent trend among borrowers to draw down on
revolving credit facilities to provide additional liquidity. Lenders that hold revolving credit
commitments have typically reserved capital to satisfy their obligations in respect to
undrawn lines of credit, which is now further supported by an emergency $1.5 trillion
repurchase offering implemented by the New York Fed on March 12.
Are sellers launching
new processes?
Sellers are expected to hit “pause” on new deal launches as companies reprioritize and
focus on addressing near-term business needs. That said, a number of existing auction
processes are moving forward, but parties are proceeding slowly and cautiously in light
of the limited financing availabilities with the hope of improved market stability by the
time they are ready to sign.
Are valuations going to
fundamentally change?
Market volatility will continue to drive depressed valuations as buyers are discouraged
by performance, business uncertainty, and deal risks. Recession-resistant businesses
and industries may be valued at a premium to market.
Volatile market conditions have created many questions for businesses. Our significant product and sector
expertise positions us to help review a variety of strategic alternatives.
How are financial
sponsors thinking
about portfolios?
Sponsors have shifted focus to addressing near-term business and liquidity needs for
existing portfolio companies to “weather the storm.”
Source: S&P LCD, LFI Weekly14
Debt Market Update
Sellers
Private Equity Market
Are financial sponsors
looking at new deals?
Many sponsors continue to evaluate new opportunities with a potential setup for a
“buyer’s market.” Where target fundamentals remain intact, previously unavailable
deals may become actionable at bargain prices if valuations experience a “reversion to
mean” and strategics and more conservative bidders remain on the sidelines.
What should I do if
my covenants are
tightening or my
lenders are being
difficult?
There are a number of alternative capital providers willing to engage in refinancing
discussions. Please reach out to us directly to discuss your particular situation.
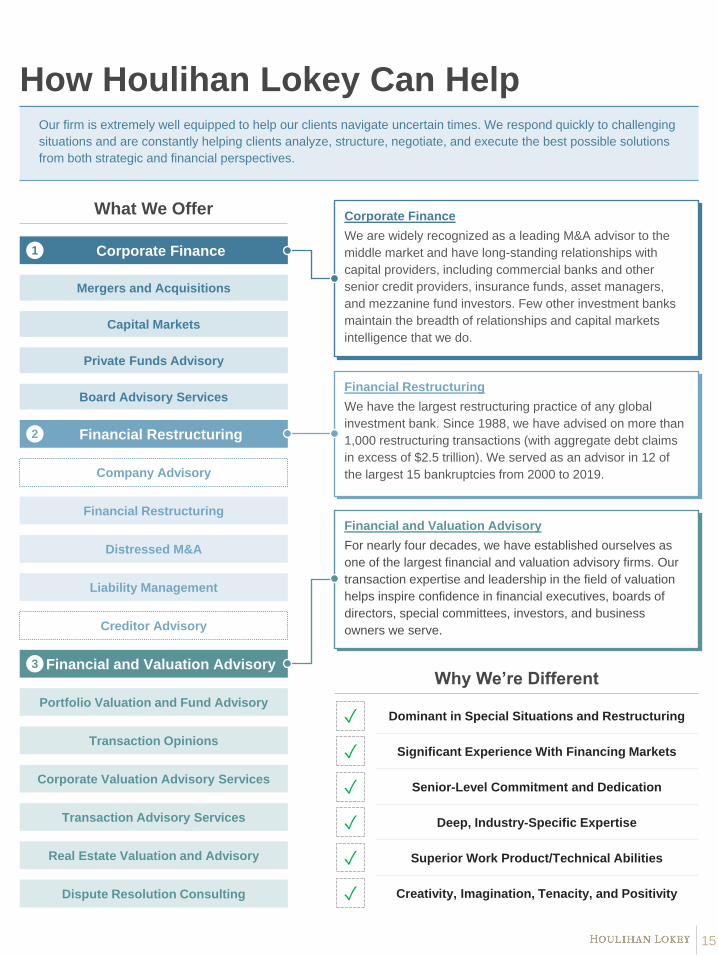
Our firm is extremely well equipped to help our clients navigate uncertain times. We respond quickly to challenging
situations and are constantly helping clients analyze, structure, negotiate, and execute the best possible solutions
from both strategic and financial perspectives.
How Houlihan Lokey Can Help
What We Offer
Superior Work Product/Technical Abilities
Creativity, Imagination, Tenacity, and Positivity
Deep, Industry-Specific Expertise
Senior-Level Commitment and Dedication
Portfolio Valuation and Fund Advisory
Significant Experience With Financing Markets
Dominant in Special Situations and Restructuring
Corporate Finance
Financial Restructuring
Financial and Valuation Advisory
Transaction Opinions
Corporate Valuation Advisory Services
Transaction Advisory Services
Real Estate Valuation and Advisory
Dispute Resolution Consulting
Mergers and Acquisitions
Capital Markets
Private Funds Advisory
Board Advisory Services
Corporate Finance
We are widely recognized as a leading M&A advisor to the
middle market and have long-standing relationships with
capital providers, including commercial banks and other
senior credit providers, insurance funds, asset managers,
and mezzanine fund investors. Few other investment banks
maintain the breadth of relationships and capital markets
intelligence that we do.
Company Advisory
Creditor Advisory
Financial Restructuring
We have the largest restructuring practice of any global
investment bank. Since 1988, we have advised on more than
1,000 restructuring transactions (with aggregate debt claims
in excess of $2.5 trillion). We served as an advisor in 12 of
the largest 15 bankruptcies from 2000 to 2019.
Financial Restructuring
Distressed M&A
Liability Management
Financial and Valuation Advisory
For nearly four decades, we have established ourselves as
one of the largest financial and valuation advisory firms. Our
transaction expertise and leadership in the field of valuation
helps inspire confidence in financial executives, boards of
directors, special committees, investors, and business
owners we serve.
Why We’re Different
1
2
3
✓
✓
✓
✓
✓
✓
15

2.0%
4.0%
6.0%
8.0%
10.0%
12.0%
70
80
90
100
110
Jan-20 Feb-20 Mar-20
Average European Leveraged Loan Flow-Name Bid
Average European High-Yield Bond Flow-Name Bid
Average European High-Yield Bond Yield
Leveraged Finance Market Impact From COVID-19
Leveraged Loans and High-Yield Issuance Volume
European Leveraged Loans and
High-Yield: Average Bid and Yield(1)
U.S. Leveraged Loans and High-
Yield: Average Bid and Yield
Primary Deals Getting Pulled Because of
Adverse Market Conditions
Date Issuer UoP Sponsor Sector CFR
Tranche
Size
Proposed
Pricing
Mar-20Micro
FocusRefinancing - Services
B1/
BB-
$500M
€500M
L+375-400/
99.0
E+325-350/
99.5
Feb-20Messer
IndustriesRepricing CVC Industrials
BB-/
B1
€540M
$2,200M
E+225/
99.875-100
L+225/ 99.875
Feb-20Alix
PartnersRepricing
CPPIB &
CDPQConsulting
B+/
B2€348M
E+275-300/
Par
Feb-20 Minimax Repricing KIRKBIFire Safety
Equipment
B+/
B1
€506M
$590M
E+250/Par
L+225/Par
Volatility Index (U.S. and Europe)
Note: Market data retrieved as of 03/27/2020
Source: Bloomberg, S&P Capital IQ, LCD
(1) Yield data for European leveraged loans not available on a weekly basis
65.5
61.0
0
20
40
60
80
100
Jan-20 Feb-20 Mar-20
U.S. (CBOE Volatility S&P 500 Index) EU (EURO STOXX 50 Volatility Index)
27-Mar-20
European Market (€B) U.S. Market ($B)
0.0
2.0
4.0
6.0
8.0
10.0
12.0
14.0
16.0
18.0
20.0
Leverage Loan Issuance Volume
High-Yield Bond Issuance Volume
0.0
10.0
20.0
30.0
40.0
50.0
60.0
70.0
80.0
90.0
Leverage Loan Issuance Volume
High-Yield Bond Issuance Volume
2.0%
4.0%
6.0%
8.0%
10.0%
70
80
90
100
110
Jan-20 Feb-20 Mar-20
Average U.S. Leveraged Loan Flow-Name Bid Average U.S. High-Yield Bond Flow-Name Bid Average U.S. High-Yield Bond Yield
Average U.S. Leveraged Loan New-Issue Yield
16

Disclaimer
© 2020 Houlihan Lokey. All rights reserved. This material may not be reproduced in any format by any means
or redistributed without the prior written consent of Houlihan Lokey.
Houlihan Lokey gathers its data from sources it considers reliable; however, it does not guarantee the
accuracy or completeness of the information provided within this presentation. The material presented
reflects information known to the authors at the time this presentation was written, and this information is
subject to change. Houlihan Lokey makes no representations or warranties, expressed or implied, regarding
the accuracy of this material. The views expressed in this material accurately reflect the personal views of the
authors regarding the subject securities and issuers and do not necessarily coincide with those of Houlihan
Lokey. Officers, directors, and partners in the Houlihan Lokey group of companies may have positions in the
securities of the companies discussed. This presentation does not constitute advice or a recommendation,
offer, or solicitation with respect to the securities of any company discussed herein, is not intended to provide
information upon which to base an investment decision, and should not be construed as such. Houlihan
Lokey or its affiliates may from time to time provide investment banking or related services to these
companies. Like all Houlihan Lokey employees, the authors of this presentation receive compensation that is
affected by overall firm profitability.
Houlihan Lokey is a trade name for Houlihan Lokey, Inc., and its subsidiaries and affiliates, which include
those in (i) the United States: Houlihan Lokey Capital, Inc., an SEC-registered broker-dealer and member of
FINRA (www.finra.org) and SIPC (www.sipc.org) (investment banking services); Houlihan Lokey Financial
Advisors, Inc. (financial advisory services); HL Finance, LLC (syndicated leveraged finance platform); and
Houlihan Lokey Real Estate Group, Inc. (real estate advisory services); (ii) Europe: Houlihan Lokey EMEA,
LLP, and Houlihan Lokey (Corporate Finance) Limited, authorized and regulated by the U.K. Financial
Conduct Authority; Houlihan Lokey S.p.A.; Houlihan Lokey GmbH; Houlihan Lokey (Netherlands) B.V.;
Houlihan Lokey (España), S.A.; and Houlihan Lokey (Corporate Finance), S.A.; (iii) the United Arab Emirates,
Dubai International Financial Centre (Dubai): Houlihan Lokey (MEA Financial Advisory) Limited, regulated by
the Dubai Financial Services Authority for the provision of advising on financial products, arranging deals in
investments, and arranging credit and advising on credit to professional clients only; (iv) Singapore: Houlihan
Lokey (Singapore) Private Limited, an “exempt corporate finance adviser” able to provide exempt corporate
finance advisory services to accredited investors only; (v) Hong Kong SAR: Houlihan Lokey (China) Limited,
licensed in Hong Kong by the Securities and Futures Commission to conduct Type 1, 4, and 6 regulated
activities to professional investors only; (vi) China: Houlihan Lokey Howard & Zukin Investment Consulting
(Beijing) Co., Limited (financial advisory services); (vii) Japan: Houlihan Lokey K.K. (financial advisory
services); and (viii) Australia: Houlihan Lokey (Australia) Pty Limited (ABN 74 601 825 227), a company
incorporated in Australia and licensed by the Australian Securities and Investments Commission (AFSL
number 474953) in respect of financial services provided to wholesale clients only. In the European Economic
Area (EEA), Dubai, Singapore, Hong Kong, and Australia, this communication is directed to intended
recipients, including actual or potential professional clients (EEA and Dubai), accredited investors
(Singapore), professional investors (Hong Kong), and wholesale clients (Australia), respectively. Other
persons, such as retail clients, are NOT the intended recipients of our communications or services and should
not act upon this communication.
17

CORPORATE FINANCE
FINANCIAL RESTRUCTURING
FINANCIAL AND VALUATION ADVISORY
HL.com