Embed Size (px)
Citation preview
Considering consent: an analysis of
factors influencing parental perceptions of
decisional quality in the context of
newborn screening
Stuart G. Nicholls, BSc (Hons), MSc,
MRes
Submitted for the degree of Doctor of Philosophy
at Lancaster University,
September 2010.
Abstract
This thesis explores decision-making and perceptions of decisional quality in par-
ents whose children have undergone newborn bloodspot screening. Newborn blood-
spot screening is the programme through which newborn babies are screened for
a variety of conditions shortly after birth.
In the UK babies are screened for phenylketonuria (PKU), congenital hypothy-
roidism (CH), sickle cell diseases (SCD), cystic fibrosis (CF) and medium chain
acyl-CoA dehydrogenase deficiency (MCADD), with Duchenne muscular dystro-
phy (DMD) offered as additional screen in Wales. Much has been written about the
applicability of consent to newborn bloodspot screening, yet research has tended
to revolve around parental knowledge and information provision. These studies
say little in terms of actual or perceived decisional quality or whether parents
are making an informed choice. Taking an exploratory sequential mixed meth-
ods approach, the present study aims to identify and model factors that influence
parental perceptions of decisional quality within the context of newborn bloodspot
screening.
The thesis draws on two studies; an exploratory study of parental experiences of
newborn bloodspot screening using semi-structured interviews, and a subsequent
quantitative phase which analysed data collected through a postal questionnaire.
The results of these studies provide significant insights into parental decision-
making. Attitudes toward medicine were shown to have a significant causal influ-
II

Stuart Nicholls
ence on perceived decisional quality through its indirect effect on parental attitudes
towards screening. Through the disaggregation of these general and specific at-
titudes, the significant role of perceived choice is identified. Perceived choice is
demonstrated not only to be a significant contributing factor to the perceived
quality of decision made, but is also shown to have a strong influence on attitudes
towards screening through an indirect and positive relationship with perceived
knowledge of screening. Both of these elements suggest that the context of screen-
ing and its presentation are key determinants of parental decisional quality.
III

Acknowledgements
Thank you to my wife Rebecca for her assistance, understanding and for hav-
ing the patience of a saint. Thanks must also go to my supervisors Dr. Mairi
Levitt and Professor Paul Fearnhead for their invaluable support and guidance as
well as their willingness to consider multiple drafts of the same piece of writing. I
would also like to thank Dr. Kevin Southern, Consultant in Paediatric Respiratory
Medicine at Royal Liverpool Children’s Hospital NHS Trust for his interest and
enthusiasm for the project and for his assistance with the recruitment of parents
throughout this project. Thanks must also be extended the administrative staff
and those working within the screening laboratory for their kind assistance in mat-
ters of recruitment and to Joyce Nicholls for proofreading early drafts of this work.
This study was funded by an Economic and Social Research Council (ESRC)
Postgraduate Studentship (award number PTA-031-2006-00013).
IV

Declaration
I confirm that this thesis is the sole work of Stuart Nicholls.
Stuart G. Nicholls
Paul Fearnhead
Mairi Levitt
V

Contents
1 Contexts and concepts 1
1.1 Newborn bloodspot screening . . . . . . . . . . . . . . . . . . . . . 1
1.1.1 Screening in the UK after Guthrie . . . . . . . . . . . . . . . 2
1.1.2 UK Policy and Practice . . . . . . . . . . . . . . . . . . . . 3
1.2 Consent and decision-making . . . . . . . . . . . . . . . . . . . . . 4
1.3 Informed choice for screening in England . . . . . . . . . . . . . . . 6
1.4 Motivation . . . . . . . . . . . . . . . . . . . . . . . . . . . . . . . . 8
1.5 Aims . . . . . . . . . . . . . . . . . . . . . . . . . . . . . . . . . . . 8
1.6 Objectives/Research questions . . . . . . . . . . . . . . . . . . . . . 9
2 Decision-making and newborn bloodspot screening 10
2.1 Informing and influencing decision-making . . . . . . . . . . . . . . 11
2.1.1 Content of disclosure . . . . . . . . . . . . . . . . . . . . . . 13
2.1.2 Satisfaction with information provision . . . . . . . . . . . . 14
2.2 Knowledge, understanding and decision-making for NBS . . . . . . 15
2.2.1 Reliance on recall . . . . . . . . . . . . . . . . . . . . . . . . 16
2.2.2 Sample issues . . . . . . . . . . . . . . . . . . . . . . . . . . 17
2.2.3 Parent or professional perspectives? . . . . . . . . . . . . . . 18
2.3 Decision-making . . . . . . . . . . . . . . . . . . . . . . . . . . . . . 19
2.3.1 Uptake and perception of choice . . . . . . . . . . . . . . . . 19
2.3.2 What is known about decision-making? . . . . . . . . . . . . 22
2.4 Limitations of existing research . . . . . . . . . . . . . . . . . . . . 25
VI

CONTENTS Stuart Nicholls
3 Devising the structural model: Methods 30
3.1 Methodological overview . . . . . . . . . . . . . . . . . . . . . . . . 30
3.2 Why interviews? . . . . . . . . . . . . . . . . . . . . . . . . . . . . 32
3.2.1 Single vs. joint interviewing . . . . . . . . . . . . . . . . . . 33
3.3 Sampling . . . . . . . . . . . . . . . . . . . . . . . . . . . . . . . . . 34
3.3.1 Sample size . . . . . . . . . . . . . . . . . . . . . . . . . . . 34
3.3.2 Populations . . . . . . . . . . . . . . . . . . . . . . . . . . . 34
3.3.3 Sampling procedure . . . . . . . . . . . . . . . . . . . . . . . 34
3.3.4 Identification and recruitment . . . . . . . . . . . . . . . . . 36
3.4 Data collection . . . . . . . . . . . . . . . . . . . . . . . . . . . . . 38
3.5 Data analysis . . . . . . . . . . . . . . . . . . . . . . . . . . . . . . 39
3.5.1 Overview . . . . . . . . . . . . . . . . . . . . . . . . . . . . 39
3.5.2 Coding . . . . . . . . . . . . . . . . . . . . . . . . . . . . . . 40
3.5.3 Data reduction . . . . . . . . . . . . . . . . . . . . . . . . . 41
3.5.4 Reliability and validity . . . . . . . . . . . . . . . . . . . . . 42
4 Devising the structural model: Results 44
4.1 Parent participation . . . . . . . . . . . . . . . . . . . . . . . . . . 44
4.2 Information-seeking behaviour . . . . . . . . . . . . . . . . . . . . . 45
4.2.1 From whom and where do parents find out about the heel
prick? . . . . . . . . . . . . . . . . . . . . . . . . . . . . . . 47
4.3 Experience . . . . . . . . . . . . . . . . . . . . . . . . . . . . . . . . 48
4.3.1 Experience and information-seeking . . . . . . . . . . . . . . 48
4.3.2 Experience as a method of validation . . . . . . . . . . . . . 50
4.3.3 Assumed knowledge with experience . . . . . . . . . . . . . 51
4.3.4 Experience and decision-making . . . . . . . . . . . . . . . . 52
4.4 Attitudes towards medicine . . . . . . . . . . . . . . . . . . . . . . 53
4.5 Perceived knowledge and understanding . . . . . . . . . . . . . . . 57
4.6 Attitudes towards screening . . . . . . . . . . . . . . . . . . . . . . 59
4.6.1 Risks . . . . . . . . . . . . . . . . . . . . . . . . . . . . . . . 59
VII
CONTENTS Stuart Nicholls
4.6.2 Benefits . . . . . . . . . . . . . . . . . . . . . . . . . . . . . 61
4.7 Choice . . . . . . . . . . . . . . . . . . . . . . . . . . . . . . . . . . 62
4.7.1 Routinisation . . . . . . . . . . . . . . . . . . . . . . . . . . 63
4.7.2 Dualistic representations: importance and insignificance . . . 64
4.7.3 Perceived choice . . . . . . . . . . . . . . . . . . . . . . . . . 65
4.7.4 Constrained choice, competence and coherence . . . . . . . . 65
4.8 Decision-making and decisional quality . . . . . . . . . . . . . . . . 67
4.9 Summary . . . . . . . . . . . . . . . . . . . . . . . . . . . . . . . . 70
4.9.1 Model 1 . . . . . . . . . . . . . . . . . . . . . . . . . . . . . 70
4.9.2 Model 2 . . . . . . . . . . . . . . . . . . . . . . . . . . . . . 73
4.9.3 Model 3 . . . . . . . . . . . . . . . . . . . . . . . . . . . . . 75
5 Defining the measurement model: Methods 77
5.1 Introduction . . . . . . . . . . . . . . . . . . . . . . . . . . . . . . . 77
5.2 Why a questionnaire? . . . . . . . . . . . . . . . . . . . . . . . . . . 78
5.3 Questionnaire development . . . . . . . . . . . . . . . . . . . . . . . 78
5.3.1 The latent variable . . . . . . . . . . . . . . . . . . . . . . . 79
5.3.2 Development of indicators . . . . . . . . . . . . . . . . . . . 79
5.4 Sampling . . . . . . . . . . . . . . . . . . . . . . . . . . . . . . . . . 82
5.4.1 Populations . . . . . . . . . . . . . . . . . . . . . . . . . . . 82
5.4.2 Sampling frame . . . . . . . . . . . . . . . . . . . . . . . . . 82
5.4.3 Sample size . . . . . . . . . . . . . . . . . . . . . . . . . . . 83
5.4.4 Sampling procedure . . . . . . . . . . . . . . . . . . . . . . . 84
5.4.5 Identification and recruitment . . . . . . . . . . . . . . . . . 84
5.4.6 Dealing with non-response . . . . . . . . . . . . . . . . . . . 84
5.5 Data preparation . . . . . . . . . . . . . . . . . . . . . . . . . . . . 86
5.5.1 Missing data . . . . . . . . . . . . . . . . . . . . . . . . . . . 86
5.5.2 Scale reliability . . . . . . . . . . . . . . . . . . . . . . . . . 87
5.5.3 Outliers . . . . . . . . . . . . . . . . . . . . . . . . . . . . . 88
VIII

CONTENTS Stuart Nicholls
6 Defining the measurement model: Results 90
6.1 Parent participation . . . . . . . . . . . . . . . . . . . . . . . . . . 90
6.2 Descriptive statistics . . . . . . . . . . . . . . . . . . . . . . . . . . 90
6.3 Data preparation . . . . . . . . . . . . . . . . . . . . . . . . . . . . 93
6.3.1 Missing data . . . . . . . . . . . . . . . . . . . . . . . . . . . 93
6.3.2 Outliers . . . . . . . . . . . . . . . . . . . . . . . . . . . . . 96
6.3.3 Scale reliability . . . . . . . . . . . . . . . . . . . . . . . . . 96
7 Structural Equation Modelling: Methods 100
7.1 Introduction . . . . . . . . . . . . . . . . . . . . . . . . . . . . . . . 100
7.2 Structural equation modelling: an overview . . . . . . . . . . . . . . 100
7.2.1 Modification . . . . . . . . . . . . . . . . . . . . . . . . . . . 103
7.2.2 Limits of SEM . . . . . . . . . . . . . . . . . . . . . . . . . 104
7.3 Model specification . . . . . . . . . . . . . . . . . . . . . . . . . . . 105
7.3.1 Model 1 . . . . . . . . . . . . . . . . . . . . . . . . . . . . . 105
7.3.2 Model 2 . . . . . . . . . . . . . . . . . . . . . . . . . . . . . 108
7.3.3 Model 3 . . . . . . . . . . . . . . . . . . . . . . . . . . . . . 110
7.4 Inference . . . . . . . . . . . . . . . . . . . . . . . . . . . . . . . . . 110
7.4.1 Path analysis . . . . . . . . . . . . . . . . . . . . . . . . . . 110
7.5 The structural model . . . . . . . . . . . . . . . . . . . . . . . . . . 115
7.6 The measurement model . . . . . . . . . . . . . . . . . . . . . . . . 116
7.6.1 Identification . . . . . . . . . . . . . . . . . . . . . . . . . . 118
7.6.2 Estimation procedure . . . . . . . . . . . . . . . . . . . . . . 121
7.6.3 Data assumptions for parameter estimation . . . . . . . . . 122
7.7 Assessing model fit . . . . . . . . . . . . . . . . . . . . . . . . . . . 124
8 Structural equation modelling: Results 128
8.1 Normality . . . . . . . . . . . . . . . . . . . . . . . . . . . . . . . . 128
8.2 Descriptives . . . . . . . . . . . . . . . . . . . . . . . . . . . . . . . 129
8.2.1 Correlation matrix . . . . . . . . . . . . . . . . . . . . . . . 132
IX

CONTENTS Stuart Nicholls
8.3 Model development . . . . . . . . . . . . . . . . . . . . . . . . . . . 135
8.3.1 Model 1: Confirmatory Factor Analysis . . . . . . . . . . . . 136
8.3.2 Model 2: Confirmatory Factor Analysis . . . . . . . . . . . . 137
8.3.3 Model 2: Structural Equation Model . . . . . . . . . . . . . 137
8.3.4 Model 3: Confirmatory Factor Analysis . . . . . . . . . . . . 145
8.3.5 Model 3: Structural Equation Model . . . . . . . . . . . . . 148
8.3.6 Summary . . . . . . . . . . . . . . . . . . . . . . . . . . . . 152
9 Decision-making and newborn bloodspot screening 156
9.1 Choice and decision quality . . . . . . . . . . . . . . . . . . . . . . 158
9.1.1 Perceptions of choice . . . . . . . . . . . . . . . . . . . . . . 159
9.2 Choice and knowledge of screening . . . . . . . . . . . . . . . . . . 162
9.2.1 Parental knowledge . . . . . . . . . . . . . . . . . . . . . . . 163
9.2.2 Knowledge saliency . . . . . . . . . . . . . . . . . . . . . . . 164
9.2.3 Knowledge through experience . . . . . . . . . . . . . . . . . 166
9.2.4 Seeking information, gaining knowledge? . . . . . . . . . . . 167
9.3 Attitudes towards screening . . . . . . . . . . . . . . . . . . . . . . 171
9.3.1 Established trust: parental relationships with the midwife . 173
9.3.2 Institutional confidence . . . . . . . . . . . . . . . . . . . . . 174
9.3.3 Knowledge, attitudes and parental decisions . . . . . . . . . 174
9.4 Parental decision-making and informed consent to newborn blood-
spot screening . . . . . . . . . . . . . . . . . . . . . . . . . . . . . . 175
A Invitation letter (interviews) 178
B Patient information sheet (interviews) 181
C Reminder letter (interviews) 185
D R code for sample size calculation 188
E Invitation letter (questionnaire) 191
X

CONTENTS Stuart Nicholls
F Patient information sheet (questionnaire) 193
G Reminder letter (questionnaire) 197
H Questionnaire & coding scheme 199
XI

List of Figures
1.1 Newborn bloodspot screening schematic . . . . . . . . . . . . . . . 5
4.1 Proposed causal structure - model 1 . . . . . . . . . . . . . . . . . . 71
4.2 Proposed causal structure - model 2 . . . . . . . . . . . . . . . . . . 74
4.3 Proposed causal structure - model 3 . . . . . . . . . . . . . . . . . . 76
6.1 Missing data patterns . . . . . . . . . . . . . . . . . . . . . . . . . . 94
7.1 Schematic of a structural equation model containing latent and ob-
served variables . . . . . . . . . . . . . . . . . . . . . . . . . . . . . 102
7.2 Path diagram of model 1 . . . . . . . . . . . . . . . . . . . . . . . . 106
7.3 Path diagram of model 2 . . . . . . . . . . . . . . . . . . . . . . . . 108
7.4 Path diagram of model 3 . . . . . . . . . . . . . . . . . . . . . . . . 111
7.5 A simple path diagram . . . . . . . . . . . . . . . . . . . . . . . . . 112
8.1 Boxplot of indicator variable scores . . . . . . . . . . . . . . . . . . 131
8.2 Confirmatory factor analysis for model 2 . . . . . . . . . . . . . . . 138
8.3 Path diagram of model 2 . . . . . . . . . . . . . . . . . . . . . . . . 139
8.4 Path diagram of final iteration of model 2 . . . . . . . . . . . . . . 141
8.5 Confirmatory factor analysis for model 3 . . . . . . . . . . . . . . . 146
8.6 Path diagram of model 3 . . . . . . . . . . . . . . . . . . . . . . . . 147
8.7 Path diagram of final iteration of model 3 . . . . . . . . . . . . . . 149
XII

List of Tables
3.1 Data profile items comparing recruitment areas . . . . . . . . . . . 35
5.1 Summary statistics for model 1 . . . . . . . . . . . . . . . . . . . . 84
6.1 Demographic characteristics of the sample . . . . . . . . . . . . . . 92
6.2 Cases displaying > 5% missing data . . . . . . . . . . . . . . . . . . 95
6.3 Cronbach alpha scores for the finalised scales . . . . . . . . . . . . . 98
7.1 List of fit indices . . . . . . . . . . . . . . . . . . . . . . . . . . . . 126
8.1 Measures of skew and kurtosis for the indicator variables together
with associated statistics of normality . . . . . . . . . . . . . . . . . 129
8.2 Bivariate correlations of the observed indicator variables . . . . . . 133
8.3 List of variances, residual variances and R-squared for model 2 . . . 140
8.4 List of variances, residual variances and R-squared for model 3 . . . 150
XIII
Chapter 1
Contexts and concepts
In 2003, and following the euphoria generated by the human genome project, the
UK Department of Health White Paper Our Inheritance Our Future was published.
This paper detailed numerous projects to support the development of research
into medical genetics. The paper also documented support for the expansion
of newborn bloodspot screening. This was soon followed by reports from the
British Medical Association (BMA), Human Genetics Commission and the Nuffield
Council on Bioethics, all of which supported the notion that newborn screening was
an area of increasing interest. Since the publication of the Department of Health
White Paper screening has been expanded within the UK and internationally.
Recent reports have also suggested that private companies are now considering
the possibility of using newborn bloodspots to analyse whole genomes, with one
company predicting that this will be feasible by 2019 (Henderson, 2009). So what
is newborn bloodspot screening, and why the interest?
1.1 Newborn bloodspot screening
Newborn bloodspot screening (herein newborn screening) is the programme through
which newborn babies are screened for a variety of conditions shortly after birth.
Screening differs from a programme of targeted testing on the basis that there is
no known risk of disease within the defined population (UK National Screening
1
1. Contexts and concepts Stuart Nicholls
Committee, 2000).
The advent of newborn screening is credited to Dr. Asbjørn Følling who discov-
ered and defined Phenylketonuria (PKU), the first condition for which screening
was conducted (Paul, 1997; Centerwall and Centerwall, 2000). PKU is an auto-
somal recessive disorder resulting in phenylalanine hydroxylase deficiency that in
turn leads to an increased amount of phenylalanine in the blood. If left untreated
this carries a high risk of mental handicap (Anon, 1999). Early testing in the
UK used ferric chloride to test urine from babies and soon became known as the
“nappy test” (Sharrard and Pollitt, 2007). In 1959, the health visiting service in
Birmingham undertook a limited programme to test the urine of all babies. This
revealed four positive tests in 19,000 babies. Following on from this, health visi-
tors in Birmingham continued to test all babies in this way (Raffle and Gray, 2007).
Urine testing was inefficient and improvements were sought. In 1961 Dr. Robert
Guthrie published his results of the agar diffusion microbial assay, a test that
improved both the speed and efficacy of screening through the use of blood as
opposed to urine. However, the UK continued to use urine testing until 1965 when,
in the South East of Scotland, ferric chloride testing of urine was replaced by the
taking of blood via the heel prick and the application of the Guthrie test (Douglas
et al., 1968). At the same time the Medical Research Council set up a Working
Party to consider the issue of newborn screening and in 1969 the Department
of Health and Social Security issued a circular endorsing the use of the Guthrie
test for a national programme of newborn screening for phenylketonuria (Simpson
et al., 1997).
1.1.1 Screening in the UK after Guthrie
Despite the 1969 Department of Health and Social Security circular, newborn
screening for conditions other than PKU continued in a piecemeal fashion. In
2

1. Contexts and concepts Stuart Nicholls
1981 the Department of Health and Social Security added congenital hypothy-
roidism (CH) to PKU as part of the national screening programme. At this time
it also recommended that a national committee be established to co-ordinate the
regional screening programmes for CH (Joint Standing Sub-Committee on Screen-
ing in Medical Care, 1981).
There was still a lack of co-ordination, with regional health authorities imple-
menting their own programmes in an ad hoc manner. In 1996 the Department
of Health established the National Screening Committee (NSC) to oversee all na-
tional screening programmes, including the newborn bloodspot programme (The
Nuffield Council of Bioethics, 2006). Its remit would be to advise on whether
programmes should be initiated, continued or withdrawn.
In 2001 it was announced that national screening for cystic fibrosis would begin, 25
years after it was first introduced in Leeds, with screening for sickle cell anaemia
to begin in 2004. Alongside this, in 2002, the Department of Health funded a
UK Newborn Screening Programme Centre (Holland et al., 2006). Today the UK
National Screening Committee recommends that all babies are offered screening
for phenylketonuria (PKU), congenital hypothyroidism (CH), sickle cell diseases
(SCD), cystic fibrosis (CF) and medium chain acyl-CoA dehydrogenase deficiency
(MCADD) (UK Newborn Screening Programme Centre, 2008b, p2).
1.1.2 UK Policy and Practice
As part of the national screening programme every resident newborn baby and
those under the age of one who enter the UK, should be offered blood spot screen-
ing (UK Newborn Screening Programme Centre, 2008b). This achieves almost
universal uptake (Bradley et al., 1993; Simpson et al., 1997; Parsons et al., 2002;
Pollitt, 2004). The process through which this occurs for newborn screening is
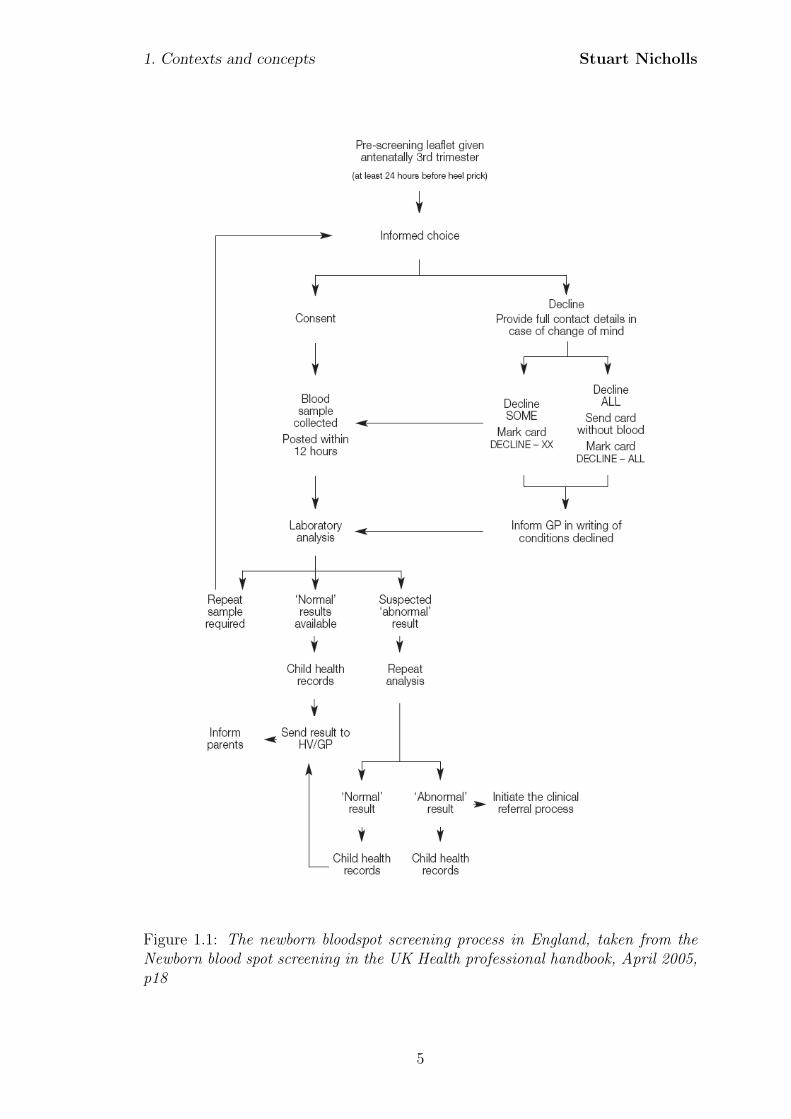
shown in Figure 1.1.
3
1. Contexts and concepts Stuart Nicholls
From the schematic one can see that in all cases a record should be maintained
regarding the parents’ decision and that this can be one of three options; to consent
to all, some, or none of the screening tests. As can be seen, informed choice is
an integral stage (UK National Screening Committee, 2000; Campbell and Ross,
2004; Kenner and Moran, 2005). This is spelt out clearly in the National Screening
Programmes own literature which states that:
“It is important to offer parents an informed choice about screening for
their baby, to gain consent and to prepare them for the blood sampling
procedure.” (UK Newborn Screening Programme Centre, 2008a, p2).
Consequently, screening can only proceed on the authorisation of the parents and
this authorisation should be made on the basis of an informed choice.
1.2 Consent and decision-making
In the newborn screening context the term informed choice appears to be used
somewhat liberally and may be equally referred to as “informed decisions” or
“informed consent”. Although definitions do vary (Gillon, 2001; Beauchamp and
Childress, 2001; del Carmen and Joffe, 2005; Dawson and Spencer, 2005; van den
Berg et al., 2006; Elwyn et al., 2009), the core aspects are often very much the
same. Firstly there are the requirements that the individual giving the consent
must be competent to do so; secondly, the consent shall be given voluntarily;
thirdly, the giving of consent must be based on relevant information, and finally a
decision is made. Consequently the process of decision-making and what informs
this process is central to any concept of informed consent.
4
1. Contexts and concepts Stuart Nicholls
Figure 1.1: The newborn bloodspot screening process in England, taken from theNewborn blood spot screening in the UK Health professional handbook, April 2005,p18
5
1. Contexts and concepts Stuart Nicholls
1.3 Informed choice for screening in England
Whilst newborn screening has been in operation for a substantial period of time
and has a high uptake rate, little is known about the decision-making process of
parents when accepting newborn bloodspot screening. Research has tended to re-
volve around parental knowledge (Smith et al., 1990; Tluczek et al., 1992; Zeuner
et al., 1999; Tluczek et al., 2005; Lang et al., 2009) and information provision
(Hargreaves et al., 2005b; Fox, 2006). However, these findings say little in terms
of parental decision-making or whether parents are making an informed choice.
Assessment of knowledge based on recall at best serves only to give evidence of
the individuals’ memory (Beauchamp and Childress, 2001); indeed the converse
may be true. The ability to recall information, says nothing as to whether that
information was used in the decision-making process and therefore whether the
decision was informed (Bekker et al., 1999). Research into leaflet content has
found that many “did not facilitate realistic expectations or support the informed
choice agenda” (Hargreaves et al., 2005b, p116). Yet this again says nothing as
to whether the leaflets are used by parents when making decisions. The dearth
of research means that there is a lack of empirical data about how parents make
decisions regarding whether or not to consent to newborn bloodspot screening.
The implication of this being that:
“There is a general lack of both procedures, and research to inform the
development of such procedures, for:
• providing parents with information about the newborn bloodspot
screening
• inviting informed consent for newborn bloodspot screening
• routinely informing parents of the results (positive or negative)
• explaining to parents the need for further tests
6
1. Contexts and concepts Stuart Nicholls
• addressing the potential for misunderstanding by parents of the
test results; and
• understanding and addressing the particular difficulties raised by
revealing carrier status.” (Stewart and Oliver, 2003, p2)
Confirming this, a systematic review of the psychosocial implications of screening
found that whilst newborn screening for phenylketonuria is an international test
that has been established for over forty years:
“...we found no studies which looked at parents’ responses to the pro-
cess or results of PKU screening and only a very small number looking
at knowledge and attitudes to Guthrie testing in general” (Green et al.,
2004, p57).
As such we know little as to how parents feel about the decisions they made,
whether they feel they have made an informed choice, or what factors affect these
assessments.
Measures such as the Multidimensional Measure of Informed Choice (MMIC)
(Marteau et al., 2001) do exist in other contexts but suffer from methodological
or theoretical issues. The MMIC, which has been developed for prenatal screen-
ing, contains recall-based knowledge components and so may fail to appropriately
capture parental understanding. The findings within the prenatal screening liter-
ature may not be relevant to newborn screening. A systematic review of different
screening programmes found that the important determinants of uptake varied
depending on the type of screening test (Jepson et al., 2000). Termination of
pregnancy, for example, has been found to be a highly significant influence in the
context of prenatal screening (Potter et al., 2008), yet is not a salient factor in the
context of newborn screening.
7
1. Contexts and concepts Stuart Nicholls
Audit data may be suggested as a proxy for explicit research data; for example,
audit data may include factors that are associated with the level of completeness
of coverage of newborn bloodspot screening. This may provide useful insights into
factors that affect uptake of newborn bloodspot screening but provides no infor-
mation about actual decisions taken by parents. Instead they may be documenting
administrative failings as much as actual refusals. Equally, the low level of refusal
- which may constitute only a handful of parents - is detrimental to any statistical
modelling or accurate quantitative analysis of actual uptake. Instead a more ap-
propriate process is to consider the reflections of parents on the decisions taken.
This not only provides insights into the decision-making process but potentially
generates variability in response allowing statistical analysis and the identification
of significant variables which may impact on these decisions.
1.4 Motivation
Thus, whilst there is an increasing interest in and expansion of, newborn bloodspot
screening, there has been little research focusing on the effects on parents or the
factors which influence parental decisions. Furthermore, research in other contexts
may not be relevant to newborn screening. There is, therefore, an opportunity to
create a better understanding of not only whether parents are making high-quality
decisions but also the factors that influence these decisions.
1.5 Aims
This research aims to identify and model factors that influence parental perceptions
of decisional quality within the context of newborn bloodspot screening (NBS).
8

1. Contexts and concepts Stuart Nicholls
1.6 Objectives/Research questions
• What are the factors that parents identify as affecting their decision to con-
sent to newborn bloodspot screening (NBS)?
• How are these factors related to their decision-making?
• To what extent do these factors influence the perceived quality of the deci-
sion?
This research will provide an insight into whether parents feel they are making
high-quality decisions when accepting or declining newborn bloodspot screening
and the factors which influence these perceptions. The results of this work will be
valuable in developing informed consent practices.
9
Chapter 2
Decision-making and newborn
bloodspot screening: what do we
know?
In the opening chapter newborn bloodspot screening was introduced together with
the motivation for this study; a lack of information about whether parents are mak-
ing informed choices or the factors that affect parental decisions to accept new-
born bloodspot screening. Informed choice, within the documentation provided by
the Newborn Screening Programme Centre, can be equated to informed consent
which itself is often decomposed into a number of elements which can broadly be
described as either informational or decisional aspects (Beauchamp and Childress,
2001; Gillon, 2001; del Carmen and Joffe, 2005; Dixon-Woods et al., 2007). In
the remainder of this chapter I shall review the literature on newborn bloodspot
screening through these informational and decisional lenses and appraise the cur-
rent state of the literature regarding the existing evidence about parental decision-
making.
This literature review has been confined to empirical studies within the context of
newborn screening and as such will not be reviewing the existing, and voluminous,
10
2. Decision-making and newborn bloodspot screening Stuart Nicholls
literature regarding prenatal screening. This literature, to which reference was
made during the introduction, has been extensively reviewed elsewhere1. Whilst it
is acknowledged that this literature may overlap with that on newborn screening
it was felt that the two contexts raise differing issues, particularly in relation to
termination following prenatal diagnosis.
Papers were sought through a narrative review of bibliographic databases such as
EMBASE, MEDLINE, and the Applied Social Sciences Index and Abstracts (AS-
SIA). In addition references were reviewed and author specific searches conducted
in order to identify texts that would not be located in these repositories.
2.1 Informing and influencing decision-making
Decision-making is often linked to the process of information provision and colla-
tion. Research relating to information provision has suggested that parents use a
range of sources to inform their decisions. A recent pan-European survey of infor-
mation for cystic fibrosis newborn screening found that 53% of the programmes
that responded provided information by a booklet with others providing infor-
mation via a pediatrician, nurse or midwife (Munck et al., 2007). Other studies
support this, in particular noting the role played by the midwife (Hargreaves et al.,
2005a; Parsons et al., 2006, 2007). Other, non-medical sources of information are
also sought with some research finding that prior personal experience and the ex-
periences of family and friends were second only to the advice given by the midwife
(Tymstra, 1986; Davey et al., 2005). In a Welsh study, personal experience was
felt to be an influential source to such an extent that one family’s negative expe-
rience of screening for Duchenne muscular dystrophy (DMD) was viewed to have
been the cause of a much higher refusal rate in one particular area (Bradley et al.,
1A comprehensive review by Green and colleagues identified 52 papers regarding understand-ing and decision making for prenatal screening, the majority of which related to Down syndromescreening but few regarding newborn screening. For more information see Green J.M., HewisonJ, Bekker H.L., Bryant L.D., Cuckle H.S., (2004) Psychosocial aspects of genetics screening ofpregnant women and newborns: a systematic review. Health Technology Assessment, 8(33)
11
2. Decision-making and newborn bloodspot screening Stuart Nicholls
1993). Additional qualitative work found that the advice of others, including the
midwife, was a key factor that affected parental decisions (Parsons et al., 2006).
This information seeking from non-medical sources was emphasised in a study
from the Netherlands where it was noted that
“Most of what they had heard came from other parents, for example,
during visits to see newborn babies and their parents. Several respon-
dents said that they had read about the test in a book about pregnancy
or seen something on television. They had seen little or no “official”
information.” (Detmar et al., 2007, p241)
Despite not receiving information through medical sources, participants in all of
the groups thought that the midwife played a key role in the provision of informa-
tion. This may suggest that the reference to “official” sources relates to written
information, with the midwife occupying a position not explicitly linked to infor-
mation provision.
Written information, whilst being received, is rarely cited as a primary source, with
some studies suggesting that instead it plays a greater role as a reference material
as opposed to influencing the initial decision-making (Hargreaves et al., 2005b).
The low priority placed by parents on written information serves to emphasise the
potential role that personal interaction plays in the information gathering process.
The reliance on midwives is an important finding if one wishes to identify the best
methods of service provision, yet in a survey of four maternity services across Eng-
land, midwives were found to be “not at all confident” in discussing with a couple
the genetics of cystic fibrosis and their risks of having an affected child. Twenty
nine percent of these respondents felt that genetics was a specialist area and should
be carried out by others (Metcalfe et al., 2008). Whilst this survey was carried
out prior to the development of training as part of the expanded national newborn
screening programme, a lack of confidence or knowledge by midwives could lead
12
2. Decision-making and newborn bloodspot screening Stuart Nicholls
to misinformed or uninformed decisions being taken by parents.
While interesting from an information provision perspective the implications for
parental decision-making are limited as they tell us little about what informa-
tional aspects parents act upon. For this one needs to consider the content of
the disclosure and the information that parents take utilise when making their
decisions.
2.1.1 Content of disclosure
Despite an extensive search of the literature, no studies were found which explic-
itly explored the communication process that occurs between parent(s) and their
midwife or parents and other parents in terms of collecting information about
newborn screening. Nor were any studies identified which questioned parents as
to what information they sought. There are, however, a limited number of studies
that have assessed written information provided to parents. Studies that have as-
sessed written information provided by healthcare organisations have found that
there is variance in terms of the details included and the way this information is
portrayed (Loeben et al., 1998; Hargreaves et al., 2005b). One review of over 100
patient information materials from the UK, US and Australia found that there
was an inherent bias towards the presentation of the benefits of newborn screening
compared to the limitations (Hargreaves et al., 2005b).
If this finding is replicated in the parent(s)-midwife discussions then there may
be a biased and less than optimal disclosure of information that precludes par-
ents from making an informed decision. This, however, is impossible to assess as
the published studies regarding parental experiences of newborn screening consis-
tently fail to provide evidence about what is disclosed to parents. As a result the
information giving process and the subsequent discussions between parents and
professionals remains opaque. None of the studies outlining information provision
13
2. Decision-making and newborn bloodspot screening Stuart Nicholls
described standard practice in any great detail. In those cases where there is a
brief description of the process e.g., parents are provided with a leaflet, no details
are given about the content.
This is a major obstacle in attempting to get inside the ‘black-box’ of parental
decision-making. Parents report that they rely on the midwife as an information
source and as a result these discussions are potentially pivotal to decision-making.
Without insight into how parents use these, or what occurs in these encounters,
the process of parental decision-making remains unexplored territory.
2.1.2 Satisfaction with information provision
Perhaps the largest area of research relating to the disclosure of information is that
of parental satisfaction with information, with a consistent finding that parents
are satisfied with the information that they have received (Sorenson et al., 1984;
Sveger et al., 1999; Sveger and Thelin, 2000; Davey et al., 2005). In particular,
one study in Massachusetts noted that the satisfaction was positively associated
with the perceived amount of information received (Sorenson et al., 1984). Oth-
ers note that satisfaction with information was correlated with belief in the value
of the test (Davey et al., 2005). Despite the consistency of these findings they
need to be carefully interpreted, for studies also show that the default reaction of
patients is to express a high level of satisfaction with medical care (Avis et al.,
1997; Sitzia and Wood, 1997). So, whilst parents respond to questions indicating
a satisfaction with the information provided, several studies also note that parents
also offer suggestions for improvement, often requesting more information (Sveger
and Thelin, 2000; Campbell and Ross, 2004; Davey et al., 2005)
One study which sought to assess why parents were dissatisfied with the infor-
mation they received found that parents suggested three possible causes for the
dissatisfaction (Parsons et al., 2007). These were:
14
2. Decision-making and newborn bloodspot screening Stuart Nicholls
• (a) a lack of information; that is there wasn’t enough
• (b) literature overload, and
• (c) a lack of time from the midwife
The first of these relates to the lack of detail in the information they were provided.
This further emphasises the need for more studies to investigate the content of the
communication process. The second point is not contradictory to the first, but
relates to the other literature that parents are receiving at this time, with parents
reporting that they lack the necessary time to read the voluminous literature
given to them (Davis et al., 2006). Finally the lack of midwife time is in part an
institutional effect of midwives having to conduct a number of clinics or visits and
consequently they only have a limited amount of time per case. In the study by
Parsons et al. (2007) parents often experienced this as a rush and were hesitant
to ask questions about the screening process. All of these have the potential to
impact negatively on information provision to parents.
2.2 Knowledge, understanding and decision-making
for NBS
By far and away the most expansive area of research around newborn bloodspot
screening is that of knowledge assessment. This has largely focussed on parental
knowledge through the accurate recall of information. The assessment of knowl-
edge is principally in two areas: the assessment of condition specific knowledge and
the evaluation of parental knowledge of the newborn screening process, with the
former generally found to be better than the latter (Faden et al., 1982; Dankert-
Roelse et al., 1990; Statham et al., 1993; Campbell and Ross, 2004; Davis et al.,
2006).
These studies, taking place mainly in the United States, have generally assessed
15
2. Decision-making and newborn bloodspot screening Stuart Nicholls
knowledge through the recall of technical information and found that parents often
do not know the names of conditions or their major cause (Faden et al., 1982).
UK research has suggested that ignorance is widespread with regards to screening
for PKU and CH (Statham et al., 1993). Two recent studies support this assertion
(Hargreaves et al., 2005a; Parsons et al., 2007).
Others, most worryingly, have found that some parents have an awareness of nei-
ther the screening programme, the names of the conditions tested for, the prob-
lems associated with these, nor whether their own child has been screened or not
(Smith et al., 1990; Tluczek et al., 1992; Campbell and Ross, 2003, 2004). In an
Australian study with women who had received written and oral information, only
37% recognised the term ‘Guthrie test’, ‘heel prick test’ or ‘newborn screen’. Most
disconcerting, given that the particular State operates under a principle of ‘in-
formed dissent’, was the finding that whilst 40.5% of the women stated that their
child had not undergone the test, when records were checked it was found that
only 2% had not undergone the test (Suriadi et al., 2004). Conversely, parental
knowledge of condition specific information is generally found to be good (Al-Jader
et al., 1990; Mischler et al., 1998; Lewis et al., 2006). Similar findings were re-
ported by a group in the Netherlands that found that knowledge of recurrence risk
was very good within a small cohort of patients identified as having CF, with 94%
knowing their recurrence risk (Dankert-Roelse et al., 1990).
2.2.1 Reliance on recall
The majority of the studies evaluating parental knowledge have done so through
the recall of information. By only assessing the recall of specific information, no
assessment is made of the understanding of the information, and at best the results
reflect the individuals’ memory (Beauchamp and Childress, 2001). Consequently
it tells us little if anything about the quality of the parental decision-making or
consent.
16
2. Decision-making and newborn bloodspot screening Stuart Nicholls
Two examples from the literature demonstrate this distinction. A sample of Dutch
parents recognised the term ‘heel prick’ and knew that the heel prick had been
conducted, but most did so “without really knowing what the heel prick was
for” (Detmar et al., 2007, p241). In a similar example, two-thirds of parents of
children with haemoglobinopathy could recall the recurrence risk of having another
child with a haemoglobinopathy but eight of the 15 parents interviewed could not
explain the risk figure (Warren et al., 1982). In both cases the parental knowledge,
through the recall of medical terminology or statistics, may be seen to be adequate
yet beyond this there is a lack of any real understanding or comprehension about
what these terms or figures mean for them in terms of their immediate or future
health.
2.2.2 Sample issues
Many of the studies of parental knowledge have heterogeneous samples in terms
of the ages of children. The heterogeneity of the samples is important as clinical
practice does not remain consistent over time and so parents would experience
differing clinical practice. In the study by Hargreaves et al. (2005a) the ages of the
children of those who participated varied between 23 years and six weeks of age.
The same issue is raised in a number of other studies although the range of ages
does vary (Dankert-Roelse et al., 1990; Dudding et al., 2000; Firth et al., 1983;
Muchamore et al., 2006b; Hildes et al., 1993; Merelle et al., 2003). Consequently,
when asked to recall their experiences, parents would have been recalling different
clinical standards, meaning experiences are not comparable. Despite this issue, the
authors draw together themes without acknowledging the context of the parental
experiences.
A further limitation brought about by the range of ages is the large lapses of time
between the study and the parents’ experiences of newborn screening. This is of
17
2. Decision-making and newborn bloodspot screening Stuart Nicholls
particular relevance given the prominence of knowledge assessment by recall of
information. Parental recall of an event, particularly technical information, may
be expected to be greater in the short term as opposed to a longer period. This
not only makes it less appropriate to use the recall of information as a method
of assessment - due to the differing information that may have been provided at
different times and the long expanse of time between screening and research - but
becomes even more pertinent if it is considered in conjunction with the salience
of information. In the studies which show good levels of knowledge, such as those
by Mischler et al. (1998); Lewis et al. (2006); Dankert-Roelse et al. (1990) and Al-
Jader et al. (1990) the selected groups were parents of children either affected by
cystic fibrosis (CF), or who were carriers of CF. A parent who has to take a child
for regular physiotherapy sessions in order to help their lung function is more likely
to have a good knowledge of the effects of the condition in comparison with an
individual who has an unaffected child. Therefore, it is perhaps no surprise to find
that when questioned about specific aspects of CF, parents of affected children
were aware that the lungs were affected in people who have CF (Lewis et al.,
2006). Consequently more attention needs to be paid to the sample composition,
the potential sample effects, and the implications for results.
2.2.3 Parent or professional perspectives?
It has already been argued that at best recall serves to demonstrate memory
and not understanding. At worst the failure to recall information may indicate a
difference in acceptance of information, as Wynne (1991) argues:
“People may appear to be unresponsive or incapable of digesting sci-
entific knowledge (which experts consider to be important to them)
when they are rejecting the scientists’ agenda. Our research shows
that public nonreceptivity to scientific information is often based on a
judgement that it is not useful or does not match public or personal
experience.” (Wynne, 1991, p116)
18
2. Decision-making and newborn bloodspot screening Stuart Nicholls
Hence a failure to recall the information selected by ‘experts’ as important may
reflect not on parents’ ability to understand the information, but on their own
interpretation of the relevance or usefulness of that particular piece of information.
The implication of this is that information may not be relevant to parents, and
their failure to recall this may say nothing as to their knowledge or understanding
but only of the salience to them. The perceived saliency of the information has
been found to be influential in prenatal screening research by Lippman (1999) and
Potter et al. (2008). These studies found that there was an interaction between
technical knowledge, other ‘experiential knowledge’ and moral beliefs (Potter et al.,
2008). Where mothers held a strong belief that termination was immoral, the tech-
nical information regarding risks became irrelevant as they would not consider a
termination. To say that they were uninformed fails to acknowledge that the in-
formation given to them by professionals has no relevance. Consequently it would
seem more appropriate to base evaluations on information that is relevant to par-
ents and utilised in their decision-making, as opposed to professionally derived
information priorities.
The existing literature suffers from a conspicuous lack of studies that have suf-
ficiently explored parental understanding and the factors that affect this under-
standing. This needs to be addressed if one is to gather relevant information as to
whether parents are providing informed consent to have their child screened.
2.3 Decision-making
2.3.1 Uptake and perception of choice
Uptake of newborn bloodspot screening is consistently found to be almost univer-
sal (Campbell and Ross, 2004; Therrell et al., 2006; Bradley et al., 1993; Clayton,
2005; Liebl et al., 2002; Dhondt, 2005; Simpson et al., 1997), with reported refusal
19
2. Decision-making and newborn bloodspot screening Stuart Nicholls
rates being as low as 0.05% (Faden et al., 1982). A published audit of data in
Bath found that only 5 parents refused screening in 1996, with 7 the previous year
(Simpson et al., 1997). More recent data from France found refusals for cystic
fibrosis screening decreased to a low of 0.2% . Over the same period no refusals
were recorded for standard screening which included tests for phenylketonuria,
congenital adrenal hyperplasia, congenital hypothyroidism and sickle cell disease
(Dhondt, 2005). Even with optional screening programmes for less treatable con-
ditions such as DMD, and screening tests with less predictive value as is the case
with diabetes type 1, uptake rates have been found to be high with with studies
exceeding a 90% uptake rate (Bradley et al., 1993; Campbell and Ross, 2003).
One potential explanation may be that the outwardly promoted requirement of
informed consent is experienced by parents as institutional rhetoric. This is sup-
ported by research which has noted that parents experience the heel prick as
routine (Hargreaves et al., 2005a; Moran et al., 2007; Parsons et al., 2007). Such
‘routinisation’ is found internationally. Dutch research into parental experiences of
screening for CH found that most parents saw the screening “as a routine business
that no one ever hears about again, and that people do not give much thought to.”
(Tymstra, 1986, p93). The same routinised attitude was found by Detmar et al.
(2007), the authors noting that screening was ”more or less automatic and that
consent is not explicitly requested” (Detmar et al., 2007, p241). In some cases
parents have even reported that the screening process was conducted in their ab-
sence, obliterating any notion of informed consent (Tymstra, 1986; Tluczek et al.,
2005).
In a Welsh study it was found that when a second screening card for an optional
screen for DMD was introduced it led to a significant increase in parental awareness
that the test was optional. The intervention also led to a decrease in the uptake
from 95% to 91%. Despite this increase in awareness, 15% of those involved in the
20
2. Decision-making and newborn bloodspot screening Stuart Nicholls
intervention arm did not realise it was optional. Four percent of these felt that
they did not have a choice, despite the explicit way in which consent for screening
was taken. This led the authors to conclude that:
“It would seem that, although the majority of mothers felt they were
being given a choice about screening, for some it was a choice about
a test they thought was always done. This, in reality, is no choice at
all.” (Parsons et al., 2005, p168)
Thus the ability to provide an informed consent is not merely about having the
facts to make a rational choice. The findings that parents do not necessarily expe-
rience a choice may also indicate that more subtle pressures are being exerted, such
as the way that the screening tests are offered, the information that is provided and
the institutions or individuals that provide them. Indeed the prescription within
the current UK guidelines that “screening has been discussed and recommended”
(UK Newborn Screening Programme Centre, 2008a, p2, emphasis added) may be
seen as an example of these subtle pressures, with a recommendation being seen
as potentially coercive.
Countering this suggestion there is evidence that at least some parents welcome
the recommendation from the midwife. Australian research has found that whilst
some parents felt that they had not given a specific consent, most were not con-
cerned by this (Muchamore et al., 2006a). UK research suggests that parents are
happy to accept a routine screen that is recommended by their midwife, with some
parents commenting that “If they had been offered a choice, many said they would
have opted for their child to be screened.” (Hargreaves et al., 2005a, p165). As a
result the mere offer of a screening test may result in a sequence of events that,
under the prevailing social norms, means that ones actual experience of ‘choice’ is
that there is no choice at all.
21
2. Decision-making and newborn bloodspot screening Stuart Nicholls
Yet despite all the evidence regarding the routine nature of screening, there is a
lack of research which explores whether parents feel they can refuse such an offer,
how they experience these offers and whether they feel the recommendations by
practitioners constitute an ‘undue influence’.
2.3.2 What is known about decision-making?
As laid out in the preceding section, much of the existing research has consid-
ered the uptake of screening, the sources of information that parents use and the
quality of this information. These studies tell us very little about parental decision-
making. In this regard there is a much thinner evidence base.
What research there is suggests that the benefit to the child is paramount (Par-
sons et al., 2002; Campbell and Ross, 2003; Hargreaves et al., 2005a; Parsons et al.,
2006; Detmar et al., 2007, 2008). This perceived benefit is indicated in the way
parents respond to a scenario where there is no direct health benefit to the child;
such as DMD screening, with some parents saying that they would refuse screening
because of the lack of health benefits (Campbell and Ross, 2003; Parsons et al.,
2006). The consistency of this finding both over time and between countries, in-
dicates that this is normative statement and not a context specific description.
Perceptions of screening, and the potential for benefits, has been found to be medi-
ated by a general attitude towards medicine. For those parents who offered reasons
why they accepted newborn screening, a belief in research, support of screening
in general, and the simplicity of the test were all given as reasons (Parsons et al.,
2006). For those who refused, a wish to avoid medical intervention and a perception
that the test would not aid research were also given as reasons. In another study
auditing an existing neonatal screening programme, the reasons given by parents
for refusal appeared to be specifically related to their opinions of screening and/or
medical intervention in general. The authors noted that several of the parents who
22
2. Decision-making and newborn bloodspot screening Stuart Nicholls
refused had delivered at home with minimal medical input and one family refused
because they thought that “the screening test was a barbaric procedure based on
the experience of an acquaintance” (Simpson et al., 1997, pF231). Whilst views
regarding the medical intervention were cited as central to the decision, this was
heavily influenced by the experiences of friends. As a result experience is not only
an important source of information but may also be important in decision-making.
The finding that the health of the child is regularly invoked as the main reason
for accepting screening is consistent with the original principles on which newborn
screening was founded. These criteria state that not only should treatment at
an early stage be of more benefit than at a later stage but also that the risks,
both physical and psychological, should be less than the benefits (Wilson and
Jungner, 1968). In some instances this is seen to be of such paramount importance
that parents felt that the benefit to the child outweighed parental autonomy and
decision-making rights over their child. For example, in one US study it was
reported that:
“The majority of respondents supported mandatory testing because
of concerns that some parents may refuse out of ignorance (six focus
groups), with three groups targeting their concern at teenage mothers.
As several respondents suggest, some parents may not make the right
choice for the health of their child.” (Campbell and Ross, 2003, p210).
Consequently, the parents felt that the benefit to the child was more important
than parental rights to decision-making. There is also an important interaction to
be noted. Firstly there is a supposition that there is a right choice in terms of the
health of the child. The availability of this ‘right’ choice may explain why some
parents experience the screening as routine as there is no choice to make, one only
has to action the correct solution. The second is that testing is beneficial. It is at
this level that the social norms may come into play as discussed earlier. The offer
of a test may imply it is beneficial. Therefore, if testing is beneficial no decision
23
2. Decision-making and newborn bloodspot screening Stuart Nicholls
needs to be made if one has already established that conveying benefit to the child
is the correct moral position.
Trust may also be an important mediating factor, with one study finding that
trust in the medical community is central to the attitudes of the mothers (Parsons
et al., 2007). Thus a trust in the medical profession may be a causal element in
determining that screening is beneficial due to the fact that screening is offered by
the medical community.
Empowerment, through gathering knowledge, may also be an important factor. For
those who accepted screening in a DMD study conducted by Parsons et al. (2006)
the majority of reasons for accepting screening related to themes of gathering
knowledge. As with the attitudes expressed by parents towards newborn screening,
much of this knowledge-seeking was related to benefiting the health of the baby.
The authors concluded that:
“Most of the reasons given [...] indicated that women were aware
screening for DMD might detect an abnormality. For those who re-
quested the test, earlier identification was seen to offer the benefits
of knowledge, time to prepare and get early help and choice in future
pregnancies.” (Parsons et al., 2006, p711).
This is not to say that all parents desire the screening results. In the same study,
a cited factor for declining screening was the desire not to know. Thus knowledge
may be central to decision-making, but not deterministic of the direction of the
decision. In an additional study the same authors note that “Women who refused
the test were far more likely to give a reason which indicated they were aware
the test might detect abnormality” (Parsons et al., 2006). Thus it may be that
increased knowledge may be linked, through such an awareness of abnormality, to
an increased refusal of newborn screening.
24
2. Decision-making and newborn bloodspot screening Stuart Nicholls
These studies suggest that there are some areas of overlap between the sources of
information that parents use and the factors that influence their decision-making.
Personal interaction appears to be important for parents when making these de-
cisions and this is exemplified through the evidence that the midwife and other
parents are principal sources of information. Whilst it is unclear from the existing
studies what parents take from these discussions into their own decision-making, a
number of factors do appear to be key. Principally the concern for the health of the
child is of utmost importance, with support for screening decreasing in line with a
perceived decrease in benefit to the child. This perception of benefit appears to be
mediated by a general attitude toward medicine and medical intervention; which
in turn appears to be influenced by experience. As such it may be that parents
enter discussion with other parents and/or the midwife seeking information as to
the potential health benefits or detriments for their child and it is this that they
take from discussions and on into their decision making.
2.4 Limitations of existing research
From the evidence, is it possible to answer the question of whether parents are
giving informed consent to newborn bloodspot screening? The answer is no be-
cause the data thus far is unclear. The analysis of parental decision making, and
in particular parental consent to newborn bloodspot screening, is something that
has received little attention within the literature. The small quantity of research
together with methodological issues preclude any great inferences being drawn
about why parents accept or decline newborn bloodspot screening or how they
come to their decision.
A limitation is that many of the studies make use of hypothetical scenarios, some-
thing which may offer few insights into actual decision-making. Examples from
clinical genetics, particularly relating to uptake of predictive testing, have shown
that there is a notable difference in predicted and actual uptake rates (Decruye-
25
2. Decision-making and newborn bloodspot screening Stuart Nicholls
naere et al., 1993; Binedell et al., 1998). This suggests that inferences drawn on the
basis of hypothetical scenarios may be unsubstantiated when applied to actual sit-
uations and that there may be additional factors affecting actual decision-making.
Audit data may be suggested as a proxy for explicit research data and may include
factors that are associated with the level of completeness of coverage of newborn
bloodspot screening. These studies indicate a number of factors that affect the
likelihood that a screening result is not recorded including reduced contact with
hospitals, early discharge following a short post-natal period, birth outside of hos-
pital and less than seven antenatal visits (Gray et al., 1997; Spady et al., 1998;
Metz et al., 2003; Jaques et al., 2008). Two studies have also identified ethnicity
related influences (Streetly et al., 1994; Metz et al., 2003). Whilst the estimation
of coverage provides useful insights into factors that may be affecting uptake of
newborn bloodspot screening, the analysis is purely descriptive and in no way pro-
vides information about actual decisions taken by parents. Instead they may be
documenting administrative failings as much as actual refusals. A combination of
data is required; the variables identified as significant may be explored further to
examine potential causal mechanisms that lead to the lack of a screening result.
It may be that parents who leave hospital earlier are less willing to have medical
interventions than those who stay longer, and this accounts for their lack of test
result. Alternatively, hospital pressures may mean that there is an increased im-
petus to have parents take children home earlier so that the facilities are free for
the next parent who requires them. This may in turn lead to more administrative
errors resulting in missed tests. Without further in-depth analyses either of these
premises are plausible.
The existing literature also suffers from methodological weaknesses. Most of the
studies which have assessed knowledge have done so using a questionnaire or a
structured interview. There is, however, a pervasive lack of justification for the
26
2. Decision-making and newborn bloodspot screening Stuart Nicholls
questions asked. There are different studies, each assessing knowledge of a genetic
condition, or NBS more generally, but the findings are not directly comparable be-
cause of the differences in questions. If there is a question asking parents to recall
prevalence, why is this included? If the questions used were intrinsically linked to
the information provided to parents, then one could make the case for the question
as a measure of recall. One would still need to justify why the recall of this specific
information was important, but one could argue that parents are being provided
with information and so this should be recalled. If this justification were in place
one could also compare the information provided to that recalled and look for any
specific patterns and these patterns could be compared across studies. Yet, this
sort of information, let alone descriptions of the current information provided to
parents, is not presented within the published studies.
The use of quantitative research is not in itself problematic, but it is the specific
application of these research methods which is the cause of concern. For example,
despite the use of quantitative research methods there is a lack of statistical analy-
sis amongst the published literature. In many of the studies only simple descriptive
statistics are used, such as percentages of responses. Whilst appearing to provide
detailed quantitative data, the results are open to misinterpretation. For example,
whilst Al-Jader et al. (1990) demonstrate a difference in parental knowledge of CF
between higher and lower educational groups, there is no analysis to see whether
this is statistically significant. Consequently the percentage differences may be
perceived to demonstrate a difference, but without further statistical analysis it is
not clear if this difference is likely to have occurred by chance or whether it is a sta-
tistically significant difference. Further compounding this are the small numbers
achieved by some studies meaning that the use of quantitative methods is likely
to be inappropriate for testing statistical significance. Again using the study by
Al-Jader et al. (1990) as an example, only 29 sets of parents were recruited. In the
questionnaire by Dankert-Roelse and colleagues only 38 individuals completed the
27

2. Decision-making and newborn bloodspot screening Stuart Nicholls
questionnaire (Dankert-Roelse et al., 1990). Other studies such as Dillard et al.
(2007) and Hildes et al. (1993) had samples of 40 or fewer.
In those studies where additional statistical analyses have taken place there are
further issues in terms of their substantive usefulness. In the study by Dillard
et al. (2007) their conclusions are somewhat diluted by the revelation that the
observed increase in parental knowledge cannot be explicitly said to be due to the
counselling intervention being assessed. In the study by Holtzman et al. (1983),
which found several variables to be statistically significant in the explanation of
parental knowledge scores, only a minimal amount of the variance was accounted
for; in some instances leaving up to 80% of the variation unexplained. This points
to a lack of prior research in terms of determining the appropriate variables that
are implicated in parental knowledge about newborn screening.
It is this lack of prior research that makes much of the quantitative research inap-
propriate. This is symptomatic of a wider issue; that of a lack of studies addressing
‘why?’ questions. The exceptions here are the studies of Parsons and colleagues
(Bradley et al., 1993; Parsons et al., 2005, 2006), which have sought to identify
factors affecting parental decisions whether or not to accept an optional screen for
DMD.
In conclusion, despite the published findings on knowledge, coverage of screening
results and parental attitudes to newborn screening there is a paucity of research
regarding parental decision-making, the information that parents use in making
decisions, and the factors that affect their decisions. Furthermore, none of the
studies relate to current UK practice and how parents experience this, perhaps not
surprising given the delays between research and publication and the rapid rate at
which clinical practice is altered. Nearly all of the research within the UK context
has been conducted prior to the current guidelines. As such, and again this ties in
28

2. Decision-making and newborn bloodspot screening Stuart Nicholls
with the opaqueness regarding details of information provision within published
studies on knowledge, it is difficult to gauge whether the existing literature would
reflect the current status within the UK regarding knowledge, understanding and
decision-making of parents. There is a need to conduct research within the current
UK context, and to make this context explicit, so that one can assess the findings
relative to the processes and mechanisms that are in place. Only then will it be
possible to begin to identify, or at least suggest with empirical support, causal
elements or mechanisms that are implicated in regarding parental decision-making
and consent to newborn screening.
29
Chapter 3
Devising the structural model:
Methods
The first stage in devising a model of parental decision-making is the determina-
tion of the appropriate variables to be included. Once a set of variables has been
agreed upon one needs to generate a theoretical framework in which these vari-
ables interact. As evidenced from the literature review there is a paucity of data
relating to either the variables to be included or the way in which these variables
impact upon parental decisions. Consequently it was deemed necessary to under-
take preliminary work to generate both the variables and the proposed model of
parental decision-making that could then be assessed through statistical analysis.
3.1 Methodological overview
The study undertaken here follows an exploratory sequential mixed methods ap-
proach comprising of qualitative and quantitative phases (Creswell and Plano
Clark, 2007). In doing so, I approach the study from a critical realist perspec-
tive, attempting to identify and explain causal mechanisms (Lawson, 1998; Sayer,
2000; Danermark et al., 2002). The use of both quantitative and qualitative data
has been argued to be important in empirical research that seeks answers to causal
relationships, such as decision-making for newborn screening, with Sayer arguing
30
3. Devising the structural model: Methods Stuart Nicholls
that:
“in any concrete study it is important not only to know what causal
mechanisms are present and how they work but also to have a quantita-
tive estimate of their number and their effects (if they are separable)”
(Sayer, 1992, p181).
Recent years have seen an increase in mixed methods approaches (Creswell and
Plano Clark, 2007; Creswell et al., 2004) or ‘multi-method research’ (Bryman,
2004). This development has been partly driven by increased funding for interdis-
ciplinary research but also increasing support for methodological triangulation.
To the extent that the aim here is to identify causal mechanisms, it could per-
haps seem that an appropriate orientation for a mixed methods design would be
to begin with a quantitative phase. This would allow one to gather data re-
garding the commonality of a phenomenon, and then to use a qualitative stage
to elucidate further and develop theories regarding the underlying mechanisms,
this being what Creswell describes as an ‘explanatory’ mixed methods approach
(Creswell and Plano Clark, 2007). To a certain extent this would be ideal; per-
haps examining the details behind an observed pattern. As already stated, there
is a paucity of research relating to parental experiences of decision-making for
newborn bloodspot screening. The effect of attempting to model a causal rela-
tionship on limited data would lead to the problem of specification error, with the
omission of theoretically key variables severely affecting any statistical inferences
that could be drawn (Hair et al., 1998). Consequently, the exploratory sequential
mixed methods approach was deemed the most appropriate as it not only provides
the opportunity to develop causal explanations through the use of the qualitative
phase, but also elucidates appropriate variables that will enable the development
of statistical analyses regarding parental decision-making. This, of course, must
be tempered by the practical restraints placed on empirical research and in partic-
ular the researcher in attempting to interpret the results. Thus, whilst one seeks
31
3. Devising the structural model: Methods Stuart Nicholls
an exhaustive set of variables, one needs to remain conscious of the benefits of
parsimony and concision, as well as the pragmatic limitations to attempting to
identify causal relationships.
Consequently, it was decided that an initial phase of interviews would be conducted
and that this would be followed by a quantitative stage comprising of a question-
naire that would be analysed using Structural Equation Modelling (SEM). In the
remainder of this chapter I outline the approach taken to this first qualitative
phase.
3.2 Why interviews?
Interviews are a preferred method when “the object of study is some form of social
process or meaning or experience which needs to be understood and explained in
a rounded way” (Mason, 1996, p96-97). This reasoning tends to be built around a
constructivist way of thinking, in that our knowledge and experiences are built up
through a series of social interactions that are not necessarily amenable to statis-
tical analysis or other rigid methodologies (Arksey and Knight, 1999). Yet from
a critical realist perspective it allows for the expression of motivations and for
other influences to be derived so that they reveal or allow us to postulate causal
mechanisms that can be further analysed through quantitative methods.
Semi-structured interviews were chosen for this study as they allow the respon-
dents themselves to create their own definitions of their experiences rather than
having definitions created and imposed by the researcher (Murphy et al., 1998).
The flexibility over structured survey interviews is that they allow the researcher
to follow up on topics discussed or introduced by the participant, as well as to
probe responses for more clarity or detail (Bell, 2005). By allowing questions to
be posed through different wording the interview can fit with the participants’
understandings or beliefs. The individual interview is also preferable over alter-
32
3. Devising the structural model: Methods Stuart Nicholls
native qualitative methods, such as focus groups, due to the ability to maintain
confidentiality which is not possible in a group situation (Bowling, 2004).
It may be argued that what people say and do are different and that other ethno-
graphic methods such as participant observation may be seen as more appropriate.
Indeed a difficulty with interviewing rests on how one is to interpret the content of
the interview. Some authors argue that the information garnered from an intervie-
wee may be problematic, particularly within the context of recalling interactions
with health services. As such, treating this data as a primary source can be mis-
leading. This is not to say that individuals are consciously misleading the inter-
viewer, rather the process of the interview itself may be seen as imposing, at least
initially, a social structure which the interviewee may feel that they are required to
conform to. As a consequence it may be more appropriate that the content derived
from the interview “be treated as an account [...] rather than as literal descrip-
tions of the respondent’s reality.” (Murphy et al., 1998, p121). With this in mind
it was felt that the crux of the study was not the actual interaction between the
professional and the parent but rather how this was experienced. This experiential
nature of parental decision-making could not be accessed through observation and
consequently interviews were chosen as the methods to be implemented.
3.2.1 Single vs. joint interviewing
Parents were interviewed individually. This was done for pragmatic and theo-
retical reasons. Pragmatically it may be more difficult to arrange to interview
couples; theoretically, interviewing separately may allow the submissive partner
more freedom to express their own individual views. Equally, a joint interview
may stir up any antagonism that exists between the couple regarding the topic
which would not be conducive to a good interview. By conducting one-to-one in-
terviews with both partners, differences in knowledge or experience which would
have remained hidden in a joint interview, may be revealed. Indeed, in the context
33
3. Devising the structural model: Methods Stuart Nicholls
of this research, it was anticipated that differing accounts may be indicative of the
process of taking consent. Prior research has found that questions of ’family’ have
traditionally been directed towards women (Valentine, 1999).
3.3 Sampling
3.3.1 Sample size
Qualitative interviewing necessarily requires small samples due to the complex
nature of the data generated and the costs incurred in terms of collection and
analysis of the data (Mason, 1996; Bowling, 2004). A total of twenty intervie-
wees were sought. Appropriate sample sizes for in-depth qualitative interviews
have been suggested as being as small as eight up to a suggested practical max-
imum of twenty for a single handed researcher (McCracken, 1988; Mason, 1996).
The chosen sample size is also consistent with previously published research and
recommendations (Senior et al., 1999; Bowling, 2004; Bryman, 2004).
3.3.2 Populations
Parents were purposively sampled in order to gauge a range of opinions and were
selected from differing geographic areas on the basis of data available from the
Audit Commission1 to reflect differing socioeconomic status. Table 3.1 shows a
selection of profile data from the areas where parents were recruited.
3.3.3 Sampling procedure
The study used a retrospective sample. Whilst the use of a prospective sample
might be seen to provide a population who have more immediate experiences of
the newborn screening process there is, in these circumstances, a greater possibil-
1Data taken from the audit commission website: http://www.areaprofiles.audit-commission.gov.uk. Accessed 9 October 2009.
34
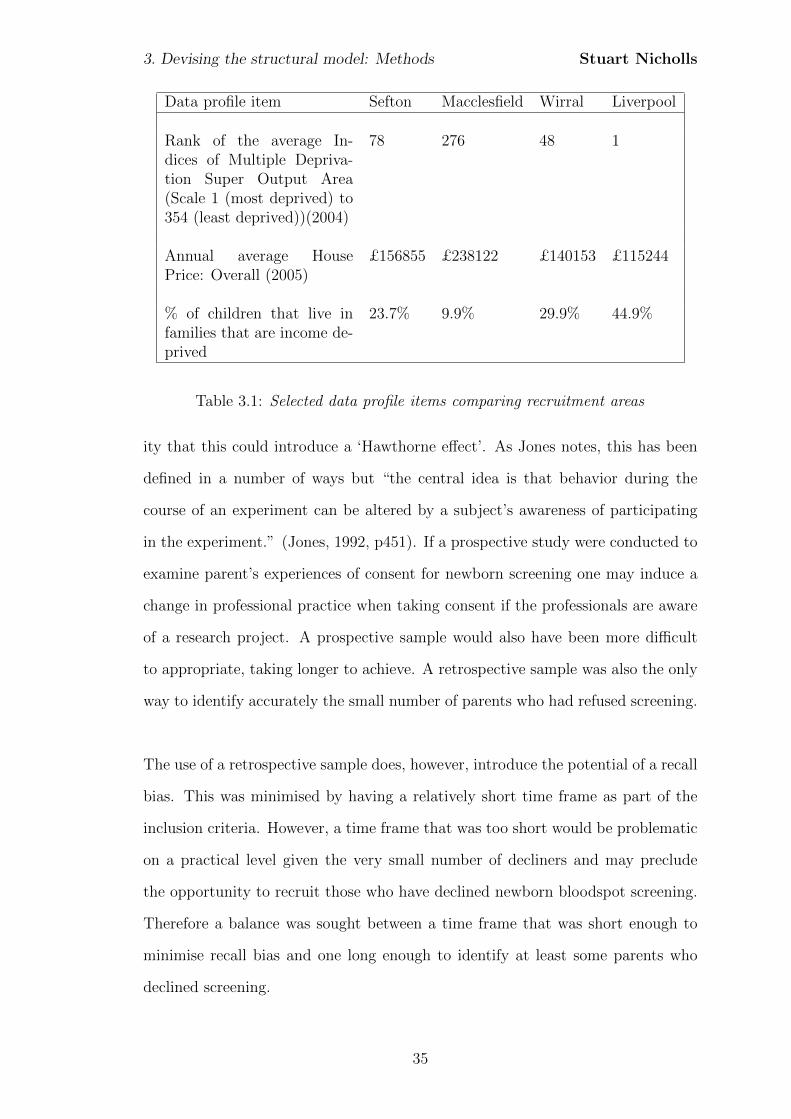
3. Devising the structural model: Methods Stuart Nicholls
Data profile item Sefton Macclesfield Wirral Liverpool
Rank of the average In-dices of Multiple Depriva-tion Super Output Area(Scale 1 (most deprived) to354 (least deprived))(2004)
78 276 48 1
Annual average HousePrice: Overall (2005)
£156855 £238122 £140153 £115244
% of children that live infamilies that are income de-prived
23.7% 9.9% 29.9% 44.9%
Table 3.1: Selected data profile items comparing recruitment areas
ity that this could introduce a ‘Hawthorne effect’. As Jones notes, this has been
defined in a number of ways but “the central idea is that behavior during the
course of an experiment can be altered by a subject’s awareness of participating
in the experiment.” (Jones, 1992, p451). If a prospective study were conducted to
examine parent’s experiences of consent for newborn screening one may induce a
change in professional practice when taking consent if the professionals are aware
of a research project. A prospective sample would also have been more difficult
to appropriate, taking longer to achieve. A retrospective sample was also the only
way to identify accurately the small number of parents who had refused screening.
The use of a retrospective sample does, however, introduce the potential of a recall
bias. This was minimised by having a relatively short time frame as part of the
inclusion criteria. However, a time frame that was too short would be problematic
on a practical level given the very small number of decliners and may preclude
the opportunity to recruit those who have declined newborn bloodspot screening.
Therefore a balance was sought between a time frame that was short enough to
minimise recall bias and one long enough to identify at least some parents who
declined screening.
35
3. Devising the structural model: Methods Stuart Nicholls
The initial research design was to sample parents using a purposive, or what has
also been termed a theoretical, sample, with sampling continuing until theoreti-
cal saturation had been achieved. Purposive sampling is a deliberate non-random
method which specifically selects individuals on the basis of them holding a par-
ticular characteristic (Bowling, 2004). Purposive sampling is beneficial as one can
target specific individuals with certain characteristics. The theoretical argument
here was that parents who refuse consent to newborn bloodspot screening may
have different experiences to those who accept screening. Random sampling and
convenience sampling were discounted as they could have missed the small num-
ber of parents who had declined screening. This sampling process may also be
considered a process of maximum variation sampling due to the deliberate seeking
of parents who decline screening (Miles and Huberman, 1994). This strategy for
sampling throws into light unexpected outcomes which may in turn identify un-
derlying mechanisms or structures that are not apparent in other circumstances
(Danermark et al., 2002).
3.3.4 Identification and recruitment
Identification and recruitment of parents was led by Dr Kevin Southern, Consul-
tant in Paediatric Respiratory Medicine at Royal Liverpool Children’s Hospital.
Parents were selected on the basis of their child’s sample being analysed by the
screening laboratory and having been born within the twelve months prior to the
start of the study in December 2008. This timeframe was selected in order to
address the sampling issues highlighted in Chapter 2 but allowed the identification
of a reasonable number of parents who had declined screening. With a small time
frame between the screening and interview it was hoped that not only would recall
bias be limited but parents would also be drawing on experiences relating to cur-
rent practice that would, at least theoretically according to professional guidance,
be standardised.
36
3. Devising the structural model: Methods Stuart Nicholls
Parents were excluded if their child was severely ill, had subsequently died or if
their parents were unable to converse freely in English. At Royal Liverpool Chil-
dren’s Hospital, Dr Southern and Elaine Hanmer, Laboratory Information Systems
Manager, extracted the names of potential participants. Due to the low number of
parents who decline newborn bloodspot screening and, in line with the purposive
sampling approach, all babies whose parents had declined screening were selected
for approach.
For those infants within the Liverpool area, the family health visitor was contacted
by Dr Southern to identify any potential problem in approaching the family. In
Macclesfield this contact was made by Liz Eccleston, Clinical Governance Lead
Midwife at Macclesfield District General Hospital.
Despite best efforts, recruitment proved problematic using the screening labora-
tory list alone. Ultimately only two parents identified from the newborn screening
laboratory list agreed to be interviewed, therefore additional recruitment methods
were undertaken. To this end Sure Start schemes were contacted regarding the
possibility of recruiting parents from play schemes and other organised events. It
was hypothesised that the parents attending Sure Start schemes, in line with their
aims and objectives, would be parents from lower socioeconomic groups, irrespec-
tive of the geographic region. In light of this supposition, regional branches of the
National Childbirth Trust (NCT) were also approached. The NCT is a charity
which aims to provide information and support to parents throughout pregnancy
and early parenthood and also has a mandate to campaign on maternity and child
health issues. In contrast to the Sure Start schemes, it was hypothesised that the
composition of these groups would be largely middle class, white mothers.
Whilst initial interviewees were identified through these contacts, additional par-
37
3. Devising the structural model: Methods Stuart Nicholls
ents were identified and recruited through a process of snowballing. This process
uses respondents to identify further potential interviewees who are then contacted
to see if they are willing to take part (Bowling, 2004). Hence, the final sample
is more accurately described as a combination of theoretical sampling followed by
snowballing which identified respondents in a situation where existing networks or
lists did not exist.
In all cases, parents who met the inclusion criteria and who failed to meet the
exclusion criteria were approached by letter in the first instance. This invitation
letter (Appendix A) introduced parents to the study, as well as providing contact
details. Included with the invite letter was a patient information sheet (Appendix
B) which provided more details regarding the project. If parents wished to take
part they indicated this on a reply slip which was returned in an included envelope.
This reply slip asked for contact details so that an interview could be arranged. If
no response was received within two weeks of sending the letter then a reminder
letter was sent. If no response was received following this letter then no further
action was taken.
3.4 Data collection
All interviews bar one were audio-recorded using a digital recorder. Audio record-
ing is preferable to the taking of field notes during the interview as this can interfere
with the process of interviewing (Britten, 1995).
All audio-recordings were transcribed verbatim. It is beyond the scope of this
chapter to assess the advantages and disadvantages of the transcription of audio
recordings; instead it is noted that this process is in itself selective and represents a
translation or interpretation from what was said to what is to be written (Bourdieu,
1999; Miles and Huberman, 1994; Mishler, 2003). Transcripts were made available
to interviewees for comment and were sent to those who had indicated that they
38
3. Devising the structural model: Methods Stuart Nicholls
wished to receive them. Such feedback from participants has been argued for with
regard to confirming the validity of the data (Miles and Huberman, 1994). In this
study, however, no further comments were received.
3.5 Data analysis
3.5.1 Overview
Following the transcription of the audio data, the transcripts were loaded into
Atlas.ti v5.2 (Scientific Sofware Development, 2007) which is a workbench for the
qualitative analysis of large bodies of textual, graphical, audio, and video data.
The major benefit of using qualitative data analysis (QDA) software such as At-
las.ti comes with the ability to store large amounts of data that can be retrieved
in a short space of time. This does not reduce or eradicate the human element of
coding and does not offer a simplification. Analysis still requires formal interpre-
tation and analysis with the software assisting this by allowing the user to apply
multiple codes quickly, negating the need for extensive paper copies of transcripts
(Richards and Richards, 1998). This systematic retrieval of codes or quotations
can allow for complex searches to be done with ease and one may easily look for
co-occurrences of codings that may be nested, overlapping or which may occur
with a specific proximity (Arksey and Knight, 1999).
The examination of the transcripts followed a thematic analysis approach (Boy-
atzis, 1998). Thematic analysis shares many features with other methods of qual-
itative analysis such as Grounded Theory in so far as textual data is coded and
labelled and, in an inductive approach, are grounded in the data. The paucity of
prior research on newborn screening precluded the use of any pre-defined coding
scheme. The focus of the analysis was not only on the development of themes that
would be taken into the second stage of the study but also the development of
causal relationships between these. As such it diverges from traditional Grounded
39
3. Devising the structural model: Methods Stuart Nicholls
Theory approaches where the development of a general or substantive theory is a
key goal. The thematic analysis conducted here may differ from some qualitative
research as it was conducted both within and across cases (Braun and Clarke,
2006).
3.5.2 Coding
Analysis began with a process of ‘open coding’ (Strauss, 1996). Open coding is the
process by which codes are developed and attached to segments of the transcript.
These codes are:
“...tags or labels for assigning units of meaning to the descriptive or
inferential information compiled during a study. Codes usually are
attached to ‘chunks’ of varying size – words, phrases, sentences or whole
paragraphs, connected or unconnected to a specific setting. They can
take the form of a straightforward category label or a more complex
one (e.g. a metaphor) [...] so the researcher can quickly find, pull out,
and cluster the segments relating to a particular research question,
hypothesis, construct or theme.” (Miles and Huberman, 1994, p56-
57).
This process of coding was iterative with the codes being developed using the
constant comparison method allowing for the constant revision, combination or
separation of codes in light of new data (Strauss, 1996). Each newly coded inci-
dent was compared both within and across parents to previous incidents in order
to refine or revise the code (Fielding and Lee, 1998). Codes were either ‘in vivo’;
coded using a phrase used by the data source, or generated by the coder; what
have been described as constructed codes (Patton, 1980; Strauss, 1996).
Codes were developed using a five step process:
1. A label (i.e., a name)
40
3. Devising the structural model: Methods Stuart Nicholls
2. A definition of what the theme concerns (i.e., the characteristic or issue
constituting the theme)
3. A description of how to know when the theme occurs (i.e., indicators on how
to ’flag’ the theme)
4. A description of any qualifications or exclusions to the identification of the
theme
5. Examples, both positive and negative, to eliminate possible confusion when
looking for a theme (Boyatzis, 1998, p31).
In addition to coding, a process of memoing was also introduced in order to main-
tain ideas and conceptual frameworks that became apparent during the process
of coding. As such, the memo acts as a device to bridge the transition between
the empirical data and the emerging conceptual structures (Miles and Huberman,
1994).
3.5.3 Data reduction
Following the initial open coding, themes were identified which subsumed multiple
codes. In this respect it is similar to what grounded theorists describe as selective
coding and involves the incorporation of the conceptual and theoretical develop-
ments captured in the memos. As such, the theme operates at a higher level than
the immediate codes although it may still operate at the manifest or latent levels
(Boyatzis, 1998).
This data reduction began through a process of pattern coding, that is “grouping
those summaries into a smaller number of sets, themes or constructs.” (Miles
and Huberman, 1994, p69). As with the initial coding, themes were reviewed and
revised in an iterative process. Cross case analysis was used to develop the notions
of understanding and explanation highlighting differences in decision-making.
41
3. Devising the structural model: Methods Stuart Nicholls
3.5.4 Reliability and validity
Reliability may be considered as “the consistency of a measure of a concept.”
(Bryman, 2004, p71) whilst validity “refers to the issue of whether an indicator
(or set of indicators) that is devised to gauge a concept really measures that con-
cept.”(Bryman, 2004, p72). Reliability may be difficult to achieve in qualitative
research; the same interview may yield different results due to different experi-
ences. The process of the interview may encourage an individual to reflect upon
their own experiences which in turn may modify their views. This poses the prob-
lem of how one can apply notions of reliability to qualitative research. In order to
overcome this I follow the work of Mays and Pope (2000) in accepting a notion of
reliability which requires modification for qualitative research. I accept a criterion
of internal reliability whereby there is a consistency within the study. In this case
it is the consistency of the application of codes, avoiding a definitional slide. This
will be accompanied through procedural elements such as the constant-comparison
technique and a reflexive approach to the research.
As previously mentioned, the notion of validity relates to the accuracy of the
research results. To this extent the feedback of participants as a process of respon-
dent validation is often advocated. It is argued that this not only provides a level
of corroboration should the respondent agree with the analysis but also that:
“... they should be able to pick up any nonsensical interpretations - the
kinds of things they could not have possibly said. However, sometimes
respondents will disagree with the transcript, even though it is clear
from the recording what they really said.” (Gibbs, 2007, p95).
In this study copies of transcripts were sent to those who indicated a wish to
receive them. Feedback from participants has been argued for with regard to con-
firming the validity of the data (Miles and Huberman, 1994). Such post-interview
interaction may also serve as part of the debriefing for both the researcher and
42

3. Devising the structural model: Methods Stuart Nicholls
interviewee and as a way to obtain feedback about the research in general (Sieber,
1992). The finding that no parents provided additional comments or feedback on
transcripts may indicate that they were satisfied that the transcripts represented
their perspectives, although this assumption was not verified.
43
Chapter 4
Devising the structural model:
Results
4.1 Parent participation
A total of 18 interviews were conducted. Two were with fathers, twelve with prima-
parous and six with multiparous parents. Unfortunately none of the parents who
had been identified as refusing the heel prick took part in this study; three parents
who declined screening actively declined to be interviewed with the remainder not
responding. Consequently the data relates only to the experiences of parents who
had accepted the heel prick. Only one parent had a child affected by one of the
screened for conditions, although this was not their most recent child. Another
mother had a child affected by an inherited metabolic condition with similar im-
plications to Phenylketonuria. The interviews ranged in length between twenty
and forty five minutes and all interviews except for one were audio-recorded and
transcribed.
As hypothesised by the purposive sampling frame, participants varied in terms
of their personal circumstances and experiences as well as age and number of
children. However, specific data was not collected on these demographic charac-
44
4. Devising the structural model: Results Stuart Nicholls
teristics and only spontaneously offered data is available. As the data comes from
a small sample it would be inappropriate to apply statistical notation, such as per-
centages, when discussing the thematic analysis and the number of respondents
who discussed particular themes. Whilst the intention was to interview parents
individually, on occasion partners were present during part of the interview. In all
instances additional consents were taken to include their input.
Seven key themes emerged from the interviews as being either explicitly or implic-
itly causally related to parental experiences regarding consent for newborn blood-
spot screening. These themes are classified as Experience, Attitudes to medicine,
Information-seeking behaviour, Perceived knowledge, Attitudes to screening, and
Perceived choice, all of which ultimately impact on Perceived decisional quality.
In the remainder of this chapter I discuss the themes that emerged from the in-
terviews and how these relate to parental attitudes towards their decision-making.
These are then drawn together in the proposed models that are to be taken forward
into the statistical analyses.
4.2 Information-seeking behaviour
Whilst the focus of this study is on parental decision-making to accept newborn
bloodspot screening and the factors that affect this decision-making process, an
important prerequisite is the information on which the decisions are based. This
information is important both in the theory and definitions of informed choice, but
was also talked about at length by parents when they discussed their experiences
of the heel prick.
Parents were found to gather or receive information at various times during the
pre-natal and post-natal period through a range of sources including friends, fam-
ily, books and the internet, each of which supplemented the information provided
45

4. Devising the structural model: Results Stuart Nicholls
by the midwife. Those parents who made reference to hearing about, or discussing,
the heel prick prior to birth were in the minority.
The interviews identified differing information-seeking practices which were broadly
classed as active seeking or passive receiving. Active seekers were those parents who
sought out information, often from sources other than the National Health Service
(NHS), and engaged with differing perspectives. Conversely, passive receivers en-
gaged in information that was presented to them, primarily by the midwife, but
did not necessarily forge their own avenues of enquiry. An active seeking behaviour
was clearly shown when one mother detailed her experiences:
“I: Did she give you anything to read, or was it just verbal?
JG: Verbal
I: And were you happy when she, to go with that?
JG: Well, yeah, ‘cos I looked it up anyway.
I: So you looked it up any way.
JG: After, afterwards - so erm, my friend’s a midwife as well
I: Ah right, OK I see
JG: So I asked her about it as well.
I: So where did you go and look it up?
JG: Internet” JG
Here the briefing by the midwife generated a number of issues on which the mother
then gathered information. The internet proved to be a starting point, but this
was then corroborated and supplemented with information from a friend who was
also a healthcare professional in the field. Whilst not taken as generalisable data,
those parents who had an active information seeking personality tended to be
those who were recruited on the hypothesis that they would be of a higher so-
cioeconomic status. However, this may not be causal as these parents were also
pro-active members of groups, such as the NCT and so it may be that membership
is indicative of having an active information seeking personality. Furthermore the
46
4. Devising the structural model: Results Stuart Nicholls
distinction was not clear between the hypothesised social groups and consequently
no definite conclusions can be drawn.
4.2.1 From whom and where do parents find out about the
heel prick?
As reported in previous studies, a range of information sources were used by par-
ents including official NHS leaflets, books, the internet, friends and family. The
most consistent reference was made to the midwife who played a central role in
information provision for parents. Parents cited difficulty in finding the time to
read written information during the post-natal period and the advantage of the
midwife, particularly for passive receivers, was that the visits provided an oppor-
tunity to gather information quickly during time that was already set aside. For
others a benefit was the ability to clarify points through discussion or gather ad-
ditional information that could serve as either an end in itself or a starting point
for further investigation:
“She was a source of information, but erm, certainly an important
source of information, erm, but I’m not sure I’d say she was a primary
one or not. Most of our decisions was informed by what [wife] had
already, already read, and then by discussions with [name] the midwife.
Erm, yeah I think there was a good level of discussion about it.”SPW
Despite the time constraints, for some parents written information, in the form of
books and magazines, was useful. Whilst the majority of parents recalled being
given an official NHS leaflet it was used by few parents to inform their decisions.
This lack of use was sometimes due to the way it was provided with other com-
mercial literature or left for parents to find. Thus, for some, written information
was provided not only at a time that made it difficult to use but also in a way
that failed to draw attention to it. For those parents who read the content proved
useful and in one case was their primary source of information.
47

4. Devising the structural model: Results Stuart Nicholls
The internet was not a great primary source of information for parents researching
the heel prick. The decision to accept the heel prick was straightforward and
the internet served a need only when researching a contentious issue, such as
vaccinations or pre-natal testing. In the context of the heel prick, the internet was
largely used as a supplementary tool for gathering information. One acknowledged
limitation to the use of the internet was a lack of quality control. One mother,
who sought information after not receiving any from the health service, recalls:
“I did look on the internet [...] but you don’t know, especially with
the internet, you don’t know what you should [...] take and not take,
because it could be very scary if you looked at that, you know what
things, the statistics and everything. You could get quite scared if you
looked on like one internet site, you know if you googled it and put it
in.” NW
Consequently there is a huge volume of information that could be gathered with-
out any form of guidance as to the relevance of that information to their own
situation. For others as with the written information, time, or lack of, is a factor
that precludes its use.
4.3 Experience
Personal experience and the experiences of others were implicated in various as-
pects of the decision-making process, ranging from the collating of information all
the way through to the actual decision itself.
4.3.1 Experience and information-seeking
A third of the parents interviewed were multiparous. For these parents personal
experience played a significant role in their information-seeking behaviour. For
some this effect was to reduce the amount of information they sought, instead
48

4. Devising the structural model: Results Stuart Nicholls
relying on their own experiences. Yet for others prior experience of ‘the system’
and processes of childbirth meant that they were able to overcome their previous
naivety and focus on the specifics of the information:
“I: So what’s changed this time?
LW: But this time, I think you change as a parent anyway and you
gain in confidence, so.
I: Why do you think that is, why do you think you’ve sort of, where
do you think you’ve got your confidence from?
LW: [laughs] Well it’s your child and you want to protect them at the
end of the day and make sure that everything’s right for them, you
know, and it’s learning that your views do count and learning that you
are the expert on your child, because at first I thought ‘oh my God I
don’t know what I’m doing’, you know, it was like shock horror and
then its, it’s learning.” LW
This experience meant that parents were able to not only question medical au-
thority, but also to have pre-emptively thought about situations that they would
face and prepare for these. Experience, however, was not limited to the process of
the heel prick. Other experiences of illness or the healthcare system were drawn
on by parents. One mother’s own health issues motivated her to try and find out
more information about congenital hypothyroidism:
“I was quite happy for them to do it, one of them, cos one of them,
one of them’s a thyroid wasn’t isn’t it? [...] And I did ask cos I’ve
got thyroid problems, and I did ask them about that one and they
didn’t give me any sort of [...] information on it. If it’s hereditary, or
anything, if she’s high risk because I’ve got an over active thyroid or
anything.” NW
Although this mother did not have a technical understanding of congenital hy-
pothyrodism, her own experiences of her thyroid problems led her to acknowledge
49
4. Devising the structural model: Results Stuart Nicholls
that this was something she wanted information about. She then sought technical
information from the midwife, although it appears that this desire for information
was not fulfilled satisfactorily.
Experience as a source of information
An important source of information for some parents is experiential knowledge.
This encompasses both embodied knowledge, that is subjective knowledge that
comes from one’s own personal experience, but also empathic knowledge which is
subjective knowledge gained through the interaction and association with others,
such as friends or family (d’Agincourt Canning, 2005; Etchegary et al., 2008). In
contrast to the midwife and the written resources, friends and family were rarely
used to gather technical information. When parents did recall discussing the heel
prick this had generally been limited to recollections of the process; how the baby
cried when blood was drawn and the emotions that they felt, rather than any
detail on the tests. As one mother recalled:
“Well, erm, I kind of knew about it through friends and my sister in
law, whose got two boys erm, five and two, so the littlest one was only,
[boy] was only sort of less than a year old when we found out that
[daughter] was on her way erm, and I remember there just being this
sort of dreaded day three, midwife comes to the house and, and you
just want to punch them. Was the general feeling I got from these
other mums because they’re making your baby cry kind of thing.”JM
This contextual information appears to serve as a process of preparation, allowing
parents to ready themselves for unfamiliar procedures.
4.3.2 Experience as a method of validation
Whilst experiential knowledge was sought, and as such one could argue that it
was their experience that made the information valid, the use of experience as
50

4. Devising the structural model: Results Stuart Nicholls
a way to validate information was not restricted to friends or family. In some
instances parents appeared to be using experience, assessed through a proxy of
age or number of years in a particular field, as a way of validating the information
that they had received and so determine its legitimacy.
“I think they’re probably as important, because I’m quite close to my
parents and, and obviously being that close to somebody who has had
children, mum was, mum was very useful, and also my husband’s mum
er was very useful as well, cos she’s a nursery nurse and has loads of
experience so yeah.” SMB
So, for this parent, the experience of her mother-in-law within her role as a nursery
nurse is a method of validation for the information she provides. Trust was placed
in the individual, and this individual trust is generated not only by regulatory
identifiers, such as qualification or association to an institution that implies both
competence and worthiness, but also through experience and interaction. This
was explicitly stated by one mother who had cited the midwife as an information
source:
“I: Erm, is there anything about the fact that it was sort of the midwife
that’s good, other than the fact that she works at the hospital, is there
any other benefits that you can think of?
NW: Well I think because she’s know, with a baby, she’s more, she’s a
bit more experienced isn’t she.” NW
Thus the experience of the midwife was linked to competency and trust and as
such an additional tool of validation alongside her qualifications.
4.3.3 Assumed knowledge with experience
Whilst parents saw positive aspects to their experience in assisting them to make
their decisions, it was also indicated that when experience, and particularly knowl-
edge gathered through experience, was assumed, this could lead to them being less
51
4. Devising the structural model: Results Stuart Nicholls
informed. In part this was due to professionals assuming that the parent would
know about the heel prick:
“[...] I actually don’t remember being told the details as much that time
[with 2nd child], now whether that’s because they said do you know
what the heel prick test is, to which I’ve gone yes, because obviously
they’ve done it before so they’ve just thought OK, take the blood and
send it off. That’s possible, that once you’ve had one child a lot of
details are then skimmed over, that they just assume. I, and I probably
assume, ‘oh yes I know’ when actually, really, if you’d have dug a bit
deeper I actually didn’t really know what it really was.” LM
This is reflected in the way that parents often had greater recollections of their
first child having their heel prick than their second. The assumption within re-
cruitment was that the heel prick would be fresh and clear in their mind. Here the
suggestion may be that even when parents have a second or third child, it is the
experiences of their first that may be more lucid.
More concerning though is the way that this parent (LM) reported the assumption
of knowledge by professionals. Consent was experienced as less thorough for their
second child where it was felt that the professional assumed that they knew about
the screening, resulting in potentially less thorough information provision. If this
is the case more widely then it raises serious questions regarding the informed
nature of any consent provided by multiparous parents.
4.3.4 Experience and decision-making
For some parents the decision to accept screening was largely based on their pre-
vious experiences with the heel prick. For those multiparous parents (N=6) the
decision appeared straightforward:
“She went through it very briefly with me and explained about the
52
4. Devising the structural model: Results Stuart Nicholls
different reasons for doing the test and I’d had the test done on [son]
and we’d already made that decision with him so to make the same
decision with her was much quicker and easier like yeah, yeah, whatever
come on, come round and do it [...]” AG
And later:
“But it was much easier for me to decide for her to have it done than
with [son] and we went through quite a lot of erm, [...] grief and research
and soul searching with [son] the first time about immunisations and
testing and amnio, all those sorts of things but when it’s second time
round you’ve already been through that decision making process, so
it’s like are we gonna do what we did the first time or have we changed
our mind here so in a lot of ways it was an easier.” AG
This perspective, of reviewing the experiences of their first child and basing their
decision on that experience, was replicated in other parents. Thus whilst experien-
tial knowledge from friends, family or professionals was an important information
source, when this experience was personal there appeared to be far less delibera-
tion or conflict. As suggested, this may be reflected in the ability to recall more
clearly the heel prick from their first child.
The caveat here is that these parents had not previously had an adverse outcome
to their decision, or a decision which they had regretted. Had this been the case
it may have been that personal experience would have had a different effect on
decision-making.
4.4 Attitudes towards medicine
For some mothers the decision to accept screening was informed through more gen-
eral attitudes towards medicine. These attitudes were often affected by their own
53

4. Devising the structural model: Results Stuart Nicholls
experiences of the healthcare system and their perceptions of how the healthcare
system in the UK works. In particular this was linked to a perceived knowledge
of the processes through which testing becomes available:
“[...] they don’t do these tests just for the sake of it. You know, and the
ethics, and all of the things they have to go through to be able to do
these things they, you know, it’s obviously enough historical evidence
to prove that by doing this, a bit like cervical screening and breast
screening, you know they’ve obviously got evidence to prove that ‘if we
do this at this point in their lives, we’ve got a better chance of finding
it, diagnosing it, and treating it without it becoming too much of an
issue further down the line’ ” JM
Consequently, a positive attitude towards medicine and testing was reflected in
positive attitudes towards screening. This was occasionally framed by the financial
constraints within which the NHS operates:
“SB: Yeah, yeah. They obviously know what they’re doing, they’re
trained professionals and they wouldn’t just rou... you know cost wise
and things like that, do these things if it wasn’t necessary. You know,
knowing the way the NHS is and things like that, I couldn’t see them
doing it just for something to do.
I: Yeah. Sorry, what do you mean, you said knowing the way the NHS
is?
SB: Doesn’t, with funds [...] You know, they all seem to be short of
money, you know when they, you know, you want these cancer drugs
and that but they say they can’t afford it and things like that. So I
shouldn’t imagine something like that would be carried out unless it
was absolutely necessary.” SB
Without explicitly mentioning Herceptin or similar medicines, this parent has
neatly summed up the perception of the approval process. This perhaps clarifies
54

4. Devising the structural model: Results Stuart Nicholls
the behaviour of parents who accepted screening without seeking much informa-
tion. By virtue of screening being offered by the NHS, it is perceived to have been
reviewed and assessed to a level whereby the NHS is happy to provide it, which
indicates to parents that this is a good thing to have.
Decisions were not solely made on perceived knowledge of the wider processes of
the NHS, but also more intimate aspects of personal contact. Whilst the midwife
was an important source of information she also played a significant role in parents
accepting newborn bloodspot screening. For some parents, as was the case with
information provision, the offer by the midwife suggests a level of quality and it
was trust in the midwife who was offering the test that led them to accept. As
one mother explains:
“I: And did you think about it between them forewarning you and
actually doing it?
SP: No
I: No?
SP: I think that because of who it is telling you, you just assume it’s
OK.
I: Yeah
SP: And that it has to be done and that, you know, it’s just a routine
thing and there’s no issue with it.
I: So because it’s the midwife you kind of just...
SP: Trust, yeah.” SP
Thus, the offer by the midwife suggests a level of quality that in turn provides the
parent with a trusting relationship. Trust in the midwife was built through their
presumed qualifications – a presumption based on their affiliation to hospitals and
the NHS more generally – together with parents’ expectations of training. Ability
was demonstrated through knowledge, itself assessed by answering questions or
providing information. This was combined with personal qualities to generate
55

4. Devising the structural model: Results Stuart Nicholls
trust. These personal qualities were demonstrated through the interaction with
parents:
“I: And do you think, maybe, if she couldn’t have answered your ques-
tions there and then it would have been a bit...
JS: Yeah, yeah, well, it depends. I mean obviously if I would have asked
her a question that’s not, is something that she’d need to research, if
she would have said I need to research that, then that would have been
fine.” JS
So a level of personal reflexivity and honesty was deemed to be important, even
if that was to the detriment of the immediate level of information she could provide.
Whilst trust in the midwife and the NHS was relatively high, parents were less
trusting of administrative aspects of hospitals. In particular, concerns were raised
over the provision of results. Parents recalled being told that ‘no news is good
news’ and that they would only receive results if there was anything of concern.
This raised concerns in parents who would have liked to have received confirmation
either way:
“Because I don’t feel you can trust, erm, I always think, what if, some-
thing goes missing, or doesn’t get done, then you wouldn’t know. Be-
cause when, when I was waiting to find out, I had the down syndrome
blood test, the triple test, and erm, obviously they said ‘if you, if you
haven’t heard within two weeks or so then, then consider it to be fine’.
So obviously nothing came, nothing came, nothing came, and then
when I went back for the next antenatal visit I said err, can I just
check on my down syndrome results, they couldn’t find them. They
weren’t in my file, so they had to ring the lab, and then they had to
write them down on a piece of paper, and I really wasn’t happy about
that. I just thought, well what if it happ...I mean, what if it had been
a problem?” HP
56

4. Devising the structural model: Results Stuart Nicholls
The concerns were not unwarranted and again drew on individual experiences
in developing their attitudes. The examples given also show how the attitudes
towards midwives, and the NHS more generally, can interact with specific attitudes
towards screening and information-seeking behaviour; both of which are important
in parental decision-making.
4.5 Perceived knowledge and understanding
Parental knowledge was not assessed through direct questioning. Given the short-
comings of knowledge assessed by recall, parents were asked to relate their own
perceptions of their knowledge. When talking about their experiences of the heel
prick, parents commented on their own perceived knowledge. Most parents were
self-deprecating, with a number openly stating that they could not remember any-
thing:
“I have got no idea, er, and I didn’t even remember it erm, until I
spoke to my partner and said erm, I’m going to do this interview and
what it’s for and he said oh is that the one that was done in the house,
so I think he remembers slightly better than me, and that’s obviously
because you haven’t given birth to anyone.”SP
In particular parents sometimes felt they had a poor technical knowledge, unable
to recall details such as the exact names of the conditions, the specific preva-
lence or similar. To this end several mothers suggested that severe tiredness was
detrimental to their ability to remember details. As one mother explained:
“But when you’ve just got a new baby you, you’re knackered aren’t
ya, and you’re looking after the baby and just cos I’m, I couldn’t, I
couldn’t have told you the next day and, you just forget.” LT
Others talked about how physiological or psychological changes, such as hormones
and emotions, affected their memory:
57
4. Devising the structural model: Results Stuart Nicholls
“Because when you have a baby your hormones are completely gone
for the first two weeks aren’t they, so, which is probably why people
can’t remember what the heel prick test was actually for.” LW
It should be remembered, however, that only one parent had a child with a screened
for condition. It may well be that parents of unaffected children have a decreased
knowledge, possibly due a perceived lack of need to remember details. Parents
of children who are affected by the screened for conditions may have a greater
knowledge, particularly for the condition which affects their child.
Despite this self-professed lack of technical knowledge, when parents began to talk
about the heel prick, many exhibited some knowledge about the screening. This
was often knowledge about the implications of the screened for conditions. One
mother, who proclaimed to have little knowledge, revealed a clear understanding
of the effects which she had considered in her own context:
“Yeah, I just recognised it when erm, and I think also PKU, I’m sure
I’d seen something on television about it, I can’t remember what, what
it was, but I do remember somebody on TV talking about the diet their
child had to have with these special protein supplements and things so,
that just stuck in my head as a condition that’s qui.., could be quite
difficult to manage in day to day life.”HP
This knowledge was sometimes presented in their understanding of why the heel
prick was taken. This occasionally included what may be viewed as technical
information:
“Yeah, because I think knowing erm, the conditions that were being
tested for and knowing that they were erm, metabolic disorders, and
knowing that they could easily, well I’m saying easily, but knowing
that they erm, could be treated with either diet or medication, then it
58

4. Devising the structural model: Results Stuart Nicholls
would be much, much more beneficial to have the test than to decline
the test.” LH
“I can’t remember if it’s this one, is it to do with finding out certain, if,
if ya child can only have certain food, foods and stuff like that, yeah.
That’s the only thing I can really remember really. And obviously if
they, if they find out at this early stage then it can, then it can erm
be very beneficial and it can basically, you know, eradicate any sort of
future problems, can’t it, and things like that.” KS
The indication here is that whilst memory may be compromised, the parents un-
derstanding of implications is not. A corollary of this is that traditional methods
of memory recall would have failed to capture this level of understanding. So
whilst it may be argued that parents have a poor knowledge due to their inability
to recall technical information such as risk figures, this obfuscates a more complex
process of information integration and understanding.
4.6 Attitudes towards screening
As already detailed, general attitudes towards the NHS and the midwife appeared
to dominate attitudes towards newborn bloodspot screening. This, however, was
not unilateral and for many parents, particularly those active seekers, a more
considered approach to risks and benefits was taken in developing their attitudes
towards screening.
4.6.1 Risks
Whilst potential concerns were raised, these were all perceived to be low risk. The
main concern voiced by parents was the potential pain that would be inflicted
upon their child. This was often revealed when parents were asked if there would
be anything that would stop them having their child screened:
59

4. Devising the structural model: Results Stuart Nicholls
“Erm, maybe if there was quite bad side effects or something for the
child or it could, I don’t know if, if it was erm, probably just that
really, or it, you know, cause harm in any way and stuff, which, I know
it’s not nice for them to suddenly get their foot pricked with a, when
you’ve only been out of the erm your belly for two minutes and they’re
like getting poked and prodded aren’t they and things like that but
yeah, I suppose if it caused any damage really to the child, yeah.” KS
The focus on the potential for distress and the effect of the disease may reveal
why parental knowledge of this and procedural aspects were greater than other,
technical, aspects. Despite these concerns, the actual risk of distress was seen to
be minimal:
“Erm, yeah, but it’s something that you know’s not gonna...and it’s
short term it’s, you know, and they’re not going to be psychologically
marred by it for the rest of their lives, erm, and you can comfort them.”
LH
This perception was strengthened when they were provided with information as
to how they could take steps to minimise the distress to their child:
“It was things like this sort of what’s, I was reluctant to, to, stab a
newborn baby and cause it distress for a relatively small benefit, but
she was able to reassure me, I had heard of the erm tenderfoot and
she said that’s what she used and that a lot of babies didn’t feel it,
especially if they’re feeding at the time she did it.” PW
One particular factor that affected the perceived level of distress was parental
opinions on the cognitive abilities of the child. The benefit was that at such a
young age the child would not remember it and so not be adversely affected.
60
4. Devising the structural model: Results Stuart Nicholls
Perceived risk: better out than in
Some parents spontaneously compared the heel prick with the measles, mumps
and rubella (MMR) vaccinations which are offered. This distinction was based on
the experience of the child but also on issues of risk and safety:
“[...] also I think because there’s a chemical element to the MMR and
all the vaccines you go for, whereas the heel prick’s very straightfor-
ward, erm, you know, it’s literally just taking the blood isn’t it and
testing that blood [...] externally, so, erm, it’s not, you know, if you’re
not filling your child with something that you don’t necessarily think
that would, that they would have anyway, that’s an unnatural ele-
ment, then I think that’s more questionable than, than just kind of
like a small scratch [...]” SMB
This safety related to the spatial location of the testing, with the screening done
outside of the body and so posing little or no risk to the child. MMR was seen as
more risky by the parents who raised it, with pain caused by boosters and uncer-
tainty about the possible side effects and adverse consequences.
Accordingly, parents were found to view the heel prick as a minimal risk inter-
vention. In line with their own expressions of knowledge and understanding, the
procedural aspects appear to weigh most on their minds in terms of any poten-
tial harm or benefit that may result. This was not only to be influenced by
their information-seeking behaviour and the sources from which they received the
information about the heel prick, but also their own ethical beliefs regarding min-
imisation of harm and maximisation of benefit.
4.6.2 Benefits
Whilst risk was weighed in terms of harm from the process, benefits were weighed
on the basis of the diseases being treatable. This was conveyed when parents
61
4. Devising the structural model: Results Stuart Nicholls
were asked about the possibility of screening for non-treatable conditions and for
which some parents saw little benefit. Whilst treatability has been reported as
an important concept (Natowicz and Zuckerman, 2009), this was found to be
a subcategory of what I shall call the ability to act ; that is parents could do
something with the results from the screening:
“SPW: I would have said that was a low, a low priority if you can’t
really do anything.” SPW
The important aspects were practical steps that could be taken.
“[...] in a way you see with a result from a test like that you’re knowing
something that you’re going to know anyway about baby eventually so
you want to know earlier and it’s better to know very early....the process
[...] You would have found out anyway eventually erm [...]” JG
Testing earlier rather than later was supported in terms of knowledge being gath-
ered earlier, allowing treatment to progress. This knowledge was also beneficial
as it was felt to help parents cope. Knowledge of disease as a method of coping
emotionally has been invoked by some commentators as a reason for expanding
newborn screening (Bailey et al., 2006). In the current context it may also be seen
in terms of adopting treatment strategies that would allow them and their child
to deal with the disease.
4.7 Choice
When discussing the heel prick with parents it soon became apparent that the ini-
tial conceptualisation of parents conscientiously considering information, making
a decision based on this information and then enacting this decision, was not only
overly simplistic but in some cases erroneous.
62

4. Devising the structural model: Results Stuart Nicholls
4.7.1 Routinisation
For most parents the offer of the heel prick was experienced as routine. That is,
parents experienced the offer not as a distinct event that existed as something that
one could opt for but something that was done to everyone. As one parent stated:
“They said they need to do some, something routine, I think I signed
something, erm, and then, they said they needed to do a couple of
routine tests...” SP
This was perpetuated by its inclusion with other post-natal checks. The fact that
the other checks were readily accepted led some to the conclusion that the process
was an automatic one. This assimilation of optional tests with more ‘routine’ ones:
“may contribute to an interactional context in which screening itself is
also perceived as routine, and where any decision to be made is taken
less seriously as a result. (Pilnick, 2008, p523)
This normalisation can be seen in the way parents talk of the processional nature
of screening:
“It was just, as I said, it was just one of those things that was all part of
that, all of this, this big machine that happens as soon as you, as soon
as you have a baby. You know, things like the health, triggering all
these visits from people...its just, not like a tread mill but you realise
that you are part of this as I said, system.” HP
In some instances this led to a view that the goal was that parents comply with
policies and practice. The potential effect of routinisation is that consent to screen-
ing may not be informed. In particular this could be detrimental to those passive
information seekers where the midwife may be the only source of information.
63
4. Devising the structural model: Results Stuart Nicholls
4.7.2 Dualistic representations: importance and insignifi-
cance
The way in which screening was presented or talked about was seen as important by
parents. Parents talked about the heel prick being presented in a way that sought
to maximise uptake and minimise concern. As already suggested, the presentation
of screening as routine served to suggest it was insignificant. This was compounded
by the way that midwives talked and were dismissive about susceptibility and
likelihood:
“Erm, [long pause] I think...the way it’s offered can throw people a
little bit. If it’s offered in a way that they’re almost expecting the
results to be negative, you know that, in as much as, as if you, if ya, if
you hear the, the, the ratio of it being picked up, the ratio of it being
in the population as being very, very low, erm, so as a result there’s a
very low risk of your child having this disorder, then you’re going to
go along with it.” LH
Couple this with the way that the information is often provided, amongst other
leaflets or talked about amongst other tests, and the test appears insignificant.
Yet this was counterbalanced with the importance placed on the heel prick by the
midwife, with parents not only interpreting it as important, but also explicitly
recalling being told this.
“If anything because of the way she brought, you know, approached
certain, the way she explained it, and what it was for and stuff, and
it made ya think oh yeah, and obviously it must be important that it
needs, you know having, needs to be done.” KS
This perception was enforced by the fact that the midwife actively recommended
the screening:
64
4. Devising the structural model: Results Stuart Nicholls
“[...] So I do remember them saying erm, well I don’t remember them
to be honest even saying it was real, well they must have said it was
voluntary although I think they do say that it is very, very recom-
mended that you do have it, and I do; I think, although I could be
totally wrong, that I have a vague idea of why they do it.” LM
As a consequence one can see how the perceived routine nature of screening; that
it is offered to everyone in a way that does not draw attention to it, together
with a firm recommendation that one should have the test, contrives to suggest to
parents that the test should be taken.
4.7.3 Perceived choice
Parents recalled being told that “we’re going to come and do this...” and so, as
reported in other studies such as those by Parsons et al. (2007), screening was
seen as a fait accompli. Indeed several parents prefaced their interviews by saying
that they hadn’t considered the screening a choice. The implication of this is that
rather than providing an informed consent parents may simply be providing an
assent to screening.
4.7.4 Constrained choice, competence and coherence
For some, the timing of the heel prick meant that actually making a considered
and informed choice was difficult, if not impossible. This difficulty was clearly
articulated by one mother who had only received her information post-natally:
[...] I don’t think you’re given any time cos your just told that they’re
going to do it and they need to do it, [...] They don’t say we’ll leave it
with you to think about and read, the literally say, bllllr the test and
right here’s the needle and they’re about to take the blood. So it’s a
very very quick process and you’re not given any option to think about
it.” LM
65

4. Devising the structural model: Results Stuart Nicholls
For others the difficulty lay in other aspects of the time, with some questioning
their ability to focus and make a decision:
“After you’ve given birth it’s such,...well for me it was quite traumatic
really [...] I think just my emotions kicked in, hormones or something
like that. So I was, I felt more of a sound mind when I was going to
antenatal” SB
This has potentially significant ramifications for any purported consent that would
be given. As one parent explained:
“[...] I didn’t question it. Probably when, when, my natural way would
have been to question it and say why is he, why is it, what and get a
bit more information about it, but you just go ‘oh OK’. You’re a bit
bewildered aren’t you when you’ve just had a baby. And your husband
isn’t normally there because they come in the day.” LT
For this mother the decision to accept the screening, without questioning or looking
into it, was out of character and one may question whether this was an informed
consent. This issue was raised by one mother who questioned whether she would
have been in the same frame of mind then as she is now, some time after the birth.
“Mmm. No, OK. But if, if they were gonna do a heel prick test to-
morrow [...] On [daughter] I think I would erm, yeah my er, my, my
thoughts about it might be different I suppose than to one day after
giving birth to her [...] Erm. You know, I’d probably like to think. If
you asked me at the time I’d probably think oh yeah, well don’t be
so ridiculous, of course I’m coherent of course I can, you know, you
think you’re pretty amazing once you err, the day after you’ve given
birth actually [laughs], yeah, yeah, you’re pretty infallible really so err,
dunno.” EA
66

4. Devising the structural model: Results Stuart Nicholls
The suggestion from these parents is that the timing of newborn screening infor-
mation, which for most parents in this study took place after the birth of the child,
was potentially detrimental to them giving of an informed consent. This alone may
bring into question whether an informed choice was given, but coupled with the
perceived lack of choice that parents also reported, this potentially raises serious
questions about whether at least some parents are providing informed consent to
newborn bloodspot screening.
4.8 Decision-making and decisional quality
For some the decision to have the screening had been made prior to the formal
provision of information. Despite having made their decision these parents wanted
to know about the implications of the decision. In explaining this, one mother
suggested that there is a perceived need for testing that doesn’t necessarily have
to be informed prior to making the decision:
“I: Yeah. Was that, did you speak to her at the same time or was that
before or after.
JG: Same time, around the same time so a mixture of all of them - it
wasn’t gonna change my decision though.
I: No, you’d made your decision.
JG: Yeah, but I wanted to know what I was letting myself in for.
I: OK, yeah, it was more about preparation rather than making your
decision.
JG: Yeah, yeah, yes definitely.
I: Right, so with the [JG talks to friend about coffee] so with the erm,
decision you said it was sort of, you wanted to make sure everything
was all right, was there anything that stood out that ‘oh this is an
important thing because x’ that made you say yes - was there anything
in particular?
67

4. Devising the structural model: Results Stuart Nicholls
JG: No ‘cos I’d made my mind up before that before I knew about the
information.” JG
The decision to accept the screening appears to have already been made by this
mother and on the basis of a predetermined principle. In exploring this the mother
states that:
“I think it’s just because of the person I am I think I hadn’t wanted
to refuse any tests for [daughter]. I do for me because I, I’m making
the decision for myself, but for [daughter] and I think I had to consider
my partner as well [...] I knew what he would say anyway as he would
want all the tests erm, but erm, I wanted to find out what the thinking
was current thinking about it.” JG
And later
“I:[...] you say you wanted to accept all the testing, was that because
you had a, it was sort of testing’s good an it’s there for a reason or was
it something else?
JG: Yeah, I think I’d been brought up like that [...] And with my train-
ing as well erm, it’s there for a reason, when I read the article about
pain I erm I sort of, I did hesitate. [...] ‘Cos I like to be unconventional
as well, as much as possible, but I like to be safe.” JG
Thus the process of active information gathering for this parent is not to inform
the decision, the decision has already been made to accept the screening, but to
make that decision an informed one. The driver behind the decision is a predeter-
mined principle, beneficence. Beneficence has been described as “a group of norms
for providing benefits and balancing benefits against risks and costs” (Beauchamp
and Childress, 2001, p12) and was seen to be invoked by parents as a reason for
screening on the basis that treatment was available. In this instance it appears
that attitudes towards medicine in general are determinants of the attitudes to-
wards screening, and as such no specific information about screening is required.
68

4. Devising the structural model: Results Stuart Nicholls
A positive attitude towards medicine, together with a general attitude to act to
maximise benefit, saw this parent accept the screening on principle, and then in-
form themselves by gathering information.
This support of beneficence appears in contrast to the principles invoked earlier in
the pregnancy:
“Cos I wouldn’t be getting rid of it anyway, so I wouldn’t bother. But
once you’ve had the baby, you’ve got it, you want to cope with it [...] I
suppose then it wouldn’t matter [...] Cos you need to know, wouldn’t
you, if there was something wrong but you didn’t know what” NW
“I know it’s really weird, but the sixteen week test I don’t, wouldn’t
wanna know because I’m having the baby anyway [...] But when she’s
born, I’d rather know if there was anything wrong with her to try and
treat her.” LW
So again, post-natally there is a focus on acting on information and actively-seeking
testing. This is a change from pregnancy when the principle of nonmaleficence;
that is the norm of avoiding the causation of harm (Beauchamp and Childress,
2001), appears to be invoked so that they do not cause harm to the child through
the application of potentially risky testing. Once the child is born, a level of risk,
or even harm, is to be tolerated so long as the perceived benefits outweigh these
risks or harms. Yet beneficence was not all conquering, and the specific context
may mean that detailed information about the process can still be important. In
describing her encounters with clinicians regarding the provision of vitamin K one
mother noted that:
“[...] when we were in hospital the first time we said we didn’t want
him to have the K, vitamin K injection [...] And erm, there was this
big gasp of you know, well nobody says they don’t want it [...] It was
really really strange so I thought well its a bit odd really an they just
69
4. Devising the structural model: Results Stuart Nicholls
thought well why don’t you want it, I said well I don’t want him to
have injections and there is an alternative and they can have it orally
[...]” AG
Hence, for this parent, the availability of alternative modes of delivery meant that
the principle of nonmaleficence was again invoked, suggesting an interaction in
parental reasoning. Whilst there is a low perception of distress and the lack of
alternatives it may be that the principle of beneficence is of greater consequence.
With a greater distress/benefit ratio and alternative forms of administration then
the principle of nonmaleficence becomes more prominent until a tipping point is
reached whereupon parents are no longer willing to proceed. All of which suggests
that there is a complex process of checks and balances covering not only the calcu-
lation of risk estimates in terms of likelihood, but also size of effect and potential
alternatives as well as underlying principles that parents assess when considering
the heel prick.
4.9 Summary
Parental decisions were found to have a range of influences, with these influences
weighing differently for different parents. Taking these thematic analyses as the
starting point, and assessing how different narratives were linked, a composite was
developed in order to produce the proposed causal maps of influences on parental
decision quality for newborn bloodspot screening.
4.9.1 Model 1
Figure 4.1 proposes that experience (EXP), informed by prior personal experience
as well as those of friends and family, affects parental decisional quality (DCQ)
indirectly through its effect on attitudes to medicine (ATTMED) and information
seeking behaviour (INFSK). This proposed relationship can be seen in the way
that positive attitudes towards the midwife and the NHS were reflected not only
70
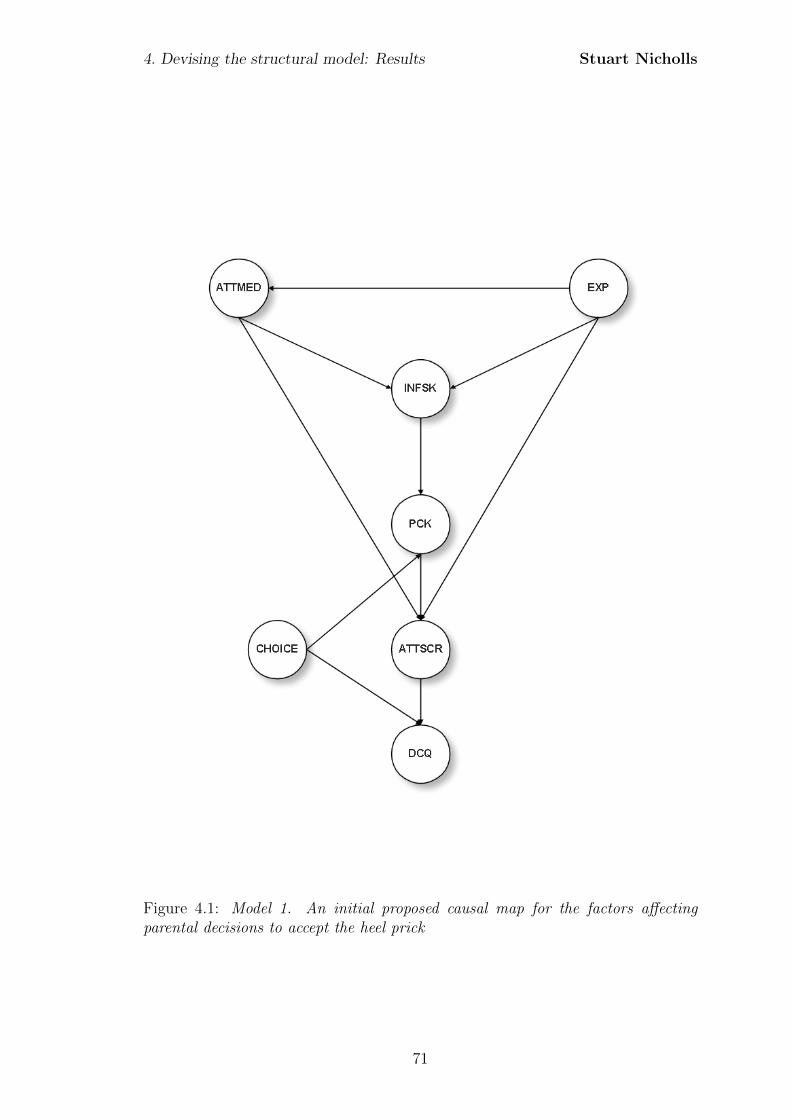
4. Devising the structural model: Results Stuart Nicholls
Figure 4.1: Model 1. An initial proposed causal map for the factors affectingparental decisions to accept the heel prick
71
4. Devising the structural model: Results Stuart Nicholls
in the use of the midwife as a primary information source but also with a theoret-
ical reduction in information-seeking; those parents with more positive attitudes
towards the midwife or hospitals discussed fewer information sources suggesting
a decrease in information-seeking behaviour with increasing positive attitudes to-
wards medicine. This corroborates with the classification of those parents as pas-
sive receivers. The analysis here also suggests that parents with multiple children
may rely on their own experience more than other information sources, again po-
tentially reducing information seeking behaviour. This finding gains some support
from research into decision-making for prenatal testing in which relevance of per-
sonal experience was a significant factor in decisions relating to prenatal testing.
(Etchegary et al., 2008; Potter et al., 2008). For some parents experience was
reported as allowing a greater focus on the information provided. Both of these
scenarios implicate experience, personal or otherwise, in the decision-making pro-
cess.
Perceived knowledge (PCK), is postulated to be affected by experience indirectly
through its relationship to information-seeking behaviour and attitudes towards
medicine. As argued in Chapter 2, assessment of knowledge through recall of
specific information is problematic. From the discussions with parents perceived
knowledge is proposed to be more appropriate to perceptions of decisional quality.
Perceived knowledge is argued to have a causal relationship with attitudes towards
screening. This proposed relationship is demonstrated by the way parents demon-
strated knowledge about implications of the diseases when discussing attitudes
towards screening at birth.
Attitudes towards screening (ATTSCR), derived through perceived risks and ben-
efits, are deemed to have a direct influence on decisional quality. This was ex-
emplified by those parents who made a conscientious risk/benefit analysis. How-
ever, this may have been informed by attitudes towards medicine with positive
72
4. Devising the structural model: Results Stuart Nicholls
attitudes towards medicine more generally being reflected in positive attitudes
towards screening. Consequently, attitudes towards screening are posited to be di-
rectly dependent on general attitudes towards medicine but also mediated through
information-seeking behaviour and perceived knowledge.
Attitudes towards screening are hypothesised to have a direct impact on perceived
decisional quality, with those with less certain attitudes anticipated to identify
with a reduced perception of decisional quality. This perception of the final de-
cision, however, is also suggested to be impacted on by the perception of choice
(CHOICE), with those parents viewing their consent as being poor quality hypoth-
esised to show a reduced perceived quality of the overall decision. This quality of
consent may be demonstrated through parental perceptions of choice or perceived
capacity to make a decision, both of which were issues relayed during the inter-
views.
4.9.2 Model 2
Model 2 is similar to model one except that information-seeking behaviour and
experience are no longer proposed to have a causal influence on perceived deci-
sion quality, neither directly nor indirectly, and attitude to medicine is proposed
to have a direct causal relationship with perceived knowledge. This is congruent
with the supposition that decisions are largely principle-based rather than based
on specific information about the screening. The model also proposes a direct
relationship between perceived choice (CHOICE) and attitudes towards screen-
ing (ATTSCR). Choice is also proposed to have a direct influence on perceived
knowledge, with the proposed relationship being that those parents who perceive
that they have a choice being more likely to have a better knowledge. Parents who
don’t perceive a great choice are proposed to be less likely to have a good perceived
knowledge, possibly due to a perceived lack of need to be informed. Furthermore,
the relationship with the midwife is proposed to be influential on the basis of the
73
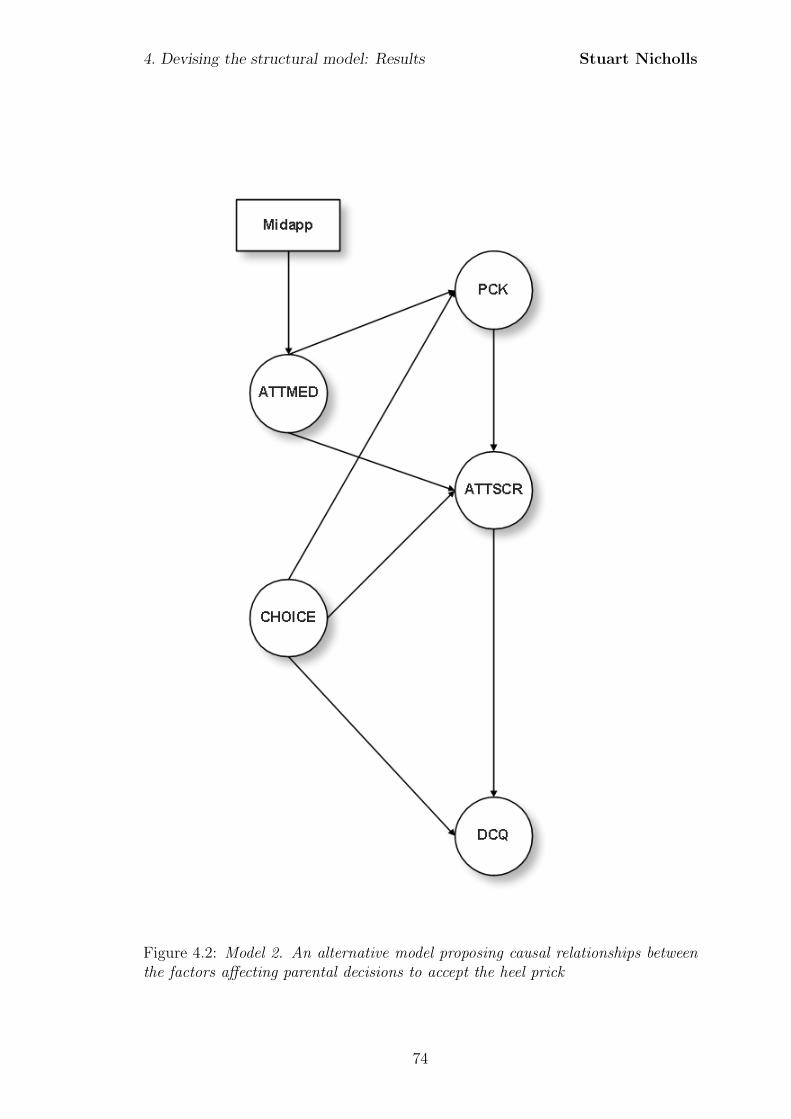
4. Devising the structural model: Results Stuart Nicholls
Figure 4.2: Model 2. An alternative model proposing causal relationships betweenthe factors affecting parental decisions to accept the heel prick
74
4. Devising the structural model: Results Stuart Nicholls
comments made by some parents about why they didn’t seek further information.
Consequently the number of times they saw the midwife is suggested to be integral
to the relationship; where seeing the midwife more often increases the strength of
feeling about the relationship, and so is included within the model and proposed
to have an effect on their attitudes towards medicine.
4.9.3 Model 3
The final model, shown in Figure 8.6, proposes that attitudes to medicine (ATTMED)
and attitudes to screening (ATTSCR) are not exclusive concepts. Instead it is
proposed that a single latent constructs of attitudes to medicine (ATTMED) is a
determinant of responses relating to trust and specific attitudes towards screening.
Again the midwife relationship is proposed to be integral to the determination of
these attitudes.
These models lay out the proposed mechanisms through which the latent con-
structs interact and culminate in the perceived quality of the parents’ decision to
accept newborn bloodspot screening. These proposed relationships, together with
the compositional elements derived from the interviews serve as the starting point
for the development of the questionnaire and subsequent analyses detailed in the
upcoming chapters.
75
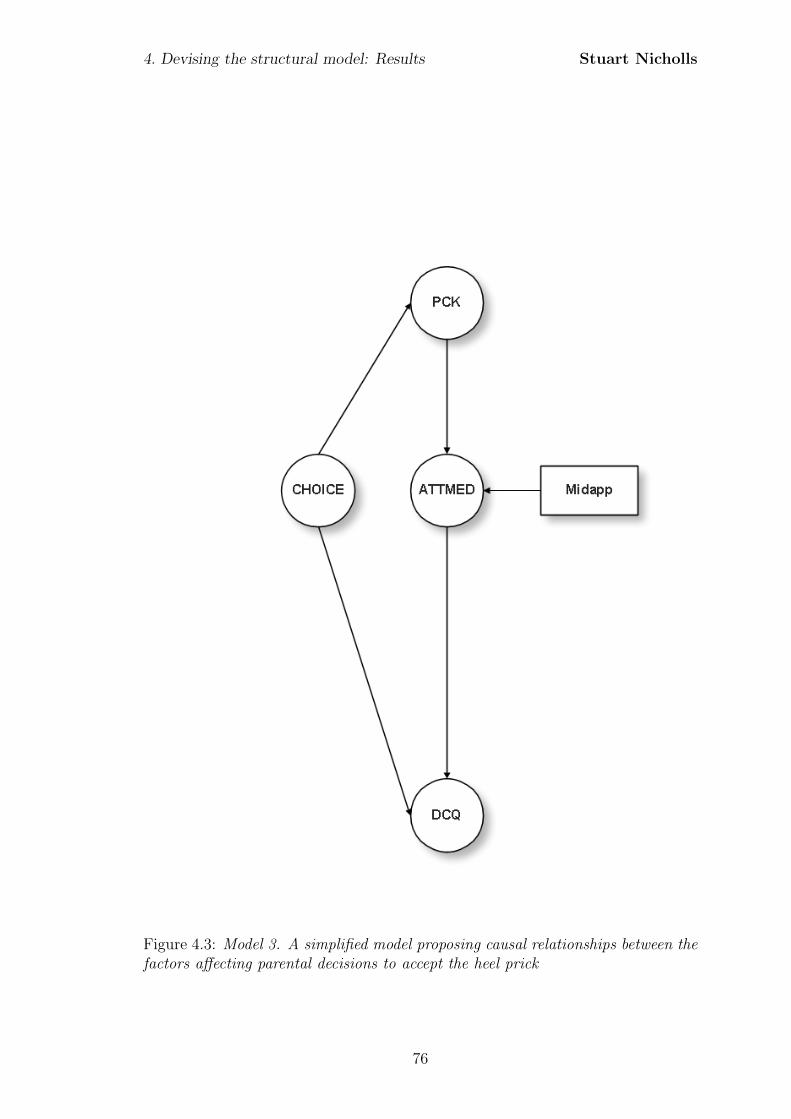
4. Devising the structural model: Results Stuart Nicholls
Figure 4.3: Model 3. A simplified model proposing causal relationships between thefactors affecting parental decisions to accept the heel prick
76
Chapter 5
Defining the measurement model:
Methods
5.1 Introduction
The aim of the first phase of the study was to gather an understanding of the
parental experiences of newborn bloodspot screening and how decisions were made
regarding whether or not to consent to having the screen. The outcome of this first
phase was an understanding of the factors that parents identified as affecting their
decisions and the way in which these interacted. This culminated in the proposed
causal models presented in Chapter 4.
Despite the strengths of these findings, and the explanations they provide about
the influences on parental decision-making about newborn screening, they provide
little insight into the strength of these influences across populations. In order to
gain insight into this one needs to conduct statistical analyses to provide explana-
tions of the generalised patterns, or demi-regs (Lawson, 1997), that appear within
the larger populations. To collect this data parents completed a postal question-
naire the results of which were analysed using structural equation modelling.
77
5. Defining the measurement model: Methods Stuart Nicholls
5.2 Why a questionnaire?
Questionnaires are highly structured tools. This structure comes not only in the
successionist approach to the question sequence but also the finite and fixed set of
responses which are available to the respondent. A limitation of this is that one
has no way of probing or clarifying interpretation of the questions. Furthermore,
with self-administered surveys one cannot guarantee that the individual complet-
ing the questionnaire is indeed the person to whom the questionnaire was sent.
Postal questionnaires also suffer from a much lower response rate than interviews
(Weisberg et al., 1996; Bryman, 2004; McColl et al., 2001).
So, given these limitations, why conduct a postal questionnaire? Perhaps the
overwhelming argument for the use of this methodology, in appropriate circum-
stances, is the fact that a very large number of people can be contacted over a
large geographic area in a relatively short space of time, at least in comparison to
the amount of time that would be required to conduct an equivalent number of
in-depth interviews (Bowling, 2004; Bryman, 2004; Czaja and Blair, 2005). Fur-
ther benefits include the removal of any potential interviewer bias and that some
people may be willing to complete a questionnaire on the basis that the data is
usually anonymous and aggregated (Bowling, 2004). Another potential advantage
to using a postal questionnaire is that respondents can complete the questionnaire
in their own time; even doing so in stages. In the current context this could be
a potential benefit as the questionnaire could be completed in evenings once the
child is asleep.
5.3 Questionnaire development
The development of the questionnaire included formal peer review by the Research
Review Committee at Royal Liverpool Children’s Hospital NHS Foundation Trust
in addition to pilot testing and revision prior to fielding. Following conventional
78
5. Defining the measurement model: Methods Stuart Nicholls
guidance it was decided that the questionnaire would begin with more simplis-
tic questions, building up a background context and progressing with increasing
complexity (Moser and Kalton, 1971).
5.3.1 The latent variable
The influential factors identified in the interview phase were largely latent con-
structs and consequently have no direct metric. If the latent constructs cannot be
measured directly one must generate indicators of these or what may be referred
to as manifest variables (Bartholomew, 1987).
5.3.2 Development of indicators
The present study used the concept of decisional quality (DCQ) as the outcome
measure. To this end the Uncertainty and Effective Decision subscales of the
Ottawa Decisional Conflict scale (O’Conner, 1995) were used as indicators of per-
ceived decisional quality. The Uncertainty subscale includes items assessing per-
ceived ease, certainty and clarity of choice whilst the Effective Decision subscale
includes items relating to satisfaction with the decision and value reflection but
also explicitly includes an item evaluating whether the respondent feels they have
made an informed choice. Both subscales have been shown to have adequate test-
retest correlations and good internal-consistency with Cronbachs alpha coefficients
exceeding 0.78.
The use of the full Ottawa Decisional Conflict scale was resisted as the other sub-
scales overlapped with aspects of perceived choice, perceived importance of risks
and benefits as well as perceived knowledge. It was felt that these items, which
arose within the interviews as key factors affecting parental decisions, needed to
be explored in greater depth and in context specific ways and as such indicators
were derived for these components.
79
5. Defining the measurement model: Methods Stuart Nicholls
Multiple indicators were developed for each latent construct identified within the
interviews. The use of multiple indicators to represent the latent construct may
act to reduce the measurement error inherent in all indicator measures and reduce
the reliance on a single indicator (Hair et al., 1998). Using multiple items may
also help to improve the validity of the measure by ironing-out idiosyncrasies in
response (Fowler Jr, 2001).
Each indicator consisted of an item pool of scores summed to produce a total
score. For this reason the total scores are sometimes referred to as summated
scales (Moser and Kalton, 1971; Hair et al., 1998). Each item consisted of a ques-
tion or statement which was rated using a five point Likert scale or binary response.
Likert scales ranged from Strongly Disagree to Strongly Agree with corresponding
scores ranging from 0 to 4. Items were a mixture of forward and reverse coding.
Item scores within the scale were averaged and then multiplied by 25 to produce
a response range of 0 to 100. In addition data was collected on a range of sociode-
mographic variables such as age group, number of children, and income.
The specific items within the questionnaire were derived from a range of sources:
existing measures in other contexts, the content of the qualitative interviews and
prior newborn bloodspot screening literature. A copy of the questionnaire includ-
ing all questions and coding scheme is included as Appendix H.
The latent construct of experience was identified within the interviews when par-
ents talked about how experience affected their decisions and that this was in-
formed by prior personal experience and also those experiences of friends and fam-
ily. Consequently indicators of experience were derived and indirectly measured
through number of children, age of the parent, and whether a friend or family has
a condition for which screening is offered.
80
5. Defining the measurement model: Methods Stuart Nicholls
In a similar way indicator variables were created for the other latent constructs
identified from the interviews. Attitude to medicine (ATTMED) is indicated by
proxy observed variables of attitudes towards the midwife, attitudes towards the
hospital and attitudes towards the NHS. The scales have been developed for this
study in order to place the concept within the current context. Development of
the scale has drawn on existing measures such as The General Trust in Physicians
Scale (Hall et al., 2002; Dugan et al., 2005).
The latent construct of Information-seeking behaviour (INFSK) is measured by
responses to questions regarding prior knowledge, actual behaviour in terms of the
number of information sources sought, and the information seeking preferences.
The measure of prior knowledge has been developed for this study due to the
lack of pre-existing measures in the newborn screening context. This draws on
measures from other settings such as those used by Bunn et al. (2002) in their
study of factors influencing intention to obtain a genetic test for colon cancer risk.
Information seeking preferences are scored using the Informed subscale of Health
Opinion Survey (Krantz et al., 1980). This subscale has been found to be reliable,
scoring 0.76 on the Kuder-Richardson 20 reliability formula. Number of sources
was indicated by parents marking all sources of information used to find out about
newborn screening.
Perceived knowledge is indicated by responses to questions regarding perceived
knowledge of the procedures, conditions and motivation for screening. These three
groupings were indicated by parents as the important informational elements and
as such the questions derive directly from the interviews. Questions were pre-
sented to allow parents to make a subjective assessment of their knowledge of each
of these aspects as opposed to selecting specific pieces of information to be recalled.
In each case scales have been developed for this study and measure responses on
a five point Likert-type scale ranging from Strongly Agree to Strongly Disagree.
81
5. Defining the measurement model: Methods Stuart Nicholls
The measurement of attitude towards screening (ATTSCR) is indicated by re-
sponses to questions regarding the parents’ attitudes towards the perceived risks
and benefits of screening, together with their child’s perceived susceptibility to the
conditions being tested for. These scales have been devised for the current study
as no scales exist for newborn bloodspot screening. Development of the scale
has, however, drawn on existing measures in other screening contexts such as the
Revised Susceptibility, Benefits, and Barriers Scale for Mammography Screening
(Champion, 1999).
The final component of the model is the parental perception of choice (CHOICE).
This perceived choice is indicated through two summated scales of parental per-
ceptions of the availability of choice and perceived ability to make a choice. As
with previous scales, these have been devised for the current study as no scales
exist for newborn bloodspot screening.
5.4 Sampling
5.4.1 Populations
The population selected was that served by the Clinical Biochemistry Department
at Royal Liverpool Children’s Hospital in their role as a UK Newborn Screening
Laboratory.
5.4.2 Sampling frame
The Clinical Biochemistry Department at Royal Liverpool Children’s Hospital is
part of the UK Newborn Screening Laboratories Network (UKSLN), an associa-
tion of NHS laboratories who provide screening services to newborn babies. The
regional newborn screening laboratory holds records of all infants born in the
Merseyside and Cheshire regions. Specifically, the population for the study was
82
5. Defining the measurement model: Methods Stuart Nicholls
parents who have given birth within the year 2008. Whilst coverage may be in-
complete (Coppinger and Cavanagh, 2008); the sampling frame is well defined.
One further limitation, imposed following National Health Service (NHS) ethical
review, was that all parents whose child had subsequently died were removed from
the sample frame. As such the sample frame constituted all children born in 2008
for whom a screening result is recorded by the Merseyside and Cheshire screen-
ing laboratory and who had not subsequently died. This provided a total 28348
children from which to draw the sample.
5.4.3 Sample size
The sample has been calculated from both a statistical perspective in order to gain
the required confidence levels, but has also been informed by practical constraints.
Statistically, asymptotic theory implies that confident conclusions can be drawn
from large samples. There is, however, a distinct lack of guidance as to when these
samples are large enough, with sample size calculations for structural equation
modelling analyses affected by the estimation procedure, model complexity, and
degree of multivariate normality within the data (Jaccard and Wan, 1996; Jackson,
2003).
Using a pre-specified power, significance level, and degrees of freedom MacCallum
et al. (1996) and Kim (2005) have derived a process through which a sample size
can be calculated. A formal routine1 is provided for the statistical software pack-
age R2. The R code is provided in Appendix D.
Table 5.1, generated from model 1, indicates that there are 109 degrees of freedom.
Using the R code for a power of 0.8 and significance of 0.05 one would need a sample
size of N=125. Building in an achievable response rate of 30% (Asch et al., 1997;
1http://timo.gnambs.at/en/scripts/powerforsem2R Development Core Team (2009). R: A language and environment for statistical com-
puting. R Foundation for Statistical Computing, Vienna, Austria. ISBN 3-900051-07-0, URLhttp://www.R-project.org.
83
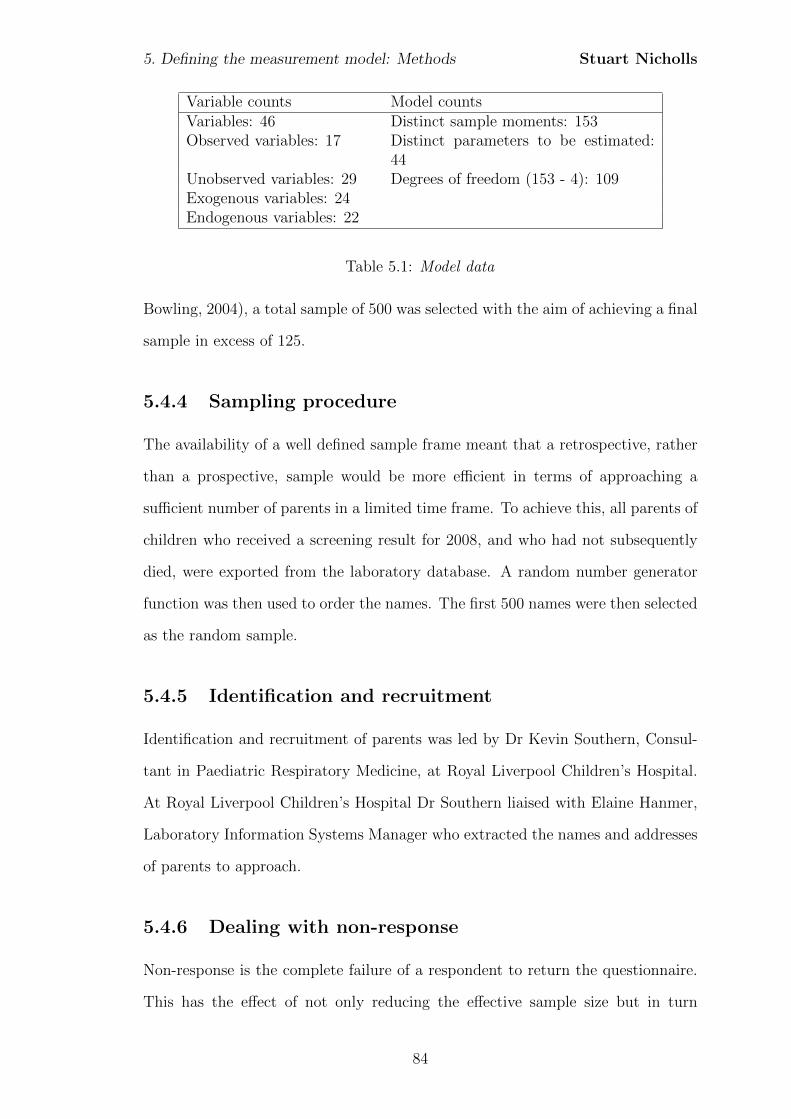
5. Defining the measurement model: Methods Stuart Nicholls
Variable counts Model countsVariables: 46 Distinct sample moments: 153Observed variables: 17 Distinct parameters to be estimated:
44Unobserved variables: 29 Degrees of freedom (153 - 4): 109Exogenous variables: 24Endogenous variables: 22
Table 5.1: Model data
Bowling, 2004), a total sample of 500 was selected with the aim of achieving a final
sample in excess of 125.
5.4.4 Sampling procedure
The availability of a well defined sample frame meant that a retrospective, rather
than a prospective, sample would be more efficient in terms of approaching a
sufficient number of parents in a limited time frame. To achieve this, all parents of
children who received a screening result for 2008, and who had not subsequently
died, were exported from the laboratory database. A random number generator
function was then used to order the names. The first 500 names were then selected
as the random sample.
5.4.5 Identification and recruitment
Identification and recruitment of parents was led by Dr Kevin Southern, Consul-
tant in Paediatric Respiratory Medicine, at Royal Liverpool Children’s Hospital.
At Royal Liverpool Children’s Hospital Dr Southern liaised with Elaine Hanmer,
Laboratory Information Systems Manager who extracted the names and addresses
of parents to approach.
5.4.6 Dealing with non-response
Non-response is the complete failure of a respondent to return the questionnaire.
This has the effect of not only reducing the effective sample size but in turn
84

5. Defining the measurement model: Methods Stuart Nicholls
reducing the quality of the analysis by increasing the margin of error and reducing
the generalisability of results (Bowling, 2004; McColl et al., 2001). The calculation
of the percentage of non-responders is used to give a response rate although there is
little agreement on acceptable response rates (Asch et al., 1997; Sitzia and Wood,
1998; McColl et al., 2001; Bryman, 2004; Bowling, 2004). If the non-response
occurs in a systematic way; so that those who do respond differ in some critical
way to those who do not respond, then there will be a response bias that will
further undermine any conclusions drawn. In order to minimise the level of non-
response:
1. The population has been specifically targetted to ensure the saliency of the
topic (McColl et al., 2001).
2. A covering letter has been included from Dr Kevin Southern, Senior Lecturer
and Consultant in Paediatric Respiratory Medicine and member of the Cystic
Fibrosis Board, National Newborn Screening Committee. The inclusion of a
covering letter with sponsorship and an influential signatory has been shown
to increase response rates (Oppenheim, 1992; McColl et al., 2001).
3. A reminder was sent as studies have shown that there is a positive relation-
ship between the number of post-notification contacts (reminders) and the
response rate (McColl et al., 2001). Published evidence also suggests that
the inclusion of a questionnaire, at least together with a second reminder,
can significantly improve response rates (McColl et al., 2001). However,
NHS ethical review determined that it would be unethical to send multi-
ple reminders to parents who had received, but not completed, a copy of
the questionnaire. As such only one reminder was sent, but this included a
second copy of the questionnaire.
4. A self-addressed freepost envelope was included.
5. Parents who returned a completed questionnaire were entered into a prize
85
5. Defining the measurement model: Methods Stuart Nicholls
draw to win £20 of high street vouchers. Evidence suggests that the offer of
small financial incentives to respondents increases the response rate.
In addition to this care was taken over the design of the survey, with the ques-
tionnaire being designed to be as short and efficient as possible and between four
to eight pages in length (Czaja and Blair, 2005). The questionnaire was piloted
with a convenience and purposive sample of parents with young children to ensure
clarity of wording and design.
5.5 Data preparation
The completed questionnaire served as the data collection tool, with responses
entered into SPSS version 17 (SPSS Inc, 2008) using the predetermined coding
scheme (see Appendix H).
To reduce the error rate a process of double data entry was used. Once the data was
entered then the data was screened using ‘wild code checking’ (Weisberg et al.,
1996). In this process the numbers entered as the responses for each question
are listed and compared to the predetermined coding scheme. If any questions
contain a code that is not from the original scheme this is verified on the original
questionnaire response to determine if an error was made during data entry.
5.5.1 Missing data
The way one deals with missing data is dependent on both the amount and the
pattern in which it is missing. If large amounts of data are missing then the gen-
eralisabilty of the results may be compromised as a result of the sample size being
reduced. If missing data is randomly distributed throughout the responses i.e.,
there is no systematic relationship within the data in terms of how it is missing,
then the probability of data being missing does not depend on the value of the data
in which there is missingness, nor does it depend on other variables. In this case
86
5. Defining the measurement model: Methods Stuart Nicholls
the data may be considered Missing Completely At Random (MCAR) (McKnight
et al., 2007). This is the least problematic situation as one may remove the cases
without introducing a bias or, if the amount is large, use some form of imputation
to fill in missing values. The alternative may be that missing data is in some way
influenced by another variable within the data set. This form of missingness may
be described as Missing at Random (MAR) if the pattern of missingness does not
depend on the values of the missing data itself. If data is missing on the basis
of the values of the missing data then data may be said to be Missing Not at
Random (MNAR). MNAR is problematic as it implies that there is a systematic
relation between the causes for data being missing and missing data (McKnight
et al., 2007). Any imputation or removal of cases would be seen to introduce bias
on the basis that the unknown values are directly related to the fact that the data
is missing. Should data be MCAR or MAR and be of an amount that renders
complete case analysis inappropriate (i.e., large amounts of missing data) then
multiple imputation will be used to impute the missing values.
To evaluate the amount and pattern of missing data the Missing Values Analysis
(MVA) option within SPSS is used. If missing data is large > 5% and can be
argued to be MAR then multiple imputation will be conducted using the inbuilt
imputation processes of SPSS which allows for the imputation of categorical vari-
ables. Should this be required then five imputed data sets will be created, with
subsequent data analysis using pooled results.
5.5.2 Scale reliability
Cronbach’s alpha
Reliability is assessed through a measure of internal consistency within the sum-
mated scales (Birkett, 1986). Cronbach’s alpha is a measure of internal consistency
and is a common approach taken for scale development within the social sciences
(Aldridge and Levine, 2001). Measures of internal consistency are appropriate
87

5. Defining the measurement model: Methods Stuart Nicholls
here as it may be expected that attitudes may change over time depending on
experience and as such test-retest reliability would not be suitable. Cronbach’s
alpha is not in itself a statistical test, but rather a measure of correlation amongst
the items within a summated scale and is computed using the following:
α =k
k − 1
[1−
∑var(i)
var(sum)
](5.1)
where k is the number of items, var(i) is the variance of an item, and var(sum)
is the variance of the totals for each participant.
The result of the Cronbach’s alpha is a value that ranges between 0 and 1 (Carmines
and Zeller, 1979; Bowling, 2004). As it is not a statistical test of internal consis-
tency, there is a lack of consensus regarding appropriate levels, with some suggest-
ing that a value above 0.6 is sufficient for exploratory research with others even
suggesting that a figure above 0.5 is adequate (Hair et al., 1998; Bowling, 2004).
As such if the Cronbach’s alpha is less than 0.6 then items will be removed if it is
indicated that doing so would improve the scales’ internal consistency.
5.5.3 Outliers
Following this a process of data screening for multivariate outliers was undertaken.
Failing to account for outliers may distort the assessments of normality. Multivari-
ate outliers are those with ‘extreme’ scores on two or more variables, or with an
atypical pattern of responses (Kline, 2005). Analysis for multivariate outliers was
conducted through the use of Mahalanobis distance, D2 (Tabachnick and Fidell,
2001). The Mahalanobis distance is defined as:
D2 = (xi − x)′S−1(xi − x) (5.2)
The Mahalanobis distance is evaluated for each case using the χ2 distribution.
Cases that have p < 0.001 are indicative of multivariate outliers (Tabachnick and
88

5. Defining the measurement model: Methods Stuart Nicholls
Fidell, 2001). Cases identified will have responses individually reviewed. If these
appear to be extreme they will be removed.
89
Chapter 6
Defining the measurement model:
Results
6.1 Parent participation
Data collection took place between January and March 2010. Of the 500 parents
selected for approach twelve were excluded on the basis that the named individual
no longer resided at that address. Of the remainder eligible for inclusion a total
of 154 questionnaires were returned giving a response rate of 32%.
6.2 Descriptive statistics
Table 6.1 presents details of the sample characteristics. Parents varied in terms of
age, income, number of children and educational level. Data was not available on
non-respondents. Demographic characteristics of respondents were compared with
data collected as part of the 2001 census, aggregated at the Cheshire & Merseyside
Strategic Health Authority (SHA) level. Comparisons were made for the variables
of ethnicity and education. Age was not compared due to the distorted sample,
attributable to the biological and legal limitations of child-bearing age; that is one
expects few parents to be aged over 40 or under 16 years. Due to different group-
ing between the census and sample data, results are not directly comparable and
90
6. Defining the measurement model: Results Stuart Nicholls
as such a qualitative comparison is undertaken. Income is not compared as the
questionnaire requested household income data and not individual data. Existing
surveys of income, such as the Annual Survey of Hours and Earnings (ASHE)1
are based on individual level data. As the survey did not request information on
the number of contributors to the household income the data is not comparable
as it would be unclear if household income was based the income of one or more
individuals.
The population who classified themselves as white was similar for both the sample
and general population (95.45% and 95.75% respectively). All ethnic groups were
within 1% of the population prevalence, although it should be borne in mind that
these are based on small sizes within sub-groups in the present study.
Respondents to the survey appeared to be more educated than the general popula-
tion of Cheshire and Merseyside. Whilst the percentage of parents with GCSE/school
level qualifications was similar for both the sample and the general population,
both around 20%, there were greater numbers of parents with College/A-level
(20.8% within the sample compared to 7.87% within the population) and higher
level qualifications (54.55% within the sample compared to 17.73% in the general
population). Accurate comparison is difficult as the census data aggregates some
school and college data. Within the census data, individuals with one A-level are
classed as having a level 1 qualification, the same as someone who had 5 GCSEs
but no college education. In the present sample college and school education were
separated and this may account for at least some of the discrepancy. Despite
this there is still a large difference with regards to the higher level qualifications
(degree, higher degree, and professional qualifications). This may in part be due
to increasing numbers of University places and degrees awarded since the census,
with over 40,000 more degrees awarded in 2008/9 than 2003/4 according to the
1http://www.statistics.gov.uk/StatBase/Product.asp?vlnk=15313
91

6. Defining the measurement model: Results Stuart Nicholls
Item Number (%)
Age groupUnder 21 2 (1.3)21 - 30 48 (31.2)31 - 40 94 (61)41 - 50 10 (6.5)
Number of children1 55 (35.7)2 68 (44.2)3 16 (10.4)4 11 (7.1)5 or more 4 (2.6)
EthnicityWhite 147 (95.5)Black Caribbean 1 (0.6)Indian 2 (1.3)Chinese 1 (0.6)Other 3 (1.9)
Highest educational levelSchool/GCSE 31 (20.1)College/A-level 32 (20.8)Undergraduate degree 32 (20.8)Postgraduate degree 20 (13.0)Professional qualification 32 (20.8)Other 4 (2.6)
Household incomeLess than £11500 16 (10.4)£11501 - £18500 20 (13.0)£18501 - £28000 18 (11.7)£28001 - £41000 27 (17.5)£41001 - £75000 44 (28.6)Over £75000 21 (13.6)
Table 6.1: Demographic characteristics of valid responses (excludes missing). Per-centages may not sum to 100 due to rounding
92
6. Defining the measurement model: Results Stuart Nicholls
Higher Education Statistics Agency (HESA)2.
The sample is relatively representative in terms of the ethnic mix, but generally
older and more educated than the population from which it was drawn. This may
indicate a response bias which must be considered when interpreting the results,
particularly in relation to questions of knowledge which may be associated with
education.
6.3 Data preparation
6.3.1 Missing data
The first stage of the data preparation was to assess both the level and pattern
of missingness within the returned questionnaires (excluding those questionnaires
that were returned but were wholly incomplete). A total of 111 questionnaires had
complete data without any missingness. The patterns of missingness were assessed
visually within SPSS.
Figure 6.1 shows the thirty two different patterns for the 43 questionnaires with
missing data. Item missingness ranged from 0 to 7.2%. Two items, corresponding
with patterns 26 and 28, had over 5% missing data. Pattern 26 relates to Q.16,
income level, and pattern 28 to Q.3 concerning the most important source of in-
formation. Missing data in Q.3 was due to three mechanisms: in one instance the
facing pages of the inside cover and next page were missed completely suggesting
the parent had failed to notice these pages. In several cases multiple items had
been marked contrary to the question instructions. No response was subsequently
recorded on the basis that one could not determine the most important source.
In the remainder no source had been marked but the preceding and subsequent
questions had been completed.
2http://www.hesa.ac.uk/index.php?option=com content&task=view&id=1578&Itemid=161
93
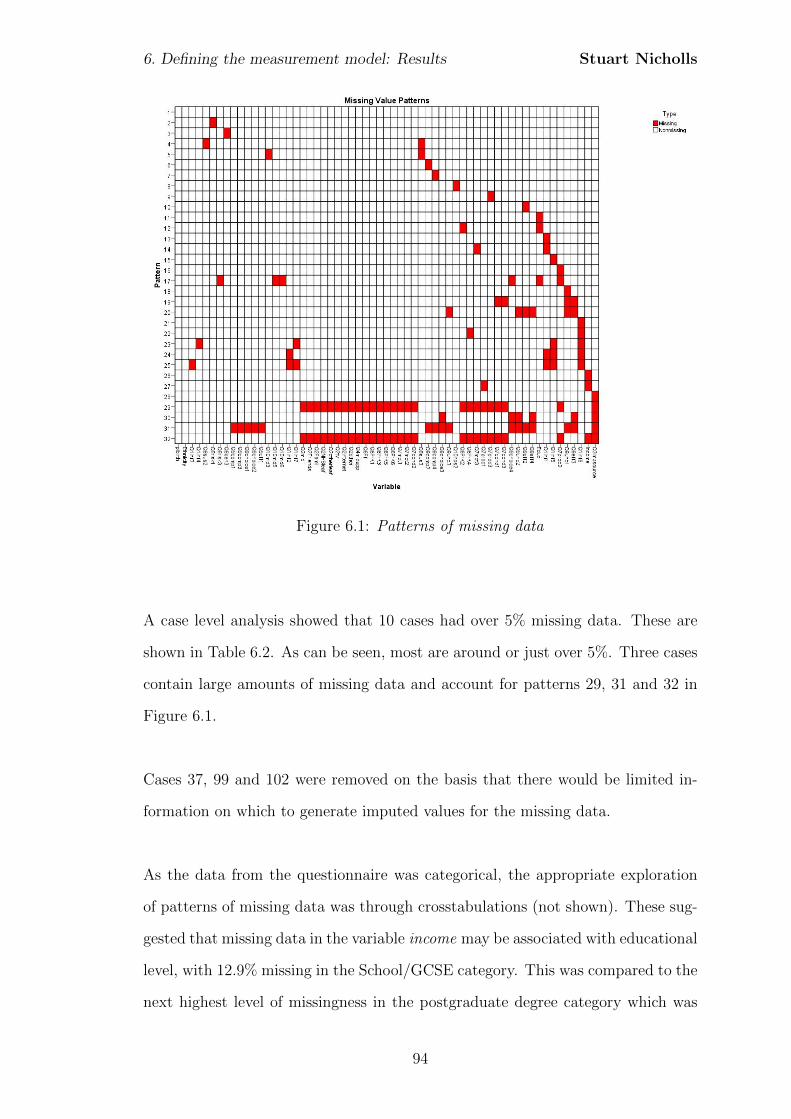
6. Defining the measurement model: Results Stuart Nicholls
Figure 6.1: Patterns of missing data
A case level analysis showed that 10 cases had over 5% missing data. These are
shown in Table 6.2. As can be seen, most are around or just over 5%. Three cases
contain large amounts of missing data and account for patterns 29, 31 and 32 in
Figure 6.1.
Cases 37, 99 and 102 were removed on the basis that there would be limited in-
formation on which to generate imputed values for the missing data.
As the data from the questionnaire was categorical, the appropriate exploration
of patterns of missing data was through crosstabulations (not shown). These sug-
gested that missing data in the variable income may be associated with educational
level, with 12.9% missing in the School/GCSE category. This was compared to the
next highest level of missingness in the postgraduate degree category which was
94
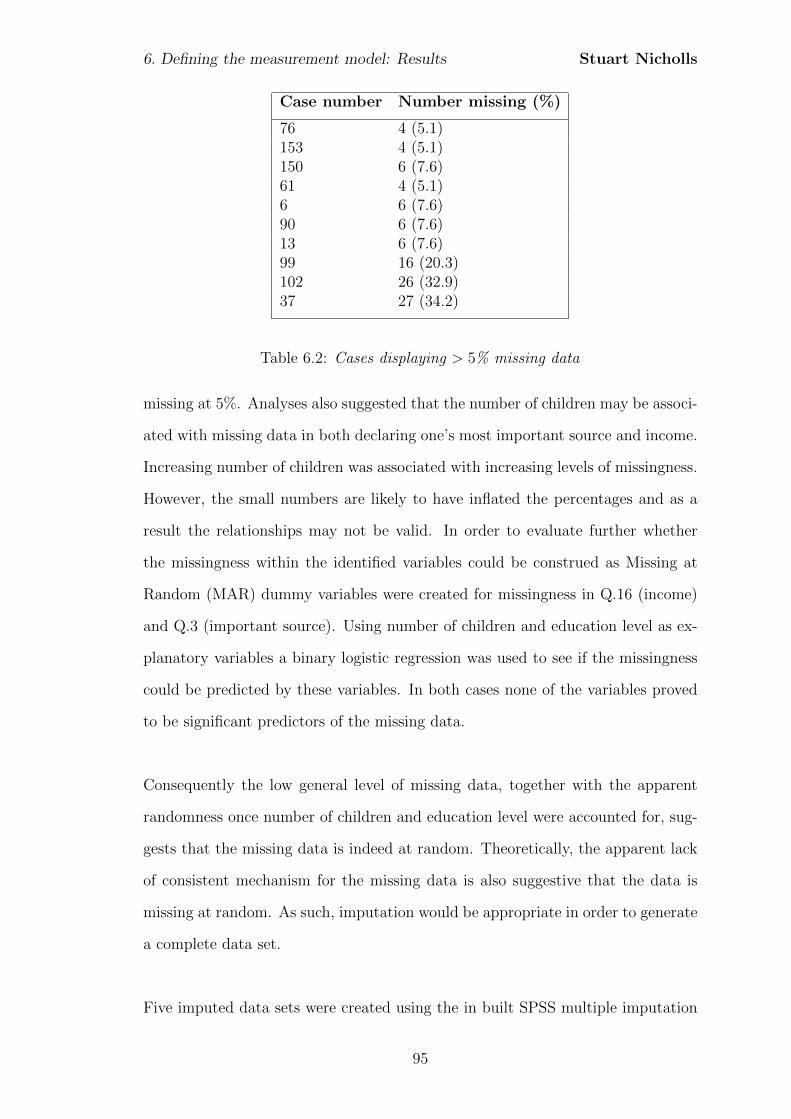
6. Defining the measurement model: Results Stuart Nicholls
Case number Number missing (%)
76 4 (5.1)153 4 (5.1)150 6 (7.6)61 4 (5.1)6 6 (7.6)90 6 (7.6)13 6 (7.6)99 16 (20.3)102 26 (32.9)37 27 (34.2)
Table 6.2: Cases displaying > 5% missing data
missing at 5%. Analyses also suggested that the number of children may be associ-
ated with missing data in both declaring one’s most important source and income.
Increasing number of children was associated with increasing levels of missingness.
However, the small numbers are likely to have inflated the percentages and as a
result the relationships may not be valid. In order to evaluate further whether
the missingness within the identified variables could be construed as Missing at
Random (MAR) dummy variables were created for missingness in Q.16 (income)
and Q.3 (important source). Using number of children and education level as ex-
planatory variables a binary logistic regression was used to see if the missingness
could be predicted by these variables. In both cases none of the variables proved
to be significant predictors of the missing data.
Consequently the low general level of missing data, together with the apparent
randomness once number of children and education level were accounted for, sug-
gests that the missing data is indeed at random. Theoretically, the apparent lack
of consistent mechanism for the missing data is also suggestive that the data is
missing at random. As such, imputation would be appropriate in order to generate
a complete data set.
Five imputed data sets were created using the in built SPSS multiple imputation
95
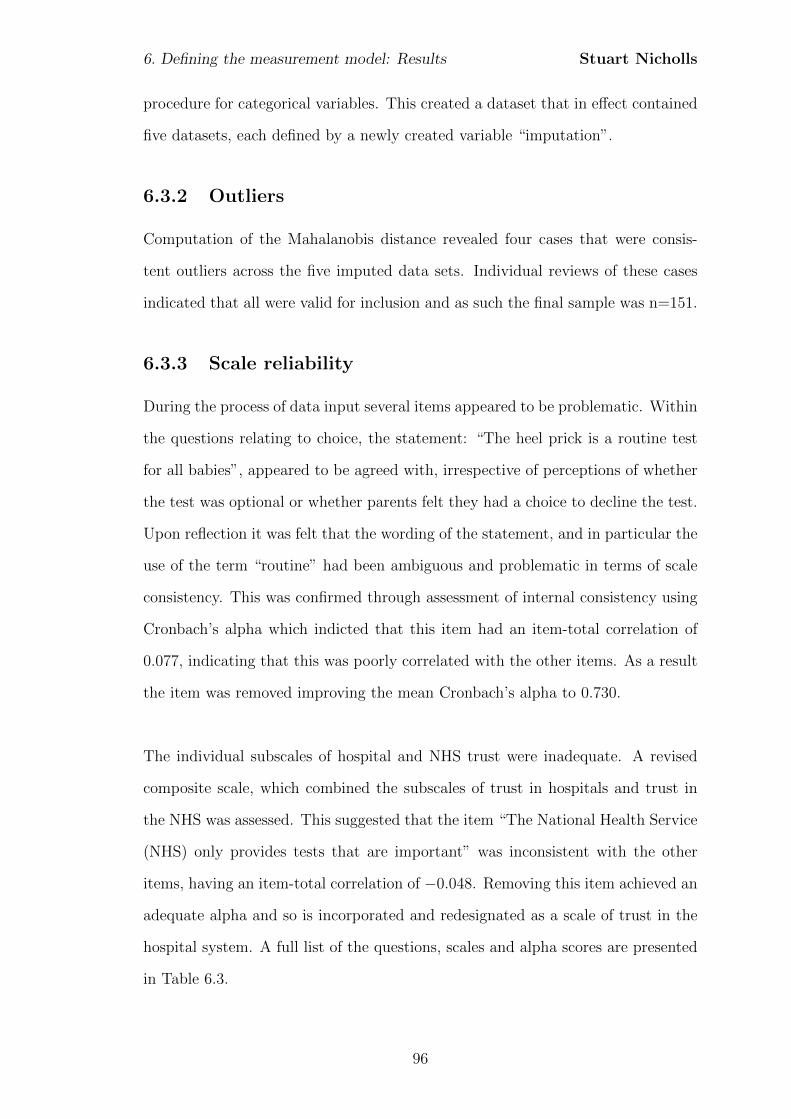
6. Defining the measurement model: Results Stuart Nicholls
procedure for categorical variables. This created a dataset that in effect contained
five datasets, each defined by a newly created variable “imputation”.
6.3.2 Outliers
Computation of the Mahalanobis distance revealed four cases that were consis-
tent outliers across the five imputed data sets. Individual reviews of these cases
indicated that all were valid for inclusion and as such the final sample was n=151.
6.3.3 Scale reliability
During the process of data input several items appeared to be problematic. Within
the questions relating to choice, the statement: “The heel prick is a routine test
for all babies”, appeared to be agreed with, irrespective of perceptions of whether
the test was optional or whether parents felt they had a choice to decline the test.
Upon reflection it was felt that the wording of the statement, and in particular the
use of the term “routine” had been ambiguous and problematic in terms of scale
consistency. This was confirmed through assessment of internal consistency using
Cronbach’s alpha which indicted that this item had an item-total correlation of
0.077, indicating that this was poorly correlated with the other items. As a result
the item was removed improving the mean Cronbach’s alpha to 0.730.
The individual subscales of hospital and NHS trust were inadequate. A revised
composite scale, which combined the subscales of trust in hospitals and trust in
the NHS was assessed. This suggested that the item “The National Health Service
(NHS) only provides tests that are important” was inconsistent with the other
items, having an item-total correlation of −0.048. Removing this item achieved an
adequate alpha and so is incorporated and redesignated as a scale of trust in the
hospital system. A full list of the questions, scales and alpha scores are presented
in Table 6.3.
96

6. Defining the measurement model: Results Stuart Nicholls
Scale Item Cronbachalpha mean(std.dev)
Inf Q2 - Instead of waiting, I usually ask the doctor or nurse imme-diately after an examination about my health†
0.710 (0.001)
Q2 - I usually ask the doctor or nurse lots of questions about theprocedures during a medical examination†Q2 - I’d rather be given many choices about what’s best for myhealth than to have the doctor make the decisions for me†Q2 - I usually don’t ask the doctor or nurse many questions aboutwhat he or she is doing during a medical examination†‡Q2 - I’d rather have doctors and nurses make make the decisionsabout what’s best than for them to give me a whole lot of choices†‡Q2 - It is better to trust doctor or nurse in charge of a medicalprocedure than to question what he or she is doing†‡Q2 - I usually wait for the doctor or nurse to tell me about theresults of a medical exam rather than asking him or her immedi-ately†‡
PrK Q7 - Before your first baby was born had you heard about theheel prick?†
0.782 (0.001)
Q7 - Before your baby was born had you heard about testing forphenylketonuria (PKU)?†Q7 - Before your baby was born had you heard about testing forcongenital Hypothyroidism (CH)?†Q7 - Before your baby was born had you heard about testing forcystic fibrosis (CF)?†Q7 - Before your baby was born had you heard about testing forsickle cell disease (SCD)?†Q7 - Before your baby was born had you heard about testing formedium chain co-acyl dehydrogenase deficiency (MCADD)?†
Mot I feel I understand why the heel prick is done 0.854 (0.001)I feel I understand why the test is done at the time it isI feel I understand what the test results mean
Proc Q8 - I feel I understand how the test is done 0.816 (0.012)Q8 - I feel I understand when the test is doneQ8 - I feel I understand when the results will be available
Cond Q8 - I feel I understand what the conditions are that the heel pricktests for
0.898 (0.005)
Q8 - I feel I understand how the conditions could affect my childQ8 - I feel I understand how the condition would be dealt with iffound
Risk Q9 - The heel prick is likely to cause a lot of pain to my child‡ 0.775 (0.003)Q9 - The heel prick causes long lasting pain to my child‡Q9 - The heel prick is likely to have a long term impact on mychild‡Q9 - The heel prick exposes my child to the risk of infection‡
Ben Q9 - The heel prick is a quick test 0.871 (0.002)Q9 - The heel prick can provide useful information.Q9 - The heel prick will allow treatment of an identified healthproblemQ9 - The conditions tested for in the heel prick are seriousQ9 - Testing earlier is better than testing later
Abch Q10 - I felt I had enough time to make a decision about the heelprick
0.793 (0.007)
Q10 - I was too tired to make a decision about the heel prick‡Q10 - I was too emotional to make a decision about the heel prick‡
Continued on Next Page. . .
97
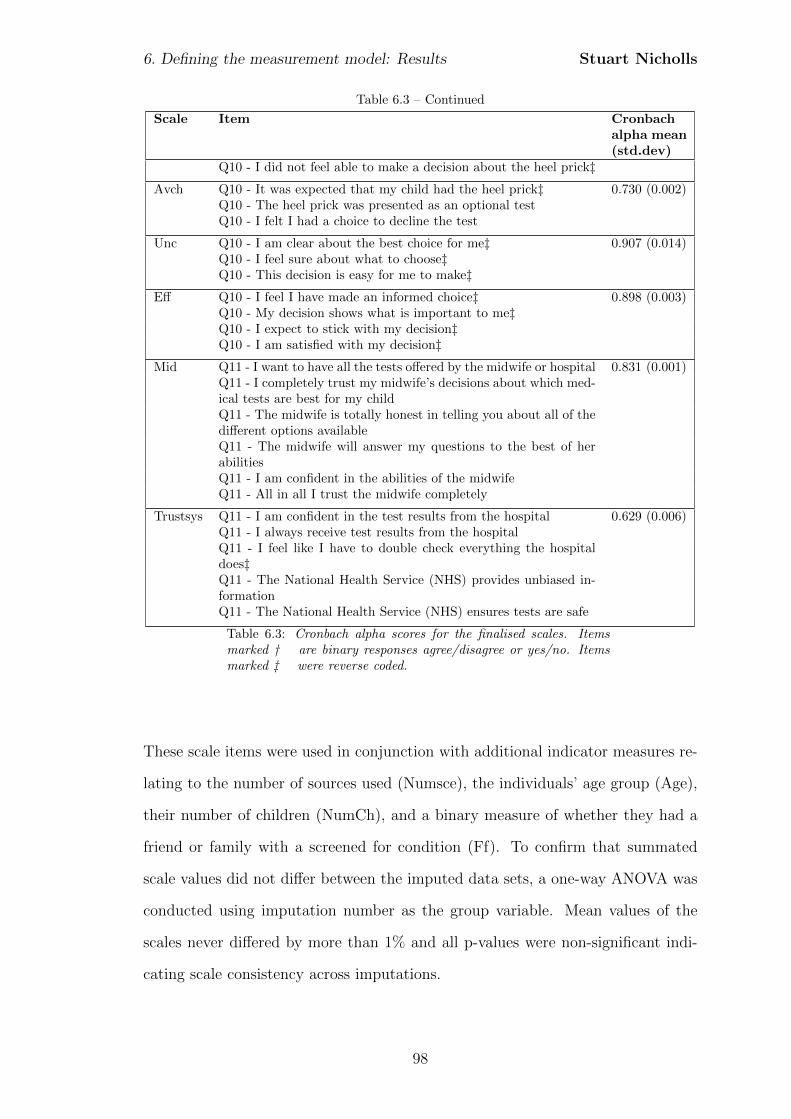
6. Defining the measurement model: Results Stuart Nicholls
Table 6.3 – Continued
Scale Item Cronbachalpha mean(std.dev)
Q10 - I did not feel able to make a decision about the heel prick‡
Avch Q10 - It was expected that my child had the heel prick‡ 0.730 (0.002)Q10 - The heel prick was presented as an optional testQ10 - I felt I had a choice to decline the test
Unc Q10 - I am clear about the best choice for me‡ 0.907 (0.014)Q10 - I feel sure about what to choose‡Q10 - This decision is easy for me to make‡
Eff Q10 - I feel I have made an informed choice‡ 0.898 (0.003)Q10 - My decision shows what is important to me‡Q10 - I expect to stick with my decision‡Q10 - I am satisfied with my decision‡
Mid Q11 - I want to have all the tests offered by the midwife or hospital 0.831 (0.001)Q11 - I completely trust my midwife’s decisions about which med-ical tests are best for my childQ11 - The midwife is totally honest in telling you about all of thedifferent options availableQ11 - The midwife will answer my questions to the best of herabilitiesQ11 - I am confident in the abilities of the midwifeQ11 - All in all I trust the midwife completely
Trustsys Q11 - I am confident in the test results from the hospital 0.629 (0.006)Q11 - I always receive test results from the hospitalQ11 - I feel like I have to double check everything the hospitaldoes‡Q11 - The National Health Service (NHS) provides unbiased in-formationQ11 - The National Health Service (NHS) ensures tests are safe
Table 6.3: Cronbach alpha scores for the finalised scales. Itemsmarked † are binary responses agree/disagree or yes/no. Itemsmarked ‡ were reverse coded.
These scale items were used in conjunction with additional indicator measures re-
lating to the number of sources used (Numsce), the individuals’ age group (Age),
their number of children (NumCh), and a binary measure of whether they had a
friend or family with a screened for condition (Ff). To confirm that summated
scale values did not differ between the imputed data sets, a one-way ANOVA was
conducted using imputation number as the group variable. Mean values of the
scales never differed by more than 1% and all p-values were non-significant indi-
cating scale consistency across imputations.
98

6. Defining the measurement model: Results Stuart Nicholls
This confirmed the final set of indicators that were to be taken forward and assessed
as within the full structural equation model.
99
Chapter 7
Structural Equation Modelling:
Methods
7.1 Introduction
In the present chapter I consider the analysis of the data collected by the question-
naire, using structural equation modelling (SEM). A major benefit of SEM over
traditional statistical methods such as multiple regression is the ability to model
complex interactions with multiple independent and dependent variables, and to
do this in a single analysis as opposed to a series of analyses.
Structural equation modelling has been used extensively within the psychosocial
literature, particularly in relation to decision-making, and has been used within
the context of prenatal screening (van den Berg et al., 2008) and genetic testing for
cancer (Bosompra et al., 2000; Bunn et al., 2002). The remainder of the chapter
outlines how the data collected by the questionnaire will be prepared and analysed.
7.2 Structural equation modelling: an overview
Structural equation modelling, sometimes, mistakenly, referred to as causal mod-
elling, is a general statistical methodology based on the analysis of covariances
100
7. Structural Equation Modelling: Methods Stuart Nicholls
and can be seen as a combination of factor analysis and multiple regression (Hox
and Bechger, 1998). The method utilises covariances to analyse proposed causal
relationships which are specified a priori on the basis of an underlying theory or
previous empirical data. Whilst two variables may co-vary and may be evidence
of a causal relationship (Baron, 2000) the development of the causal model needs
to be theoretically derived and not driven purely by the statistical analysis. Con-
sequently a purported limitation of SEM is that there needs to be prior theory,
and it is because of this need that the first, qualitative, phase of the study was
required in order to inform the theoretical aspect of creating a causal model.
A limitation of traditional methods of regression is that that they only model the
relationships between observed variables. These methods are inappropriate when
one wants to consider relationships between latent variables such as the attitudes
or experiences expressed by parents during the interview phase of this study. SEM
allows not only the estimation of multiple interrelated relationships in a single
analysis (Hair et al., 1998), but also takes into account the relationships between
latent variables. In addition, structural equation modelling accounts for measure-
ment error in the latent variable’s corresponding indicator variables. To do this
SEM models include error terms that become parameters estimated within the
model (Raykov and Marcoulides, 2000). In order to clarify the relationships be-
tween variables within the model one uses a path diagram. A simple example is
shown in Figure 7.1
From Figure 7.1 we can see that there is the structural model which posits the
relationship between the latent variables; in effect the proposed causal models de-
rived from the interviews. Each latent variable also forms part of a measurement
model that shows the hypothesised relationships between the indicator variables
and the latent variable for which they act as proxies. This is, in principle the rela-
tionship between the questions within the questionnaire and the proposed latent
101
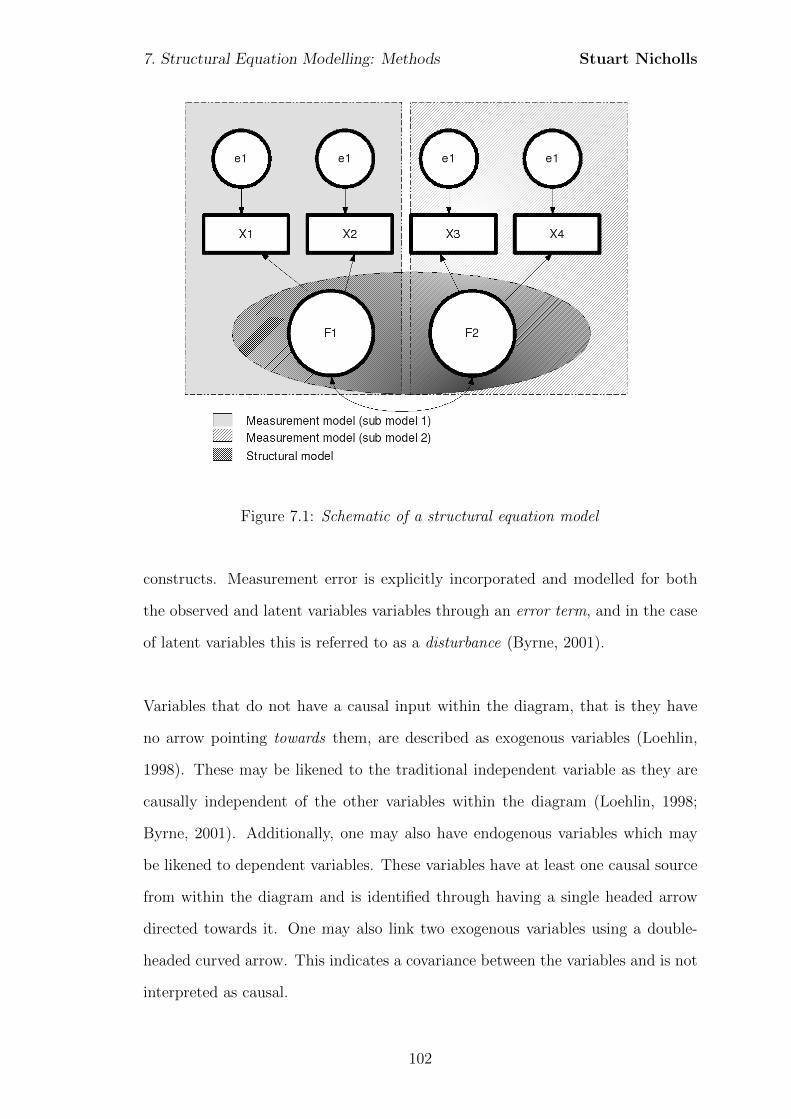
7. Structural Equation Modelling: Methods Stuart Nicholls
Figure 7.1: Schematic of a structural equation model
constructs. Measurement error is explicitly incorporated and modelled for both
the observed and latent variables variables through an error term, and in the case
of latent variables this is referred to as a disturbance (Byrne, 2001).
Variables that do not have a causal input within the diagram, that is they have
no arrow pointing towards them, are described as exogenous variables (Loehlin,
1998). These may be likened to the traditional independent variable as they are
causally independent of the other variables within the diagram (Loehlin, 1998;
Byrne, 2001). Additionally, one may also have endogenous variables which may
be likened to dependent variables. These variables have at least one causal source
from within the diagram and is identified through having a single headed arrow
directed towards it. One may also link two exogenous variables using a double-
headed curved arrow. This indicates a covariance between the variables and is not
interpreted as causal.
102
7. Structural Equation Modelling: Methods Stuart Nicholls
Using the path diagram as the starting point the parameters, such as path coef-
ficients, are estimated to create an implied population covariance matrix; that is
one generates a covariance matrix based on the model. As described in more detail
later in the chapter, the parameter values are estimated using a discrepancy, or
minimisation, function which aims to minimise the difference between the implied
population covariance matrix and the sample covariance matrix generated from
the sample data. In short, parameter estimates based on the model are used to
generate a model implied population covariance matrix which is then compared
with the sample covariance matrix. Whilst a number of discrepancy functions are
available this is most commonly achieved through a process of maximum likelihood
estimation. The level of discrepancy between the implied covariance matrix and
the sample covariance matrix can then be evaluated, principally through the appli-
cation of the χ2 statistic, with the aim being to minimise the discrepancy. The χ2
statistic tests the null hypothesis that the factor loadings, variances, covariances
and residuals are valid. The probability associated with the χ2 represents the
probability of a value greater than this, given the null hypothesis (i.e. that there
is no difference between the model and sample covariance matrix) is true (Byrne,
2001). The higher the probability, the closer the fit between the implied population
covariance matrix and the sample covariance matrix. A range of fit indices have
been created to supplement the traditional χ2 and are discussed in Section 7.7.
The availability of fit indices allow for the comparison of different, or competing,
models in order to identify models which may be a better approximation to the
data.
7.2.1 Modification
The availability of goodness-of-fit measures allows one to make modifications to
a model in order to attempt to improve the value of a given index. Such an ap-
proach, whilst intuitively appealing, is potentially problematic if one is unable to
103
7. Structural Equation Modelling: Methods Stuart Nicholls
explain the modification in a substantive way, that is the modification must also
be theoretically valid (Ho, 2006). To this end it has been proposed that a holis-
tic approach to assessing model fit be taken in which the goodness-of-fit indices
provide only a partial role, albeit a significant one. In assessing the whole model,
individual parameter estimates are also assessed ensuring size and direction are
reasonable and consistent with the theory from which the model was derived. The
overall fit may be inferred to be good on the basis of a goodness-of-fit measure but
if the parameter estimates are not statistically significant or have signs opposite
to those predicted then the interpretation is problematic (Bollen, 1989). Conse-
quently all models will be assessed not only through the use of fit indices, but also
by evaluating the parameter estimates.
7.2.2 Limits of SEM
Perhaps the biggest issue for SEM is the interpretation of the analysis. No matter
what the statistical results are, the attribution of causality must be made in devel-
oping and designing the path diagram. The statistical analysis provides evidence
to support or contradict the model being evaluated. This limitation of what SEM
can say appears to be the most significant, and often misinterpreted, limitation
with the potential for authors to misappropriately state that their model proves
a causal relationship between variables. Yet if one bears this caveat in mind then
there is no reason why SEM cannot be used as a statistical tool to gather eviden-
tiary data that may support or undermine a theory of causal relationships.
The remainder of the chapter provides more detail of the structural equation mod-
elling approach. Starting with model specification I set out each of the competing
models to be analysed before turning to the issue of inference in which I discuss
issues of identification and parameter estimation. I then conclude the chapter by
considering model fit and the evaluation of structural equation models.
104
7. Structural Equation Modelling: Methods Stuart Nicholls
7.3 Model specification
Proposing a single model based on the first phase results and obtaining a result
that is acceptable in no way determines that this is the ‘best’ model (Hair et al.,
1998). There may, for example, be a number of alternative models that are equally
as good, or even better. The approach taken here is to take a competing models
strategy or what Joreskog has called an alternative models strategy (Byrne, 2001)
whereby several competing, or alternative, models are evaluated against a selection
of model-fit indices.
7.3.1 Model 1
From Figure 7.2 it can be seen that the model proposes that Attitudes to Medicine
(ATTMED) is indicated through scores on the scales developed to measure trust
in the midwife (Mid) and the healthcare system more generally (Trustsys). The
latent construct of experience (EXP) is proposed to have a direct causal relation-
ship on attitudes to medicine and is measured through responses to whether the
individual has a friend or family member with a screened for condition (Ff), num-
ber of children (Numch), and grouped age (Age). Both individual experience and
attitudes to medicine are suggested to have a direct influence on the individuals
information-seeking behaviour (INFSK), indicated by responses to questions on
prior knowledge (PrK), their information seeking responses (Inf) in accordance
with the Informed subscale of Health Opinion Survey, and the total number of
sources of information used (Numsce). This directly affects the latent construct of
perceived knowledge (PCK) indicated by self-reported knowledge of the motivation
behind screening (Mot), the procedures used (Proc) and the conditions tested for
(Cond). Perceived choice (CHOICE), indicated through responses regarding ones
perceived ability to make a choice (Abch) and the perceived availability of the
choice (Avch), is proposed to directly affect both perceived knowledge and per-
ceived decisional quality. Attitudes towards screening (ATTSCR) are measured
through the perceived risks (Risk) and benefits (Ben), and has a direct causal
105
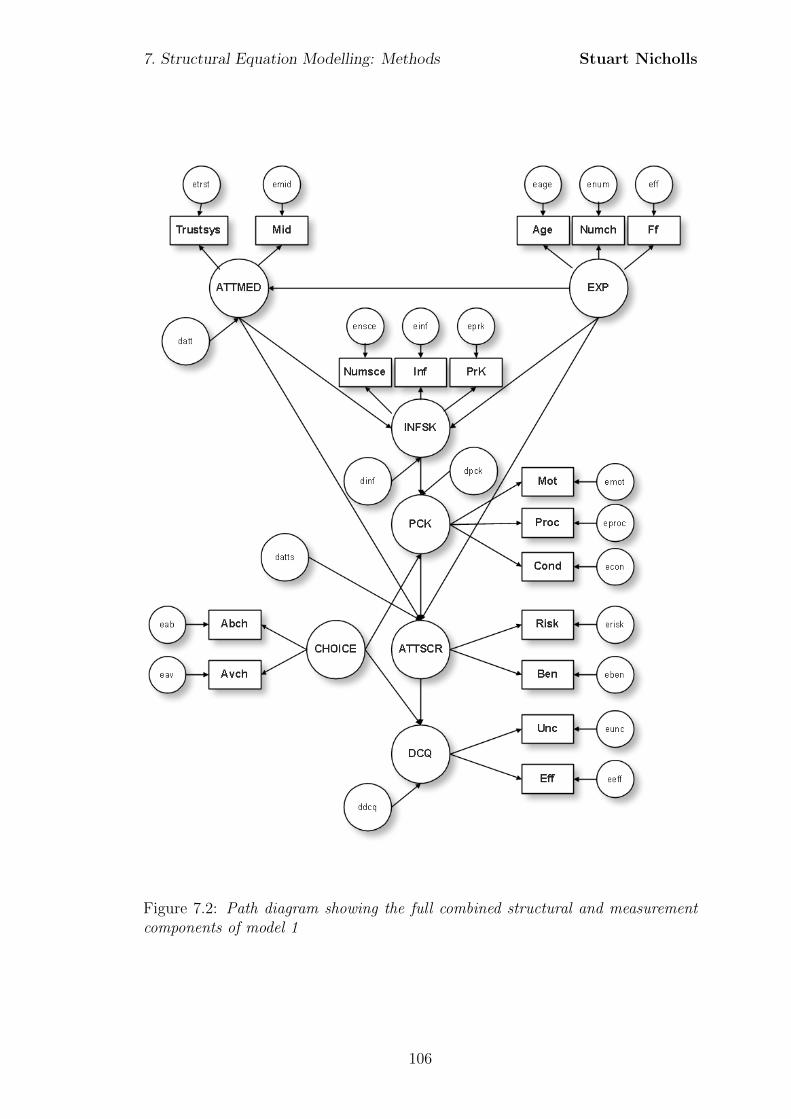
7. Structural Equation Modelling: Methods Stuart Nicholls
Figure 7.2: Path diagram showing the full combined structural and measurementcomponents of model 1
106

7. Structural Equation Modelling: Methods Stuart Nicholls
relationship with overall perceived decisional quality (DCQ) which is indicated
through responses on the Uncertainty (Unc) and Decision Effectiveness (Eff) sub-
scales taken from the Ottawa Decisional Conflict Scale (O’Conner, 1995).
107
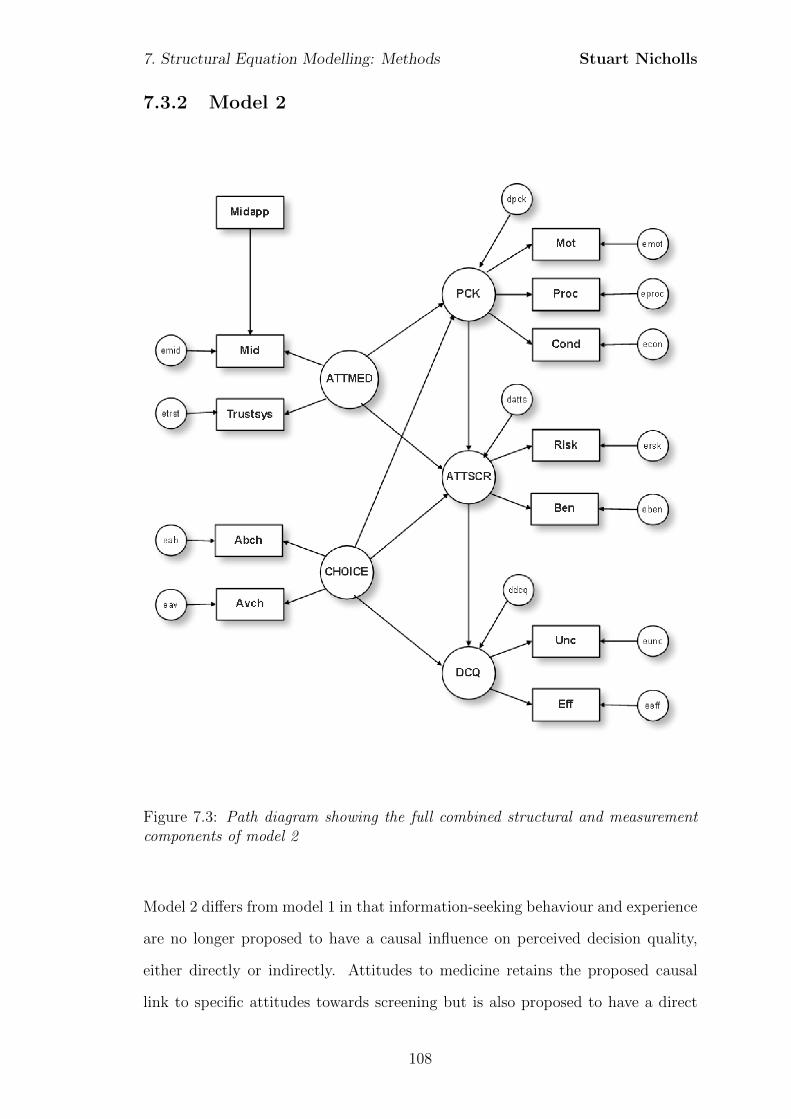
7. Structural Equation Modelling: Methods Stuart Nicholls
7.3.2 Model 2
Figure 7.3: Path diagram showing the full combined structural and measurementcomponents of model 2
Model 2 differs from model 1 in that information-seeking behaviour and experience
are no longer proposed to have a causal influence on perceived decision quality,
either directly or indirectly. Attitudes to medicine retains the proposed causal
link to specific attitudes towards screening but is also proposed to have a direct
108

7. Structural Equation Modelling: Methods Stuart Nicholls
causal relationship with perceived knowledge. This change is in keeping with the
description by some parents that decisions had already been made on perceptions
of beneficence as opposed to specific information-seeking. Furthermore, choice is
proposed to have a causal influence on perceived knowledge. This is implemented
on a theoretical basis with the hypothesis that an increase in perceived choice will
lead to greater perceived knowledge through the passive uptake of information.
The number of times that the mother saw the same midwife (Midapp) is included
as an additional covariate and is proposed to be a determinant of trust in the
midwife. All other relationships remain the same as in model 1.
109
7. Structural Equation Modelling: Methods Stuart Nicholls
7.3.3 Model 3
Model 3 differs from model 2 and model 1 by combining the previously defined con-
structs of attitudes to medicine (ATTMED) and attitudes to screening (ATTSCR).
It is proposed that a single latent constructs of attitudes to medicine (ATTMED)
is determinant of responses to the indicators of trust in the system (Trustsys),
trust in the midwife (Mid) together with the perceived risks (Risks) and benefits
(Ben) of screening. This is in keeping with current models of parental decision-
making that aggregate specific and general attitudes. This aggregation will allow
for a comparison with model 2 and assess the potential for differing effects between
specific and general attitudes. Choice is no longer proposed to act on this com-
bined construct. All other indicator/latent variable relationships remain as with
model 2.
7.4 Inference
As already alluded to, analysis starts with the specification of the model and the
posited relationships between variables. The next stage is to statistically analyse
these relationships. In the next section I review this process, beginning with the
process of path analysis.
7.4.1 Path analysis
Whilst the components of the path diagram were outlined in Section 7.2, the pro-
cess for analysing the diagram has yet to be discussed. In this next section I
introduce this process through path analysis which forms a major component of
structural equation modelling. In path analysis the hypothesised relationships be-
tween observed variables are quantified through the analysis of correlations. In
order to clarify the relationships within the model these relationships are usually
represented pictorially using a path diagram.
110

7. Structural Equation Modelling: Methods Stuart Nicholls
Figure 7.4: Path diagram showing the full combined structural and measurementcomponents of model 3
111
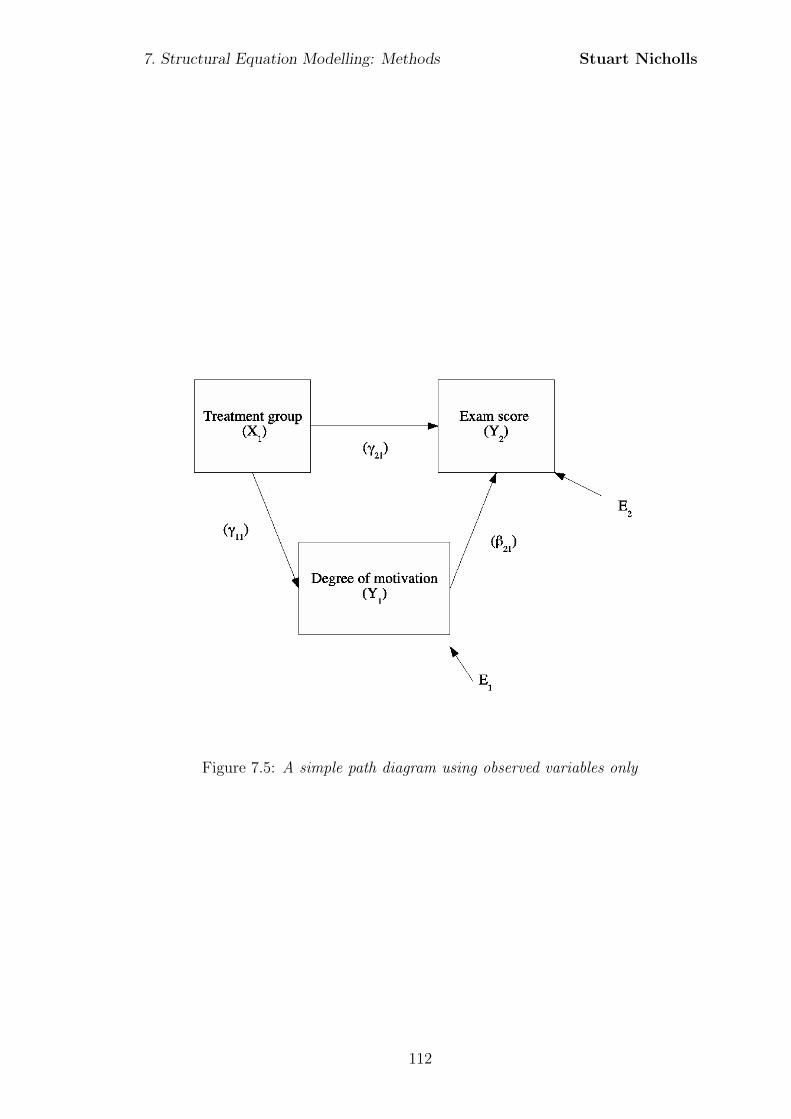
7. Structural Equation Modelling: Methods Stuart Nicholls
Figure 7.5: A simple path diagram using observed variables only
112

7. Structural Equation Modelling: Methods Stuart Nicholls
Figure 7.5 is taken from Tabachnick and Fidell (2001) and shows a simple example
of a path diagram. In this example exam score (Y2) is modelled to be an outcome
of degree of motivation (Y1) but also a study skills treatment group (X1). Both
exam score and degree of motivation are assumed to be measured with some degree
of error and so explicitly include error terms E1 and E2 which are assumed to be
independent from the variables (i.e. they do not covary). In analysing the model
one wishes to take account of both the direct effects of the treatment group, but
also the indirect effect via the variable Degree of motivation. In specifying the
model each of the dependent variables, Y1 and Y2 can be written as a function of
the independent variables thus:
Y1 = γ11X1 + ε1 (7.1)
where ε1 corresponds with E1 in the model, and
Y2 = β21Y1 + γ21X1 + ε2 (7.2)
.
Using the sample data and covariance algebra it is possible to generate parameter
estimates for β21, γ21, andγ11. The covariance of variables X and Y ; COV (X, Y ),
is defined as:
COV (X, Y ) =
∑ni=1(xi − x)(yi − y)
N − 1(7.3)
where (xi, yi), i = 1, ..., n are the sample values on the two variables and x and y
are their respective means.
In the determination of a covariance it is worth remembering:
113

7. Structural Equation Modelling: Methods Stuart Nicholls
COV (a,X) = 0 (7.4)
That is, the covariance of a variable X and a constant a is 0. But also that:
COV (aX, bY ) = abCOV (X, Y ) (7.5)
and
COV (X1 +X2, Y ) = COV (X1, Y ) + COV (X2, Y ) (7.6)
and noting finally that:
COV (X,X) = V AR(X) (7.7)
Returning to the example, one can show that the parameters of interest from the
regression equations can be re-written in terms of the variances and covariances:
COV (X1, Y1) = COV (X1, γ11X1 + ε1) (7.8)
applying Equation 7.6 this can be re-written as:
COV (X1, Y1) = COV (X1, γ11X1) + COV (X1, ε1) (7.9)
where we assume that COV (X1, ε1) = 0. Consequently this can be further revised
on the basis of Equation 7.5 so that:
COV (X1, Y1) = γ11COV (X1X1) (7.10)
which by Equation 7.7 gives us the variance so that:
COV (X1, Y1) = γ11σx1x1 (7.11)
so that the covariance of X1 and Y1 is equal to the path coefficient γ11 multiplied
114

7. Structural Equation Modelling: Methods Stuart Nicholls
by the variance of X1. Ultimately this can be re-arranged in order to calculate γ11
thus;
γ11 =COV (X1, Y1)
V AR(X1)(7.12)
This can be extended to calculate the remaining path coefficients, although the
algebra soon expands and for brevity is not shown here. Rather the example is
used to demonstrate that one can estimate the path coefficients from the covariance
and the variance. One can then use these parameters together with the proposed
model to create the implied population covariance matrix.
7.5 The structural model
Path analysis, whilst useful, is limited to the analysis of the observed variables.
This can, however, be extended to include latent variables. This is considered by
decomposing the full structural equation model into its constituent structural and
measurement components and considering how one includes the latent variables
within these.
The structural component of the model posits the relationship(s) between the
latent variables. This is formally defined as:
η = α + Bη + Γξ + ζ, (7.13)
where η is an m × 1 vector of latent endogenous variables, ξ is an n × 1 vector
of latent exogenous variables, α is an m × 1 vector of intercept terms, B is an
m×m matrix of coefficients that give the influence of ηs on each other and Γ as
an n×m matrix of coefficients for the effect of the ξ on η. Finally, ζ is an m× 1
vector of disturbances that contains the unexplained parts of the ηs (Bollen, 1998;
Heck and Thomas, 2009; Ullman, 2001). This model also assumes that, as with
the measurement model, the expectation of ζ is 0 and that errors and exogenous
115
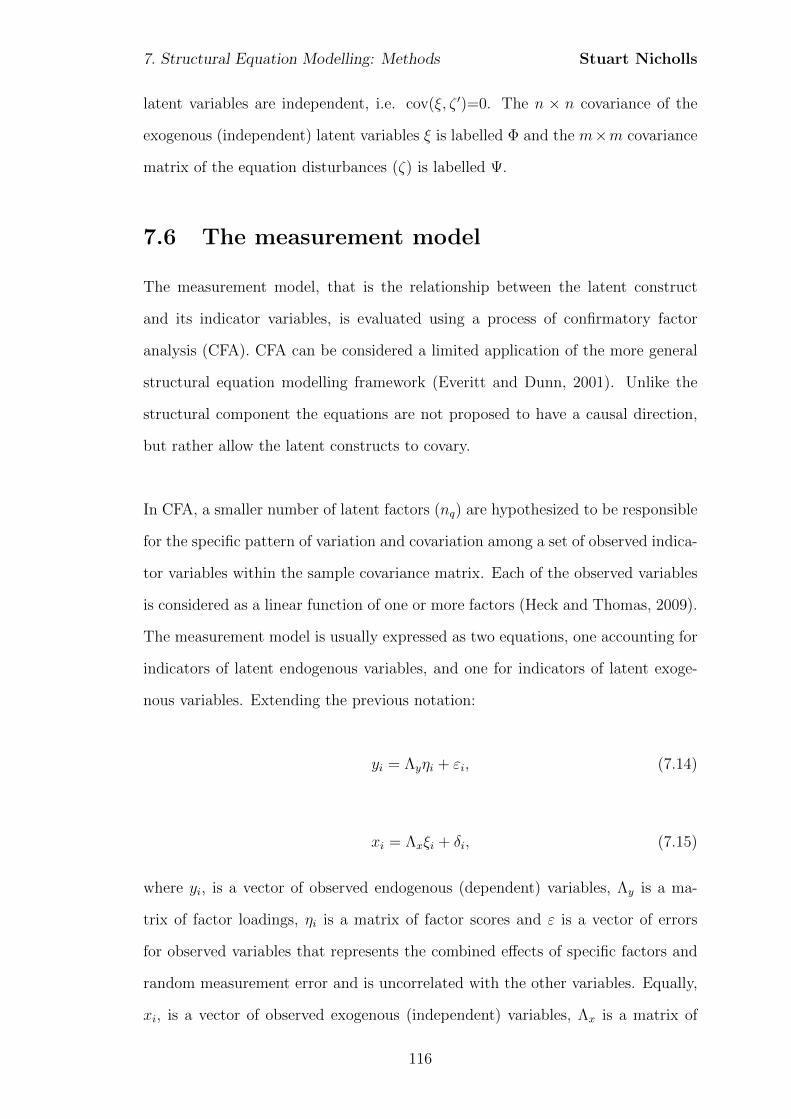
7. Structural Equation Modelling: Methods Stuart Nicholls
latent variables are independent, i.e. cov(ξ, ζ ′)=0. The n × n covariance of the
exogenous (independent) latent variables ξ is labelled Φ and the m×m covariance
matrix of the equation disturbances (ζ) is labelled Ψ.
7.6 The measurement model
The measurement model, that is the relationship between the latent construct
and its indicator variables, is evaluated using a process of confirmatory factor
analysis (CFA). CFA can be considered a limited application of the more general
structural equation modelling framework (Everitt and Dunn, 2001). Unlike the
structural component the equations are not proposed to have a causal direction,
but rather allow the latent constructs to covary.
In CFA, a smaller number of latent factors (nq) are hypothesized to be responsible
for the specific pattern of variation and covariation among a set of observed indica-
tor variables within the sample covariance matrix. Each of the observed variables
is considered as a linear function of one or more factors (Heck and Thomas, 2009).
The measurement model is usually expressed as two equations, one accounting for
indicators of latent endogenous variables, and one for indicators of latent exoge-
nous variables. Extending the previous notation:
yi = Λyηi + εi, (7.14)
xi = Λxξi + δi, (7.15)
where yi, is a vector of observed endogenous (dependent) variables, Λy is a ma-
trix of factor loadings, ηi is a matrix of factor scores and ε is a vector of errors
for observed variables that represents the combined effects of specific factors and
random measurement error and is uncorrelated with the other variables. Equally,
xi, is a vector of observed exogenous (independent) variables, Λx is a matrix of
116

7. Structural Equation Modelling: Methods Stuart Nicholls
factor loadings, ξi is a matrix of factor scores and δ is a vector of errors for observed
variables. Consequently the observed variables are linked to the underlying factors
through the factor loading matrix (Λ). The covariance matrix of ε is denoted Θε
with Θδ denoting the equivalent for δ. Equation 7.14 can be extended with the
inclusion of covariates:
yi = Ληi + Kxi + εi, (7.16)
where K is a matrix of regression coefficients relating the covariates to latent vari-
ables and xi is a vector of the covariates.
Thus if we wish to consider the covariance matrix of the observed variables we can
employ covariance algebra. This will allow us to develop the relationship between
the data matrix and the population (Reyment and Joreskog, 1993). Here I extend
only the notation for Y for the purpose of brevity.
Y = ηΛ′ + ε (7.17)
and
Y′ = Λη′ + ε′ (7.18)
In terms of variances and covariances:
1
NY′Y = Λ
[1
Nη′η
]Λ′ + Λ
[1
Nη′ε
]+
[1
Nε′η
]Λ′ +
1
Nε′ε (7.19)
In line with asymptotic behaviour, increasing sample sizes would, in general, lead
to variances and covariances more likely to be closer to the population values than
those of a smaller sample. Thus if we let the size N increase indefinitely, each term
in 7.19 will converge towards its population value. Hence
117

7. Structural Equation Modelling: Methods Stuart Nicholls
1
NY′Y→
∑,
1
Nη′η → Ψ,
1
Nη′ε→ 0,
1
Nε′ε→ Θ (7.20)
and we have
Σ = ΛΨΛ′ + Θ (7.21)
where Λ and Λ′ are the factor loading matrix and its inverse respectively, Ψ is a
q × q covariance matrix of factors and Θ is a p× p covariance matrix of the error
terms assumed to be normally distributed with a mean of 0 and some variance
(Heck and Thomas, 2009).
The significance of these formulations is that if one has details of the factor load-
ings and factor scores one can use these to model an implied population covariance
matrix. Comparing the model implied population covariance matrix and the sam-
ple covariance matrix we can summarise the degree of correspondence between the
two matrices. As the level of correspondence increases the population covariance
matrix more closely resembles the sample covariance matrix, or put another way,
the model more closely resembles the data. This comparison between the popula-
tion covariance matrix and the sample covariance matrix is the starting point for
evaluation of the model and the development of goodness-of-fit indices.
7.6.1 Identification
A pre-requisite to the evaluation of the structural equation model is that it must be
identified. Identification is the process of attempting to estimate each parameter
for which a correlation or covariance cannot be directly calculated. For a model to
be identified there must be an effective number of parameters equal to, or less than
the number of sample variances/covariances available from the observed variables
(MacCallum, 1995; Raykov and Marcoulides, 2000; Kline, 2005). This is some-
118
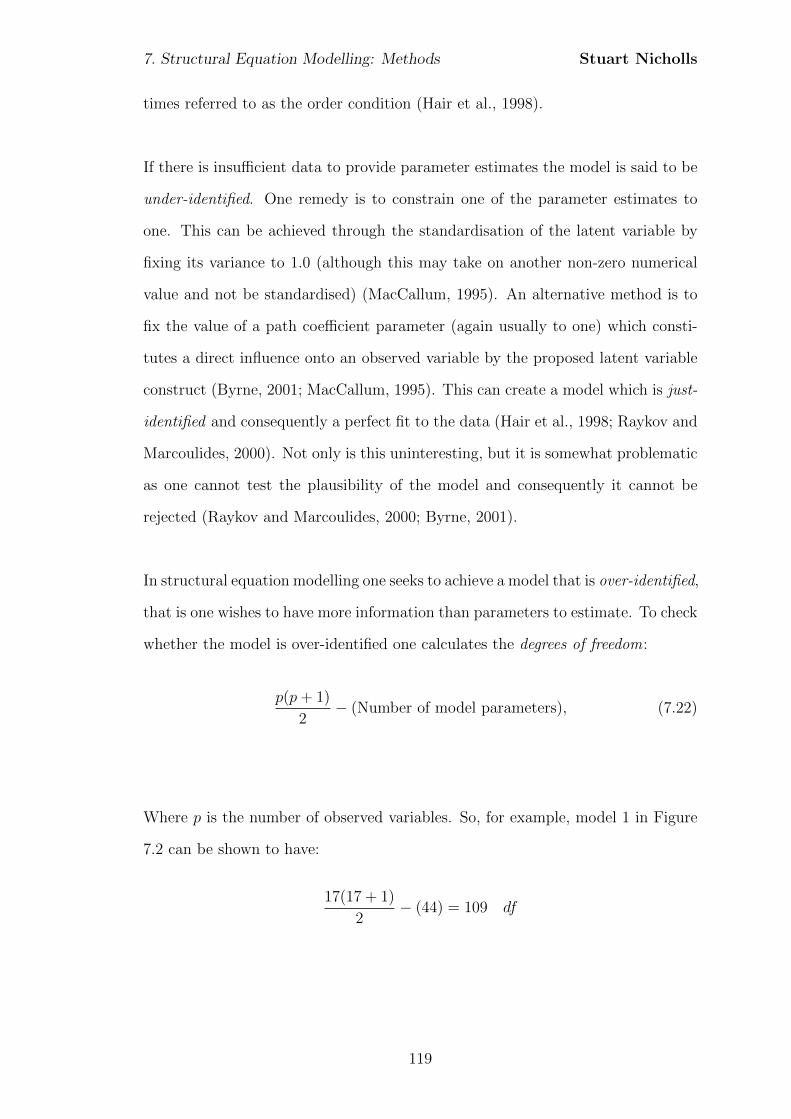
7. Structural Equation Modelling: Methods Stuart Nicholls
times referred to as the order condition (Hair et al., 1998).
If there is insufficient data to provide parameter estimates the model is said to be
under-identified. One remedy is to constrain one of the parameter estimates to
one. This can be achieved through the standardisation of the latent variable by
fixing its variance to 1.0 (although this may take on another non-zero numerical
value and not be standardised) (MacCallum, 1995). An alternative method is to
fix the value of a path coefficient parameter (again usually to one) which consti-
tutes a direct influence onto an observed variable by the proposed latent variable
construct (Byrne, 2001; MacCallum, 1995). This can create a model which is just-
identified and consequently a perfect fit to the data (Hair et al., 1998; Raykov and
Marcoulides, 2000). Not only is this uninteresting, but it is somewhat problematic
as one cannot test the plausibility of the model and consequently it cannot be
rejected (Raykov and Marcoulides, 2000; Byrne, 2001).
In structural equation modelling one seeks to achieve a model that is over-identified,
that is one wishes to have more information than parameters to estimate. To check
whether the model is over-identified one calculates the degrees of freedom:
p(p+ 1)
2− (Number of model parameters), (7.22)
Where p is the number of observed variables. So, for example, model 1 in Figure
7.2 can be shown to have:
17(17 + 1)
2− (44) = 109 df
119

7. Structural Equation Modelling: Methods Stuart Nicholls
The degrees of freedom, denoted df , is a measure of the number of free model
parameters (Kline, 2005). A just-identified model would have 0 degrees of free-
dom. An over-identified model would have 1 or more degrees of freedom. Thus in
this case the proposed model can be seen to be over-identified and amenable to
statistical analysis and model testing.
This appears to present a problem as an overidentified model will not have an
exact solution due to differing parameter estimates that can be generated from
the sample data. For example if we consider the following equations:
x1 + x2 = 5 (7.23)
2x1 + x2 = 8 (7.24)
x1 + 2x2 = 9 (7.25)
Unique solutions can be found if the equations are considered in pairs but no
unique solution exists for all three equations. In the same way, an over identified
model will not have a single unique value for the parameter estimates. Whilst
not providing a unique solution, it does provide the opportunity to test different
models and compare them using specified criteria (Chou and Bentler, 1995). We
can, for example, consider the equations to be a combination of parameters and
error which provide us with our data. So that
5 = x1 + x2 + ε1 (7.26)
8 = 2x1 + x2 + ε2 (7.27)
9 = x1 + 2x2 + ε3 (7.28)
If we implement the criterion to minimise the residual sum of squares (RSS), where
120

7. Structural Equation Modelling: Methods Stuart Nicholls
RSS =∑n
i=1(yi − f(xi))2, we find
RSS = (5− (x1 + x2))2 + (8− (2x1 + x2))
2 + (9− (x1 + 2x2))2 (7.29)
Solving for both x1 and x2 gives the solution of x1 = 2.273 and x2 = 3.273 with an
RSS of 0.36. Smaller values of RSS indicate a better fit and so different models can
be evaluated and the RSS values compared (although one needs to control for the
number of predictor variables). Hence overidentification brings with it advantages
of being able to create and assess different models by comparing the fit of the
parameter estimates. This, however, requires one to not only develop methods
with which to estimate the parameters, but also ways in which to evaluate the
overall fit of the model.
7.6.2 Estimation procedure
In order to find a unique solution in an over-identified model an estimation pro-
cedure is implemented, through which the parameter estimates are created. The
aim is to identify parameter values which, when entered into the model, minimise
the discrepancy between the sample covariance matrix and the implied population
covariance matrix. By imposing some form of statistical criteria to control the esti-
mation process, as done in the above example, we describe a minimisation function.
The parameter estimates are plugged into the structural equations derived from
the model in order to produce the implied covariance matrix. Most commonly this
is achieved through the Maximum likelihood fit function (Bentler and Dudgeon,
1996) which minimises the following:
FML = log|Σ| − log|S|+ tr(SΣ−1)− ρ (7.30)
where Σ is the implied population covariance matrix, Σ−1 is the inverse of the
121
7. Structural Equation Modelling: Methods Stuart Nicholls
implied population covariance matrix, S is the sample covariance matrix and ρ is
the number of measured variables.
The benefit of maximum likelihood estimation over other methods, such as ordi-
nary least squares; where one attempts to minimise the sums of squared deviations,
is that the estimates are computed simultaneously, as opposed to sequentially.
Whilst alternative estimation techniques such as the Asymptotically Distribution
Free estimator (ADF) have been shown to work well, they require very large sample
sizes - in the order of 1000 to 5000 cases (West et al., 1995). Such large samples are
beyond the practicalities of this study. Other methods, such as generalised least
squares, have been found to produce negatively biased estimates in comparison to
maximum likelihood estimation (Chou and Bentler, 1995).
A further advantage of maximum likelihood estimation is its flexibility for inter-
pretation. This is because the procedure is ‘scale free’ but also ‘scale invariant’,
meaning that the scale of the fitting function is consistent, irrespective of the
observed variables’ scale (Kline, 2005, p115).
7.6.3 Data assumptions for parameter estimation
In Section 7.2 it was noted that the evaluation of model fit is often based on
the χ2 statistic. This statistic, derived from the fit function, is distributed χ2 if
the data are multivariate normal (Hoyle, 1995). The requirement of multivariate
normality means that maximum likelihood estimation is susceptible to errors if
data is severely non-normal (West et al., 1995). The importance of this lies in the
potential effects that non-normality has on both the parameter estimates and the
model fit, potentially over-rejecting models (Hair et al., 1998).
Non-normality appears to have differing effects on different aspects of model esti-
mation. Lei and Lomax (2005) found that whilst severe non-normality affected χ2
122
7. Structural Equation Modelling: Methods Stuart Nicholls
values of model fit, moderate deviations from normality (defined as skewness of less
than 0.45 and kurtosis less than 1.5) had negligible effects. Parameter estimates,
on the other hand, have been shown to be robust to even severe non-normality
(Schermelleh-Engel et al., 2003; Lei and Lomax, 2005). Other studies have sug-
gested even greater robustness of the χ2 noting only substantial overestimation
when skew was 2.028 and kurtosis 2.898 (Muthen and Kaplan, 1985). Variability
in the acceptable levels of skew and kurtosis exist with some recommending values
of skew less than 2.0 and others up to 3.0 (Kline, 2005) are acceptable. For kurtosis
there is less agreement with some suggesting that absolute values less than 7.0 may
be appropriate for maximum likelihood estimation (West et al., 1995; Curran et al.,
1996; Kline, 2005; Finney and DiStefano, 2006), although these recommendations
range as high as 10.0 (Kline, 2005). More recent research has, however, suggested
that for models with combined skew of 2.0 and kurtosis of 7.0, the maximum
likelihood χ2 may not be robust, even with large sample sizes (Nevitt and Han-
cock, 2001). Research has also found that given non-normal data, the maximum
likelihood-based standard errors will be underestimated (Finney and DiStefano,
2006). Consequently, parameter estimates appear to be relatively robust to devi-
ations from normality, but χ2 and standard errors of parameter estimates may be
more susceptible to bias from increasing normality.
Consequently the data will be tested for normality. Univariate normality will be
assessed through the evaluation of skewness and kurtosis. Visual analysis will be
through the production of histograms and will be supported by statistical eval-
uations in the form of the Kolmogorov-Smirnov and Shapiro-Wilks statistics. If
univariate analyses reveal only mild to moderate non-normality (here using a con-
servative estimate of skew less than 2.0 and kurtosis less than 3.0) then maximum
likelihood estimation will be employed. If data is shown to be be severely uni-
variate, and hence multivariate nonnormal, then maximum likelihood parameter
estimates with standard errors and a Satorra-Bentler χ2 will be used. The Satorra-
123

7. Structural Equation Modelling: Methods Stuart Nicholls
Bentler scaled χ2 is discussed in the next section.
7.7 Assessing model fit
Much of the debate around structural equation modelling has focussed on the
assessment of model fit, with much disagreement regarding appropriateness. Model
fit is usually evaluated using the χ2 statistic:
χ2 = (N − 1)Fmin (7.31)
where N is the sample size and Fmin is the minimum fit function.
If, as already suggested, the data is not multivariate normal then the χ2 statistic
in its usual form is inappropriate. To account for non-normality one can employ
the Satorra-Bentler χ2 which corrects the normal theory chi-square by a constant
c, that is determined in part by the observed multivariate kurtosis, and the model
degrees of freedom. This is defined as
Satorra−Bentler χ2 =df
tr(USy)TML (7.32)
where TML is the traditional maximum likelihood test statistic, df is the degrees of
freedom in the model, U is the weight matrix and residual weight matrix under the
model and Sy is the asymptotic covariance matrix (Hu et al., 1992; Ullman, 2001).
This scaled test statistic has been shown to be reliable under various distributions
(Curran et al., 1996; Byrne, 2001).
In contrast to the conventional application of the chi-squared statistic one seeks
an insignificant difference between the sample and the fitted covariance matrices
(Byrne, 2001; Ullman, 2001; Ho, 2006).
Reliance on the χ2 statistic alone is problematic as the null hypothesis of a per-
124
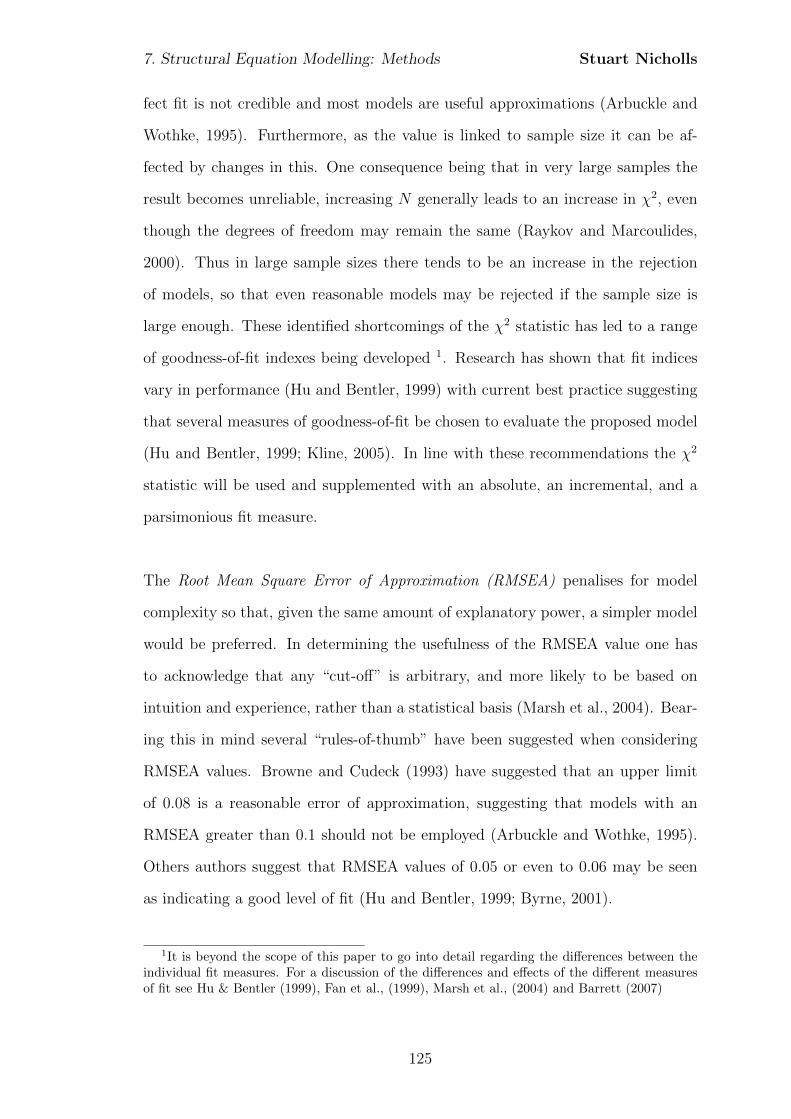
7. Structural Equation Modelling: Methods Stuart Nicholls
fect fit is not credible and most models are useful approximations (Arbuckle and
Wothke, 1995). Furthermore, as the value is linked to sample size it can be af-
fected by changes in this. One consequence being that in very large samples the
result becomes unreliable, increasing N generally leads to an increase in χ2, even
though the degrees of freedom may remain the same (Raykov and Marcoulides,
2000). Thus in large sample sizes there tends to be an increase in the rejection
of models, so that even reasonable models may be rejected if the sample size is
large enough. These identified shortcomings of the χ2 statistic has led to a range
of goodness-of-fit indexes being developed 1. Research has shown that fit indices
vary in performance (Hu and Bentler, 1999) with current best practice suggesting
that several measures of goodness-of-fit be chosen to evaluate the proposed model
(Hu and Bentler, 1999; Kline, 2005). In line with these recommendations the χ2
statistic will be used and supplemented with an absolute, an incremental, and a
parsimonious fit measure.
The Root Mean Square Error of Approximation (RMSEA) penalises for model
complexity so that, given the same amount of explanatory power, a simpler model
would be preferred. In determining the usefulness of the RMSEA value one has
to acknowledge that any “cut-off” is arbitrary, and more likely to be based on
intuition and experience, rather than a statistical basis (Marsh et al., 2004). Bear-
ing this in mind several “rules-of-thumb” have been suggested when considering
RMSEA values. Browne and Cudeck (1993) have suggested that an upper limit
of 0.08 is a reasonable error of approximation, suggesting that models with an
RMSEA greater than 0.1 should not be employed (Arbuckle and Wothke, 1995).
Others authors suggest that RMSEA values of 0.05 or even to 0.06 may be seen
as indicating a good level of fit (Hu and Bentler, 1999; Byrne, 2001).
1It is beyond the scope of this paper to go into detail regarding the differences between theindividual fit measures. For a discussion of the differences and effects of the different measuresof fit see Hu & Bentler (1999), Fan et al., (1999), Marsh et al., (2004) and Barrett (2007)
125

7. Structural Equation Modelling: Methods Stuart Nicholls
The Comparative Fit Index (CFI) is an incremental fit measure. The CFI has a
range from 0 to 1.0, with a higher value indicating a better fit of the model. It is
worth noting that a CFI of 1.0 is not equivalent to a perfect fit, but rather that
χ2m < dfm (Kline, 2005). A general rule of thumb is that a CFI > 0.9 is indicative
of a model that is a good fit (Byrne, 2001; Kline, 2005). The CFI has also been
shown to be robust to non-normality (Lei and Lomax, 2005).
The Akaike information criterion (AIC) is a comparative measure (Hair et al.,
1998) and so has no fixed metric. Lower values indicate better fit.
Table 7.1 describes the formulae for each fit index, together with information on
interpretation.
Index Formula Comment
RMSEA√
δmdfm(N−1) δm =max(χ2
m − dfm, 0) with χ2m repre-
senting the chi-square statistic of themodel, and dfm the degrees of freedomwithin the model. < 0.05 indicatesgood fit, > 0.08 indicates poor fit.
CFI 1− δmδb
δm =max(χ2m − dfm, 0) where χ2
m rep-resents the chi-square statistic of themodel, and dfm the degrees of freedom.δb is the equivalent but calculated forthe baseline model. Range from 0 to1.0, a CFI > 0.9 indicates good fit.
AIC χ2 + 2q χ2 is calculated as before and q isthe number of free model parameters.Lower values indicate better fit.
Table 7.1: Formulas and descriptions for the selected fit indexes
Should the fit indices indicate a reasonable or good level of fit then the free pa-
rameter estimates are evaluated through comparisons between the estimate and
it’s standard error (Hoyle, 1995). These tests are based on the unstandardised
parameter estimates as the use of standardised estimates may lead to incorrect
126
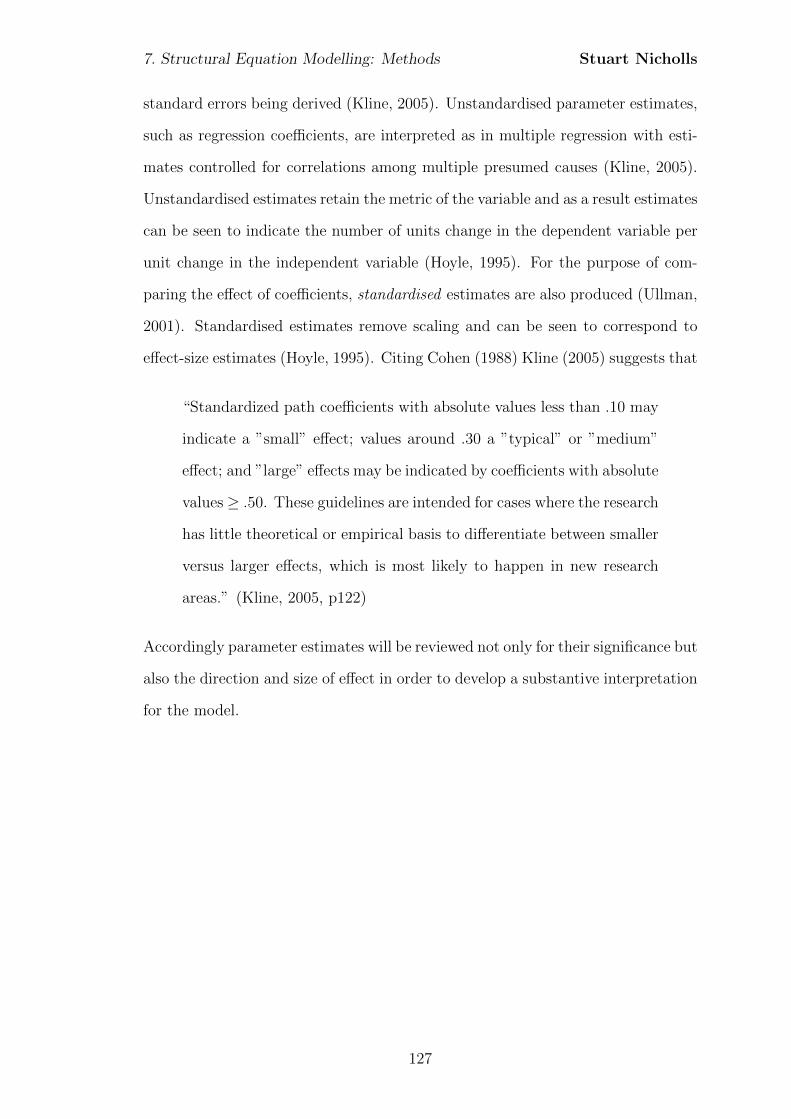
7. Structural Equation Modelling: Methods Stuart Nicholls
standard errors being derived (Kline, 2005). Unstandardised parameter estimates,
such as regression coefficients, are interpreted as in multiple regression with esti-
mates controlled for correlations among multiple presumed causes (Kline, 2005).
Unstandardised estimates retain the metric of the variable and as a result estimates
can be seen to indicate the number of units change in the dependent variable per
unit change in the independent variable (Hoyle, 1995). For the purpose of com-
paring the effect of coefficients, standardised estimates are also produced (Ullman,
2001). Standardised estimates remove scaling and can be seen to correspond to
effect-size estimates (Hoyle, 1995). Citing Cohen (1988) Kline (2005) suggests that
“Standardized path coefficients with absolute values less than .10 may
indicate a ”small” effect; values around .30 a ”typical” or ”medium”
effect; and ”large” effects may be indicated by coefficients with absolute
values ≥ .50. These guidelines are intended for cases where the research
has little theoretical or empirical basis to differentiate between smaller
versus larger effects, which is most likely to happen in new research
areas.” (Kline, 2005, p122)
Accordingly parameter estimates will be reviewed not only for their significance but
also the direction and size of effect in order to develop a substantive interpretation
for the model.
127
Chapter 8
Structural equation modelling:
Results
Following the previous chapters in which a structural model was proposed and the
measurement model defined, the final stage is to bring the two aspects together to
evaluate the proposed full latent model. In this chapter I first assess the indicator
variables to check the assumption of normality. I then present some simple de-
scriptive statistics before evaluating the three proposed models. Initial descriptive
statistics were generated using SPSS (SPSS Inc, 2008). Confirmatory factor anal-
ysis and structural equation modelling were conducted using MPlus v6.0 (Muthen
and Muthen, 2010).
8.1 Normality
Visual assessment of histograms for each indicator (not shown) suggested non-
normality. This was then confirmed through descriptive statistics of skew and
kurtosis as well as appropriate test statistics, which are shown in Table 8.1. In all
cases the variables are found to be non-normal.
The extent to which the variables are non-normal does, however, differ and whilst
skew is within the proposed limits within which maximum likelihood estimation is
128
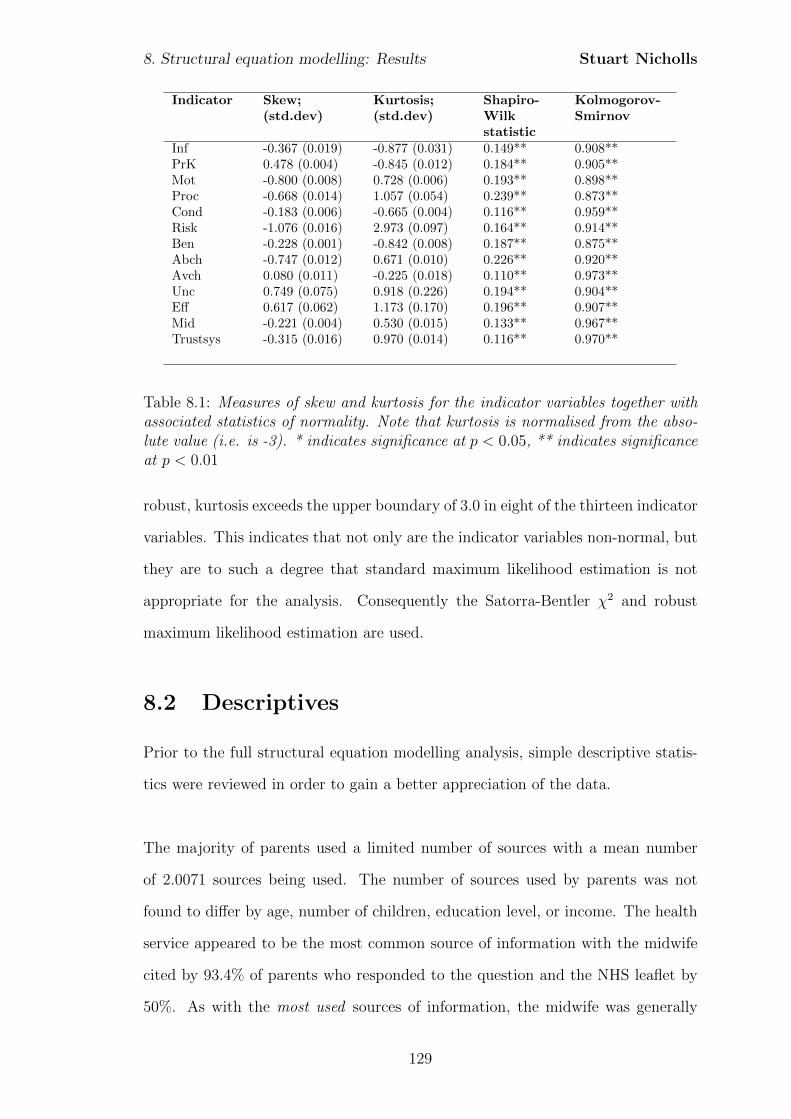
8. Structural equation modelling: Results Stuart Nicholls
Indicator Skew;(std.dev)
Kurtosis;(std.dev)
Shapiro-Wilkstatistic
Kolmogorov-Smirnov
Inf -0.367 (0.019) -0.877 (0.031) 0.149** 0.908**PrK 0.478 (0.004) -0.845 (0.012) 0.184** 0.905**Mot -0.800 (0.008) 0.728 (0.006) 0.193** 0.898**Proc -0.668 (0.014) 1.057 (0.054) 0.239** 0.873**Cond -0.183 (0.006) -0.665 (0.004) 0.116** 0.959**Risk -1.076 (0.016) 2.973 (0.097) 0.164** 0.914**Ben -0.228 (0.001) -0.842 (0.008) 0.187** 0.875**Abch -0.747 (0.012) 0.671 (0.010) 0.226** 0.920**Avch 0.080 (0.011) -0.225 (0.018) 0.110** 0.973**Unc 0.749 (0.075) 0.918 (0.226) 0.194** 0.904**Eff 0.617 (0.062) 1.173 (0.170) 0.196** 0.907**Mid -0.221 (0.004) 0.530 (0.015) 0.133** 0.967**Trustsys -0.315 (0.016) 0.970 (0.014) 0.116** 0.970**
Table 8.1: Measures of skew and kurtosis for the indicator variables together withassociated statistics of normality. Note that kurtosis is normalised from the abso-lute value (i.e. is -3). * indicates significance at p < 0.05, ** indicates significanceat p < 0.01
robust, kurtosis exceeds the upper boundary of 3.0 in eight of the thirteen indicator
variables. This indicates that not only are the indicator variables non-normal, but
they are to such a degree that standard maximum likelihood estimation is not
appropriate for the analysis. Consequently the Satorra-Bentler χ2 and robust
maximum likelihood estimation are used.
8.2 Descriptives
Prior to the full structural equation modelling analysis, simple descriptive statis-
tics were reviewed in order to gain a better appreciation of the data.
The majority of parents used a limited number of sources with a mean number
of 2.0071 sources being used. The number of sources used by parents was not
found to differ by age, number of children, education level, or income. The health
service appeared to be the most common source of information with the midwife
cited by 93.4% of parents who responded to the question and the NHS leaflet by
50%. As with the most used sources of information, the midwife was generally
129
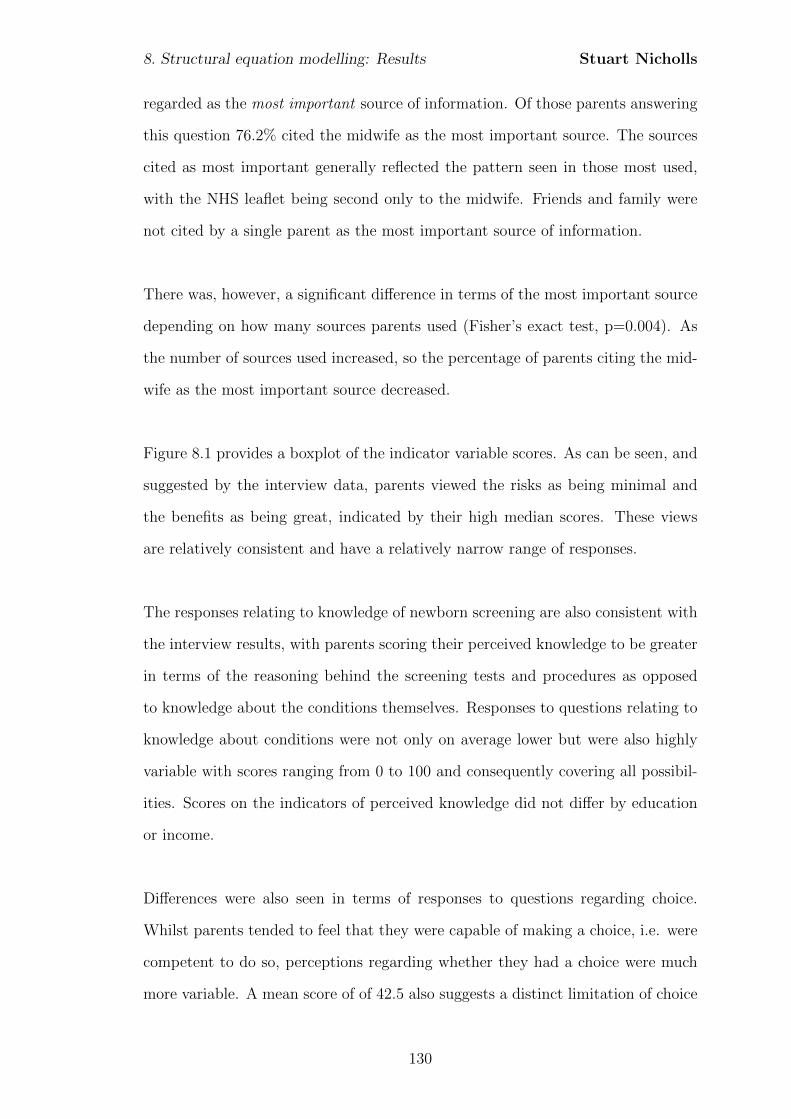
8. Structural equation modelling: Results Stuart Nicholls
regarded as the most important source of information. Of those parents answering
this question 76.2% cited the midwife as the most important source. The sources
cited as most important generally reflected the pattern seen in those most used,
with the NHS leaflet being second only to the midwife. Friends and family were
not cited by a single parent as the most important source of information.
There was, however, a significant difference in terms of the most important source
depending on how many sources parents used (Fisher’s exact test, p=0.004). As
the number of sources used increased, so the percentage of parents citing the mid-
wife as the most important source decreased.
Figure 8.1 provides a boxplot of the indicator variable scores. As can be seen, and
suggested by the interview data, parents viewed the risks as being minimal and
the benefits as being great, indicated by their high median scores. These views
are relatively consistent and have a relatively narrow range of responses.
The responses relating to knowledge of newborn screening are also consistent with
the interview results, with parents scoring their perceived knowledge to be greater
in terms of the reasoning behind the screening tests and procedures as opposed
to knowledge about the conditions themselves. Responses to questions relating to
knowledge about conditions were not only on average lower but were also highly
variable with scores ranging from 0 to 100 and consequently covering all possibil-
ities. Scores on the indicators of perceived knowledge did not differ by education
or income.
Differences were also seen in terms of responses to questions regarding choice.
Whilst parents tended to feel that they were capable of making a choice, i.e. were
competent to do so, perceptions regarding whether they had a choice were much
more variable. A mean score of of 42.5 also suggests a distinct limitation of choice
130
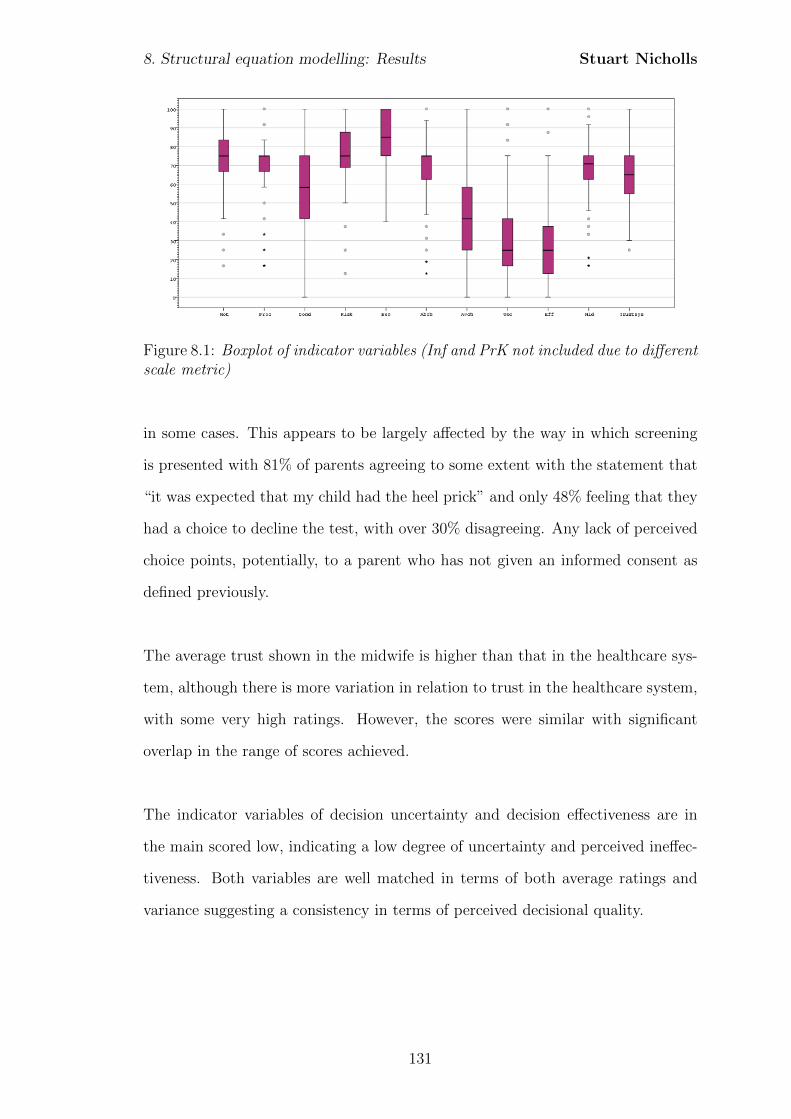
8. Structural equation modelling: Results Stuart Nicholls
Figure 8.1: Boxplot of indicator variables (Inf and PrK not included due to differentscale metric)
in some cases. This appears to be largely affected by the way in which screening
is presented with 81% of parents agreeing to some extent with the statement that
“it was expected that my child had the heel prick” and only 48% feeling that they
had a choice to decline the test, with over 30% disagreeing. Any lack of perceived
choice points, potentially, to a parent who has not given an informed consent as
defined previously.
The average trust shown in the midwife is higher than that in the healthcare sys-
tem, although there is more variation in relation to trust in the healthcare system,
with some very high ratings. However, the scores were similar with significant
overlap in the range of scores achieved.
The indicator variables of decision uncertainty and decision effectiveness are in
the main scored low, indicating a low degree of uncertainty and perceived ineffec-
tiveness. Both variables are well matched in terms of both average ratings and
variance suggesting a consistency in terms of perceived decisional quality.
131
8. Structural equation modelling: Results Stuart Nicholls
8.2.1 Correlation matrix
In order to gain a better appreciation of possible associations one can consider the
correlations between the indicator variables. Table 8.2 shows the simple bivari-
ate correlations between the variables included within the analysis. As expected,
indicators which relate to the same latent variable show an acceptable level of
correlation.
The bivariate correlations suggest that the relationship between information-seeking
and decision making may not be a simple process. A negative correlation of -0.088
exists between the number of children (Numch) and the number of sources used
by the parent (Numsce) suggesting that as parents have more children they access
a more limited number of sources of information. This, however, is not significant
(p > 0.05) indicating a lack of any real difference depending on number of children.
There is also a positive correlation between the number of children and trust in the
midwife (0.060), yet a negative association with more general trust in the health-
care system (-0.091). However, both of these correlations are small and again are
not significant (p > 0.05), suggesting that experience - indicated through number
of children - has little association with trust nor manifest information-seeking.
Another expected relationship proposed in model 1 is that increased information-
seeking will lead to increased knowledge. Correlations between number of sources
of information (Numsce) and the knowledge items of Mot, Proc and Cond are non-
significant at the 5% level, nor are correlations between information-seeking be-
haviour (Inf) and the three items assessing perceived knowledge. Perceived knowl-
edge also did not appear to be affected significantly by the source of information
deemed most important (Kruskall-Wallis non-parametric ANOVA p > 0.1 for each
knowledge item). This may suggest that the relationship between information-
seeking (and provision) and knowledge is either missing, or more complex than
predicted.
132

8. Structural equation modelling: Results Stuart Nicholls
Ff
Age
Num
ch
Mot
Proc
Num
sce
Inf
Prk
Cond
Ris
kB
en
Ab
ch
Avch
Unc
Eff
Mid
Trustsys
Ff
1.000
Age
-0.015
1.000
Num
ch
0.007
0.2
15
1.000
Mot
0.032
0.137
0.043
1.000
Proc
-0.014
0.031
0.068
0.7
52
1.000
Num
sce
-0.048
0.122
-0.088
0.134
0.050
1.000
Inf
-0.047
0.100
0.067
-0.029
0.027
0.1
63
1.000
Prk
0.059
-0.009
0.039
0.3
03
0.2
47
0.120
0.045
1.000
Cond
0.143
0.018
0.065
0.6
80
0.6
17
0.028
-0.132
0.3
47
1.000
Ris
k-0
.198
0.112
0.048
0.1
83
0.1
60
-0.131
-0.135
-0.035
0.098
1.000
Ben
-0.083
0.125
-0.005
0.4
74
0.4
40
-0.033
-0.044
0.134
0.2
93
0.4
41
1.000
Ab
ch
-0.136
-0.035
-0.012
0.4
46
0.3
85
0.125
-0.068
0.2
43
0.3
70
0.2
94
0.3
32
1.000
Avch
0.013
-0.015
0.031
0.3
55
0.2
94
0.077
-0.079
0.1
97
0.4
07
0.081
0.082
0.3
70
1.000
Unc
-0.001
0.061
0.113
-0.5
72
-0.4
92
-0.138
0.003
-0.2
87
-0.4
26
-0.1
96
-0.4
59
-0.4
55
-0.3
93
1.000
Eff
-0.021
0.019
0.024
-0.5
96
-0.4
81
-0.083
0.056
-0.3
03
-0.4
71
-0.1
96
-0.5
23
-0.3
83
-0.3
82
0.8
50
1.000
Mid
0.058
-0.2
10
0.060
0.1
90
0.2
19
-0.044
-0.2
54
0.093
0.2
75
0.152
0.2
94
0.149
0.1
82
-0.2
97
-0.3
93
1.000
Trustsys
0.014
-0.034
-0.091
0.3
39
0.3
46
0.086
-0.2
44
0.147
0.3
51
0.2
16
0.3
59
0.2
38
0.2
13
-0.3
01
-0.3
59
0.5
17
1.000
Tab
le8.
2:B
ivar
iate
corr
elat
ion
sof
the
obse
rved
indi
cato
rva
riab
les.
Sig
nifi
can
tco
rrel
atio
ns
are
indi
cate
din
bold
(p<
0.05
)
133
8. Structural equation modelling: Results Stuart Nicholls
Furthermore, the number of sources used appears to show little association with
trust in either the midwife or the healthcare system more generally. This may in-
dicate a lack of relationship between ATTMED and INFSK as predicted in model
1. Yet, if one considers the most important source of information, then this is
significantly associated with trust in the midwife (Kruskall-Wallis non-parametric
ANOVA p < 0.05). Perhaps unsurprisingly those parents who cite the midwife as
the most important source show the highest levels of trust in the midwife. Those
parents citing the internet as the most important source of information showed the
lowest levels of trust in the midwife. Such a finding is in keeping with the interview
data where parents indicated that contentious topics or where uncertainty existed,
may be candidates for internet use. The lower levels of trust in the midwife may,
therefore, be conducive to increased uncertainty leading to increased internet use.
Number of children (Numch) shows small, but non-significant associations with
perceived knowledge of the motivation for screening, procedures, and conditions.
Equally Age shows small and non-significant correlations with perceived knowl-
edge of the procedures and conditions for which screening is conducted. Whilst
age appears to show a small correlation with knowledge of the motivation behind
screening, this is found to be non significant also.
The predicted relationship between perceived choice and perceived knowledge is
also suggested, with significant positive correlations between perceived choice and
perceived knowledge of the motivation for screening (0.355, p < 0.01), procedures
(0.294, p < 0.01), and conditions for which screening is conducted (0.407, p <
0.01). In addition perceived choice, perceived risks and perceived benefits all
show a significant (all p < 0.01) negative association with decisional uncertainty
and decisional effectiveness. These suggest that as perceived choice, the perceived
benefits and perceived lack of risks increase, so decisional uncertainty and perceived
134
8. Structural equation modelling: Results Stuart Nicholls
decisional ineffectiveness decrease, as proposed in the structural model. These
bivariate correlations are, therefore, not only of the proposed directionality but
are also in keeping with the proposed structural models regarding the factors
influencing parental decisional quality in relation to their acceptance of newborn
bloodspot screening.
8.3 Model development
In line with best practice the models were evaluated in a two-stage process. Firstly
the measurement model was evaluated in terms of how well the data fit the latent
variables. Secondly the full structural model was evaluated to include the pro-
posed relationships between latent constructs.
In the first stage each of the models are evaluated for their measurement compo-
nent only. Each indicator, the summated scales previously generated, loads onto
a single theoretical construct, or latent variable. In light of the amendments made
during scale construction the confirmatory factor analysis models are shown below
with a description of the loadings. In order to better evaluate the measurement
model fit, the latent variable variances were fixed at one, allowing the factor load-
ings to be freely estimated.
Following the confirmatory factor analyses models 2 and model 3 are evaluated
on both the measurement and structural aspects. In contrast to the CFA the
variances of the latent variables were freely estimated and, in order to ensure the
model was identified, the loading on the first indicator for each latent construct
was constrained to one.
135

8. Structural equation modelling: Results Stuart Nicholls
8.3.1 Model 1: Confirmatory Factor Analysis
Analysis of the measurement component of model 1 (not shown) reveals a border-
line good fit according to the CFI (mean 0.938, standard deviation = 0.002) and
RMSEA (mean 0.057, standard deviation = 0.001) although a χ2 of 146.153 on
98 degrees of freedom is highly significant suggesting poor model fit (p = 0.001).
Despite the apparently reasonable model fit, a review of the parameter estimates
suggests that both the latent variables of INFSK and EXP poorly predict their
associated indicator variables (all p > 0.1). This suggests that INFSK and EXP
should be removed from the model. Modification of the model, through the removal
of the non-significant variables, generates the proposed measurement component
for model 2 and as such the analysis proceeds with the evaluation of this second
model.
136
8. Structural equation modelling: Results Stuart Nicholls
8.3.2 Model 2: Confirmatory Factor Analysis
The initial analysis of the model shown in Figure 8.2 revealed a negative error
variance for the variable Ben. This value of -33.984 is not, however, significant
(p = 0.658). Given the lack of negative error variances in model 1 it is not
assumed to be caused by misspecification of the model but, rather, may be due to a
combination of a relatively small sample together with only having two-indicators
for the factor (Kline, 2005). As this is the only variable that is erroneous it is
constrained to only allow error variances of zero or greater (Kline, 2005). Refitting
the model with this constraint provides a good fit by the CFI (mean 0.981, standard
deviation = 0.003) and RMSEA (mean 0.049, standard deviation = 0.004). All
factor loadings are significant at the 5% level and so are retained.
Modification
No modifications are suggested and so the initial model is retained.
8.3.3 Model 2: Structural Equation Model
The initial model fitted is that shown in Figure 8.3. As with the measurement
model, the fit indices suggested that model 2 was a reasonable fit to the data with
a CFI of 0.950 (standard deviation of 0.003) and an RMSEA of 0.067 (standard
deviation 0.002). These were slightly contradicted with a χ2 value of 78.609 on 47
degrees of freedom, indicating a significant value at the 5% level (p = 0.002616).
Reviewing the parameter estimates indicated that the majority of estimates are
highly significant and should be retained. However, the path coefficient CHOICE
→ ATTSCR is not significant at the 5% level (p = 0.312) suggesting that this
should be removed from the model.
137
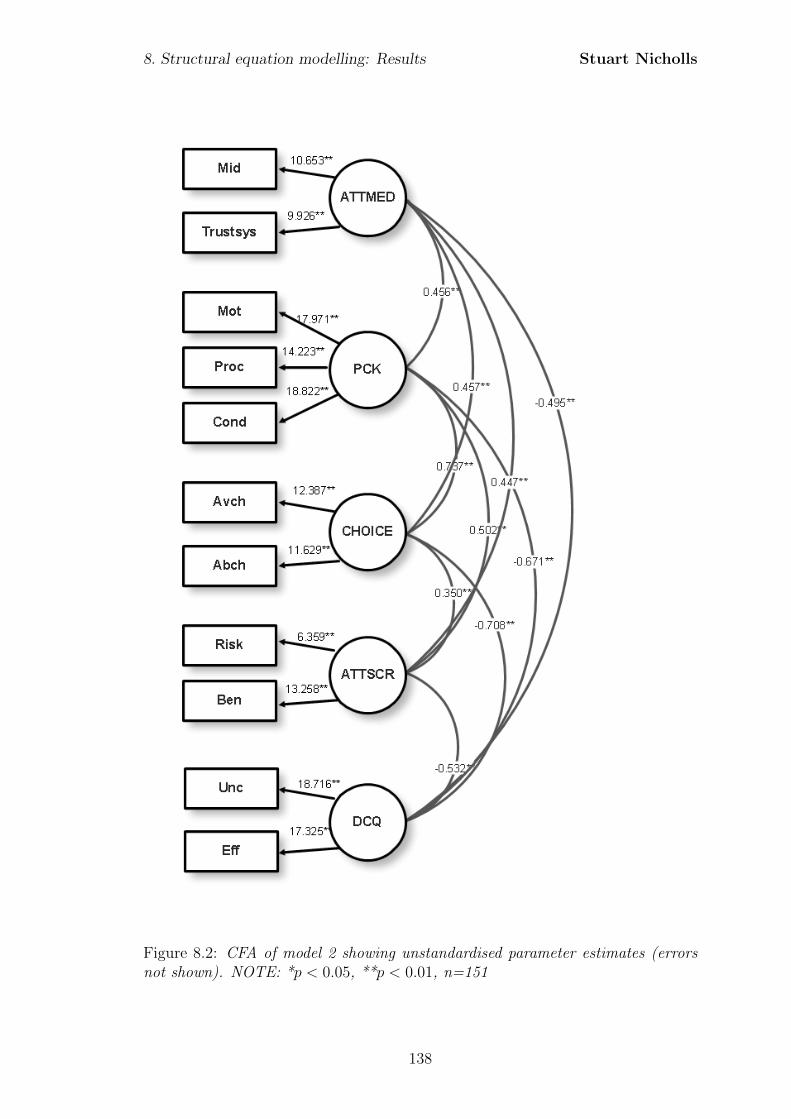
8. Structural equation modelling: Results Stuart Nicholls
Figure 8.2: CFA of model 2 showing unstandardised parameter estimates (errorsnot shown). NOTE: *p < 0.05, **p < 0.01, n=151
138
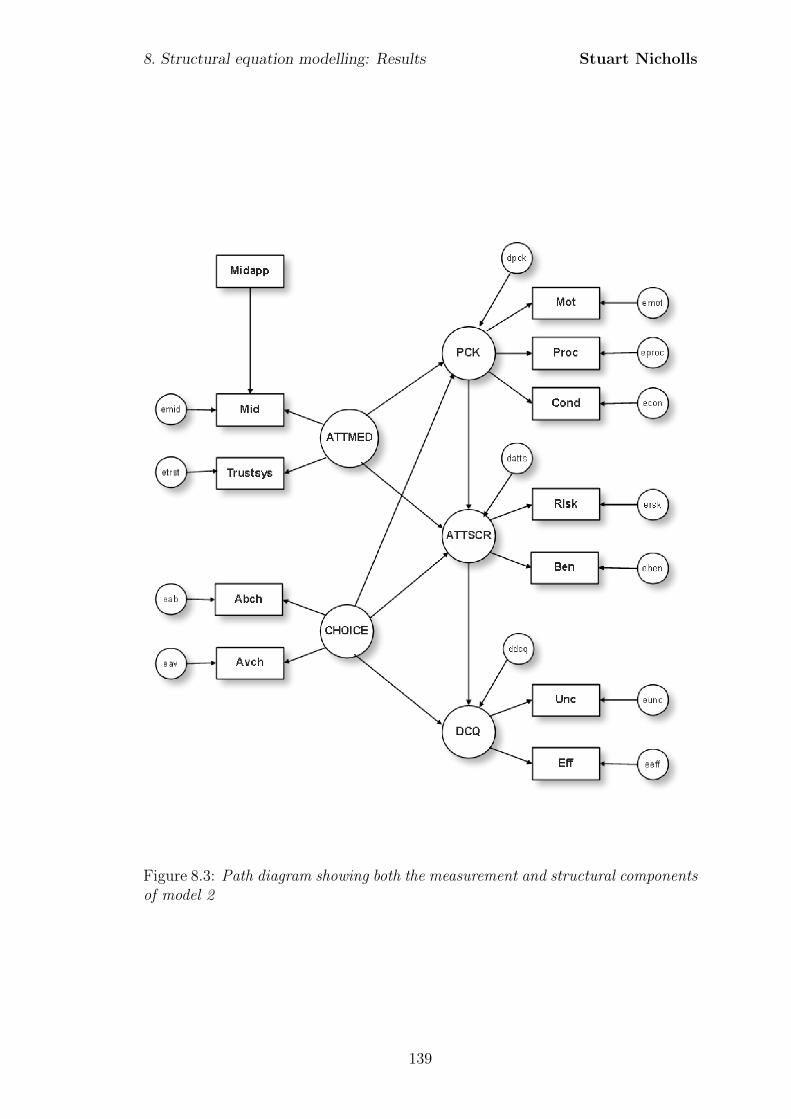
8. Structural equation modelling: Results Stuart Nicholls
Figure 8.3: Path diagram showing both the measurement and structural componentsof model 2
139
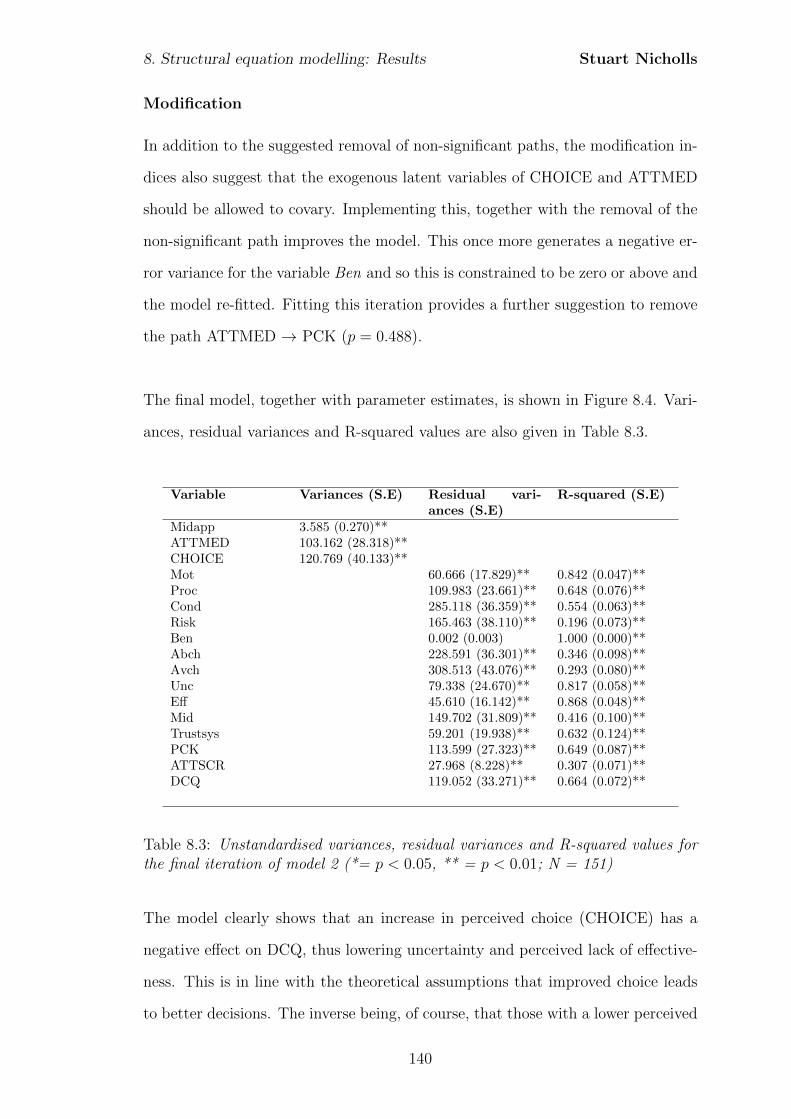
8. Structural equation modelling: Results Stuart Nicholls
Modification
In addition to the suggested removal of non-significant paths, the modification in-
dices also suggest that the exogenous latent variables of CHOICE and ATTMED
should be allowed to covary. Implementing this, together with the removal of the
non-significant path improves the model. This once more generates a negative er-
ror variance for the variable Ben and so this is constrained to be zero or above and
the model re-fitted. Fitting this iteration provides a further suggestion to remove
the path ATTMED → PCK (p = 0.488).
The final model, together with parameter estimates, is shown in Figure 8.4. Vari-
ances, residual variances and R-squared values are also given in Table 8.3.
Variable Variances (S.E) Residual vari-ances (S.E)
R-squared (S.E)
Midapp 3.585 (0.270)**ATTMED 103.162 (28.318)**CHOICE 120.769 (40.133)**Mot 60.666 (17.829)** 0.842 (0.047)**Proc 109.983 (23.661)** 0.648 (0.076)**Cond 285.118 (36.359)** 0.554 (0.063)**Risk 165.463 (38.110)** 0.196 (0.073)**Ben 0.002 (0.003) 1.000 (0.000)**Abch 228.591 (36.301)** 0.346 (0.098)**Avch 308.513 (43.076)** 0.293 (0.080)**Unc 79.338 (24.670)** 0.817 (0.058)**Eff 45.610 (16.142)** 0.868 (0.048)**Mid 149.702 (31.809)** 0.416 (0.100)**Trustsys 59.201 (19.938)** 0.632 (0.124)**PCK 113.599 (27.323)** 0.649 (0.087)**ATTSCR 27.968 (8.228)** 0.307 (0.071)**DCQ 119.052 (33.271)** 0.664 (0.072)**
Table 8.3: Unstandardised variances, residual variances and R-squared values forthe final iteration of model 2 (*= p < 0.05, ** = p < 0.01; N = 151)
The model clearly shows that an increase in perceived choice (CHOICE) has a
negative effect on DCQ, thus lowering uncertainty and perceived lack of effective-
ness. This is in line with the theoretical assumptions that improved choice leads
to better decisions. The inverse being, of course, that those with a lower perceived
140
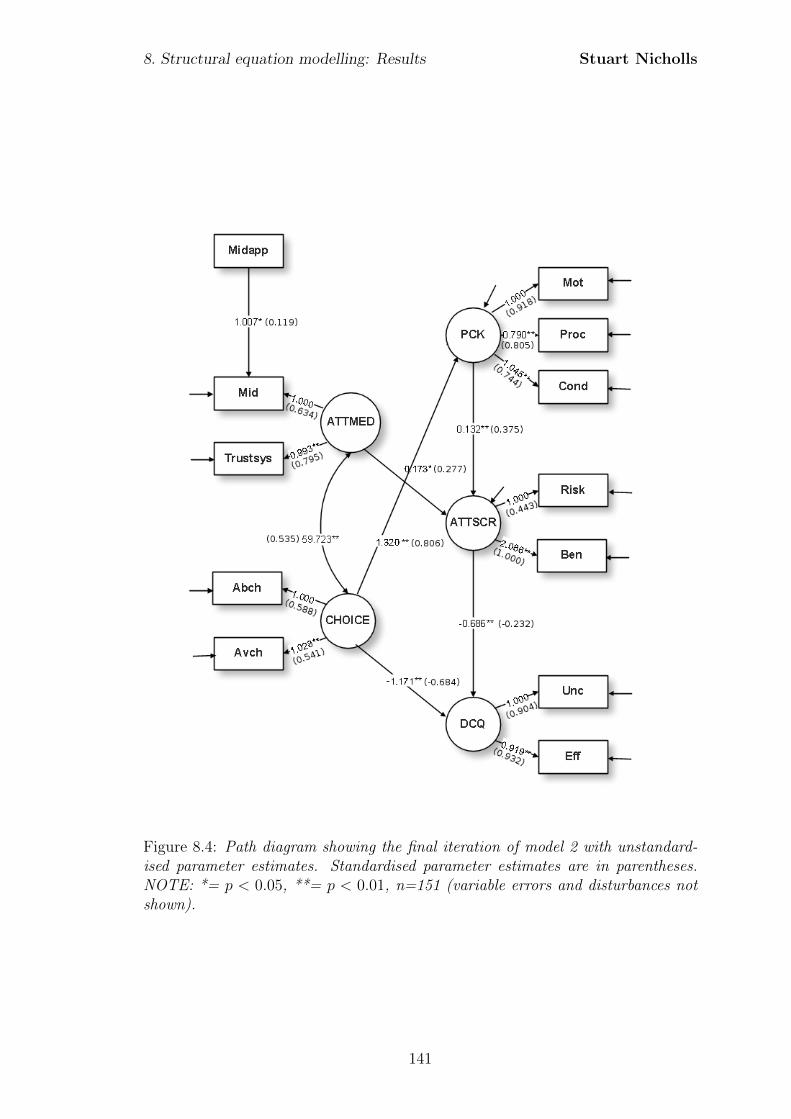
8. Structural equation modelling: Results Stuart Nicholls
Figure 8.4: Path diagram showing the final iteration of model 2 with unstandard-ised parameter estimates. Standardised parameter estimates are in parentheses.NOTE: *= p < 0.05, **= p < 0.01, n=151 (variable errors and disturbances notshown).
141
8. Structural equation modelling: Results Stuart Nicholls
choice will tend to have a lower degree of perceived decisional quality. As already
suggested, this may mean that not only are these parents more likely to make more
uncertain decisions, but any impediment to their ability to make a choice or the
availability of a choice, may be indicative of a lack of informed consent.
In addition to the influence of perceived choice, increases in attitudes towards
screening also lead to improved decisions on the basis of a negative unstandard-
ised path coefficient of -0.686. Again this is as expected, with stronger positive
attitudes being associated with increased decisional quality. The strong negative
correlation (-0.459) between perceived benefits and decisional uncertainty suggest-
ing potentially that the perceived benefits play an important role. Stronger positive
attitudes may also indicate a stronger degree of certainty, particularly in relation
to benefits. Again, this is in keeping with the interview data where parents talked
about the obvious benefits of screening and the lack of harms which made the
decision a relatively easy one.
The model indicates that the role of specific attitudes towards screening is sec-
ondary to perceived choice; choice has a greater effect on decisional quality. This
is clearly shown with CHOICE having a standardised regression coefficient that is
almost three times that of the path between ATTSCR and DCQ. The size of the
coefficient points to this effect not only being of statistical significance but sub-
stantive significance as well. Accordingly any explanation of parental decisional
quality needs to consider not only the rational evaluation of direct risks and ben-
efits of the immediate test but also wider aspects of the context in which the test
is offered. The substantive contribution to the explanation of parental decisional
quality is confirmed with the squared multiple correlations which suggests that
around 66% of the variance in DCQ is explained by the two independent latent
constructs of CHOICE and ATTSCR.
142
8. Structural equation modelling: Results Stuart Nicholls
Parental knowledge has been the subject of much research in newborn screening.
Whilst the confirmatory factor analysis and correlations suggest the relationship
between information-seeking, experience, and knowledge is a complex one requir-
ing greater study, the structural model suggests that knowledge has a significant
association with attitudes towards screening. The latent construct of perceived
knowledge not only explains the variation within the indicator variables to a rea-
sonable degree (over 84% of the variation in knowledge of the motivation for screen-
ing), but also shows a significant and positive relationship with attitudes towards
screening, with increases in positive attitudes being causally attributable, in part,
to increases in knowledge. This finding of a statistically significant relationship
is also suggested to have a substantive role, with the standardised regression co-
efficient falling within the typical or medium effect size range. The concept of
‘treatability’ may be a significant factor in this association. Those parents who
talked of treatability during the interviews not only showed a knowledge or un-
derstanding of the condition in order to relate to the fact that it was treatable,
but they also understood that screening was made available and that testing at
this stage allowed for the greater effectiveness of the treatment. It is in this way
that increased knowledge may contribute to the increases in perceived benefits and
positive attitudes towards screening.
Perceived knowledge is also found to be significantly related to perceived choice,
with increases in perceived choice leading to increases in perceived knowledge.
With a standardised regression coefficient of 0.806 this is of both statistical and
practical significance. This again is in keeping with the model proposal that a per-
ceived choice instigates, perhaps through discussion with the midwife, a greater
awareness of the options and information uptake leading to a greater perceived
knowledge. Equally, a lack of perceived choice or a perception of screening as
mandatory, may be argued to suppress information-seeking or knowledge, poten-
tially through a perceived lack of need.
143
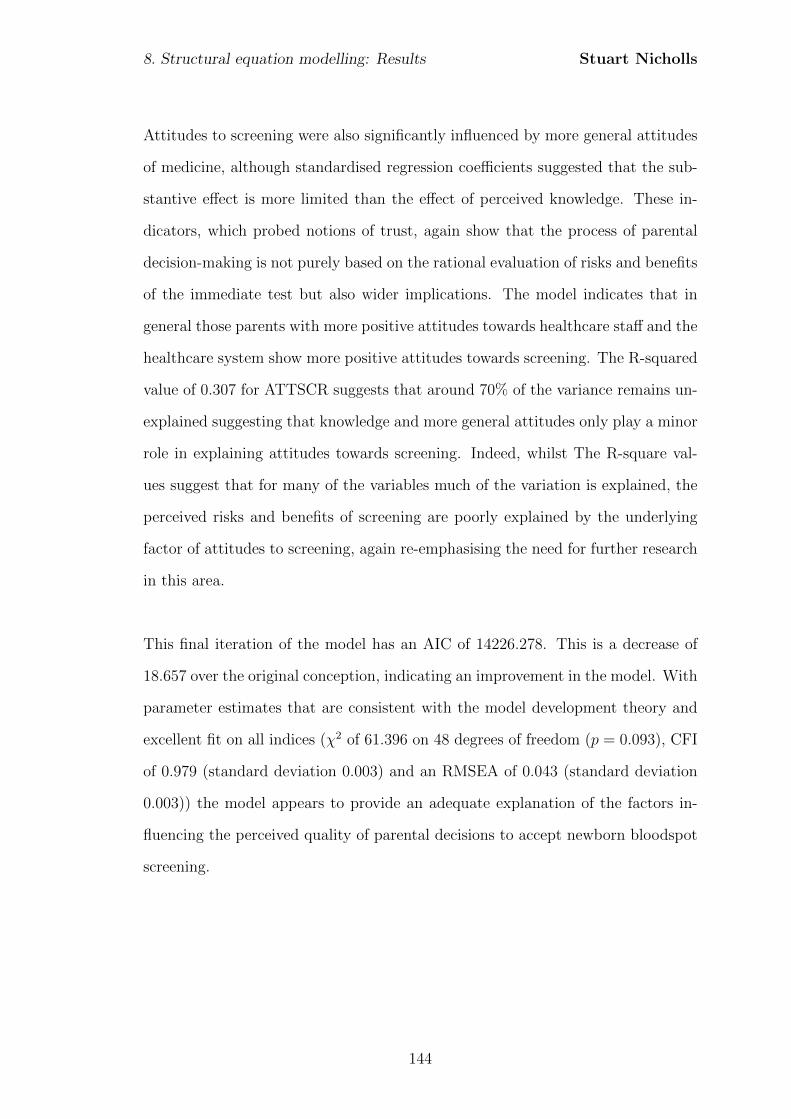
8. Structural equation modelling: Results Stuart Nicholls
Attitudes to screening were also significantly influenced by more general attitudes
of medicine, although standardised regression coefficients suggested that the sub-
stantive effect is more limited than the effect of perceived knowledge. These in-
dicators, which probed notions of trust, again show that the process of parental
decision-making is not purely based on the rational evaluation of risks and benefits
of the immediate test but also wider implications. The model indicates that in
general those parents with more positive attitudes towards healthcare staff and the
healthcare system show more positive attitudes towards screening. The R-squared
value of 0.307 for ATTSCR suggests that around 70% of the variance remains un-
explained suggesting that knowledge and more general attitudes only play a minor
role in explaining attitudes towards screening. Indeed, whilst The R-square val-
ues suggest that for many of the variables much of the variation is explained, the
perceived risks and benefits of screening are poorly explained by the underlying
factor of attitudes to screening, again re-emphasising the need for further research
in this area.
This final iteration of the model has an AIC of 14226.278. This is a decrease of
18.657 over the original conception, indicating an improvement in the model. With
parameter estimates that are consistent with the model development theory and
excellent fit on all indices (χ2 of 61.396 on 48 degrees of freedom (p = 0.093), CFI
of 0.979 (standard deviation 0.003) and an RMSEA of 0.043 (standard deviation
0.003)) the model appears to provide an adequate explanation of the factors in-
fluencing the perceived quality of parental decisions to accept newborn bloodspot
screening.
144
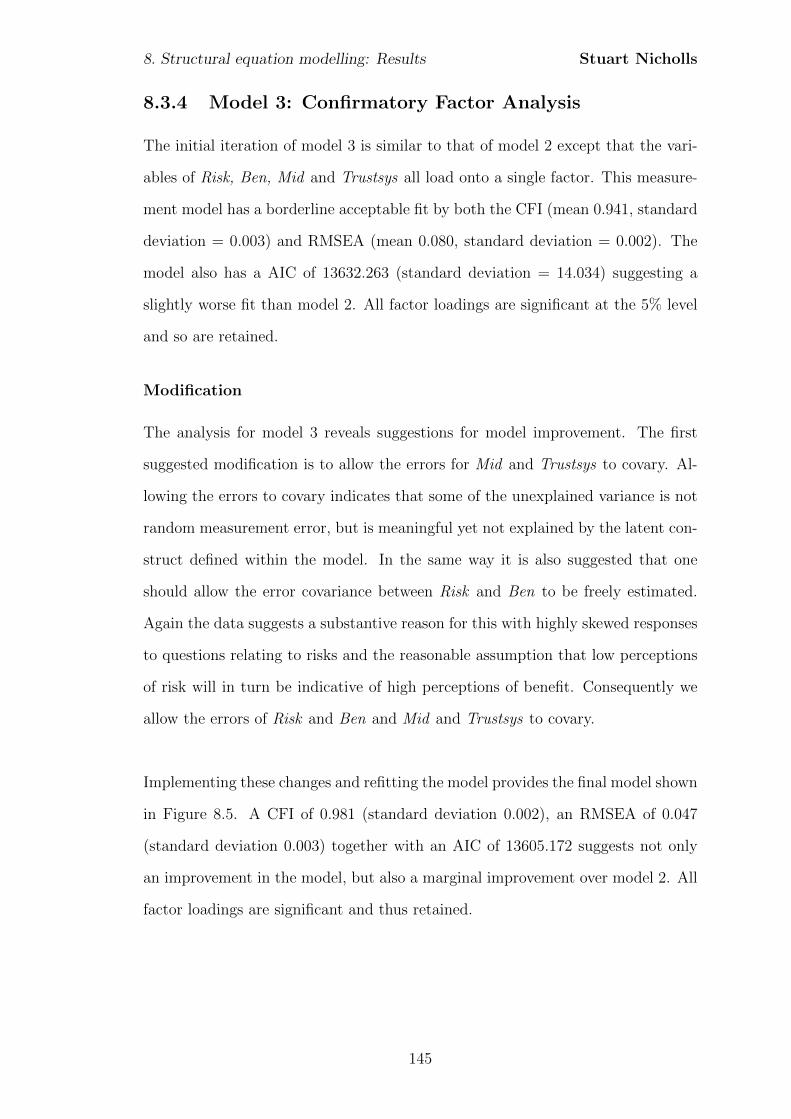
8. Structural equation modelling: Results Stuart Nicholls
8.3.4 Model 3: Confirmatory Factor Analysis
The initial iteration of model 3 is similar to that of model 2 except that the vari-
ables of Risk, Ben, Mid and Trustsys all load onto a single factor. This measure-
ment model has a borderline acceptable fit by both the CFI (mean 0.941, standard
deviation = 0.003) and RMSEA (mean 0.080, standard deviation = 0.002). The
model also has a AIC of 13632.263 (standard deviation = 14.034) suggesting a
slightly worse fit than model 2. All factor loadings are significant at the 5% level
and so are retained.
Modification
The analysis for model 3 reveals suggestions for model improvement. The first
suggested modification is to allow the errors for Mid and Trustsys to covary. Al-
lowing the errors to covary indicates that some of the unexplained variance is not
random measurement error, but is meaningful yet not explained by the latent con-
struct defined within the model. In the same way it is also suggested that one
should allow the error covariance between Risk and Ben to be freely estimated.
Again the data suggests a substantive reason for this with highly skewed responses
to questions relating to risks and the reasonable assumption that low perceptions
of risk will in turn be indicative of high perceptions of benefit. Consequently we
allow the errors of Risk and Ben and Mid and Trustsys to covary.
Implementing these changes and refitting the model provides the final model shown
in Figure 8.5. A CFI of 0.981 (standard deviation 0.002), an RMSEA of 0.047
(standard deviation 0.003) together with an AIC of 13605.172 suggests not only
an improvement in the model, but also a marginal improvement over model 2. All
factor loadings are significant and thus retained.
145
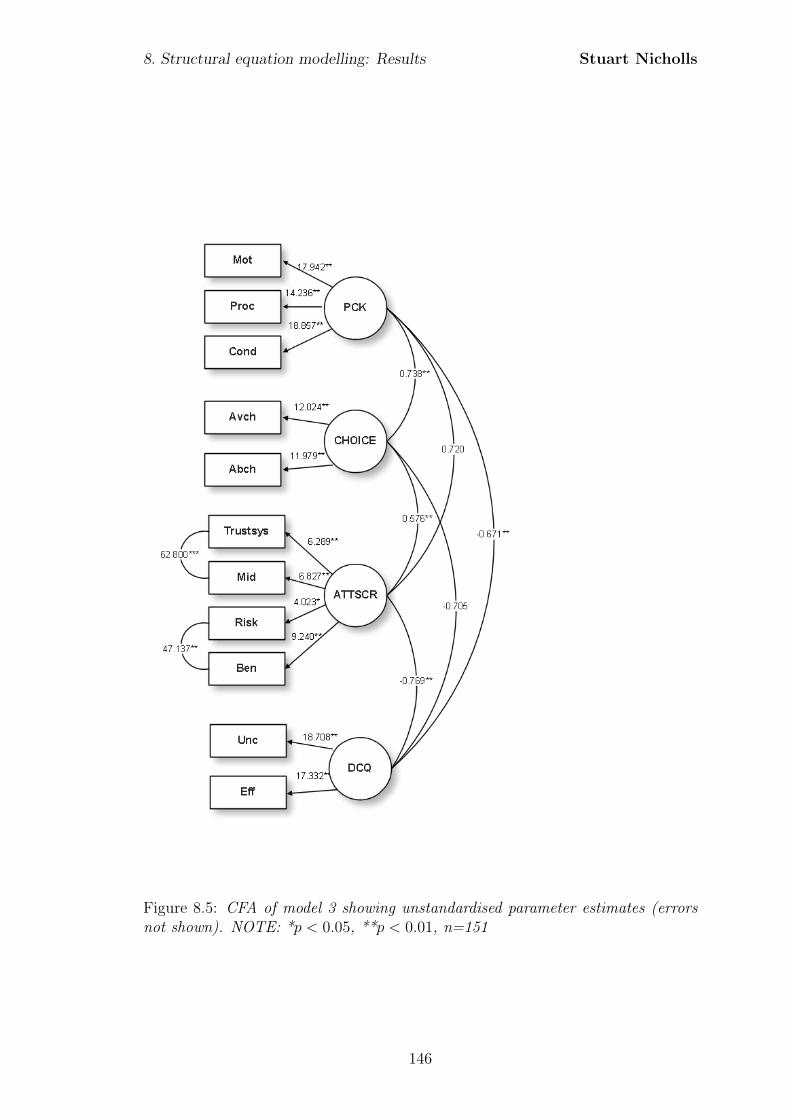
8. Structural equation modelling: Results Stuart Nicholls
Figure 8.5: CFA of model 3 showing unstandardised parameter estimates (errorsnot shown). NOTE: *p < 0.05, **p < 0.01, n=151
146
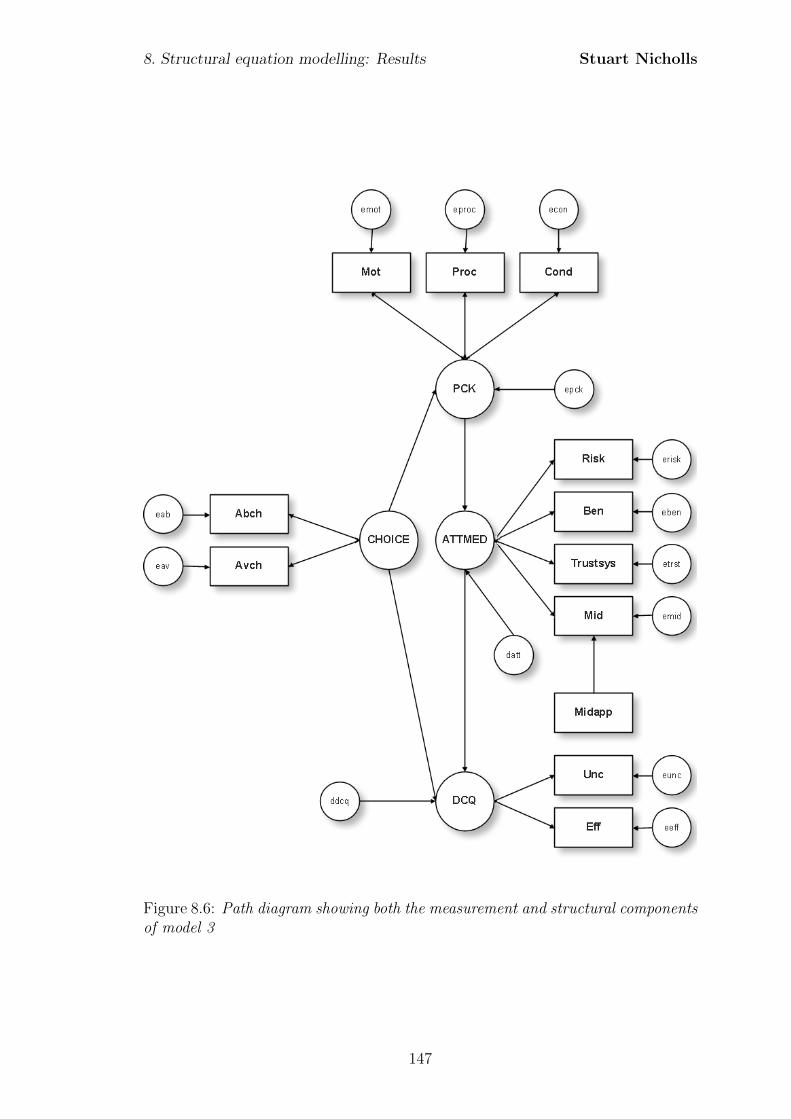
8. Structural equation modelling: Results Stuart Nicholls
Figure 8.6: Path diagram showing both the measurement and structural componentsof model 3
147
8. Structural equation modelling: Results Stuart Nicholls
8.3.5 Model 3: Structural Equation Model
Fitting the third model (Figure 8.6), and including the error covariances suggested
from the confirmatory factor analysis, provides a good level of fit with a CFI of
0.977 (standard deviation 0.002), an RMSEA of 0.044 (standard deviation of 0.002)
and a χ2 of 62.372 on 48 degrees of freedom (p = 0.080). The model also has an
AIC of 14225.317 (standard deviation 13.873) which is comparable to model 2.
Modification
Whilst the model is a good fit, review of the modification indices suggest that
an improvement can be made by including the path Midapp → CHOICE. This is
substantively and logically reasonable, given the official instruction that midwives
should discuss newborn screening with parents. It, therefore, seems reasonable
that those parents who have seen the midwife more often are more likely to have
discussed newborn bloodspot screening and consequently the need for informed
choice. These parents would, by this logic, be expected to have a greater percep-
tion of choice, particularly regarding the availability of choice if not necessarily
the ability to make a choice. The final model which includes this additional causal
link is shown in Figure 8.7. Variances, residual variances and R-squared values are
also given in Table 8.4.
Direction of the relationships between the latent constructs are found to be the
same in model 3 as they were in model 2. Both attitudes to medicine (ATTMED)
and perceived choice (CHOICE) appear to have a significant effect on perceived
decisional quality (DCQ). Perceived choice retains the positive causal effect on per-
ceived knowledge (PCK). Whilst this remains a large and substantively significant
effect, the size of effect is reduced in comparison with model 2 (0.699 compared
with 0.806). In contrast to the previous model, attitudes to medicine appear to be
having a greater effect on perceived decisional quality than perceived choice. Both
coefficients do, however, remain significant at the 5% level. Perceived knowledge
148
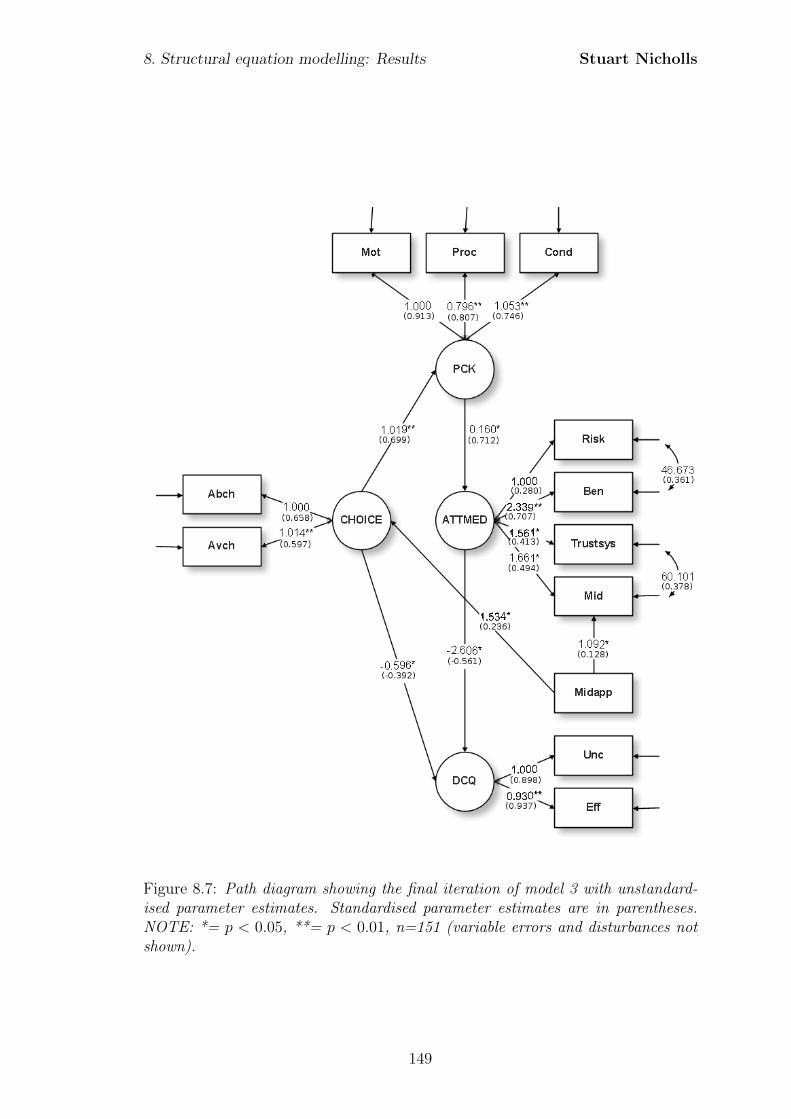
8. Structural equation modelling: Results Stuart Nicholls
Figure 8.7: Path diagram showing the final iteration of model 3 with unstandard-ised parameter estimates. Standardised parameter estimates are in parentheses.NOTE: *= p < 0.05, **= p < 0.01, n=151 (variable errors and disturbances notshown).
149
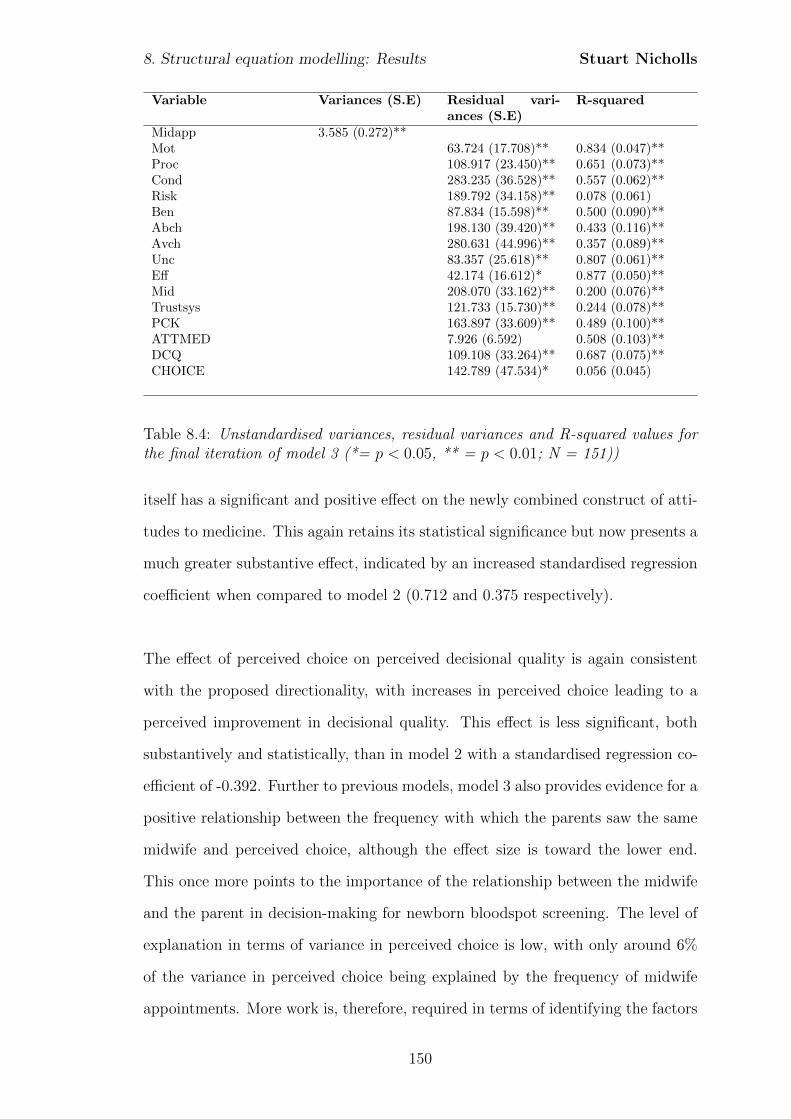
8. Structural equation modelling: Results Stuart Nicholls
Variable Variances (S.E) Residual vari-ances (S.E)
R-squared
Midapp 3.585 (0.272)**Mot 63.724 (17.708)** 0.834 (0.047)**Proc 108.917 (23.450)** 0.651 (0.073)**Cond 283.235 (36.528)** 0.557 (0.062)**Risk 189.792 (34.158)** 0.078 (0.061)Ben 87.834 (15.598)** 0.500 (0.090)**Abch 198.130 (39.420)** 0.433 (0.116)**Avch 280.631 (44.996)** 0.357 (0.089)**Unc 83.357 (25.618)** 0.807 (0.061)**Eff 42.174 (16.612)* 0.877 (0.050)**Mid 208.070 (33.162)** 0.200 (0.076)**Trustsys 121.733 (15.730)** 0.244 (0.078)**PCK 163.897 (33.609)** 0.489 (0.100)**ATTMED 7.926 (6.592) 0.508 (0.103)**DCQ 109.108 (33.264)** 0.687 (0.075)**CHOICE 142.789 (47.534)* 0.056 (0.045)
Table 8.4: Unstandardised variances, residual variances and R-squared values forthe final iteration of model 3 (*= p < 0.05, ** = p < 0.01; N = 151))
itself has a significant and positive effect on the newly combined construct of atti-
tudes to medicine. This again retains its statistical significance but now presents a
much greater substantive effect, indicated by an increased standardised regression
coefficient when compared to model 2 (0.712 and 0.375 respectively).
The effect of perceived choice on perceived decisional quality is again consistent
with the proposed directionality, with increases in perceived choice leading to a
perceived improvement in decisional quality. This effect is less significant, both
substantively and statistically, than in model 2 with a standardised regression co-
efficient of -0.392. Further to previous models, model 3 also provides evidence for a
positive relationship between the frequency with which the parents saw the same
midwife and perceived choice, although the effect size is toward the lower end.
This once more points to the importance of the relationship between the midwife
and the parent in decision-making for newborn bloodspot screening. The level of
explanation in terms of variance in perceived choice is low, with only around 6%
of the variance in perceived choice being explained by the frequency of midwife
appointments. More work is, therefore, required in terms of identifying the factors
150
8. Structural equation modelling: Results Stuart Nicholls
which influence perceived choice.
The final iteration of the model has an AIC of 14221.416, reduced from 14225.317.
This is a decrease of 3.901 indicating only a marginal improvement over the orig-
inal formulation. With parameter estimates that are consistent with the model
development theory and excellent fit on all indices (χ2 of 56.801 on 47 degrees
of freedom (p = 0.155), CFI of 0.985 (standard deviation 0.002) and an RMSEA
of 0.037 (standard deviation of 0.003)) the model appears to provide a good ex-
planation, through the application of fit indices alone, of the factors influencing
the perceived quality of parental decisions to accept newborn bloodspot screening.
Despite the good model fit, this final iteration of the model raises questions re-
garding the substantive application of the model. In particular the low R-squared
values for Risk and CHOICE suggests that the explanatory power, in terms of
substantive explanation, is limited when compared to model 2.
As already noted, attitudes towards medicine, in contrast to the previous model,
appear to be having a greater influence on perceived decisional quality than does
perceived choice. This in part may be due to the combining of the previously
separate latent constructs of attitudes to medicine (ATTMED) and attitudes to
screening (ATTSCR). It will be remembered that in model 2 ATTMED had a
significant and positive effect on ATTSCR and so the increase in effect seen here
is not necessarily surprising. Despite the large effects and the good fit of the CFA
model, the R-squared values suggest that the model may be substantively weaker
than model 2, with the single latent construct of ATTMED explaining much less
of the variance in the indicator variables than model 2. The variable Risk has
R-square value of 0.078, indicating that only around 8% of the variance in the
variable is explained by the newly combined latent construct of ATTMED. This
is now non-significant at the 5% level (p = 0.2). Compare this to model 2 where
almost 20% of the variance was explained by the underlying construct of ATTSCR.
151
8. Structural equation modelling: Results Stuart Nicholls
The R-squared values of Mid and Trustsys are also reduced in model 3. When
coupled to the required error covariances between Risk and Ben and Mid and
Trustsys this finding may be seen to suggest that the application of the model
with a single latent construct of ATTMED is substantively questionable.
8.3.6 Summary
From the three initial models two competing models were found to be adequate in
terms of their measurement components. Applying these measurement aspects to
the proposed structural relationships derived from the interviews provided the full
structural equation models and allowed for a complete assessment of the proposed
causal relationships. In both models 2 and 3 minor modification, through the
removal of non-significant paths and the inclusion of additional paths, generated
two models that demonstrated adequate explanation by a number of fit indices.
However, a review of the parameter estimates and R-squared values indicated that
model 2 was substantively preferable. The application of this model provides a
number of novel insights.
The lack of correlations between indicators of experience or information-seeking
with either knowledge or attitudes to medicine suggest that the role played by
information-seeking and experience appears not to be one affecting parental sat-
isfaction with decisions, or potentially parental decision-making at all. This is
further compounded by the lack of significant association between the latent con-
structs within the confirmatory factor analysis of model 1. This is of particular
interest given the central role of information provision and education within in-
formed consent procedures generally, and may point to other processes through
which parents make decisions relating to newborn bloodspot screening specifically.
Two particular factors are indicated by the models assessed here.
Firstly, more general attitudes towards healthcare staff and the healthcare sys-
152
8. Structural equation modelling: Results Stuart Nicholls
tem appear to play a strong role in determining attitudes towards screening and
in turn parental perceptions of the quality of decision made. This is indicated
through significant path coefficients between the latent constructs of attitudes to
medicine (ATTMED) and specific attitudes to screening (ATTSCR) and the sub-
sequent significant negative path coefficients between these specific attitudes and
perceived decisional quality (DCQ). These suggest that positive attitudes towards
the components of the healthcare system more generally lead to more positive at-
titudes towards screening in terms of perceived risks and benefits. More positive
attitudes towards screening in turn lead to greater perceived quality of decision.
This is perhaps to be expected given that all parents who completed the ques-
tionnaire also accepted screening. Further work would be of benefit to see if the
relationship holds in the opposite case so that stronger negative attitudes are asso-
ciated with a greater perceived quality of decision for those parents who declined
screening.
The second significant factor identified is that of perceived choice. Perceived choice
appears to affect the perceived quality of the decision directly as well as indirectly
through a positive effect on knowledge which in turn has a positive effect on atti-
tudes towards screening. This, as already described, was found to have a significant
direct effect on perceived quality of decision. Whilst perceived choice has previ-
ously been related to informed consent or parental decisions, this study quantifies
this role and suggests that the effect may be even greater than specific attitudes
towards the screening test.
Whilst both models 2 and 3 demonstrated good fit, the further evaluation of both
parameter estimates and R-square values suggests that model 2 is to be preferred.
This is for several reasons. Firstly, the fit of model 3 was based on the inclusion
of covariances between error terms for several observed variables. Whilst substan-
tively reasonable, the requirement to allow error terms to covary is indicative of
153
8. Structural equation modelling: Results Stuart Nicholls
some underlying model misspecification or at least lack of model fit. This is further
suggested by the extremely low R-square values for Risk, and CHOICE, as well
as decreases for both Mid and Trustsys in model 3. These low R-square values
correspond to the error terms allowed to covary suggesting that the single factor
of attitudes to medicine does not adequately capture the complexities of perceived
risks and benefits when combined with more general attitudes towards healthcare,
and that the two factor model employed in model 2 is preferable.
Whilst model 2 provides improved estimates of R-square for all variables, and does
not require the correlation of error terms, there is still improvement to be made
in terms of the amount of variance explained for the variables of Risk. Whilst this
may in part be explained by highly skewed and polarised views regarding the risks
and benefits of screening it may also be an area that would benefit from further
research in terms of the influences on perceptions of risks and benefits with new-
born screening.
Despite these findings several caveats must be made. When compared to the
population in Merseyside and Cheshire, parents appeared to be older and more
educated. This may present a bias in the results, although no significant differ-
ences were found when scores on knowledge indicators were compared by income
or education. The sample showed marginal differences from the regional demo-
graphics in terms of ethnicity. It is likely that the relatively small sample size
contributed to these differences in ethnic demographics. The response rate of 32%
is also relatively low, indicating a potential bias. However,a lack of information
with which to compare responders to non-responders means that a response bias
cannot be confirmed or denied. Whilst the response rate was relatively low, it
does compare well with other survey research relating to parental experiences of
newborn screening which have seen response rates as low as 23% (Mischler et al.,
1998), 28.6% (Ciske et al., 2001), and 32.5% (Davey et al., 2005).
154

8. Structural equation modelling: Results Stuart Nicholls
Despite these cautions, the data does provide significant insights regarding parental
decision-making, in particular the distinction between general attitudes and spe-
cific attitudes. The role of trust appears to be significant and through the dis-
aggregation of the general and specific attitudes, the significant role of perceived
choice is shown. Both of these elements suggest that the context and presentation
of screening are key determinants of parental decisional-quality.
155
Chapter 9
Decision-making in the context of
newborn bloodspot screening
This study took a mixed methods approach to exploring parental perceptions of
decision-making within the context of newborn bloodspot screening, with initial
exploratory interviews informing a larger scale quantitative survey. This process
may be considered a process of triangulation, with the questionnaire data provid-
ing evidence as to the pervasiveness of attitudes or experiences indicated within the
interviews. The interviews may also be considered to provide additional explana-
tion of the trends seen within the questionnaire. Consequently, whilst the research
design and protocol present the data collection and analysis in a linear fashion,
the actualities of the analysis and interpretation is much more of an iterative cycle.
One limitation that may be levelled at the study is the relatively low response
rate. It is unclear why there was a lack of response, although one may hypothe-
sise that parents felt unable to commit the time to an interview or to complete a
questionnaire, particularly for research that would provide no discernable health
benefit for their child. This level of response is consistent with a number of pre-
vious studies on parental attitudes to newborn screening (Mischler et al., 1998;
Ciske et al., 2001; Davey et al., 2005) and may explain the heterogeneous samples
156
9. Decision-making and newborn bloodspot screening Stuart Nicholls
noted in other studies (Dankert-Roelse et al., 1990; Dudding et al., 2000; Firth
et al., 1983; Muchamore et al., 2006b; Hildes et al., 1993; Merelle et al., 2003).
The responses to the postal questionnaire suggest that respondents may have a
higher level of income than the general population and this should be borne in
mind when interpreting the results. The lack of respondents who declined consent
to newborn bloodspot screening does mean that the conclusions drawn cannot be
generalised to those who do not consent. Whilst a deficit to the study, the small
number of parents who did refuse - in the region of 0.025% for the period from
which the sample was drawn - means that even with a high response rate there
would not be enough respondents to conduct any reliable statistical analyses. As a
result information relating to the decision-making of parents who decline newborn
bloodspot screening remains an area in need of further research.
Despite these limitations the data from both phases clearly shows the importance
of context as well as content in parental decision-making about newborn screening.
Parents talked of their experiences in terms of their perceived ability to make an in-
formed decision but also what they considered to be the availability of choice; that
is the possibility of actually being allowed to make a decision rather than being
routinely processed along a pre-defined trajectory. Equally the analysis through
the structural equation modelling indicated a significant deterministic relationship
between parental perceived choice and both their attitudes towards screening and
perceptions regarding the quality of the decision made. Perceived choice was also
positively associated with improved decisional quality indicated through increases
in perceived effectiveness of decision and reduced decision uncertainty.
Trust was also found to be important. Parents talked of trust not only in the mid-
wife, but also in the health service. Attitudes towards screening could be shown
to be causally attributable, at least in part, to trust in these same staff and systems.
157
9. Decision-making and newborn bloodspot screening Stuart Nicholls
Surprisingly, there was a lack of evidence to support the proposed relationships
between information-seeking and knowledge or experience and knowledge. Dis-
cussions with parents suggested that trust is again significant in terms of limiting
the information-seeking process to a few trusted sources, particularly as screening
occurs at a time when parents are principally occupied with the care of their baby.
In the remainder of this chapter I place these findings into the wider health context
and discuss the new insights the study brings with it.
9.1 Choice and decision quality
The results of the structural equation modelling analysis presented evidence to
support the modelled causal relationship between perceived choice and parental
perceptions of decisional quality. This indicated that with increasing perceptions
of choice there was a significant improvement in the perceived quality of the de-
cision to accept newborn bloodspot screening. The effect of perceived choice on
perceived decisional quality was found to be greater than the effect of specific at-
titudes towards the screening, with a path coefficient three times as large.
Perceived choice, and its relationship with decisional quality, is an area that is
sorely lacking within the newborn screening literature. Those studies that have
considered choice generally do so within the limited context of parental attitudes
to mandatory or voluntary screening (Faden et al., 1982; Campbell and Ross, 2005;
Davis et al., 2006; Detmar et al., 2007). This body of work presents highly vari-
able results with some studies indicating that parents feel that screening should be
mandatory (Faden et al., 1982), whilst others suggest that parents strongly sup-
port voluntary screening (Muchamore et al., 2006a; Detmar et al., 2007). What is
generally missing is any analysis that considers the role that choice - or at least
perceived choice - may play with regard to decision-making.
158
9. Decision-making and newborn bloodspot screening Stuart Nicholls
Despite this, research does exist which support that the current findings. Research
by Parsons et al. (2005), which sought to evaluate an intervention which empha-
sised an optional screen for Duchenne muscular dystrophy, found that parents who
received the intervention were more likely to feel that the midwife had given them
a choice and were significantly more satisfied. Consequently the presentation of
the information, and choice, appears to play a crucial role in parental experiences
of decision-making for newborn bloodspot screening.
9.1.1 Perceptions of choice
The impact on perceived choice appears to largely rest with the perceptions re-
lating to the availability of choice as opposed to parental concerns regarding their
ability to make a choice. The data presented in this study shows that experiences
in relation to choice are highly variable and on average parents perceived a low
availability of choice. The highly variable responses covered the full spectrum of
possibilities, with some parents rating the availability of choice (Avch) as zero
whilst others scored 100 indicating that they felt that they had made an indepen-
dent and free choice. The average scores were also low, below 50, indicating that
on average parents viewed the availability of choice as distinctly limited. Over
80% of parents responding to the questionnaire felt that it was expected that their
child had the heelprick and 40% disagreed to some extent that the heel prick was
presented as an optional test. Perhaps more worryingly, over 30% of respondents
felt that they did not have a choice to decline the test. When compared to the
results of Parsons et al. (2005) these figures are considerably higher. Parsons et al.
(2005) found that 15% of parents were not aware that testing was optional and
4% felt that they had not been given a choice. However, their study related to an
additional screening for Duchenne muscular dystrophy that was explicitly noted
as optional. The lower figures perhaps reflect this explicit nature of the offer.
159
9. Decision-making and newborn bloodspot screening Stuart Nicholls
The routine and implied choice
Almost all programmes of newborn bloodspot screening show high uptake rates
(Bradley et al., 1993; Parsons et al., 2002; Campbell and Ross, 2003; Metz et al.,
2003; Dhondt, 2005). High uptake, it has been argued, may reflect a routinisation
of screening and consequently may be indicative of a programme where informed
consent may be lacking (Murray and Clarke, 2002). This may also be reflected
in the low levels of perceived choice within the current study. Whilst the context
here was that of newborn bloodspot screening, the lack of perceived choice has
also been reported with parents undergoing prenatal screening, suggesting that
the issues at work may be more general and relating to the presentation of the
screening as opposed to the specific details within each situation. In one study
of parental experience of Duchenne muscular dystrophy screening (Parsons et al.,
2005) the authors concluded that:
“It would seem that, although the majority of mothers felt they were
being given a choice about screening, for some it was a choice about
a test they thought was always done. This, in reality, is no choice at
all.” (Parsons et al., 2005, p168)
Whilst the authors concluded that these parents didn’t experience a choice, the
causes of this lack of choice weren’t explored. The present study, and in partic-
ular the interviews, supports the implication that the way in which screening is
delivered is a factor in this lack of perceived choice; something which has been
raised in the context of prenatal testing (Clarke, 1991). In particular the ‘pro-
ceduralisation’ of the process was noted within the interviews. This is consistent
with ethnographical work conducted within the antenatal booking visit in which
McCourt (2006) notes that whilst choice is affirmed the language used emphasises
the almost inevitability of testing. As she notes:
“Two main rhetorical patterns were identified in the use of language re-
lating to choices. We have termed these ‘routine as choice’ and ‘choice
160
9. Decision-making and newborn bloodspot screening Stuart Nicholls
as routine’. Routine as choice implies that what is routine is the nor-
mal, common and therefore right choice to make. This commonly
included terms in describing the visit such as ‘you will have’ or ‘and
then you have’, or the language of a product for consumption such as
‘we do’, ‘we offer’ or ‘everyone has’. Choice as routine implies more
openness, but still presents certain choices as the routine ones, which
most people are likely to make. It also commonly uses consumerist
terms, for example, ‘what we offer here’, ‘you can have’ or ‘it’s your
choice’. The language around choice in the majority of visits appeared
to promote what Kirkham and colleagues, in their study of informed
choice leaflets in maternity care, termed ‘informed compliance’ (Staple-
ton, Kirkham, & Thomas, 2002) since it was difficult for women (and
could have appeared disruptive) to interject in the flow or to challenge
it.” (McCourt, 2006, p1315)
The same use of rhetoric was found in the present study when parents talked about
how they were told that the midwife ‘needed to come and do a couple of routine
tests’. The latter rhetoric of routine as choice is sometimes emphasised through
what Pilnick (2008) refers to as the tests’ ‘sequential location’; the way it is closely
related in proximity to other more routine tests or maternal checks. Again this
was identified within the interviews with parents talking about how the screening
was just one of a range of tests.
Indeed some authors have argued that the mere existence of screening may in itself
be seen by parents as a reason to assume that this screening is worthwhile (Clarke,
1991; Pilnick, 2002; Nijsingh, 2007). This implicit endorsement has been observed
within prenatal screening (Potter et al., 2008) and appeared to be the case here.
For some mothers the perception of the screening as routine was seen to verify
the acceptability of it. This was not an irrational acceptance. For example, one
mother discussed the financial constraints within which the NHS operates and this
161
9. Decision-making and newborn bloodspot screening Stuart Nicholls
was used to suggest that the fact that screening was offered meant that it was both
worthwhile and efficient. This approach falls between the two principal processes
of decision-making in that it is not a systematic processing of the immediate in-
formation about screening yet is not as simplistic as employing a heuristic such
as ‘experts can be trusted’ (Marteau and Anionwu, 1999). That parents accept
screening on the basis that it is offered by the healthcare system is consistent
with what Porter and Macintyre (1984) refer to as ‘what is, must be best’. This
acceptance of routines because they are routine (Green and Statham, 1996) sug-
gests that parents are not necessarily making an informed choice on the basis of
the immediate information about the screening tests. This assertion finds support
through the lack of evidence for a relationship between information-seeking and
perceived decisional quality.
9.2 Choice and knowledge of screening
As discussed previously, knowledge and understanding are important aspects to
informed consent. If parents do not understand the information provided then this
can be seen to vitiate their consent. However, the framing of the information is
key; information presented in a manner that is not conducive to decision-making is
unlikely to be used or retained by the individual. In the present study perception of
choice was strongly associated with knowledge. This evidence supports the notion
of a positive causal relationship through which increases in perceived choice lead
to increases in perceived knowledge. This is again found within the screening
literature. Parsons et al. (2005) found that mothers who received an intervention
to emphasise parental choice had a greater knowledge about the process of the
optional screen for Duchenne Muscular Dystrophy. This confirmed earlier work in
the US where it was found that a disclosure and consent process led to improved
knowledge in mothers (Faden et al., 1982). This, it was argued in Chapter 8,
may be attributable to greater discussion with the midwife or deliberation and
awareness of screening brought about by an increase in perceived choice.
162
9. Decision-making and newborn bloodspot screening Stuart Nicholls
9.2.1 Parental knowledge
Parental knowledge is a common theme in newborn bloodspot screening research,
with numerous studies suggesting that parents have a poor knowledge of newborn
bloodspot screening (Smith et al., 1990; Tluczek et al., 1992; Zeuner et al., 1999;
Tluczek et al., 2005; Lang et al., 2009). Despite these results, few studies have
sought to disaggregate different aspects of knowledge about newborn bloodspot
screening. In the present study, and in line with the results of the interviews, per-
ceived knowledge of screening was divided into three broad domains: knowledge
relating to the motivation for screening, knowledge of the procedures for con-
ducting screening, and condition specific knowledge. Analysing parental responses
showed higher average knowledge scores for the motivational and procedural as-
pects of screening when compared to condition specific knowledge.
The parental focus on practical aspects is in contrast to the majority of published
research on recall which has tended to focus on technical details of conditions such
as the ability to recall specific terms or condition prevalence (e.g. Warren et al.,
1982; Holtzman et al., 1983; Lewis et al., 2006). The selection of the information to
be assessed is integral to the responses one achieves and the subsequent inferences
one can draw from the results. As Levitt argues:
“If the aim in consulting the public is to show that more public edu-
cation is needed then one method is to ask specific questions, keeping
the focus in the researchers/funding bodies area of expertise” (Levitt,
2003, 20)
Consequently the selection of questions on which to assess knowledge is intrinsically
tied to the results obtained. The results of the current study suggest that the
selection of knowledge questions relating to motivational or procedural aspects
of the programme are likely to yield results suggesting better knowledge than
studies which focus on technical details or condition specific knowledge. However,
163
9. Decision-making and newborn bloodspot screening Stuart Nicholls
few studies disclose the process by which questions are selected or the reasoning
behind their inclusion (Nicholls, 2010).
9.2.2 Knowledge saliency
The survey results are consistent with the interview findings where some parents
lacked knowledge of condition names, yet knew why screening was conducted and
understood the implications. Parental recall was consistent with stated interest.
For parents who took part in the interviews it was the ability to act on information
in order to benefit the health of their child which was important. The few studies
which have considered different aspects of knowledge suggests that the present
finding is not unique. Holtzman et al. (1983) found that a higher percentage of
parents recalled how the screening was conducted than did the inherited nature
of the disorders. Indeed the lowest levels of recollection was for a question asking
about how often babies were born with the conditions. The authors also found
that there was no significant difference between pre-disclosure and post-consent
groups regarding this latter question. The parental responses within interviews
for the present study suggest that this information is not as salient to parents
as other aspects, and consequently not remembered. This observation has been
referred to as “framing failures” in which it is noted that “the context of the indi-
viduals previous beliefs, assumptions, and experiences that frame the information
provided” (Dawson, 2009, p104). Other studies have found that this pattern is
replicated when parents are asked about information priorities. When parents
requested more information this was about the nature and purpose of screening
as opposed to technical details or aspects relating to prevalence (Campbell and
Ross, 2004). More recent work has found that the saliency of the information
may even extend to the recognition of conditions. One study found that 96% of
mothers had heard of sickle cell disease, yet only 33% had heard of cystic fibro-
sis. The authors suggest that “This may be due in part to the high percentage
(74%) of African American women in our survey. SCD is more common in per-
164
9. Decision-making and newborn bloodspot screening Stuart Nicholls
sons of African ancestry” (Lang et al., 2009, p2427). The suggestion being that
as CF was less common, parents were less inclined to know about it. However,
it remains unclear whether this difference is due to parents or to the practice of
healthcare professionals, who may not present information they feel is not relevant.
The variation in areas of knowledge and interest is also found in other screening
contexts. Studies in prenatal screening have found parents to have a greater knowl-
edge of practical aspects of screening (Smith et al., 1994; Green et al., 2004). In
particular, one study found that the meaning of a high risk result and the risk of
miscarriage are important pieces of information, whilst the percentage of women
who are likely to have a low risk result is seen to be unimportant (Michie et al.,
2003). Again this differed by the immediate relevance. Unsurprisingly, informa-
tion as to the percentage of women with a high risk result who went on to have a
baby with Down’s syndrome was more important to mothers who had a high risk
result than to those who received a low risk result (Michie et al., 2003).
Similar knowledge patterns and information preferences are seen in cancer screen-
ing with Jepson et al. (2007) noting that parents wanted information on the risks
and consequences of screening. In colorectal cancer screening, patients have been
shown to have a greater knowledge of the procedures (colonoscopy) than the risk
factors or symptoms (Koo et al., 2010), whilst a study of prostate cancer screen-
ing in African American men revealed a greater knowledge of the implications of
screening than the function of the prostate or potential symptoms (Davis et al.,
2010).
Not only does this have important implications for those assessing screening, but
it is central to those providing information. Providing information that is not
salient to parents will at worst fail to promote informed choices but may actually
be detrimental. The consistency of findings across settings suggests that the areas
165
9. Decision-making and newborn bloodspot screening Stuart Nicholls
of parental concern are relatively well defined and discernable. By making these
aspects central to the education given to parents it is not only likely that parental
satisfaction with the information provided will be increased, but that this will also
act to facilitate parental perceptions as to whether they have made an informed
choice.
9.2.3 Knowledge through experience
Further to the lack of relationship between experience and information-seeking
behaviour reported in the results of the structural equation modelling, there was
also no evidence of any relationship between experience and knowledge. Parents
were hypothesised to be more knowledgable if they were multiparous than if they
were first time mothers. This supposition was made on the basis of interview
data which suggested that parental understanding with their first child may be
undermined by a lack of familiarity with healthcare systems. It seems that the
converse is not to be found; parents with multiple children did not perceive them-
selves to be significantly more knowledgeable on any of the domains evaluated here.
Evidence regarding this within the newborn screening literature is minimal with
only two studies identified which have considered the role of parity on knowledge.
In a Welsh study Smith et al. (1990) found that parental awareness of screening
was higher in multiparous compared to primaparous mothers. However, parental
awareness of the screened for conditions did not differ with both groups showing a
poor level of awareness. This result has been replicated in a further study which
found that multiparous parents were no more knowledgeable of the screened for
conditions than were primaparous parents (Statham et al., 1993).
This can be seen within the interview data, where parents recalled in greater detail
their experiences with their first child. Decisions for subsequent children appeared
less deliberated which may be why there was no association found between number
166
9. Decision-making and newborn bloodspot screening Stuart Nicholls
of children and knowledge. The interviews also suggest that the potential assump-
tion of knowledge with multiparous mothers could lead to a plateau of knowledge
or relatively small increase over those primaparous mothers. Furthermore, the
present study did not include parents who had a screened for condition in their
most recent child. The fact that these parents had not been confronted with a
condition may be implicated in the failure to find an association between parity
and knowledge. Time may also be a factor; for most parents childbirth will be a
relatively rare event. It may be that a lack of impetus to remember details results
in parents being no more knowledgeable in future pregnancies or after additional
children than they were during their first.
9.2.4 Seeking information, gaining knowledge?
Parents discussed seeking information from a range of sources. Whilst sources did
vary, both the interviews and questionnaires indicated that the midwife and health
service dominated information provision. This is in keeping with previous research
which has found that parents consistently cite the midwife as a key source of in-
formation (Tymstra, 1986; Hargreaves et al., 2005a; Davey et al., 2005; Tluczek
et al., 2006; Parsons et al., 2006, 2007). Written information materials have been
the focus of several studies (Hargreaves et al., 2004, 2005a), with the suggestion
that in some cases these may not facilitate informed choice (Hargreaves et al.,
2005b). Prior personal experience and the experiences of families and friends have
also been found to be important (Davey et al., 2005). In a Welsh study one fam-
ily’s negative experience of screening for DMD was felt to have been the cause of
a much higher refusal rate in one geographic area (Bradley et al., 1993). Despite
these findings there is a paucity of evidence relating to information-seeking prac-
tices and how these impact on knowledge of newborn bloodspot screening.
The initial interview phase of the study had suggested that parents employed dif-
fering information-seeking practices which were broadly classed as “active seeking”
167
9. Decision-making and newborn bloodspot screening Stuart Nicholls
or “passive receiving”. This grouping can be seen to show some similarities to a
monitoring/blunting coping style (Miller, 1987). However, whilst those considered
to be active seekers of information showed an information-seeking style akin to the
traditional monitoring dimension, those parents labelled as passive receivers were
inconsistent with the blunting aspects. Passive receivers did not provide demon-
strable blunting techniques, such as information avoidance or distraction, and were
found to accept information when this was provided to them. Instead, parental
information seeking appeared to be consistent with the formulation of Wilson in
which other modes of searching take place (Wilson, 1999; Case et al., 2005). Wil-
son’s model identifies four methods of information search and acquisition:
“passive attention: such as listening to the radio or watching tele-
vision programmes, where information acquisition may take place
without intentional seeking;
passive search: signifies those occasions when one type of search (or
other behaviour) results in the acquisition of information that
happens to be relevant to the individual;
active search: where an individual actively seeks out information;
and
ongoing search: where active searching has already established the
basic framework of knowledge, ideas, beliefs or values, but where
occasional continuing search is carried out to update or expand
one’s framework. In consumer research, Bloch et al. (1986) define
ongoing search as that which is independent of specific purchase
needs or decisions and that the motives are to build knowledge for
future purchase decisions and simply to engage in a pleasurable
activity.” (Wilson, 1999, p562)
The parents within the interviews could, therefore, be considered to fulfil two of
these categories with the active seekers equating to the active search within Wilsons
168
9. Decision-making and newborn bloodspot screening Stuart Nicholls
model, whilst the passive receivers can be considered to undertake a form of passive
search, or what may also be referred to as “active scanning” which may involve
practices such as semi-directed browsing and the active listening to conversations
or questions in likely locations (McKenzie, 2002). Consequently, the attendance
of antenatal appointments and the receipt of information from the midwife may
be seen as a passive search occasioned by their attendance.
Questionnaire responses concurred with the different information-seeking practices
with parents varying in terms of both their purported and actual information-
seeking behaviour, indicated through the number of sources used. This variation
is consistent with reported practices within newborn bloodspot screening interna-
tionally which has found that parents vary in terms of when, how and to what
extent they collect or seek information (Tymstra, 1986; Parsons et al., 2006; Det-
mar et al., 2007; Tluczek et al., 2009). In particular, recent research has explicitly
noted that “Some parents actively sought out information, for example, reading
books, while others learned about NBS incidentally as part of their circumstances”
(Tluczek et al., 2009, p329). Such a finding is consistent with the passive receiver
or passive search strategies identified here.
Information-seeking behaviour scores indicated an active-seeking population with
almost 40% of parents scoring highly in terms of stated behaviour. This wasn’t
borne out by actual behaviour, with the majority of parents (74%) using ei-
ther one or two sources of information only and less than 10% using 4 or more
sources. Cross-tabulations (not shown) revealed a non-significant relationship be-
tween stated information-seeking behaviour and the number of sources used. This
may suggest that the differing information-seeking practices are not manifest in
the number of sources used, but the way in which they are used.
Despite the identification of different information-seeking preferences, the present
169
9. Decision-making and newborn bloodspot screening Stuart Nicholls
study failed to find evidence of a relationship between information-seeking, as-
sessed through either stated behaviour or the number of information sources used,
and knowledge. Whilst there are no studies within the context of newborn blood-
spot screening that consider such a relationship, work in prostate cancer screening
has found that independent active seekers of information are significantly more
knowledgeable about prostate cancer than doctor dependent seekers or passive re-
cipients (Williams-Piehota et al., 2008). However, the analysis did not consider
the information-seeking process per se as it did not clearly demarcate the ac-
tive/passive or seeking/scanning distinctions.
The potential lack of association between both stated and actual information-
seeking and knowledge is significant when one considers the education of parents.
If the aim of the education is to improve parental knowledge of screening then giv-
ing parents more information, in the form of more materials from different sources,
may not be effective. Instead resources may be better spent honing and refining
a limited range of information sources. Furthermore, experience cannot be con-
sidered as knowledge. The finding that multiparous parents are not significantly
more knowledgeable than primaparous parents demonstrates the need for consis-
tent information irrespective of number of children. There is, however, a paucity
of information relating to both information-seeking practices and the relationship
with knowledge and it remains an area that is vastly under researched despite the
extensive range of materials produced by the NHS and newborn screening pro-
gramme. Specifically research is required which considers how the different infor-
mation sources are used and the role that each of these play in the decision-making
process. Whilst knowledge has been assessed in a variety of ways, the failure to
consider the relationships with educational materials and information-seeking is
to be lamented. More work is needed to consider what information materials are
deemed accessible and useful and how these affect the information-seeking pro-
cess. Each of these need to be related to knowledge so long as the consent given
170
9. Decision-making and newborn bloodspot screening Stuart Nicholls
by parents is required to be an informed one and not merely an assent.
9.3 Attitudes towards screening
Both the interviews and the questionnaire data indicate that trust is an impor-
tant factor when making decisions to accept newborn bloodspot screening. Whilst
both models 2 and 3 were supported by the quantitative data gathered through
the questionnaire, model 2, in which general attitudes to medicine and specific
attitudes to screening were disaggregated, was found to be theoretically more ro-
bust. Whilst attitudes are widely reported within both the newborn and prenatal
screening literature, these attitudes tend to focus purely on the perceptions of risks
and benefits of the immediate test (Al-Jader et al., 1990; Campbell and Ross, 2003,
2005; Davey et al., 2005). The findings here suggest that much more of the vari-
ability in perceived decisional quality may be accounted for if one also includes the
wider attitudes towards healthcare. This finding further implicates the context of
the screening in the responses which one achieves. Those parents who have more
negative attitudes towards healthcare generally, are likely to have more negative
attitudes towards screening specifically. The disaggregation of the general and spe-
cific attitudes may also in part explain the greater influence of choice on perceived
decisional quality and may indicate that existing studies may over emphasise the
role that attitudes play in parental decisions regarding screening.
Parents demonstrated the requirement for interpersonal trust, that is a trusting
relationship between two individuals, and in particular singled out the relation-
ship with the midwife. This was based on trust in her abilities and knowledge,
demonstrated not only through objective sources of reference - such as qualifica-
tions - but also her demeanour. This finding is in keeping with previous stud-
ies on physician-patient trust which have found that “it was repeated experience
of caring, compassion, and commitment that underpinned trust” (Guthrie, 2008;
Brownlie, 2008). Parents also showed a more general trust in hospitals and the
171
9. Decision-making and newborn bloodspot screening Stuart Nicholls
NHS demonstrated by confidence in regulation and governance. The finding that
both of these aspects loaded onto a single latent construct, and that this was a
significant determinant of parental attitudes towards screening, is consistent with
existing theories of trust relationships. As Hall et al. (2002) state:
“General trust depends to some extent on patients’ previous experi-
ences with their own doctors. Also, patients who have greater general
trust are expected to more readily trust individual physicians they meet
for the first time. This is because, early in a treatment relationship,
interpersonal trust is likely to be based primarily on general system
features, but as the relationship continues, a divergence (either higher
or lower) is more likely between general and interpersonal trust, as pa-
tients learn more about the particular characteristics of a provider.”
(Hall et al., 2002, p1422)
Trust, therefore, is not distinct between the healthcare professionals and the insti-
tutions in which they work. As Brownlie (2008, p21) suggests:
“In reality, the relationships are two-way: health professionals are given
a ‘warrant for trust’ (Misztal 1996, 121) from their association with a
health profession or an organization such as a particular clinic; and,
at the same time, trust in these institutions is ‘built up’, almost in a
symbolic interactionist sense, through the recurrent actions between
people within these settings.”
Multiple-layers are in play with a reciprocal interaction between layers and confi-
dence being established through individual interactions. Such a relationship was
identified within the present study, suggesting that both the attitudes towards the
key healthcare professionals - here the midwife - and the wider health service are
important.
172
9. Decision-making and newborn bloodspot screening Stuart Nicholls
9.3.1 Established trust: parental relationships with the
midwife
Trust in the midwife was a specific finding within the current study. This trusting
relationship arose within the interviews and was confirmed through the quanti-
tative analysis where it was found that there was a significant and positive rela-
tionship between the frequency with which parents saw the same midwife and the
trust placed in them. This suggests that familiarity may be an important part of
this trusting relationship.
The role of the parent-midwife relationship was noted by Parsons et al. (2007)
and Muchamore et al. (2006b). In both studies trust in the midwife or healthcare
professionals was an important factor in parental decision-making, even overriding
the need for information in some parents (Parsons et al., 2007). The present study
confirms this but also offers an insight into the causal determinants of this trust.
The quantitative analysis indicates that increasing familiarity was associated with
increased trust. This is potentially explained through a build up of trust over time.
The discussions with parents suggests that characteristics of the midwife, such as
honesty, confidentiality and not being patronised were important in establishing a
trusting relationship.
This role of familiarity is a feature within trust literature, with authors claim-
ing that an ongoing relationship not only engenders greater trust within an in-
dividual but may also mean that the individual may act in a more trustworthy
manner (Solbjør, 2008). The qualitative data from the present study suggests
that increasing contact with the same midwife, and the associated familiarity, led
parents to perceive that they are given a greater deal of attention. Confidence in
abstract systems of governance also plays a role. The parental interviews indicated
that qualifications and experience together with the midwife’s personal skills and
demonstrable expertise were key to developing trust relations. This is consistent
173
9. Decision-making and newborn bloodspot screening Stuart Nicholls
with previous studies into trust relationships which have found that items relating
to patient-centred care e.g. whether patients felt they were given enough attention,
and perceptions of professional expertise are ranked highest in terms of explaining
trust (Calnan and Rowe, 2006; Rowe and Calnan, 2006).
9.3.2 Institutional confidence
Whilst both interpersonal trust and institutional confidence were relatively high
with mean scores of 69.7 and 65.4 respectively, confidence in healthcare institutions
was lower than the interpersonal trust in the midwife. This is again consistent with
the existing literature regarding trust relations which, although complex, tends to
show a decline in institutional confidence whilst individual trust remains higher
(Brownlie, 2008). Explanation can again be found within the interview data,
specifically in relation to the receipt of results which some parents noted were ei-
ther not received or were not given on the basis that “no news is good news”.
This can be seen to tie in with parental acceptance of screening on the basis that
it is offered by the health service, and this service is trusted. The role of trust has
been noted in the context of prenatal screening decisions where the trust in the
healthcare system led to the perception that screening was a helpful technology
(Santalahti et al., 1998; Chiang et al., 2006). The same was found within the
parental interviews conducted here, in which parents talked about the review and
vetting processes they felt tests went through, indicating a trust in the systems of
accountability in place to govern the NHS.
9.3.3 Knowledge, attitudes and parental decisions
The present study found an association between knowledge and attitudes which in
turn had an effect on parental perceptions of decisional quality. This was specifi-
cally postulated as a causal relationship; with increased knowledge leading to more
positive attitudes leading to a greater perceived quality of decision. This thinking
174
9. Decision-making and newborn bloodspot screening Stuart Nicholls
is consistent with the study of Holtzman et al. (1983) where parents with higher
knowledge scores were significantly more in favour of mandatory screening.
This can be compared to studies in prenatal screening where inconsistent results
have been found with some failing to find a relationship (Michie et al., 2003) whilst
others suggest that those mothers accepting screening, and with positive attitudes,
tend to be more knowledgeable than those declining (Michie et al., 1999). Stud-
ies in cancer screening have found the converse with increased knowledge being
associated with decreased intention to screen for prostate cancer, (Coulter and
Fitzpatrick, 2000).
It may, therefore, be that the specific circumstances of newborn screening, and the
central location of parental attitudes towards the ‘ability to act’ on information, are
contributing factors in this identified association between perceived knowledge and
attitudes. However, more research is required to identify whether this association
can be extrapolated to parents who decline screening, or if it is an artefact of
the present sample which consisted only of parents who had accepted newborn
screening.
9.4 Parental decision-making and informed con-
sent to newborn bloodspot screening
In the UK there is a policy of informed consent (UK National Screening Committee,
2000; Campbell and Ross, 2004; Kenner and Moran, 2005). This is spelt out clearly
in the National Screening Programme’s own literature which states that:
“It is important to offer parents an informed choice about screening for
their baby, to gain consent and to prepare them for the blood sampling
procedure.” (UK Newborn Screening Programme Centre, 2008a, p2).
175
9. Decision-making and newborn bloodspot screening Stuart Nicholls
In January 2008 updated guidelines were issued by the UK Newborn Screening
Programme Centre for those professionals involved in the collection of the blood
spot sample. These guidelines confirm the initial step in the screening process,
stating that in order to enable parents to make an informed decision about screen-
ing they should have the ‘Screening tests for you and your baby’ booklet (UK
Newborn Screening Programme Centre, 2008a). Parents are given this informa-
tion at some point during the 3rd trimester of pregnancy but at least 24 hours
before screening. No stipulation is provided for exactly when the information is
given and so this may vary. Staff are then expected to:
“Explain fully to parents and then record in the maternity record that
newborn blood spot screening has been discussed and recommended,
booklet given and consent sought.” (UK Newborn Screening Pro-
gramme Centre, 2008a, p2).
Despite advocating choice there is no data to assess whether an informed consent
is being given; none of the standards for assessing screening relate to the consent
process. Standard three; that regions should account for 100% of the screening
tests offered, in no way ensures that the recorded decisions constitute an informed
consent, or even an informed refusal. It does, however, suggest that the data
should be available to identify all those parents who have accepted, given a partial
acceptance or have declined screening. As such, analysis could, theoretically, be
conducted on the percentage of parents who refuse screening for all or some con-
ditions as well as those who accept all conditions.
Whilst this data would be of huge value, the present study suggests that audit
data would only capture a small proportion of the elements which play a role in
parental-decision making. The results here clearly show that context is key; that
the way in which screening is presented and the experiences of parents in their
interactions with healthcare staff and the system more widely, are crucial to the
determination of both their attitudes towards screening and their retrospective
176
9. Decision-making and newborn bloodspot screening Stuart Nicholls
attitudes towards the decisions taken.
The disaggregation of attitudes has provided insights into the strength of effect
of different constructs. When attitudes towards the staff and healthcare system
were separated from attitudes towards the specific test the influence on decisional
quality by these specific attitudes was reduced. This suggests that the failure to
account for these aspects separately overestimates the specific influence of test at-
titudes on parental decisional quality. When separated, the results indicated that
the direct effect of perception of choice had a greater effect on parental perceptions
of decisional quality than attitudes towards the screening test itself. This finding
implicates the presentation of screening as a key determinant of decisional quality.
The study also highlights areas that are under-researched. More work is required
to consider the mechanisms through which perceived choice affects decisional qual-
ity and the role of choice in developing parental knowledge. The lack of association
between experience, information-seeking, and knowledge is also one that deserves
greater attention, and would be extremely pertinent to those involved in the ar-
eas of health promotion and parental education. More research is also needed to
establish the generalisability of the effects of the identified variables within the
context of parental declines.
177

Appendix A
Invitation letter (interviews)
178

3rd February 2009
Dear
Invitation to take part in a study of newborn screening experiences
I am writing to invite you to take part in a research study to find out about your experiences and views about newborn blood spot screening, or what you may know as the ‘heel prick test’. You are receiving this letter because you have recently had a child. The study is being conducted by Stuart Nicholls at Lancaster University.
In this study you will be asked to take part in one interview, and this should take roughly one hour of your time. Interviews are a good way to find out what you think in a way that allows you to explain in your words what you feel. There is very little research about how parents experience these tests and how they are offered and I hope that this research may be used to develop this process.
Please read the attached information sheet that explains the purpose of this research.
If, in the meantime, you have any questions please do not hesitate to contact Stuart Nicholls, by telephone on 07892721041 or by email at [email protected].
Thank you for taking the time to read this letter
Yours Sincerely
Dr Kevin SouthernSenior Lecturer and Consultant in Paediatric Respiratory Medicine
A. Invitation letter (interviews) Stuart Nicholls
179

Please return the reply slip below in the envelop included. If you do not wish to take part please indicate on the form below, this will ensure you receive no further letters.
Name:.......................................... Ref:...............................
Yes, I would like to take part
No, I would not like to take part
Contact details:
Telephone:...........................................................................
Address:...............................................................................
.............................................................................................
.............................................................................................
Postcode:..............................................................................
A. Invitation letter (interviews) Stuart Nicholls
180

Appendix B
Patient information sheet
(interviews)
181
18 December 2008: version 1.5
Participant Information sheet
Parental experiences of newborn screening
You are being invited to take part in a study to explore the experiences of parents whose children have been offered newborn blood spot screening (or what may have been referred to as the heel prick or Guthrie test) as part of the care for their newborn baby. This leaflet gives you information about this study and how it involves you. Before you decide to take part it is important for you to understand why the research is being done and what it will involve. The research to be carried out has been approved by the Multi Centre Research Ethics Committee (MREC Reference: 08/H1005/85) as well as the ethics committee of Lancaster University.
Purpose of research
The aim of this study is to find out how parents experience newborn blood spot screening, and how they decide whether or not to have their children tested. To do this you have been invited to take part in an interview. Whilst the main outcome will be research to achieve an educational qualification (PhD), I hope that the information from this study will be used to help develop the way that newborn blood spot screening is conducted.
Who is doing the study?
The project is being conducted by Stuart Nicholls, a PhD student at Lancaster University and who is being supervised by Dr Mairi Levitt and Professor Paul Fearnhead, both of whom are also at Lancaster University. For more information about Lancaster University you can visit their website at www.lancs.ac.uk or by contacting Stuart Nicholls. This project forms part of the doctoral research for Stuart Nicholls which is to be completed by September 2010. Stuart is funded by a studentship from the Economic and Social Research Council (ESRC). As part of this studentship Stuart has received training in a range of research methods. In addition to this Stuart has conducted previous research interviewing patients of the health service and this work has been published in international medical journals. If you require any further information please contact Stuart Nicholls on 07892721041 or by email at [email protected]
Why have I been chosen?
You have been chosen because you have had a child during the last twelve months. As such you should have been offered the newborn blood spot screening tests as part of the National Screening Programme for newborn babies.
B. Patient information sheet (interviews) Stuart Nicholls
182

What will taking part involve?
If you agree to help with the research you will be asked to take part in one interview. This will be informal and will take approximately one hour, although it may be shorter or longer. This interview will explore different aspects of how the newborn blood spot screening tests were offered to you, what you felt about them, and what influenced your decision-making.
Interviews are a good way to find out about peoples experiences and views as they allow the person to put their thoughts in their own words and are less restrictive than a questionnaire.
Risks and benefits of taking part
There are no risks to you in taking part in this research. You will only be asked about your experiences and views. Any comments you make will remain anonymous. This may, however, allow for the possibility of discussing issues that may be upsetting. You do not need to talk about anything which you do not wish to, and you will not be asked to do so. The research will provide information about how parents experience the tests and may identify ways in which this process can be developed. If you would like to, you can receive a copy of the interview as well as a summary of the research. The research will also help to design future studies.
What if I do not wish to take part?
Taking part is completely optional and you can choose not to take part. This will not affect your future treatment in any way. If you do not wish to take part please inform Stuart Nicholls by completing the enclosed reply slip to say this, or contact him by email or telephone.
Confidentiality
All interviews will be conducted with the strictest confidence and your name will not be used in any publication or shown to any person. Only Stuart Nicholls will be able to identify you. Occasionally direct quotations will be used for publication but these will have your name and any identifying comments removed from them. All information will be stored in secure locations as required by the Data Protection Act 1998 and processed under data protection registration Z6328653. Data will be held for a required period of 5 years after which it will be destroyed.
Will I be paid for taking part?
Unfortunately I will not be able to pay you for helping with this study. If you have incurred any expenses as a result of taking part in this study these will be reimbursed.
What will happen to the results?
The results will be compiled as part of a doctoral thesis for submission for the qualification of PhD for Stuart Nicholls. The results may also be published in academic and professional journals and at conferences. No individuals taking part in the study will be identifiable from these results.
B. Patient information sheet (interviews) Stuart Nicholls
183

Future research
You will not automatically be expected to take part in any future research
What if something goes wrong?
In the unlikely event that you are harmed by taking art in this research project, there are no special compensation arrangements. If you are harmed due to someone’s negligence, then you may have grounds for legal action but you may have to pay for it.
Regardless of this, If you have a concern about any aspect of this study, you should ask to speak to Stuart Nicholls who will do his best to answer your questions (tel: 07892721041). If you remain unhappy and wish to complain formally, you can do this through the NHS Complaints Procedure or through Lancaster University. Details of how to do this are available on request.
For further information or comments about the study please contact:
Stuart Nichollsc/o Mathematics and Statistics,Fylde College,Lancaster University,LancasterLA1 4YWTel: 07892721041Email: [email protected]
Alternatively you may contact your local NHS R&D department for further information.
Thank you for taking the time to read this. If you have any further questions please contact Stuart Nicholls
You should keep this information sheet for future reference
B. Patient information sheet (interviews) Stuart Nicholls
184

Appendix C
Reminder letter (interviews)
185

6 March 2009
Dear
Invitation to take part in a study of newborn screening experiences
I recently wrote to you regarding the above study and invited you to take part in research to find out about your experiences and views about newborn blood spot screening, or what you may know as the ‘heel prick test’. If you have recently replied then please discard this letter.
You are receiving this letter because you have recently had a child. The study is being conducted by Stuart Nicholls at Lancaster University. In this study you will be asked to take part in one interview, and this should take roughly one hour of your time. Interviews are a good way to find out what you think in a way that allows you to explain in your words what you feel. There is very little research about how parents experience these tests and how they are offered and I hope that this research may be used to develop this process.
Please read the attached information sheet that explains the purpose of this research. If you wish to take part please return the enclosed reply slip.
If, in the meantime, you have any questions please do not hesitate to contact Stuart Nicholls, by telephone on 07892721041 or by email at [email protected].
Thank you for taking the time to read this letter
Yours Sincerely
Dr Kevin SouthernSenior Lecturer and Consultant in Paediatric Respiratory Medicine
C. Reminder letter (interviews) Stuart Nicholls
186

Please return the reply slip below in the envelop included. If you do not wish to take part please indicate on the form below, this will ensure you receive no further letters.
Name:.......................................... Ref:...............................
Yes, I would like to take part
No, I would not like to take part
Contact details:
Telephone:...........................................................................
Address:...............................................................................
.............................................................................................
.............................................................................................
Postcode:..............................................................................
C. Reminder letter (interviews) Stuart Nicholls
187

Appendix D
R code for sample size calculation
188

R code for generating SEM Sample size
# Calculate required sample size for test of close fit # (RMSEA)## @author Timo Gnambs <[email protected]># @version 2008-09-10## @source MacCallum, R. C., Browne, M. W. & Sugawara, H. M. # (1996). Power analysis and determination of # sample size for covariance structure modeling. # Psychological Methods, 1(2), 130-149.#
#################### SETTINGS ####################
df <- 109 # Degrees of freedomalpha <- 0.05 # Significance levelpower <- 0.80 # Desired powerrmsea0 <- 0.05 # RMSEA under H0rmseaa <- 0.08 # RMSEA under H1
##################################################
#initialize valuespowa <- 0.0n0 <- 0#begin loop for finding initial level of n ;while(!(powa > power)) { n0 <- n0 + 100 ncp0 <- (n0-1)*df*rmsea0**2 ncpa <- (n0-1)*df*rmseaa**2 #compute power if(rmsea0 > rmseaa) { cval <- qchisq(alpha,df=df,ncp=ncp0) powa <- pchisq(cval,df=df,ncp=ncpa) } else { cval <- qchisq(1-alpha,df=df,ncp=ncp0) powa <- 1 - pchisq(cval,df=df,ncp=ncpa) }}#begin loop for interval halvingdir <- -1newn <- n0intv <- 200powdiff <- powa - powerwhile(!(powdiff < .001)){
D. R code for sample size calculation Stuart Nicholls
189

intv <- intv*0.5 newn <- newn + dir*intv*.5 #compute new power ncp0 <- (newn-1)*df*rmsea0**2 ncpa <- (newn-1)*df*rmseaa**2 #compute power if(rmsea0 > rmseaa) { cval <- qchisq(alpha,df=df,ncp=ncp0) powa <- pchisq(cval,df=df,ncp=ncpa) } else { cval = qchisq(1-alpha,df=df,ncp=ncp0) powa = 1 - pchisq(cval,df=df,ncp=ncpa) } powdiff <- abs(powa - power) if(powa < power) dir <- 1 else dir <- -1}nrmsea <- newnrm(powa, n0, newn, dir, intv, powdiff, ncp0, ncpa, cval)print(c('Required N for test of close of fit (McCallum et al., 1996)', ceiling(nrmsea)))
D. R code for sample size calculation Stuart Nicholls
190

Appendix E
Invitation letter (questionnaire)
191

Alder HeyEaton Road
LiverpoolL12 2AP
www.alderhey.com
January 2010
Dear
I am writing to you as the Paediatric Doctor supporting a study to find out about your experiences of the heel prick. This will have been conducted shortly after your baby was born. You have been selected at random from a sample of parents who had a child born in 2008.
The study, conducted by Stuart Nicholls at Lancaster University, aims to explore how you made your decision and what affected this.
If you would like to take part please complete the questionnaire included with this letter and return it in the freepost (no stamp required) envelope enclosed. As a thank you all completed questionnaires will be entered into a draw to win £20 of high street vouchers.
Thank you for taking the time to read this letter and I sincerely hope you can spare the time to take part. You should read the information sheet that explains more about the study, and if you have any questions please contact Stuart directly by telephone on 07892721041 or by email at [email protected].
You have been chosen at random and without sight of medical records. As such we are not aware of an circumstances that may prevent you from taking part. If this is the case please accept my apologies for any inconvenience or distress caused.
Once again, thank you for your time.
Yours Sincerely
Dr Kevin Southern MBChB, MRCP, PhDSenior Lecturer and Consultant in Paediatric Respiratory Medicine,member of the Cystic Fibrosis Board, National Newborn Screening Committee.
E. Invitation letter (questionnaire) Stuart Nicholls
192

Appendix F
Patient information sheet
(questionnaire)
193
October 2009: version 1.2
Participant Information sheet: Experiences of the heel prick
You are being invited to take part in a study to explore the experiences of parents whose children have been offered the heel prick as part of the care for their newborn baby. This leaflet gives you information about this study and how it involves you. Before you decide to take part it is important for you to understand why the research is being done and what it will involve. The research to be carried out has been approved by the Multi Centre Research Ethics Committee (MREC Reference: 09/H1005/66) as well as the ethics committee of Lancaster University.
Purpose of research
The aim of this study is to find out how you, as parents, feel about the heel prick and and how you made your decision about whether to have the test or not. To do this you have been invited to complete a short survey. Whilst the main outcome will be research to achieve an educational qualification (PhD), I aim to use the information you provide to help develop the way that heel prick is conducted.
Who is doing the study?
I am Stuart Nicholls, a PhD student at Lancaster University. I am supervised by Dr Mairi Levitt and Professor Paul Fearnhead, both of whom are also at Lancaster University. For more information about Lancaster University you can visit the website at www.lancs.ac.uk or contact me. This project forms part of my doctoral research which is to be completed by September 2010. I am funded by a studentship from the Economic and Social Research Council (ESRC). As part of this studentship I have received training in a range of research methods but have also conducted previous research which has been published in international medical journals. If you require any further information please contact me on 07892721041 or by email at [email protected]
Why have I been chosen?
You have been chosen at random from a sample of parents who have had a child during 2008 and whose tests were analysed by the Merseyside and Cheshire screening laboratory. As such you should have been offered the newborn blood spot screening tests as part of the National Screening Programme for newborn babies.
Continued on the next page....
F. Patient information sheet (questionnaire) Stuart Nicholls
194

What will taking part involve?
If you agree to help with the research you will be asked to complete a short questionnaire. This should take roughly 15 minutes. The questionnaire will ask you about the heel prick and how you felt about different things to do with this.
The questionnaire is completely confidential and no one will be able to identify you from the results.
Risks and benefits of taking part
There are no risks to you in taking part in this research. You will only be asked about your experiences and views. Any comments you make will remain anonymous. The research will provide information about how parents experience the tests and may identify ways in which this process can be developed. If you would like to, you can receive a summary of the research.
What if I do not wish to take part?
Taking part is completely optional and you can choose not to take part. If you do not wish to take part please inform Stuart Nicholls by completing the tick box on the questionnaire to say this, or contacting him by email or telephone. This will mean that you receive no further letters.
Confidentiality
All questionnaires will be analysed with the strictest confidence and your name will not be used in any publication or shown to any person. Only Stuart Nicholls will be able to identify you. All results published will be averages from all the people who respond and so no one will see your results. All information will be stored in secure locations as required by the Data Protection Act 1998 and processed under data protection registration Z6328653. Data will be held for a required period of 5 years after which it will be destroyed.
Will I be paid for taking part?
Unfortunately I will not be able to pay you for helping with this study. However, as a thank you, all completed questionnaires will be entered into a draw to win £20 of High Street vouchers.
What will happen to the results?
The results will be compiled as part of a doctoral thesis for submission for the qualification of PhD for Stuart Nicholls. The results may also be published in academic and professional journals and at conferences. No individuals taking part in the study will be identifiable from these results.
Continued over the page....
F. Patient information sheet (questionnaire) Stuart Nicholls
195

What if something goes wrong?
It is extremely unlikely that you are harmed by taking part in this research project. However, there are no special compensation arrangements. If you are harmed due to someone’s negligence, then you may have grounds for legal action but you may have to pay for it.
Regardless of this, If you have a concern about any aspect of this study, you should ask to speak to Stuart Nicholls who will do his best to answer your questions (tel: 07892721041). If you remain unhappy and wish to complain formally, you can do this through the NHS Complaints Procedure or through Lancaster University. Details of how to do this are available on request.
For further information or comments about the study please contact:
Stuart Nichollsc/o Mathematics and Statistics,Fylde College,Lancaster University,LancasterLA1 4YFTel: 07892721041Email: [email protected]
You should keep this information sheet for future reference
F. Patient information sheet (questionnaire) Stuart Nicholls
196

Appendix G
Reminder letter (questionnaire)
197

Alder HeyEaton Road
LiverpoolL12 2AP
www.alderhey.com
January 2010
Dear
I recently wrote to you regarding a study about your experiences of the heel prick and invited you to take part in this research.
If you have recently replied then please discard this letter.
The study, conducted by Stuart Nicholls at Lancaster University aims to explore how you made your decision about the heel prick and what affected this. If you would like to take part please complete the questionnaire included with this letter and return it in the freepost (no stamp required) envelope enclosed. As a thank you all completed questionnaires will be entered into a draw to win £20 of high street vouchers.
Thank you for taking the time to read this letter and I sincerely hope you can spare the time to take part. You should read the information sheet included which explains more about the study, and if you have any questions please contact Stuart directly by telephone on 07892721041 or by email at [email protected].
You have been chosen at random and without sight of medical records. As such we are not aware of an circumstances that may prevent you from taking part. If this is the case please accept my apologies for any inconvenience or distress caused.
Once again, thank you for your time.
Yours Sincerely
Dr Kevin Southern MBChB, MRCP, PhDSenior Lecturer and Consultant in Paediatric Respiratory Medicine,member of the Cystic Fibrosis Board, National Newborn Screening Committee.
G. Reminder letter (questionnaire) Stuart Nicholls
198

Appendix H
Questionnaire & coding scheme
199

Reference Number: ________________
Experiences of the heel prick
This survey asks you about your experiences of newborn bloodspot screening, or what may have been referred to as the heel prick (the procedure whereby a small amount of blood is taken from your baby's heel for testing). In answering please think about how you felt at the time and, if you have more than one child, please answer for your most recent child. If you wish to complete the survey on line please visit www.maths.lancs.ac.uk/~nichols1
Thank you for your time and for completing this questionnaire. Please remember that all completed questionnaires will be entered into a prize draw to win £20 of high street vouchers.
Please tick this box and return the survey if you do not wish to take part:
InformationIn this section you will be asked about your general experiences with your doctor or nurse before moving on to how you found out about the heel prick and your views about the information you found.
1. Please tell me about your usual experiences, such as when you go to see your own doctor. Please tick whether you agree or disagree:
Agree Disagree
Instead of waiting, I usually ask the doctor or nurse immediately after an examination about my health
1 0
I usually ask the doctor or nurse lots of questions about the procedures during a medical examination
1 0
I’d rather be given many choices about what’s best for my health than to have the doctor make the decisions for me
1 0
I usually don’t ask the doctor or nurse many questions about what he or she is doing during a medical examination
1 0
I’d rather have doctors and nurses make the decisions about what’s best than for them to give me a whole lot of choices
1 0
It is better to trust doctor or nurse in charge of a medical procedure than to question what she or he is doing
1 0
I usually wait for the doctor or nurse to tell me about the results of a medical exam rather than asking him or her immediately
1 0
Continued on the next page...
H. Questionnaire & coding scheme Stuart Nicholls
200
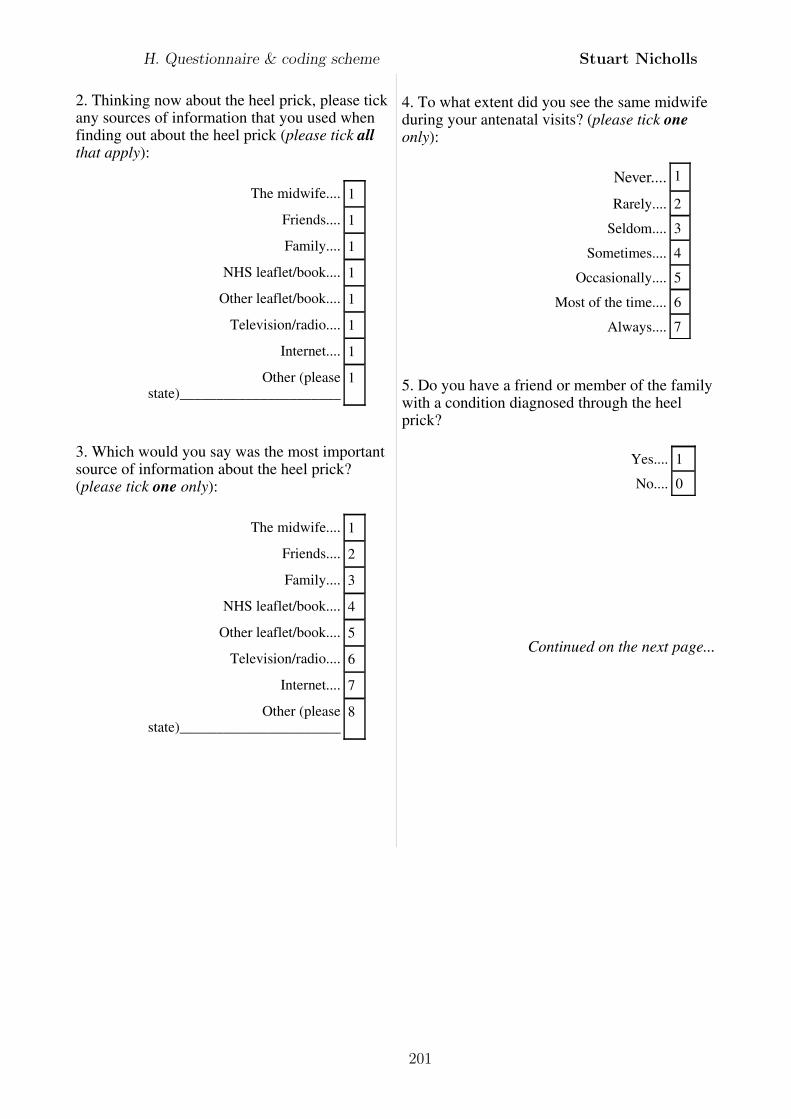
2. Thinking now about the heel prick, please tick any sources of information that you used when finding out about the heel prick (please tick all that apply):
The midwife.... 1
Friends.... 1
Family.... 1
NHS leaflet/book.... 1
Other leaflet/book.... 1
Television/radio.... 1
Internet.... 1
Other (please state)______________________
1
3. Which would you say was the most important source of information about the heel prick? (please tick one only):
The midwife.... 1
Friends.... 2
Family.... 3
NHS leaflet/book.... 4
Other leaflet/book.... 5
Television/radio.... 6
Internet.... 7
Other (please state)______________________
8
4. To what extent did you see the same midwife during your antenatal visits? (please tick one only):
Never.... 1
Rarely.... 2
Seldom.... 3
Sometimes.... 4
Occasionally.... 5
Most of the time.... 6
Always.... 7
5. Do you have a friend or member of the family with a condition diagnosed through the heel prick?
Yes.... 1
No.... 0
Continued on the next page...
H. Questionnaire & coding scheme Stuart Nicholls
201
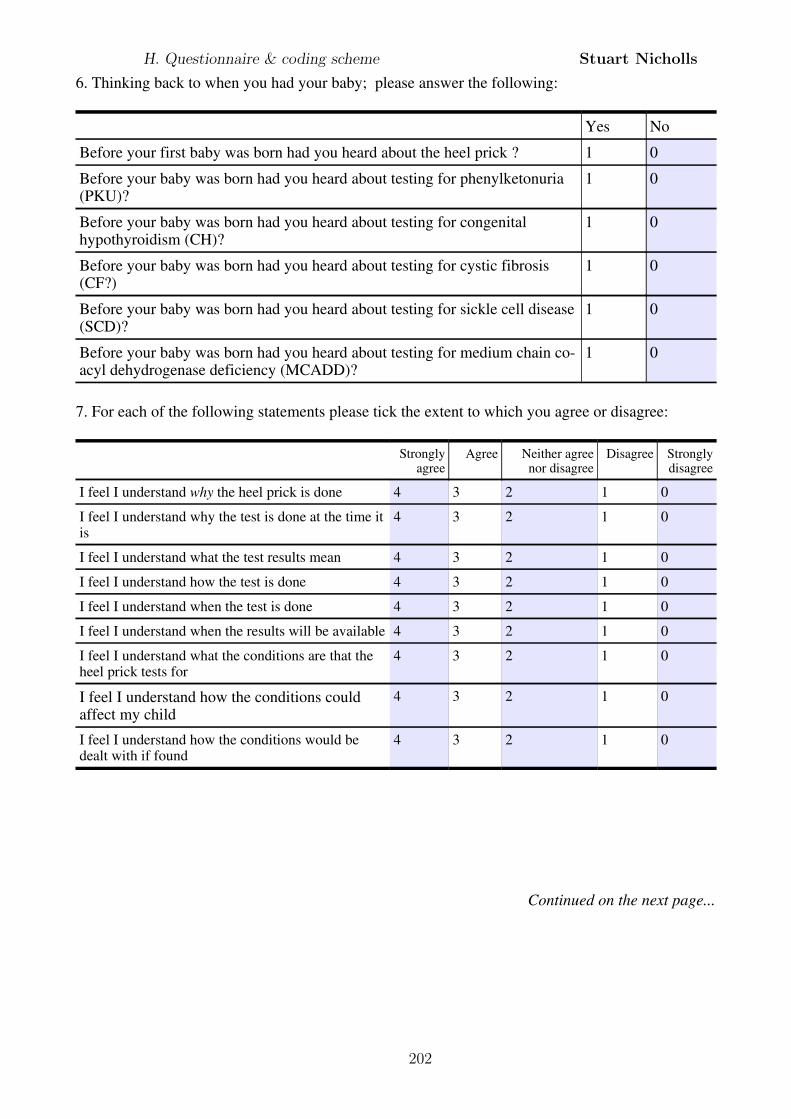
6. Thinking back to when you had your baby; please answer the following:
Yes No
Before your first baby was born had you heard about the heel prick ? 1 0
Before your baby was born had you heard about testing for phenylketonuria (PKU)?
1 0
Before your baby was born had you heard about testing for congenital hypothyroidism (CH)?
1 0
Before your baby was born had you heard about testing for cystic fibrosis (CF?)
1 0
Before your baby was born had you heard about testing for sickle cell disease (SCD)?
1 0
Before your baby was born had you heard about testing for medium chain co-acyl dehydrogenase deficiency (MCADD)?
1 0
7. For each of the following statements please tick the extent to which you agree or disagree:
Strongly agree
Agree Neither agree nor disagree
Disagree Strongly disagree
I feel I understand why the heel prick is done 4 3 2 1 0
I feel I understand why the test is done at the time it is
4 3 2 1 0
I feel I understand what the test results mean 4 3 2 1 0
I feel I understand how the test is done 4 3 2 1 0
I feel I understand when the test is done 4 3 2 1 0
I feel I understand when the results will be available 4 3 2 1 0
I feel I understand what the conditions are that the heel prick tests for
4 3 2 1 0
I feel I understand how the conditions could affect my child
4 3 2 1 0
I feel I understand how the conditions would be dealt with if found
4 3 2 1 0
Continued on the next page...
H. Questionnaire & coding scheme Stuart Nicholls
202

Attitudes to screeningIn this next section I would like to ask you about your views regarding the heel prick.
8. For each of the following statements please tick the extent to which you agree or disagree:
Strongly agree
Agree Neither agree nor disagree
Disagree Strongly disagree
I feel my child is at risk of having a condition which the heel prick tests for
4 3 2 1 0
The heel prick is an important test 4 3 2 1 0
The conditions screened for are rare 4 3 2 1 0
The heel prick is likely to cause a lot of pain to my child
0 1 2 3 4
The heel prick causes long lasting pain to my child 0 1 2 3 4
The heel prick is likely to have a long term impact on my child
0 1 2 3 4
The heel prick exposes my child to the risk of infection
0 1 2 3 4
The heel prick is a quick test 4 3 2 1 0
The heel prick can provide useful information. 4 3 2 1 0
The heel prick will allow treatment of an identified health problem
4 3 2 1 0
The conditions tested for in the heel prick are serious
4 3 2 1 0
Testing earlier is better than testing later 4 3 2 1 0
Continued on the next page...
H. Questionnaire & coding scheme Stuart Nicholls
203

Decision-makingIn this next section I would like to ask about how you felt about aspects of making the decision about the heel prick.
9. For each of the following statements please tick the extent to which you agree or disagree:
Strongly agree
Agree Neither agree nor disagree
Disagree Strongly disagree
I felt I had enough time to make a decision about the heel prick
4 3 2 1 0
I was too tired to make a decision about the heel prick
0 1 2 3 4
I was too emotional to make a decision about the heel prick
0 1 2 3 4
I did not feel able to make a decision about the heel prick
0 1 2 3 4
The heel prick is a routine test for all babies 0 1 2 3 4
It was expected that my child had the heel prick 0 1 2 3 4
The heel prick was presented as an optional test 4 3 2 1 0
I felt I had a choice to decline the test 4 3 2 1 0
I am clear about the best choice from me 0 1 2 3 4
I feel sure about what to choose 0 1 2 3 4
This decision is easy for me to make 0 1 2 3 4
I feel I have made an informed choice 0 1 2 3 4
My decision shows what is important to me 0 1 2 3 4
I expect to stick with my decision 0 1 2 3 4
I am satisfied with my decision 0 1 2 3 4
Continued on the next page...
H. Questionnaire & coding scheme Stuart Nicholls
204
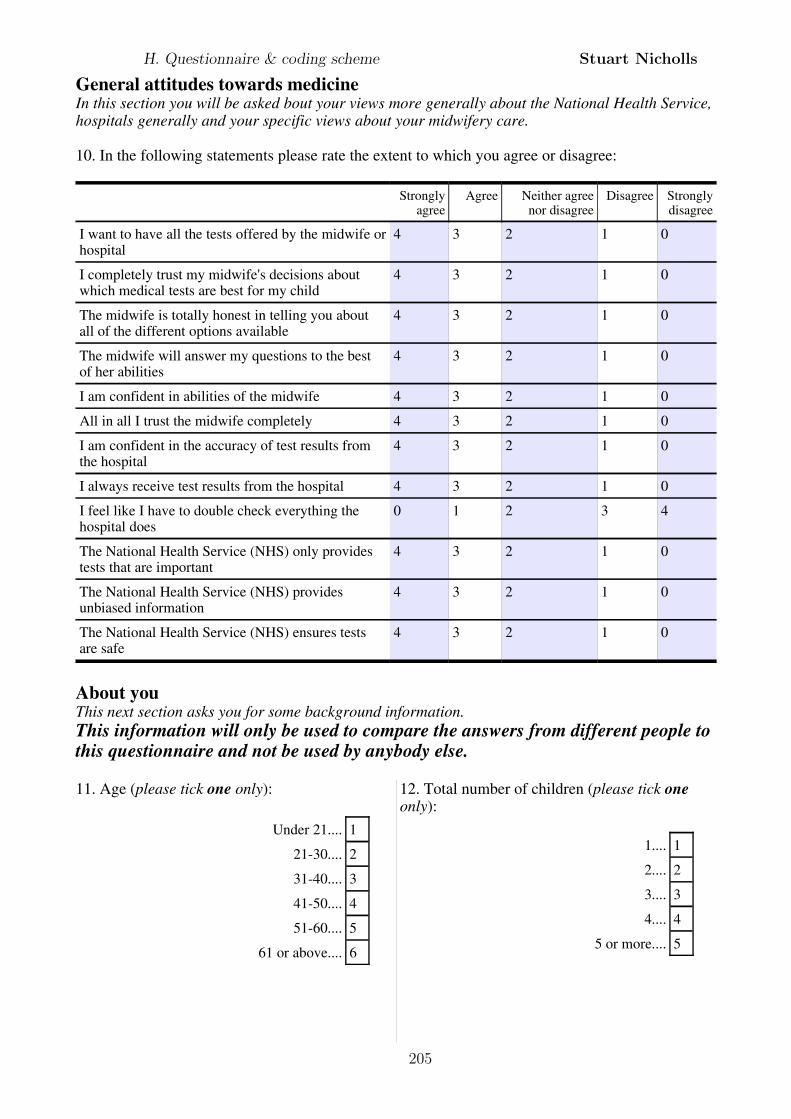
General attitudes towards medicineIn this section you will be asked bout your views more generally about the National Health Service, hospitals generally and your specific views about your midwifery care.
10. In the following statements please rate the extent to which you agree or disagree:
Strongly agree
Agree Neither agree nor disagree
Disagree Strongly disagree
I want to have all the tests offered by the midwife or hospital
4 3 2 1 0
I completely trust my midwife's decisions about which medical tests are best for my child
4 3 2 1 0
The midwife is totally honest in telling you about all of the different options available
4 3 2 1 0
The midwife will answer my questions to the best of her abilities
4 3 2 1 0
I am confident in abilities of the midwife 4 3 2 1 0
All in all I trust the midwife completely 4 3 2 1 0
I am confident in the accuracy of test results from the hospital
4 3 2 1 0
I always receive test results from the hospital 4 3 2 1 0
I feel like I have to double check everything the hospital does
0 1 2 3 4
The National Health Service (NHS) only provides tests that are important
4 3 2 1 0
The National Health Service (NHS) provides unbiased information
4 3 2 1 0
The National Health Service (NHS) ensures tests are safe
4 3 2 1 0
About youThis next section asks you for some background information. This information will only be used to compare the answers from different people to this questionnaire and not be used by anybody else.
11. Age (please tick one only):
Under 21.... 1
21-30.... 2
31-40.... 3
41-50.... 4
51-60.... 5
61 or above.... 6
12. Total number of children (please tick one only):
1.... 1
2.... 2
3.... 3
4.... 4
5 or more.... 5
H. Questionnaire & coding scheme Stuart Nicholls
205

13. Where was your most recent child born? (please tick one only):
NHS Hospital....(please give hospital name)
.................................................................
1
Private Hospital...(please give hospital name)
.................................................................
2
Home.... 3
Other (please state).........................................................................................................................
4
14. Ethnic group (please tick one only):
White.... 1
Black African.... 2
Black Caribbean.... 3
Black Other.... 4
Indian.... 5
Pakistani.... 6
Bangladeshi.... 7
Chinese.... 8
Other (please state)
.......................................................................
9
15. Highest level of educational attainment (please tick one only):
School/GCSE.... 1
College/A-Level.... 2
Undergraduate degree.... 3
Postgraduate degree.... 4
Professional qualification.... 5
Other (please state)....
.......................................................................
6
16. What is your estimated household income (including benefits) before tax? (please tick one only):
Less than £11500.... 1
£11501 – £18500.... 2
£18501 - £28000.... 3
£28001 – 41000.... 4
£41001 -75000.... 5
Over £75000.... 6
Please tick the box below if you would like a summary of the findings when complete:
1
Thank you for your time and for helping with this research.
H. Questionnaire & coding scheme Stuart Nicholls
206

Bibliography
Al-Jader, L., Goodchild, M., Ryley, H., and Harper, P. (1990). Attitudes of parents
of cystic fibrosis children towards neonatal screening and antenatal diagnosis.
Clinical Genetics, 38:460–465.
Aldridge, A. and Levine, K. (2001). Surveying the social world. Principles and
practice in survey research. Unerstanding social research. Open University Press.
Anon (1999). Phenylketonuria. Journal of Medical Screening, 6:113.
Arbuckle, J. and Wothke, W. (1995). Amos 4.0 user’s guide. Smallwaters corpo-
ration, Chicago.
Arksey, H. and Knight, P. (1999). Interviewing for social scientists. Sage publica-
tions, London.
Asch, D., Jedrziewski, M., and Christakis, N. (1997). Response rates to mail sur-
veys published in medical journals. Journal of Clinical Epidemiology, 50:1129–
1136.
Avis, M., Bond, M., and Arthur, A. (1997). Questioning patient satisfaction: an
empirical investigation in two outpatient clinics. Social Science & Medicine,
44:85–92.
Bailey, D., Beskow, L., Davis, A., and Skinner, D. (2006). Changing perspectives
on the benefits of newborn screening. Mental Retardation and Developmental
Disabilities Research Reviews, 12:270–279.
Baron, J. (2000). Thinking and deciding. Cambridge University Press, Cambridge.
207
BIBLIOGRAPHY Stuart Nicholls
Bartholomew, D. (1987). Latent variable models and factor analysis. Charles
Griffin & Company, London.
Beauchamp, T. and Childress, J. (2001). Principles of Biomedical Ethics. Oxford
University Press, Oxford, 5th edition.
Bekker, H., Thornton, J., Airey, C., Connelly, J., Hewison, J., Robinson, M.,
Lilleyman, J., MacIntosh, M., Maule, A., Michie, S., and Pearman, A. (1999).
Informed decision making: an annotated bibliography and systematic review.
Health Technology Assessment, 3(1):i–155.
Bell, J. (2005). Doing your research project. A guide for first-time researchers in
education, health and social science. Open University Press, Maidenhead, 4th
edition.
Bentler, P. and Dudgeon, P. (1996). Covariance structure analysis: Statistical
practice, theory, and directions. Annual Review of Psychology, 47:563–592.
Binedell, J., Soldan, J., and Harper, P. (1998). Predictive testing for Huntington’s
disease: I. Predictors of uptake in South Wales. Clinical Genetics, 54:477–488.
Birkett, N. (1986). Selecting the number of response categories for a likert-type
scale. In Proceedings of the American Statistical Association 1987 Annual Meet-
ings, Section on Survey Research Methods, pages 488–492.
Bollen, K. (1989). Structural equations with latent variables. John Wiley & Sons.
Bollen, K. (1998). Structural equation models. In Armitage, P. and Colton, T.,
editors, Encyclopedia of biostatistics, pages 4363–4372. John Wiley, Sussex.
Bosompra, K., Flynn, B., Ashikaga, T., Rairikar, C., Worden, J., and Solomon, L.
(2000). Likelihood of undergoing genetic testing for cancer risk: a population-
based study. Preventive Medicine, 30:155–166.
Bourdieu, P. (1999). Understanding. In Bourdieu, P., Accardo, A., Balazs, G.,
Beaud, S., Bonvin, F., Bourdieu, E., Bourgois, P., Broccolichi, S., Champagne,
208
BIBLIOGRAPHY Stuart Nicholls
P., Christin, R., Faguer, J., Garcia, S., Lenoir, R., M, F. O., Pialoux, Pinto,
L., Podalydes, D., and Wacquant, A. S. C. S. L. . J. D., editors, The weight of
the world: social suffering in contemporary society, pages 607–627. Polity Press,
Cambridge.
Bowling, A. (2004). Research Methods in Health, volume 2nd. Open University
Press, Maidenhead.
Boyatzis, R. (1998). Transforming qualitative information. Sage publications,
Thousand Oaks.
Bradley, D., Parsons, E., and Clarke, A. (1993). Experience with screening new-
borns for Duchenne muscular dystrophy in Wales. British Medical Journal,
306:357–360.
Braun, V. and Clarke, V. (2006). Using thematic analysis in psychology. Qualita-
tive Research in Psychology, 3:77–101.
Britten, N. (1995). Qualitative research: Qualitative interviews in medical re-
search. British Medical Journal, 311:251–253.
Brownlie, J. (2008). Conceptualizing trust and health. In Brownlie, J., Greene, A.,
and Howson, A., editors, Researching trust and health, pages 17–32. Routledge,
New York.
Bryman, A. (2004). Social research methods, volume 2nd. Oxford University Press,
Oxford.
Bunn, J., Bosompra, K., Ashikaga, T., Flynn, B., and Worden, J. (2002). Factors
influencing intention to obtain a genetic test for colon cancer risk: a population-
based study. Preventive Medicine, 34:567–577.
Byrne, B. (2001). Structural equation modeling with AMOS. Multivariate Appli-
cations Series. Lawrence Erlbaum Associates, Mahwah, New Jersey.
209
BIBLIOGRAPHY Stuart Nicholls
Calnan, M. and Rowe, R. (2006). Researching trust relations in health care. Con-
ceptual and methodological challenges - an introduction. Journal of Health
Organization and Management, 20(5):349–358.
Campbell, E. and Ross, L. (2003). Parental attitudes regarding newborn screening
of PKU and DMD. American Journal of Medical Genetics, 120A:209–214.
Campbell, E. and Ross, L. (2004). Incorporating newborn screening into prenatal
care. American Journal of Obstetrics and Gynecology, 190:876–877.
Campbell, E. and Ross, L. (2005). Parental attitudes and beliefs regarding the
genetic testing of children. Community Genetics, 8:94–102.
Carmines, E. and Zeller, R. (1979). Reliability and validity assessment. Quantita-
tive applications in the social sciences. Sage Publications, Beverley Hills.
Case, D., Andrews, J., Johnson, J., and Allard, S. (2005). Avoiding versus seek-
ing: the relationship of information seeking to avoidance, blunting, coping,
dissonance, and related concepts. Journal of the Medical Library Association,
93(3):353–362.
Centerwall, S. and Centerwall, W. (2000). The discovery of phenylketonuria: the
story of a young couple, two retarded children, and a scientist. Pediatrics,
105:89–103.
Champion, V. (1999). Revised susceptibility, benefits, and barriers scale for mam-
mography screening. Research in Nursing & Health, 22:341–348.
Chiang, H.-H., Chao, Y.-M. Y., and Yuh, Y.-S. (2006). Informed choice of pregnant
women in prenatal screening tests for Down’s syndrome. Journal of Medical
Ethics, 32:273–277.
Chou, C.-H. and Bentler, P. (1995). Estimates and tests in structural equation
modeling. In Hoyle, R., editor, Structural equation modeling, pages 37–55. Sage
Publications, Thousand Oaks.
210
BIBLIOGRAPHY Stuart Nicholls
Ciske, D., Haavisto, A., Laxova, A., Zeng, L., Rock, M., and Farrell, P. (2001).
Genetic counseling and neonatal screening for cystic fibrosis: an assessment of
the communication process. Pediatrics, 107:699–705.
Clarke, A. (1991). Is non-directive counselling possible? The Lancet, 338:998–1001.
Clayton, E. (2005). Talking with parents before newborn screening. Journal of
Pediatrics, 147:S26–S29.
Coppinger, C. and Cavanagh, C. (2008). Data collection and performance analysis
report. Newborn blood spot screening in the UK 2006 - 07.
Coulter, A. and Fitzpatrick, R. (2000). The patient’s perspective regarding appro-
priate health care. In Albrecht, G., Fitzpatrick, R., and Scrimshaw, S., editors,
Handbook of social studies in health and medicine, pages 454–464. Sage Publi-
cations, London.
Creswell, J., Fetters, M., and Ivankova, N. (2004). Designing a mixed methods
study in primary care. Annals of Family Medicine, 2:7–12.
Creswell, J. and Plano Clark, V. (2007). Designing and conducting mixed methods
research. Sage publications, Thousand Oaks.
Curran, P., West, S., and Finch, J. (1996). The robustness of test statistics to non-
normality and specification error in confirmatory factor analysis. Psychological
Methods, 1(1):16–29.
Czaja, R. and Blair, J. (2005). Designing surveys. Pine Forge Press, Thousand
Oaks, 2nd edition.
d’Agincourt Canning, L. (2005). The effect of experiential knowledge on construc-
tion of risk perception in hereditary breast/ovarian cancer. Journal of Genetic
Counseling, 14(1):55–69.
Danermark, B., Ekstrom, M., Jakobsen, L., and Karlsson, J. (2002). Explaining
society. Critical realism in the social sciences. Routledge, London.
211
BIBLIOGRAPHY Stuart Nicholls
Dankert-Roelse, J., Knol, K., and ten Kate, L. (1990). Effects of neonatal screening
for cystic fibrosis on reproduction, attitudes toward reproductive behaviour and
genetic knowledge. Acta Universitatis Carolinae Medica, 36:99–101.
Davey, A., French, D., Dawkins, H., and O’Leary, P. (2005). New mothers’ aware-
ness of newborn screening, and their attitudes to the retention and use of samples
for research purposes. Genomics, Society and Policy, 1:41–51.
Davis, S., Diefenbach, M., Valdimarsdottir, H., Chen, T., Hall, S., and Thompson,
H. (2010). Pros and cons of prostate cancer screening: associations with screen-
ing knowledge and attitudes among urban African American men. Journal of
the National Medical Association, 102(3):174–182.
Davis, T., Humiston, S., Arnold, C., Bocchini Jr, J., Bass III, P., Kennen, E.,
Bocchini, A., Kyler, P., and Lloyd-Puryear, M. (2006). Recommendations for
effective newborn screening communication: results of focus groups with parents,
providers, and experts. Pediatrics, 117:S326–S340.
Dawson, A. (2009). The normative status of the requirement to gain an informed
consent in clinical trials: comprehension, obligations, and empirical evidence. In
Corrigan, O., McMillan, J., Liddell, K., Richards, M., and Weijer, C., editors,
The limits of consent. A socio-ethical approach to human subject research in
medicine, pages 99–113. Oxford University Press.
Dawson, A. and Spencer, S. (2005). Informing children and parents about research.
Archives of Disease in Childhood, 90:233–235.
Decruyenaere, M., Evers-Kiebooms, G., and van den Berge, H. (1993). Percep-
tion of predictive testing for Huntington’s disease by young women: preferring
uncertainty to certainty? Journal of Medical Genetics, 30:557–561.
del Carmen, M. and Joffe, S. (2005). Informed consent for medical treatment and
research: a review. The Oncologist, 10:636–641.
212
BIBLIOGRAPHY Stuart Nicholls
Detmar, S., Dijkstra, N., Nijsingh, N., Rijnders, M., Verweij, M., and Hosli, E.
(2008). Parental opinions about the expansion of the neonatal screening pro-
gramme. Community Genetics, 11:11–17.
Detmar, S., Hosli, E., Dijkstra, N., Nijsingh, N., Rijnders, M., and Verweij, M.
(2007). Information and informed consent for neonatal screening: opinions and
preferences of parents. Birth, 34:238–244.
Dhondt, J.-L. (2005). Implementation of informed consent for a cystic fibrosis
newborn screening program in France: low refusal rates for optional testing.
Journal of Pediatrics, 147:S106–S108.
Dillard, J., Shen, L., Tluczek, A., Modaff, P., and Farrell, P. (2007). The effect of
disruptions during counseling on recall of genetic risk information: The case of
cystic fibrosis. Journal of Genetic Counseling, 16:179–190.
Dixon-Woods, M., Ashcroft, R., Jackson, C., Tobin, M., Kivitts, J., Burton, P.,
and Samani, S. (2007). Beyond ‘misunderstanding’: Written information and
decisions about taking part in a genetic epidemiology study. Social Science &
Medicine, 65:2212–2222.
Douglas, D., Farquhar, J., Forfar, J., Fraser, M., Keay, A., McCrae, W., Miller,
R., Syme, J., Gilloran, J. L., Tait, H. P., Langton, M., Miller, R., Wilson, H. D.,
Riddell, G., Grant, M., Riddell, J., Howitt, L. F., McCoubrey, A., Campsie, J.,
Simpson, W. A., Wink, R. M., and Melville, F. (1968). Population screening by
Guthrie test for phenylketonuria in South-east Scotland. Report by the Consul-
tant Paediatricians and Medical Officers of Health of the S.E. Scotland hospital
region. British Medical Journal, 1:674–676.
Dudding, T., Wilcken, B., Burgess, B., Hambly, J., and Turner, G. (2000). Re-
productive decisions after neonatal screening identifies cystic fibrosis. Archives
of Disease in Childhood.Fetal and Neonatal Edition, 82:F124–F127.
213
BIBLIOGRAPHY Stuart Nicholls
Dugan, E., Trachtenberg, F., and Hall, M. (2005). Development of abbreviated
measures to assess patient trust in a physician, health insurer, and the medical
profession. BMC Health Services Research, 5(64):1–7.
Elwyn, G., Elwyn, B., and Miron-Shatz, T. (2009). Measuring ‘decision quality’:
Irresolvable difficulties and an alternative proposal. In Edwards, A. and Elwyn,
G., editors, Shared decision-making in health care, chapter Measuring ‘decision
quality’: Irresolvable difficulties and an alternative proposal, pages 143–149.
Oxford University Press, Oxford.
Etchegary, H., Potter, B., Howley, H., Cappelli, M., Coyle, D., Graham, I., Walker,
M., and Wilson, B. (2008). The influence of experiential knowledge on prenatal
screening and testing decisions. Genetic Testing, 12(1):115–124.
Everitt, B. and Dunn, G. (2001). Applied multivariate data analysis. Arnold,
London, 2nd edition.
Faden, R., Chwalow, A., Holtzman, N., and Horn, S. (1982). A survey to evaluate
parental consent as public policy for neonatal screening. American Journal of
Public Health, 72:1347–1352.
Fielding, N. and Lee, R. (1998). Computer analysis and qualitative research. Sage
publications, London.
Finney, S. and DiStefano, C. (2006). Non-normal and categorical data in struc-
tural equation modeling. In Hancock, G. and Mueller, R., editors, Structural
equation modeling: a second course, pages 269–314. Information Age Publishing,
Scottsdale.
Firth, M., Gardner-Medwin, D., Hosking, G., and Wilkinson, E. (1983). Interviews
with parents of boys suffering from Duchenne Muscular Dystrophy. Developmen-
tal Medicine and Child Neurology, 25:466–471.
Fowler Jr, F. (2001). Survey Research Methods. Sage publications, Thousand
Oaks, 3rd edition.
214
BIBLIOGRAPHY Stuart Nicholls
Fox, R. (2006). Informed choice in screening programmes: do leaflets help? A
critical literature review. Journal of Public Health, 28(4):309–317.
Gibbs, G. (2007). Analyzing qualitative data. Sage publications, London.
Gillon, R. (2001). Telling the truth, confidentiality, consent and respect for auton-
omy. In Harris, J., editor, Bioethics, pages 507–528. Oxford University Press,
Oxford.
Gray, J., Sorrentino, J., Matheson, G., Wise, P., and McCormick, M. (1997).
Failure to screen newborns for inborn disorders: a potential consequence for
changes in newborn care. Early Human Development, 48:279–285.
Green, J., Hewison, J., Bekker, H., Bryant, L., and Cuckle, H. (2004). Psychosocial
aspects of genetic screening of pregnant women and newborns: a systematic
review. Health Technology Assessment, 8:iii–124.
Green, J. and Statham, H. (1996). Psychosocial aspects of prenatal screening
and diagnosis. In Marteau, T. and Richards, M., editors, The troubled helix:
social and psychological implications of the new human genetics, pages 140–163.
Cambridge University Press, Cambridge.
Guthrie, B. (2008). Trust and asymmetry in general practitioner-patient relation-
ships in the united kingdom. In Brownlie, J., Greene, A., and Howson, A.,
editors, Researching trust in health, pages 133–151. Routledge, New York.
Hair, J., Anderson, R., Tatham, R., and Black, W. (1998). Multivariate data
analysis. Prentice Hall, New Jersey, 5th edition.
Hall, M., Camacho, F., Dugan, E., and Balkrishnan, R. (2002). Trust in the med-
ical profession: conceptual and measurement issues. Health Services Research,
37(5):1419–1439.
Hargreaves, K., Stewart, R., and Oliver, S. (2004). Pilot study of pre-screening
parent leaflet on newborn blood spot screening and health professional com-
215
BIBLIOGRAPHY Stuart Nicholls
munication guidelines. Technical report, UK Newborn Screening Programme
Centre, London.
Hargreaves, K., Stewart, R., and Oliver, S. (2005a). Informed choice and public
health screening for children: the case of blood spot screening. Health Expecta-
tions, 8:161–171.
Hargreaves, K., Stewart, R., and Oliver, S. (2005b). Newborn screening infor-
mation supports public health more than informed choice. Health Education
Journal, 64:110–119.
Heck, R. and Thomas, S. (2009). An introduction to multilevel modeling techniques.
Routledge, New York.
Henderson, M. (2009). Genetic mapping of babies by 2019 will
transform preventive medicine. Online dated 9th Feb 2009.
http://www.timesonline.co.uk/tol/news/uk/science/article5689052.ece Ac-
cessed 17/2/2009.
Hildes, E., Jacobs, H., Cameron, A., Seshia, S., Booth, F., Evans, J., Wroge-
mann, K., and Greenberg, C. (1993). Impact of genetic counselling after neona-
tal screening for Duchenne muscular dystrophy. Journal of Medical Genetics,
30:670–674.
Ho, R. (2006). Handbook of univariate and multivariate data analysis and inter-
pretation with SPSS. Chapman & Hall/CRC,Boca Raton.
Holland, W., Stewart, S., and Masseria, C. (2006). Policy brief. screening in
europe.
Holtzman, N., Faden, R., Chwalow, A., and Horn, S. (1983). Effect of informed
parental consent on mother’s knowledge of newborn screening. Pediatrics,
72:807–812.
216
BIBLIOGRAPHY Stuart Nicholls
Hox, J. and Bechger, T. (1998). An introduction to structural equation modeling.
Family Science Review, 11:354–373.
Hoyle, R. (1995). The structural equation modeling approach. Basic concepts and
fundamental issues. In Hoyle, R., editor, Structural equation modeling, pages
1–15. Sage publications, Thousand Oaks.
Hu, L., Bentler, P., and Kano, Y. (1992). Can test statistics in covariance structure
analysis be trusted? Psychological Bulletin, 112(2):351–362.
Hu, L.-T. and Bentler, P. (1999). Cutoff criteria for fit indexes in covariance struc-
ture analysis: conventional criteria versus new alternatives. Structural Equation
Modeling., 6(1):1–55.
Jaccard, J. and Wan, C. (1996). LISREL approaches to interaction effects in
multiple regression. Sage Publications, Thousand Oaks.
Jackson, D. (2003). Revisiting sample size and number of parameter estimates:
some support for the N:q hypothesis. Structural Equation Modeling., 10(1):128–
141.
Jaques, A., Collins, V., Pitt, J., and Halliday, J. (2008). Coverage of the Victo-
rian newborn screening programme in 2003: a retrospective population study.
Journal of Paediatrics and Child Health, 44:498–503.
Jepson, R., Clegg, A., Forbes, C., Lewis, R., Sowden, A., and Kleijnen, J. (2000).
The determinants of screening uptake and interventions for increasing uptake:
a systematic review. Health Technology Assessment, 4(14):i–121.
Jepson, R., Hewison, J., Thompson, A., and Weller, D. (2007). Patient perspectives
on information and choice in cancer screening: A qualitative study in the UK.
Social Science & Medicine, 65:890–899.
Joint Standing Sub-Committee on Screening in Medical Care (1981). Screening
for early detection of congenital hypothyroidism.
217
BIBLIOGRAPHY Stuart Nicholls
Jones, S. R. (1992). Was there a hawthorne effect? The American Journal of
Sociology, 98:451–468.
Kenner, C. and Moran, M. (2005). Newborn screening and genetic testing. Journal
of Midwifery & Women’s Health, 50:219–226.
Kim, K. (2005). The relation among fit indexes, power, and sample size in struc-
tural equation modeling. Structural Equation Modeling, 12(3):368–390.
Kline, R. (2005). Principles and practice of structural equation modeling. The
Guilford Press, New York, 2nd edition.
Koo, J., Arasaratnam, M., Liu, K., Redmond, D., S.J.Connor, Sung, J., and
Leong, R. (2010). Knowledge, perception and practices of colorectal can-
cer screening in an ethnically diverse population. Cancer Epidemiology, page
doi:10.1016/j.canep.2010.05.013.
Krantz, D., Baum, A., and Wideman, M. (1980). Assessment of preferences for
self-treatment and information in health care. Journal of Personality and Social
Psychology, 39(5):977–990.
Lang, C., Stark, A., Acharya, K., and Ross, L. (2009). Maternal knowledge and
attitudes about newborn screening for sickle cell disease and cystic fibrosis.
American Journal of Medical Genetics Part A, 149A:2424–2429.
Lawson, T. (1997). Economics and reality. Routledge, London.
Lawson, T. (1998). Economic science without experimentation. In Archer, M.,
Bhaskar, R., Collier, A., Lawson, T., and Norrie, A., editors, Critical realism.
Essential readings., pages 144–185. Routledge.
Lei, M. and Lomax, R. (2005). The effect of varying degrees of nonnormality in
structural equation modeling. Structural Equation Modeling, 12(1):1–27.
218
BIBLIOGRAPHY Stuart Nicholls
Levitt, M. (2003). Public consultation in bioethics. What’s the point of asking
the public when they have neither scientific nor ethical expertise? Health Care
Analysis, 11:15–25.
Lewis, S., Curnow, L., Ross, M., and Massie, J. (2006). Parental attitudes to the
identification of their infants as carriers of cystic fibrosis by newborn screening.
Journal of Paediatrics and Child Health, 42:533–537.
Liebl, B., Nennsteil-Ratzel, U., von Kries, R., Fingerhut, R., Olgemoller, B., Zapf,
A., and Roscher, A. (2002). Very high compliance in an expanded ms \ ms-
based newborn screening program despite written parental consent. Preventive
Medicine, 34:127–131.
Lippman, A. (1999). Embodied knowledge and making sense of prenatal diagnosis.
Journal of Genetic Counseling, 8(5):255–274.
Loeben, G., Marteau, T., and Wilfond, B. (1998). Mixed messages: presentation of
information in cystic fibrosis-screening pamphlets. American Journal of Human
Genetics, 63:1181–1189.
Loehlin, J. (1998). Latent variable models. An introduction to factor, path, and
structural analysis. Lawrence Erlbaum Associates, Mahwah, New Jersey, 3rd
edition.
MacCallum, R. (1995). Model specification. Procedures, strategies, and related
issues. In Hoyle, R., editor, Structural equation modeling., pages 16–36. Sage
Publications.
MacCallum, R., Browne, M., and Sugawara, H. (1996). Power analysis and deter-
mination of sample size for covariance structure modeling. Psychological Meth-
ods, 1(2):130–149.
Marsh, H., Hau, K.-T., and Wen, Z. (2004). In search of golden rules: comment
on hypothesis-testing to setting cutoff values for fit indexes and dangers in over-
219
BIBLIOGRAPHY Stuart Nicholls
generalizing Hu and Bentler’s (1999) findings. Structural Equation Modeling.,
11(3):320–341.
Marteau, T. and Anionwu, E. (1999). Evaluating carrier testing: objectives and
outcomes. In Marteau, T. and Richards, M., editors, The troubled helix: so-
cial and psychological implications of the new human genetics, pages 123–139.
Cambridge University Press, Cambridge.
Marteau, T., Dormandy, E., and Michie, S. (2001). A measure of informed choice.
Health Expectations, 4:99–108.
Mason, J. (1996). Qualitative researching. Sage publications, London.
Mays, N. and Pope, C. (2000). Assessing quality in qualitative research. British
Medical Journal, 320:50–52.
McColl, E., Jacoby, A., Thomas, L., Soutter, J., Bamford, C., Steen, N., Thomas,
R., Harvey, E., Garratt, A., and Bond, J. (2001). Design and use of question-
naires: a review of best practice applicable to health service staff and patients.
Health Technology Assessment, 5:i–256.
McCourt, C. (2006). Supporting choice and control? Communication and interac-
tion between midwives and women at the antenatal booking visit. Social Science
& Medicine, 62:1307–1318.
McCracken, G. (1988). The long interview. Sage publications, California.
McKenzie, P. (2002). Communication barriers and information-seeking counter-
strategies in accounts of practitioner-patient encounters. Library & Information
Science Research, 24:31–47.
McKnight, P., McKnight, K., Sidani, S., and Figueredo, A. (2007). Missing data.
A gentle introduction. The Guildford Press, New York.
Merelle, M., Huisman, J., Alderden-van der Vecht, A., Taat, F., Bezemer, D.,
Griffioen, R., Brinkhorst, G., and Dankert-Roelse, J. (2003). Early versus late
220
BIBLIOGRAPHY Stuart Nicholls
diagnosis: psychological impact on parents of children with cystic fibrosis. Pe-
diatrics, 111:346–350.
Metcalfe, A., Haydon, J., Bennett, C., and Farndon, P. (2008). Midwives’ views of
the importance of genetics and their confidence with genetic activities in clinical
practice: implications for the delivery of genetics education. Journal of Clinical
Nursing, 17(4):1–12.
Metz, M., Ranieri, E., Gerace, R., Priest, K., Luke, C., and Chan, A. (2003).
Newborn screening in South Australia: is it universal? Medical Journal of
Australia, 179:412–415.
Michie, S., Dormandy, E., and Marteau, T. (2003). Informed choice: understand-
ing knowledge in the context of screening uptake. Patient Education and Coun-
seling, 50:247–253.
Michie, S., Smith, D., and Marteau, T. (1999). Prenatal tests: How are women
deciding? Prenatal Diagnosis, 19:743–748.
Miles, M. and Huberman, A. (1994). Qualitative data analysis: an expanded
sourcebook, volume 2nd. Sage publications, California.
Miller, S. (1987). Monitoring and blunting: validation of a questionnaire to assess
styles of information seeking under threat. Journal of Personality and Social
Psychology, 52(2):345–353.
Mischler, E., Wilfond, B., Fost, N., Laxova, A., Reiser, C., Sauer, C., Makholm,
L., Shen, G., Feenan, L., McCarthy, C., and Farrell, P. (1998). Cystic fibro-
sis newborn screening: Impact on reproductive behavior and implications for
genetic counseling. Pediatrics, 102:44–52.
Mishler, E. (2003). Representing discourse: the rhetoric of transcription. In Field-
ing, N., editor, Interviewing, volume 3, pages 12–37. Sage publications, London,
London.
221
BIBLIOGRAPHY Stuart Nicholls
Moran, J., Quirk, K., Duff, A., and Brownlee, K. (2007). Newborn screening for
CF in a regional paediatric centre: The psychosocial effects of false-positive IRT
results on parents. Journal of Cystic Fibrosis, 6:250–254.
Moser, C. and Kalton, G. (1971). Survey methods in social investigation. Gower,
2nd edition.
Muchamore, I., Morphett, L., and Barlow-Stewart, K. (2006a). Community views
and perspectives of newborn screening.
Muchamore, I., Morphett, L., and Barlow-Stewart, K. (2006b). Exploring existing
and deliberated community perspectives of newborn screening: informing the
development of state and national policy standards in newborn screening and
the use of dried blood spots. Australia and New Zealand Health Policy, 3:1–9.
Munck, A., Duff, A., Southern, K., Castellani, C., and on behalf of the ECFS CF
Neonatal Working Group (2007). Survey of the information provided for parents
about newborn screening for CF in European programmes. Journal of Cystic
Fibrosis, 6(Supplement 1):S87.
Murphy, E., Dingwall, R., Greatbatch, D., Parker, S., and Watson, P. (1998).
Qualitative research methods in health technology assessment: a review of the
literature. Health Technology Assessment, 2:1–274.
Murray, A. and Clarke, A. (2002). The ethics of population screening. Current
paediatrics, 12:447–452.
Muthen, B. and Kaplan, D. (1985). A comparison of some methodologies for the
factor analysis of non-normal likert variables. British Journal of Mathematical
and Statistical Psychology, 38:171–189.
Muthen, L. and Muthen, B. (2010). Mplus: version 6.0.
Natowicz, M. and Zuckerman, S. (2009). On treatability: considerations of treat-
ment in context. Health Matrix, 19:187–197.
222
BIBLIOGRAPHY Stuart Nicholls
Nevitt, J. and Hancock, G. (2001). Performance of bootstrapping approaches
to model test statistics and parameter standard error estimation in structural
equation modeling. Structural Equation Modeling, 8(3):353–377.
Nicholls, S. (2010). Knowledge or understanding? Informed choice in the con-
text of newborn bloodspot screening. Public Health Ethics, 3(2):128–136. doi:
10.1093/phe/phq016.
Nijsingh, N. (2007). Informed consent and the expansion of newborn screening.
In Dawson, A. and Verweij, M., editors, Ethics, prevention and public health,
pages 198–212. Oxford University Press, Oxford.
O’Conner, A. (1995). Validation of a decisional conflict scale. Medical Decision
Making, 15(1):25–30.
Oppenheim, A. (1992). Questionnaire design, interviewing and attitude measure-
ment. Continuum, London.
Parsons, E., Clarke, A., Hood, K., Lycett, E., and Bradley, D. (2002). Newborn
screening for Duchenne muscular dystrophy: a psychosocial study. Archives of
Disease in Childhood.Fetal and Neonatal Edition, 86:91–95.
Parsons, E., Israel, J., Hood, K., and Bradley, D. (2006). Optional screening
for DMD: reasons given by mothers for opting in or out. British Journal of
Midwifery, 14:710–714.
Parsons, E., King, J., Israel, J., and Bradley, D. (2007). Mothers’ accounts of
screening newborn babies in Wales (UK). Midwifery, 23:59–65.
Parsons, E., Moore, C., Israel, J., Hood, K., Clarke, A., and Bradley, D. (2005).
Emphasizing parental choice on newborn screening. British Journal of Mid-
wifery, 13:165–168.
Patton, M. (1980). Qualiitative evaluation methods. Sage publications, Beverley
Hills.
223
BIBLIOGRAPHY Stuart Nicholls
Paul, D. (1997). Appendix 5: The history of newborn phenylketonuria screening in
the u.s. In Holtzman, N. and Watson, M., editors, Promoting safe and effective
genetic testing in the United States: final report of the Task Force on genetic
testing., pages 137–160. National Institutes of Health, Bethesda.
Pilnick, A. (2002). Genetics and society. An introduction. Oxford University Press,
Oxford.
Pilnick, A. (2008). ‘It’s something for you both to think about: choice and decision
making in nuchal translucency screening for Downs syndrome. Sociology of
Health & Illness, 30(4):511–530.
Pollitt, R. (2004). Compliance with science: consent or coercion in newborn screen-
ing. European Journal of Pediatrics, 163:757–758.
Porter, M. and Macintyre, S. (1984). What is, must be best: a research note on
conservative or deferential responses to antenatal care provision. Social Science
& Medicine, 19(11):1197–1200.
Potter, B., O’Reilly, N., Etchegary, H., Howley, H., Graham, I., Walker, M., Coyle,
D., Chorny, Y., Cappelli, M., Boland, I., and Wilson, B. (2008). Exploring
informed choice in the context of prenatal testing: findings from a qualitative
study. Health Expectations, 11(4):355–365.
Raffle, A. and Gray, M. (2007). Screening. Evidence and practice. Oxford Univer-
sity Press, Oxford.
Raykov, T. and Marcoulides, G. (2000). A first course in structural equation
modeling. Lawrence Erlbaum Associates, Mahwah, New Jersey.
Reyment, R. and Joreskog, K. (1993). Applied factor analysis in the natural sci-
ences. Cambridge University Press, Cambridge.
Richards, T. and Richards, L. (1998). Using computers in qualitative research,
pages 211–245. Sage publications, Thousand Oaks.
224
BIBLIOGRAPHY Stuart Nicholls
Rowe, R. and Calnan, M. (2006). Trust relations in health care - the new agenda.
European Journal of Public Health, 16:4–6.
Santalahti, P., Hemminki, E., Latikka, A.-M., and Ryynanen, M. (1998). Women’s
decision-making in prenatal screening. Social Science & Medicine, 46:1067–1076.
Sayer, A. (1992). Method in social science. A realist approach. Routledge, London,
2nd edition.
Sayer, A. (2000). Realism and social science. Sage publications, London.
Schermelleh-Engel, K., Moosbrugger, H., and Mller, H. (2003). Evaluating the fit
of structural equation models: tests of significance and descriptive goodness-of-
fit measures. Methods of Psychological Research Online, 8(2):23–74.
Scientific Sofware Development (2007). ATLAS/ti. Version 5.2. Berlin, 5.2 edition.
Senior, V., Marteau, T. M., and Peters, T. J. (1999). Will genetic testing for
predisposition for disease result in fatalism? A qualitative study of parents
responses to neonatal screening to familial hypercholesterolaemia. Social Science
& Medicine, 48:1857–1860.
Sharrard, M. and Pollitt, R. (2007). Metabolic screening in children: newborn
screening for metabolic diseases past, present and future. Pediatrics and Child
Health, 17:273–278.
Sieber, J. (1992). Planning ethically responsible research. Sage publications, New-
bury Park.
Simpson, N., Randall, R., Lenton, S., and Walker, S. (1997). Audit of neona-
tal screening programme for phenylketonuria and congenital hypothyroidism.
Archives of Disease in Childhood, 77:F228–F234.
Sitzia, J. and Wood, N. (1997). Patient satisfaction: a review of issues and con-
cepts. Social Science & Medicine, 45:1829–1843.
225
BIBLIOGRAPHY Stuart Nicholls
Sitzia, J. and Wood, N. (1998). Response rate in patient satisfaction research: an
analysis of 210 published studies. International Journal for Quality in Health
Care, 10:311–317.
Smith, D., Shaw, R., and Marteau, T. (1994). Informed consent to undergo serum
screening for Down’s syndrome: the gap between policy and practice. British
Medical Journal, 309:776.
Smith, R., Williams, D., Sibert, J., and Harper, P. (1990). Attitudes of mothers to
neonatal screening for Duchenne muscular dystrophy. British Medical Journal,
300:1112.
Solbjør, M. (2008). “you have to have trust in those pictures” A perspective on
women’s experiences of mammography screening. In Brownlie, J., Greene, A.,
and a Howson, editors, Researching trust in health, chapter ”You have to have
trust in those pictures” A perspective on women’s experiences of mammography
screening, pages 54–71. Routledge, New York.
Sorenson, J., Levy, H., Mangione, T., and Sepe, S. (1984). Parental response
to repeat testing of infants with ‘false-positive’ results in a newborn screening
program. Pediatrics, 73:183–187.
Spady, D., Saunders, L., and Bamforth, F. (1998). Who gets missed: coverage
in a provincial newborn screening program for metabolic disease. Pediatrics,
102:e21–e31.
SPSS Inc (2008). Spss for windows, rel. 17.
Statham, H., Green, J., and Snowden, C. (1993). Mothers’ consent to screening
newborn babies for disease. British Medical Journal, 306:858.
Stewart, R. and Oliver, S. (2003). What is known about communication with
parents about newborn bloodspot screening?
226
BIBLIOGRAPHY Stuart Nicholls
Strauss, A. (1996). Qualitative analysis for social scientists. Cambridge University
Press.
Streetly, A., Grant, C., Bickler, G., Eldridge, P., Bird, S., and Griffiths, W.
(1994). Variation in coverage by ethnic group of neonatal (Guthrie) screening
programme in South London. British Medical Journal, 309:372–374.
Suriadi, C., Jovanovska, M., and Quinlivian, J. (2004). Factors affecting moth-
ers’ knowledge of genetic screening. Australian and New Zealand Journal of
Obstetrics and Gynaecology, 44:30–34.
Sveger, T. and Thelin, T. (2000). A future for neonatal α1-antitrypsin screening?
Acta Paediatrica, 89:628–631.
Sveger, T., Thelin, T., and McNeil, T. (1999). Neonatal α1-antitrypsin screening:
parents’ views and reactions 20 years after the identification of the deficiency
state. Acta Paediatrica, 88:315–318.
Tabachnick, B. and Fidell, L. (2001). Using multivariate statistics. Allyn and
Bacon, Boston, 4th edition.
The Nuffield Council of Bioethics (2006). Genetic screening: a supplement to the
1993 report by the Nuffield Council on Bioethics.
Therrell, B., Johnson, A., and Williams, D. (2006). Status of newborn screening
programs in the United States. Pediatrics, 117:212–252.
Tluczek, A., Koscik, R., Farrell, P., and Rock, M. (2005). Psychosocial risk as-
sociated with newborn screening for cystic fibrosis: parents? experience while
awaiting the sweat-test appointment. Pediatrics, 115:1692–1703.
Tluczek, A., Koscik, R., Modaff, P., Pfeil, D., Rock, M., Farrell, P., Lifchez,
C., Freeman, M., Gershan, W., Zaleski, C., and Sullivan, B. (2006). Newborn
screening for cystic fibrosis: parents’ preferences regarding counseling at the
time of infants’ sweat test. Journal of Genetic Counseling, 15:277–291.
227
BIBLIOGRAPHY Stuart Nicholls
Tluczek, A., Mischler, E., Farrell, P., Fost, N., Peterson, N., Carey, P., Bruns,
W., and McCarthy, C. (1992). Parents’ knowledge of neonatal screening and
response to false-positive cystic fibrosis testing. Developmental and Behavioral
Pediatrics, 13:181–186.
Tluczek, A., Orland, K., Nick, S., and Brown, R. (2009). Newborn screening:
an appeal for improved parent education. Journal of Perinatal and Neonatal
Nursing, 23(4):326–334.
Tymstra, T. (1986). False positive results in screening tests: experiences of parents
of children screened for congenital hypothyroidism. Family Practice, 3:92–96.
UK National Screening Committee (2000). Second report of the UK national
screening committee.
UK Newborn Screening Programme Centre (2008a). Guidelines for newborn blood
spot sampling.
UK Newborn Screening Programme Centre (2008b). Standards and guidelines for
newborn blood spot screening.
Ullman, J. (2001). Structural equation modelling., pages 653–771. Allyn and Bacon,
Boston, 4th edition.
Valentine, G. (1999). Doing household research: interviewing couples together and
apart. Area, 31:67–74.
van den Berg, M., Timmermans, D., Knol, D., van Eijk, J., de Smit, D., van Vugt,
J., and van der Wal, G. (2008). Understanding pregnant women’s decision
making concerning prenatal screening. Health Psychology, 27:430–437.
van den Berg, M., Timmermans, D., ten Kate, L., van Guyt, J., and van der
Wal, G. (2006). Informed decision making in the context of prenatal screening.
Patient Education and Counseling, 63:110–117.
228
BIBLIOGRAPHY Stuart Nicholls
Warren, N., Carter, T., Humbert, J., and Rowley, P. (1982). Newborn screening
for hemoglobinopathies in New York state: experience of physicians and parents
of affected children. The Journal of Pediatrics, 100:373–377.
Weisberg, H., Krosnick, J., and Bowen, B. (1996). An introduction to survey
research, polling, and data analysis. Sage publications, Thousand Oaks, 3rd
edition.
West, S., Finch, J., and Curran, P. (1995). Structural equations models with
nonnormal variables. In Hoyle, R., editor, Structural equation modeling, pages
56–75. Sage Publications, Thousand Oaks.
Williams-Piehota, P., McCormack, L., Treiman, K., and Bann, C. (2008). Health
information styles among participants in a prostate cancer screening informed
decision-making intervention. Health Edducation Research, 23(3):440–453.
Wilson, J. and Jungner, G. (1968). Principles and practice of screening for disease.
WHO, Geneva.
Wilson, T. (1999). Information behaviour: an interdisciplinary perspective. Infor-
mation Processing & Management, 33(4):551–572.
Wynne, B. (1991). Knowledges in context. Science, technology & human values,
16(1):111–121.
Zeuner, D., Ades, A., Karnon, J., Brown, J., Dezateux, C., and Anionwu, E.
(1999). Antenatal and neonatal haemoglobinopathy screening in the UK: review
and economic analysis. Health Technology Assessment, 3:i–185.
229