Embed Size (px)
Citation preview
Impacts 08 Team Dr Beatriz García, Director Ruth Melville, Programme Manager Sonia McEwan, Programme Assistant Document Reference: Impacts 08 – ULMS (Oct 2008) Econ Impacts of the ECoC
Impacts 08 is a joint programme of the University of Liverpool and Liverpool John Moores University Commissioned by Liverpool City Council
Considering the Economic Impacts of the 2008 European Capital of Culture
A Review on the Literature Concerning
“Economic Multiplier” Effects
October 2008
Report by
Sarah Louisa Phythian-Adams, David Sapsford and Alan Southern (University of Liverpool Management School)
Impacts 08 - ULMS | Economic Impacts of the ECoC | October 2008
1 Impacts 08 - The Liverpool Model, European Capital of Culture Research Programme
www.impacts08.net
Executive summary1
Introduction: Study Aims This study has been developed to provide guidance for “multiplier analysis” with respect to the economic impacts assessment of Liverpool European Capital of Culture (ECoC) 2008. It was commissioned by Impacts 08 to underpin their work in partnership with Liverpool City Council, Culture Company, the Mersey Partnership and the Northwest Regional Development Agency to demonstrate the economic value and importance of Liverpool ECoC 2008 to the regional economy. Methodology It sets out recommendations for best practice in the use of economic multipliers, based on a review of 40 case study economic impact assessments and reports which are relevant to the arts, cultural and events sectors. Main Recommendations The assessment of the economic impact of Liverpool 2008 will require the development of bespoke multipliers, suitable for the impact of investment in cultural initiatives. The study therefore recommends: Development of an Input-Output model based on the review findings to provide statistically legitimate
estimates of multipliers which take into account the full impact of investments in cultural and related initiatives.
This model will be supported by range of data to be gathered from a variety of sources, including surveys
of institutions, consumers and from existing central sources of statistics. The economic impact assessment should take part alongside other measures of impact as part of a full
evaluation, in order to support valuation of “intangible benefits”. Main findings The impact of arts and cultural programming has increasingly gained focus over the last decade especially with respect to Government and Local Authority funding. A number of high profile reports by the Department of Culture, Media and Sport and the Department for Communities and Local Government have set out the rationale for impact studies as well as best practice for undertaking them. These do not however include guidelines for multiplier analysis. This review examines the approaches taken and the use of multipliers in a range of recent economic impact assessment studies. It looks first at the definitions of “economic multipliers” and the calculations and development of the models from which they are derived. It explores the difference between the two discernable measures for calculating appropriate multipliers: Quantification of direct and indirect effects (i.e. direct spending attributable to an event e.g. spending at
the event and indirect spending e.g. spending on supporting activities like childcare and travel). Induced activity, or second/higher order activity, which comes about as a result of the additional monies
injected into the (local) economy causing increased activity across other sectors. These effects ripple from the (local) core to the wider periphery in a kind of “virtuous circle” effect.
The report highlights the development of Input-Output based models for measuring the induced effects of spending on a program / project and the theoretical base from which it has grown (the “multiplier effect” theorised by Keynes and others). This is the basis for most contemporary Input-Output based approaches to the question in hand.
1 Prepared by A Gilmore, Northwest Culture Observatory.
Impacts 08 - ULMS | Economic Impacts of the ECoC | October 2008
2 Impacts 08 - The Liverpool Model, European Capital of Culture Research Programme
www.impacts08.net
The review considers 40 high profile or benchmark case studies which were selected for their relevance to use of economic multipliers. It concludes that a few – Myerscough (1988a), Allen & Shaw (2000 & 2002), Shellard (2004), Dunlop (2004) provided solid base for the development of an Input-Output model (and enumeration of multipliers) for the Liverpool 2008 European Capital of Culture program. It also outlines the methodological limitations concerning the development and application of Input-Output models as part of impact assessment. These limitations include the application of such models in exercises to evaluate intangible benefits, including those relating to underlying assumptions concerning the existence of spare capacity in the economy. Other points of note relate to the use of data to underpin the derivation of mulitpliers. First-order direct multipliers can be straightforwardly estimated from raw sourced data. However, these will not take account of the potentially significant second (and higher-order) effects induced within the wider (supra-local) economy. Accordingly, the report recommends the development of Input-Output model based on the methodology of a number of best-practice case studies identified in this review, with a view to providing statistically legitimate estimates of multipliers which take into account the full impact of investments in cultural and related initiatives. The data required for the calibration and estimation of such a model can be gathered from a variety of sources, including surveys of institutions, consumers and from existing central sources of statistics. Finally, the report concludes that this review should be undertaken alongside other measures of impact as part of a full evaluation. Applying multiplier modelling to Liverpool ECoC 2008 In applying the modelling technique of Input-Output analysis to derive a multiplier value for the 2008 European Capital of Culture there are effectively two choices – the first is to use current “off the shelf” modelling packages which can be set up to calculate the impact and the second is to develop a bespoke model. The former would be the most cost effective method, with several private consulting firms able to offer this service. The second, to develop a model would require more resources and would be best undertaken by a body which has experience in developing such models. In this respect, the developments of multiplier models of higher education institutions provides a similar recent model development on which the development of a Capital of Culture impact model could be developed. In either case the most likely difficulty in applying the technique to find a relevant “multiplier” value for the Capital of Culture is collecting the right kind of information. Relevant output information can be aggregated from regional statistics and input information concerning households estimated from aggregates of wages and profit to the household sector. However, the choice (and/or) calculation of technical and inter-dependence coefficients used in multiplying out the transactions tables is crucial. For this purpose, there are a number of coefficients that are currently produced by relevant central statistical authorities for both Region and Industry that should be looked at in detail, as the review of case studies has revealed. These are termed “centrally determined coefficients” – for example as used by SQW Ltd (2006). Conclusions and Recommendations As part of an in-depth analysis of the economic impacts of the Liverpool ECoC 2008 year, an application
of Input-Output analysis and the enumeration of relevant multipliers would provide a valuable intelligence. The use of existing “off the shelf” models/multipliers is not recommended as the results gained will vary
greatly with the input parameters, compounded by the fact that they are based on generic conditions.
Impacts 08 - ULMS | Economic Impacts of the ECoC | October 2008
3 Impacts 08 - The Liverpool Model, European Capital of Culture Research Programme
www.impacts08.net
The most preferable approach would be to undertake a calculation of an Input-Output analysis based on the best practice of studies which have been implemented in similar regions (most notably illustrated by the Myerscough, Shellard and UK Universities studies, as discussed in the case study section of the report).
The development of an Input-Output analysis needs to take account of the methodological limitations
identified to look to the best practice case studies to mitigate these limitations. In addition, the calculation of individual multipliers should be made explicit along with the theoretical
framework and assumptions. The sourcing of data used in the Input-Output analysis should also be considered carefully and any estimations and assumptions justified.
In summary, the enumeration of multipliers can add to the evaluation of impact, but should not be
considered in isolation: other methods of impact assessment that can take account of hidden value should be developed in companion to and in contrast to multiplier analysis.
Impacts 08 - ULMS | Economic Impacts of the ECoC | October 2008
4 Impacts 08 - The Liverpool Model, European Capital of Culture Research Programme
www.impacts08.net
Contents
Executive Summary ........................................................................................................................................... 1
1. Introduction .................................................................................................................................................... 5
1.1. Method of review ..................................................................................................................................... 5
1.2. Direct, Indirect and Induced Impacts ....................................................................................................... 5
1.3. A brief history of Input-Output Modelling and the Multiplier ..................................................................... 6
1.4. Multipliers in practice .............................................................................................................................. 7
2. Mathematical Modelling .................................................................................................................................. 8
2.1. The key issues of formulating a model .................................................................................................... 8
2.2. Basic Input-Output analysis – Classical versus neo-classical ................................................................. 9
2.3. Creating the basic open static model ...................................................................................................... 9
2.4. The transactions table ............................................................................................................................10
2.5. Technical Coefficients and Interdependence coefficients Tables ...........................................................10
2.6. Calculations and resultant outputs .........................................................................................................11
3. Extensions .....................................................................................................................................................12
3.1. The Regional Multiplier Model ................................................................................................................12
3.2. The application of multiplier modelling in real-world economics .............................................................12
3.3. A note on the diversity of economic impact studies ...............................................................................12
4. Studies of Arts & Cultural Economic Multipliers.............................................................................................13
4.1. Case study highlights .............................................................................................................................13
5. Issues and Limitations in the development of Input-Output Multiplier modelling ...........................................32
6. Applying multiplier modelling to 2008 ............................................................................................................33
7. Conclusions & Recommendations.................................................................................................................34
8. References ....................................................................................................................................................35
9. Appendices ...................................................................................................................................................39
9.1. Nine Sector Input-Output Table for the United Kingdom 1963 ...............................................................39
9.2. Summary of Events studied in UK Sport (2004) .....................................................................................40
Impacts 08 - ULMS | Economic Impacts of the ECoC | October 2008
5 Impacts 08 - The Liverpool Model, European Capital of Culture Research Programme
www.impacts08.net
1. Introduction
A Government in charge of public spending is subject to the same kind of decision making constraints and utility maximising incentives as other organisations operating in a complex market place, or indeed individuals. However, the gains a public body seeks to maximise are often the subject of acute political debate and consequence. Public spending may be required in the provision of “Public Goods”, those goods defined in economics that are of a public benefit that may not have otherwise been produced at a sufficient level, or for which positive externalities (benefits) may be conferred on the population as a whole which outweigh their costs. It may be done as a form of income re-distribution, or with the desire to act as a catalyst to a national economy, regional economy or even an economic sector. In respect of the later, the notion that such public spending can act as a catalyst in an economy or sector is based on the idea of the so-called “multiplier effect”. Government guidance on the appraisal and evaluation of capital projects underwent a comprehensive review and new (“Green Book”) guidance was issued in 2003 that emphasised the “3Rs” – Regeneration, Renewal and Regional Development (ODPM 2003). Within it, the need for longer term evaluation was recognised as well as external economic factors and modernisation of public spending processes - including the need for „[the] value of long-term benefit to be brought into the appraisal process‟. Since the DCMS (2004b) working paper „Culture at the heart of regeneration‟, the promotion of regeneration of arts & cultural projects and events has become a National Government Policy aim and subsequently a multi-regional policy aim. The subject of this review therefore, is the review of the development of enumerations of economic impact assessment via the enumeration of economic multipliers, rather than a review of the basis for denoting arts & cultural programming as a means of regeneration and economic development, which has been extensively covered in both policy debate and academic literature. To do this we first consider from where the concept of the economic multiplier was derived, via an overview of the history and initial development of Input-Output modelling and the measurement of multipliers; the development of regional analysis; followed by the use of this analysis for particular industry sector and finally applications made in the area of arts & cultural related regeneration.
1.1. Method of review
To review the development of input-output modelling and economic impact multiplier estimates, use of key academic literature in the field was used, in the first instance stemming from a review of the collection of papers printed in the comprehensive 50 years review of input-output analysis by Kurz et al (1998). To further identify literature concerning the use of input-output analysis and economic impact multipliers a search of key academic literature was undertaken as well as the use of the Arts Council of England, NorthWest Culture Observatory and Impact online databases which contained references to key studies undertaken in both the academic and private sector by consulting bodies under direction of local and national authorities. In so do doing it is hoped that this review can cover a wider base of literature and compare the methodologies used in studies across the academic and private sector.
1.2. Direct, Indirect and Induced Impacts
Since the creation of the DCMS in 1997, more emphasis has been placed on measuring the economic effects of the cultural and creative industries and this has been mainly achieved through direct “mapping” exercises – by dividing out statistics for businesses which fall within the classification of “creative” or “cultural industries” in measurable areas such as employment, sales and even gross value added (see for example Casey et al 1996; DCMS 1998).
Impacts 08 - ULMS | Economic Impacts of the ECoC | October 2008
6 Impacts 08 - The Liverpool Model, European Capital of Culture Research Programme
www.impacts08.net
However, these direct measures of output or key statistics do not take into account secondary or “induced” effects. Such effects may include, for example, the additional number of electricians required because of additional performances put on at a theatre or the amount of money generated in services revenue in restaurants and bars due to the audience. These additional effects can be quantified by measuring increases in levels of all activity after a certain event. They can even be apportioned to show, for example, the average cost-per-job from Public spending on the arts (total public subsidy to an organisation divided by employment) (see Myerscough 1988). However, it is difficult to extract out the effects due to the event itself and those attributable to other factors – as well as the impact lost because of displacement or “crowding out” activities. For example a person may have spent their money on other recreational activities in that region with or without the festival /event/ project. To then consider any higher order impacts (for example, to what extent those in the restaurant industry then increase their spending) compounds the above two problems. It is therefore apparent that any measure of impact of additional spending on an arts & cultural program, as in 2008 European Capital of Culture spending, a model is required which uses directly measurable variables and takes into account the secondary or induced impacts, while holding for displacement issues (See Seaman, (2003); Madden (2001) & Van Puffelen (1996) as well as allowing for the inclusion of higher order impacts. The use of input-output modelling and the calculation of a resulting multiplier can do just this. The use of input-output modelling and the resultant enumeration of a multiplier is referred to as “multiplier analysis” and “impact analysis” interchangeably. In effect, by mapping the economy (or the relevant industry or sector which will be expounded later), in an input-output matrix, cumulative changes in an economy can be measured as a result of changes in inputs.
1.3. A brief history of Input-Output Modelling and the Multiplier
The idea of a “multiplier effect” in economics was developed by Keynes as part of his „General theory of Employment, Interest and Money‟ (1936). However, the basis for this idea has been attributed to his student, Kahn (1931). The idea of the multiplier effect is most simply expressed in the form of a model of a closed economy (an economy which has not external inputs or outputs). When it is operating in an equilibrium, Keynes argued that exogenous increases in spending (i.e. an external input), particularly pointing to Public spending, will increase total spending by a multiple of the initial increase by stimulating a “virtuous circle” effect in the rest of the economy. The government outlays an initial amount on a Public project which may include the hiring of labour, the purchase of materials and supplies and all of the services required by the project. The money spent on the project is then recycled through the economy by the labour spending their wages, by the companies who have supplied the goods hiring new employment and spending more on their raw materials etc and then in turn, those wages spent and raw materials etc demanded. This means that a relatively small initial outlay can multiply up into a greater level of economic activity. This theory is premised upon the notion that an economy operates with a “circular flow”, where the “normal” (pre injected) levels of production can be mapped as a matrix of activities all adding to final demand. Wassily Leontief‟s paper on „Quantatative Input-Output relations in the economic system of the United States‟ in 1936 developed just such a tabulation of input and output from which the process of input-output modelling as we are more familiar with today developed and which allows for the complication of “open” economies. The idea of “circular flow” within an economy stretches further in antiquity to formative writings in the discipline of economics. In „Foundations of Input-Output analysis‟, Kurz et al (1998) suggest that it is „clearly discernable‟ in authors such as William Petty (1623-87) and Richard Cantillon (1697-1734). Moreover Francoise Quesnay published his „Tableau economique‟ in 1758 which specified production in an economy via a sophisticated two-
Impacts 08 - ULMS | Economic Impacts of the ECoC | October 2008
7 Impacts 08 - The Liverpool Model, European Capital of Culture Research Programme
www.impacts08.net
tier tabular expression and Leon Walras set out a general equilibrium system in 1954 which became the tabular basis for modern input-output modelling. Around the same time (early 1950‟s), scholars in the USA recognised the potential value of input-output modelling for regions and for industry sectors. Such models allow the study of inter-relationships between sub-sectors of industry or region. This has several benefits – mainly in allowing planners and local and national authorities to enable the development of policy and planning toward the right regional and industry infrastructure. Isard (1953) set out a regional model in the American Economic review (which he later developed into a reference text for regional analysis (1960)) and Leontief (1953) honed the technique for regional and industry structure approaches. Moore & Peterson (1955) developed an early inter-Industry model of Utah and Carter & Heady (1959) developed several input-output analysis models focusing on regional and commodity sectors of agriculture. Subsequently there have been some modifications and improvements to the Input-Output modelling approach (see particularly Miller & Blair (2005)), as well as being applied to almost all sectors of the economy, countries and regions. However, the basic principles remain.
1.4. Multipliers in practice
At this point it is important to note that the term “multiplier” is not fixed to the idea of Input-Output modelling. Indeed, the term “multiplier” has been used in several studies of the impacts of arts & cultural programming in the UK and has referred to different measures of its multiplying effect. For example, Johnson and Thomas‟ 1992 study of Museums and Tourism used a ratio of total effects (including direct and indirect) to direct activity for each organisation. The South West Museums Council in 2000 used a ratio of final to initial changes and DiNoto and Merk, (1993) quoted the multiplier as the ratio of number of jobs created to amount of initial expenditure. (See Johnson & Thomas 2001) The multiplier calculations proposed by the British Arts Festivals Association (Allen & Shaw (2000 & 2002) are based on those used by the United States Department of Commerce‟s Bureau of Economic Affairs and assess spending in the arts in three different categories - using three different multipliers. These three different multipliers have been widely accepted in the UK as the sector standard and are most often applied to studies of the economic impacts of festivals. The three multipliers used are:
1. Direct Expenditure by festival organisers 2. Ancillary Expenditure by festival attendees 3. Capital Expenditure in respect of the project or event
More generally multipliers are quoted as being of three types:
1. Type I – Include direct or initial spending on a project as well as indirect spending (i.e. business to business). These may also be known as first order multipliers;
2. Type II – As in type I plus “induced” effects (from i.e. increased household spending from wages earned). These higher order effects are calculated using Input-Output analysis;
3. Type III – include the direct, indirect and induced spending but are modified according to spending patterns and demographics.
Most commonly, multipliers are either quoted as being “direct” or are of a type II. Separate multipliers are also quoted for output, employment and income. The first order multipliers can be calculated from figures ascertained in terms of spending (direct and indirect) associated with the program/project, but in order to
Impacts 08 - ULMS | Economic Impacts of the ECoC | October 2008
8 Impacts 08 - The Liverpool Model, European Capital of Culture Research Programme
www.impacts08.net
calculate the induced effects (i.e. the ripple effect that induces spending in the rest of the economy via a virtuous circle effect) a model must be developed that takes account of second order (and subsequent higher order) spending.
2. Mathematical Modelling
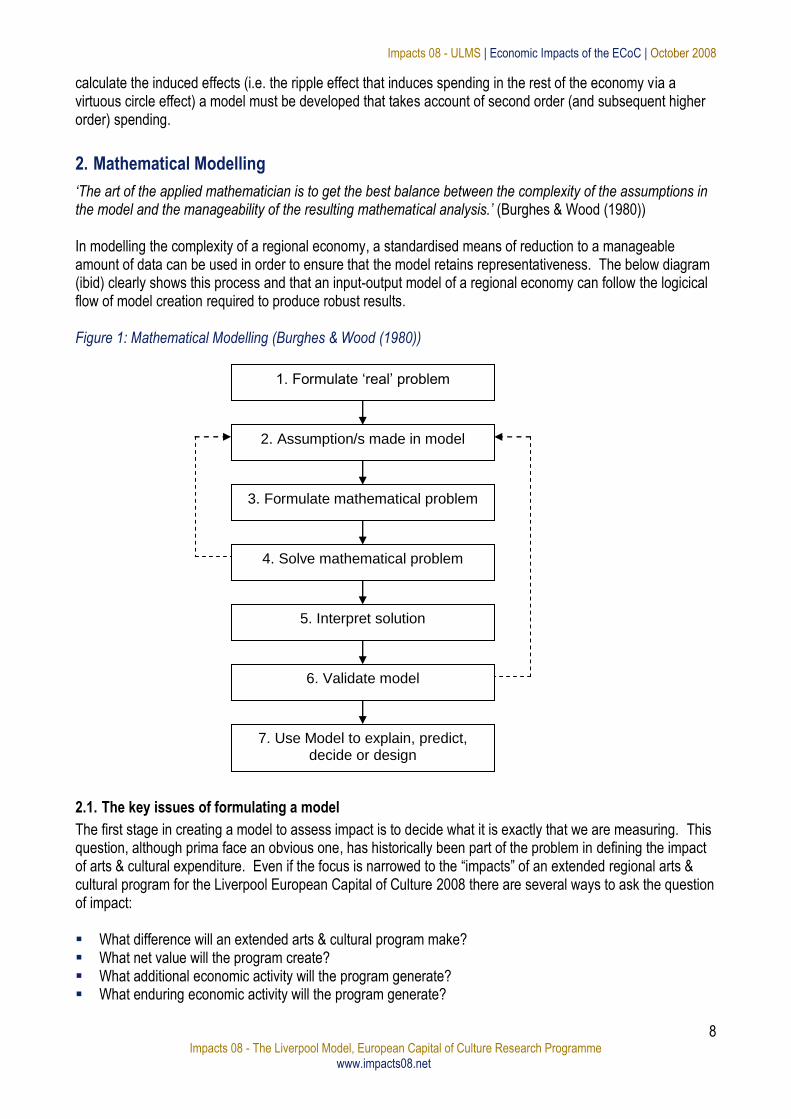
‘The art of the applied mathematician is to get the best balance between the complexity of the assumptions in the model and the manageability of the resulting mathematical analysis.’ (Burghes & Wood (1980)) In modelling the complexity of a regional economy, a standardised means of reduction to a manageable amount of data can be used in order to ensure that the model retains representativeness. The below diagram (ibid) clearly shows this process and that an input-output model of a regional economy can follow the logicical flow of model creation required to produce robust results. Figure 1: Mathematical Modelling (Burghes & Wood (1980))
2.1. The key issues of formulating a model
The first stage in creating a model to assess impact is to decide what it is exactly that we are measuring. This question, although prima face an obvious one, has historically been part of the problem in defining the impact of arts & cultural expenditure. Even if the focus is narrowed to the “impacts” of an extended regional arts & cultural program for the Liverpool European Capital of Culture 2008 there are several ways to ask the question of impact: What difference will an extended arts & cultural program make? What net value will the program create? What additional economic activity will the program generate? What enduring economic activity will the program generate?
1. Formulate ‘real’ problem
2. Assumption/s made in model
3. Formulate mathematical problem
4. Solve mathematical problem
5. Interpret solution
6. Validate model
7. Use Model to explain, predict, decide or design
Impacts 08 - ULMS | Economic Impacts of the ECoC | October 2008
9 Impacts 08 - The Liverpool Model, European Capital of Culture Research Programme
www.impacts08.net
This is by no means an exhaustive list in slanting the question of impact and indeed the implied question of time period – where substantial differences will be apparent between the impact felt during the year of the program and the increases that will be sustained post the initial investment and post the event period. In deciding on a focus, it may be beneficial to work from the same base as those studies which have provided the highest quality benchmark which have gone before. Various studies are outlined in this paper in the section on impact studies and this issue is discussed further there. Secondly and of equal importance is the way in which assumptions whether made explicitly or implied are handled within the model. The underlying assumptions within the model will affect the results gained and should be examined in the process of validating the model and hence the results gained. Evaluating the effects of specified assumptions may be clear, but there are many implied assumptions that may not readily be evaluated. For example, an implied assumption in evaluating a multiplier effect is that there is actually spare capacity within the economy with which to react to a direct spending impetus. Economists must often make assumptions such as this and generally about how an economy functions and adapts. There is often consensus regarding these and these schools of thought may historically become labelled for convenience, Classisists and neo-classists are two such schools.
2.2. Basic Input-Output analysis – Classical versus neo-classical
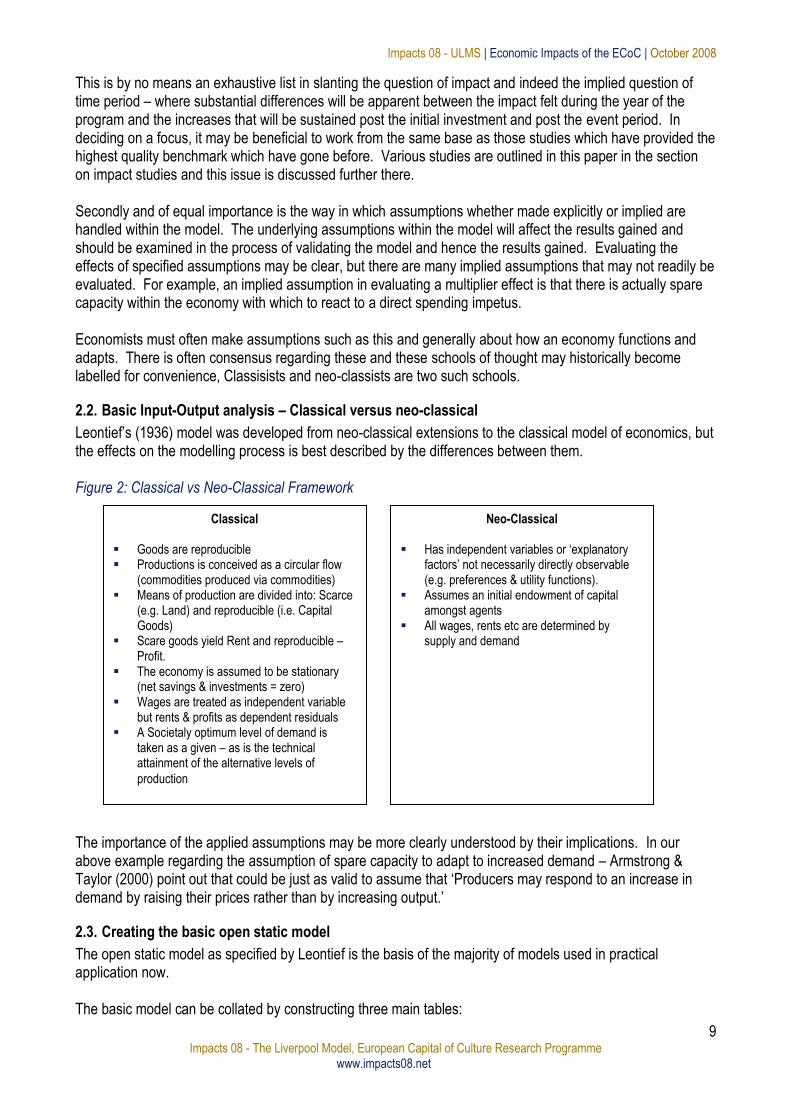
Leontief‟s (1936) model was developed from neo-classical extensions to the classical model of economics, but the effects on the modelling process is best described by the differences between them. Figure 2: Classical vs Neo-Classical Framework
The importance of the applied assumptions may be more clearly understood by their implications. In our above example regarding the assumption of spare capacity to adapt to increased demand – Armstrong & Taylor (2000) point out that could be just as valid to assume that „Producers may respond to an increase in demand by raising their prices rather than by increasing output.‟
2.3. Creating the basic open static model
The open static model as specified by Leontief is the basis of the majority of models used in practical application now. The basic model can be collated by constructing three main tables:
Classical Goods are reproducible Productions is conceived as a circular flow
(commodities produced via commodities) Means of production are divided into: Scarce
(e.g. Land) and reproducible (i.e. Capital Goods)
Scare goods yield Rent and reproducible – Profit.
The economy is assumed to be stationary (net savings & investments = zero)
Wages are treated as independent variable but rents & profits as dependent residuals
A Societaly optimum level of demand is taken as a given – as is the technical attainment of the alternative levels of
production
Neo-Classical Has independent variables or „explanatory
factors‟ not necessarily directly observable (e.g. preferences & utility functions).
Assumes an initial endowment of capital amongst agents
All wages, rents etc are determined by supply and demand
Impacts 08 - ULMS | Economic Impacts of the ECoC | October 2008
10 Impacts 08 - The Liverpool Model, European Capital of Culture Research Programme
www.impacts08.net
1. A transactions table. 2. A table of technical coefficients (sometimes called “direct requirements” tables) 3. A table of inter-dependence coefficients (sometimes called “total coefficients” or “total requirements”
tables). Each of these tables interact to create the Input-Output model from which multipliers can be enumerated.
2.4. The transactions table
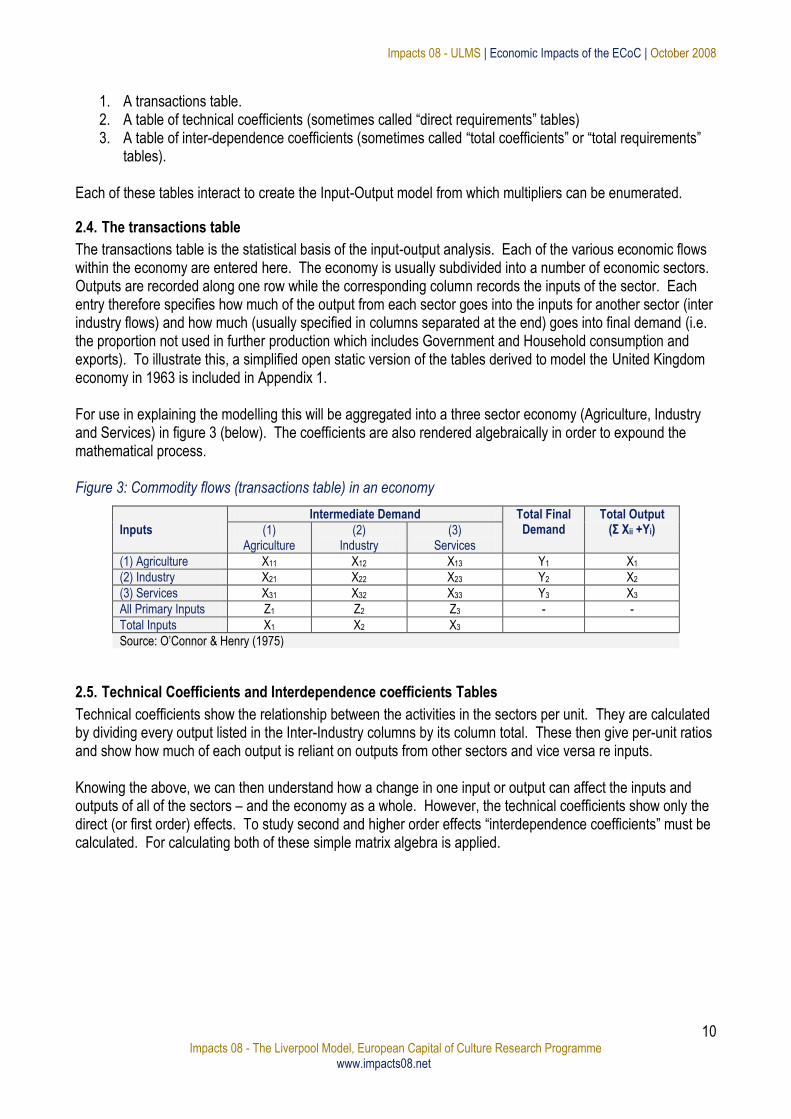
The transactions table is the statistical basis of the input-output analysis. Each of the various economic flows within the economy are entered here. The economy is usually subdivided into a number of economic sectors. Outputs are recorded along one row while the corresponding column records the inputs of the sector. Each entry therefore specifies how much of the output from each sector goes into the inputs for another sector (inter industry flows) and how much (usually specified in columns separated at the end) goes into final demand (i.e. the proportion not used in further production which includes Government and Household consumption and exports). To illustrate this, a simplified open static version of the tables derived to model the United Kingdom economy in 1963 is included in Appendix 1. For use in explaining the modelling this will be aggregated into a three sector economy (Agriculture, Industry and Services) in figure 3 (below). The coefficients are also rendered algebraically in order to expound the mathematical process. Figure 3: Commodity flows (transactions table) in an economy
Inputs
Intermediate Demand Total Final Demand
Total Output (Σ Xii +Yi) (1)
Agriculture (2)
Industry (3)
Services
(1) Agriculture X11 X12 X13 Y1 X1
(2) Industry X21 X22 X23 Y2 X2
(3) Services X31 X32 X33 Y3 X3
All Primary Inputs Z1 Z2 Z3 - -
Total Inputs X1 X2 X3
Source: O‟Connor & Henry (1975)
2.5. Technical Coefficients and Interdependence coefficients Tables
Technical coefficients show the relationship between the activities in the sectors per unit. They are calculated by dividing every output listed in the Inter-Industry columns by its column total. These then give per-unit ratios and show how much of each output is reliant on outputs from other sectors and vice versa re inputs. Knowing the above, we can then understand how a change in one input or output can affect the inputs and outputs of all of the sectors – and the economy as a whole. However, the technical coefficients show only the direct (or first order) effects. To study second and higher order effects “interdependence coefficients” must be calculated. For calculating both of these simple matrix algebra is applied.
Impacts 08 - ULMS | Economic Impacts of the ECoC | October 2008
11 Impacts 08 - The Liverpool Model, European Capital of Culture Research Programme
www.impacts08.net
Figure 4: Inter-Industry Technical Coefficients
Sector Intermediate Demand
(1) Agriculture (2) Industry (3) Services
(1) Agriculture a11 = x11 / x1 a12 = x12 / x2 a13 = x13 / x3
(2) Industry a21 = x21 / x1 a22 = x22 / x2 a23 = x23 / x3
(3) Services a31 = x31 / x1 a32 = x32 / x2 a33 = x33 / x3
Source: O‟Connor & Henry (1975)
The technical coefficients aii are calculated as in figure 4 above. The interdependence coefficients Yi are calculated using simple matrix algebra.
2.6. Calculations and resultant outputs
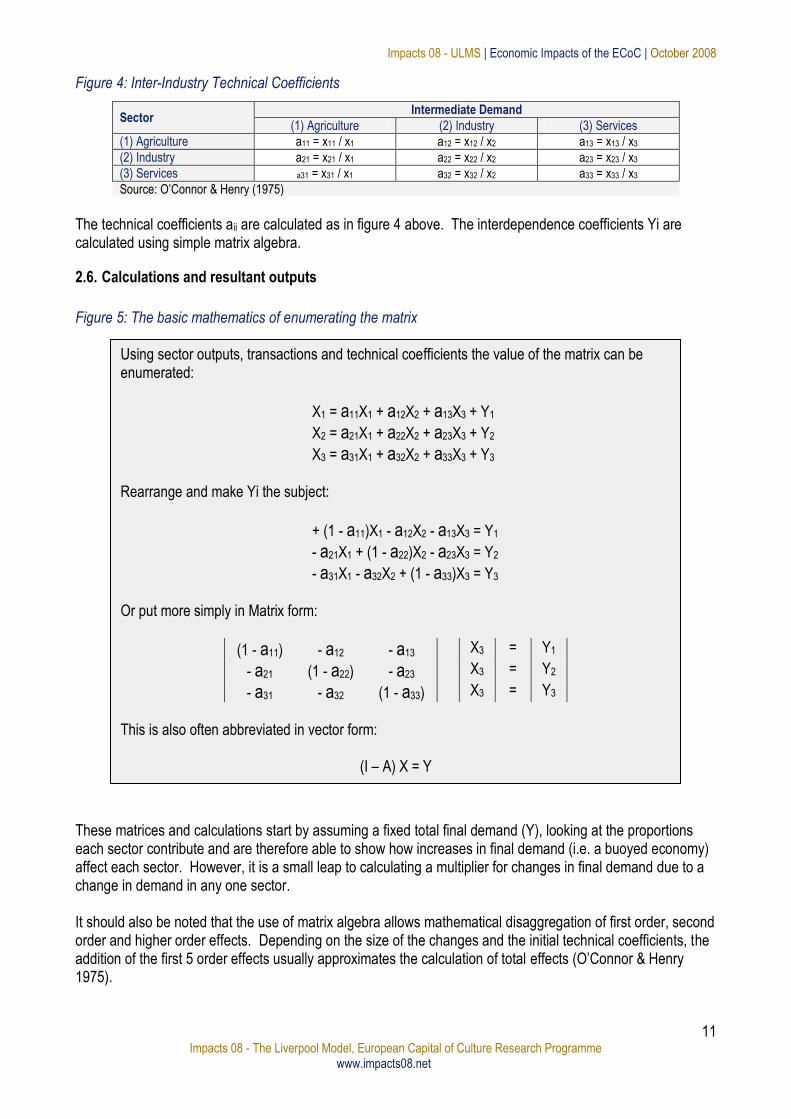
Figure 5: The basic mathematics of enumerating the matrix
These matrices and calculations start by assuming a fixed total final demand (Y), looking at the proportions each sector contribute and are therefore able to show how increases in final demand (i.e. a buoyed economy) affect each sector. However, it is a small leap to calculating a multiplier for changes in final demand due to a change in demand in any one sector. It should also be noted that the use of matrix algebra allows mathematical disaggregation of first order, second order and higher order effects. Depending on the size of the changes and the initial technical coefficients, the addition of the first 5 order effects usually approximates the calculation of total effects (O‟Connor & Henry 1975).
Using sector outputs, transactions and technical coefficients the value of the matrix can be enumerated:
X1 = a11X1 + a12X2 + a13X3 + Y1
X2 = a21X1 + a22X2 + a23X3 + Y2
X3 = a31X1 + a32X2 + a33X3 + Y3
Rearrange and make Yi the subject:
+ (1 - a11)X1 - a12X2 - a13X3 = Y1
- a21X1 + (1 - a22)X2 - a23X3 = Y2
- a31X1 - a32X2 + (1 - a33)X3 = Y3
Or put more simply in Matrix form:
(1 - a11) - a12 - a13 X3 = Y1
- a21 (1 - a22) - a23 X3 = Y2
- a31 - a32 (1 - a33) X3 = Y3
This is also often abbreviated in vector form:
(I – A) X = Y
Impacts 08 - ULMS | Economic Impacts of the ECoC | October 2008
12 Impacts 08 - The Liverpool Model, European Capital of Culture Research Programme
www.impacts08.net
The inter-sector multipliers are sometimes referred to as “partial multipliers” – as they express the proportion of final demand attributed to each sector (or sub-sector). They should not be confused with complete multipliers – these are the multipliers that are quoted as economic impact indicators and are a ratio of total activity in an economy resulting from a unit of direct spend i.e. for every £1 injection, £x of activity will arise. By the addition of a “household” sector, even the simplified model used in our explanation can calculate these. This addition means, crucially, rather than treating household income as a leakage from the economic system, it is treated as a potential generator of further economic activity (i.e. from spending). In terms of the outputs (i.e. what proportion of the outputs is consumed by the household sector) demand information can be derived, however, in terms of the inputs (what goes into the household sector to produce spending) – these must be derived from the aggregation of wages & salaries and other household incomes and profits. See appendix 9.1 for an full sector transactions table. An understanding of the basic model is important in understanding the contemporary use of input-output models, where the basic model is extended to allow for the complexity of modern economies, including for example an allowance for in-flows and out-flows (imports and exports) to the model and a greater disaggregation of sectors and their intra-sector partial multipliers.
3. Extensions
3.1. The Regional Multiplier Model
Where adequate regional data exists, models of regional economic performance can be created in exactly the same way. The main difference in the way in which the tables are constructed are to treat purchases from other regions as regional imports and sales to other regions as regional exports. Similarly, the construction of models for specified industry can be constructed by disaggregating the sector into a number of sub-sectors and deriving cost structures for each of these. In the tabulations, each sector becomes a row and column of its own interacting with the other sub sectors. The main difference is the inclusion (usually to the right hand side of the table) of an “Inter-Industry” quadrant, where inputs and outputs to closely connected industries are specified but in a more aggregated form. Industries not closely connected can be aggregated into a single column and row “other industries” entry (see O‟Connor & Henry (1975)).
3.2. The application of multiplier modelling in real-world economics
The use of Input-Output modelling and resultant enumeration of a multiplier has increased rapidly since its inception in the 1930‟s. The use of the technique using national and regional statistics for mapping full economies and the effects of specific industry sectors or events has meant that the technique has become part of a key repertoire of evaluation tools. As such several academic institutions and private sector bodies have developed Input-Output models with multiplier calculation for use in various sectors as well as the development of off-the-shelf programs such as Implan (IMPact analysis for PLANning), a well developed and used tool in the USA (www.implan.com) or LM3 [3rd order Local Multiplier] – a tool developed for Regional use in the UK (www.neweconomics.org). In the rest of this review, a number of studies evaluating economic impact through the use of Input-Output analysis and/or enumeration of a multiplier are considered.
3.3. A note on the diversity of economic impact studies
Before individual impact studies are considered, it is worth mentioning that the following studies highlighted are those who have included a focus on an enumerated economic impact multiplier. There has however been a plethora of studies which have looked at economic and social impacts of arts & culture, including arts & cultural led regeneration that have used other economic indicators. Some important papers which have considered socio-economic benefits are Landry et al (1996) „The art of regeneration: urban renewal through
Impacts 08 - ULMS | Economic Impacts of the ECoC | October 2008
13 Impacts 08 - The Liverpool Model, European Capital of Culture Research Programme
www.impacts08.net
cultural activity‟ which provided socio-economic regeneration statistics from case studies from 15 cities with culturally led regeneration programs. Some other broad studies are McManus (2002), Moriarty and McManus (2003) and Shaw (2003). The Office for Economic Co-operation and Development (OECD) has also identified a form of economic and social impact which would not be measured by the creation of input-output models and enumeration of an economic impact multiplier. They identify Social Capital or „networks, together with shared norms, values and understandings that facilitate co-operation within or among groups‟ (Cote & Healy (2001)). Gould (2001) also defines “social capital” as „a community‟s human wealth – the sum total of its skills, knowledge and partnerships‟ and „a powerful motor for sustainable development‟. Culture „builds and holds the human resources of communities‟; cultural activity can also „drive transformation: it educates, generates skills and confidence, connects people and cements new partnerships. Gould (2001) also talks about changes to economic capital brought about by arts & cultural programming in the form of “cultural capital”, which is about the relationship between culture and social capital. Cultural capital includes local cultural resources but is also about how cultural activity can encourage local people to participate in their community. Such capital formation may be difficult to measure by enumerating an economic multiplier in terms of immediate term effects and separating out and correctly attributing out longer term effects.
4. Studies of Arts & Cultural Economic Multipliers
It is hoped that the following summaries of economic impact multipliers for arts & Cultural programs and events will provide a comprehensive review of both academic and private sector studies. The studies have been summarised to highlight pertinent information concerning the data used, the purpose and focus of the reports as well as key findings concerning economic impact and multipliers. The studies have been divided into three sections: Studies of impacts of arts & cultural programming in general Studies of arts & cultural institutions Studies of events The studies have been presented in a tabulated form in order to distil some of the information more pertinent to the development of economic multipliers. They therefore present only extracts of the findings and commentary is related to the suitability of purpose with respect to the development of economic multipliers. Several meta-reviews have been consulted in the first instance and wherever possible findings from these further summarised in the following tables. Particular reference has been made of the following excellent overviews: Johnson & Thomas (1992) & (2001) and The Arts Council England (2004).
4.1. Case study highlights
Over 40 case studies are included in the tabulations below and many more were considered and rejected for the review (which is focusing on the enumeration of multipliers). In collating the tables, several of the studies stood out as a basis for emulation in terms of creating an Input-Output model for the Liverpool 2008 European Capital of Culture Program. A few should be noted as of particular relevance and importance either for their transparency, attention to collection and collation of data or analytical methods – Myserscough (1988a & 1991), Allen & Shaw (2000 & 2002), Shellard (2004), Dunlop (2004) are a few of note and any subsequent development of an Input-Output model should regard the relevant methodology used in these studies. However, the limitations highlighted within this review and the studies themselves should be considered in the creation of any new model and wherever possible methodological improvements sought.
Impacts 08 - ULMS | Economic Impacts of the ECoC | October 2008
14 Impacts 08 - The Liverpool Model, European Capital of Culture Research Programme
www.impacts08.net
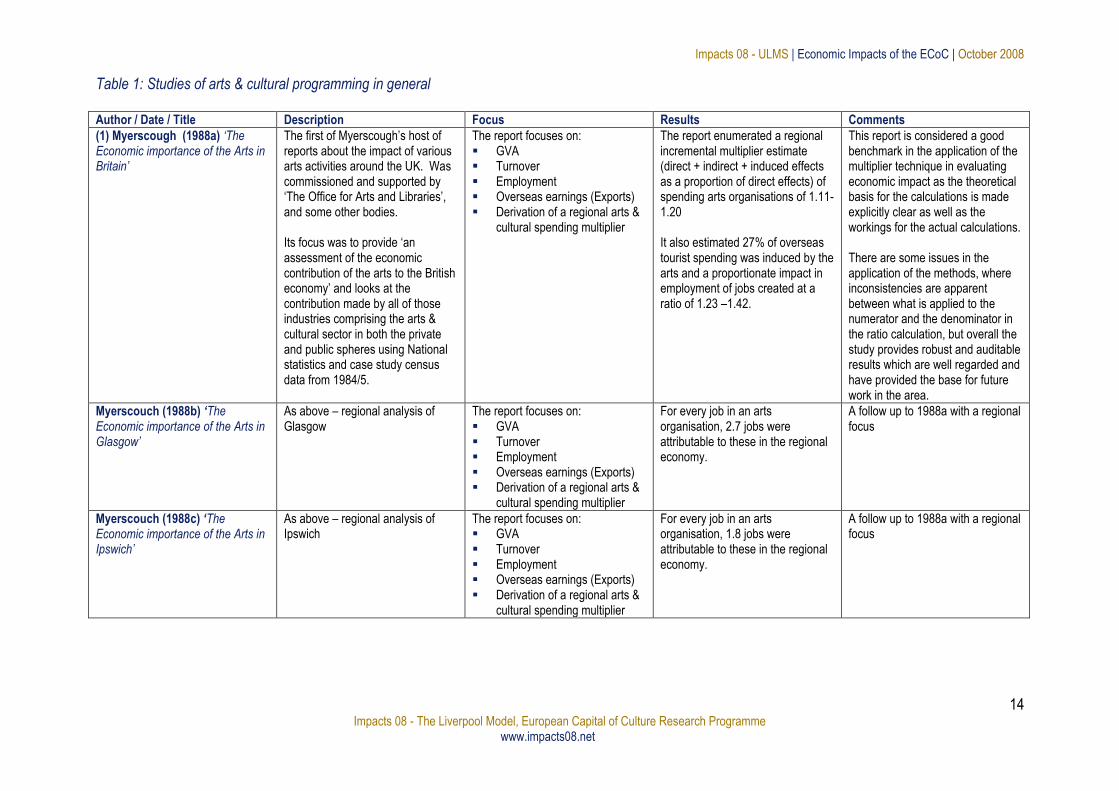
Table 1: Studies of arts & cultural programming in general Author / Date / Title Description Focus Results Comments
(1) Myerscough (1988a) ‘The Economic importance of the Arts in Britain’
The first of Myerscough‟s host of reports about the impact of various arts activities around the UK. Was commissioned and supported by „The Office for Arts and Libraries‟, and some other bodies. Its focus was to provide „an assessment of the economic contribution of the arts to the British economy‟ and looks at the contribution made by all of those industries comprising the arts & cultural sector in both the private and public spheres using National statistics and case study census data from 1984/5.
The report focuses on: GVA Turnover Employment Overseas earnings (Exports) Derivation of a regional arts &
cultural spending multiplier
The report enumerated a regional incremental multiplier estimate (direct + indirect + induced effects as a proportion of direct effects) of spending arts organisations of 1.11- 1.20 It also estimated 27% of overseas tourist spending was induced by the arts and a proportionate impact in employment of jobs created at a ratio of 1.23 –1.42.
This report is considered a good benchmark in the application of the multiplier technique in evaluating economic impact as the theoretical basis for the calculations is made explicitly clear as well as the workings for the actual calculations. There are some issues in the application of the methods, where inconsistencies are apparent between what is applied to the numerator and the denominator in the ratio calculation, but overall the study provides robust and auditable results which are well regarded and have provided the base for future work in the area.
Myerscouch (1988b) ‘The Economic importance of the Arts in Glasgow’
As above – regional analysis of Glasgow
The report focuses on: GVA Turnover Employment Overseas earnings (Exports) Derivation of a regional arts &
cultural spending multiplier
For every job in an arts organisation, 2.7 jobs were attributable to these in the regional economy.
A follow up to 1988a with a regional focus
Myerscouch (1988c) ‘The Economic importance of the Arts in Ipswich’
As above – regional analysis of Ipswich
The report focuses on: GVA Turnover Employment Overseas earnings (Exports) Derivation of a regional arts &
cultural spending multiplier
For every job in an arts organisation, 1.8 jobs were attributable to these in the regional economy.
A follow up to 1988a with a regional focus
Impacts 08 - ULMS | Economic Impacts of the ECoC | October 2008
15 Impacts 08 - The Liverpool Model, European Capital of Culture Research Programme
www.impacts08.net
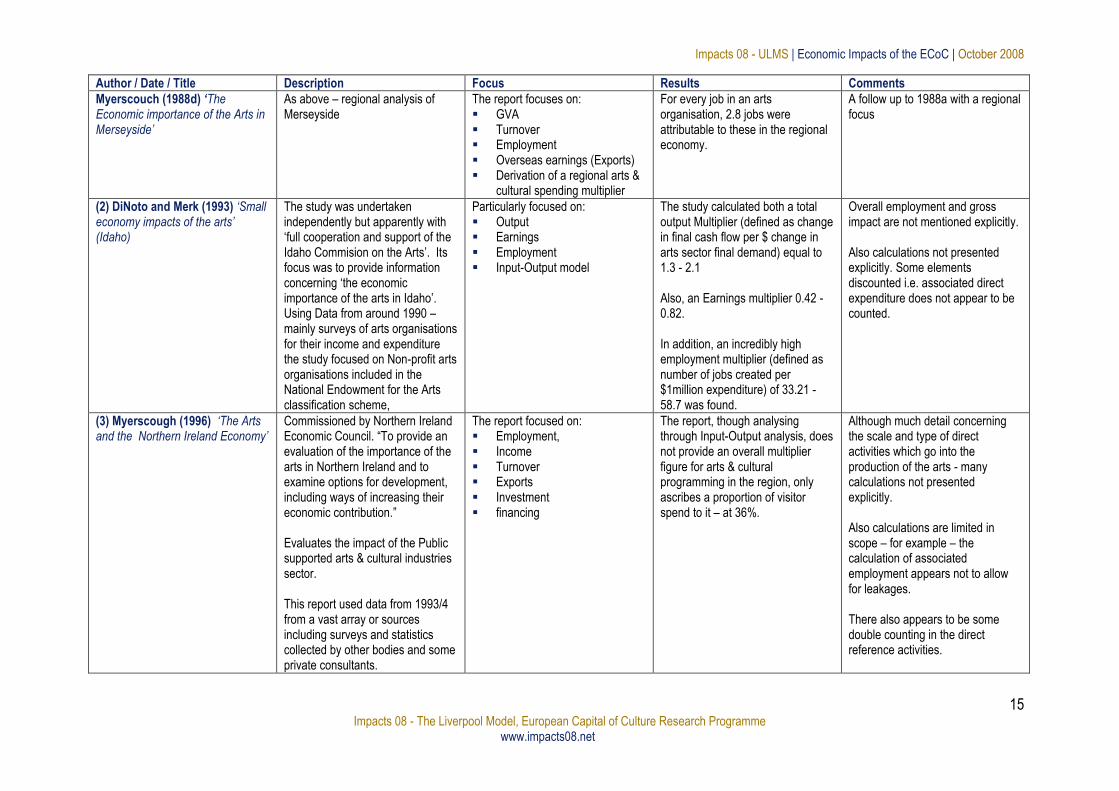
Author / Date / Title Description Focus Results Comments
Myerscouch (1988d) ‘The Economic importance of the Arts in Merseyside’
As above – regional analysis of Merseyside
The report focuses on: GVA Turnover Employment Overseas earnings (Exports) Derivation of a regional arts &
cultural spending multiplier
For every job in an arts organisation, 2.8 jobs were attributable to these in the regional economy.
A follow up to 1988a with a regional focus
(2) DiNoto and Merk (1993) ‘Small economy impacts of the arts’ (Idaho)
The study was undertaken independently but apparently with „full cooperation and support of the Idaho Commision on the Arts‟. Its focus was to provide information concerning „the economic importance of the arts in Idaho‟. Using Data from around 1990 – mainly surveys of arts organisations for their income and expenditure the study focused on Non-profit arts organisations included in the National Endowment for the Arts classification scheme,
Particularly focused on: Output Earnings Employment Input-Output model
The study calculated both a total output Multiplier (defined as change in final cash flow per $ change in arts sector final demand) equal to 1.3 - 2.1 Also, an Earnings multiplier 0.42 - 0.82. In addition, an incredibly high employment multiplier (defined as number of jobs created per $1million expenditure) of 33.21 - 58.7 was found.
Overall employment and gross impact are not mentioned explicitly. Also calculations not presented explicitly. Some elements discounted i.e. associated direct expenditure does not appear to be counted.
(3) Myerscough (1996) ‘The Arts and the Northern Ireland Economy’
Commissioned by Northern Ireland Economic Council. “To provide an evaluation of the importance of the arts in Northern Ireland and to examine options for development, including ways of increasing their economic contribution.” Evaluates the impact of the Public supported arts & cultural industries sector. This report used data from 1993/4 from a vast array or sources including surveys and statistics collected by other bodies and some private consultants.
The report focused on: Employment, Income Turnover Exports Investment financing
The report, though analysing through Input-Output analysis, does not provide an overall multiplier figure for arts & cultural programming in the region, only ascribes a proportion of visitor spend to it – at 36%.
Although much detail concerning the scale and type of direct activities which go into the production of the arts - many calculations not presented explicitly. Also calculations are limited in scope – for example – the calculation of associated employment appears not to allow for leakages. There also appears to be some double counting in the direct reference activities.
Impacts 08 - ULMS | Economic Impacts of the ECoC | October 2008
16 Impacts 08 - The Liverpool Model, European Capital of Culture Research Programme
www.impacts08.net
Author / Date / Title Description Focus Results Comments
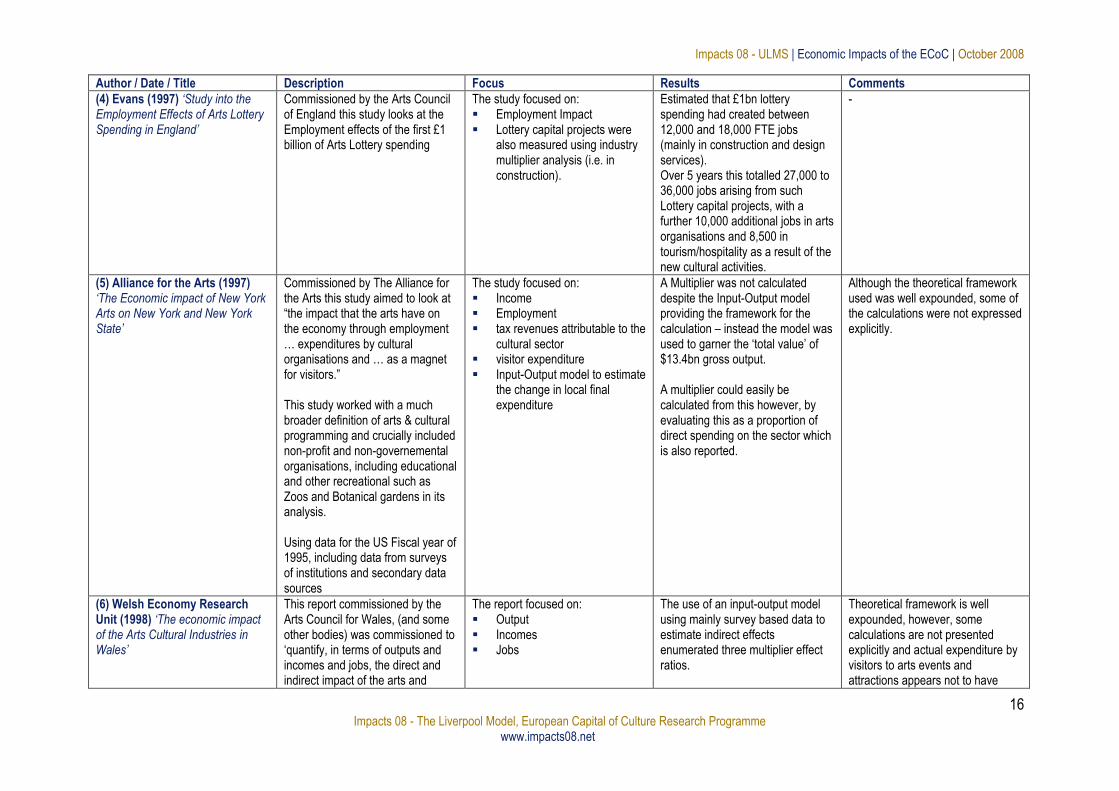
(4) Evans (1997) ‘Study into the Employment Effects of Arts Lottery Spending in England’
Commissioned by the Arts Council of England this study looks at the Employment effects of the first £1 billion of Arts Lottery spending
The study focused on: Employment Impact Lottery capital projects were
also measured using industry multiplier analysis (i.e. in construction).
Estimated that £1bn lottery spending had created between 12,000 and 18,000 FTE jobs (mainly in construction and design services). Over 5 years this totalled 27,000 to 36,000 jobs arising from such Lottery capital projects, with a further 10,000 additional jobs in arts organisations and 8,500 in tourism/hospitality as a result of the new cultural activities.
-
(5) Alliance for the Arts (1997) ‘The Economic impact of New York Arts on New York and New York State’
Commissioned by The Alliance for the Arts this study aimed to look at “the impact that the arts have on the economy through employment … expenditures by cultural organisations and … as a magnet for visitors.” This study worked with a much broader definition of arts & cultural programming and crucially included non-profit and non-governemental organisations, including educational and other recreational such as Zoos and Botanical gardens in its analysis. Using data for the US Fiscal year of 1995, including data from surveys of institutions and secondary data sources
The study focused on: Income Employment tax revenues attributable to the
cultural sector visitor expenditure Input-Output model to estimate
the change in local final expenditure
A Multiplier was not calculated despite the Input-Output model providing the framework for the calculation – instead the model was used to garner the „total value‟ of $13.4bn gross output. A multiplier could easily be calculated from this however, by evaluating this as a proportion of direct spending on the sector which is also reported.
Although the theoretical framework used was well expounded, some of the calculations were not expressed explicitly.
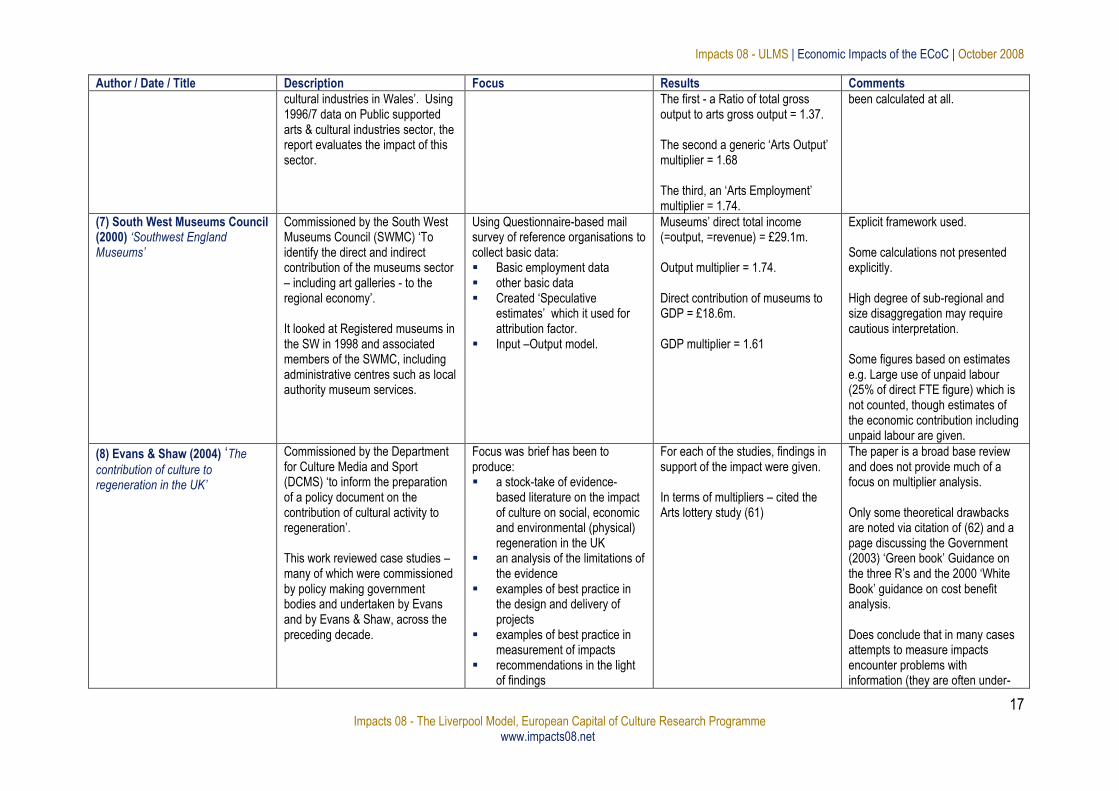
(6) Welsh Economy Research Unit (1998) ‘The economic impact of the Arts Cultural Industries in Wales’
This report commissioned by the Arts Council for Wales, (and some other bodies) was commissioned to „quantify, in terms of outputs and incomes and jobs, the direct and indirect impact of the arts and
The report focused on: Output Incomes Jobs
The use of an input-output model using mainly survey based data to estimate indirect effects enumerated three multiplier effect ratios.
Theoretical framework is well expounded, however, some calculations are not presented explicitly and actual expenditure by visitors to arts events and attractions appears not to have
Impacts 08 - ULMS | Economic Impacts of the ECoC | October 2008
17 Impacts 08 - The Liverpool Model, European Capital of Culture Research Programme
www.impacts08.net
Author / Date / Title Description Focus Results Comments
cultural industries in Wales‟. Using 1996/7 data on Public supported arts & cultural industries sector, the report evaluates the impact of this sector.
The first - a Ratio of total gross output to arts gross output = 1.37. The second a generic „Arts Output‟ multiplier = 1.68 The third, an „Arts Employment‟ multiplier = 1.74.
been calculated at all.
(7) South West Museums Council (2000) ‘Southwest England Museums’
Commissioned by the South West Museums Council (SWMC) „To identify the direct and indirect contribution of the museums sector – including art galleries - to the regional economy‟. It looked at Registered museums in the SW in 1998 and associated members of the SWMC, including administrative centres such as local authority museum services.
Using Questionnaire-based mail survey of reference organisations to collect basic data: Basic employment data other basic data Created „Speculative
estimates‟ which it used for attribution factor.
Input –Output model.
Museums‟ direct total income (=output, =revenue) = £29.1m. Output multiplier = 1.74. Direct contribution of museums to GDP = £18.6m. GDP multiplier = 1.61
Explicit framework used. Some calculations not presented explicitly. High degree of sub-regional and size disaggregation may require cautious interpretation. Some figures based on estimates e.g. Large use of unpaid labour (25% of direct FTE figure) which is not counted, though estimates of the economic contribution including unpaid labour are given.
(8) Evans & Shaw (2004) „The
contribution of culture to regeneration in the UK’
Commissioned by the Department for Culture Media and Sport (DCMS) „to inform the preparation of a policy document on the contribution of cultural activity to regeneration‟. This work reviewed case studies – many of which were commissioned by policy making government bodies and undertaken by Evans and by Evans & Shaw, across the preceding decade.
Focus was brief has been to produce: a stock-take of evidence-
based literature on the impact of culture on social, economic and environmental (physical) regeneration in the UK
an analysis of the limitations of the evidence
examples of best practice in the design and delivery of projects
examples of best practice in measurement of impacts
recommendations in the light of findings
For each of the studies, findings in support of the impact were given. In terms of multipliers – cited the Arts lottery study (61)
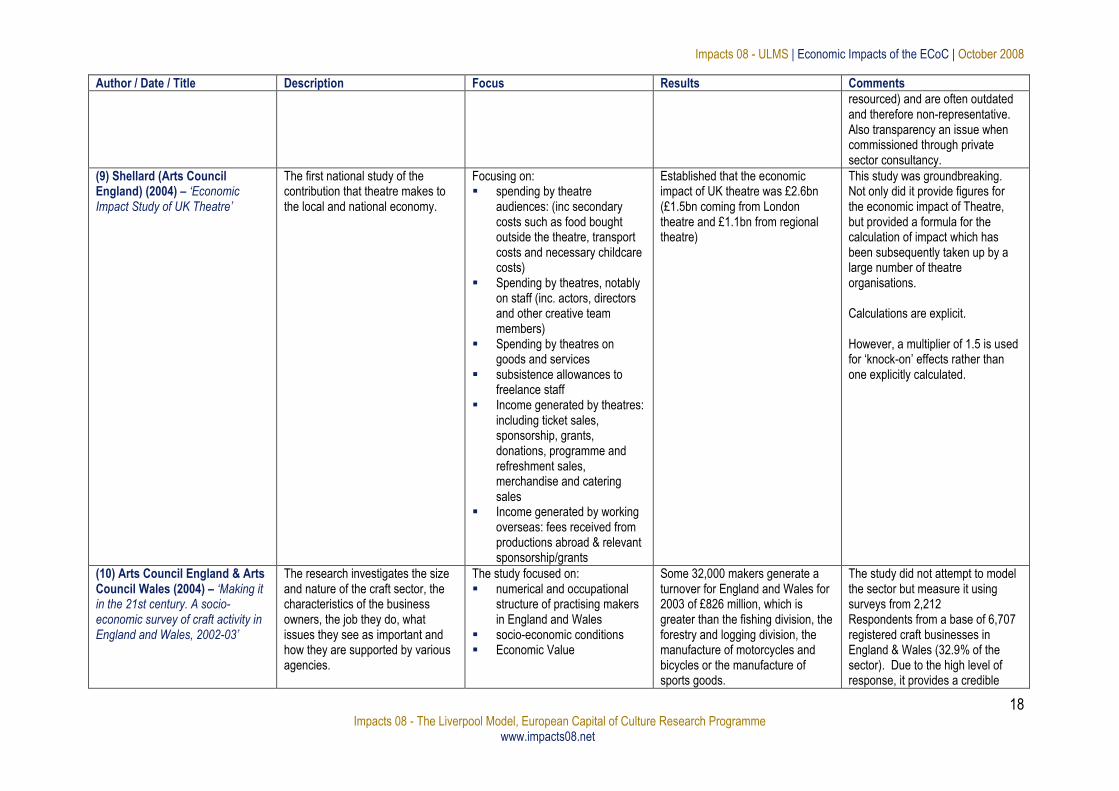
The paper is a broad base review and does not provide much of a focus on multiplier analysis. Only some theoretical drawbacks are noted via citation of (62) and a page discussing the Government (2003) „Green book‟ Guidance on the three R‟s and the 2000 „White Book‟ guidance on cost benefit analysis. Does conclude that in many cases attempts to measure impacts encounter problems with information (they are often under-
Impacts 08 - ULMS | Economic Impacts of the ECoC | October 2008
18 Impacts 08 - The Liverpool Model, European Capital of Culture Research Programme
www.impacts08.net
Author / Date / Title Description Focus Results Comments
resourced) and are often outdated and therefore non-representative. Also transparency an issue when commissioned through private sector consultancy.
(9) Shellard (Arts Council England) (2004) – ‘Economic Impact Study of UK Theatre’
The first national study of the contribution that theatre makes to the local and national economy.
Focusing on: spending by theatre
audiences: (inc secondary costs such as food bought outside the theatre, transport costs and necessary childcare costs)
Spending by theatres, notably on staff (inc. actors, directors and other creative team members)
Spending by theatres on goods and services
subsistence allowances to freelance staff
Income generated by theatres: including ticket sales, sponsorship, grants, donations, programme and refreshment sales, merchandise and catering sales
Income generated by working overseas: fees received from productions abroad & relevant sponsorship/grants
Established that the economic impact of UK theatre was £2.6bn (£1.5bn coming from London theatre and £1.1bn from regional theatre)
This study was groundbreaking. Not only did it provide figures for the economic impact of Theatre, but provided a formula for the calculation of impact which has been subsequently taken up by a large number of theatre organisations. Calculations are explicit. However, a multiplier of 1.5 is used for „knock-on‟ effects rather than one explicitly calculated.
(10) Arts Council England & Arts Council Wales (2004) – ‘Making it in the 21st century. A socio-economic survey of craft activity in England and Wales, 2002-03’
The research investigates the size and nature of the craft sector, the characteristics of the business owners, the job they do, what issues they see as important and how they are supported by various agencies.
The study focused on: numerical and occupational
structure of practising makers in England and Wales
socio-economic conditions Economic Value
Some 32,000 makers generate a turnover for England and Wales for 2003 of £826 million, which is greater than the fishing division, the forestry and logging division, the manufacture of motorcycles and bicycles or the manufacture of sports goods.
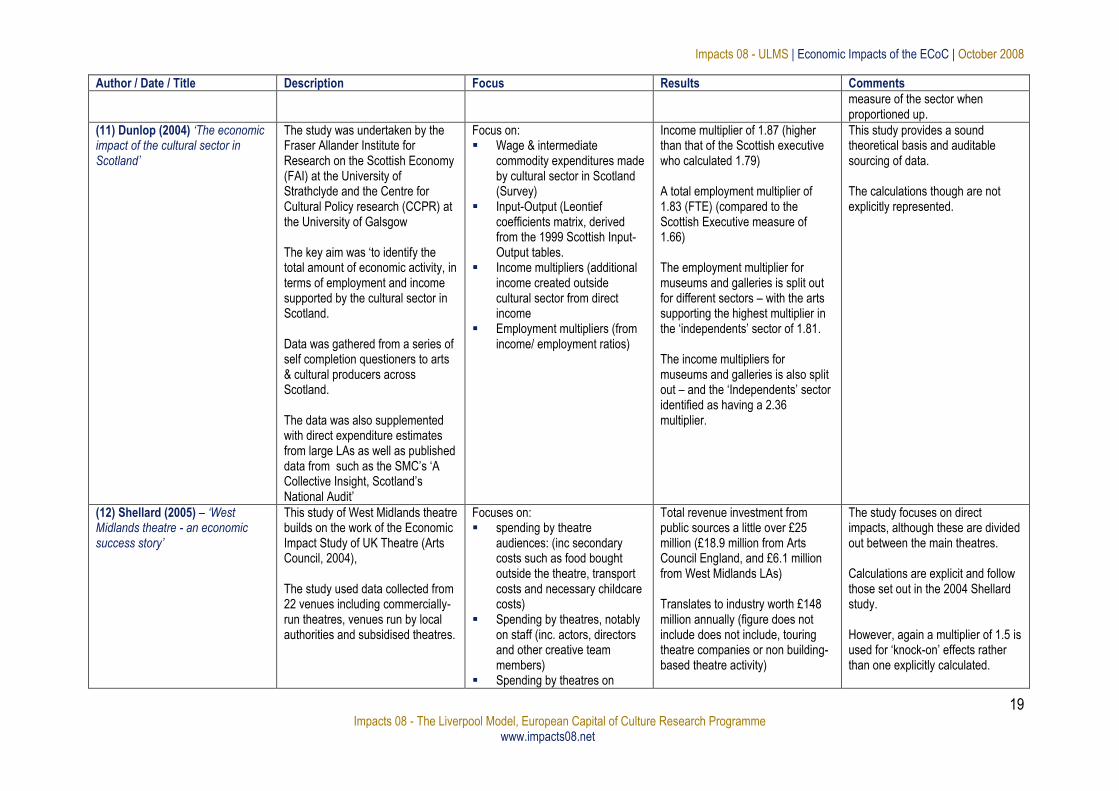
The study did not attempt to model the sector but measure it using surveys from 2,212 Respondents from a base of 6,707 registered craft businesses in England & Wales (32.9% of the sector). Due to the high level of response, it provides a credible
Impacts 08 - ULMS | Economic Impacts of the ECoC | October 2008
19 Impacts 08 - The Liverpool Model, European Capital of Culture Research Programme
www.impacts08.net
Author / Date / Title Description Focus Results Comments
measure of the sector when proportioned up.
(11) Dunlop (2004) ‘The economic impact of the cultural sector in Scotland’
The study was undertaken by the Fraser Allander Institute for Research on the Scottish Economy (FAI) at the University of Strathclyde and the Centre for Cultural Policy research (CCPR) at the University of Galsgow The key aim was „to identify the total amount of economic activity, in terms of employment and income supported by the cultural sector in Scotland. Data was gathered from a series of self completion questioners to arts & cultural producers across Scotland. The data was also supplemented with direct expenditure estimates from large LAs as well as published data from such as the SMC‟s „A Collective Insight, Scotland‟s National Audit‟
Focus on: Wage & intermediate
commodity expenditures made by cultural sector in Scotland (Survey)
Input-Output (Leontief coefficients matrix, derived from the 1999 Scottish Input-Output tables.
Income multipliers (additional income created outside cultural sector from direct income
Employment multipliers (from income/ employment ratios)
Income multiplier of 1.87 (higher than that of the Scottish executive who calculated 1.79) A total employment multiplier of 1.83 (FTE) (compared to the Scottish Executive measure of 1.66) The employment multiplier for museums and galleries is split out for different sectors – with the arts supporting the highest multiplier in the „independents‟ sector of 1.81. The income multipliers for museums and galleries is also split out – and the „Independents‟ sector identified as having a 2.36 multiplier.
This study provides a sound theoretical basis and auditable sourcing of data. The calculations though are not explicitly represented.
(12) Shellard (2005) – ‘West Midlands theatre - an economic success story’
This study of West Midlands theatre builds on the work of the Economic Impact Study of UK Theatre (Arts Council, 2004), The study used data collected from 22 venues including commercially-run theatres, venues run by local authorities and subsidised theatres.
Focuses on: spending by theatre
audiences: (inc secondary costs such as food bought outside the theatre, transport costs and necessary childcare costs)
Spending by theatres, notably on staff (inc. actors, directors and other creative team members)
Spending by theatres on
Total revenue investment from public sources a little over £25 million (£18.9 million from Arts Council England, and £6.1 million from West Midlands LAs) Translates to industry worth £148 million annually (figure does not include does not include, touring theatre companies or non building-based theatre activity)
The study focuses on direct impacts, although these are divided out between the main theatres. Calculations are explicit and follow those set out in the 2004 Shellard study. However, again a multiplier of 1.5 is used for „knock-on‟ effects rather than one explicitly calculated.
Impacts 08 - ULMS | Economic Impacts of the ECoC | October 2008
20 Impacts 08 - The Liverpool Model, European Capital of Culture Research Programme
www.impacts08.net
Author / Date / Title Description Focus Results Comments
goods and services subsistence allowances to
freelance staff Income generated by theatres:
including ticket sales, sponsorship, grants, donations, programme and refreshment sales, merchandise and catering sales
Income generated by working overseas: fees received from productions abroad & relevant sponsorship / grants
Including income generated by working overseas and sponsorship / grants the figure rises to £264m.
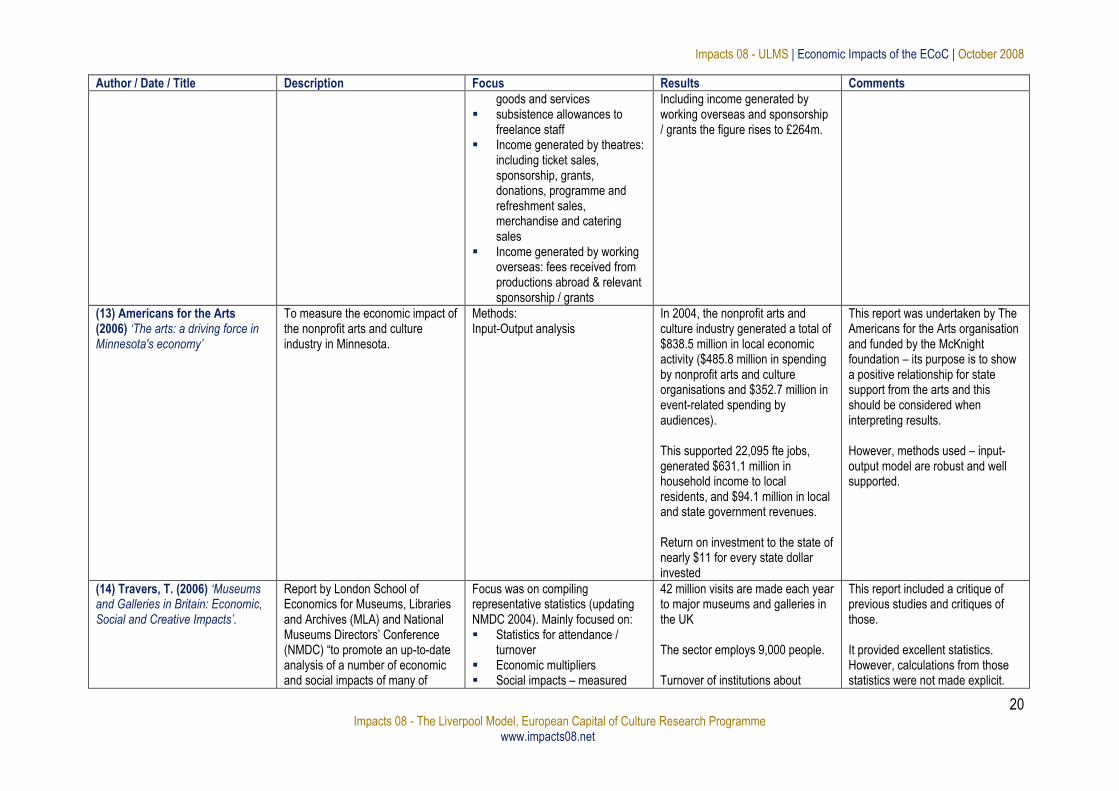
(13) Americans for the Arts (2006) ‘The arts: a driving force in Minnesota's economy’
To measure the economic impact of the nonprofit arts and culture industry in Minnesota.
Methods: Input-Output analysis
In 2004, the nonprofit arts and culture industry generated a total of $838.5 million in local economic activity ($485.8 million in spending by nonprofit arts and culture organisations and $352.7 million in event-related spending by audiences). This supported 22,095 fte jobs, generated $631.1 million in household income to local residents, and $94.1 million in local and state government revenues. Return on investment to the state of nearly $11 for every state dollar invested
This report was undertaken by The Americans for the Arts organisation and funded by the McKnight foundation – its purpose is to show a positive relationship for state support from the arts and this should be considered when interpreting results. However, methods used – input-output model are robust and well supported.
(14) Travers, T. (2006) ‘Museums and Galleries in Britain: Economic, Social and Creative Impacts’.
Report by London School of Economics for Museums, Libraries and Archives (MLA) and National Museums Directors‟ Conference (NMDC) “to promote an up-to-date analysis of a number of economic and social impacts of many of
Focus was on compiling representative statistics (updating NMDC 2004). Mainly focused on: Statistics for attendance /
turnover Economic multipliers Social impacts – measured
42 million visits are made each year to major museums and galleries in the UK The sector employs 9,000 people. Turnover of institutions about
This report included a critique of previous studies and critiques of those. It provided excellent statistics. However, calculations from those statistics were not made explicit.
Impacts 08 - ULMS | Economic Impacts of the ECoC | October 2008
21 Impacts 08 - The Liverpool Model, European Capital of Culture Research Programme
www.impacts08.net
Author / Date / Title Description Focus Results Comments
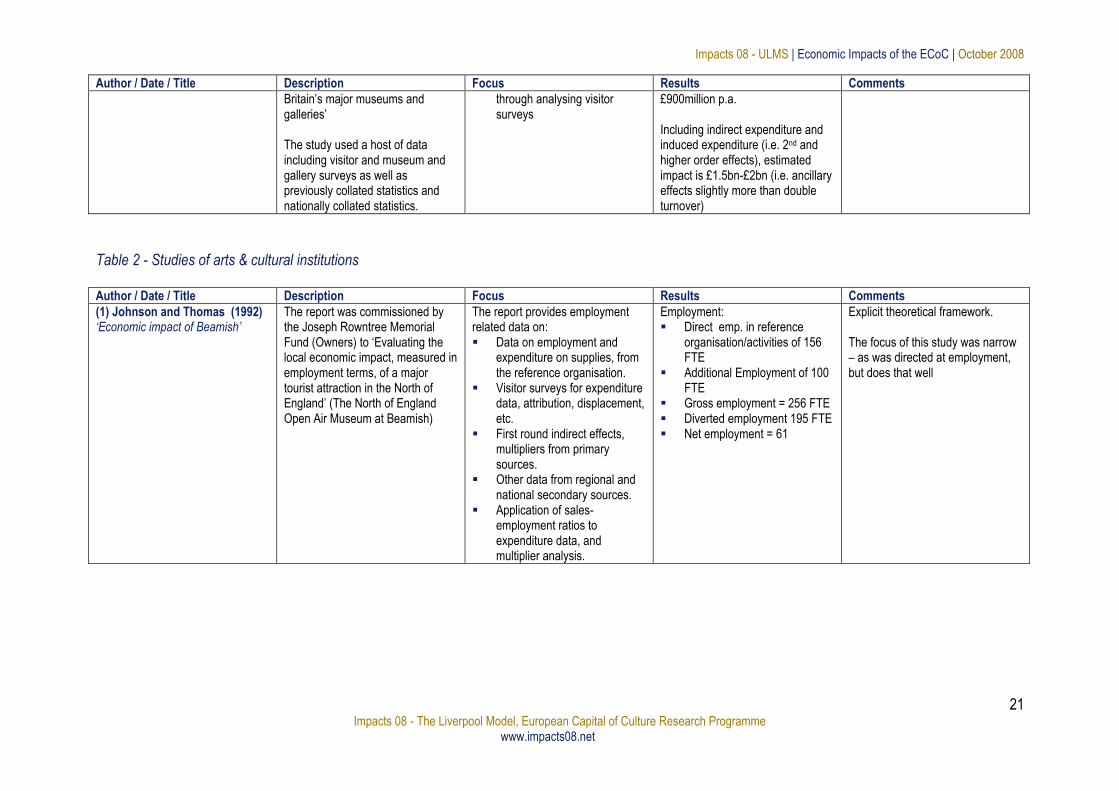
Britain‟s major museums and galleries‟ The study used a host of data including visitor and museum and gallery surveys as well as previously collated statistics and nationally collated statistics.
through analysing visitor surveys
£900million p.a. Including indirect expenditure and induced expenditure (i.e. 2nd and higher order effects), estimated impact is £1.5bn-£2bn (i.e. ancillary effects slightly more than double turnover)
Table 2 - Studies of arts & cultural institutions Author / Date / Title Description Focus Results Comments
(1) Johnson and Thomas (1992) ‘Economic impact of Beamish’
The report was commissioned by the Joseph Rowntree Memorial Fund (Owners) to „Evaluating the local economic impact, measured in employment terms, of a major tourist attraction in the North of England‟ (The North of England Open Air Museum at Beamish)
The report provides employment related data on: Data on employment and
expenditure on supplies, from the reference organisation.
Visitor surveys for expenditure data, attribution, displacement, etc.
First round indirect effects, multipliers from primary sources.
Other data from regional and national secondary sources.
Application of sales-employment ratios to expenditure data, and multiplier analysis.
Employment: Direct emp. in reference
organisation/activities of 156 FTE
Additional Employment of 100 FTE
Gross employment = 256 FTE Diverted employment 195 FTE Net employment = 61
Explicit theoretical framework. The focus of this study was narrow – as was directed at employment, but does that well
Impacts 08 - ULMS | Economic Impacts of the ECoC | October 2008
22 Impacts 08 - The Liverpool Model, European Capital of Culture Research Programme
www.impacts08.net
Author / Date / Title Description Focus Results Comments
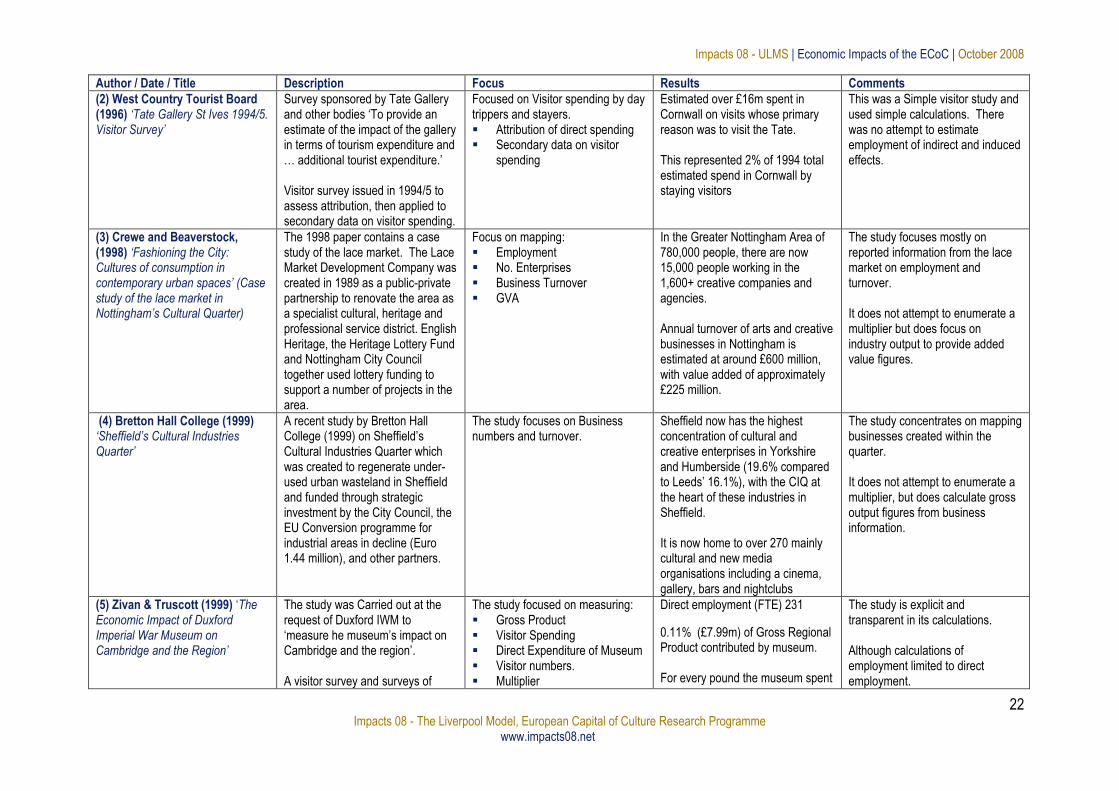
(2) West Country Tourist Board (1996) ‘Tate Gallery St Ives 1994/5. Visitor Survey’
Survey sponsored by Tate Gallery and other bodies „To provide an estimate of the impact of the gallery in terms of tourism expenditure and … additional tourist expenditure.‟ Visitor survey issued in 1994/5 to assess attribution, then applied to secondary data on visitor spending.
Focused on Visitor spending by day trippers and stayers. Attribution of direct spending Secondary data on visitor
spending
Estimated over £16m spent in Cornwall on visits whose primary reason was to visit the Tate. This represented 2% of 1994 total estimated spend in Cornwall by staying visitors
This was a Simple visitor study and used simple calculations. There was no attempt to estimate employment of indirect and induced effects.
(3) Crewe and Beaverstock, (1998) ‘Fashioning the City: Cultures of consumption in contemporary urban spaces’ (Case study of the lace market in Nottingham’s Cultural Quarter)
The 1998 paper contains a case study of the lace market. The Lace Market Development Company was created in 1989 as a public-private partnership to renovate the area as a specialist cultural, heritage and professional service district. English Heritage, the Heritage Lottery Fund and Nottingham City Council together used lottery funding to support a number of projects in the area.
Focus on mapping: Employment No. Enterprises Business Turnover GVA
In the Greater Nottingham Area of 780,000 people, there are now 15,000 people working in the 1,600+ creative companies and agencies. Annual turnover of arts and creative businesses in Nottingham is estimated at around £600 million, with value added of approximately £225 million.
The study focuses mostly on reported information from the lace market on employment and turnover. It does not attempt to enumerate a multiplier but does focus on industry output to provide added value figures.
(4) Bretton Hall College (1999) ‘Sheffield’s Cultural Industries Quarter’
A recent study by Bretton Hall College (1999) on Sheffield‟s Cultural Industries Quarter which was created to regenerate under-used urban wasteland in Sheffield and funded through strategic investment by the City Council, the EU Conversion programme for industrial areas in decline (Euro 1.44 million), and other partners.
The study focuses on Business numbers and turnover.
Sheffield now has the highest concentration of cultural and creative enterprises in Yorkshire and Humberside (19.6% compared to Leeds‟ 16.1%), with the CIQ at the heart of these industries in Sheffield. It is now home to over 270 mainly cultural and new media organisations including a cinema, gallery, bars and nightclubs
The study concentrates on mapping businesses created within the quarter. It does not attempt to enumerate a multiplier, but does calculate gross output figures from business information.
(5) Zivan & Truscott (1999) „The Economic Impact of Duxford Imperial War Museum on Cambridge and the Region’
The study was Carried out at the request of Duxford IWM to „measure he museum‟s impact on Cambridge and the region‟. A visitor survey and surveys of
The study focused on measuring: Gross Product Visitor Spending Direct Expenditure of Museum Visitor numbers. Multiplier
Direct employment (FTE) 231
0.11% (£7.99m) of Gross Regional Product contributed by museum. For every pound the museum spent
The study is explicit and transparent in its calculations. Although calculations of employment limited to direct employment.
Impacts 08 - ULMS | Economic Impacts of the ECoC | October 2008
23 Impacts 08 - The Liverpool Model, European Capital of Culture Research Programme
www.impacts08.net
Author / Date / Title Description Focus Results Comments
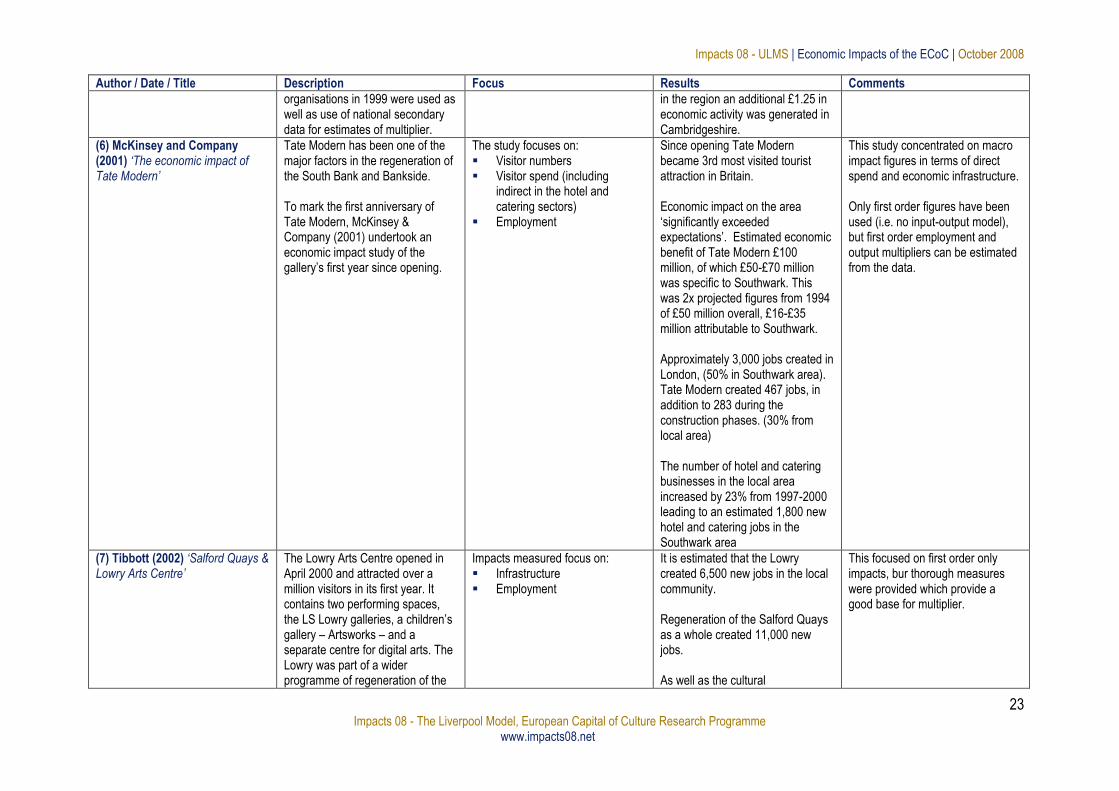
organisations in 1999 were used as well as use of national secondary data for estimates of multiplier.
in the region an additional £1.25 in economic activity was generated in Cambridgeshire.
(6) McKinsey and Company (2001) ‘The economic impact of Tate Modern’
Tate Modern has been one of the major factors in the regeneration of the South Bank and Bankside. To mark the first anniversary of Tate Modern, McKinsey & Company (2001) undertook an economic impact study of the gallery‟s first year since opening.
The study focuses on: Visitor numbers Visitor spend (including
indirect in the hotel and catering sectors)
Employment
Since opening Tate Modern became 3rd most visited tourist attraction in Britain. Economic impact on the area „significantly exceeded expectations‟. Estimated economic benefit of Tate Modern £100 million, of which £50-£70 million was specific to Southwark. This was 2x projected figures from 1994 of £50 million overall, £16-£35 million attributable to Southwark. Approximately 3,000 jobs created in London, (50% in Southwark area). Tate Modern created 467 jobs, in addition to 283 during the construction phases. (30% from local area) The number of hotel and catering businesses in the local area increased by 23% from 1997-2000 leading to an estimated 1,800 new hotel and catering jobs in the Southwark area
This study concentrated on macro impact figures in terms of direct spend and economic infrastructure. Only first order figures have been used (i.e. no input-output model), but first order employment and output multipliers can be estimated from the data.
(7) Tibbott (2002) ‘Salford Quays & Lowry Arts Centre’
The Lowry Arts Centre opened in April 2000 and attracted over a million visitors in its first year. It contains two performing spaces, the LS Lowry galleries, a children‟s gallery – Artsworks – and a separate centre for digital arts. The Lowry was part of a wider programme of regeneration of the
Impacts measured focus on: Infrastructure Employment
It is estimated that the Lowry created 6,500 new jobs in the local community. Regeneration of the Salford Quays as a whole created 11,000 new jobs. As well as the cultural
This focused on first order only impacts, bur thorough measures were provided which provide a good base for multiplier.
Impacts 08 - ULMS | Economic Impacts of the ECoC | October 2008
24 Impacts 08 - The Liverpool Model, European Capital of Culture Research Programme
www.impacts08.net
Author / Date / Title Description Focus Results Comments
Salford Quays, including the £28 million Imperial War Museum North (Pride of place, 2002).
developments, there has been a £90 million commercial and retail development.
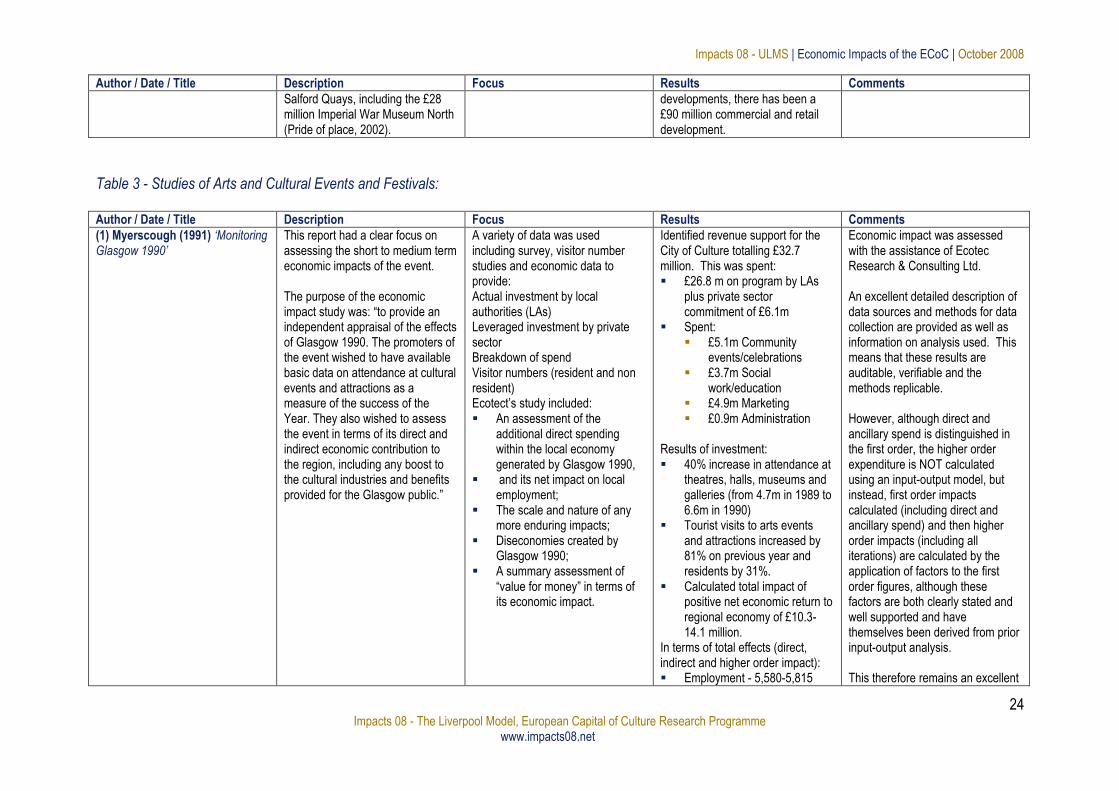
Table 3 - Studies of Arts and Cultural Events and Festivals: Author / Date / Title Description Focus Results Comments
(1) Myerscough (1991) ‘Monitoring Glasgow 1990’
This report had a clear focus on assessing the short to medium term economic impacts of the event. The purpose of the economic impact study was: “to provide an independent appraisal of the effects of Glasgow 1990. The promoters of the event wished to have available basic data on attendance at cultural events and attractions as a measure of the success of the Year. They also wished to assess the event in terms of its direct and indirect economic contribution to the region, including any boost to the cultural industries and benefits provided for the Glasgow public.”
A variety of data was used including survey, visitor number studies and economic data to provide: Actual investment by local authorities (LAs) Leveraged investment by private sector Breakdown of spend Visitor numbers (resident and non resident) Ecotect‟s study included: An assessment of the
additional direct spending within the local economy generated by Glasgow 1990,
and its net impact on local employment;
The scale and nature of any more enduring impacts;
Diseconomies created by Glasgow 1990;
A summary assessment of “value for money” in terms of its economic impact.
Identified revenue support for the City of Culture totalling £32.7 million. This was spent: £26.8 m on program by LAs
plus private sector commitment of £6.1m
Spent: £5.1m Community
events/celebrations £3.7m Social
work/education £4.9m Marketing £0.9m Administration
Results of investment: 40% increase in attendance at
theatres, halls, museums and galleries (from 4.7m in 1989 to 6.6m in 1990)
Tourist visits to arts events and attractions increased by 81% on previous year and residents by 31%.
Calculated total impact of positive net economic return to regional economy of £10.3-14.1 million.
In terms of total effects (direct, indirect and higher order impact): Employment - 5,580-5,815
Economic impact was assessed with the assistance of Ecotec Research & Consulting Ltd. An excellent detailed description of data sources and methods for data collection are provided as well as information on analysis used. This means that these results are auditable, verifiable and the methods replicable. However, although direct and ancillary spend is distinguished in the first order, the higher order expenditure is NOT calculated using an input-output model, but instead, first order impacts calculated (including direct and ancillary spend) and then higher order impacts (including all iterations) are calculated by the application of factors to the first order figures, although these factors are both clearly stated and well supported and have themselves been derived from prior input-output analysis. This therefore remains an excellent
Impacts 08 - ULMS | Economic Impacts of the ECoC | October 2008
25 Impacts 08 - The Liverpool Model, European Capital of Culture Research Programme
www.impacts08.net
Author / Date / Title Description Focus Results Comments
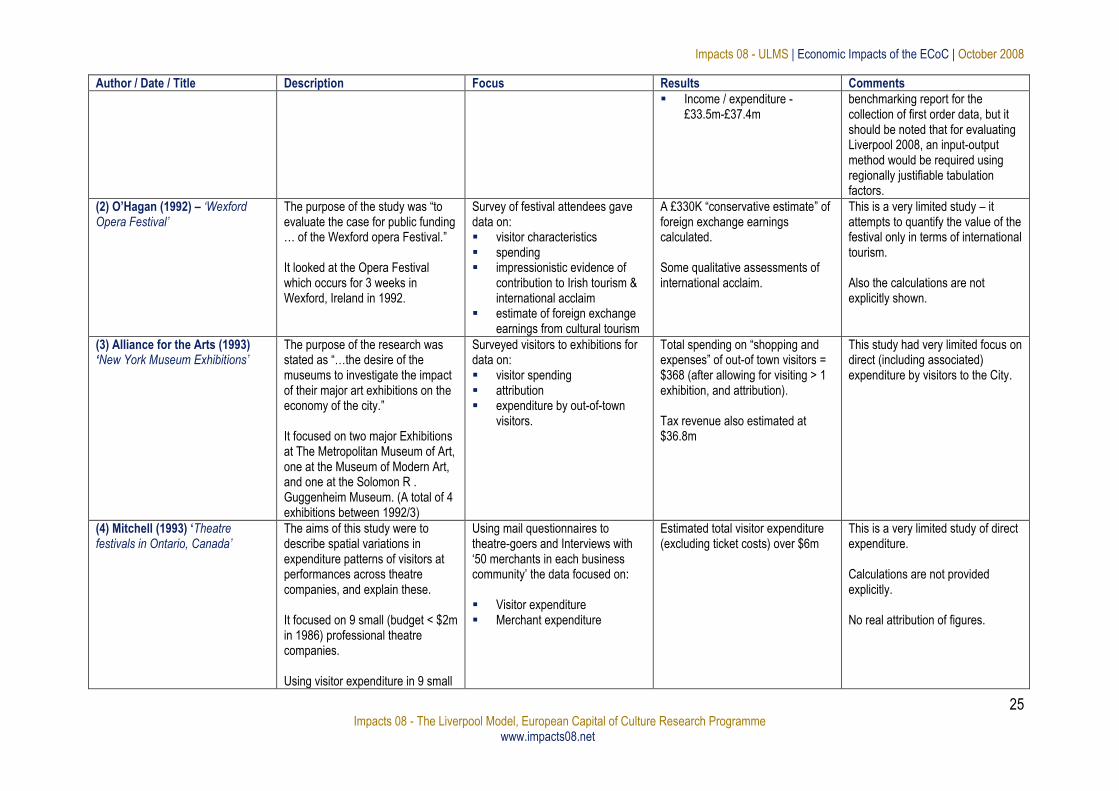
Income / expenditure - £33.5m-£37.4m
benchmarking report for the collection of first order data, but it should be noted that for evaluating Liverpool 2008, an input-output method would be required using regionally justifiable tabulation factors.
(2) O’Hagan (1992) – ‘Wexford Opera Festival’
The purpose of the study was “to evaluate the case for public funding … of the Wexford opera Festival.” It looked at the Opera Festival which occurs for 3 weeks in Wexford, Ireland in 1992.
Survey of festival attendees gave data on: visitor characteristics spending impressionistic evidence of
contribution to Irish tourism & international acclaim
estimate of foreign exchange earnings from cultural tourism
A £330K “conservative estimate” of foreign exchange earnings calculated. Some qualitative assessments of international acclaim.
This is a very limited study – it attempts to quantify the value of the festival only in terms of international tourism. Also the calculations are not explicitly shown.
(3) Alliance for the Arts (1993) ‘New York Museum Exhibitions’
The purpose of the research was stated as “…the desire of the museums to investigate the impact of their major art exhibitions on the economy of the city.” It focused on two major Exhibitions at The Metropolitan Museum of Art, one at the Museum of Modern Art, and one at the Solomon R . Guggenheim Museum. (A total of 4 exhibitions between 1992/3)
Surveyed visitors to exhibitions for data on: visitor spending attribution expenditure by out-of-town
visitors.
Total spending on “shopping and expenses” of out-of town visitors = $368 (after allowing for visiting > 1 exhibition, and attribution). Tax revenue also estimated at $36.8m
This study had very limited focus on direct (including associated) expenditure by visitors to the City.
(4) Mitchell (1993) ‘Theatre festivals in Ontario, Canada’
The aims of this study were to describe spatial variations in expenditure patterns of visitors at performances across theatre companies, and explain these. It focused on 9 small (budget < $2m in 1986) professional theatre companies. Using visitor expenditure in 9 small
Using mail questionnaires to theatre-goers and Interviews with „50 merchants in each business community‟ the data focused on: Visitor expenditure Merchant expenditure
Estimated total visitor expenditure (excluding ticket costs) over $6m
This is a very limited study of direct expenditure. Calculations are not provided explicitly. No real attribution of figures.
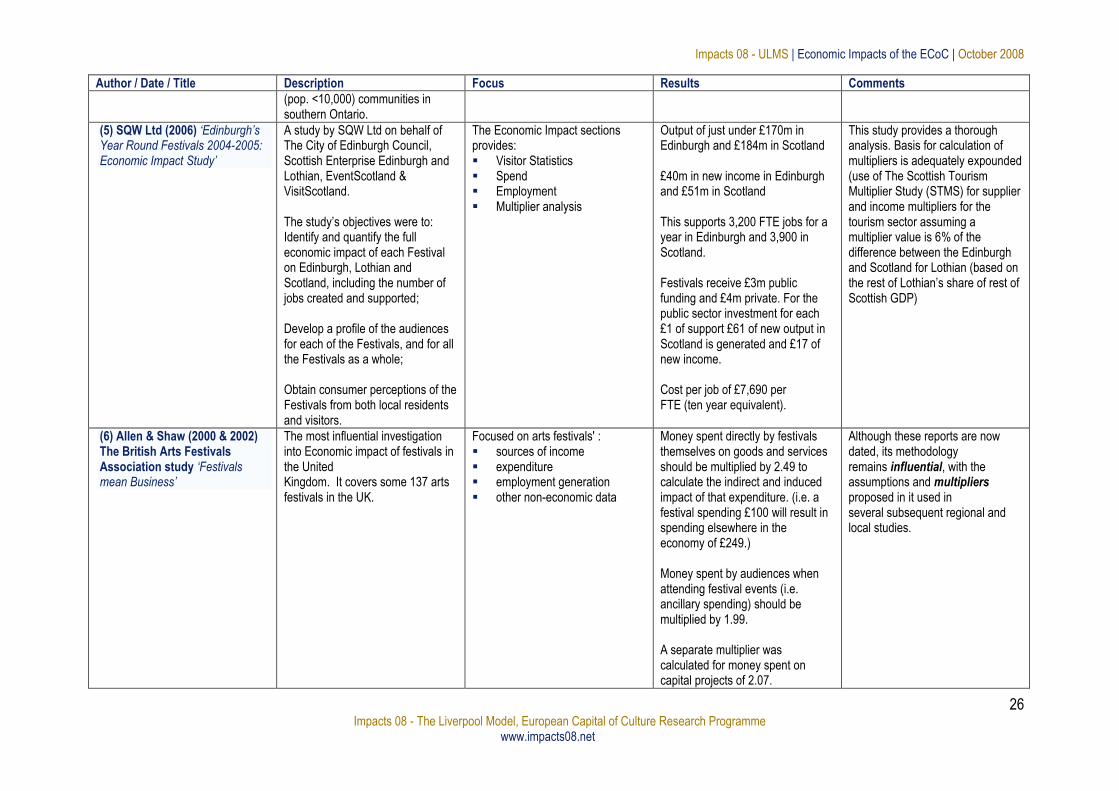
Impacts 08 - ULMS | Economic Impacts of the ECoC | October 2008
26 Impacts 08 - The Liverpool Model, European Capital of Culture Research Programme
www.impacts08.net
Author / Date / Title Description Focus Results Comments
(pop. <10,000) communities in southern Ontario.
(5) SQW Ltd (2006) ‘Edinburgh’s Year Round Festivals 2004-2005: Economic Impact Study’
A study by SQW Ltd on behalf of The City of Edinburgh Council, Scottish Enterprise Edinburgh and Lothian, EventScotland & VisitScotland. The study‟s objectives were to: Identify and quantify the full economic impact of each Festival on Edinburgh, Lothian and Scotland, including the number of jobs created and supported; Develop a profile of the audiences for each of the Festivals, and for all the Festivals as a whole; Obtain consumer perceptions of the Festivals from both local residents and visitors.
The Economic Impact sections provides: Visitor Statistics Spend Employment Multiplier analysis
Output of just under £170m in Edinburgh and £184m in Scotland £40m in new income in Edinburgh and £51m in Scotland This supports 3,200 FTE jobs for a year in Edinburgh and 3,900 in Scotland. Festivals receive £3m public funding and £4m private. For the public sector investment for each £1 of support £61 of new output in Scotland is generated and £17 of new income. Cost per job of £7,690 per FTE (ten year equivalent).
This study provides a thorough analysis. Basis for calculation of multipliers is adequately expounded (use of The Scottish Tourism Multiplier Study (STMS) for supplier and income multipliers for the tourism sector assuming a multiplier value is 6% of the difference between the Edinburgh and Scotland for Lothian (based on the rest of Lothian‟s share of rest of Scottish GDP)
(6) Allen & Shaw (2000 & 2002) The British Arts Festivals Association study ‘Festivals mean Business’
The most influential investigation into Economic impact of festivals in the United Kingdom. It covers some 137 arts festivals in the UK.
Focused on arts festivals' : sources of income expenditure employment generation other non-economic data
Money spent directly by festivals themselves on goods and services should be multiplied by 2.49 to calculate the indirect and induced impact of that expenditure. (i.e. a festival spending £100 will result in spending elsewhere in the economy of £249.) Money spent by audiences when attending festival events (i.e. ancillary spending) should be multiplied by 1.99. A separate multiplier was calculated for money spent on capital projects of 2.07.
Although these reports are now dated, its methodology remains influential, with the assumptions and multipliers proposed in it used in several subsequent regional and local studies.
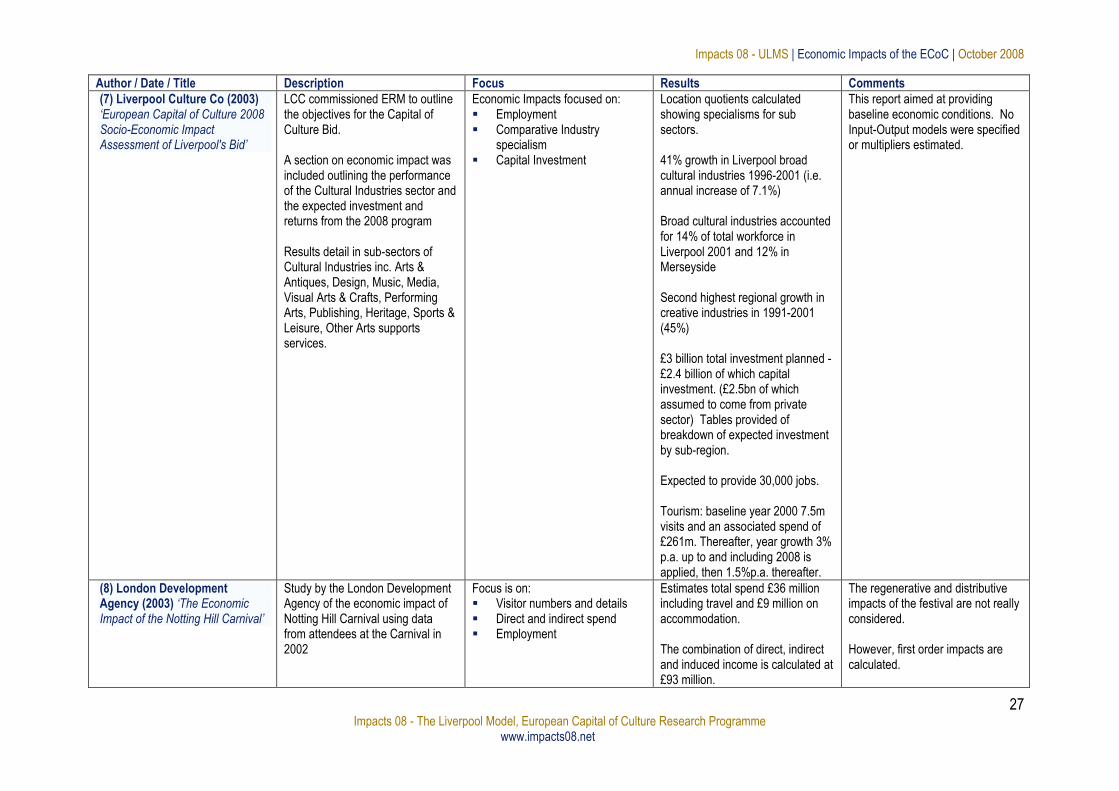
Impacts 08 - ULMS | Economic Impacts of the ECoC | October 2008
27 Impacts 08 - The Liverpool Model, European Capital of Culture Research Programme
www.impacts08.net
Author / Date / Title Description Focus Results Comments
(7) Liverpool Culture Co (2003) ‘European Capital of Culture 2008 Socio-Economic Impact Assessment of Liverpool's Bid’
LCC commissioned ERM to outline the objectives for the Capital of Culture Bid. A section on economic impact was included outlining the performance of the Cultural Industries sector and the expected investment and returns from the 2008 program Results detail in sub-sectors of Cultural Industries inc. Arts & Antiques, Design, Music, Media, Visual Arts & Crafts, Performing Arts, Publishing, Heritage, Sports & Leisure, Other Arts supports services.
Economic Impacts focused on: Employment Comparative Industry
specialism Capital Investment
Location quotients calculated showing specialisms for sub sectors. 41% growth in Liverpool broad cultural industries 1996-2001 (i.e. annual increase of 7.1%) Broad cultural industries accounted for 14% of total workforce in Liverpool 2001 and 12% in Merseyside Second highest regional growth in creative industries in 1991-2001 (45%) £3 billion total investment planned - £2.4 billion of which capital investment. (£2.5bn of which assumed to come from private sector) Tables provided of breakdown of expected investment by sub-region. Expected to provide 30,000 jobs. Tourism: baseline year 2000 7.5m visits and an associated spend of £261m. Thereafter, year growth 3% p.a. up to and including 2008 is applied, then 1.5%p.a. thereafter.
This report aimed at providing baseline economic conditions. No Input-Output models were specified or multipliers estimated.
(8) London Development Agency (2003) ‘The Economic Impact of the Notting Hill Carnival’
Study by the London Development Agency of the economic impact of Notting Hill Carnival using data from attendees at the Carnival in 2002
Focus is on: Visitor numbers and details Direct and indirect spend Employment
Estimates total spend £36 million including travel and £9 million on accommodation. The combination of direct, indirect and induced income is calculated at £93 million.
The regenerative and distributive impacts of the festival are not really considered. However, first order impacts are calculated.
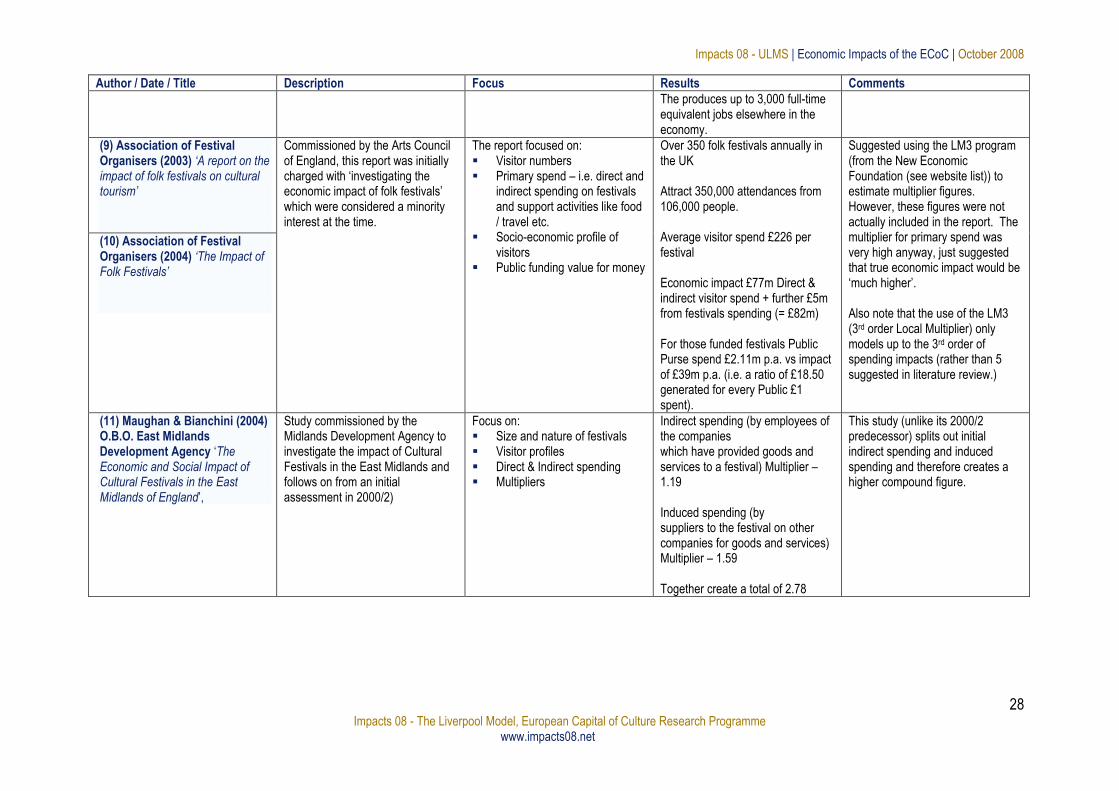
Impacts 08 - ULMS | Economic Impacts of the ECoC | October 2008
28 Impacts 08 - The Liverpool Model, European Capital of Culture Research Programme
www.impacts08.net
Author / Date / Title Description Focus Results Comments
The produces up to 3,000 full-time equivalent jobs elsewhere in the economy.
(9) Association of Festival Organisers (2003) ‘A report on the impact of folk festivals on cultural tourism’
Commissioned by the Arts Council of England, this report was initially charged with „investigating the economic impact of folk festivals‟ which were considered a minority interest at the time.
The report focused on: Visitor numbers Primary spend – i.e. direct and
indirect spending on festivals and support activities like food / travel etc.
Socio-economic profile of visitors
Public funding value for money
Over 350 folk festivals annually in the UK Attract 350,000 attendances from 106,000 people. Average visitor spend £226 per festival Economic impact £77m Direct & indirect visitor spend + further £5m from festivals spending (= £82m) For those funded festivals Public Purse spend £2.11m p.a. vs impact of £39m p.a. (i.e. a ratio of £18.50 generated for every Public £1 spent).
Suggested using the LM3 program (from the New Economic Foundation (see website list)) to estimate multiplier figures. However, these figures were not actually included in the report. The multiplier for primary spend was very high anyway, just suggested that true economic impact would be „much higher‟. Also note that the use of the LM3 (3rd order Local Multiplier) only models up to the 3rd order of spending impacts (rather than 5 suggested in literature review.)
(10) Association of Festival Organisers (2004) ‘The Impact of Folk Festivals’
(11) Maughan & Bianchini (2004) O.B.O. East Midlands Development Agency „The Economic and Social Impact of Cultural Festivals in the East Midlands of England‟,
Study commissioned by the Midlands Development Agency to investigate the impact of Cultural Festivals in the East Midlands and follows on from an initial assessment in 2000/2)
Focus on: Size and nature of festivals Visitor profiles Direct & Indirect spending Multipliers
Indirect spending (by employees of the companies which have provided goods and services to a festival) Multiplier – 1.19 Induced spending (by suppliers to the festival on other companies for goods and services) Multiplier – 1.59 Together create a total of 2.78
This study (unlike its 2000/2 predecessor) splits out initial indirect spending and induced spending and therefore creates a higher compound figure.
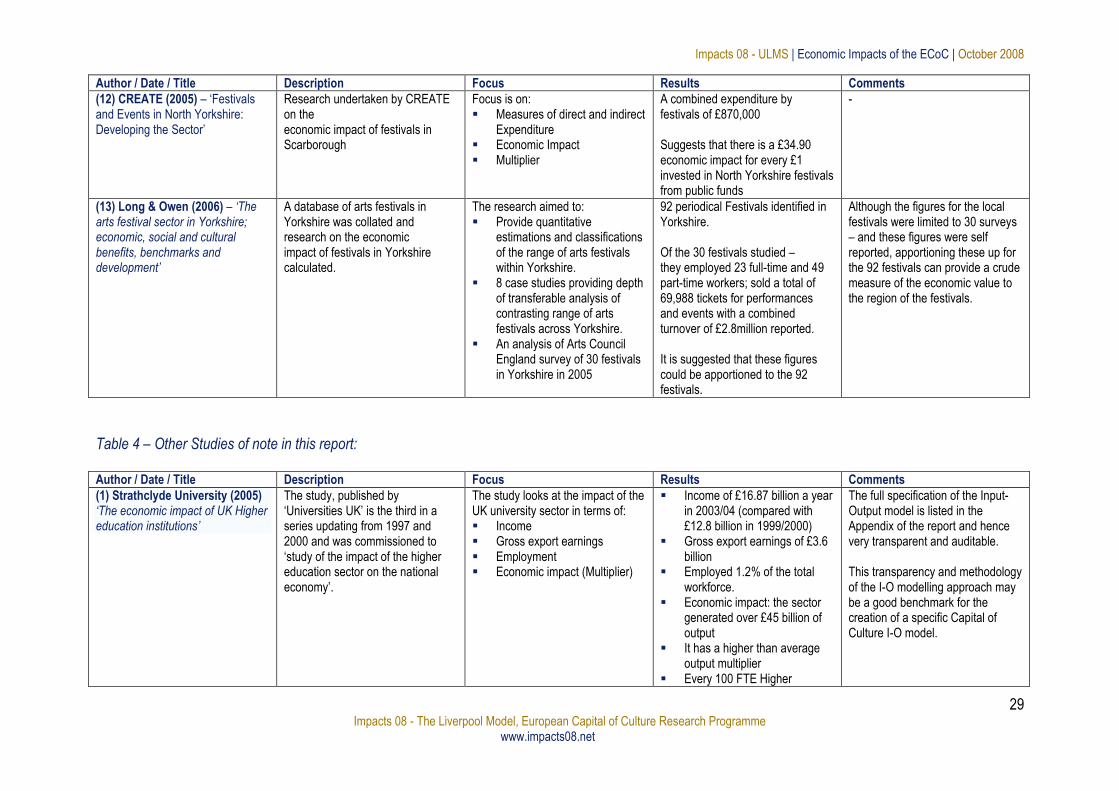
Impacts 08 - ULMS | Economic Impacts of the ECoC | October 2008
29 Impacts 08 - The Liverpool Model, European Capital of Culture Research Programme
www.impacts08.net
Author / Date / Title Description Focus Results Comments
(12) CREATE (2005) – „Festivals and Events in North Yorkshire: Developing the Sector‟
Research undertaken by CREATE on the economic impact of festivals in Scarborough
Focus is on: Measures of direct and indirect
Expenditure Economic Impact Multiplier
A combined expenditure by festivals of £870,000 Suggests that there is a £34.90 economic impact for every £1 invested in North Yorkshire festivals from public funds
-
(13) Long & Owen (2006) – ‘The arts festival sector in Yorkshire; economic, social and cultural benefits, benchmarks and development’
A database of arts festivals in Yorkshire was collated and research on the economic impact of festivals in Yorkshire calculated.
The research aimed to: Provide quantitative
estimations and classifications of the range of arts festivals within Yorkshire.
8 case studies providing depth of transferable analysis of contrasting range of arts festivals across Yorkshire.
An analysis of Arts Council England survey of 30 festivals in Yorkshire in 2005
92 periodical Festivals identified in Yorkshire. Of the 30 festivals studied – they employed 23 full-time and 49 part-time workers; sold a total of 69,988 tickets for performances and events with a combined turnover of £2.8million reported. It is suggested that these figures could be apportioned to the 92 festivals.
Although the figures for the local festivals were limited to 30 surveys – and these figures were self reported, apportioning these up for the 92 festivals can provide a crude measure of the economic value to the region of the festivals.
Table 4 – Other Studies of note in this report: Author / Date / Title Description Focus Results Comments
(1) Strathclyde University (2005) ‘The economic impact of UK Higher education institutions’
The study, published by „Universities UK‟ is the third in a series updating from 1997 and 2000 and was commissioned to „study of the impact of the higher education sector on the national economy‟.
The study looks at the impact of the UK university sector in terms of: Income Gross export earnings Employment Economic impact (Multiplier)
Income of £16.87 billion a year in 2003/04 (compared with £12.8 billion in 1999/2000)
Gross export earnings of £3.6 billion
Employed 1.2% of the total workforce.
Economic impact: the sector generated over £45 billion of output
It has a higher than average output multiplier
Every 100 FTE Higher
The full specification of the Input-Output model is listed in the Appendix of the report and hence very transparent and auditable. This transparency and methodology of the I-O modelling approach may be a good benchmark for the creation of a specific Capital of Culture I-O model.
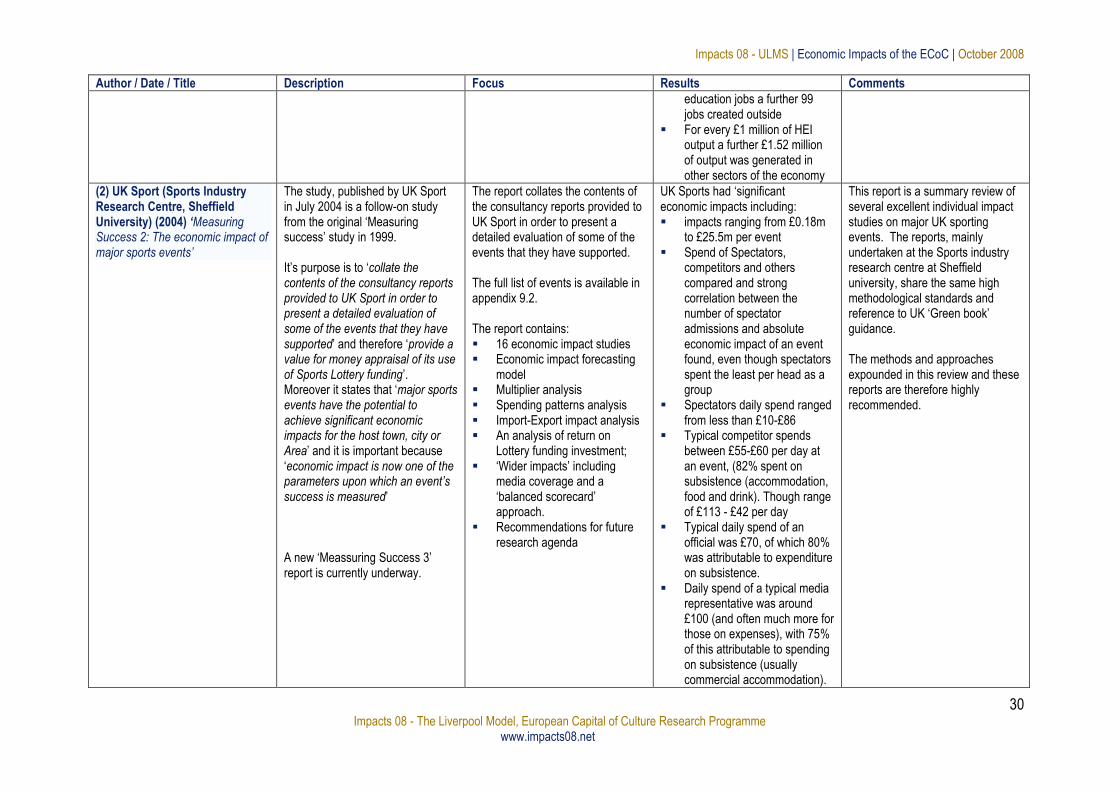
Impacts 08 - ULMS | Economic Impacts of the ECoC | October 2008
30 Impacts 08 - The Liverpool Model, European Capital of Culture Research Programme
www.impacts08.net
Author / Date / Title Description Focus Results Comments
education jobs a further 99 jobs created outside
For every £1 million of HEI output a further £1.52 million of output was generated in other sectors of the economy
(2) UK Sport (Sports Industry Research Centre, Sheffield University) (2004) ‘Measuring Success 2: The economic impact of major sports events’
The study, published by UK Sport in July 2004 is a follow-on study from the original „Measuring success‟ study in 1999. It‟s purpose is to „collate the contents of the consultancy reports provided to UK Sport in order to present a detailed evaluation of some of the events that they have supported‟ and therefore „provide a value for money appraisal of its use of Sports Lottery funding‟. Moreover it states that „major sports events have the potential to achieve significant economic impacts for the host town, city or Area‟ and it is important because „economic impact is now one of the parameters upon which an event’s success is measured‟ A new „Meassuring Success 3‟ report is currently underway.
The report collates the contents of the consultancy reports provided to UK Sport in order to present a detailed evaluation of some of the events that they have supported. The full list of events is available in appendix 9.2. The report contains: 16 economic impact studies Economic impact forecasting
model Multiplier analysis Spending patterns analysis Import-Export impact analysis An analysis of return on
Lottery funding investment; „Wider impacts‟ including
media coverage and a „balanced scorecard‟ approach.
Recommendations for future research agenda
UK Sports had „significant economic impacts including: impacts ranging from £0.18m
to £25.5m per event Spend of Spectators,
competitors and others compared and strong correlation between the number of spectator admissions and absolute economic impact of an event found, even though spectators spent the least per head as a group
Spectators daily spend ranged from less than £10-£86
Typical competitor spends between £55-£60 per day at an event, (82% spent on subsistence (accommodation, food and drink). Though range of £113 - £42 per day
Typical daily spend of an official was £70, of which 80% was attributable to expenditure on subsistence.
Daily spend of a typical media representative was around £100 (and often much more for those on expenses), with 75% of this attributable to spending on subsistence (usually commercial accommodation).
This report is a summary review of several excellent individual impact studies on major UK sporting events. The reports, mainly undertaken at the Sports industry research centre at Sheffield university, share the same high methodological standards and reference to UK „Green book‟ guidance. The methods and approaches expounded in this review and these reports are therefore highly recommended.

Impacts 08 - ULMS | Economic Impacts of the ECoC | October 2008
31 Impacts 08 - The Liverpool Model, European Capital of Culture Research Programme
www.impacts08.net
Author / Date / Title Description Focus Results Comments
Much of the economic impact identified as redistribution, therefore no impact on overall GDP. However, some events e.g. Flora Marathon - £1.2m imports
High approval ratings from the public for continued support of events through the Lottery;
For every £1 of Lottery support, additional expenditure in host economies amounted to £7.23.
Forecasting gave accuracies of 64%-79%
Impacts 08 - ULMS | Economic Impacts of the ECoC | October 2008
32 Impacts 08 - The Liverpool Model, European Capital of Culture Research Programme
www.impacts08.net
5. Issues and Limitations in the development of Input-Output Multiplier modelling
In policy situations where a Government body is essentially looking for evidence of the efficacy of each additional pound spent on an arts & cultural program in terms of its impact, it is often tempting to view a multiplier as being such for each marginal unit. Although this is rarely touched upon in the literature, it is important to note that calculations made within the models are expressed in terms of a per-pound multiplier effect, but only at the level of spending set out in the model. It is unlikely that the marginal unit multiplier will remain constant as direct government spending on the program is increased or indeed decreased. That is, for example, if a multiplier is calculated and offered as a per pound 1.5 x return when £1m is invested, investing a further £1 may not produce an equivalent 1.5 x, but may make the overall multiplier higher or lower. The difference between the expression of calculated impact as a per-pound multiplier and marginal per-pound effects is of fundamental importance. As noted above, there are several definitions of Multipliers and at least three easily recognisably different sub-strands of “multiplier” which can be aggregated (Direct Expenditure by festival organisers, Ancillary Expenditure by festival attendees and Capital Expenditure), but make more sense calculated and quoted separately. There are also different definitions of what those multipliers represent – i.e. a ratio of total effects (including direct and indirect) to direct activity for each organisation (Johnson & Thomas, 1992) or ratio of final to initial changes (The South West Museums Council, 2000). The use of off the shelf software may therefore leave the user with a “black box” calculation (where results are returned without any understanding of how), unless the user is very knowledgeable about the mechanics of the tabulation and resultant calculations. The figures gained depend on two main elements: Firstly, the quality of the primary data sourced to input into the model (e.g. direct spend etc) but also quite heavily on the tabulation coefficients used in the model. With several orders of iterative multiplicity these have the potential to radically affect the results. Indeed, there are a number of methodological and interpretation issues that can affect the resultant tabulations. Other highlighted issues include: Long & Owen‟s (2006) note of caution that there „may at times be a tendency to downplay substitution and displacement of spending, the external costs of a festival, and opportunity costs of public funding (though this may be balanced by visitor spending in local businesses)‟. They assert that therefore „confidence in economic analyses depends ultimately on what is included, emphasised and excluded from studies‟. Johnson & Thomas (2000) particularly highlight the issue of a lack of calculation of the proportion of diversion spending (i.e. spending that has simply been diverted from other regional or industry spending). Most particularly they note that even when this is calculated there is usually no regard taken (likely because of the unknown nature of the reaction) to competitive reactions against diversionary spending. In addition, the relatively short-term nature of arts festivals and potentially long term nature of injections to the economy, can complicate the attribution of benefits and hence accuracy of the tables and resultant economic analyses. This problem can sometimes be mitigated by calculating a two-stage impact analysis, the first taking account of the short-term effects of the immediate infrastructure investment and direct spending and a second taking account of the longer term effects. Long & Owen (2006) offer a succinct list of identified methodological difficulties:
distinguishing between visitors and residents in festival audiences
Impacts 08 - ULMS | Economic Impacts of the ECoC | October 2008
33 Impacts 08 - The Liverpool Model, European Capital of Culture Research Programme
www.impacts08.net
disaggregating and allocating visitor spending in the area economy defining expenditure that is retained in the area economy estimating expenditure that is displaced from other sectors of the local economy during a festival identifying a festival's external costs
Economic multipliers also need to reflect the characteristics of the economies in which the research is being done. Although tabulations may be regional, not all money spent as a result of the initial investment will circulate within the regional economy - a certain amount of “leakage” of money spent outside of the local economy will occur. In order for the tabulations to be accurate, this needs to be recognised and if regional tabulations don‟t allow for this (as noted in sections 2.6 and 3.1 - with the addition of in-flows and out-flows i.e. regional imports and exports), this should be flagged up. The question should also be asked – if an economic impact (multiplier) is a full assessment of the impact of arts and cultural programming? There is no assessment made in the model for the economic impact of say a reduction in crime – it may represent a shift in the type of expenditure from say insurance premiums to other expenditure, but does not provide a measure of the satisfaction gained from the switch, nor does it evaluate the sense of value derived by citizens from greater social cohesion. Hughes (1989) for example has argued that the definition adopted in the Myerscough (1988a,b,c) studies is too broad and “…makes little sense in economic terms…”, He emphasised that when research is used as the basis for policy evaluation it needs to capture measurements of benefits that are not normally reflected in market transactions – i.e. impact on the enjoyment, appreciation, and human capital of participants, and on those whom they influence (the cultural impact). There are other measures of impact however, which do attempt to evaluate a full “basket” of effects. The contingent valuation method for valuing non fully tangible goods can evaluate the full spectrum of the end consumer experience of a good by setting up a hypothetical market in which the subjects are persuaded to reveal what their willingness to pay for the good would be should it be in a tangible market (see Cuccia (2003). Such an evaluation could provide a useful alternative perspective to that of the economic multiplier in allowing such intangibles to be formulated in monetary (and therefore comparable) terms. As mentioned above – enumeration of an economic multiplier may not be able to fully account for the accumulation of social and cultural capital either in the immediate term or the longer term and therefore some other method of accounting for this should be considered. Jeannotte (2001) offered a proxy measure of “social capital” through measurement of membership of groups which participate in the arts and cultural activity and the Arts Council of England have subsequently commissioned research which has used this proxy measure to estimate gains to cultural capital (for example see Skelton et al, 2002). Finally, strong consideration of the aforementioned Green Book guidelines would suggest that consideration should be given to as yet unvalued (additional) benefits that could make an event worthwhile despite the cost. (See ODPM 2003). These benefits include notional valuations based on, for example, exposure achieved from media coverage as well as associated “place marketing” effects which may in turn encourage future tourism, or the attraction and/ or accumulation of cultural capital within an area. This is sometimes referred to as a “Balanced Scorecard” approach to event evaluation.
6. Applying multiplier modelling to 2008
In applying the modelling technique of Input-Output analysis to derive a multiplier value for the 2008 European Capital of Culture status and program there are effectively two choices – the first is to use current “off the shelf” modelling packages which can be set up to calculate the impact and the second is to specifically develop a model.
Impacts 08 - ULMS | Economic Impacts of the ECoC | October 2008
34 Impacts 08 - The Liverpool Model, European Capital of Culture Research Programme
www.impacts08.net
The former would be the most cost effective method, with several private consulting firms able to offer this service. The second, to develop a model would require substantially more resources and would be best undertaken by a body which has experience in developing such models. In this respect, the developments of multiplier models of higher education institutions provides a similar recent model development on which the development of a Capital of Culture impact model could be developed. In either case the most likely difficulty in applying the technique to find a relevant “multiplier” value for the Capital of Culture is collecting the right kind of information. Relevant output information can be aggregated from regional statistics and input information concerning households estimated from aggregates of wages and profit to the household sector. Crucial to the calculation will be the choice (and / or) calculation of technical and inter-dependence coefficients used in multiplying out the transactions tables. For those purposes, there are a number of coefficients that are currently produced by relevant central statistical authorities for both Region and Industry that could be used (see studies in the case study tables 1-3 which refer to centrally determined coefficient e.g. SQW Ltd 2006). Mahajan (2004) shows the sourcing of Input-Output estimates from the Office of National Statistics for the creative sector for 1992-2002. The office of National Statistics also supplies full information on the methodology of their Input-Output estimates (Mahajan (1997)) as well as its full compliment of Input-Output tables for the UK sector downloadable from its website (www.statistics.gov.uk).
7. Conclusions & Recommendations
As part of an in-depth analysis of the economic impacts of the 2008 European Capital of Culture year, an application of Input-Output analysis and enumeration of relevant multipliers would provide a valuable intelligence. The use of existing off the shelf programs is not recommended as the results gained will vary greatly with the input parameters and this will be compounded by the fact that it is based around generic conditions. It would be preferable to undertake a calculation of an Input-Output analysis based on the best practice of studies which have been implemented in similar regions. For this, the use of methodology of the Myserscough reports detailed in the case study tables 1-3, as well as the impact of theatres and the impact of museums reports detailed in the case study tables 1-3 is recommended as a starting point, as is the methodology of creating the Input-Output tables in the Universities model. The development of an Input-Output analysis needs to take account of the methodological limitations identified and as such again look to the best practice case studies denoted above. In addition, the calculation of individual multipliers should be made explicit along with the theoretical framework and assumptions. The sourcing of data used in the Input-Output analysis should also be considered carefully and any estimations and assumptions justified. In summary, the enumeration of multipliers can add to the evaluation of impact, but should not be considered in isolation, other methods of impact assessment that can take account of hidden value should be developed in companion to and in contrast to multiplier analysis.
Impacts 08 - ULMS | Economic Impacts of the ECoC | October 2008
35 Impacts 08 - The Liverpool Model, European Capital of Culture Research Programme
www.impacts08.net
8. References
Allen, K. and Shaw, P. (2000) „Festivals Mean Business: The Shape of Arts Festivals in the UK‟. British Arts Festivals Association
Allen, K. and Shaw, P. (2002) „Festivals Mean Business II: The Shape of Arts Festivals in the UK, 2002 update‟. British Arts Festivals Association
Alliance for the Arts (1993) „The Economic Impact of Major Exhibitions at the Metropolitan Museum of Art, the Museum of Modern Art, the Solomon R. Guggenheim Museum‟. Alliance for the Arts, New York
Alliance for the Arts (1997) ‘The Economic Impact of the Arts on New York City and New York State’, Alliance for the Arts, New York
Americans for the Arts (2006) „The arts: a driving force in Minnesota's economy‟ Minnesota Citizens for the Arts (MCA)
Armstrong, H & Taylor J (2000) „Regional Economics and Policy (Third Edition)‟, Blackwell Publishing, UK
Arts Council England (2004) „The impact of the arts: Some research evidence‟, Arts Council England, May 2004, UK
Arts Council England & Arts Council Wales (2004) „Making it in the 21st century. A socio-economic survey of craft activity in England and Wales, 2002-03‟ Arts Council England & Arts Council Wales
Association of Festival Organisers (2003) „A report on the impact of folk festivals on cultural tourism‟, Association of Festival Organisers
Association of Festival Organisers (2004) „The Impact of Folk Festivals‟, Association of Festival Organisers
Bretton Hall (1999) „Cultural industry baseline study: Yorkshire and Humber region’; Bretton Hall, Leeds
Brookes, F. & Wood, P. (2001) „East Midlands Creative Industries Study‟. Comedia, Stroud
Burghes, D.N. & Wood, A.D. (1980) „Mathematical Models in the Social, Management & Life Sciences’, Ellis Horwood, UK
Casey, B, R Dunlop and S Selwood (1996) „Culture as Commodity? The Economics of the Arts and Built Heritage in the UK‟, Policy Studies Institute, London
Carter, H.O. & Heady, E.O. (1959) „An Input-Output analysis emphasising Regional and commodity sectors of agriculture‟ Agricultural and home economics experimental station, Iowa State University, Research Bulletin No 469
Cote, S. and Healy, T. (2001) „The well being of nations. The role of human and social capital‟. Organisation for economic Co-operation and Development, Paris
Create (2005) ‘Festivals and Events in North Yorkshire: Developing the Sector’, CREATE
Crewe, L. and Beaverstock, J. (1998) 'Fashioning the City: Cultures of consumption in contemporary urban spaces', Geoforum 29, pp.1287-308
Cuccia, T (2003) „Contingent Valuation‟ in „A Handbook of Cultural Economics‟ Towse, R (Ed) Edward Elgar Publishing, UK
DCMS (1998) „Creative Industries Mapping Document‟. DCMS, London
DCMS, (2004a) „DCMS Evidence Toolkit‟, DET (formerly the Regional Cultural Data Framework).
DCMS, (2004b), „Culture at the Heart of Regeneration, Consultation Report‟, DCMS, UK
DiNoto, M.J. and Merk, L.H. (1993) „Small economy impacts of the arts‟, Journal of Cultural Economics, volume 17 number 3, pp 41-53
Evans, G.L. (1997) „Study into the Employment Effects of Arts Lottery Spending in England‟, Arts Council of England Research Report No. 14. London, ACE
Evans & Shaw (2004) „The contribution of culture to regeneration in the UK: A review of evidence‟. Report to the Department for Culture, Media and Sport, DCMS, UK
Impacts 08 - ULMS | Economic Impacts of the ECoC | October 2008
36 Impacts 08 - The Liverpool Model, European Capital of Culture Research Programme
www.impacts08.net
Gateshead Council (1992) „Urban regeneration through the arts‟, Gateshead Council.
Gould, H (2001) „Culture and social capital‟. In: „Recognising culture‟, Matarasso (ed), Comedia.
Harmston, F.K. & Lund, R.E (1967) ‘Application of an input-output framework to a community economic system’
Hughes, G (1989) „Measuring the economic value of the arts‟, Policy Studies, Spring, volume 9 number 3, pp 33-45.
Isard, Walter (1953) „Regional Commodity Balances and Inter-Regional Commodity Flows‟, American Economic Review, Papers and Proceedings 43, pp167-180, May 1953.
Isard, Walter et al., (1960) „Methods of Regional Analysis: An Introduction to Regional Science‟, MIT Press.
Jeannotte, M.S. (2001) „Singing alone? The contribution of cultural capital to social cohesion and sustainable communities‟ in Proceedings of the Second International Conference on Cultural Policy Research, Victoria University, Wellington, New Zealand
Johnson, P.S. and R.B Thomas (1992) „Tourism, Museums and the Local Economy‟. Aldershot: Edward Elgar
Johnson, P.S. & Thomas, R.B. (2001) ‘The economic impact of the arts: a critique’. In „The UK Cultural Sector‟ Selwood, S. (Editor) Policy Studies Institute, London, pp 202-215
Kahn, R.F. (1931) „The relation of home investment to employment‟, Economic Journal, June 1931
Keynes, J,M (1936) „General theory of Employment, Interest and Money‟, Palgrave Macmillan, UK
Kurz, H.D; Dietzenbacher, E; Lager, C (1998) „Input-Output Analysis’, The International Library of Critical Writings in Economics 92, Volumes I – III‟, Elgar Reference, UK
Landry, C, Green, L, Matarasso, F and Bianchini, F (1996) „The Art of Regeneration: Urban renewal through cultural activity‟, Comedia, Stroud.
Leontief, Wassily (1936) „Quantatative Input-Output relations in the economic system of the United States‟ in Review of Economics and Statistics XVIII (3), pp105-25
Leontief, Wassily (1953) „Studies in the structure of the American Economy‟ Oxford University Press XVIII (3), pp105-25
Leontief, Wassily W (1986) ‘Input-Output Economics. 2nd ed., New York: Oxford University Press,
Liverpool Culture Co (2003) ‘European Capital of Culture 2008 Socio-Economic Impact Assessment of Liverpool's Bid’ Liverpool Culture Co , Liverpool
London Development Agency (2003) ‘The Economic Impact of the Notting Hill Carnival’, London Development Agency
Long, Philip & Owen, Elizabeth (2006) ‘The arts festival sector in Yorkshire; economic, social and cultural benefits, benchmarks and development’
Madden, Christopher (2001) „Using ‘Economic’ Impact studies in Arts & Cultural Advocacy: A Cautionary Note‟, Media International Australia incorporating Culture and Policy, No 98, Feb 2001, Australia
Mahajan, Sanjiv (2004) „Input–Output Analyses: Creative sector, 1992–2002‟, Office for National Statistics, Economic Trends 611, October 2004.
Mahajan, Sanjiv (1997) „Input–Output: Methodological Guide 1997 Edition‟, Office for National Statistics, London.
Maughan, Christopher & Bianchini, Franco (2004) „The Economic and Social Impact of Cultural Festivals in the East Midlands of England‟, East Midlands Development Agency
McKinsey and Company (2001) „The economic impact of Tate Modern‟. Executive Summary, www.tate.org.uk/home/news/110501_3.htm
McManus, C (2002) „Fewer than six: a study of creativity in regeneration in Yorkshire and the Humber‟, Yorkshire Arts
Moriarty, G and McManus, C (2003) „Releasing potential: creativity and change – arts and regeneration in England’s North West‟. Arts Council England, UK
Impacts 08 - ULMS | Economic Impacts of the ECoC | October 2008
37 Impacts 08 - The Liverpool Model, European Capital of Culture Research Programme
www.impacts08.net
Miller, R.E. & Blair, P. D. (1985) „Input-Output Analysis, Foundations and Extensions‟, Prentice-Hall, New-Jersey
Miller, R; Karen, E; Polenske, R & Rose, A.Z. (Eds.) (1989) ‘Frontiers of Input-Output Analysis‟. Oxford UP, N.Y. [HB142 F76 1989/ Suzz]
Mitchell, C.J.A. (1993) „Economic impact of the arts: theatre festivals in small Ontario Communities‟, Journal of Cultural Economics, volume 17 number 2, pp 55-69
Moore, F.T. & Peterson, J.W. (1955) „Regional Analysis: An Inter-Industry Model of Utah‟ Review of Economics and Statistics, Vol 37, pp368-83
Myerscough (1988a) „The Economic Importance of the Arts in Britain‟, London: Policy Studies Institute
Myerscough, J (1988b) „The Economic Importance of the Arts in Glasgow‟, London: Policy Studies Institute
Myerscough, J (1988c) „The Economic Importance of the Arts in Ipswich‟, London: Policy Studies Institute
Myerscough, J (1988d) „The Economic Importance of the Arts in Merseyside‟, London: Policy Studies Institute
Myerscough, J. (1991) „Monitoring Glasgow 1990‟. Report for Glasgow City Council, Strathclyde Regional Council and Scottish Enterprise.
Myerscough, J (1996) „The Arts and the Northern Ireland Economy‟. Northern Ireland Development Office, Belfast
National Museums Directors Conference (NMDC) (2004) ‘Valuing Museums’, NMDC, London
O‟Connor, R & Henry, E.W (1975) „Input-Output Analysis and it‟s applications‟, Charles Griffin & Co, UK
O‟Hagan, J (1992) „The Wexford Opera Festival: a case for public funding?‟. In „Cultural Economics‟, Towse, R & Khakee, A (Eds), pp 61-66, Springer-Verlag Berlin
ODPM (2003) „Assessing the Impacts of Spatial Interventions. Regeneration, Renewal and Regional Development. Main Guidance‟, Office of the Deputy Prime Minister (Consultation, April), London
Polenske, Karen (1976) ‘Advances in Input-Output Analysis’
Quesnay, Francoise (1758) „Tableau economique‟, 2 vols,Institut Nationale d‟Etudes Demographiques, Paris
Rappoport, P. N.; Rodenrys, K. J. & Savitt, J. H. (1979) „Energy Consumption in the Transportation Services Section, research for the Electric Power Research Institute’
Reeves, Michelle (2002) „Measuring the economic and social impact of the arts: a review‟ Arts Council England
Rose, A & Miernyk, W (1989) „Input-Output analysis
Schumann, J (1968) „Input-Output Analyse‟, Berlin, Springer (TEXTBOOK)
Seaman, B,A, (2003) ‘Economic Impact of the Arts’. In ‘A Handbook of Cultural Economics’ 2003, ed Towse, R, pp 43-76.
Shellard, D (2004) „Economic impact study of UK theatre‟, Arts Council England, UK
Shellard, Dominic (2005) „West Midlands theatre - an economic success story‟ Arts Council England
Shaw, P, (1995) Changing Places: The arts in Scotland‟s urban areas, Scottish Office/Scottish Arts Council, Edinburgh, (Lit review on econ impact arts)
Shaw, P, (1999) The Arts and Neighbourhood Renewal, A Literature Review to inform the work of Policy Action Team 10, DCMS
Shaw, P. (2003) „Regeneration, Community Facilitation and Social Inclusion: The Role of Cultural Activity‟. Report to the Government Office of Yorkshire & the Humber and also to Yorkshire Culture
Skelton, A. et al. (2002) „Arts in England: attendance, participation and attitudes in 2001‟. Arts Council of England, London
Sohn, I (1986) „Readings in Input-Output Analysis: Theories and Applications‟, Oxford University Press, NY
South West Museums Council (2000) „The Economic Contribution of Museums in the South West‟, South West Museums Council, Taunton
Impacts 08 - ULMS | Economic Impacts of the ECoC | October 2008
38 Impacts 08 - The Liverpool Model, European Capital of Culture Research Programme
www.impacts08.net
SQW (2005) „Edinburgh’s year round festivals 2004/05 Economic Impact Study‟, Report to The City of Edinburgh Council, Scottish Enterprise Edinburgh and Lothian, EventScotland & VisitScotland
Strathclyde University (2005) „The economic impact of UK Higher education institutions‟, Universities UK
Travers, T. (2006) „Museums and Galleries in Britain: Economic, Social and Creative Impacts‟, Report by London School of Economics for Museums, Libraries and Archives (MLA) and National Museums Directors‟ Conference (NMDC).
Sports Industry Research Centre, Sheffield University (2004) „Measuring Success 2: The Economic Impact of Major Sports Events‟, UK Sports, London.
US Department of Commerce, Bureau of Economic Analysis (1997) „Regional multipliers: A user handbook for regional input-output modeling system (RIMS II)‟. Third edition. Washington, D.C.: U.S. Government Printing Office.
Van Puffelen, F. (1996) „Abuses of conventional impact studies in the arts‟, Cultural Policy, volume 2 number 2, pp 241-254
Walras, Leon (1954), „Elements of Pure Economics‟ W. Jaffi Co, Illinois, USA
Welsh Economy Research Unit (1998) „The Economic Impact of the Arts and Cultural Industries in Wales‟, Welsh Economy Research Unit, Business School Cardiff
West Country Tourist Board (1996) „Tate Gallery St Ives 1994/5. Visitor Survey‟, West Country Tourist Board, Exeter
Zivan, L. and Truscott, R. (1999) „The Economic Impact of Duxford Imperial War Museum on Cambridge and the Region‟, Judge Institute of Management Studies. Cambridge University. Cambridge
Web References: The Arts Council of the UK: www.artscouncil.org.uk The Arts Impact Database: www.impact.arts.gla.ac.uk The Office for National Statistics: www.statistics.gov.uk Input Output Tables and coefficients for Scotland: http://www.scotland.gov.uk/Topics/Statistics/Browse/Economy/Input-Output/Downloads Minesota IMPLAN Group: http://www.implan.com/ The New Economic Foundation (Providers of the LM3 toolkit): www.Neweconomics.org The NorthWest Culture Observatory: www.northwestcultureobservatory.org.uk UKSport (2008) http://www.uksport.gov.uk/pages/economic_impact_of_major_sports_events/
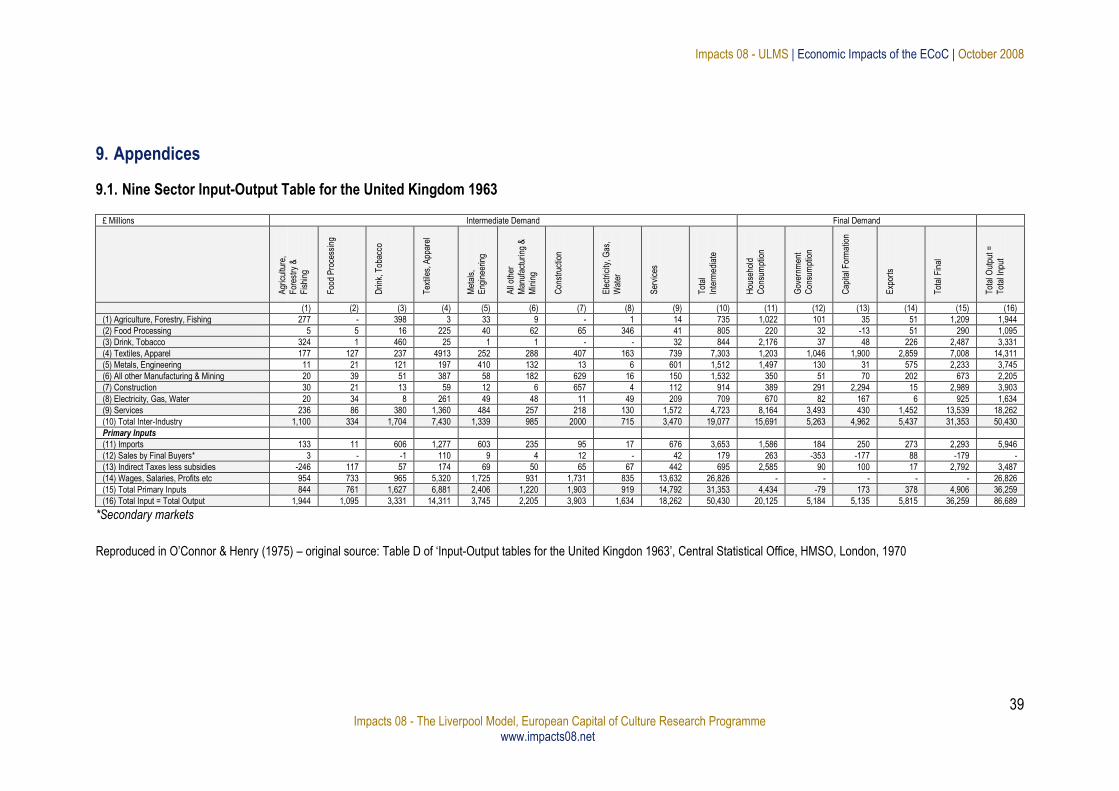
Impacts 08 - ULMS | Economic Impacts of the ECoC | October 2008
39 Impacts 08 - The Liverpool Model, European Capital of Culture Research Programme
www.impacts08.net
9. Appendices
9.1. Nine Sector Input-Output Table for the United Kingdom 1963
*Secondary markets
Reproduced in O‟Connor & Henry (1975) – original source: Table D of „Input-Output tables for the United Kingdon 1963‟, Central Statistical Office, HMSO, London, 1970
£ Millions Intermediate Demand Final Demand
Agr
icul
ture
,
For
estr
y &
F
ishi
ng
Foo
d P
roce
ssin
g
Drin
k, T
obac
co
Tex
tiles
, App
arel
Met
als,
E
ngin
eerin
g
All
othe
r
Man
ufac
turi
ng &
M
inin
g
Con
stru
ctio
n
Ele
ctric
ity, G
as,
Wat
er
Ser
vice
s
Tot
al
Inte
rmed
iate
Hou
seho
ld
Con
sum
ptio
n
Gov
ernm
ent
Con
sum
ptio
n
Cap
ital F
orm
atio
n
Exp
orts
Tot
al F
inal
Tot
al O
utpu
t =
Tot
al In
put
(1) (2) (3) (4) (5) (6) (7) (8) (9) (10) (11) (12) (13) (14) (15) (16)
(1) Agriculture, Forestry, Fishing 277 - 398 3 33 9 - 1 14 735 1,022 101 35 51 1,209 1,944
(2) Food Processing 5 5 16 225 40 62 65 346 41 805 220 32 -13 51 290 1,095
(3) Drink, Tobacco 324 1 460 25 1 1 - - 32 844 2,176 37 48 226 2,487 3,331
(4) Textiles, Apparel 177 127 237 4913 252 288 407 163 739 7,303 1,203 1,046 1,900 2,859 7,008 14,311
(5) Metals, Engineering 11 21 121 197 410 132 13 6 601 1,512 1,497 130 31 575 2,233 3,745
(6) All other Manufacturing & Mining 20 39 51 387 58 182 629 16 150 1,532 350 51 70 202 673 2,205
(7) Construction 30 21 13 59 12 6 657 4 112 914 389 291 2,294 15 2,989 3,903
(8) Electricity, Gas, Water 20 34 8 261 49 48 11 49 209 709 670 82 167 6 925 1,634
(9) Services 236 86 380 1,360 484 257 218 130 1,572 4,723 8,164 3,493 430 1,452 13,539 18,262
(10) Total Inter-Industry 1,100 334 1,704 7,430 1,339 985 2000 715 3,470 19,077 15,691 5,263 4,962 5,437 31,353 50,430
Primary Inputs
(11) Imports 133 11 606 1,277 603 235 95 17 676 3,653 1,586 184 250 273 2,293 5,946
(12) Sales by Final Buyers* 3 - -1 110 9 4 12 - 42 179 263 -353 -177 88 -179 -
(13) Indirect Taxes less subsidies -246 117 57 174 69 50 65 67 442 695 2,585 90 100 17 2,792 3,487
(14) Wages, Salaries, Profits etc 954 733 965 5,320 1,725 931 1,731 835 13,632 26,826 - - - - - 26,826
(15) Total Primary Inputs 844 761 1,627 6,881 2,406 1,220 1,903 919 14,792 31,353 4,434 -79 173 378 4,906 36,259
(16) Total Input = Total Output 1,944 1,095 3,331 14,311 3,745 2,205 3,903 1,634 18,262 50,430 20,125 5,184 5,135 5,815 36,259 86,689
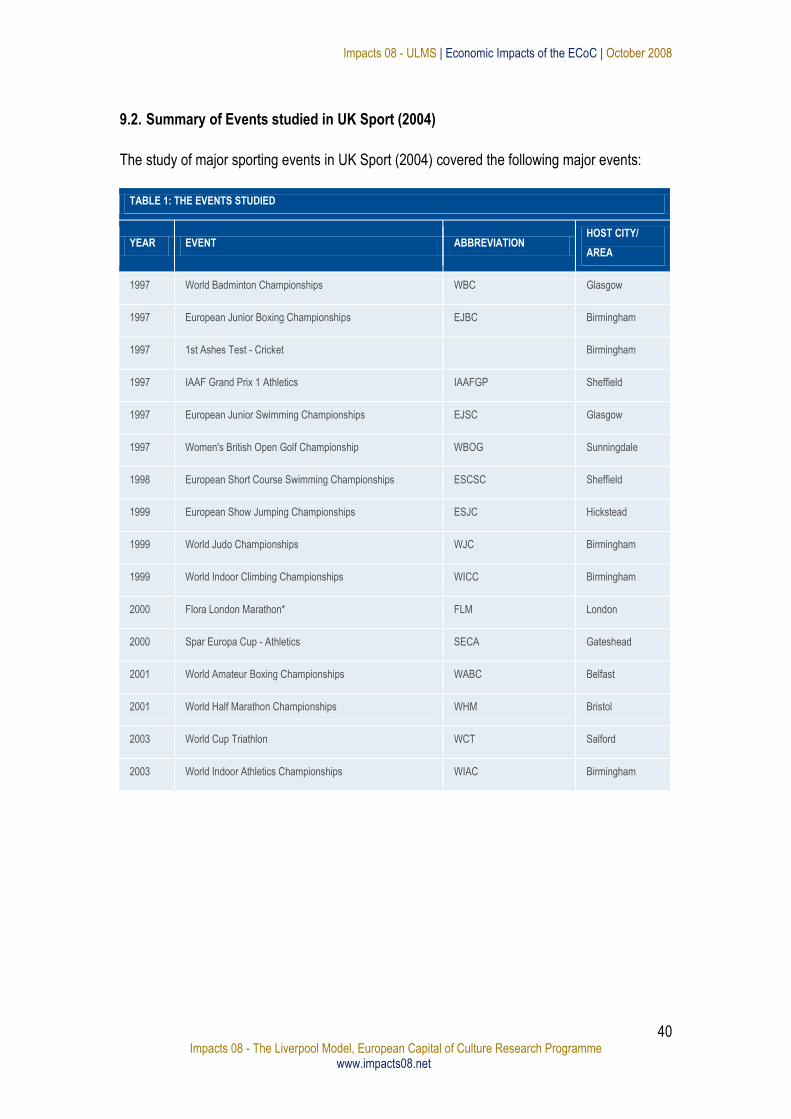
Impacts 08 - ULMS | Economic Impacts of the ECoC | October 2008
40 Impacts 08 - The Liverpool Model, European Capital of Culture Research Programme
www.impacts08.net
9.2. Summary of Events studied in UK Sport (2004)
The study of major sporting events in UK Sport (2004) covered the following major events:
TABLE 1: THE EVENTS STUDIED
YEAR EVENT ABBREVIATION HOST CITY/
AREA
1997 World Badminton Championships WBC Glasgow
1997 European Junior Boxing Championships EJBC Birmingham
1997 1st Ashes Test - Cricket Birmingham
1997 IAAF Grand Prix 1 Athletics IAAFGP Sheffield
1997 European Junior Swimming Championships EJSC Glasgow
1997 Women's British Open Golf Championship WBOG Sunningdale
1998 European Short Course Swimming Championships ESCSC Sheffield
1999 European Show Jumping Championships ESJC Hickstead
1999 World Judo Championships WJC Birmingham
1999 World Indoor Climbing Championships WICC Birmingham
2000 Flora London Marathon* FLM London
2000 Spar Europa Cup - Athletics SECA Gateshead
2001 World Amateur Boxing Championships WABC Belfast
2001 World Half Marathon Championships WHM Bristol
2003 World Cup Triathlon WCT Salford
2003 World Indoor Athletics Championships WIAC Birmingham