Embed Size (px)
Citation preview

Ž .International Journal of Food Microbiology 69 2001 209–215www.elsevier.comrlocaterijfoodmicro
Considering uncertainty in comparing the burden of illness due tofoodborne microbial pathogensq
Mark Powell a,), Eric Ebel b, Wayne Schlosser c
a Office of Risk Assessment and Cost Benefit Analysis, U.S. Department of Agriculture, SW 5248 S. Ag. Bldg., 1400 Independence AÕe.,Washington, DC 20250, USA
b USDA Food Safety and Inspection SerÕice, Ft. Collins, CO, USAc USDA Food Safety and Inspection SerÕice, College Station, TX, USA
Received 7 October 2000; received in revised form 2 February 2001; accepted 20 February 2001
Abstract
The uncertainty attendant to burden-of-illness estimates should be taken into account in comparing the public healthimpact of different foodborne pathogens. In this paper, decision analysis concepts are applied to the comparisons ofpathogen-specific burden-of-illness estimates. In situations wherein the magnitude of uncertainty varies, the rank order ofpathogen-specific burden-of-illness estimates is sensitive to the decisional criteria applied. To illustrate the magnitude ofattendant uncertainty in pathogen-specific foodborne-illness estimates, probabilistic risk assessment methods are used tocharacterize the uncertainty regarding the burden of illness due to Escherichia coli O157:H7. The magnitude of uncertaintyabout the burden of food-related illness due to E. coli O157:H7 is substantial, ranging from less than 50,000 to more than120,000 casesryear. This example underscores the importance of considering the uncertainty attendant to burden-of-illnessestimates in comparing the public health impacts of different pathogens. Although some would argue that the expected valueof the number of illnesses provides the Abest estimateB for decision-making, this merely reflects a decision-making rule ofconvention and not a scientific truism. Published by Elsevier Science B.V.
Keywords: Comparative risk assessment; Uncertainty; E. coli O157:H7
q Disclaimer: The opinions expressed herein are the views ofthe authors and do not necessarily reflect the official policy orposition of the U.S. Department of Agriculture. Reference hereinto any specific commercial product, process, or service by tradename, trademark, manufacturer, or otherwise, does not necessarilyconstitute or imply the endorsement, recommendation, or favo-rance by the United States government.
) Corresponding author. Tel.: q1-202-720-9786; fax: q1-202-720-4240.
Ž .E-mail address: [email protected] M. Powell .
1. Introduction
Comparative risk is defined as any comparisonamong the risks of two or more hazards with respect
Ž .to a common scale Society for Risk Analysis, 2001 .Comparative risk assessment is an analytic-delibera-tive process used to systematically measure, charac-terize, compare, and rank different hazards to informvalue-laden risk management decision-making under
Žscientific uncertainty National Research Council,.1996 .
0168-1605r01r$ - see front matter. Published by Elsevier Science B.V.Ž .PII: S0168-1605 01 00495-0

( )M. Powell et al.r International Journal of Food Microbiology 69 2001 209–215210
Ž .Recently, Mead et al. 1999 undertook the enor-mous and commendable task of estimating the over-all burden of foodborne disease in the United States.The burden of illness due to foodborne pathogenswas quantified in terms of the annual number ofillnesses, hospitalizations, and deaths. From theviewpoint of risk analysts concerned with food safetyregulatory decision-making, such data and analysishave manifold uses. For example, the U.S. Depart-ment of Agriculture Food Safety and Inspection Ser-vice is currently employing much of the data un-derlying the estimated burden of illness due toEscherichia coli O157:H7, as well as other epidemi-ologic data, in developing a farm-to-table processrisk model for E. coli O157:H7 in ground beef.
The pathogen-specific estimates of foodborne dis-ease are also particularly useful to consider in mak-ing resource allocation decisions and setting the riskassessment agenda. However, the priority assigned toa pathogen depends upon a number of factors, in-cluding the metric used to estimate public health
Ž .impact. Table 1 was derived from Mead et al. 1999and lists the top three-ranked pathogens for theannual number of foodborne illnesses, hospitaliza-tions, and deaths. Note that the pathogen rankings inTable 1 vary depending on health outcome measure.Consequently, using a common metric such as Qual-
Ž .ity Adjusted Life Years QALY’s or Disability Ad-Ž .justed Life Years DALY’s is conceptually appeal-
ing for the purpose of comparing food safety risks.ŽQALY’s and DALY’s combine duration of lifeŽ .quantitative dimension and health-related quality of
Ž .life qualitative dimension into a single public health.measure. There are certainly other relevant factors,
however, that need to be taken into account in settingpublic health priorities and regulatory agendas in-
Fig. 1. A comparison of uncertainties of three pathogens.
cluding the feasibility and cost-effectiveness of pre-ventive measures, legal authorities under the opera-tive statutes, and the economic costs associated with
Ž .the burden of illness Buzby and Roberts, 1997 .Another factor that needs to be considered in
comparing risks from different sources is the uncer-tainty attendant to the risk estimates. Comparingrisks on the basis of point estimates may omit infor-mation relevant to the decision. Consider the hypo-thetical scenario shown in Fig. 1, wherein the mini-mum, most likely, and maximum estimates of theannual number of illnesses are presented for threepathogens. The pathogen assigned the highest prior-ity depends on the decisional criterion employed.Pathogen A maximizes the most likely estimate ofthe number of illnesses. Pathogen B maximizes thelower-bound estimate. Pathogen C maximizes theupper-bound estimate. Although some may arguethat the expected value of the number of illnessesprovides the Abest estimateB for decision-making,this merely represents a conventional rule and not ascientific truism.
A specific example illustrates how the applicationof probabilistic methods to available epidemiologic
Table 1Top-ranked foodborne pathogens in terms of illness, hospitalization, and deatNote: percentage of total foodborne illnesses attributed to the pathogen is presented in parentheses.
Pathogen Illness Hospitalization Death
Ž . Ž . Ž . Ž .Salmonella non-typhoidal 3 10% 2 26% 1 31%Ž .Listeria monocytogenes 2 28%
Ž . Ž .Campylobacter 2 14% 3 17%Ž . Ž .Norwalk-like viruses 1 67% 1 33%
Ž .Toxoplasma gondi 3 21%
( )M. Powell et al.r International Journal of Food Microbiology 69 2001 209–215 211
data can readily generate a more robust estimate ofthe burden of illness due to a particular pathogenwith attendant uncertainty. In the following example,FoodNet surveillance and other epidemiologic dataare used to characterize the uncertainty about theannual number of cases of E. coli O157:H7 in theUS.
2. Methods
The analysis begins with the reported population-based rate in the five original FoodNet catchmentareas during 1996–1998. The crude average rateacross the five sites during 1996–1998 ranged from
Ž2.3 to 2.8 casesr100,000 person-years Centers for.Disease Control and Prevention, 1999a . A cluster-
weighted average was used to extrapolate to theŽnational level i.e., the rate reported in each of the
sites was weighted by the population of the state in.which the site is located . Consequently, the rate
reported from the catchment area in a large state likeCalifornia is given greater weight than the rate in astate like Minnesota, which has a smaller population.It is appropriate to use a cluster-weighted average toextrapolate to the national level, but doing so doesnot necessarily imply a correction for a hypothesized
ŽAnorthern-tierB effect i.e., that the rate of illnessfrom E. coli O157:H7 is correlated with northern
.latitudes . It seems equally plausible, for example, tohypothesize a state-level effect in the active surveil-lance system. In comparison to the crude rates, thepopulation-based rates of reported E. coli O157:H7illness for the five original FoodNet sentinel sites for
Ž .1996–1998 weighted by cluster state size are esti-mated to be 2.04, 1.25, and 1.51r100,000 person-
Žyears Hedberg et al., 1997; U.S. Census Bureau,2000a; U.S. Department of Agriculture, 1997, 1998,
. Ž1999 . Preliminary FoodNet data for 1999 havebeen reported indicating that the crude average rateacross the five original sites during 1999 was 2.1
Žcasesr100,000 person-years Centers for Disease.Control and Prevention, 2000 , but the summary data
presented are insufficiently disaggregated to update.the present analysis.
To represent the annual variability in the numberof reported cases, the cluster-weighted rates from
Žthe 1996–1998 surveillance 2.04, 1.25, and 1.51
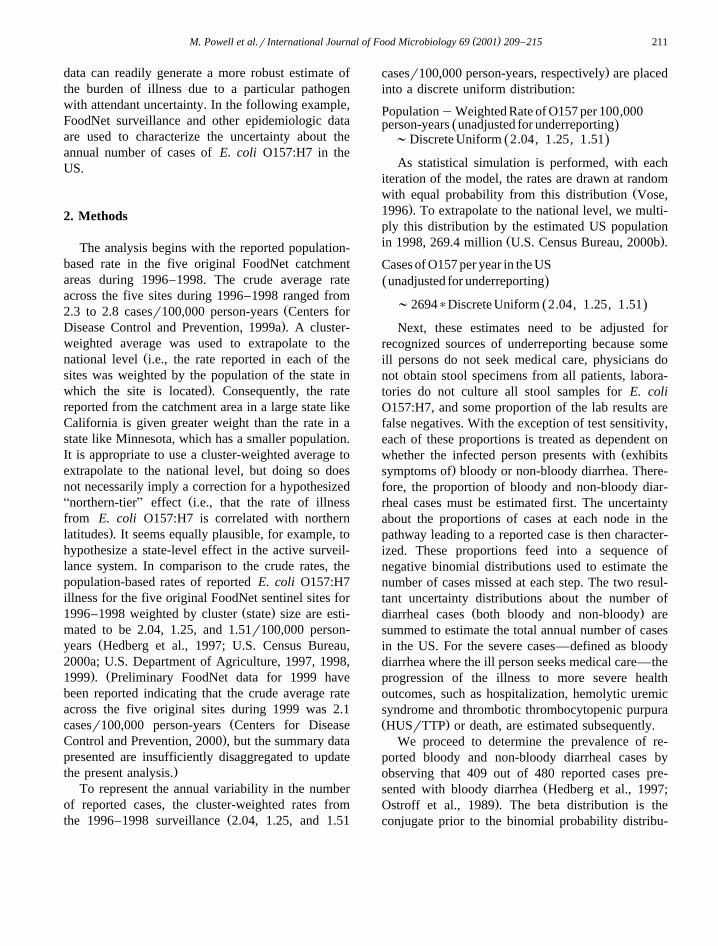
.casesr100,000 person-years, respectively are placedinto a discrete uniform distribution:
PopulationyWeighted Rate of O157 per 100,000person-years unadjusted for underreportingŽ .;Discrete Uniform 2.04, 1.25, 1.51Ž .As statistical simulation is performed, with each
iteration of the model, the rates are drawn at randomŽwith equal probability from this distribution Vose,
.1996 . To extrapolate to the national level, we multi-ply this distribution by the estimated US population
Ž .in 1998, 269.4 million U.S. Census Bureau, 2000b .
Cases of O157 per year in the USunadjusted for underreportingŽ .;2694)Discrete Uniform 2.04, 1.25, 1.51Ž .Next, these estimates need to be adjusted for
recognized sources of underreporting because someill persons do not seek medical care, physicians donot obtain stool specimens from all patients, labora-tories do not culture all stool samples for E. coliO157:H7, and some proportion of the lab results arefalse negatives. With the exception of test sensitivity,each of these proportions is treated as dependent on
Žwhether the infected person presents with exhibits.symptoms of bloody or non-bloody diarrhea. There-
fore, the proportion of bloody and non-bloody diar-rheal cases must be estimated first. The uncertaintyabout the proportions of cases at each node in thepathway leading to a reported case is then character-ized. These proportions feed into a sequence ofnegative binomial distributions used to estimate thenumber of cases missed at each step. The two resul-tant uncertainty distributions about the number of
Ž .diarrheal cases both bloody and non-bloody aresummed to estimate the total annual number of casesin the US. For the severe cases—defined as bloodydiarrhea where the ill person seeks medical care—theprogression of the illness to more severe healthoutcomes, such as hospitalization, hemolytic uremicsyndrome and thrombotic thrombocytopenic purpuraŽ .HUSrTTP or death, are estimated subsequently.
We proceed to determine the prevalence of re-ported bloody and non-bloody diarrheal cases byobserving that 409 out of 480 reported cases pre-
Žsented with bloody diarrhea Hedberg et al., 1997;.Ostroff et al., 1989 . The beta distribution is the
conjugate prior to the binomial probability distribu-
( )M. Powell et al.r International Journal of Food Microbiology 69 2001 209–215212
tion and is therefore often used to describe uncer-Ž .tainty about proportions Vose, 1996 . Therefore,
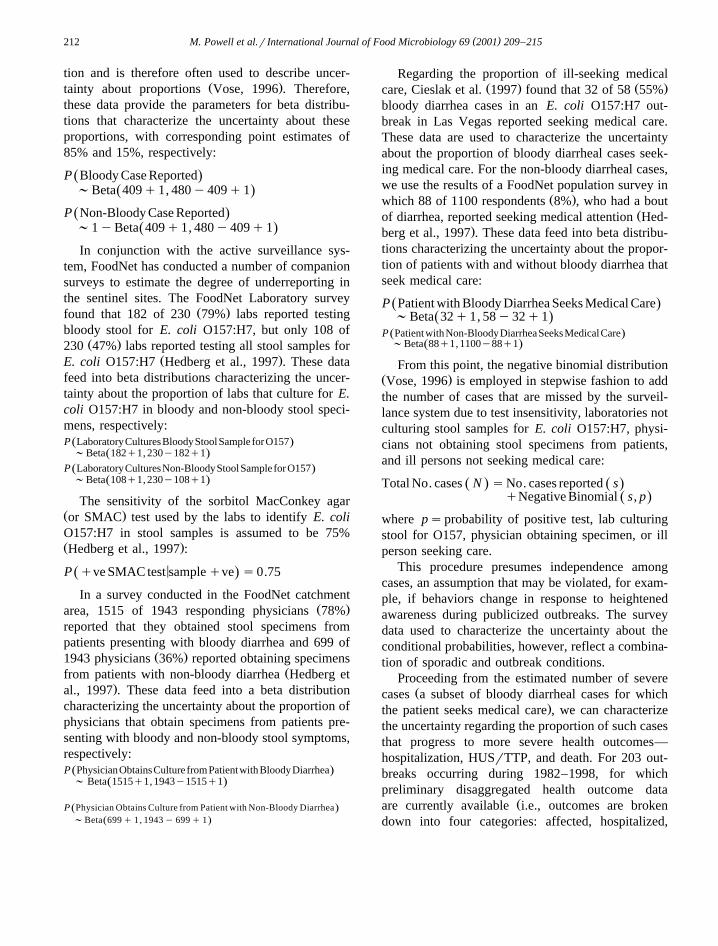
these data provide the parameters for beta distribu-tions that characterize the uncertainty about theseproportions, with corresponding point estimates of85% and 15%, respectively:
P Bloody Case ReportedŽ .;Beta 409q1, 480y409q1Ž .
P Non-Bloody Case ReportedŽ .;1yBeta 409q1, 480y409q1Ž .In conjunction with the active surveillance sys-
tem, FoodNet has conducted a number of companionsurveys to estimate the degree of underreporting inthe sentinel sites. The FoodNet Laboratory survey
Ž .found that 182 of 230 79% labs reported testingbloody stool for E. coli O157:H7, but only 108 of
Ž .230 47% labs reported testing all stool samples forŽ .E. coli O157:H7 Hedberg et al., 1997 . These data
feed into beta distributions characterizing the uncer-tainty about the proportion of labs that culture for E.coli O157:H7 in bloody and non-bloody stool speci-mens, respectively:P LaboratoryCulturesBloodyStoolSample for O157Ž .;Beta 182q1, 230y182q1Ž .
P LaboratoryCulturesNon-BloodyStoolSample for O157Ž .;Beta 108q1, 230y108q1Ž .
The sensitivity of the sorbitol MacConkey agarŽ .or SMAC test used by the labs to identify E. coliO157:H7 in stool samples is assumed to be 75%Ž .Hedberg et al., 1997 :
<P qve SMAC test sampleqve s0.75Ž .In a survey conducted in the FoodNet catchment
Ž .area, 1515 of 1943 responding physicians 78%reported that they obtained stool specimens frompatients presenting with bloody diarrhea and 699 of
Ž .1943 physicians 36% reported obtaining specimensŽfrom patients with non-bloody diarrhea Hedberg et
.al., 1997 . These data feed into a beta distributioncharacterizing the uncertainty about the proportion ofphysicians that obtain specimens from patients pre-senting with bloody and non-bloody stool symptoms,respectively:P PhysicianObtainsCulture fromPatientwithBloodyDiarrheaŽ .; Beta 1515q1, 1943y1515q1Ž .
P Physician Obtains Culture from Patient with Non-Bloody DiarrheaŽ .;Beta 699q 1, 1943y 699q 1Ž .
Regarding the proportion of ill-seeking medicalŽ . Ž .care, Cieslak et al. 1997 found that 32 of 58 55%
bloody diarrhea cases in an E. coli O157:H7 out-break in Las Vegas reported seeking medical care.These data are used to characterize the uncertaintyabout the proportion of bloody diarrheal cases seek-ing medical care. For the non-bloody diarrheal cases,we use the results of a FoodNet population survey in
Ž .which 88 of 1100 respondents 8% , who had a boutŽof diarrhea, reported seeking medical attention Hed-
.berg et al., 1997 . These data feed into beta distribu-tions characterizing the uncertainty about the propor-tion of patients with and without bloody diarrhea thatseek medical care:
P Patient with Bloody Diarrhea Seeks Medical CareŽ .;Beta 32q1, 58y32q1Ž .
P PatientwithNon-BloodyDiarrheaSeeksMedicalCareŽ .;Beta 88q1, 1100y88q1Ž .
From this point, the negative binomial distributionŽ .Vose, 1996 is employed in stepwise fashion to addthe number of cases that are missed by the surveil-lance system due to test insensitivity, laboratories notculturing stool samples for E. coli O157:H7, physi-cians not obtaining stool specimens from patients,and ill persons not seeking medical care:
Total No. cases N sNo. cases reported sŽ . Ž .qNegative Binomial s, pŽ .
where psprobability of positive test, lab culturingstool for O157, physician obtaining specimen, or illperson seeking care.
This procedure presumes independence amongcases, an assumption that may be violated, for exam-ple, if behaviors change in response to heightenedawareness during publicized outbreaks. The surveydata used to characterize the uncertainty about theconditional probabilities, however, reflect a combina-tion of sporadic and outbreak conditions.
Proceeding from the estimated number of severeŽcases a subset of bloody diarrheal cases for which
.the patient seeks medical care , we can characterizethe uncertainty regarding the proportion of such casesthat progress to more severe health outcomes—hospitalization, HUSrTTP, and death. For 203 out-breaks occurring during 1982–1998, for whichpreliminary disaggregated health outcome data
Žare currently available i.e., outcomes are brokendown into four categories: affected, hospitalized,

( )M. Powell et al.r International Journal of Food Microbiology 69 2001 209–215 213
.HUSrTTP, and death , 968 out of 4478 casesŽ .21.6% resulted in hospitalization, 228 out of 4478
Ž .cases 5.1% progressed to HUSrTTP, and 28 out ofŽ . Ž4478 cases 0.6% resulted in death Centers for
.Disease Control and Prevention, 1999b . These datafeed into beta distributions characterizing the uncer-tainty about the attack rates:
Proportion of severe cases resulting in hospitalization
;Beta 968q1, 4478y968q1Ž .Proportion of severe cases progressing to HUSrTTP
;Beta 228q1, 4478y228q1Ž .Proportion of severe cases resulting in death
;Beta 28q1, 4478y28q1Ž .Applying these attack rates to all cases involves
an assumption that the severity of outbreak andsporadic E. coli O157 strains are similar.
Using the data described above, the number ofcases in each category is estimated using Monte
Ž .Carlo simulation methods Vose, 1996 . Monte Carlosimulation procedures were performed with Latin
Ž .Hypercube sampling 10,000 iterations using Pal-Ž .isadesq@Riske Ver. 3.5.2 , an add-on to Mi-Ž .crosoftq Excele ’97 .
3. Results
Table 2 summarizes the results of Monte Carlosimulation characterizing the uncertainty about the
Table 2Results of epidemiologic Monte Carlo simulation— E. coliO157:H7 from all sourcesNote: To avoid a misleading impression of precision, the values inthis table were rounded off to two significant figures, with theexception of the estimated number of deaths, which were roundedoff to the nearest increments of 5.
Median 95% Credible interval
Total resultsTotal annual cases O157 US 75,000 50,000–120,000
Total bloody 14,000 9600–22,000Total non-bloody 60,000 38,000–100,000
SeÕere resultsŽ .Severe bloody, seeks care 7500 5800–11,000
Hospitalized 1600 1200–2400HUSrTTP 380 280–590
Deaths 50 25–90
number of cases of E. coli O157:H7 annually in theUS.
4. Discussion
Note that there is considerable uncertainty regard-ing the total number of cases of E. coli O157:H7.Also, the upper- and lower bounds of the credibleintervals for the estimated number of severe cases,hospitalizations, and HUSrTTP differ by about afactor of 2. The 95% credible interval for the esti-mated annual number of deaths due to E. coliO157:H7 from all sources is approximately 25–90.ŽThe 95% credible interval is the span between the2.5th and 97.5th percentiles of the Monte Carlo
.simulation output distribution.In addition to allowing us to avoid misleadingly
precise point estimates for the annual incidence ofdiseases such as E. coli O157:H7, the methods ofprobabilistic risk assessment can also help us toexplore the data to better understand which of themany factors contribute most to the overall uncer-tainty. Sensitivity analysis can help guide our think-ing about where to invest in additional epidemiologi-cal data acquisition to most effectively improve theprecision in our overall estimates. Fig. 2 presents, indescending order, the rank correlations of variousfactors in the model with the total number of casesof E. coli O157:H7. The pattern that emerges is thatif we seek to reduce our uncertainty in the overallnumber of cases, we should focus on enhancing thedata on the non-bloody cases, beginning with thosethat do not seek medical care. Toward the other endof the range, it seems that if we seek to have a moreprecise estimate of the overall number of cases, thenwe may gain relatively little from decreasing ouruncertainty about the proportion of E. coli O157:H7cases that are bloody.
As is typically the case, however, the results ofthe sensitivity analysis depend upon what questionwe are trying to answer. If rather than trying toreduce the uncertainty in the overall number ofcases, we seek instead to improve the estimate of thenumber of deaths due to E. coli O157:H7, then thepattern that emerges from the sensitivity analysisresults, presented in Fig. 3, is that we are keenlyinterested in improving our knowledge about the

( )M. Powell et al.r International Journal of Food Microbiology 69 2001 209–215214
Fig. 2. Rank correlations for the total number of cases.
disposition of the bloody cases and about the overallrate of E. coli O157:H7 in the population.
In summary, this paper attempted to motivatethe importance in a decision–theoretic frameworkof taking uncertainty into account in comparingthe public health impact of different foodbornepathogens. The case of E. coli O157:H7 is devel-oped to provide an illustrative example of how to
characterize and analyze the uncertainty attendant topathogen-specific estimates of foodborne illness. Aspart of a comprehensive strategic planning and re-source allocation process, the US President’s FoodSafety Council has requested the Interagency FoodSafety Risk Assessment Consortium, which consistsof the Departments of Health and Human Servicesand Agriculture and the Environmental Protection
Fig. 3. Rank correlations for the number of deaths.

( )M. Powell et al.r International Journal of Food Microbiology 69 2001 209–215 215
Agency, to consider how to develop a comparativerisk analysis for food safety. An important elementof this effort is exploring the available methods toassess the comparative health risks associated with
Žfoodborne pathogens President’s Council on Food.Safety, 1999 .
References
Buzby, C., Roberts, T., 1997. Guillain–Barre syndrome increasesfoodborne disease costs. FoodReview: Mag. Food Econ. 20,36–39.
Centers for Disease Control and Prevention, 1999a. FoodNet1998. Morb. Mortal. Wkly. Rep. 48, 189–194.
Centers for Disease Control and Prevention, 1999b. Unpublisheddata.
Centers for Disease Control and Prevention, 2000. PreliminaryFoodNet data on the incidence of foodborne illnesses—selectedsites, United States, 1999. Morb. Mortal. Wkly. Rep. 49,201–205.
Cieslak, P.R., Noble, S.J., Maxson, D.J. et al., 1997. Hamburger-associated Escherichia coli O157:H7 infection in Las Vegas:a hidden epidemic. Am. J. Public Health 87, 176–180.
Hedberg, C., Angulo, F., Townes et al., 1997. Differences inEscherichia coli O157:H7 annual incidence among FoodNetactive surveillance sites. Poster Presented at FoodNet Confer-ence. Baltimore, MD, 22–26 June.
Mead, P.S., Slutsker, L., Dietz, V. et al., 1999. Food-relatedillness and death in the United States. Emerging Infect. Dis. 5,607–625.
National Research Council, 1996. Understanding Risk: Informing
Decisions in a Democratic Society. National Academy Press,Washington, DC.
Ostroff, S.M., Kobayashi, J.M., Lewis, J.H., 1989. Infections withEscherichia coli O157:H7 in Washington state: the first yearof statewide disease surveillance. J. Am. Med. Assoc. 262,355–359.
President’s Council on Food Safety, 1999. Assessment of theNAS Report, Ensuring Safe Food from Production to Con-sumption. March. Available at: http:rrwww.foodsafety.govr; fsgrcreport.html.
Society for Risk Analysis, 2001. Glossary of Risk Analysis Terms.Available at: http:rrwww.sra.orgrglossary.htm.
U.S. Census Bureau, 2000a. State Population Estimates: An-nual Time Series, July 1, 1990 to July 1, 1999. Available at:http:rrwww.census.govrpopulationrestimatesrstaterst-99-3.txt.
U.S. Census Bureau, 2000b. Historical National Population Esti-mates: July 1, 1900 to July 1, 1999. Available at: http:rrwww.census.govrpopulationrestimatesrnationrpopclockest.txt.
U.S. Department of Agriculture, F.S.I.S, 1997. Report to Congress:FSISrCDCrFDA SENTINEL SITE STUDY: The Establish-ment and Implementation of an Active Surveillance Systemfor Bacterial Foodborne Diseases in the United States. Febru-ary. http:rrwww.fsis.usda.govrOPHSrfsisrep1.htm.
U.S. Department of Agriculture, F.S.I.S, 1998. Report to Congress:FoodNet: An Active Surveillance System for Bacterial Food-borne Diseases in the United States. April. Available at:http:rrwww.fsis.usda.govrOPHSrrpcong97rtext.htm.
U.S. Department of Agriculture, F.S.I.S, 1999. Report to Congress:FoodNet: An Active Surveillance System for Bacterial Food-borne Diseases in the United States. April. Available at:http:rrwww.fsis.usda.govrOPHSrrpcong98rrpcong98.htm.
Vose, D., 1996. Quantitative Risk Analysis: A Guide to MonteCarlo Simulation Modelling. Wiley, New York.