Embed Size (px)
Citation preview
1
Consolidated 3Q Financial Results for the Fiscal Year
ending March 2018
T-Gaia Corporation /TSE 3738
February 6, 2018
(Nine months ended Dec. 31, 2017)
2
This material contains statements about the future performance of T-Gaia Corp., which are based on management’s assumptions and beliefs taking information currently available into consideration. Therefore, please be advised that T-Gaia’s actual results could differ materially from those described in these forward-looking statements as a result of numerous factors, including general economic conditions in T-Gaia’s principal markets as well as other factors detailed from time to time.
Disclaimer
3
Outline of Consolidated 3Q Financial Results for the FY ending March 2018
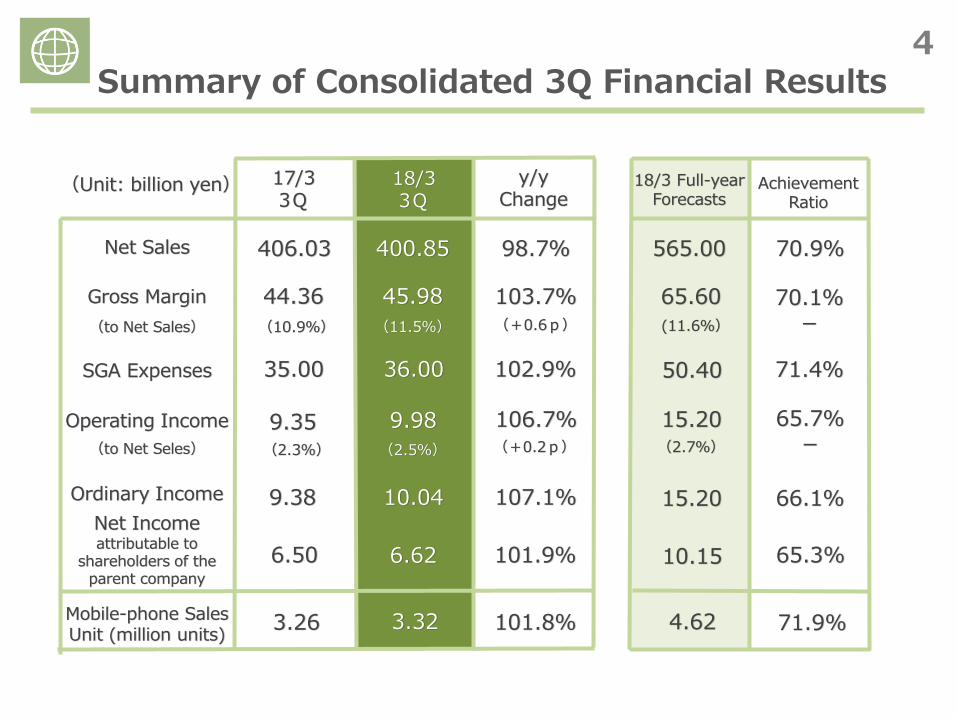
4 Summary of Consolidated 3Q Financial Results
406.03 400.85
44.36
35.00
9.35
9.38
6.50
17/3 3Q
18/3 3Q
45.98
36.00
9.98
10.04
6.62
Gross Margin
Net Sales
SGA Expenses
Operating Income
Net Income attributable to
shareholders of the parent company
Ordinary Income
y/y Change
(to Net Seles)
(to Net Sales)
98.7%
103.7%
102.9%
106.7%
107.1%
101.9%
(10.9%) (11.5%)
(2.3%) (2.5%)
(Unit: billion yen)
(+0.6p)
(+0.2p)
565.00
18/3 Full-year Forecasts
65.60
50.40
15.20
15.20
10.15
Achievement Ratio
70.9%
70.1% -
71.4%
65.7% -
66.1%
65.3%
(11.6%)
(2.7%)
Mobile-phone Sales Unit (million units)
4.62 3.32 71.9% 3.26 101.8%
5
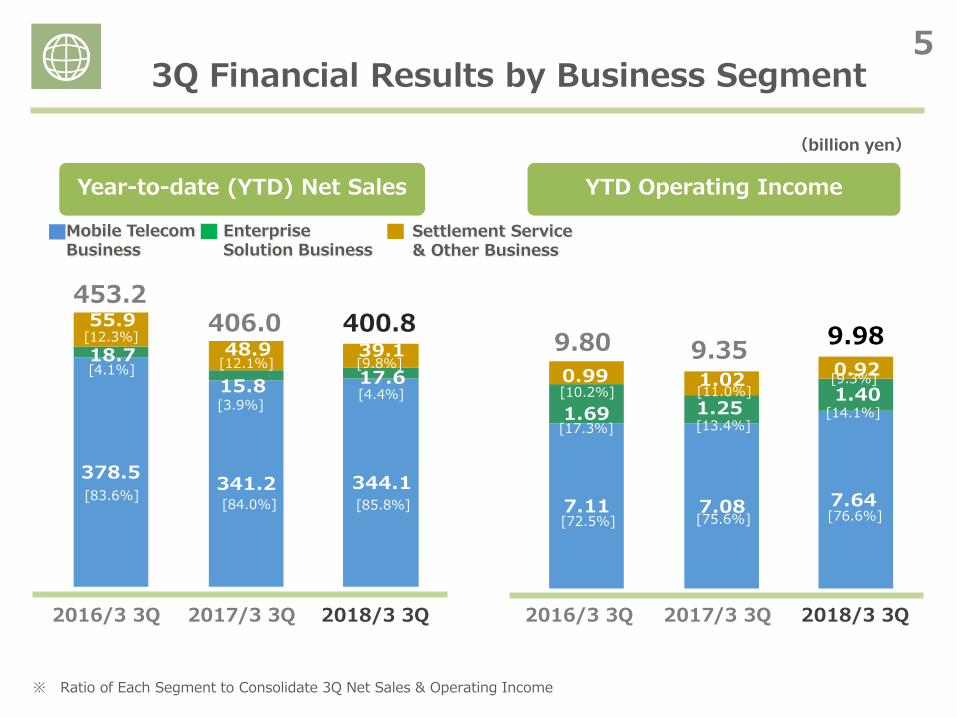
378.5 341.2 344.1
18.7
15.8 17.6
55.9
48.9 39.1
※ Ratio of Each Segment to Consolidate 3Q Net Sales & Operating Income
Mobile Telecom Business
Enterprise Solution Business
Settlement Service & Other Business
(billion yen)
Year-to-date (YTD) Net Sales YTD Operating Income
2017/3 3Q 2018/3 3Q
406.0
2016/3 3Q
453.2 400.8
7.11 7.08 7.64
1.69 1.25 1.40
0.99 1.02 0.92
9.35 9.98 9.80
2017/3 3Q 2018/3 3Q 2016/3 3Q
[12.1%]
[12.3%]
[9.8%]
[3.9%]
[4.1%]
[4.4%]
[84.0%] [83.6%]
[85.8%] [72.5%]
[10.2%]
[17.3%]
[75.6%]
[11.0%]
[13.4%]
[76.6%]
[9.3%]
[14.1%]
3Q Financial Results by Business Segment
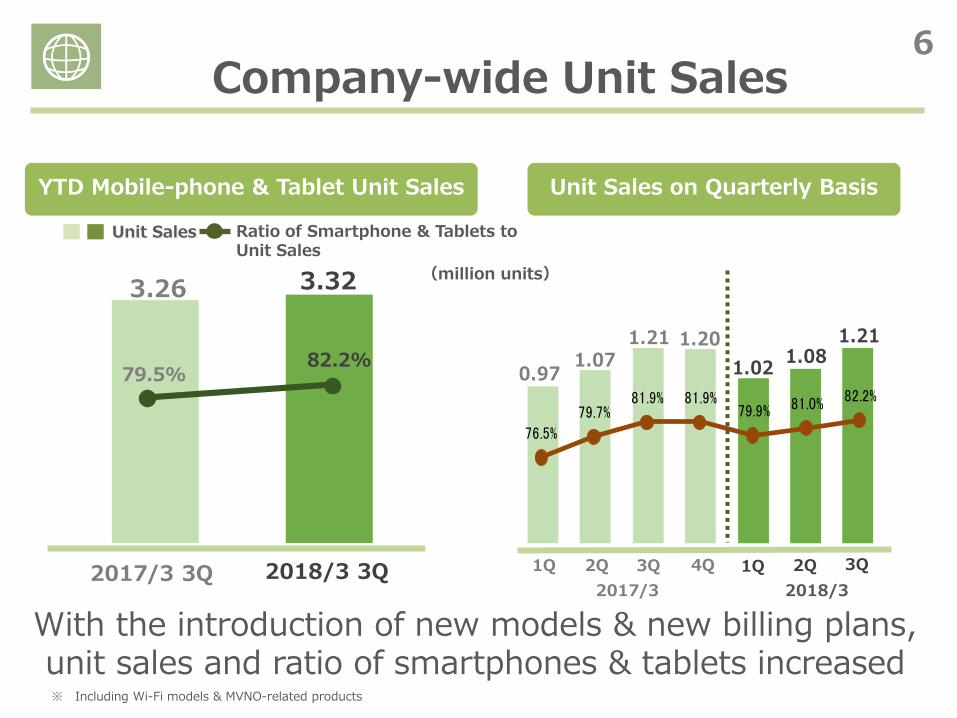
6
79.5%82.2%
0.971.07
1.21 1.20
1.021.08
1.21
76.5%79.7%
81.9% 81.9%79.9% 81.0% 82.2%
1Q 2Q
Company-wide Unit Sales
YTD Mobile-phone & Tablet Unit Sales Unit Sales on Quarterly Basis
Unit Sales
With the introduction of new models & new billing plans, unit sales and ratio of smartphones & tablets increased
Ratio of Smartphone & Tablets to Unit Sales
※ Including Wi-Fi models & MVNO-related products
(million units)
3Q 4Q 1Q 2Q
2017/3 2018/3 2017/3 3Q 2018/3 3Q
3.26 3.32
3Q
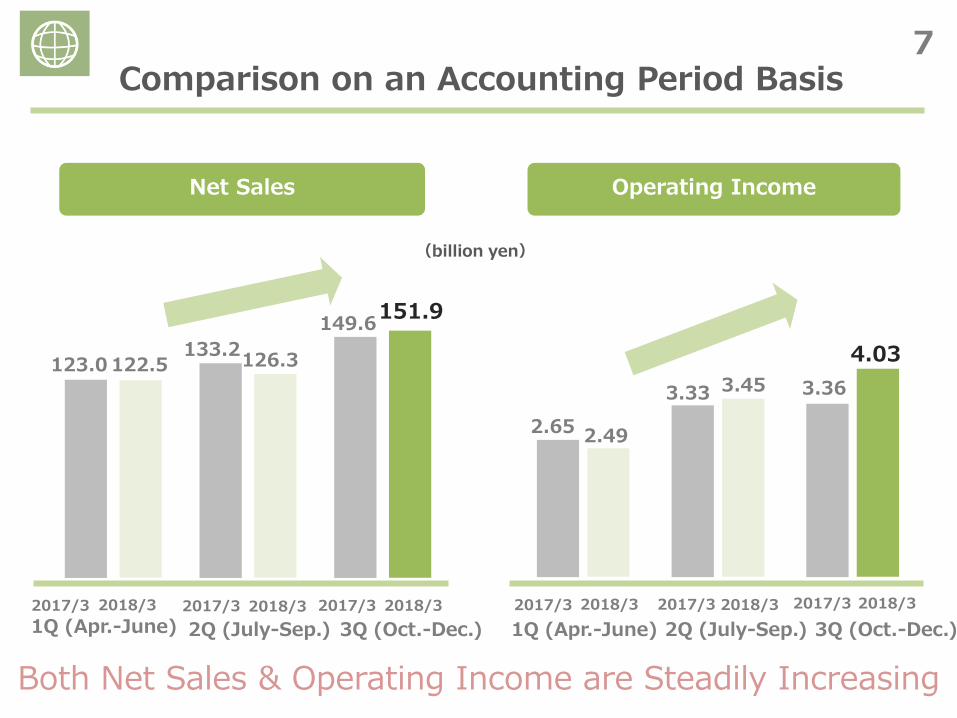
7
(billion yen)
Net Sales Operating Income
126.3 122.5
151.9
Both Net Sales & Operating Income are Steadily Increasing
123.0 133.2
149.6
2017/3 2017/3 2017/3 1Q (Apr.-June) 2Q (July-Sep.) 3Q (Oct.-Dec.)
2018/3 2018/3 2018/3 2017/3 2017/3 2017/3 2018/3 2018/3 2018/3
2.65 2.49
3.33 3.45 3.36
4.03
Comparison on an Accounting Period Basis
1Q (Apr.-June) 2Q (July-Sep.) 3Q (Oct.-Dec.)
8
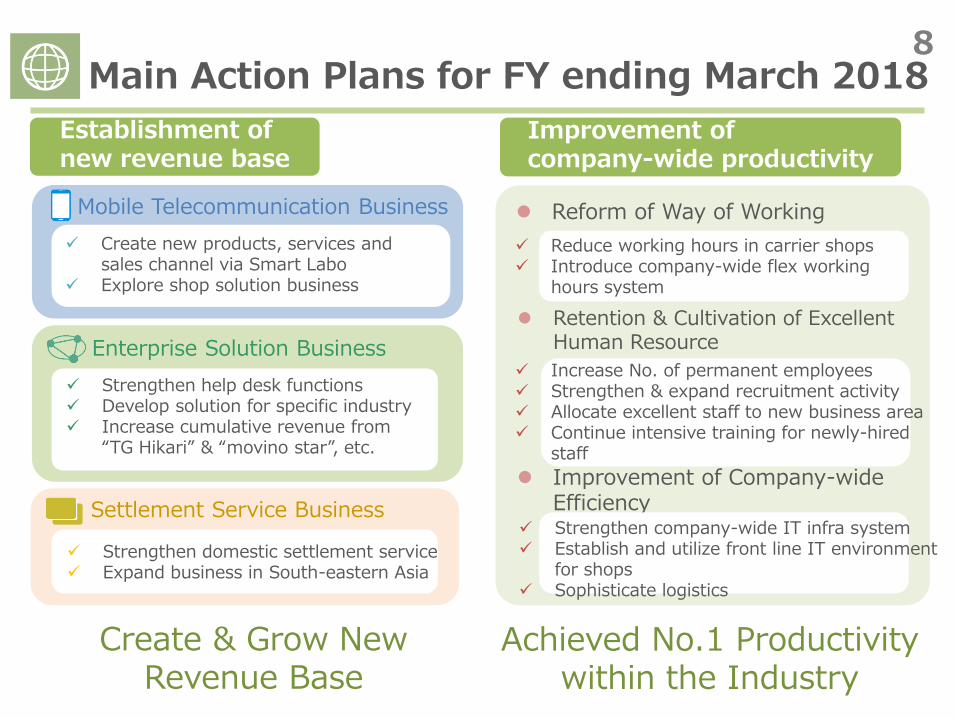
Strengthen domestic settlement service Expand business in South-eastern Asia
Main Action Plans for FY ending March 2018
Retention & Cultivation of Excellent Human Resource
Improvement of company-wide productivity
Establishment of new revenue base
Mobile Telecommunication Business
Create new products, services and sales channel via Smart Labo
Explore shop solution business
Enterprise Solution Business
Create & Grow New Revenue Base
Reform of Way of Working
Improvement of Company-wide Efficiency
Achieved No.1 Productivity within the Industry
Strengthen help desk functions Develop solution for specific industry Increase cumulative revenue from
“TG Hikari” & “movino star”, etc.
Settlement Service Business
Reduce working hours in carrier shops Introduce company-wide flex working
hours system
Strengthen company-wide IT infra system Establish and utilize front line IT environment
for shops Sophisticate logistics
Increase No. of permanent employees Strengthen & expand recruitment activity Allocate excellent staff to new business area Continue intensive training for newly-hired
staff
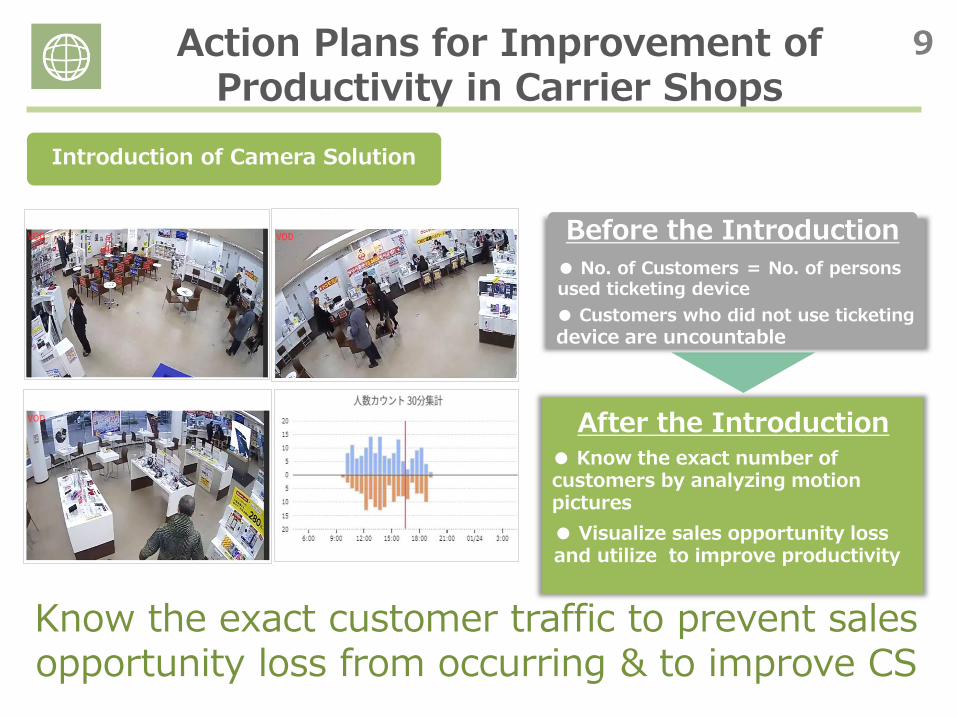
9 Action Plans for Improvement of Productivity in Carrier Shops
Know the exact customer traffic to prevent sales opportunity loss from occurring & to improve CS
Introduction of Camera Solution
● No. of Customers = No. of persons used ticketing device
● Know the exact number of customers by analyzing motion pictures
Before the Introduction
After the Introduction
● Customers who did not use ticketing device are uncountable
● Visualize sales opportunity loss and utilize to improve productivity
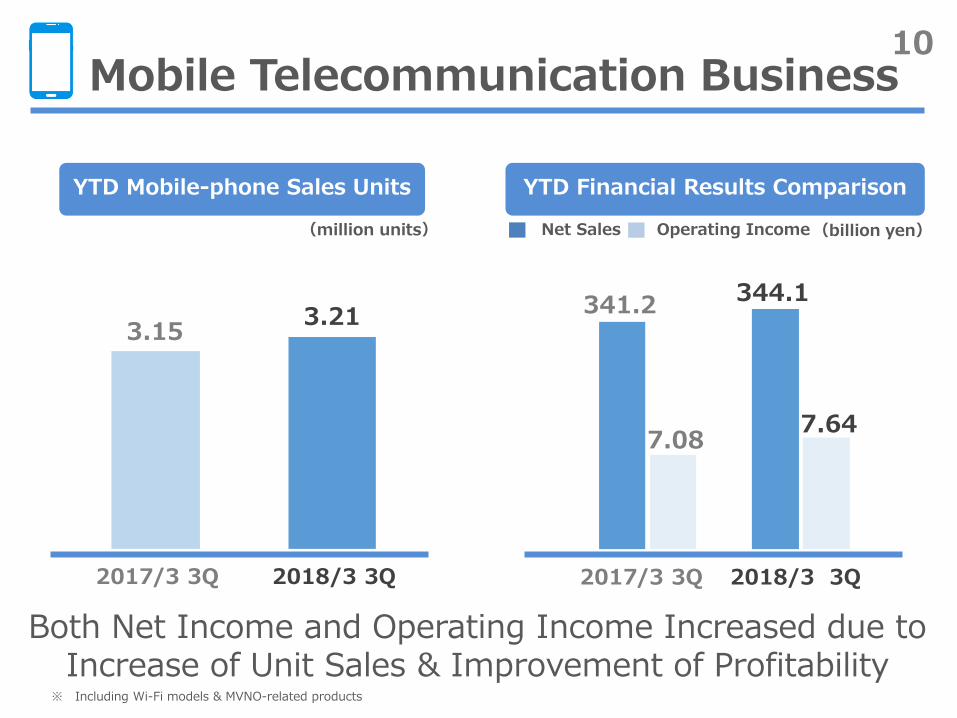
10 Mobile Telecommunication Business
(million units) (billion yen) Net Sales Operating Income
Both Net Income and Operating Income Increased due to Increase of Unit Sales & Improvement of Profitability
YTD Financial Results Comparison YTD Mobile-phone Sales Units
3.15 3.21
2018/3 3Q 2017/3 3Q
341.2 344.1
7.08 7.64
2018/3 3Q 2017/3 3Q
※ Including Wi-Fi models & MVNO-related products
11
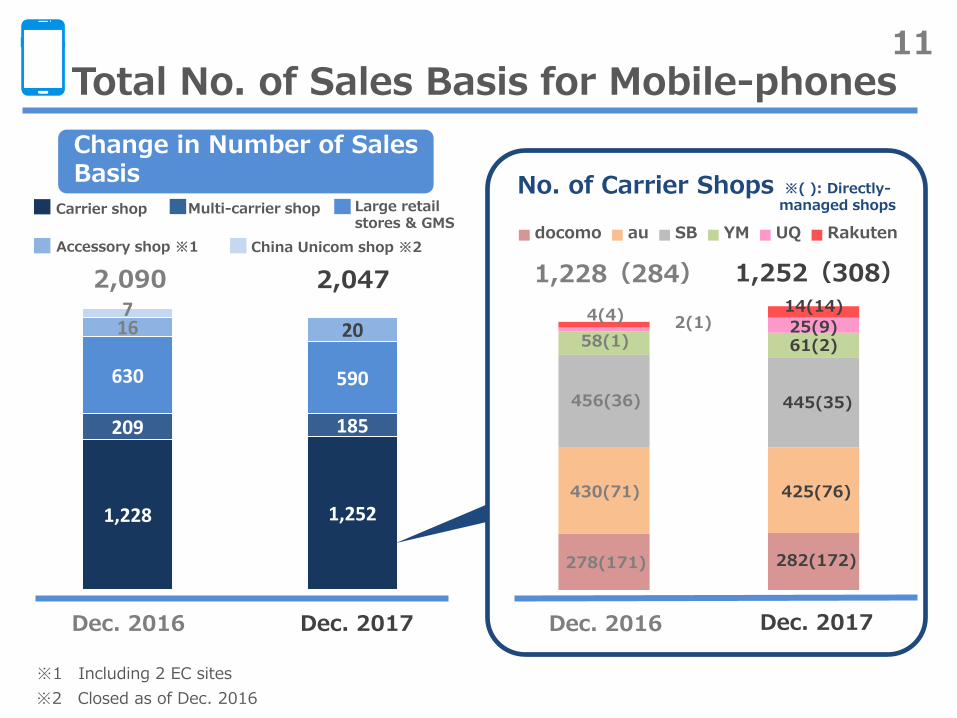
1,228 1,252
209 185
630 590
16 20 7
2,047 2,090
Total No. of Sales Basis for Mobile-phones
Change in Number of Sales Basis
※1 Including 2 EC sites
※2 Closed as of Dec. 2016
Carrier shop Multi-carrier shop Large retail stores & GMS
Accessory shop ※1 China Unicom shop ※2
Dec. 2017 Dec. 2016 Dec. 2016 Dec. 2017
2(1) 4(4) 14(14)
docomo au SB YM UQ Rakuten
1,228(284) 1,252(308)
25(9) 61(2)
445(35)
425(76)
282(172)
58(1)
456(36)
430(71)
278(171)
※( ): Directly-managed shops
No. of Carrier Shops
12
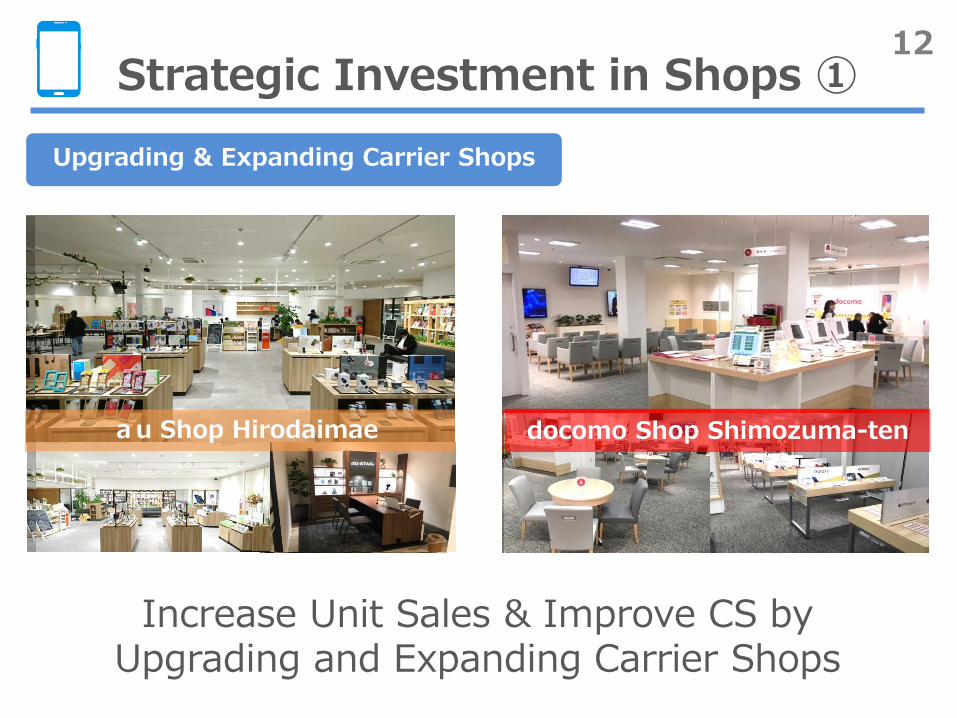
Increase Unit Sales & Improve CS by Upgrading and Expanding Carrier Shops
Strategic Investment in Shops ①
Upgrading & Expanding Carrier Shops
auショップ広大前 ドコモショップ下妻店 au Shop Hirodaimae docomo Shop Shimozuma-ten
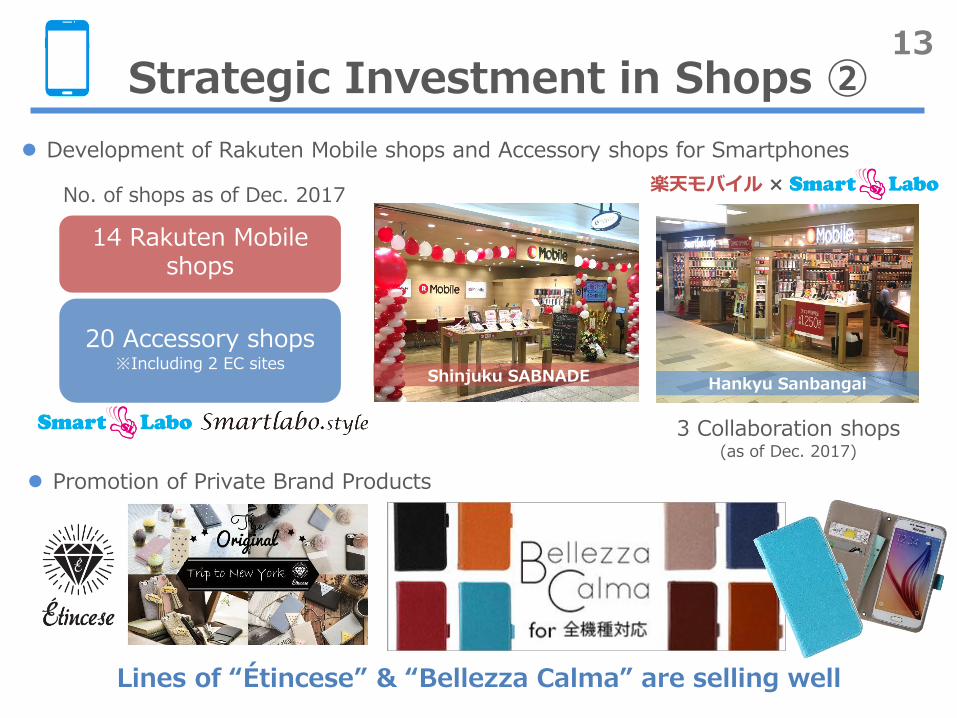
13 Strategic Investment in Shops ②
Lines of “Étincese” & “Bellezza Calma” are selling well
Promotion of Private Brand Products
Development of Rakuten Mobile shops and Accessory shops for Smartphones
Hankyu Sanbangai
楽天モバイル ×
3 Collaboration shops (as of Dec. 2017)
14 Rakuten Mobile shops
No. of shops as of Dec. 2017
20 Accessory shops ※Including 2 EC sites
Shinjuku SABNADE
14
応用編チャプター6:
フロアオペレーションの重要性
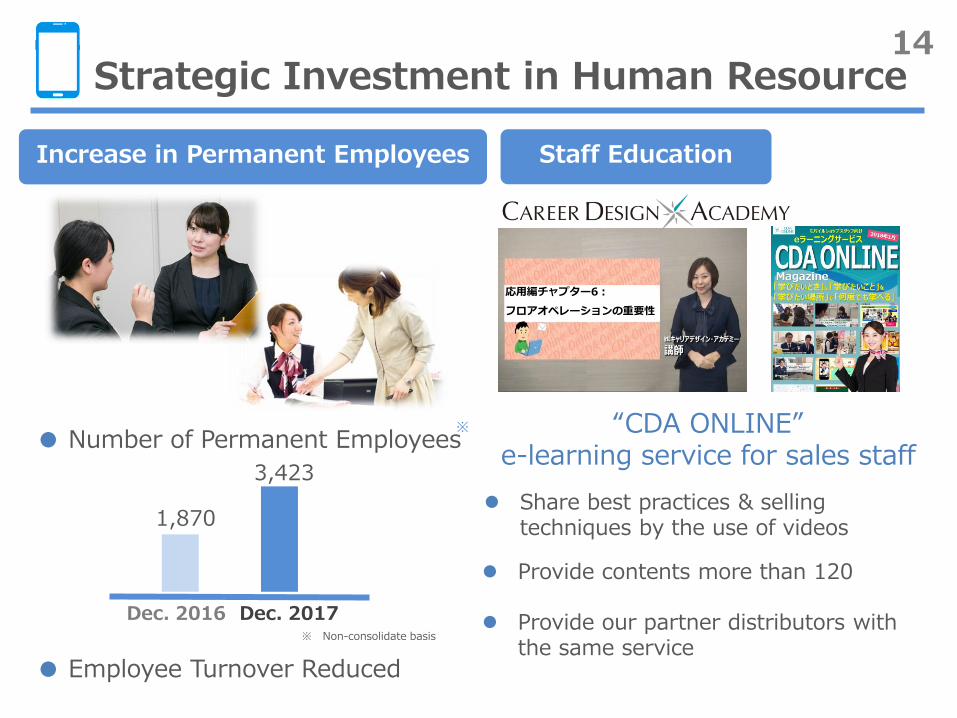
Strategic Investment in Human Resource
Provide contents more than 120
Increase in Permanent Employees
Share best practices & selling techniques by the use of videos
“CDA ONLINE” e-learning service for sales staff
Staff Education
● Number of Permanent Employees
3,423
1,870
Provide our partner distributors with the same service
Dec. 2017 Dec. 2016 ※ Non-consolidate basis
※
● Employee Turnover Reduced
15
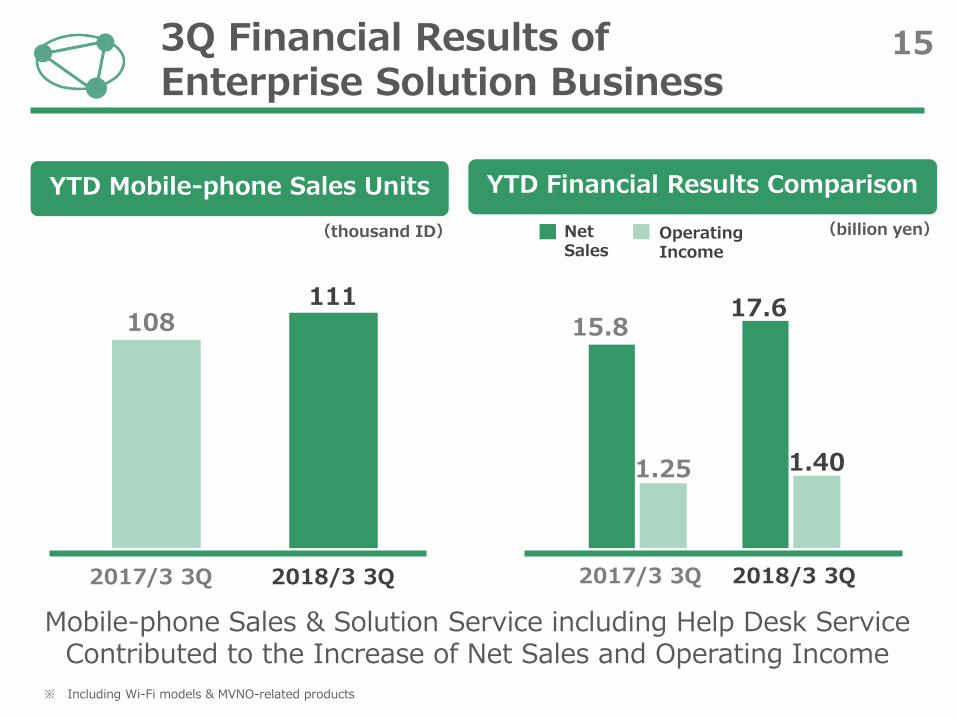
2018/3 3Q
2017/3 3Q
108 111
YTD Financial Results Comparison
(billion yen) Net Sales
Operating Income
3Q Financial Results of Enterprise Solution Business
YTD Mobile-phone Sales Units
(thousand ID)
Mobile-phone Sales & Solution Service including Help Desk Service Contributed to the Increase of Net Sales and Operating Income
2018/3 3Q 2017/3 3Q
15.8 17.6
1.40 1.25
※ Including Wi-Fi models & MVNO-related products
16
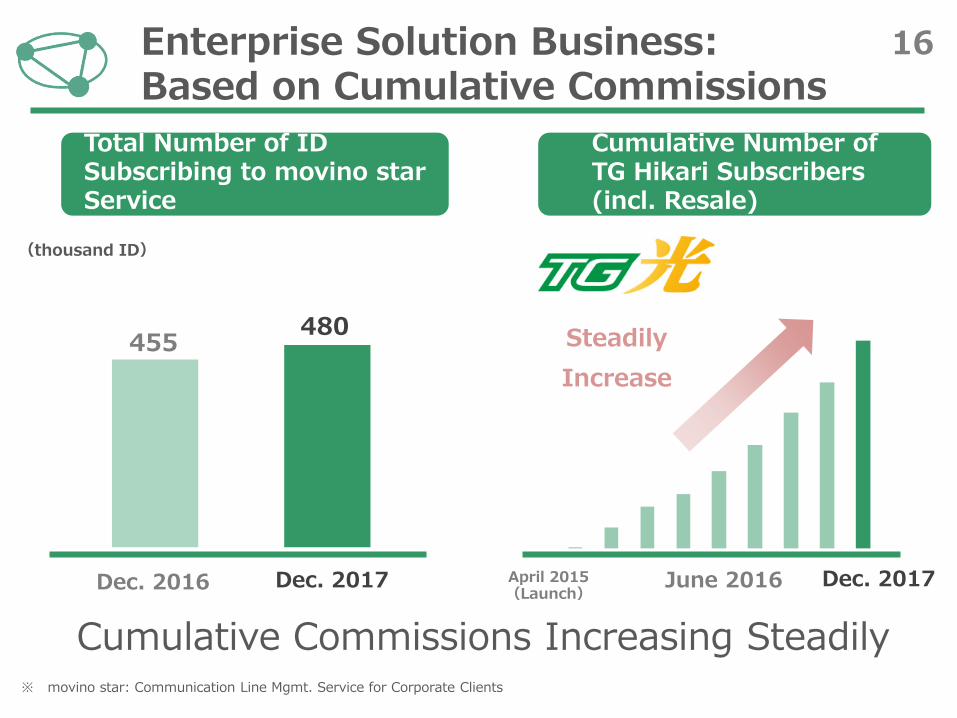
Total Number of ID Subscribing to movino star Service
Enterprise Solution Business: Based on Cumulative Commissions
(thousand ID)
Dec. 2016 Dec. 2017
455 480
Cumulative Number of TG Hikari Subscribers (incl. Resale)
Cumulative Commissions Increasing Steadily ※ movino star: Communication Line Mgmt. Service for Corporate Clients
Dec. 2017 April 2015 (Launch)
June 2016
Steadily
Increase
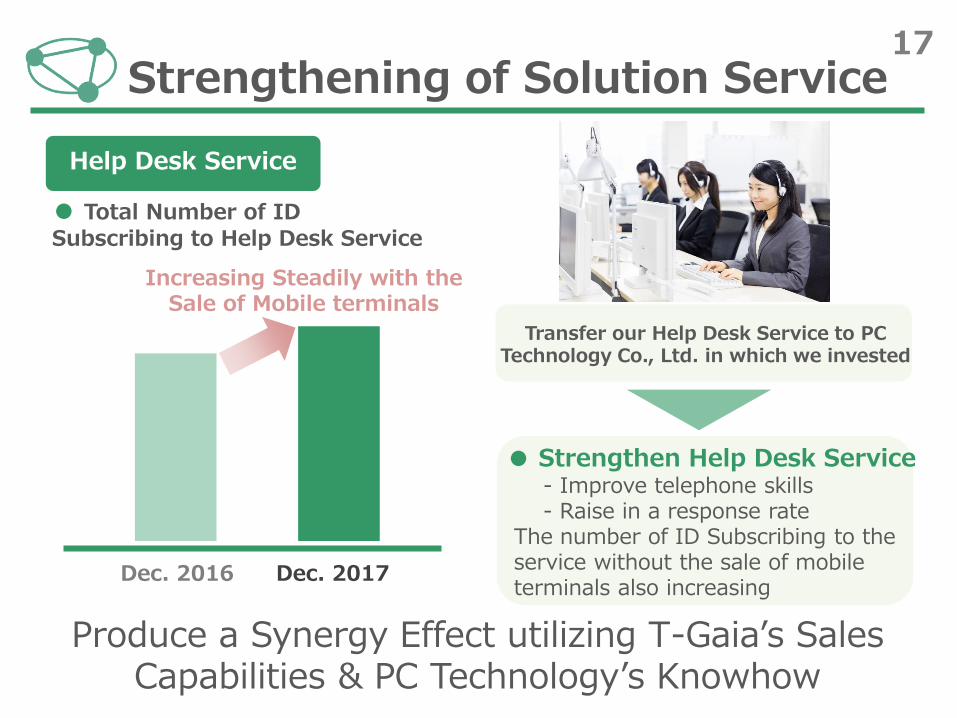
17 Strengthening of Solution Service
Help Desk Service
Produce a Synergy Effect utilizing T-Gaia’s Sales Capabilities & PC Technology’s Knowhow
Transfer our Help Desk Service to PC Technology Co., Ltd. in which we invested
Dec. 2016 Dec. 2017
Increasing Steadily with the Sale of Mobile terminals
● Strengthen Help Desk Service - Improve telephone skills - Raise in a response rate The number of ID Subscribing to the service without the sale of mobile terminals also increasing
● Total Number of ID Subscribing to Help Desk Service
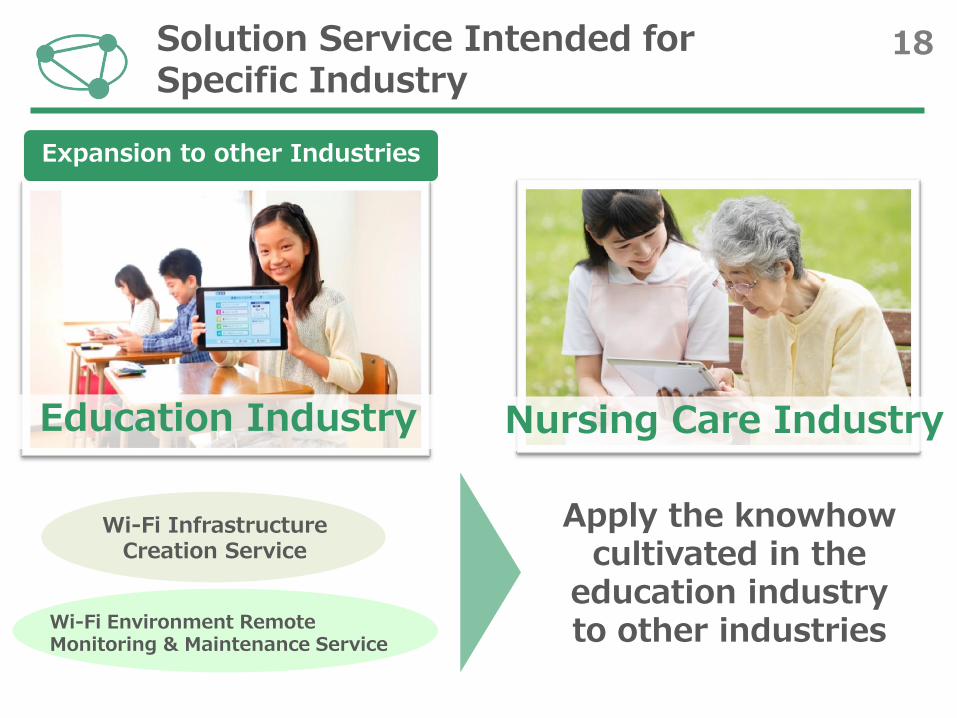
18 Solution Service Intended for Specific Industry
Expansion to other Industries
Nursing Care Industry Education Industry
Wi-Fi Infrastructure Creation Service
Wi-Fi Environment Remote Monitoring & Maintenance Service
Apply the knowhow cultivated in the
education industry to other industries
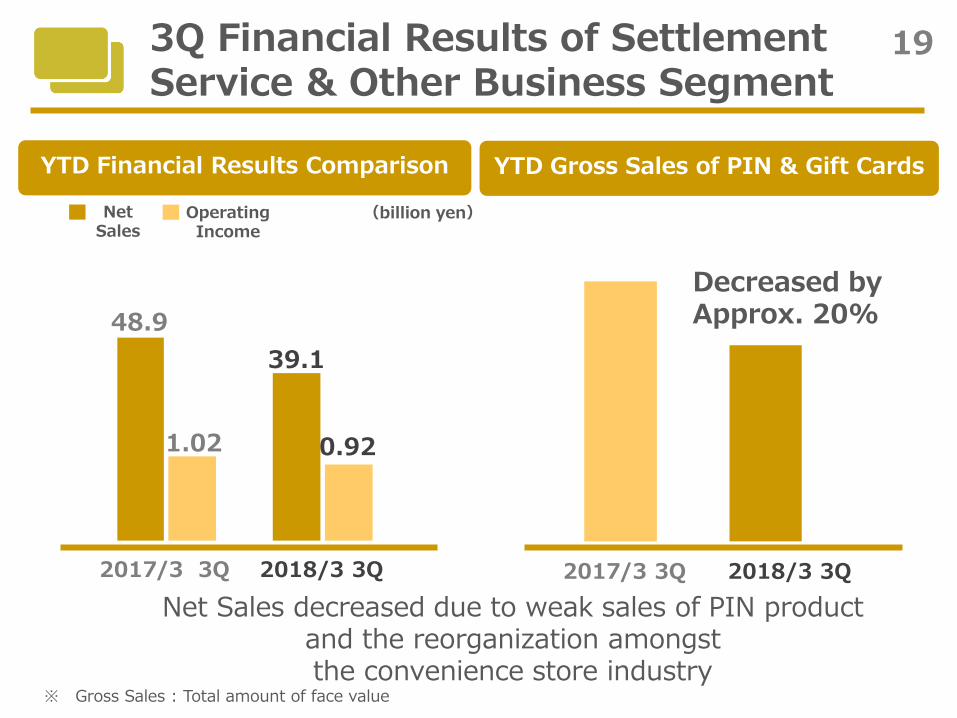
19 3Q Financial Results of Settlement Service & Other Business Segment
営業利益
Net Sales decreased due to weak sales of PIN product and the reorganization amongst the convenience store industry
YTD Financial Results Comparison
(billion yen) Net Sales
Operating Income
YTD Gross Sales of PIN & Gift Cards
※ Gross Sales : Total amount of face value
Decreased by Approx. 20% 48.9
1.02
39.1
0.92
2018/3 3Q 2017/3 3Q 2018/3 3Q 2017/3 3Q
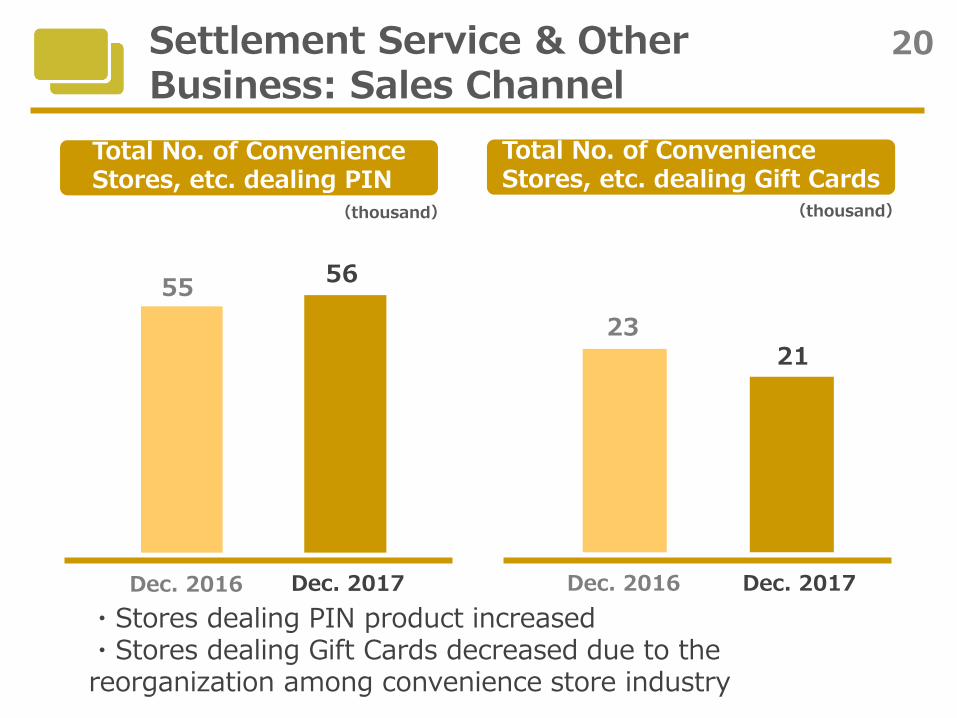
20 Settlement Service & Other Business: Sales Channel
・Stores dealing PIN product increased ・Stores dealing Gift Cards decreased due to the reorganization among convenience store industry
55 56
Dec. 2016 Dec. 2017
(thousand)
23 21
Total No. of Convenience Stores, etc. dealing PIN
Total No. of Convenience Stores, etc. dealing Gift Cards
Dec. 2016 Dec. 2017
(thousand)
21
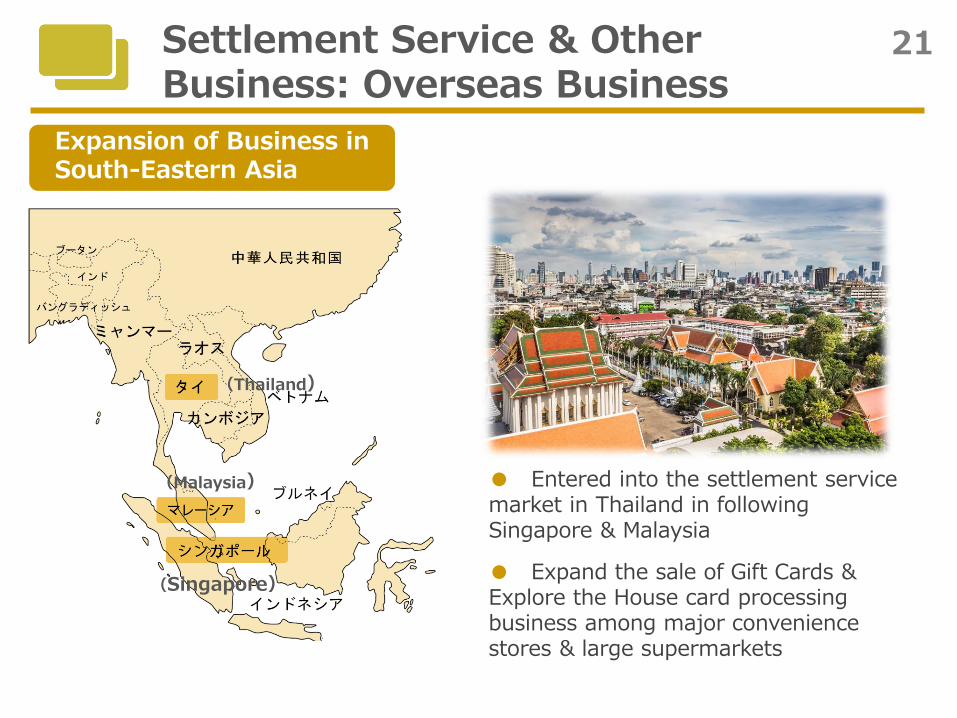
● Entered into the settlement service market in Thailand in following Singapore & Malaysia
Expansion of Business in South-Eastern Asia
Settlement Service & Other Business: Overseas Business
● Expand the sale of Gift Cards & Explore the House card processing business among major convenience stores & large supermarkets
(Thailand)
(Malaysia)
(Singapore)
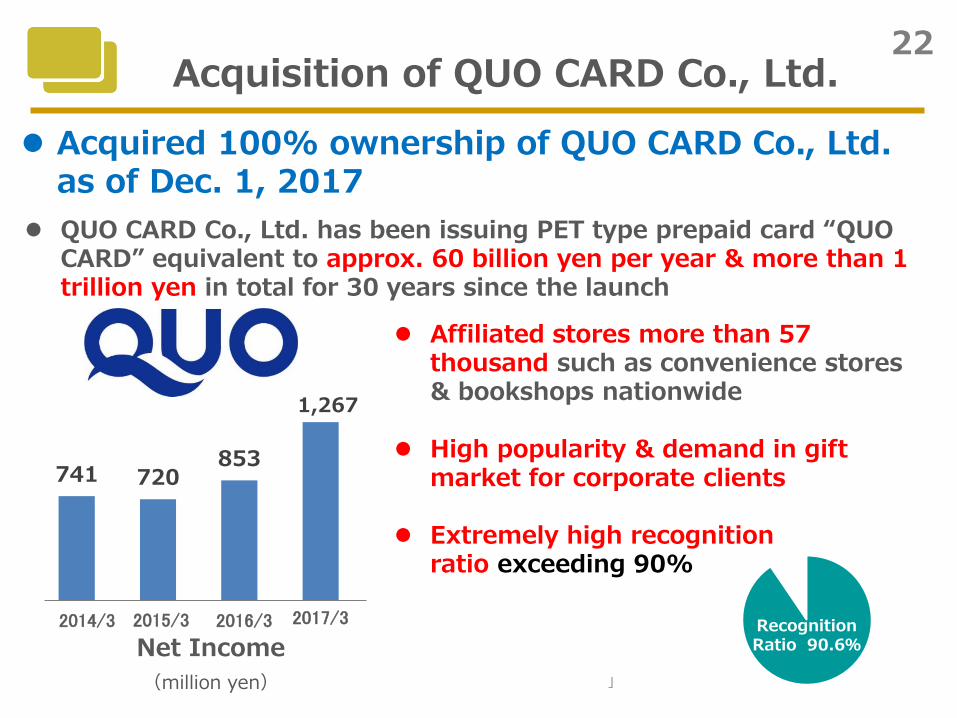
22 Acquisition of QUO CARD Co., Ltd.
QUO CARD Co., Ltd. has been issuing PET type prepaid card “QUO CARD” equivalent to approx. 60 billion yen per year & more than 1 trillion yen in total for 30 years since the launch
」
Recognition Ratio 90.6%
741 720 853
1,267
Net Income
(million yen)
2014/3 2015/3 2016/3 2017/3
Acquired 100% ownership of QUO CARD Co., Ltd. as of Dec. 1, 2017
Affiliated stores more than 57 thousand such as convenience stores & bookshops nationwide
High popularity & demand in gift
market for corporate clients Extremely high recognition
ratio exceeding 90%
23
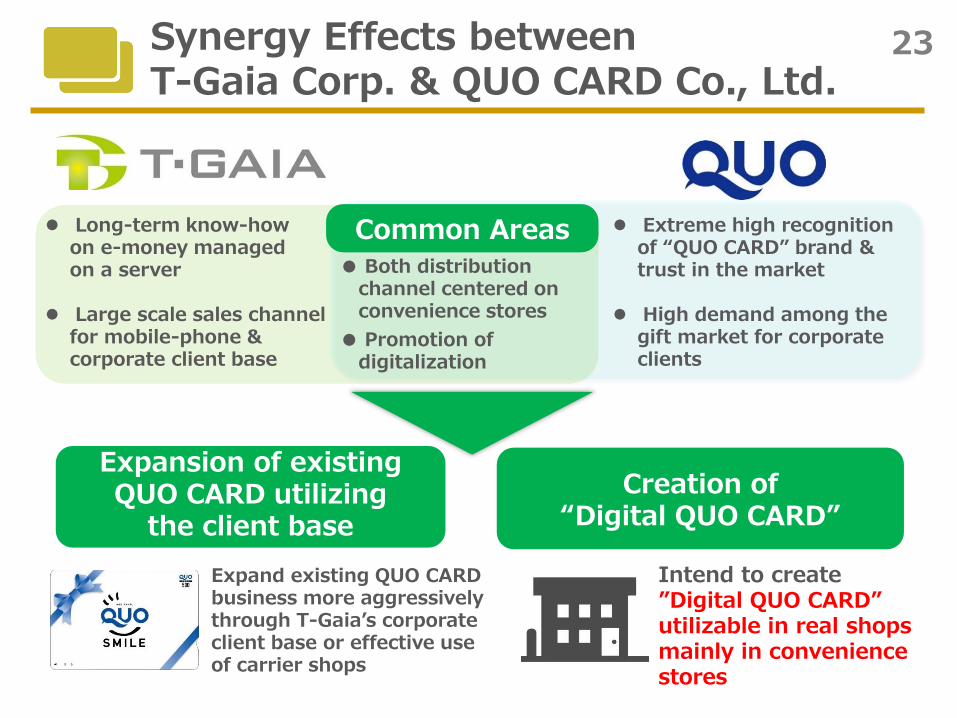
Creation of “Digital QUO CARD”
Expansion of existing QUO CARD utilizing
the client base
Synergy Effects between T-Gaia Corp. & QUO CARD Co., Ltd.
Intend to create ”Digital QUO CARD” utilizable in real shops mainly in convenience stores
Expand existing QUO CARD business more aggressively through T-Gaia’s corporate client base or effective use of carrier shops
Long-term know-how on e-money managed on a server Large scale sales channel for mobile-phone & corporate client base
● Both distribution channel centered on convenience stores
Extreme high recognition of “QUO CARD” brand & trust in the market High demand among the gift market for corporate clients
● Promotion of digitalization
Common Areas
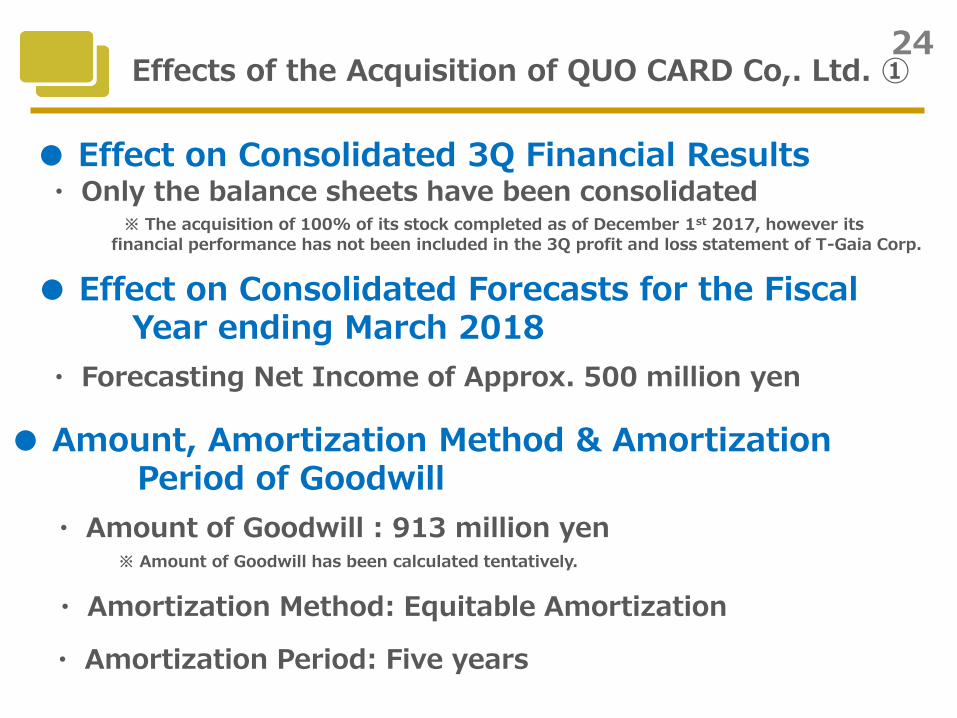
24 Effects of the Acquisition of QUO CARD Co,. Ltd. ①
● Effect on Consolidated 3Q Financial Results ・ Only the balance sheets have been consolidated
※ The acquisition of 100% of its stock completed as of December 1st 2017, however its
financial performance has not been included in the 3Q profit and loss statement of T-Gaia Corp.
● Amount, Amortization Method & Amortization Period of Goodwill
・ Amount of Goodwill : 913 million yen
・ Amortization Method: Equitable Amortization
※ Amount of Goodwill has been calculated tentatively.
● Effect on Consolidated Forecasts for the Fiscal Year ending March 2018
・ Forecasting Net Income of Approx. 500 million yen
・ Amortization Period: Five years
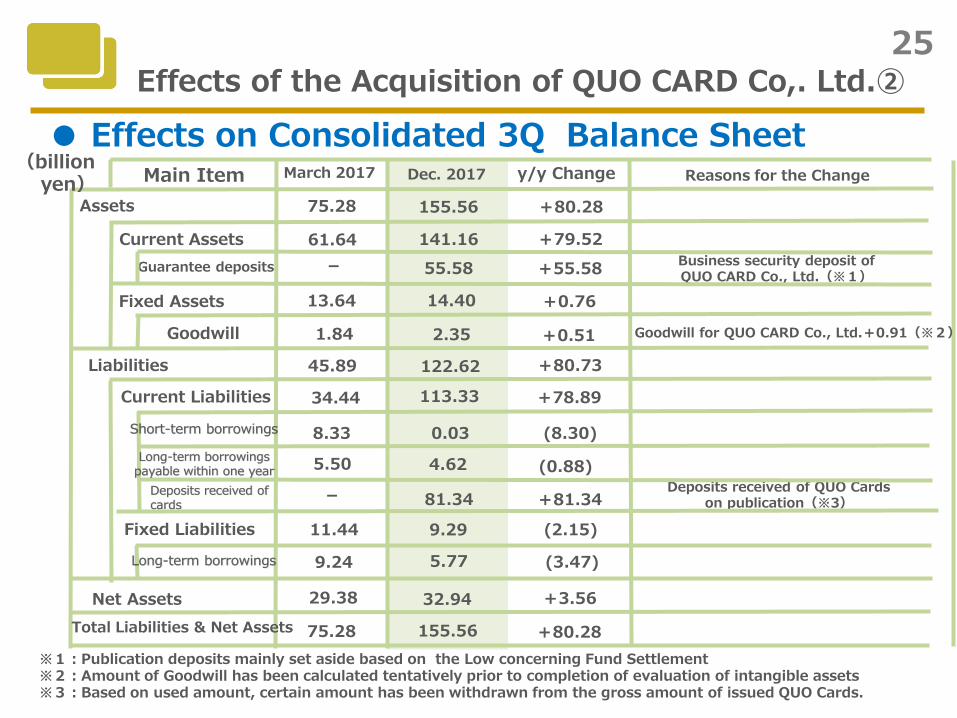
25 Effects of the Acquisition of QUO CARD Co,. Ltd.②
● Effects on Consolidated 3Q Balance Sheet March 2017 Dec. 2017 y/y Change Reasons for the Change Main Item
Goodwill
※1:Publication deposits mainly set aside based on the Low concerning Fund Settlement ※2:Amount of Goodwill has been calculated tentatively prior to completion of evaluation of intangible assets ※3:Based on used amount, certain amount has been withdrawn from the gross amount of issued QUO Cards.
Guarantee deposits
Assets
Current Assets 61.64 141.16
75.28 155.56
- 55.58
Fixed Assets 13.64 14.40
1.84 2.35
Liabilities 45.89 122.62
Current Liabilities
Deposits received of cards
Fixed Liabilities
Net Assets
- 81.34
34.44 113.33
11.44 9.29
29.38 32.94
Total Liabilities & Net Assets 75.28 155.56
+79.52
+80.28
+55.58
+0.76
+0.51
+80.73
+81.34
+78.89
(2.15)
+3.56
+80.28
Business security deposit of QUO CARD Co., Ltd.(※1)
Goodwill for QUO CARD Co., Ltd.+0.91(※2)
(billion yen)
Deposits received of QUO Cards on publication(※3)
Short-term borrowings 8.33 0.03 (8.30)
Long-term borrowings payable within one year
Long-term borrowings
5.50 4.62 (0.88)
9.24 5.77 (3.47)
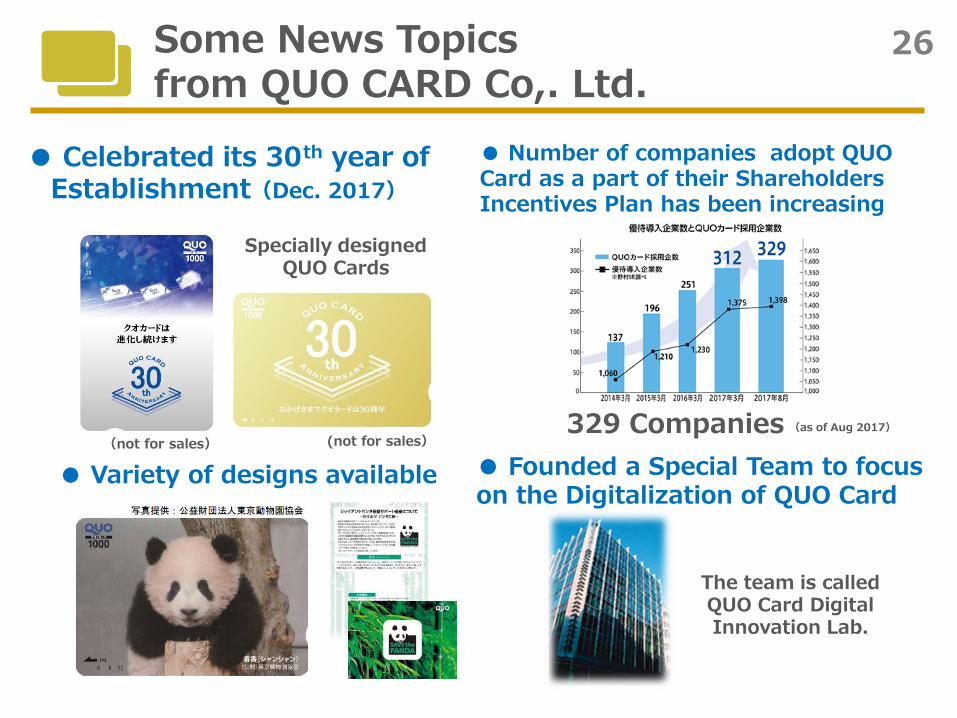
26 Some News Topics from QUO CARD Co,. Ltd.
● Celebrated its 30th year of Establishment(Dec. 2017)
● Founded a Special Team to focus on the Digitalization of QUO Card
● Variety of designs available
● Number of companies adopt QUO Card as a part of their Shareholders Incentives Plan has been increasing
The team is called QUO Card Digital Innovation Lab.
329 Companies (as of Aug 2017)
(not for sales) (not for sales)
Specially designed QUO Cards

27
Consolidated Forecasts for
FY Ending March 2018
and Future Development
28
Toward the FY 2020 (FY ending March 2021), T-Gaia set a medium-term goal to realize sustainable growth and to respond to the expectations of all stakeholders including shareholders and employees by achieving the following objectives based on the Corporate Philosophy released April 2014.
● Firmly maintain the position as the leading company in the core business of mobile-phone distribution ● Grow solution business for corporate clients, settlement service and overseas business as the strong core business ● Create and explore new business opportunities in the mobile and internet industries ● Maintain the dividend payout ratio over 30%
In order to realize the objectives noted above, T-Gaia are taking concrete measures every day setting the following points as the company-wide strategy
● Cultivate, recruit, utilize and retain human resources to realize maximization and optimization of achievement of respective employees ● Conduct strategic and continuous cost management to transform the cost structure into one that can respond to change of the market environment ● Maximize the corporate-wide achievement by optimizing the organization as well as the corporate system
Based on the above medium-term goal & company-wide strategy, develop the business strategy for each business line and make every effort to realize them through the concrete action plan in each business dept.
Medium-term Goal
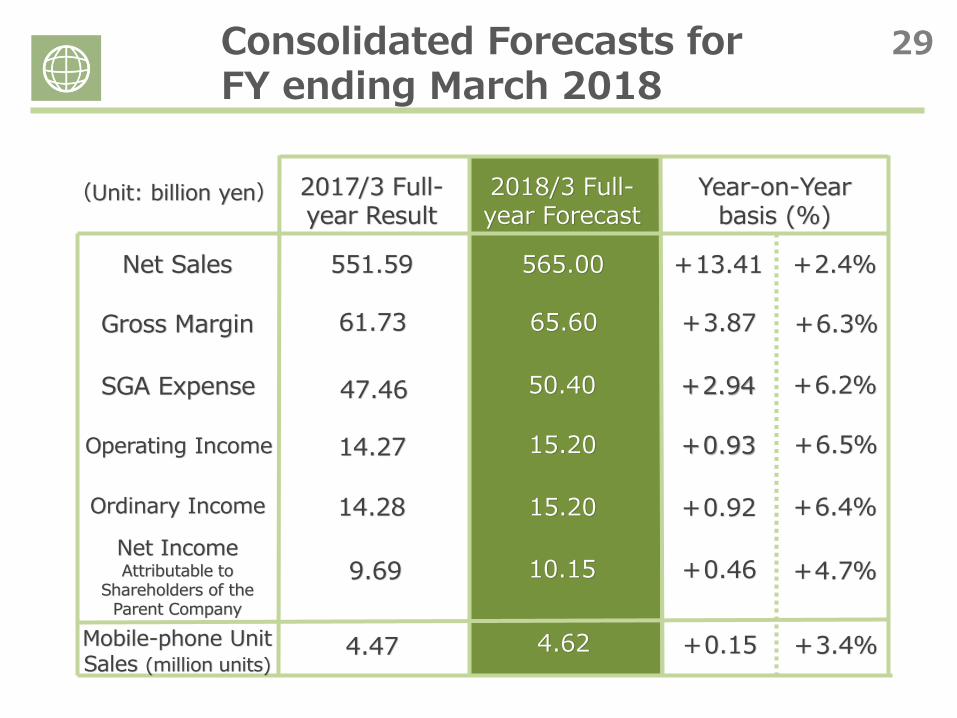
29 Consolidated Forecasts for FY ending March 2018
551.59 565.00
61.73
47.46
14.27
14.28
9.69
2017/3 Full-year Result
2018/3 Full-year Forecast
65.60
50.40
15.20
15.20
10.15
Gross Margin
Net Sales
SGA Expense
Operating Income
Net Income Attributable to
Shareholders of the Parent Company
Ordinary Income
Year-on-Year basis (%)
+2.4%
+6.3%
+6.2%
+6.4%
+4.7%
(Unit: billion yen)
+3.87
+2.94
+0.93
+0.92
+0.46
Mobile-phone Unit Sales (million units)
4.47 +3.4% +0.15
+6.5%
4.62
+13.41
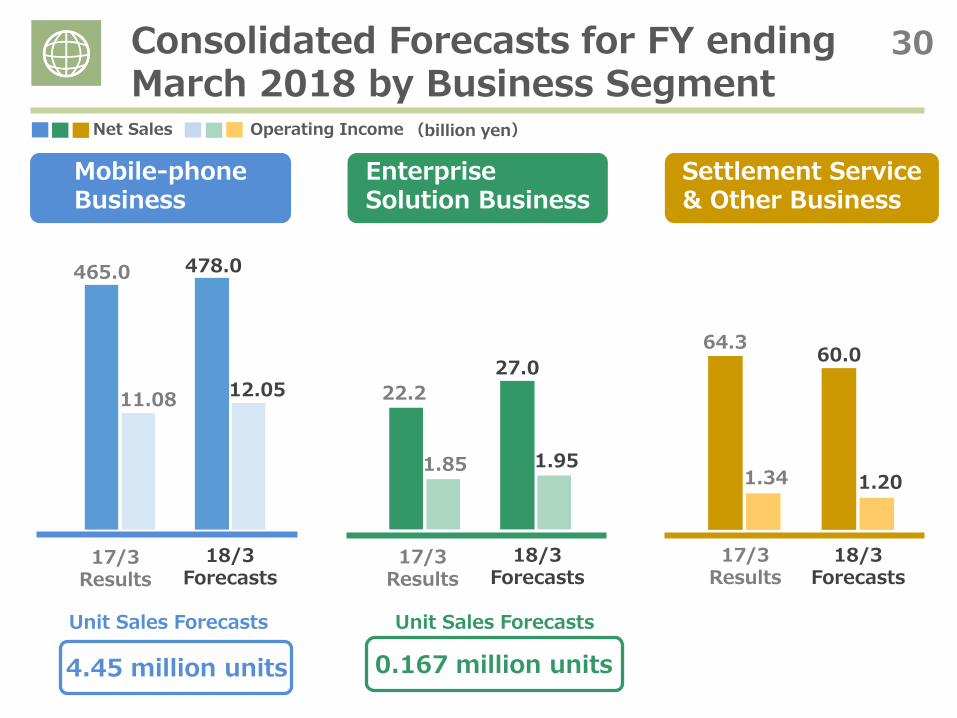
30 Consolidated Forecasts for FY ending March 2018 by Business Segment
Mobile-phone Business
Enterprise Solution Business
Settlement Service & Other Business
22.2
27.0
1.85 1.95
64.3 60.0
1.34 1.20
18/3 Forecasts
17/3 Results
18/3 Forecasts
17/3 Results
4.45 million units 0.167 million units
Unit Sales Forecasts Unit Sales Forecasts
(billion yen) Net Sales Operating Income
465.0 478.0
11.08 12.05
18/3 Forecasts
17/3 Results
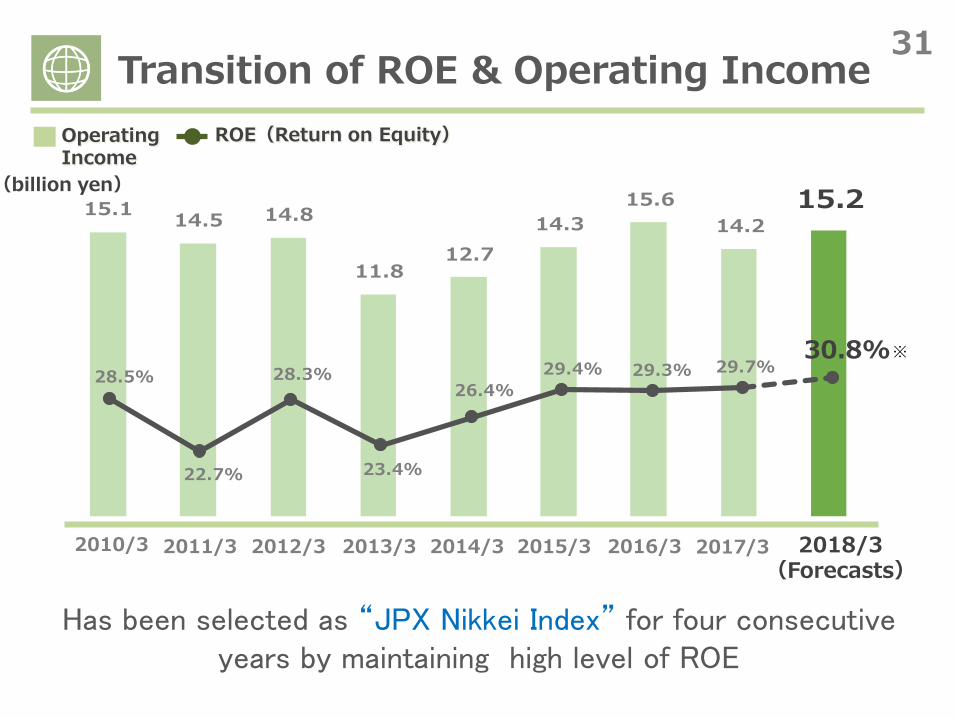
31
15.114.5 14.8
11.812.7
14.3
15.6
14.2
15.2
Operating Income
28.5%
22.7%
28.3%
23.4%
26.4%
29.4% 29.3% 29.7%30.8%
2010/3 2011/3
(billion yen)
2013/3 2012/3
ROE(Return on Equity)
2014/3 2015/3 2016/3
Has been selected as “JPX Nikkei Index” for four consecutive years by maintaining high level of ROE
※
2018/3 (Forecasts)
2017/3
Transition of ROE & Operating Income
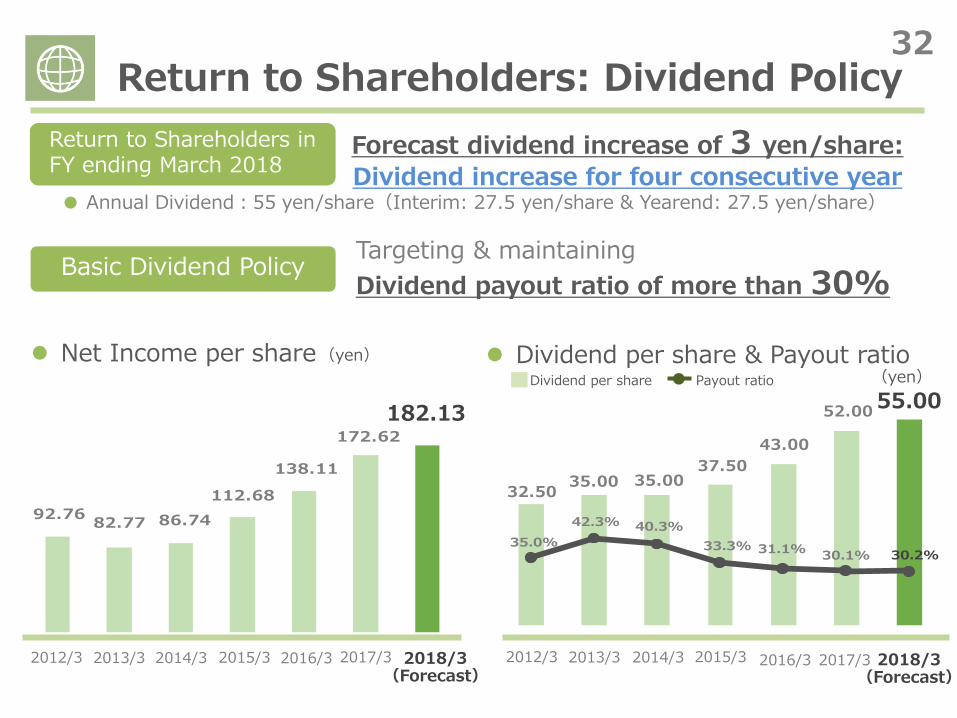
32
配当性向
32.5035.00 35.00
37.50
43.00
52.00
92.7682.77 86.74
112.68
138.11
172.62
Return to Shareholders in FY ending March 2018
● Annual Dividend:55 yen/share(Interim: 27.5 yen/share & Yearend: 27.5 yen/share)
Basic Dividend Policy Targeting & maintaining
Dividend payout ratio of more than 30%
182.13
Forecast dividend increase of 3 yen/share:
Dividend increase for four consecutive year
2018/3 (Forecast)
55.00 Dividend per share
35.0%
42.3% 40.3%
33.3% 31.1%30.1% 30.2%
2017/3 2012/3 2015/3 2016/3 2014/3 2013/3 2017/3 2012/3 2015/3 2016/3 2014/3 2013/3
(yen)
(yen)
Net Income per share Dividend per share & Payout ratio
Return to Shareholders: Dividend Policy
2018/3 (Forecast)
Payout ratio
33
For Better Work Environment
Action Plan for Better Productivity
Achieve Improved Productivity by Further Improving Efficiency, CS & ES
For further improvements in CS・ES, the variable work hours scheme has been introduced
One shop holiday per month has been added since 2017
Reduction of day-to-day shop opening hours
Reduced shop opening hours and closure during winter holiday seasons
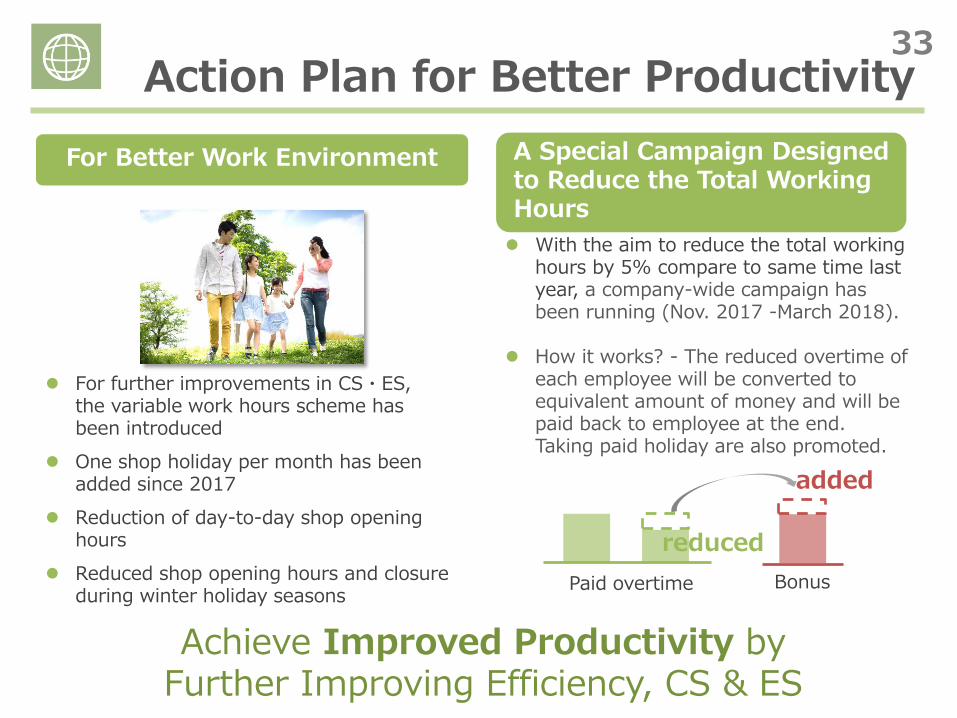
A Special Campaign Designed to Reduce the Total Working Hours
With the aim to reduce the total working hours by 5% compare to same time last year, a company-wide campaign has been running (Nov. 2017 -March 2018).
How it works? - The reduced overtime of
each employee will be converted to equivalent amount of money and will be paid back to employee at the end. Taking paid holiday are also promoted.
Bonus Paid overtime
reduced
added
34
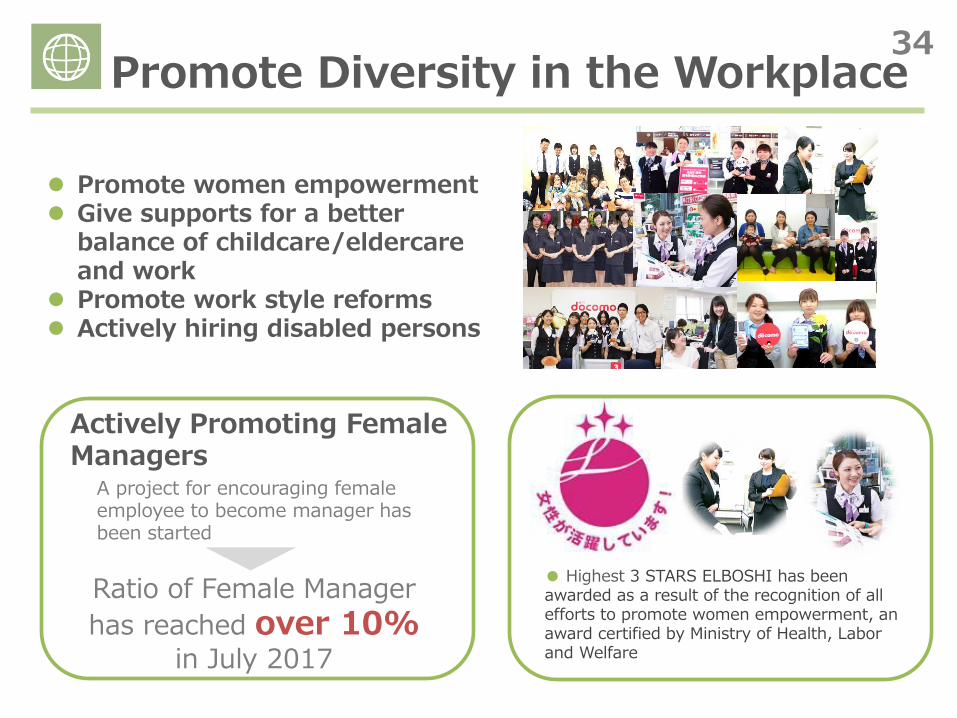
Promote women empowerment Give supports for a better
balance of childcare/eldercare and work
Promote work style reforms Actively hiring disabled persons
Promote Diversity in the Workplace
● Highest 3 STARS ELBOSHI has been awarded as a result of the recognition of all efforts to promote women empowerment, an award certified by Ministry of Health, Labor and Welfare
Actively Promoting Female Managers
Ratio of Female Manager
has reached over 10% in July 2017
A project for encouraging female employee to become manager has been started
35 For our society: CSR Activities
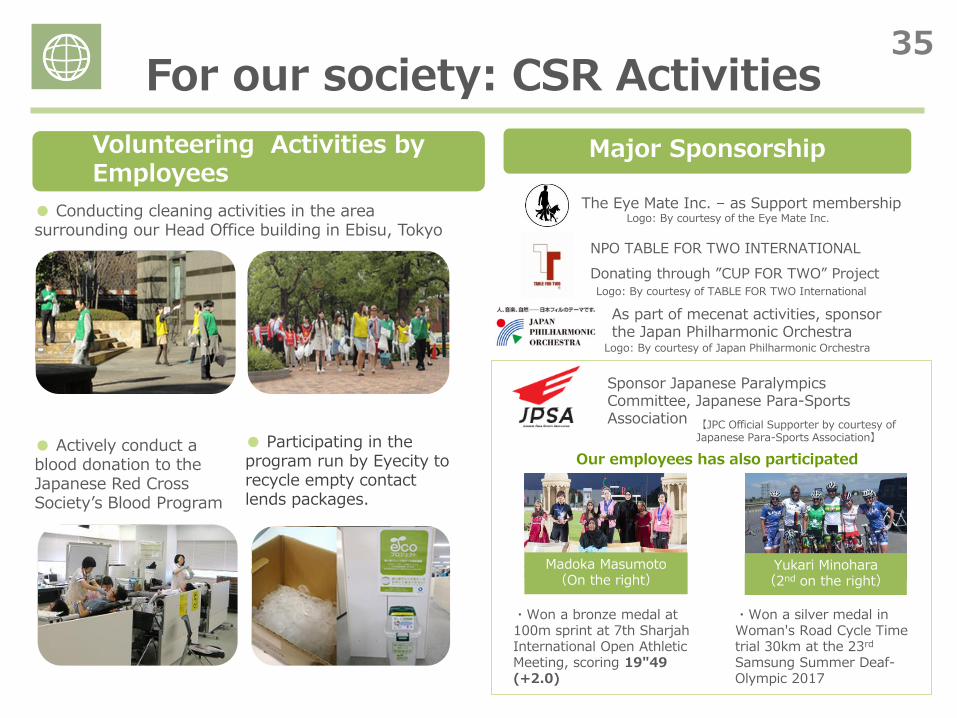
The Eye Mate Inc. – as Support membership
As part of mecenat activities, sponsor the Japan Philharmonic Orchestra
NPO TABLE FOR TWO INTERNATIONAL
Donating through ”CUP FOR TWO” Project
Our employees has also participated ● Participating in the program run by Eyecity to recycle empty contact lends packages.
Major Sponsorship
・Won a bronze medal at 100m sprint at 7th Sharjah International Open Athletic Meeting, scoring 19″49 (+2.0)
Yukari Minohara (2nd on the right)
・Won a silver medal in Woman's Road Cycle Time trial 30km at the 23rd Samsung Summer Deaf-Olympic 2017
Madoka Masumoto (On the right)
● Conducting cleaning activities in the area surrounding our Head Office building in Ebisu, Tokyo
Volunteering Activities by Employees
● Actively conduct a blood donation to the Japanese Red Cross Society’s Blood Program
Logo: By courtesy of the Eye Mate Inc.
Logo: By courtesy of TABLE FOR TWO International
Logo: By courtesy of Japan Philharmonic Orchestra
Sponsor Japanese Paralympics Committee, Japanese Para-Sports Association 【JPC Official Supporter by courtesy of
Japanese Para-Sports Association】
36 For Our Society: Activities by National Association of Mobile Phone Distributors
(Sign of the Certification)
(As of Dec. 2017)
“Reliable Carrier Shop” Recognition System
5,675 Carrier Shops(68% of all shops)
(including 285 shops directly managed by T-Gaia,
100% of all its shops)
※
※ docomo shops, au shops, Soft Bank shops and Y!mobile shops are the subject carrier shops
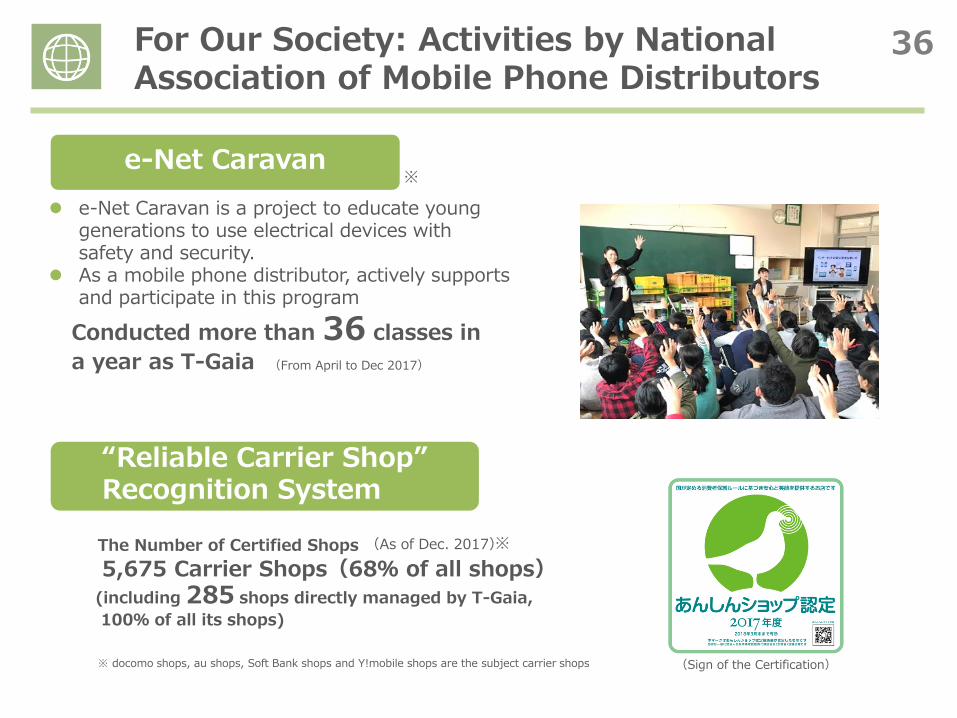
e-Net Caravan is a project to educate young generations to use electrical devices with safety and security.
As a mobile phone distributor, actively supports and participate in this program
※
Conducted more than 36 classes in
a year as T-Gaia (From April to Dec 2017)
The Number of Certified Shops
e-Net Caravan