Embed Size (px)
Citation preview

CONSOLIDATED ANNUAL FINANCIAL STATEMENTSFOR THE YEAR ENDED 30 JUNE 2017
GLADSTONE PORTS CORPORATION LIMITED
ACN 131 965 896 • ABN 96 263 788 242
Purpose and scopeGladstone Ports Corporation Limited (GPC) is a company Government Owned Corporation (GOC), constituted on 1 July
2004 under the provisions of the Government Owned Corporations Act 1993 (the Act). GPC converted to a company
GOC on 1 July 2008, under the provisions of the Act. Under the terms of s118 of the Act, the Financial Accountability Act
2009 applies to GPC as if it were a statutory body.
These statements have been prepared to:
(i) comply with the provisions of the Corporations Act 2001, and other prescribed requirements
(ii) comply with the provisions of the Financial Accountability Act 2009 and other prescribed requirements
(iii) communicate information concerning GPC’s financial performance for the year and its financial position at year end.
The statements are general purpose in nature and provide a full presentation of all the financial activities of GPC.
The consolidated financial report of GPC for the year ended 30 June 2017 was authorised for issue to shareholding
Ministers in accordance with a resolution of the Directors on 29 August 2017.
63FINANCIALS GLADSTONE PORTS CORPORATION ANNUAL REPORT 2016/17

Directors’ Report for the year ended 30 June 2017 ........................................................................................................................................65
Auditor’s Independence Declaration for the year ended 30 June 2017 ...............................................................................................71
Consolidated Statement of Profit and Loss and Other Comprehensive Income
for the year ended 30 June 2017 ................................................................................................................................................................................72
Consolidated Statement of Financial Position as at 30 June 2017 ........................................................................................................73
Consolidated Statement of Changes In Equity for the year ended 30 June 2017 ........................................................................74
Consolidated Statement of Cash Flows for the year ended 30 June 2017 .......................................................................................75
Notes to the Consolidated Financial Statements for the year ended 30 June 2017 ...................................................................76
1. General information ...................................................................................................................................................................................................76
2. Basis of preparation ...................................................................................................................................................................................................76
3. Significant accounting judgements, estimates and assumptions ..................................................................................................78
4. Subsidiaries .....................................................................................................................................................................................................................78
5. Parent entity information .......................................................................................................................................................................................79
6. Segment information .................................................................................................................................................................................................81
7. Profit from operating activities ............................................................................................................................................................................81
8. Income tax equivalent ..............................................................................................................................................................................................82
9. Cash and short-term deposits.............................................................................................................................................................................85
10. Trade and other receivables .................................................................................................................................................................................85
11. Property, plant and equipment ...........................................................................................................................................................................87
12. Investment properties ..............................................................................................................................................................................................92
13. Trade and other payables ......................................................................................................................................................................................93
14. Loans and borrowings – non-current............................................................................................................................................................. 94
15. Provisions ........................................................................................................................................................................................................................ 94
16. Issued capital .................................................................................................................................................................................................................96
17. Financial instruments risk management .......................................................................................................................................................96
18. Commitments and contingencies .....................................................................................................................................................................99
19. Auditor’s remuneration ............................................................................................................................................................................................99
20. Key management personnel disclosures ................................................................................................................................................... 100
21. Related party disclosure .......................................................................................................................................................................................103
22. Number of employees ............................................................................................................................................................................................104
Directors’ Declaration ......................................................................................................................................................................................................105
Independent Auditor’s Report ...................................................................................................................................................................................106
Glossary of terms ...............................................................................................................................................................................................................108
TABLE OF CONTENTS
64 FINANCIALS GLADSTONE PORTS CORPORATION ANNUAL REPORT 2016/17
The Directors present their report together with the consolidated financial statements of Gladstone Ports Corporation
Limited, being Gladstone Ports Corporation Limited (the parent) and its controlled entities (Gladstone Marine Pilot
Services Pty Ltd and Gladstone WICET Operations Pty Limited) for the year ended 30 June 2017 and the auditor’s
report thereon.
The Board comprises non-executive Directors who have a diversity of business experience as well as community
responsibilities. The criteria for membership of the Board are in accordance with the Act. The Act requires that, in
appointing a person as Director, the Governor in Council must have regard to that person’s ability to contribute to
the Group’s commercial performance and implementation of its Statement of Corporate Intent (SCI). Directors are
appointed for a term of not more than five years but may be reappointed.
In order to comply with the provisions of the Corporations Act 2001 the Directors submit their report for the year
ended 30 June 2017.
DirectorsThe names and details of the Company’s Directors in office during the financial year and until the date of this report
are as follows. Directors were in office for this entire period unless otherwise stated.
Chairman
Leo Zussino BE, MBALeo Zussino was appointed as Chairman from 15 September 1990 until 30 June 1999. Reappointed from 1 October
2015 until 30 September 2018. Leo is Chairman of the Human Resources Committee and a member of the Audit and
Compliance Committee and the Risk Committee.
During the past 30 years Leo has held senior executive and non-executive positions in both private and public sectors.
He has extensive experience as a non-executive Chairman of Australian and Queensland Government and Industry
Boards, and is a past CEO of the Group (2000 to 2013). Leo has a strong track record in strategic and corporate
planning, and major economic infrastructure project facilitation and delivery. This has provided solid commercial
outcomes, resulted in operational excellence, created robust commercial partnerships, and led to long-term successful
industrial and Government relationships. Leo has served as Chairman of Australian Maritime Safety Authority (2008
to 2014), Chairman of Gladstone Economic & Development Board (2001 to 2012), President of Ports Australia (1996
to 1998), Chairman of Queensland Ports Authority Association (1992 to 1999), and a Council Member of CQ University
(1990 to 2001).
Judy Reynolds, BBus, CA, MAICDAppointed 1 October 2008 until 30 September 2011. Reappointed from 1 October 2011 until 30 September 2014;
reappointed from 2 October 2014 until 30 September 2017. Judy is Chair of the Audit and Compliance Committee.
Judy is a chartered accountant with over 28 years’ as a manager and director in public accounting firms. She has
extensive experience in business development, profit and risk modelling and the formulation and implementation
of strategic growth strategies. Judy works in a wide range of industries with small and medium entities (SMEs),
their owners and business leaders as a consultant advisor, mentor and coach. Judy is a director of Opening Gates.
She previously owned a chartered accounting and financial planning business for over 15 years, chaired the National
Sothertons Board and acted as board member and advisor to many organisations including the Gladstone Economic
and Industry Development Board, and the Gladstone Foundation. She is a member of the Institute of Chartered
Accountants, and is a past Fellow of the Taxation Institute of Australia.
DIRECTORS’ REPORTFOR THE YEAR ENDED 30 JUNE 2017
65FINANCIALS GLADSTONE PORTS CORPORATION ANNUAL REPORT 2016/17

Peter Corones AM
Appointed Director 1 July 1994 for two years and extended to 30 June 1999. Reappointed from 1 July 1999 until 30
June 2003; reappointed from 1 July 2003 to 30 June 2005; reappointed from 1 July 2005 to 30 September 2007;
reappointed from 1 October 2007 to 30 September 2009; reappointed from 1 October 2009 until to 30 September
2012. Peter ceased as Director on 16 August 2012. Appointed in 1 October 2015 until 30 September 2018. Peter is a
member of the Human Resources Committee.
A business proprietor and company director, Peter’s strong background spans 40 years of extensive commercial and
community experience. Over the past three decades he has been a member of, or served in titled executive and non-
executive roles on, a number of key Boards and Authorities in the region. Current roles include Chairman of Gladstone
Area Group Apprentices Limited (GAGAL) and Governor in Council appointee to the CQ University Council. Peter
served on the City of Gladstone Council for more than 20 years, was Mayor for 14 years, and is a past Director of GPC.
Gladstone born, Peter has significant knowledge of the region’s economic and industry development; ports; tourism,
promotion, administration; project and community facilitation and understands the characteristics and challenges of
the region. Peter was awarded a Centenary Medal for distinguished service to local government (2001) and a Medal
of the Order of Australia (2009) for service to the Gladstone Region community.
Gail Davidson, FAICD
Appointed 1 October 2008 until 30 September 2011; reappointed from 1 October 2011 until 30 September 2014;
reappointed from 2 October 2014 until 30 September 2017. Gail is a member of the Human Resources Committee.
Gail has held management roles in a number of areas for over 40 years and until July 2016 was the Executive General
Manager Disability and Community Services for Endeavour Foundation. Gail has been involved in the disability sector
for over 26 years, having previously worked in the hospitality and health sectors. She has been a member of the
Gladstone Foundation Board of Advice, the Disability Council of Queensland, the Gambling Community Benefit Fund,
under Treasury, the Complaints Management Quality Committee advising the Minister and was the Inaugural Chair
of the Regional Disability Council of Central Queensland. At present she is also a Queensland representative
in Canberra on policy matters for the National Disability Service and has recently been appointed to the Board of
Mercy Community Services in Brisbane. She has qualifications in management, is a fellow of the Australian Institute
of Company Directors and is continuing her studies.
Grant Cassidy FAICD
Appointed 1 October 2015 until 30 September 2018. Grant is member of the Audit and Compliance Committee and the
Risk Committee.
Grant has over 15 years’ experience in the Gladstone area tourism industry, gained as Managing Director of the Cassidy
Hospitality Group, a specialist group which owns and operates accommodation and restaurant businesses in the
region. His 15 year’s media experience provides a depth of understanding of sales, marketing and media management.
As a very active and long-term contributor to the area’s community organisations Grant understands local issues,
having been Chairman of Capricorn Enterprise – the regions peak tourism and economic development organisation
and as a former member of the Tourism Queensland Board. In the latter role he chaired the Audit and Risk committee.
Grant has also previously held board positions with organisations such as Rockhampton Girls Grammar School and CQ
University Australia. Grant was one of the three Rockhampton representatives to attend The Queensland Plan forums.
In addition, Grant is also Chairman of the Capricorn Business Advisory Committee and a board member of Regional
Development Australia – Fitzroy & Central West, as well as Chairman of the Salvation Army Rockhampton Red Shield
Business Appeal Committee.
66 FINANCIALS GLADSTONE PORTS CORPORATION ANNUAL REPORT 2016/17

Peta Jamieson GradCertBA, BA (Hons), BA, MScEnvMgtAppointed 1 October 2015 until 30 September 2018. Peta is a member of the Human Resources Committee and the
Risk Committee.
Peta has over 20 years’ experience in Queensland State Government; Brisbane City Council and the Local Government
Association of Queensland (LGAQ), and is the director of her own management consultancy. She has a breadth of
both executive and operational experience, and a clear understanding of how government, its policies, and processes
work. Peta is a strong advocate for the Bundaberg and Wide Bay Burnett Region. She is actively involved with
community, commercial and government bodies such as the Wide Bay Burnett Regional Organisation of Councils,
Starfire Solutions, North Burnett Regional Council on local and regional projects and initiatives. Peta is also a Director
on the Wide Bay Hospital and Health Board and member of its Finance Committee, Executive Committee and Audit
and Risk Compliance Committee.
Marita Corbett BCom, CAAppointed 15 December 2016 until 30 September 2019. Marita is Chairman of the Risk Committee and a member of
the Audit and Compliance Committee.
Marita is a Chartered Accountant, Certified Internal Auditor and Certified in Risk Management Assurance. She has 25
years’ experience as a governance, risk management and accounting professional, supporting organisations to improve
operations and accomplish objectives through the evaluation of decision making, risk management, internal control
and governance processes. She is the National Lead Partner Risk Advisory for BDO.
Her experience has been built with a number of large organisations with significant revenue and asset bases, diverse
stakeholders, investments, commercial and operational scopes, and risk based decision making requirements.
Marita is Chair of the Audit and Risk Committee for the Department of Science, Information Technology, Innovation
and the Arts, Chair of the Audit and Risk Committee for the Department of Environment and Heritage Protection,
an Independent Member of the Audit and Risk Committee for the Public Safety Business Agency, an Independent
Member of the Audit Committee for the Queensland Parliamentary Service and a former Chair of the Risk
Management Committee of the Crime and Misconduct Commission.
Previous Director
Helen Skippen, B.Bus, MBA, GAICDAppointed 1 October 2010 until 30 September 2013. Reappointed from 12 December 2013 until 30 September 2016.
Helen was a member of the Audit and Compliance Committee.
Company Secretary
Mariette Lansdell, B.Comm (Hons), MBA, AGIADuring the past twenty years Mariette has participated in the banking, marketing, telecommunications and marine
industries in Australia, Europe and Africa. She has been engaged in several of the Group’s projects during the past
seven years. She was appointed by the Board as Company Secretary in March 2011.
Principal activitiesThe consolidated entity’s principal activities are to:
a) provide import and export shipping infrastructure to the Central Queensland region through the Port of Gladstone,
Port of Rockhampton and Port of Bundaberg, and encourage the use of these facilities for the economic benefit of
stakeholders
b) manage cargo handling facilities for coal and other bulk products at Port of Rockhampton, RG Tanna Coal Terminal
Barney Point Terminal and Auckland Point facilities
c) develop, manage and lease land and other assets for port related purposes
d) manage ancillary services and functions which support core business activities.
67FINANCIALS GLADSTONE PORTS CORPORATION ANNUAL REPORT 2016/17

2017$’000
2016$’000
Dividends paid from prior year profits 279,233 54,400
Dividends paid from asset revaluation reserve 126,594 -
Cents per share Cents per share
Dividend per share 100.94 13.53
Operating results for the yearThe Group’s net profit after income tax is $72.036M (2016: $83.298M) representing a decrease of 13.5% from the
previous year. All profits are from continuing operations. The 2017 results included net revaluation increases of $6.286M
(2016: revaluation decreases of $10.755M). These related to investment property write downs and reversal of previous
write downs on assets revalued as part of the end of year valuation process.
Auditor independenceA copy of the Auditor’s Independence Declaration as required under section 307C of the Corporations Act 2001 is
included following the Directors’ Report.
DividendsDividends paid to shareholders during the financial year were as follows:
In addition to the above dividends, the Directors recommended the payment of a final dividend at 100% of profits,
adjusted in line with Shareholding Ministers’ approval. The final dividend amounts to $61.037M (15.18 cents per share).
Review of financial conditions and likely developments2017 saw record tonnages through GPC of 121.2MT. RG Tanna Coal Terminal had a lower tonnage throughput of 59.8MT
(2016: 62.6MT), a drop of 4.5%. Coal throughput at Wiggins Island Coal Terminal partially offset these reductions with
an increase of 15.0% to 9.2MT was achieved. It is expected that the coal industry will continue to see small growth of
1-2% per annum in tonnages over the short to medium term. GPC has written off bad debts within the coal sector
of $16.7M in 2017 (2016: $22.9M).
The LNG industry exports continue to increase as the three plants on Curtis Island ramp up to capacity. Tonnages of
19.4MT (2016: 12.2MT), an increase of 59.6%, were attained during the year. The alumina industry continues its strong
performance with 2017 throughput in line with that from 2016. The increase in vessels from the LNG industry has also
driven an increase in pilotage revenue for the year to $23.9M from $20.7M in 2016.
Ordinary property revenue continued to decline (a decrease of 14.4%) in 2017 because of the general downturn in the
Gladstone property market. It is expected that this will continue in the short-term.
Over the next five years port development will focus on ensuring that the capacity of the shipping channels is matched
to the growth of trade.
Significant changes in the state of affairsThere were no significant changes in the state of affairs of Gladstone Ports Corporation during the year ended
30 June 2017.
Environmental regulationThe Group’s operations are subject to significant environmental regulations under both Commonwealth and State
legislation. Refer to comments under the section ‘Environment and Sustainability’ of the 2017 Annual Report.
There have been no significant known breaches of the consolidated entity’s licence conditions or any environmental
regulations to which it is subject.
68 FINANCIALS GLADSTONE PORTS CORPORATION ANNUAL REPORT 2016/17

Indemnification and insurance of Directors and OfficersDuring the financial year the Group indemnified all Directors and Executive Officers in respect of Directors and Officers
liability and company reimbursement insurance. The base premium paid amounted to $84,535.
Under the policy the insurer agrees to pay:
(a) all losses which each insured person becomes legally obligated to pay on account of any claims for wrongful acts
(b) all losses for which the company may grant indemnification to each insured person.
The Group has not otherwise during or since the end of the financial year, except to the extent permitted by law,
indemnified an officer of the company against a liability incurred as such an officer.
Directors’ attendance at Board and Committee meetings
Committee membershipAt the date of this report the Group had an Audit and Compliance Committee, a Human Resources Committee and a
Risk Committee.
Directors’ interestsThe Directors have no interest in any shares of the Group as all shares are held for the benefit of the State of
Queensland by Ministers of the Crown.
Remuneration of key management personnelNote 20 of the consolidated financial statements provides detailed disclosures relating to the remuneration of key
management personnel. The term key management personnel refers to those persons having the authority and
responsibility for planning, directing and controlling the activities of GPC, directly or indirectly, including any director
of GPC.
Audit and Compliance Committee: Human Resources Committee: Risk Committee
Judy Reynolds – Chair Leo Zussino – Chairman Marita Corbett – Chair
Leo Zussino Gail Davidson Leo Zussino
Grant Cassidy Peter Corones AM Grant Cassidy
Marita Corbett Peta Jamieson Peta Jamieson
Board (9 held)
Audit and Compliance Committee
(5 held)
Human Resources Committee
(5 held)
Risk Committee (1 held)
Leo Zussino 9 (out of 9) 4 (out of 5) 5 (out of 5) 1 (out of 1)
Judy Reynolds 9 (out of 9) 5 (out of 5) 0 (out of 0) 0 (out of 0)
Peter Corones AM 9 (out of 9) 0 (out of 0) 5 (out of 5) 0 (out of 0)
Gail Davidson 9 (out of 9) 0 (out of 0) 5 (out of 5) 0 (out of 0)
Grant Cassidy 9 (out of 9) 5 (out of 5) 0 (out of 0) 1 (out of 1)
Peta Jamieson 8 (out of 9) 0 (out of 0) 5 (out of 5) 1 (out of 1)
Marita Corbett 4 (out of 5) 2 (out of 2) 0 (out of 0) 1 (out of 1)
Helen Skippen 3 (out of 3) 2 (out of 2) 0 (out of 0) 0 (out of 0)
69FINANCIALS GLADSTONE PORTS CORPORATION ANNUAL REPORT 2016/17

Risk managementThe Group, in carrying out its business, maintains a risk management philosophy that appropriately:
a) protects the wellbeing of the Group’s workforce, the wider community in which it operates and its physical
environment
b) manages threats that could adversely affect the Group’s ability to meet its corporate objectives, its growth in
shareholder value and its stewardship of company assets.
Proceedings on behalf of companyNo person has applied to the Court under section 237 of the Corporations Act 2001 (Cth) for leave to bring
proceedings on behalf of GPC, or to intervene in any proceedings to which GPC is a party, for the purpose of taking
responsibility on behalf of the company for all or part of those proceedings.
No proceedings have been brought of GPC with leave of the Court under section 237 of the Corporations Act (Cth).
Subsequent eventsThere has not been any matter or circumstance occurring subsequent to the end of the financial year that has
significantly affected, or may significantly affect, the operations of the consolidated entity, the results of those
operations, or the state of affairs of the consolidated entity in future years.
The Directors’ Report is signed in accordance with a resolution of the Directors made pursuant to s298 (2) of the
Corporations Act 2001 (Cth). On behalf of the Directors:
Leo Zussino
Chairman
Dated: 29 August 2017
70 FINANCIALS GLADSTONE PORTS CORPORATION ANNUAL REPORT 2016/17

To the Directors of Gladstone Ports Corporation Limited
This auditor’s independence declaration has been provided pursuant to x.307C of the Corporations Act 2001.
Independence declaration
As lead auditor for the audit of Gladstone Ports Corporation Limited for the financial year ended 30 June 2017,
I declare that, to the best of my knowledge and belief, there have been:
(a) no contraventions of the auditor independence requirements of the Corporations Act 2001 in relation to the audit
(b) no contraventions of any applicable code of professional conduct in relation to the audit.
D Adams Queensland Audit Office
As delegate of the Auditor-General Brisbane
AUDITOR’S INDEPENDENCE DECLARATIONFOR THE YEAR ENDED 30 JUNE 2017
71FINANCIALS GLADSTONE PORTS CORPORATION ANNUAL REPORT 2016/17
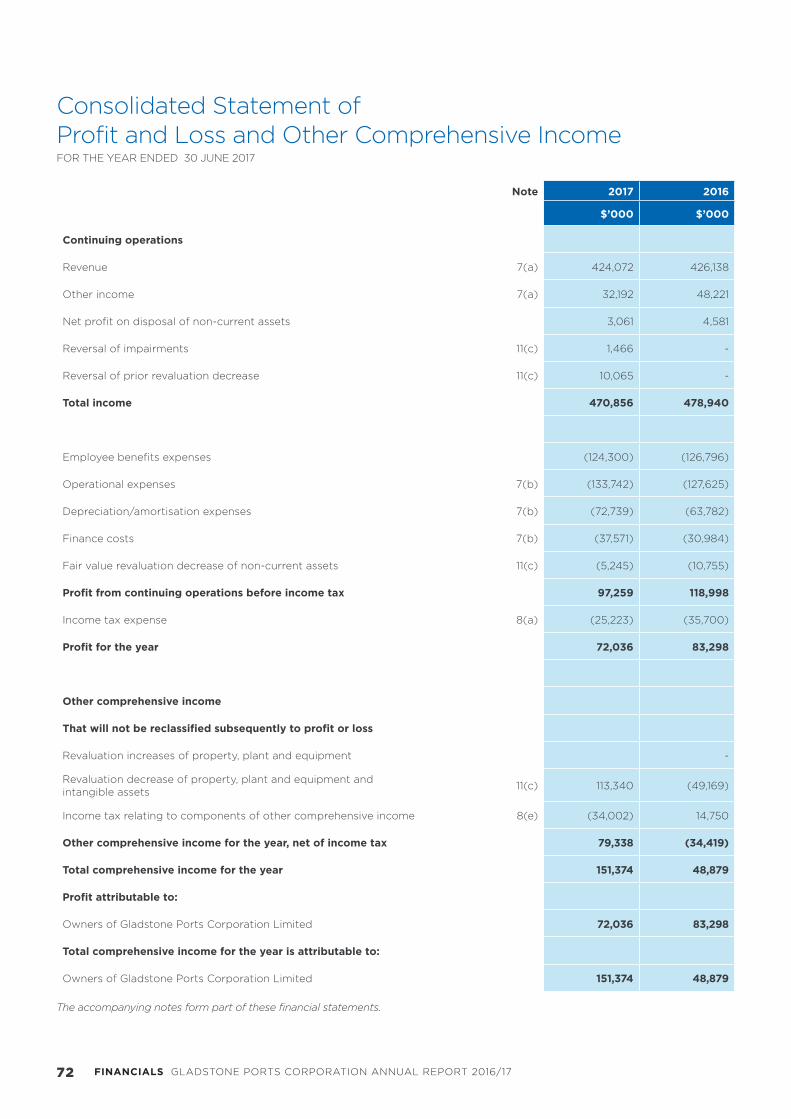
Consolidated Statement of Profit and Loss and Other Comprehensive IncomeFOR THE YEAR ENDED 30 JUNE 2017
Note 2017 2016
$’000 $’000
Continuing operations
Revenue 7(a) 424,072 426,138
Other income 7(a) 32,192 48,221
Net profit on disposal of non-current assets 3,061 4,581
Reversal of impairments 11(c) 1,466 -
Reversal of prior revaluation decrease 11(c) 10,065 -
Total income 470,856 478,940
Employee benefits expenses (124,300) (126,796)
Operational expenses 7(b) (133,742) (127,625)
Depreciation/amortisation expenses 7(b) (72,739) (63,782)
Finance costs 7(b) (37,571) (30,984)
Fair value revaluation decrease of non-current assets 11(c) (5,245) (10,755)
Profit from continuing operations before income tax 97,259 118,998
Income tax expense 8(a) (25,223) (35,700)
Profit for the year 72,036 83,298
Other comprehensive income
That will not be reclassified subsequently to profit or loss
Revaluation increases of property, plant and equipment -
Revaluation decrease of property, plant and equipment and intangible assets
11(c) 113,340 (49,169)
Income tax relating to components of other comprehensive income 8(e) (34,002) 14,750
Other comprehensive income for the year, net of income tax 79,338 (34,419)
Total comprehensive income for the year 151,374 48,879
Profit attributable to:
Owners of Gladstone Ports Corporation Limited 72,036 83,298
Total comprehensive income for the year is attributable to:
Owners of Gladstone Ports Corporation Limited 151,374 48,879
The accompanying notes form part of these financial statements.
72 FINANCIALS GLADSTONE PORTS CORPORATION ANNUAL REPORT 2016/17
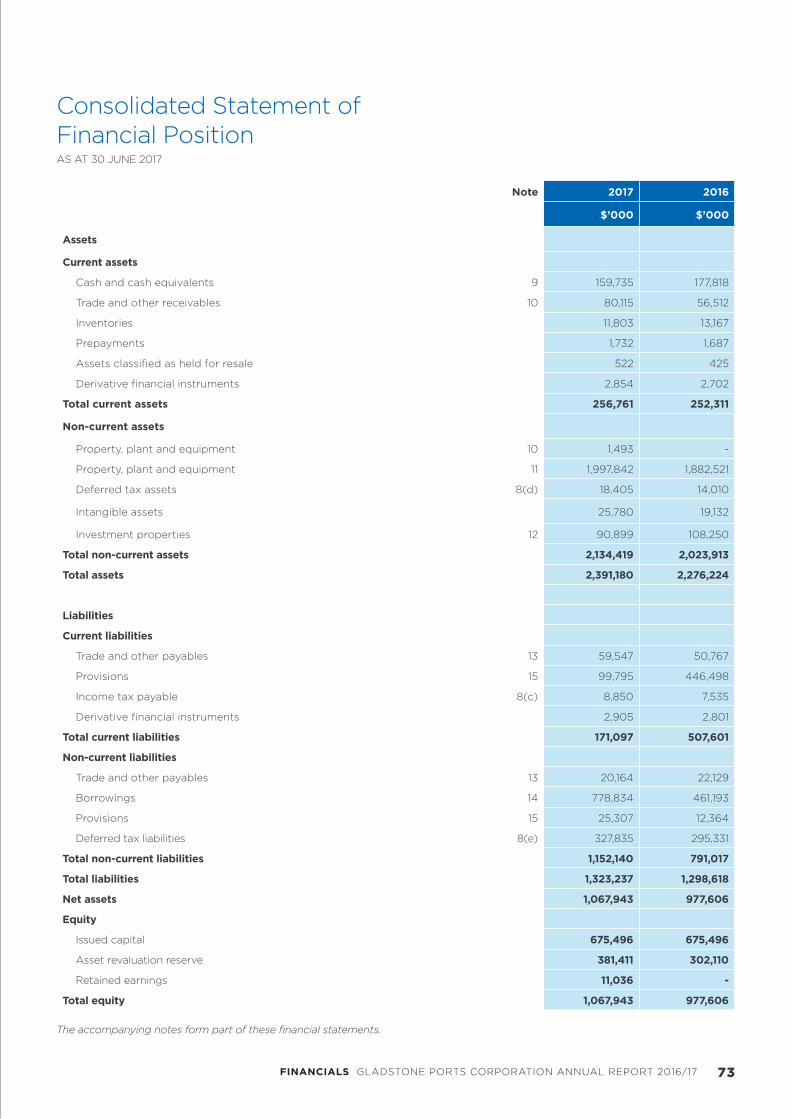
Consolidated Statement of Financial PositionAS AT 30 JUNE 2017
Note 2017 2016
$’000 $’000
Assets
Current assets
Cash and cash equivalents 9 159,735 177,818
Trade and other receivables 10 80,115 56,512
Inventories 11,803 13,167
Prepayments 1,732 1,687
Assets classified as held for resale 522 425
Derivative financial instruments 2,854 2,702
Total current assets 256,761 252,311
Non-current assets
Property, plant and equipment 10 1,493 -
Property, plant and equipment 11 1,997,842 1,882,521
Deferred tax assets 8(d) 18,405 14,010
Intangible assets 25,780 19,132
Investment properties 12 90,899 108,250
Total non-current assets 2,134,419 2,023,913
Total assets 2,391,180 2,276,224
Liabilities
Current liabilities
Trade and other payables 13 59,547 50,767
Provisions 15 99,795 446,498
Income tax payable 8(c) 8,850 7,535
Derivative financial instruments 2,905 2,801
Total current liabilities 171,097 507,601
Non-current liabilities
Trade and other payables 13 20,164 22,129
Borrowings 14 778,834 461,193
Provisions 15 25,307 12,364
Deferred tax liabilities 8(e) 327,835 295,331
Total non-current liabilities 1,152,140 791,017
Total liabilities 1,323,237 1,298,618
Net assets 1,067,943 977,606
Equity
Issued capital 675,496 675,496
Asset revaluation reserve 381,411 302,110
Retained earnings 11,036 -
Total equity 1,067,943 977,606
The accompanying notes form part of these financial statements.
73FINANCIALS GLADSTONE PORTS CORPORATION ANNUAL REPORT 2016/17
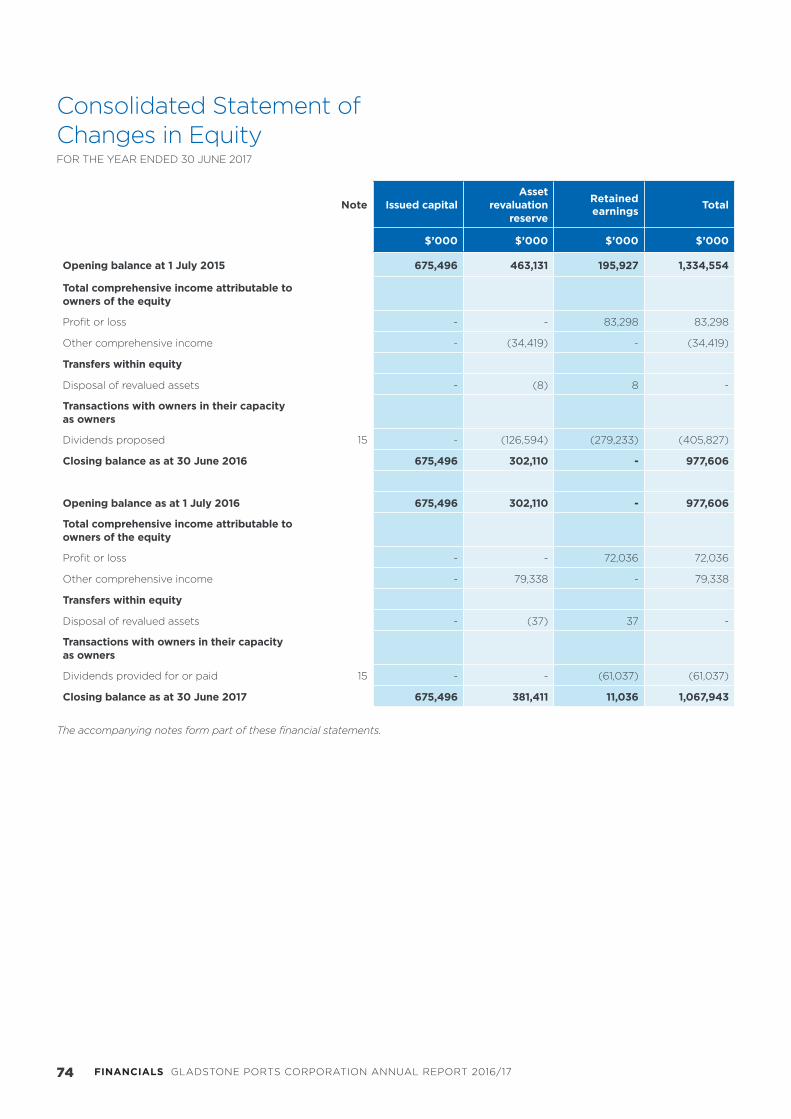
Consolidated Statement of Changes in EquityFOR THE YEAR ENDED 30 JUNE 2017
Note Issued capitalAsset
revaluation reserve
Retained earnings
Total
$’000 $’000 $’000 $’000
Opening balance at 1 July 2015 675,496 463,131 195,927 1,334,554
Total comprehensive income attributable to owners of the equity
Profit or loss - - 83,298 83,298
Other comprehensive income - (34,419) - (34,419)
Transfers within equity
Disposal of revalued assets - (8) 8 -
Transactions with owners in their capacity as owners
Dividends proposed 15 - (126,594) (279,233) (405,827)
Closing balance as at 30 June 2016 675,496 302,110 - 977,606
Opening balance as at 1 July 2016 675,496 302,110 - 977,606
Total comprehensive income attributable to owners of the equity
Profit or loss - - 72,036 72,036
Other comprehensive income - 79,338 - 79,338
Transfers within equity
Disposal of revalued assets - (37) 37 -
Transactions with owners in their capacity as owners
Dividends provided for or paid 15 - - (61,037) (61,037)
Closing balance as at 30 June 2017 675,496 381,411 11,036 1,067,943
The accompanying notes form part of these financial statements.
74 FINANCIALS GLADSTONE PORTS CORPORATION ANNUAL REPORT 2016/17

Consolidated Statement of Cash FlowsFOR THE YEAR ENDED 30 JUNE 2017
Note 2017 2016
$’000 $’000
Cash flows from operating activities
Receipts from customers 469,886 537,967
Tax equivalents paid to Queensland Treasury (29,801) (34,377)
Net FBT, Fuel Tax Credit and GST paid to Australian Taxation Office (ATO) (20,365) (28,050)
Payments to suppliers (136,606) (139,794)
Employee related payments (123,503) (126,077)
Interest received 2,826 3,083
Interest paid (31,048) (25,837)
Other finance costs (6,523) (5,147)
Net cash flows from operating activities 9(a) 124,866 181,768
Cash flows from investing activities
Proceeds from sale of property, plant and equipment and investment properties 3,777 6,933
Purchase of property, plant and equipment (46,655) (65,799)
Purchase of intangibles (11,885) (2,129)
Net cash flows used in investing activities (54,763) (60,995)
Cash flows from financing activities
Repayment of borrowings - (151)
Loan drawdowns 317,641 -
Dividends paid (405,827) (54,400)
Net cash flows from financing activities (88,186) (54,551)
Net (decrease)/increase in cash and cash equivalents (18,083) 66,222
Cash and cash equivalents at beginning of the financial year 177,818 111,596
Cash and cash equivalents at the end of the financial year 9 159,735 177,818
The accompanying notes form part of these financial statements.
75FINANCIALS GLADSTONE PORTS CORPORATION ANNUAL REPORT 2016/17

Notes to the Consolidated Financial StatementsFOR THE YEAR ENDED 30 JUNE 2017
1. General informationThe financial statements comprise the consolidated financial statements of the Group. The Group is a for profit entity
and includes Gladstone Ports Corporation Limited, Gladstone Marine Pilot Services Pty Ltd and Gladstone WICET
Operations Pty Ltd. Gladstone Ports Corporation Limited (GPC) is a public company incorporated and operating in
Australia. GPC’s registered office and principal place of business is:
40 Goondoon Street
Gladstone QLD 4680
Tel: (07) 4976 1333
The consolidated entity’s principal activities are to:
a) provide import and export shipping infrastructure to the Central Queensland region through the Port of Gladstone,
Port of Rockhampton and Port of Bundaberg, and encourage the use of these facilities for the economic benefit of
stakeholders
b) manage cargo handling facilities for coal and other bulk products at Port of Rockhampton, RG Tanna Coal Terminal
Barney Point Terminal and Auckland Point facilities
c) develop, manage and lease land and other assets for port related purposes
d) manage ancillary services and functions which support core business activities.
Information on the Group’s structure is provided in Note 4 and information on other related party relationships is
provided in Note 21.
2. Basis of preparation
(1) Presentation
Historical cost convention
These financial statements have been prepared under the historical cost convention, as modified by the revaluation
of the available-for-sale financial assets, financial assets and liabilities at fair value through profit and loss and certain
classes of property plant and equipment and investment property measured at fair value.
Functional currency
The consolidated financial statements are presented in Australian Dollars which is the entity’s functional currency.
Rounding of amounts
The financial report is presented in Australian dollars and the company is of a kind referred to in ASIC Class Order
98/0100 dated 10 July 1998. In accordance with that Class Order, amounts in the financial report and Directors’ Report
have been rounded to the nearest one thousand dollars, unless otherwise stated.
Classification between current and non-current
The Group presents assets and liabilities in the statement of financial position based upon current/non-current
classification. An asset or liability is classified as current when it is expected to be turned over within the next twelve
months. All other items are classified as non-current.
Foreign currency transactions and balances
In preparing the financial statements, transactions in currencies other than Australian Dollars are recorded at the
rates of exchange prevailing on the dates of the transactions. At each Statement of Financial Position date, monetary
items denominated in foreign currencies are retranslated at the rates prevailing at the Statement of Financial Position
date. Non-monetary items carried at fair value that are denominated in foreign currencies are retranslated at the rates
prevailing on the date when fair value was determined. Non-monetary items that are measured in terms of historical
cost in a foreign currency are not retranslated.
76 FINANCIALS GLADSTONE PORTS CORPORATION ANNUAL REPORT 2016/17
Comparatives
Comparative information reflects the audited 2015-16 financial statements.
Goods and services tax (GST)
Revenues, expenses and assets are recognised net of the amount of GST, except where the amount of GST incurred is
not recoverable from the ATO. In these circumstances, the GST is recognised as part of the cost of acquisition or part
of the item of expense. Trade receivables and payables are stated with the amount of GST included.
Commitments and contingencies are disclosed net of the amount of GST recoverable from, or payable to the ATO.
Cash flows are included in the Consolidated Statement of Cash Flows on a gross basis. The GST components of cash
flows arising from investing and financing activities that are recoverable from or payable to the ATO, are classified as
operating cash flows.
The net amount of GST recoverable from, or payable to, the taxation authority is included as part of the receivables in
the Consolidated Statement of Financial Position.
(2) Basis of consolidationThe consolidated financial statements represent the financial statements of GPC and its subsidiaries.
All intragroup assets and liabilities, equity, income, expenses and cash flows relating to transactions between members
of the Group are eliminated in full on consolidation. Details of all subsidiaries are listed in Note 4. Parent entity financial
statements are listed in Note 5.
(3) Statement of complianceThese consolidated financial statements are a general purpose financial report and have been prepared in accordance
with the Corporations Act 2001, the Financial Accountability Act 2009, applicable Australian Accounting Standards and
other authoritative pronouncements of the Australian Accounting Standards Board.
The consolidated financial statements of Gladstone Ports Corporation Limited and its subsidiaries (collectively, ‘the
Group’) for the year ended 30 June 2017 were authorised for issue in accordance with a resolution of the directors on
29 August 2017.
The financial statements of Gladstone Ports Corporation Limited also comply with International Financial Reporting
Standards (IFRS) as issued by the International Accounting Standards Board (IASB).
(4) Changes in accounting policies, disclosures, standards and interpretations
Accounting policies
Unless otherwise stated, all accounting policies applied are consistent with those of the prior year. Where appropriate,
comparative figures have been amended to accord with the current year’s presentation and disclosure.
Accounting Standards and Interpretation issued but not yet effective
The Group has not adopted Australian Accounting Standards and Interpretations that have recently been issued
or amended but are not yet effective for the annual reporting period ended 30 June 2017. These are outlined in
the table below:
2. Basis of preparation (cont)
(1) Presentation (cont)
77FINANCIALS GLADSTONE PORTS CORPORATION ANNUAL REPORT 2016/17

3. Significant accounting judgements, estimates and assumptionsThe preparation of the Group’s consolidated financial statements requires management to make judgements,
estimates and assumptions that affect the reported amounts of revenues, expenses, assets and liabilities, and the
accompanying disclosures, and the disclosure of contingent liabilities. Uncertainty about these assumptions and
estimates could result in outcomes that require a material adjustment to the carrying amount of assets or liabilities
affected in future periods.
The Group based its assumptions and estimates on parameters available when the consolidated financial statements
were prepared. Existing circumstances and assumptions about future developments, however, may change due
to market changes or circumstances arising beyond the control of the Group. Such changes are reflected in the
assumptions when they occur.
The areas involving a higher degree of judgement and complexity, or areas where assumptions and estimates
significant to the financial statements are disclosed in the following notes:
Valuation of property, plant and equipment Note 11c
Personal leave and long service provision Note 15
Recovery of deferred tax assets Note 8d
Estimation of useful lives of assets Note 11a
Provision for impaired debts Note 10
Name of subsidiary Principal activityPlace of incorporation
and operation
Proportion of ownership interest and voting power held by the Group
30 June 2017 30 June 2016
Gladstone Marine Pilot Services Pty Ltd
Pilotage services Australia 100% 100%
Gladstone WICET Operations Pty Ltd
Dormant Australia 100% 100%
4. SubsidiariesDetails of the Group’s subsidiaries as at 30 June 2017 are as follows:
2. Basis of preparation (cont)
(4) Changes in accounting policies, disclosures, standards and interpretations (cont)
TitleOperative for reporting
periods beginning on/afterAssessment
AASB 9: Financial Instruments 1 January 2018GPC has undertaken a preliminary review of this standard and will commence a full review of its impact in late 2017.
AASB 15: Revenue from Contracts with Customers
1 January 2018
GPC has undertaken a preliminary review of the standard and will commence a full review of revenue contracts in late 2017 to ascertain any financial impact of the new standard.
AASB 16: Leases 1 January 2019
GPC has undertaken a preliminary review of the standard and believe that it will not have a material impact on the financial statements. A full review to ascertain the actual impact will be undertaken in late 2017.
AASB 2016-2: Amendments to Australian Accounting Standards – Disclosure Initiative: Amendments to AASB 107
1 January 2017GPC has undertaken a preliminary review of this standard and will commence a full review of its impact in late 2017.
The Group intends to apply accounting standards and interpretations as they are required and not earlier.
78 FINANCIALS GLADSTONE PORTS CORPORATION ANNUAL REPORT 2016/17
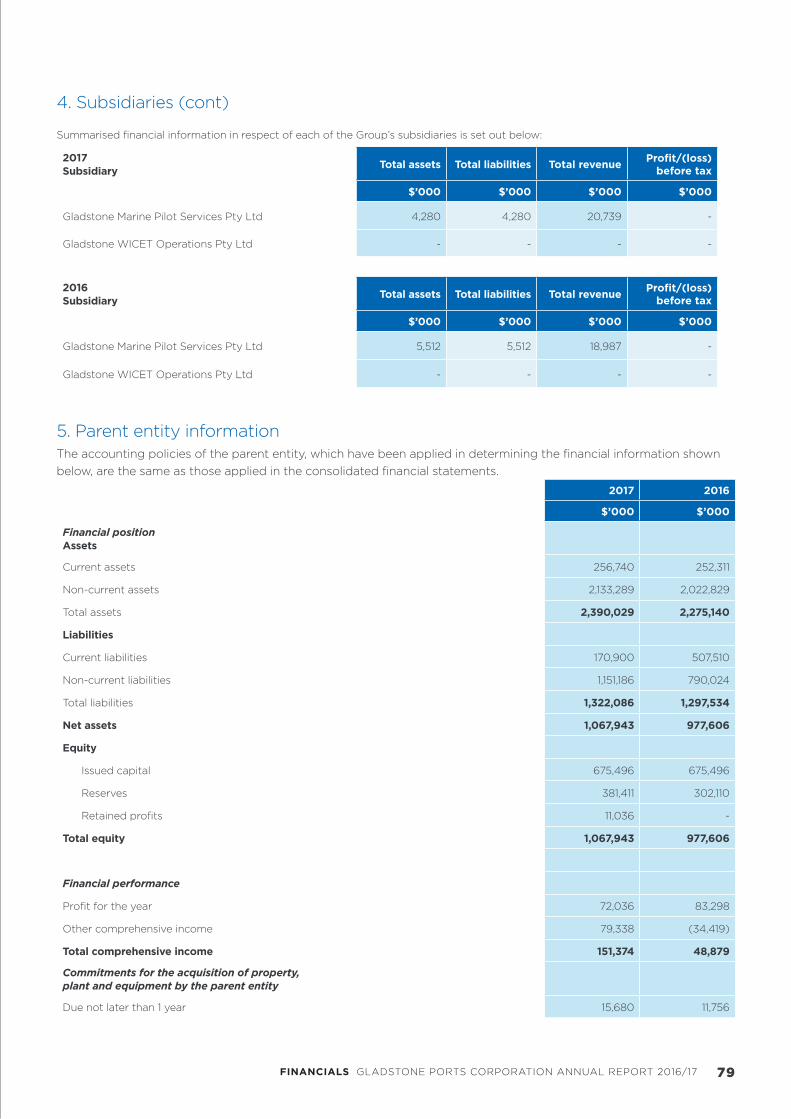
2017 Subsidiary
Total assets Total liabilities Total revenueProfit/(loss)
before tax
$’000 $’000 $’000 $’000
Gladstone Marine Pilot Services Pty Ltd 4,280 4,280 20,739 -
Gladstone WICET Operations Pty Ltd - - - -
2016 Subsidiary
Total assets Total liabilities Total revenueProfit/(loss)
before tax
$’000 $’000 $’000 $’000
Gladstone Marine Pilot Services Pty Ltd 5,512 5,512 18,987 -
Gladstone WICET Operations Pty Ltd - - - -
2017 2016
$’000 $’000
Financial position Assets
Current assets 256,740 252,311
Non-current assets 2,133,289 2,022,829
Total assets 2,390,029 2,275,140
Liabilities
Current liabilities 170,900 507,510
Non-current liabilities 1,151,186 790,024
Total liabilities 1,322,086 1,297,534
Net assets 1,067,943 977,606
Equity
Issued capital 675,496 675,496
Reserves 381,411 302,110
Retained profits 11,036 -
Total equity 1,067,943 977,606
Financial performance
Profit for the year 72,036 83,298
Other comprehensive income 79,338 (34,419)
Total comprehensive income 151,374 48,879
Commitments for the acquisition of property, plant and equipment by the parent entity
Due not later than 1 year 15,680 11,756
4. Subsidiaries (cont) Summarised financial information in respect of each of the Group’s subsidiaries is set out below:
5. Parent entity informationThe accounting policies of the parent entity, which have been applied in determining the financial information shown
below, are the same as those applied in the consolidated financial statements.
79FINANCIALS GLADSTONE PORTS CORPORATION ANNUAL REPORT 2016/17

2017 2016
$’000 $’000
Revenue
Cargo handling charges 238,928 249,718
Harbour dues 85,197 74,289
Tonnage rates 52,876 55,309
Other shipping charges 8,574 8,964
Pilotage 23,933 20,749
Property revenue 12,524 14,625
Smallcraft services 2,040 2,484
Total 424,072 426,138
Other income
Interest received 2,973 3,083
Recoverable works 11,299 9,696
Other 17,920 35,442
Total 32,192 48,221
7. Profit from operating activities
(a) RevenueRevenue is recognised when services are delivered and is measured at the fair value of the consideration received
or receivable to the extent that it is probable that the economic benefits will flow to the Group and the revenue
can be reliably measured, regardless of when the payment is received. Revenue is measured at the fair value of the
consideration received or receivable, taking into account contractually defined terms of payment.
Revenue has been calculated based on existing contracts. Harbour dues, tonnage rates, other shipping charges or
cargo handling charges for all vessels are invoiced after departure of the vessel.
Lease revenue from investment properties is recognised in revenue on a straight-line basis over the term of the lease
and is included in revenue in the Consolidated Statement of Profit or Loss and Other Comprehensive Income due to
its operating nature.
Interest received is recognised as interest accrues using the effective interest method.
The profit or loss on sale of an asset is determined when control has passed to the buyer. In accounting for the sale of
non-current assets, the net gains/losses on sale of assets sold are included in the Consolidated Statement of Profit and
Loss and Other Comprehensive Income.
6. Segment informationThe Group operates in a single segment, namely the maritime port industry, at three locations in Central Queensland -
Port of Gladstone, Port of Rockhampton and Port of Bundaberg.
80 FINANCIALS GLADSTONE PORTS CORPORATION ANNUAL REPORT 2016/17

7. Profit from operating activities (cont)
(b) ExpensesExpenses from continuing operations before related income tax equivalent expense includes:
Note 2017 2016
$’000 $’000
Depreciation/amortisation expense
Property, plant and equipment 11(a) 67,703 61,115
Intangibles 5,055 2,574
Investment properties 12 (19) 93
Total 72,739 63,782
Operational expenses
Contractors 40,453 41,550
Services and consultants 11,272 8,213
Indirect taxes and government charges 7,079 7,315
Materials and supplies 16,018 14,617
Energy 18,239 17,651
Insurance 3,334 2,852
Lease payments 3,043 2,874
Bad debts 16,710 22,914
Rehabilitation provision 14,019 5,716
Other 3,575 3,923
Total 133,742 127,625
Finance costs
Interest 31,050 25,836
Competitive neutrality fee 6,571 5,059
Financial instrument (profit)/loss (50) 100
(Gains)/losses on foreign exchange - (11)
Total 37,751 30,984
Borrowing costs directly attributable to the acquisition, construction or production of an asset that necessarily takes a
substantial period of time to get ready for its intended use or sale are capitalised as part of the cost of the asset. All other
borrowing costs are expensed in the period in which they occur. Borrowing costs consist of interest and other costs that
the Group incurs in connection with the borrowing of funds. No borrowing costs were capitalised in 2017 or 2016.
81FINANCIALS GLADSTONE PORTS CORPORATION ANNUAL REPORT 2016/17

8. Income tax equivalent
Income tax expense represents the sum of the tax currently payable and deferred tax.
Current income tax
As a Government Owned Corporation (GOC), the Group is required to pay income tax equivalents under the National
Tax Equivalents Regime (NTER) and is required to adopt tax effect accounting in accordance with AASB 112 Income
Taxes. The Group’s current tax is calculated using tax rates that have been enacted or substantively enacted by the
end of the reporting period (2017 and 2016: 30%).
Deferred tax
Deferred tax is recognised on temporary differences between the carrying amounts of assets and liabilities in the
consolidated financial statements and the corresponding tax bases used in the computation of taxable profit. Deferred
income tax assets and liabilities are measured at the tax rates that are expected to apply to the year when the asset is
realised or the liability is settled, based on tax rates that have been enacted or substantively enacted at the end of the
reporting period.
Current and deferred tax are recognised in profit or loss, except where they relate to items that are recognised in other
comprehensive income or directly in equity. Tax assets and liabilities are offset if the underlying taxes relate to the
same taxation authority.
Tax consolidation
GPC and its wholly-owned entities are a tax consolidated group for income tax purposes. The head entity in this Group
is Gladstone Ports Corporation Limited. Current tax liabilities and assets and deferred tax assets arising from unused
tax losses and relevant tax credits of the members of the tax consolidated group are recognised by the Company.
(a) Income tax equivalent expense
2017 2016
$’000 $’000
Profit before income tax equivalents 97,259 118,998
Prima facie tax at 30% 29,178 35,699
Non-deductible (revenue)/expenses 522 1
Research and development tax offset 2016 (2,013) -
Research and development tax offset provision 2017 (1,580) -
Prior year over provision (884) -
Income tax expense 25,223 35,700
Comprised of
Deferred tax asset (4,395) (1,019)
Deferred tax liability (1,498) 6,276
Income tax payable 31,116 30,443
25,223 35,700
82 FINANCIALS GLADSTONE PORTS CORPORATION ANNUAL REPORT 2016/17
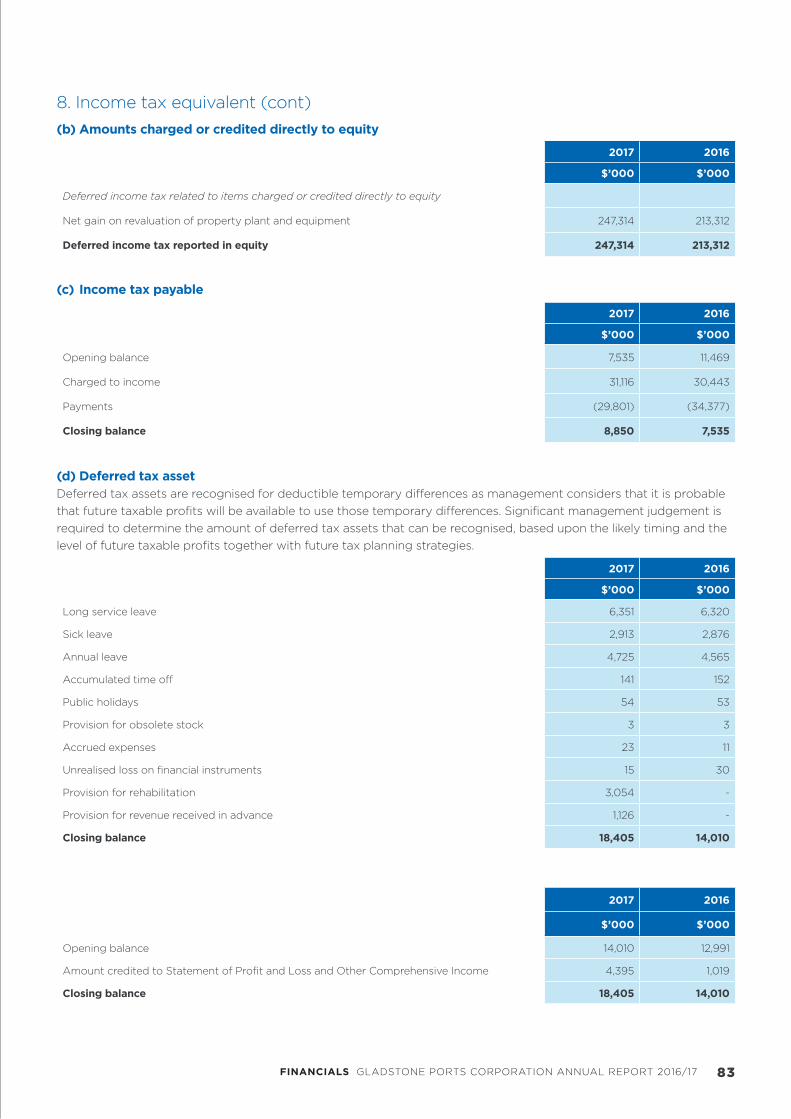
8. Income tax equivalent (cont)
(b) Amounts charged or credited directly to equity
2017 2016
$’000 $’000
Deferred income tax related to items charged or credited directly to equity
Net gain on revaluation of property plant and equipment 247,314 213,312
Deferred income tax reported in equity 247,314 213,312
2017 2016
$’000 $’000
Opening balance 7,535 11,469
Charged to income 31,116 30,443
Payments (29,801) (34,377)
Closing balance 8,850 7,535
2017 2016
$’000 $’000
Long service leave 6,351 6,320
Sick leave 2,913 2,876
Annual leave 4,725 4,565
Accumulated time off 141 152
Public holidays 54 53
Provision for obsolete stock 3 3
Accrued expenses 23 11
Unrealised loss on financial instruments 15 30
Provision for rehabilitation 3,054 -
Provision for revenue received in advance 1,126 -
Closing balance 18,405 14,010
2017 2016
$’000 $’000
Opening balance 14,010 12,991
Amount credited to Statement of Profit and Loss and Other Comprehensive Income 4,395 1,019
Closing balance 18,405 14,010
(c) Income tax payable
(d) Deferred tax assetDeferred tax assets are recognised for deductible temporary differences as management considers that it is probable
that future taxable profits will be available to use those temporary differences. Significant management judgement is
required to determine the amount of deferred tax assets that can be recognised, based upon the likely timing and the
level of future taxable profits together with future tax planning strategies.
83FINANCIALS GLADSTONE PORTS CORPORATION ANNUAL REPORT 2016/17
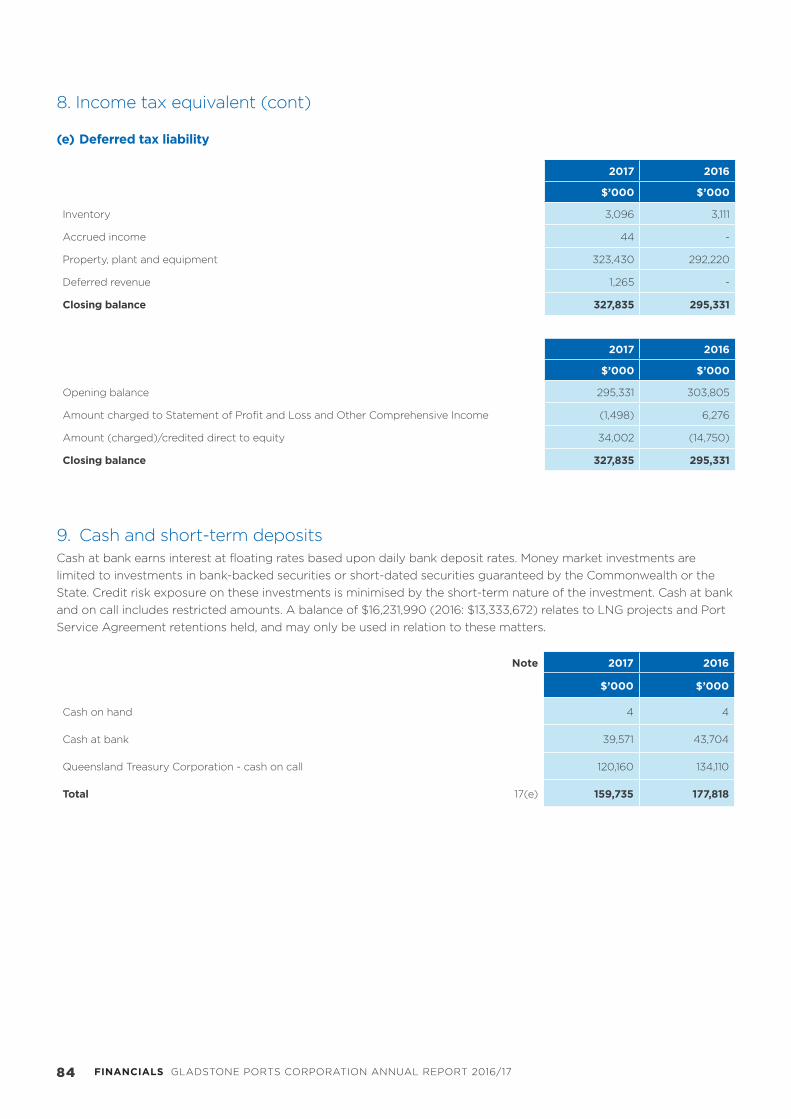
9. Cash and short-term depositsCash at bank earns interest at floating rates based upon daily bank deposit rates. Money market investments are
limited to investments in bank-backed securities or short-dated securities guaranteed by the Commonwealth or the
State. Credit risk exposure on these investments is minimised by the short-term nature of the investment. Cash at bank
and on call includes restricted amounts. A balance of $16,231,990 (2016: $13,333,672) relates to LNG projects and Port
Service Agreement retentions held, and may only be used in relation to these matters.
2017 2016
$’000 $’000
Inventory 3,096 3,111
Accrued income 44 -
Property, plant and equipment 323,430 292,220
Deferred revenue 1,265 -
Closing balance 327,835 295,331
2017 2016
$’000 $’000
Opening balance 295,331 303,805
Amount charged to Statement of Profit and Loss and Other Comprehensive Income (1,498) 6,276
Amount (charged)/credited direct to equity 34,002 (14,750)
Closing balance 327,835 295,331
(e) Deferred tax liability
Note 2017 2016
$’000 $’000
Cash on hand 4 4
Cash at bank 39,571 43,704
Queensland Treasury Corporation - cash on call 120,160 134,110
Total 17(e) 159,735 177,818
8. Income tax equivalent (cont)
84 FINANCIALS GLADSTONE PORTS CORPORATION ANNUAL REPORT 2016/17
9. Cash and short-term deposits (cont)
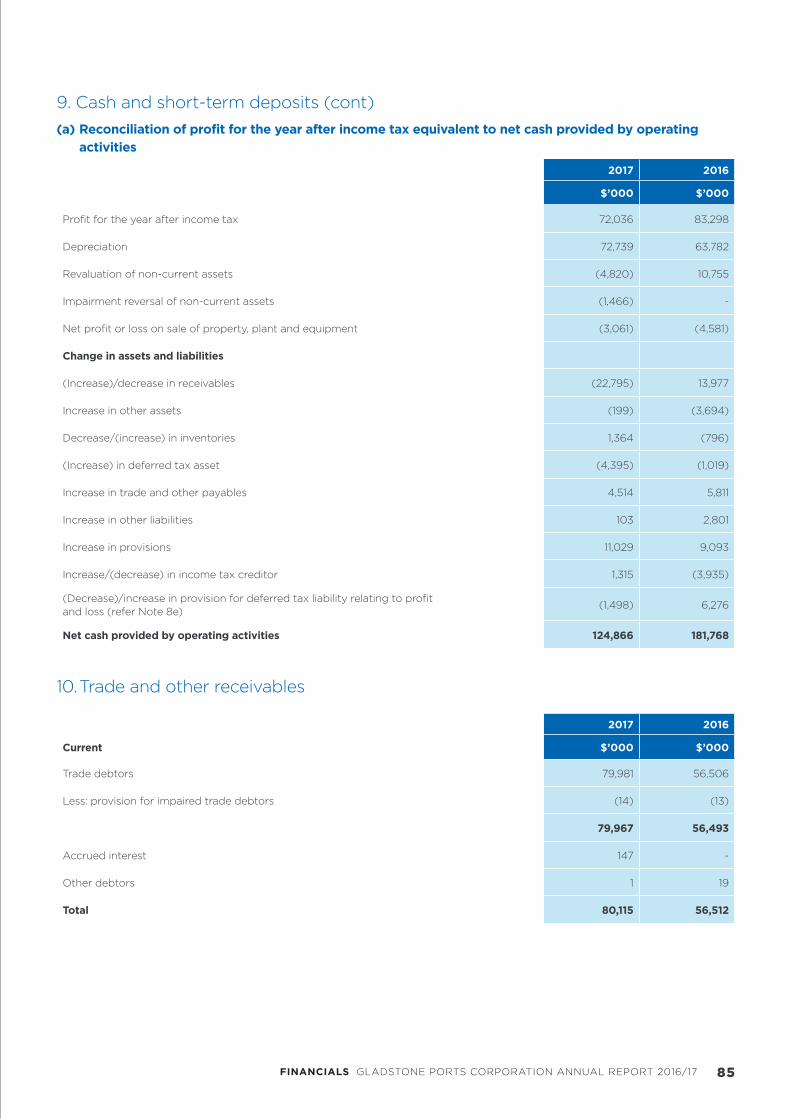
(a) Reconciliation of profit for the year after income tax equivalent to net cash provided by operating
activities
10. Trade and other receivables
2017 2016
$’000 $’000
Profit for the year after income tax 72,036 83,298
Depreciation 72,739 63,782
Revaluation of non-current assets (4,820) 10,755
Impairment reversal of non-current assets (1,466) -
Net profit or loss on sale of property, plant and equipment (3,061) (4,581)
Change in assets and liabilities
(Increase)/decrease in receivables (22,795) 13,977
Increase in other assets (199) (3,694)
Decrease/(increase) in inventories 1,364 (796)
(Increase) in deferred tax asset (4,395) (1,019)
Increase in trade and other payables 4,514 5,811
Increase in other liabilities 103 2,801
Increase in provisions 11,029 9,093
Increase/(decrease) in income tax creditor 1,315 (3,935)
(Decrease)/increase in provision for deferred tax liability relating to profit and loss (refer Note 8e)
(1,498) 6,276
Net cash provided by operating activities 124,866 181,768
2017 2016
Current $’000 $’000
Trade debtors 79,981 56,506
Less: provision for impaired trade debtors (14) (13)
79,967 56,493
Accrued interest 147 -
Other debtors 1 19
Total 80,115 56,512
85FINANCIALS GLADSTONE PORTS CORPORATION ANNUAL REPORT 2016/17

Ageing analysis of trade and term debtor balances at 30 June:
2017 2016
Non-current $’000 $’000
Trade debtors 1,493 -
Opening balance 13 -
Impaired debts written off (16,734) (22,901)
Movement in provision 16,735 22,914
Closing balance 14 13
Where receivables are beyond normal trading terms, the likelihood of the recovery of these receivables is assessed by
management. All receivables are assessed on an individual basis. GPC wrote off one bad debt from a coal company
during the year that represented the majority of the bad debts written off. Legal efforts are being made to recover the
debts but the amount is not considered recoverable.
2017 Not dueOverdue < 1 year
Overdue 1–5 years
Overdue >5 years
$’000 $’000 $’000 $’000
Debtor balance 81,480 142 - -
Impaired debt provision - (14) - -
81,480 128 - -
2016 Not dueOverdue < 1 year
Overdue 1–5 years
Overdue >5 years
$’000 $’000 $’000 $’000
Debtor balance 56,422 103 - -
Impaired debt provision - (13) - -
56,422 90 - -
10. Trade and other receivables (cont)
Reconciliation of impaired debts:
The major component of debtor exposure is to coal producers using the Port of Gladstone for the export of product.
Coal producers are mostly major listed companies or their related companies and account for 71% (2016: 67%) of
trade debtors at balance date. Credit is only available to established customers on 30-day terms except in the case
of coal exporters who may be required to make payment within 14 days of receipt of monthly statements. Credit risk
exposure is minimised in the case of term leases where personal guarantees are required from directors of small private
companies. In addition, receivable balances are monitored on an ongoing basis with the result that the Group’s exposure
to bad debts is not significant. Refer to Note 17(a) credit risk exposure for further information.
86 FINANCIALS GLADSTONE PORTS CORPORATION ANNUAL REPORT 2016/17
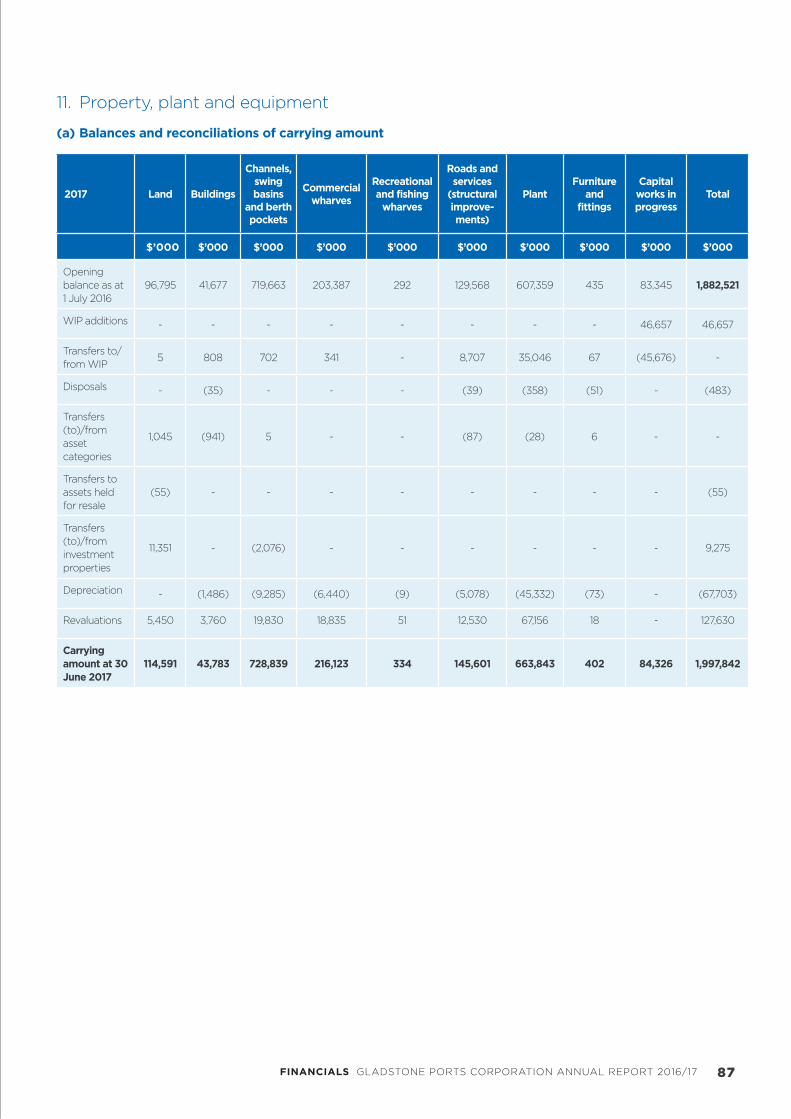
11. Property, plant and equipment
(a) Balances and reconciliations of carrying amount
2017 Land Buildings
Channels, swing basins
and berth pockets
Commercial wharves
Recreational and fishing
wharves
Roads and services
(structural improve-ments)
PlantFurniture
and fittings
Capital works in progress
Total
$’000 $’000 $’000 $’000 $’000 $’000 $’000 $’000 $’000 $’000
Opening balance as at 1 July 2016
96,795 41,677 719,663 203,387 292 129,568 607,359 435 83,345 1,882,521
WIP additions - - - - - - - - 46,657 46,657
Transfers to/from WIP
5 808 702 341 - 8,707 35,046 67 (45,676) -
Disposals - (35) - - - (39) (358) (51) - (483)
Transfers (to)/from asset categories
1,045 (941) 5 - - (87) (28) 6 - -
Transfers to assets held for resale
(55) - - - - - - - - (55)
Transfers (to)/from investment properties
11,351 - (2,076) - - - - - - 9,275
Depreciation - (1,486) (9,285) (6,440) (9) (5,078) (45,332) (73) - (67,703)
Revaluations 5,450 3,760 19,830 18,835 51 12,530 67,156 18 - 127,630
Carrying amount at 30 June 2017
114,591 43,783 728,839 216,123 334 145,601 663,843 402 84,326 1,997,842
87FINANCIALS GLADSTONE PORTS CORPORATION ANNUAL REPORT 2016/17

11. Property, plant and equipment (cont)
(a) Balances and reconciliations of carrying amount (cont)
2016 Land Buildings
Channels, swing basins
and berth pockets
Commercial wharves
Recreational and fishing
wharves
Roads and services
(structural improve-ments)
PlantFurniture
and fittings
Capital works in progress
Total
$’000 $’000 $’000 $’000 $’000 $’000 $’000 $’000 $’000 $’000
Opening Balance as at 1 July 2015
95,270 50,361 778,504 209,548 301 117,591 608,407 486 74,038 1,934,506
WIP additions - - - - - - - - 65,690 65,690
Transfers to/from WIP
- 5 12 589 - 16,212 39,565 - (56,383) -
Disposals - - - - - - (55) - - (55)
Transfers (to)/from asset categories
1,525 - (1,238) - - - (17) 17 - 287
Transfers to investment properties
- (6,904) - - - - - - - (6,904)
Depreciation - (1,785) (7,727) (6,750) (9) (4,235) (40,541) (68) - (61,115)
Revaluations - - (49,888) - - - - - - (49,888)
Carrying amount at 30 June 2016
96,795 41,677 719,663 203,387 292 129,568 607,359 435 83,345 1,882,521
88 FINANCIALS GLADSTONE PORTS CORPORATION ANNUAL REPORT 2016/17

11. Property, plant and equipment (cont)
Property, plant and equipment are stated at cost or fair value, less accumulated depreciation and any impairment losses,
except for work in progress. Work in progress is stated at cost, net of accumulated impairment losses, if any.
Initial recognition
Assets are recognised at cost, being the fair value of the assets provided as consideration at the date of acquisition plus
any incidental costs attributable to the acquisition. The cost of non-current assets constructed by the Group includes
the cost of all materials used in construction, direct labour on the project and an appropriate proportion of variable and
fixed overheads.
An asset recognition threshold of one thousand dollars has been adopted and applies to all assets acquired with a
useful life of more than one year.
Any cost that increases the originally assessed capacity or production capacity of an asset is capitalised. Similarly,
when each major inspection is performed, its cost is recognised in the carrying amount of the plant and equipment as a
replacement only if it is eligible for capitalisation. All other repairs and maintenance are recognised as an expense in the
Consolidated Statement of Profit and Loss and Other Comprehensive Income as incurred.
Depreciation
Depreciation is recognised on a straight-line basis on all non-current assets, so as to reflect the consumption of the
economic benefits over the expected economic lives of assets. The depreciation rates used for major assets in each
class are as follows:
Where assets have separately identifiable components, these components are assigned useful lives distinct from the
asset to which they relate. The assets’ useful lives and depreciation methods are reviewed, and adjusted if appropriate,
at each financial year end.
The estimation of the useful lives of assets has been based upon historical experience as well as manufacturers’
warranties (for plant and equipment), lease terms (for leased equipment) and turnover policies (for motor vehicles).
In addition, the condition of the assets is assessed at least annually and considered against the remaining useful life.
Adjustments to useful life are made when considered necessary.
Disposal
An item of property, plant and equipment is de-recognised upon disposal or when no further economic benefits are
expected from its use or disposal. Any gain or loss arising on de-recognition of the asset is included in the Consolidated
Statement of Profit and Loss and Other Comprehensive Income in the year the asset is de-recognised.
Buildings 2.50%–11.77%
Channels, swing basins and berth pockets 1.00%
Commercial wharves 2.50%–20.00%
Recreational and fishing wharves 2.50%–20.00%
Roads and services 1.50%–15.40%
Plant 1.00%–33.00%
Furniture 4.00%–27.02%
89FINANCIALS GLADSTONE PORTS CORPORATION ANNUAL REPORT 2016/17

11. Property, plant and equipment (cont)
(b) Carrying amounts if assets were measured at cost less accumulated depreciation
If assets were measured using the cost model the carrying amounts would be as follows:
2017 Net book value
2016 Net book value
$’000 $’000
Land 72,362 73,834
Buildings 38,996 41,222
Channels, swing basins and berth pockets 126,957 134,870
Commercial wharves 174,513 180,138
Recreational and fishing wharves 377 404
Roads and services (structural improvements) 139,202 140,481
Plant 562,314 576,400
Furniture and fittings 416 437
Capital works in progress 84,326 83,345
Total 1,199,463 1,231,131
Level 1 Level 2 Level 3Fair value as at
30 June
$’000 $’000 $’000 $’000
Land - - 114,591 114,591
Buildings - - 43,783 43,783
Channel, swing basins and berth pockets - - 728,839 728,839
Commercial wharves - - 216,123 216,123
Recreational and fishing wharves - - 334 334
Roads and services - - 145,601 145,601
Plant - - 663,843 663,843
Furniture and fittings - - 402 402
Capital works in progress - - 84,326 84,326
- - 1,997,842 1,997,842
(c) Valuations
Measurement after recognition
Revaluation increments are credited to the asset revaluation reserve except to the extent that they reverse a revaluation
decrement previously recognised in the Consolidated Statement of Profit and Loss and Other Comprehensive Income.
Revaluation decrements are recognised in profit and loss, except to the extent they offset a previous revaluation. In
this case the decrement is recorded in the asset revaluation reserve. The net amounts of accumulated depreciation are
restated to the revalued amounts.
Categorisation of fair values recognised as at 30 June 2017:
90 FINANCIALS GLADSTONE PORTS CORPORATION ANNUAL REPORT 2016/17
11. Property, plant and equipment (cont)
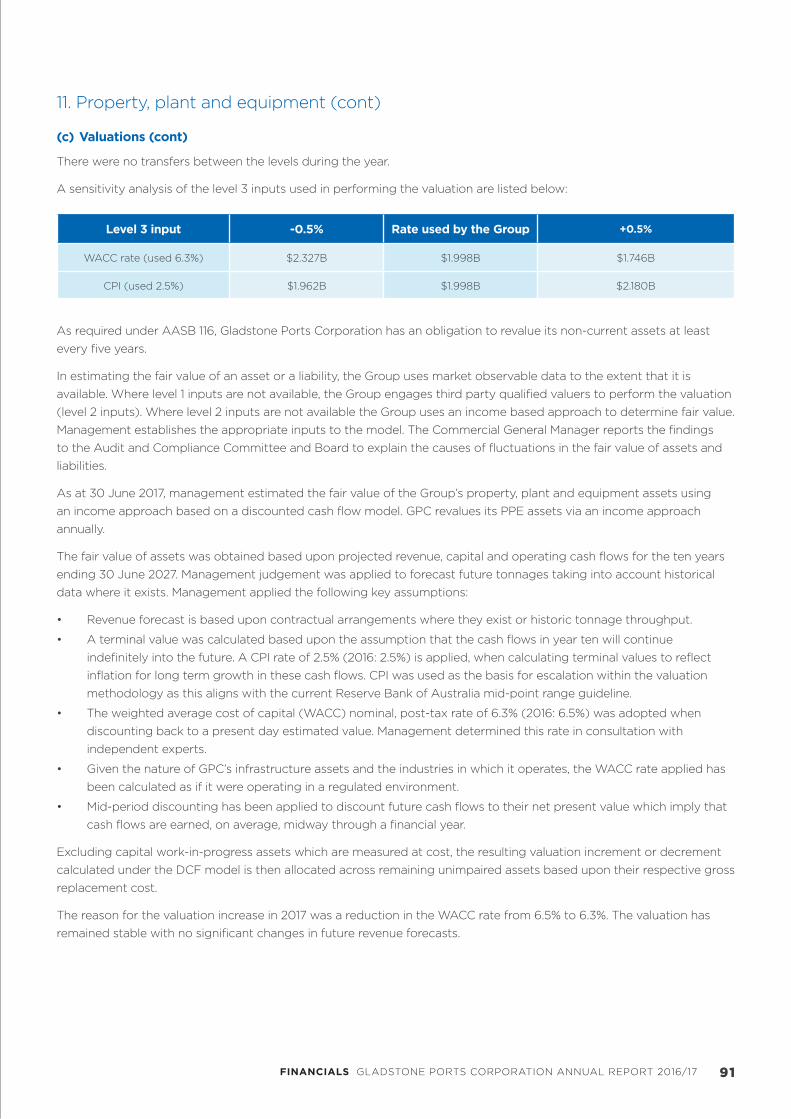
(c) Valuations (cont)
There were no transfers between the levels during the year.
A sensitivity analysis of the level 3 inputs used in performing the valuation are listed below:
As required under AASB 116, Gladstone Ports Corporation has an obligation to revalue its non-current assets at least
every five years.
In estimating the fair value of an asset or a liability, the Group uses market observable data to the extent that it is
available. Where level 1 inputs are not available, the Group engages third party qualified valuers to perform the valuation
(level 2 inputs). Where level 2 inputs are not available the Group uses an income based approach to determine fair value.
Management establishes the appropriate inputs to the model. The Commercial General Manager reports the findings
to the Audit and Compliance Committee and Board to explain the causes of fluctuations in the fair value of assets and
liabilities.
As at 30 June 2017, management estimated the fair value of the Group’s property, plant and equipment assets using
an income approach based on a discounted cash flow model. GPC revalues its PPE assets via an income approach
annually.
The fair value of assets was obtained based upon projected revenue, capital and operating cash flows for the ten years
ending 30 June 2027. Management judgement was applied to forecast future tonnages taking into account historical
data where it exists. Management applied the following key assumptions:
• Revenue forecast is based upon contractual arrangements where they exist or historic tonnage throughput.
• A terminal value was calculated based upon the assumption that the cash flows in year ten will continue
indefinitely into the future. A CPI rate of 2.5% (2016: 2.5%) is applied, when calculating terminal values to reflect
inflation for long term growth in these cash flows. CPI was used as the basis for escalation within the valuation
methodology as this aligns with the current Reserve Bank of Australia mid-point range guideline.
• The weighted average cost of capital (WACC) nominal, post-tax rate of 6.3% (2016: 6.5%) was adopted when
discounting back to a present day estimated value. Management determined this rate in consultation with
independent experts.
• Given the nature of GPC’s infrastructure assets and the industries in which it operates, the WACC rate applied has
been calculated as if it were operating in a regulated environment.
• Mid-period discounting has been applied to discount future cash flows to their net present value which imply that
cash flows are earned, on average, midway through a financial year.
Excluding capital work-in-progress assets which are measured at cost, the resulting valuation increment or decrement
calculated under the DCF model is then allocated across remaining unimpaired assets based upon their respective gross
replacement cost.
The reason for the valuation increase in 2017 was a reduction in the WACC rate from 6.5% to 6.3%. The valuation has
remained stable with no significant changes in future revenue forecasts.
Level 3 input -0.5% Rate used by the Group +0.5%
WACC rate (used 6.3%) $2.327B $1.998B $1.746B
CPI (used 2.5%) $1.962B $1.998B $2.180B
91FINANCIALS GLADSTONE PORTS CORPORATION ANNUAL REPORT 2016/17

Note 2017 2016
$’000 $’000
Valuation adjustment to Balance Sheet
Property, plant and equipment revaluations 11(a) 127,630 (49,888)
Assets held for resale revaluations (136) (1,293)
Investment property (revaluation decreases)/revaluations 12 (7,868) (8,763)
119,626 (59,944)
Valuation adjustments to Consolidated Statement and Profit and Loss and Other Comprehensive Income
Reversal of impairment – Statement of Profit and Loss 1,466 -
Reversal of prior revaluation decreases of non-current assets – Statement of Profit and Loss
10,065 -
Revaluation decrease of non-current assets – Statement of Profit and Loss (5,245) (10,775)
Revaluation of non-current assets – asset revaluation reserve 113,340 -
Revaluation decrease of non-current assets – asset revaluation reserve - (49,169)
119,626 (59,944)
12. Investment properties
Note 2017 2016
$’000 $’000
Opening balance 108,250 110,559
Additions - 32
Transfers (to)/from property, plant and equipment 11(a) (9,275) 5,379
Transfers (to)/from assets held for resale (227) 2,498
Revaluations 11(c) (7,868) (8,763)
Disposals - (1,362)
Depreciation 7(b) 19 (93)
Closing balance 90,899 108,250
Investment properties are recognised initially at cost. Subsequent to initial recognition, investment properties are stated
at fair value, which reflects market conditions at the reporting date. Investment properties include land and buildings.
Professional expert external valuers are used for the valuation of investment properties. For the 2017 year, the fair value
has been determined based on independent valuations by AON Valuation Services as at 30 April 2017, in accordance
with AASB 140 – Investment Properties, which requires an annual review of fair value. GPC is satisfied that these are
materially correct as at 30 June 2017. The fair value was determined based on the market comparable approach that
11. Property, plant and equipment (cont)
(c) Valuations (cont)
The reconciliation of revaluations across each balance sheet item and is shown below:
92 FINANCIALS GLADSTONE PORTS CORPORATION ANNUAL REPORT 2016/17

13. Trade and other payables
2017 2016
Current $’000 $’000
Trade creditors 41,550 34,908
Revenue received in advance 13,106 12,987
GST payable 2,389 771
Other 2,502 2,101
59,547 50,767
Non-current
Revenue received in advance 20,164 22,129
The revenue received in advance relates to operating lease revenue on investment properties and revenue received in
advance on recoverable works contracts. Due to the short-term nature of trade and other payables, their carrying value
is assumed to approximate to their fair value. For more information on the Group’s credit risk management process,
refer to Note 17(a).
12. Investment properties (cont)
reflects recent transaction prices for similar properties. In estimating the fair value of the properties, the highest and
best use of the properties is their current use. There has been no change to the valuation technique during the year.
Gains or losses arising from changes in the fair values of investment properties are recognised in the Consolidated
Statement of Profit and Loss and Other Comprehensive Income in the year they arise.
All of the Group’s investment properties are commercial properties located in Australia and are level 2 on the fair value
hierarchy. There were no transfers between the levels during the year.
Investment properties are derecognised either when they have been disposed of or when the investment property is
permanently withdrawn from use and no future economic benefit is expected from its disposal. Any gains or losses on
the retirement or disposal of an investment property are recognised in the Consolidated Statement of Profit and Loss
and Other Comprehensive Income in the year of retirement or disposal.
Transfers are made to/from investment property when, and only when:
• there is a change in use
• commencement of an operating lease to another party
• ending construction or development
• commencement of owner occupation
• commencement of development with a view to sale.
Note 2017 2016
$’000 $’000
Non-current
Queensland Treasury Corporation loans 19(c) 778,834 461,193
14. Loans and borrowings – Non-current
93FINANCIALS GLADSTONE PORTS CORPORATION ANNUAL REPORT 2016/17

2017 2016
Carrying amount
$’000
Fair value
$’000
Carrying amount
$’000
Fair value
$’000
Queensland Treasury Corporation loans 778,834 812,106 461,193 514,699
15. Provisions
Provisions are recognised when there is a present legal, equitable or constructive obligation to make a future sacrifice of
economic benefits to other entities as a result of past transactions or other past events and it is probable that a future
sacrifice of economic benefits will be required and a reliable estimate can be made of the amount of the obligation.
(i) Wages, and salaries, annual leave, and non-monetary benefits
A liability is recognised for benefits accruing to employees in respect of wages and salaries, annual leave, long service
leave, and non-monetary benefits when it is probable that settlement will be required and they are capable of being
measured reliably. Liabilities for wages, salaries, annual leave, and accumulated time off are recognised and are
measured as the amount unpaid at the reporting date at pay rates anticipated on settlement in respect of employees’
services, including related on-costs.
(ii) Long service leave and personal leave
The Group does not expect its long service leave or personal leave provisions to be settled wholly within the twelve
months of the reporting date. The provisions have been calculated using anticipated wage and salary rates including
related on-costs and expected settlement dates based on usage patterns and is discounted using rates attaching to
corporate bond rates at balance date which most closely match the terms of the maturity of the related liabilities.
(iii) Superannuation
Superannuation is provided for on an incurred basis through the Statement of Profit and Loss and Other
Comprehensive Income. No liability is recognised for accruing superannuation benefits in relation to defined benefits
schemes as this liability is held on a whole of Government basis and reported in the whole of Government financial
statements prepared in accordance with the terms of AASB31 Financial Reporting by Governments.
The Queensland Treasury Corporation loans comprise advances made under one client specific pool arrangement
(CSP). The CSP will comprise a combination of bonds and floating rate debt so that the weighted average term of the
underlying cash flows of these instruments matches the weighted average term of the underlying cash flows of the
Group’s loans. The CSP with a book value of $778,834,114 is used for the Group’s normal operations. This is unsecured.
Fair values
Unless disclosed below the carrying amount (book value) of the Group’s current and non-current borrowings
approximate to their fair value. The fair values have been calculated by discounting the expected future cash flows at
prevailing market interest rates.
The fair value represents the value of the debt if the Group repaid at that date. As it is the intention of the Group to hold
the debt for its term, no provision is required to be made in these accounts. The Group’s loan with Queensland Treasury
Corporation is level 2 on the fair value hierarchy. There were no transfers between the levels during the year.
14. Loans and borrowings – Non-current (cont)
94 FINANCIALS GLADSTONE PORTS CORPORATION ANNUAL REPORT 2016/17

15. Provisions (cont)
Employee benefits
Employee benefits comprise of long service leave, annual leave, sick leave and rostered day off provisions. These
provisions are categorised as either current or non-current. Non-current benefit provisions are those that are not
expected to be consumed within the next twelve (12) month period. The benefit provision is calculated through
application of a discount calculation to derive the present value of the future payment. GPC utilises the Millman Group
of 100 Discount Rate for this purpose.
Dividends
A provision for dividends is recognised at the reporting date where the dividends have been declared, determined or
recommended by the Directors prior to the reporting date. A corresponding amount is recognised directly in equity.
Dividends provided calculations are based on 100% of net profit after an adjustment for revaluation increments/
decrements and shareholding Minister approval to retain the proceeds from a specified land sale arrangement. The
effective comparable percentages are 2017 at 100% and 2016 at 100%. All dividends are unfranked. Dividends are
declared after reporting date but before the financial statements are authorised for issue. In addition, the Board declared
a special dividend of $315M in 2016. The special dividend was funded entirely by new borrowings (refer note 17(f)).
Provision movements
Rehabilitation 2017
Rehabilitation 2016
Dividend 2017
Dividend 2016
Employee Benefits
2017
Employee Benefits
2016
$’000 $’000 $’000 $’000 $’000 $’000
Current provision 3,108 5,716 61,037 405,827 34,430 34,190
Non-current provision 12,459 - - - 12,848 12,364
Closing balance of provision at 30 June
15,567 5,716 61,037 405,827 47,278 46,554
Opening balance of provision at 1 July
5,716 - 405,827 54,000 46,554 43,239
Payment of provisions (5,036) - (405,827) (54,400) (18,271) (18,773)
Movement in provision calculation
14,887 5,716 61,037 405,827 18,995 22,088
Closing balance of provision at 30 June
15,567 5,716 61,037 405,827 47,278 46,554
2017 2016
$’000 $’000
Current
Employee benefits 34,430 34,190
Dividends 61,037 405,827
Rehabilitation 3,108 5,716
Other 1,220 765
Total 99,795 446,498
Non-current
Employee benefits 12,848 12,364
Rehabilitation 12,459 -
Total 25,307 12,364
95FINANCIALS GLADSTONE PORTS CORPORATION ANNUAL REPORT 2016/17

17. Financial instruments risk management
GPC has exposure to credit risk, foreign currency risk, liquidity risk, interest rate risk and capital management risk from
its use of financial instruments. The Group’s financial instruments comprise receivables, payables, bank loans, cash and
short-term deposits and derivatives. The Directors have reviewed the Group’s held to maturity financial assets in the
light of its capital maintenance and liquidity requirements and have confirmed the Group’s positive intention and ability
to hold those assets to maturity.
The Board of Directors has overall responsibility for the establishment and oversight of the risk management framework.
The Group manages its exposure to key financial risks, including credit risk, liquidity risk, interest rate and currency risk,
in accordance with its financial policies. The objectives of the policies are to support the delivery of the Group’s financial
targets whilst protecting future financial security.
The Board reviews and agrees policies for managing each of the risks summarised below:
(a) Credit risk exposure
Credit risk arises from the financial assets of the group, which comprise cash and cash equivalents and trade and other
receivables. The Group is exposed to credit risk from the possibility of counter parties to trade and other receivables
failing to perform their obligations.
The Group does not hold any credit derivatives to offset its credit exposure. The level of exposure is disclosed in the
Statement of Financial Position and in Note 10 with the carrying amount stated net of any provision for impaired debts.
(b) Foreign currency risk
The Group occasionally makes capital purchases in US dollars. To manage the currency risks arising from these
transactions, the Group may enter into derivative transactions, namely forward currency contracts.
The Board approved policy requires management to examine entering into a derivative transaction to eliminate
currency exposure on any individual transactions in excess of $500,000. It is the Group’s policy not to enter into
forward contracts until a firm commitment is in place. The terms of the hedge derivatives are required to exactly match
the terms of the hedged item to maximise hedge effectiveness.
As at 30 June 2017 the Group had entered into one forward contract to purchase US dollars for a dozer to be
purchased in December 2017. As of 30 June 2016 the Group had entered into one forward contract to purchase US
dollars for a dozer purchased in December 2016.
These derivatives provide economic hedges, but do not qualify for hedge accounting. The market value is presented,
whereas for the other obligations the respective undiscounted cash flows are presented. Cash flows for financial assets
and liabilities without fixed amount or timing are based upon the conditions existing at 30 June 2017.
16. Issued capital
2017 2016
No. No.
Issued capital
Authorised to issue – ordinary shares 1,000,000,000 1,000,000,000
Issued – ordinary shares fully paid 402,066,818 402,066,818
The shares have no par value.
96 FINANCIALS GLADSTONE PORTS CORPORATION ANNUAL REPORT 2016/17

17. Financial instruments risk management (cont)
The risks implied in the table above reflect a balanced view of cash inflows and outflows.
Interest bearing loans and borrowings relate to Queensland Treasury Corporation borrowings which are interest only
with no fixed repayment date for the principal component. For the purposes of completing the maturity analysis, the
principal component of these loans has been included in the more than five-year time band with no interest payment
assumed in this time band.
All trade and other payables due in >1 year are revenue received in advance for recoverable works. All other trade
payables and other financial liabilities originate from the ongoing operations of the Group.
To monitor existing financial assets and liabilities as well as to enable an effective controlling of future risks, the Group
has established comprehensive risk reporting that reflects expectations of management of settlement of financial assets
and liabilities.
The Group monitors rolling forecasts of liquidity reserves on the basis of expected cash flow. At balance date the Group
had $30,000,000 (2016: $30,000,000) of unused credit facilities available for use.
Maturity analysis of financial liabilities based upon management’s expectations
Year ended 30 June 2017 Note < 1 year 1 – 5 Years > 5 years Total
$‘000 $’000 $’000 $’000
Financial liabilities
Trade and other payables 13 59,547 7,860 12,304 79,711
Interest bearing loans and borrowings 14 - - 778,834 778,834
Dividend provision 15 61,037 - - 61,037
120,584 7,860 791,138 919,582
Year ended 30 June 2016 Note < 1 year 1 – 5 Years > 5 years Total
$‘000 $’000 $’000 $’000
Financial liabilities
Trade and other payables 13 50,767 7,860 14,269 72,896
Interest bearing loans and borrowings 14 - - 461,193 461,193
Dividend provision 15 405,827 - - 405,827
456,594 7,860 475,462 939,916
(c) Liquidity risk
GPC is exposed to liquidity risk in respect of its payables and borrowings from Queensland Treasury Corporation for
capital works. GPC manages liquidity risk through the use of a liquidity management strategy which aims to reduce
the exposure to risk by ensuring GPC has sufficient funds available to meet employee and supplier obligations as they
fall due. This is achieved by ensuring maximum levels of cash are at hand to match the expected duration of various
employee and supplier liabilities. Funding arrangements are in place with Queensland Treasury Corporation which will
allow sufficient funding to cover planned requirements within GPC’s corporate planning period.
The Group has available a business card facility with a limit of $250,000 (2016: $250,000). Loan facilities shown
in Note 14 are provided by Queensland Treasury Corporation. New borrowings are subject to an approved loan
program with the sanction of the Treasurer of Queensland. The Group has access to a $30,000,000 (2016:
$30,000,000) working capital facility provided through Queensland Treasury Corporation. This facility was not
drawn upon during the financial year.
97FINANCIALS GLADSTONE PORTS CORPORATION ANNUAL REPORT 2016/17

Post-tax profit Equity
2017 2016 2017 2016
$’000 $’000 $’000 $’000
+1% (100 basis points) (778) (469) (778) (469)
-1% (100 basis points) 778 476 778 476
(d) Interest rate risk exposure
The Group’s exposure to interest rate risk relates primarily to the Group’s long-term debt obligations. The level of debt is
disclosed in Note 14.
At 30 June 2017 the Group’s financial assets and liabilities exposed to variable interest rate risk consisted of cash and
cash equivalents and interest bearing loans and liabilities only. The Group’s policy is to manage its finance costs using
a mix of fixed and variable rate debt. The Group constantly analyses its interest rate exposure where consideration is
given to the mix of fixed and variable interest rates.
Sensitivity analysis based upon the interest risk exposures in existence at the Statement of Financial Position date
illustrates that a +/- 1% movement in interest rates with all other variables held constant, the post-tax profit and equity
affect is as follows:
(e) Net fair value
Cash at bank and at call are valued as the amount of the deposit or the purchase price of the underlying security.
Receivables are carried at the nominal amount due, less provision for impaired debts which represents the assessed
credit risk. Liability to trade creditors is recognised on receipt of goods and services at nominal value. Payment would
normally occur within 30 days. Borrowings outstanding at 30 June 2017 have been valued at book using long-term
interest rates negotiated with Queensland Treasury Corporation.
(f) Capital management
The Group manages its capital to ensure that it will be able to continue as a going concern while maximising the return
to shareholders through the optimisation of the debt and equity balance. The Group will return a dividend for the 2017
financial year equal to $61.037M being 100% of adjusted profits after tax. The increased dividend payout ratio of 100%
and the additional distribution of $315M in 2016 facilitated the regearing of the Group to the extent of funding the $315M
distribution from long-term borrowings.
The Group will manage its capital structure to maintain a minimum investment grade credit rating of BBB range,
consistent with its loan documentation with QTC. The capital structure of the Group consists of borrowings disclosed in
Note 14 and equity comprising issued capital, reserves and retained earnings.
17. Financial instruments risk management (cont)
98 FINANCIALS GLADSTONE PORTS CORPORATION ANNUAL REPORT 2016/17

2017 2016
$’000 $’000
Due not later than one year 1,373 1,892
Due later than one year and not later than five years 707 1,428
Total 2,080 3,320
Capital expenditure commitments contracted but not provided for:
2017 2016
$’000 $’000
Due not later than one year 15,680 11,756
2017 2016
$ $
Remuneration 200,801 137,901
18. Commitments and contingencies
19. Auditor’s remuneration
Operating lease commitments – Group as lessor
2017 2016
Operating lease revenue $’000 $’000
Due not later than one year 10,674 9,909
Due later than one year and not later than five years 27,035 25,885
Due later than five years 73,479 59,714
Total 111,188 95,508
These leases relate to the Group’s business of providing facilities for stevedoring operators as well as investment
properties (land and buildings) for industrial use for other business purposes.
Operating lease commitments – Group as lessee
These leases relate to office equipment and light vehicles:
These are amounts (excluding GST) paid to the Auditor-General of Queensland for audit of the financial statements. No
other benefits were received by the auditors:
The estimated fee for 2017 is $170,000 (2016: $164,500).
Contingent assets and liabilities
As at the date of these accounts, the Board is not aware of any material contingent assets or liabilities.
99FINANCIALS GLADSTONE PORTS CORPORATION ANNUAL REPORT 2016/17

Shareholding Ministers
The GOC’s shareholding Ministers are identified as part of the GOC’s KMP, and these Ministers are the Treasurer and
Minister for Trade and Investment, and Minister for Main Roads, Road Safety and Ports and Minister for Energy, Biofuels
and Water Supply. Ministerial remuneration entitlements are outlined in the Legislative Assembly of Queensland’s
Members’ Remuneration Handbook. The GOC does not bear any cost of remuneration of Ministers. The majority of
Ministerial entitlements are paid by the Legislative Assembly, with the remaining entitlements being provided by
Ministerial Services Branch within the Department of the Premier and Cabinet. As all Ministers are reported as KMP of
the Queensland Government, aggregate remuneration expenses for all Ministers is disclosed in the Queensland General
Government and Whole of Government Consolidated Financial Statements as from 2016-17, which are published as part
of Queensland Treasury’s Report on State Finances.
Directors (short-term and post-employment benefits)
Directors’ emoluments are set by the State Government with other fees and allowances determined on the basis of
meetings attended and expenditure incurred in performing their roles. Directors do not receive performance related
remuneration.
Specified executives
The Human Resources Committee recommend executive remuneration to the Board. The committee uses market and
industry surveys to ascertain an appropriate level of remuneration to attract appropriately skilled staff. The remuneration
policy is subject to State Government guidelines and changes to executive remuneration are approved by the Board
and advised to shareholding Ministers.
The Group’s remuneration policy is based on a total employment cost (TEC) concept. The TEC concept ensures all
benefits including salary, superannuation, motor vehicle etc. are included in the remuneration package cost. Short-term
benefits are disclosed as the gross salary package (excluding bonuses) and may be taken either as salary or salary
sacrificed by the Director or employee. Amounts paid on separation are included as a short-term benefit. Other benefits
are listed as taxable fringe benefits amounts. These may include benefits that are available to all employees of the
Group and are not specific to the listed roles. All disclosed items relate to amounts received by each senior executive for
the full financial year irrespective of when they commenced their role listed below.
From 2014 all new senior executive appointments are on tenure. Senior executives employed prior to this date are
employed on fixed three-year terms, otherwise their terms and conditions of employment are the same. Where existing
executive contracts are renewed the Board reviews whether to move the executive to tenure from fixed term contracts.
All senior executives’ remuneration levels increase in line with the market assessments up to a maximum of 10% per
annum where remuneration remains below the market median. Where remuneration is above market median annual
increases are restricted to CPI increases. There are no at risk benefits to senior executives. Separation benefits, in the
event of termination by the Group, other than for misconduct, are allowed for in the agreements. The Chief Executive
Officer is entitled to three months’ notice, or payment in lieu of notice as well as a separation payment of the lesser of
12 months’ pay and the amount which would otherwise be paid between the determination date and the end of the
contract term. Senior executives are entitled to four weeks’ notice or payment in lieu. In the event of a position being
made redundant the executive is entitled to eight weeks pay plus three weeks’ pay for each year of service, up to a
maximum of 52 weeks. In accordance with Ministerial guidelines details of Directors and the senior executives of the
entity with the greatest authority in office at 30 June 2017 are as follows:
20. Key management personnel disclosures
100 FINANCIALS GLADSTONE PORTS CORPORATION ANNUAL REPORT 2016/17

20. Key management personnel disclosures (cont)
Directors Last date of appointment
Date of termination/resignation
Short-term benefits
Post-employment benefits
Total
$’000Directors’ fees
$’000Superannuation
$’000
Zussino, Leo (Chairman) 1 October 2015 30 September 2018
2017 53 35 88
2016 53 5 58
Reynolds, J 2 October 2014 30 September 2017
2017 51 5 56
2016 51 5 56
Corones, P 1 October 2015 30 September 2018
2017 49 5 54
2016 33 3 36
Davidson, G 2 October 2014 30 September 2017
2017 41 13 54
2016 49 5 54
Cassidy, G 1 October 2015 30 September 2018
2017 49 5 54
2016 33 3 36
Jamieson, P 1 October 2015 30 September 2018
2017 49 5 54
2016 33 3 36
Corbett, M 15 December 2016 30 September 2019
2017 22 2 24
2016 - - -
Skippen, H 1 October 2010 30 September 2016
2017 16 2 18
2016 49 5 54
Brodie, M (Former Chairman) 7 June 2012 30 September 2015
2017 - - -
2016 27 3 30
Greig, C 16 August 2012 30 September 2015
2017 - - -
2016 16 2 18
Moorhead, B 16 August 2012 30 September 2015
2017 - - -
2016 16 2 18
Ward, C 17 July 2014 30 September 2015
2017 - - -
2016 15 1 16
Total remuneration: Directors
2017 330 72 402
2016 375 37 412
Refer to Directors’ Report for additional information regarding reappointments of Directors.
101FINANCIALS GLADSTONE PORTS CORPORATION ANNUAL REPORT 2016/17

20. Key management personnel disclosures (cont)
Specified Executives Contract expiry date/termination
date
Short-term benefits Post-employment
benefits
Other benefits Total
$’000 Salary
$’000 Separation payments
$’000 Superannuation
$’000 Motorvehicle
$’000 Other
$’000
Peter O’Sullivan CEO1 Tenure
2017 460 - 86 - - 546
2016 - - - - - -
Galt, MCommercial GM
Tenure
2017 355 - 66 22 1 444
2016 321 - 60 24 5 410
Brown ACargo Handling Operations GM
Tenure
2017 331 - 62 23 2 418
2016 292 - 55 25 5 377
Carter, GPort Planning and Development GM
Tenure
2017 274 - 54 25 1 354
2016 240 - 47 30 9 326
Winsor, RPeople and Community GM2
Tenure
2017 212 - 29 16 1 258
2016 153 - 47 - - 200
Sherriff, JSafety, Environment and Risk GM
Tenure
2017 224 - 42 14 8 288
2016 202 - 38 15 8 263
Wilson, GMarine Operations GM4
2- Mar-17
2017 144 74 14 9 1 242
2016 247 - 35 15 5 302
Doyle, CCEO3
15-Sep-16
2017 - - - - - -
2016 310 - 37 15 2 364
Total remuneration: specified executives
2017 2,000 74 353 109 14 2,550
2016 1,765 - 319 124 34 2,242
1 Appointed 25 July 2016 3 Resigned 29 January 2016 2 Appointed 12 October 2015 4 Terminated 13 January 2017
Transactions of a similar nature are disclosed in aggregate except when separate disclosure is necessary and material.
102 FINANCIALS GLADSTONE PORTS CORPORATION ANNUAL REPORT 2016/17

21. Related party disclosure
Control
GPC is a Queensland Government Owned Corporation, with all shares owned by shareholding Ministers on behalf of the
State of Queensland.
Key management personnel
Disclosures relating to key management personnel are set out in Note 20.
Transactions with related parties
From time to time Senior Executives, Directors and related entities may have commercial dealings with GPC. These
transactions are conducted on arm’s length terms and conditions. Senior Executives and Directors declare their interest
on commercial dealings at Board meetings.
Transactions with State of Queensland controlled entities
All transactions between GPC and other Government Owned Corporations are on an arm’s length commercial basis.
GPC, as a Government Owned Corporation, has had arm’s length transactions with other government agencies.
Intercompany transactions
Balances between GPC and its subsidiaries, which are related parties of GPC, have been eliminated on consolidation and
are not disclosed in this note.
Revenue
Gladstone Ports Corporation Limited
2017 2016
Agency Nature $’000 $’000
Maritime Safety Queensland Rent, berthage, pilotage transfers, oil spill response 23,987 23,166
Department of Transport and Main RoadsBed levelling, vessel hire, Bundaberg Port Transport Network Study
1,500 97
Other Various 735 710
Gladstone Marine Pilot Services Pty Ltd
2017 2016
Agency Nature $’000 $’000
Gladstone Ports Corporation Limited Rent, berthage, pilotage transfers, oil spill response 20,739 18,987
Expenses
Gladstone Ports Corporation Limited
2017 2016
Agency Nature $’000 $’000
Gladstone Marine Pilot Services Pty Ltd Provision of operating services 20,739 18,987
Department of Agriculture Environmental works 1,000 1,000
Gladstone Area Water Board Water and capital contributions 845 877
Office of State Revenue Land tax and payroll tax 7,019 6,764
QSuper Superannuation contributions 15,954 15,751
Queensland Department of Transport and Main Roads
Including survey work, dredging and registrations 875 3,716
Queensland Treasury Dividend, NTER tax, competitive neutrality and rates 442,853 95,752
Queensland Treasury Corporation Loan interest 31,156 32,411
WorkCover Queensland Workers’ compensation insurance 1,623 1,676
Other Various 3,319 2,357
103FINANCIALS GLADSTONE PORTS CORPORATION ANNUAL REPORT 2016/17

21. Related party disclosure (cont)
Gladstone Marine Pilot Services Pty Ltd
2017 2016
Agency Nature $’000 $’000
QSuper Superannuation contributions 1,704 1,673
OtherVessel registration, payroll tax, vessel simulations
759 934
2017 2016
No. No.
Number of employees at year end (Full Time Equivalent) 725 731
The number of employees represents the total number of people employed (Full Time Equivalent) by the Group as at 30 June.
Debtors
Gladstone Marine Pilot Services Pty Ltd
2017 2016
Agency $’000 $’000
Maritime Safety Queensland 853 718
Other (28) 25
Guarantees
No guarantees have been given or received.
Creditors
Gladstone Marine Pilot Services Pty Ltd
2017 2016
Agency $’000 $’000
Queensland Treasury Corporation 778,834 461,193
Other - 12
The amounts outstanding are unsecured and will be settled in cash.
2017 2016
$’000 $’000
Total salaries and wages paid or payable to all employees 103,567 105,163
Superannuation paid or payable for all employees
Defined benefit schemes 4,011 3,713
Accumulation schemes 7,611 7,782
11,622 11,495
22. Number of employees
104 FINANCIALS GLADSTONE PORTS CORPORATION ANNUAL REPORT 2016/17

DIRECTORS’ DECLARATIONThe Directors declare that:
i. in the Directors’ opinion, there are reasonable grounds to believe that the company will be able to pay its debts as
and when they become due and payable;
ii. in the Directors’ opinion, the attached financial statements and notes thereto are in accordance with the
Corporations Act 2001, including compliance with accounting standards and giving a true and fair view of the
financial position and performance of the consolidated entity.
Note 2 confirms that the financial statements also comply with International Financial Reporting Standards as issued by
the International Accounting Standards Board.
Signed in accordance with a resolution of the Directors made pursuant to s.295(5) of the Corporations Act 2001.
On behalf of the Directors
L Zussino Dated: 29 August 2017
Chairman
J Reynolds Dated: 29 August 2017
Director
105FINANCIALS GLADSTONE PORTS CORPORATION ANNUAL REPORT 2016/17

INDEPENDENT AUDITOR’S REPORTTo the Members of Gladstone Ports Corporation Limited
Report on the Financial Report
Opinion
I have audited the accompanying financial report of Gladstone Ports Corporation Limited and its controlled entities
(the group).
In my opinion, the financial report:
a) gives a true and fair view of the group’s financial position as at 30 June 2017, and its financial performance and cash
flows for the year then ended
b) complies with the Corporations Act 2001, the Corporations Regulations 2001 and Australian Accounting Standards.
The financial report comprises the consolidated statement of financial position as at
30 June 2017, the consolidated statement of profit and loss and other comprehensive income, consolidated statement
of changes in equity and consolidated statement of cash flows for the year then ended, notes to the financial statements
including summaries of significant accounting policies and other explanatory information, and the directors’ declaration.
Basis for opinion
I conducted my audit in accordance with the Auditor-General of Queensland Auditing Standards, which incorporate
the Australian Auditing Standards. My responsibilities under those standards are further described in the Auditor’s
Responsibilities for the Audit of the Financial Report section of my report.
I am independent of the group in accordance with the ethical requirements of the Accounting Professional and Ethical
Standards Board’s APES 110 Code of Ethics for Professional Accountants (the Code) that are relevant to my audit of
the financial report in Australia. I have also fulfilled my other ethical responsibilities in accordance with the Code and the
Auditor-General of Queensland Auditing Standards. I am also independent of the group in accordance with the auditor
independence requirements of the Corporations Act 2001, and confirm that the independence declaration required by
the Corporations Act 2001, which has been given to the directors of the company, would be in the same terms if given
to the directors as at the time of this auditor’s report.
I believe that the audit evidence I have obtained is sufficient and appropriate to provide a basis for my opinion.
Other information
Other information comprises the information included in the Group’s annual report for the year ended 30 June 2017,
but does not include the financial report and my auditor’s report thereon.
Those charged with governance are responsible for the other information.
My opinion on the financial report does not cover the other information and accordingly I do not express any form of
assurance conclusion thereon.
In connection with my audit of the financial report, my responsibility is to read the other information and, in doing so,
consider whether the other information is materially inconsistent with the financial report or my knowledge obtained
in the audit or otherwise appears to be materially misstated.
If, based on the work I have performed, I conclude that there is a material misstatement of this other information,
I am required to report that fact.
I have nothing to report in this regard.
Responsibilities of the company for the financial report
The company’s directors are responsible for the preparation of the financial report that gives a true and fair view in
accordance with the Corporations Act 2001, the Corporations Regulations 2001 and Australian Accounting Standards,
106 FINANCIALS GLADSTONE PORTS CORPORATION ANNUAL REPORT 2016/17

and for such internal control as the company’s directors determine is necessary to enable the preparation of the financial
report that is free from material misstatement, whether due to fraud or error.
The company’s directors are also responsible for assessing the group’s ability to continue as a going concern, disclosing,
as applicable, matters relating to going concern and using the going concern basis of accounting unless management
either intends to liquidate the group or to cease operations, or has no realistic alternative but to do so.
Auditor’s responsibilities for the audit of the financial report
My objectives are to obtain reasonable assurance about whether the financial report as a whole is free from material
misstatement, whether due to fraud or error, and to issue an auditor’s report that includes my opinion. Reasonable
assurance is a high level of assurance, but is not a guarantee that an audit conducted in accordance with the Australian
Auditing Standards will always detect a material misstatement when it exists. Misstatements can arise from fraud or error
and are considered material if, individually or in aggregate, they could reasonably be expected to influence the economic
decisions of users taken on the basis of this financial report.
As part of an audit in accordance with the Australian Auditing Standards, I exercise professional judgement and maintain
professional scepticism throughout the audit. I also:
• Identify and assess the risks of material misstatement of the financial report, whether due to fraud or error, design
and perform audit procedures responsive to those risks, and obtain audit evidence that is sufficient and appropriate
to provide a basis for my opinion. The risk of not detecting a material misstatement resulting from fraud is higher
than for one resulting from error, as fraud may involve collusion, forgery, intentional omissions, misrepresentations,
or the override of internal control.
• Obtain an understanding of internal control relevant to the audit in order to design audit procedures that are
appropriate in the circumstances, but not for expressing an opinion on the effectiveness of the group’s internal
control.
• Evaluate the appropriateness of accounting policies used and the reasonableness of accounting estimates and
related disclosures made by the group.
• Conclude on the appropriateness of the group’s use of the going concern basis of accounting and, based on
the audit evidence obtained, whether a material uncertainty exists related to events or conditions that may cast
significant doubt on the group’s ability to continue as a going concern. If I conclude that a material uncertainty
exists, I am required to draw attention in my auditor’s report to the related disclosures in the financial report or,
if such disclosures are inadequate, to modify my opinion. I base my conclusions on the audit evidence obtained
up to the date of my auditor’s report. However, future events or conditions may cause the group to cease to
continue as a going concern.
• Evaluate the overall presentation, structure and content of the financial report, including the disclosures, and
whether the financial report represents the underlying transactions and events in a manner that achieves fair
presentation.
• Obtain sufficient appropriate audit evidence regarding the financial information of the entities or business activities
within the group to express an opinion on the financial report. I am responsible for the direction, supervision and
performance of the audit of the group. I remain solely responsible for my audit opinion.
I communicate with the company’s directors regarding, among other matters, the planned scope and timing of the audit
and significant audit findings, including any significant deficiencies in internal control that I identify during my audit.
D Adams FCPA Queensland Audit Office
as delegate of the Auditor-General Brisbane
107FINANCIALS GLADSTONE PORTS CORPORATION ANNUAL REPORT 2016/17