Embed Size (px)
Citation preview
1
Consolidated Edison Company of New York, Inc.
Steam Operations
Assessment of the End to End Efficiency of the Steam System
Joint Proposal Study #1
April 30, 2011

2
Table of Contents Executive Summary - 3
Objective - 5
Scope of Work - 6
Descriptive Work Plan - 6
Con Edison End to End Efficiency – 8
District Energy System End to End Efficiency - 18
Alternative Technologies Description - 22
Technology Efficiencies based on a Proxy Customer - 24
Conclusions - 27
Appendix - 30
2010 Actual Con Edison Fuel A1
2010 Con Edison Tank Farm A2
2010 Con Edison Auxiliaries A3
2010 Con Edison End to End Efficiency A4
2010 Actual Con Edison Fuel – Winter A5
2010 Con Edison Tank Farm – Winter A6
2010 Con Edison End to End Efficiency – Winter A7
2010 Actual Con Edison Fuel – Summer A8
2010 Con Edison Tank Farm – Summer A9
2010 Con Edison End to End Efficiency – Summer A10
2015 Projected Con Edison Fuel A11
2015 Projected Con Edison Auxiliaries A12
2015 Projected Con Edison End to End Efficiency A13
2015 Projected Con Edison Fuel – Winter A14
2015 Projected Con Edison End to End Efficiency - Winter A15
2015 Projected Con Edison Fuel – Summer A16
2015 Projected Con Edison End to End Efficiency - Summer A17
Measurement Uncertainties A18
District Chilled Water End to End Efficiency A19
District Hot Water End to End Efficiency A20
District Chilled and Hot Water End to End Efficiency A21
District Chilled and Hot Water with Cogeneration End to End Efficiency A22
Condensate Usage Analysis – Summary Sheet A23
Condensate Usage Analysis – Scenario # 1 A24
Condensate Usage Analysis – Scenario # 2 A25
Condensate Usage Analysis – Scenario # 3 A26
Condensate Usage Analysis – Scenario # 4 A27
Proxy Customer Technology Summary Sheet – Gas Turbine with HRSG A28
Proxy Customer Technology Summary Sheet – Microturbine A29
Proxy Customer Technology Summary Sheet – Boiler A30
Proxy Customer Technology Summary Sheet – Fuel Cell A31
Proxy Customer Technology Summary Sheet – Reciprocating Engine A32
District Chilled Water Energy Diagram A33
District Hot Water Energy Diagram A34
District Chilled and Hot Water Energy Diagram A35
District Chilled and Hot Water with Cogeneration Energy Diagram A36
Con Edison Steam System 2010 End to End Energy Diagram A37
Con Edison Steam System 2015 End to End Energy Diagram A38
3
1. Executive Summary
The 2010 Steam Rate Order required Consolidated Edison Company of New York, Inc.
(“Con Edison” or the “Company”) to examine the end-to- end efficiency of the Con
Edison steam system (“Study #1”). As part of this effort, the Company performed the
following analyses and review:
1. The actual 2010 end to end efficiency of the Con Edison steam system.
2. The forecasted 2015 end to end efficiency of the Con Edison steam system.
3. The manufacturer efficiency ranges of different types of combined heat and power
(cogeneration or “CHP”) technologies and boiler-only technologies that a customer
can install in its building in lieu of using Con Edison steam.
4. The energy use efficiency of the different types of combined heat and power
technologies and boiler-only technologies installed in a proxy Manhattan commercial
customer’s building, in lieu of Con Edison steam.
5. The estimated efficiency of a district energy system constructed in Manhattan.
End to end efficiency is defined as the total amount of energy used (electrical and
thermal) by a customer divided by the total fuel input. Only the electric energy used by
the customer that was produced by steam system cogeneration (for the steam end to end
efficiency calculation) and the electric energy produced by the customer-sited sources
were accounted for in these end to end efficiency assessments. All efficiency values
within this report are High Heating Value (“HHV”).
One assumption that was common for all of the foregoing cases was that there were no
building equipment heat losses. This is so because every building is different and there
are too many different types of equipment configurations that could be possible. The
following tables summarize the findings of this study. Figure 1 shows the end to end
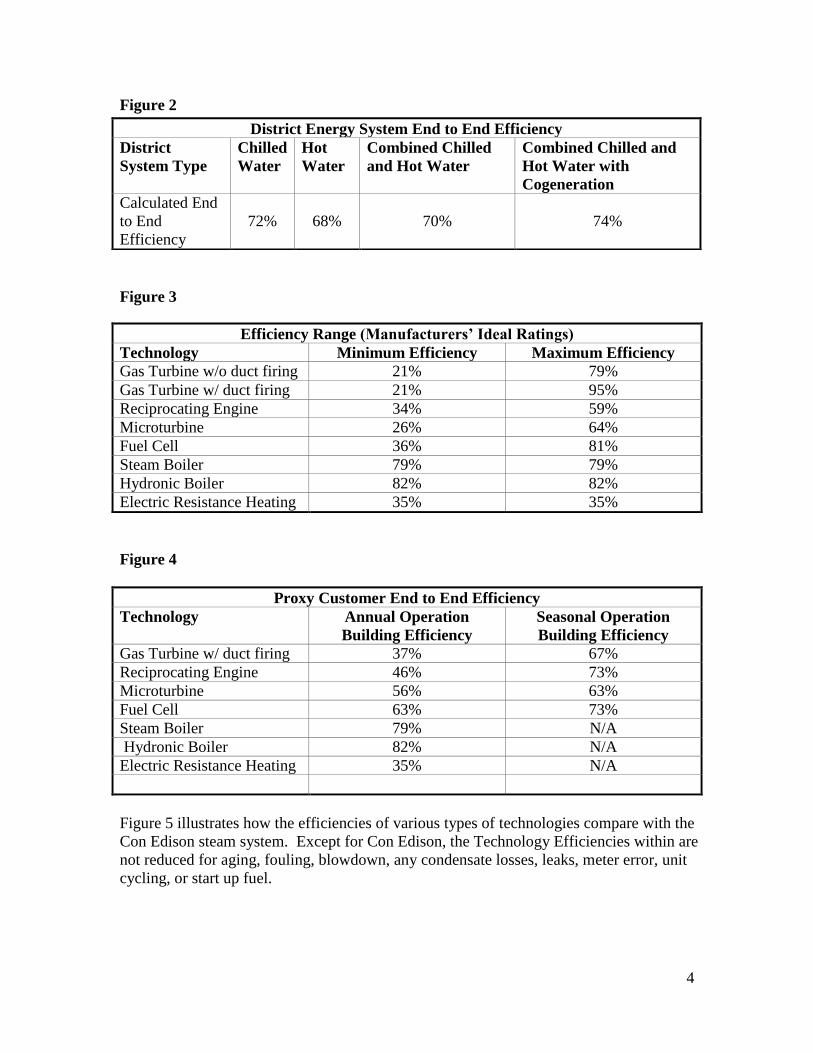
efficiency of the Con Edison steam system for 2010 and 2015. Figure 2 shows the end to
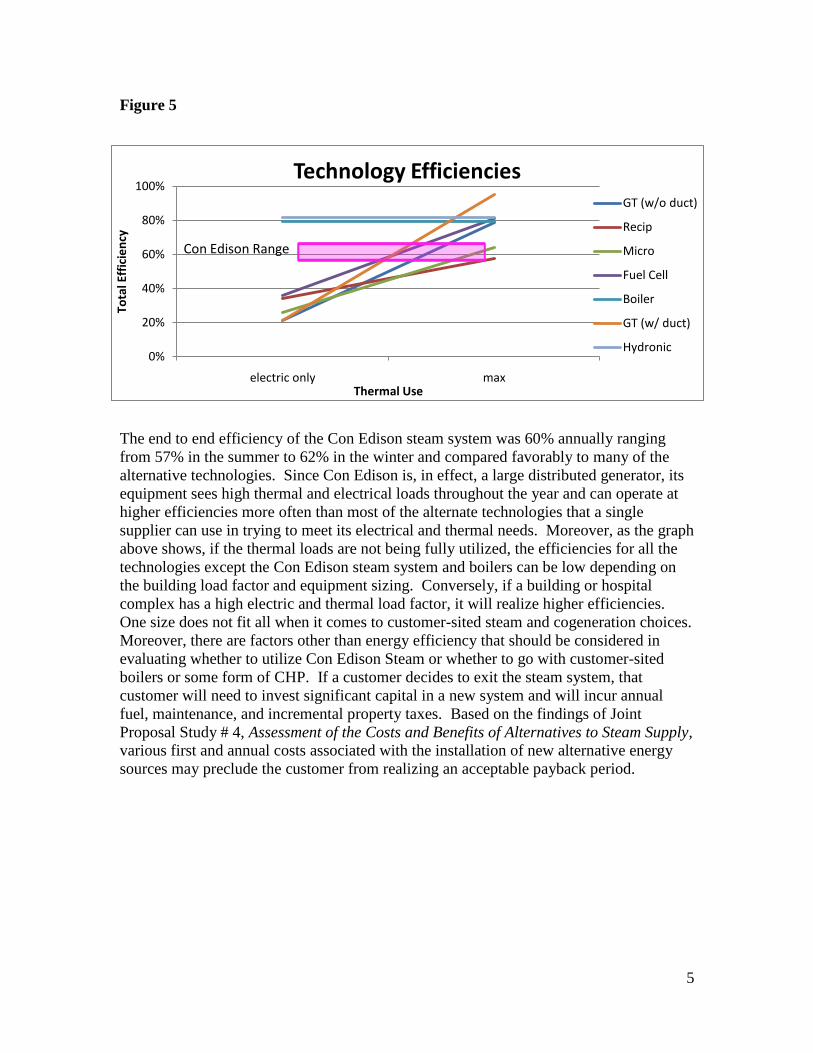
end efficiency of various district energy system options. Figure 3 shows the efficiency of
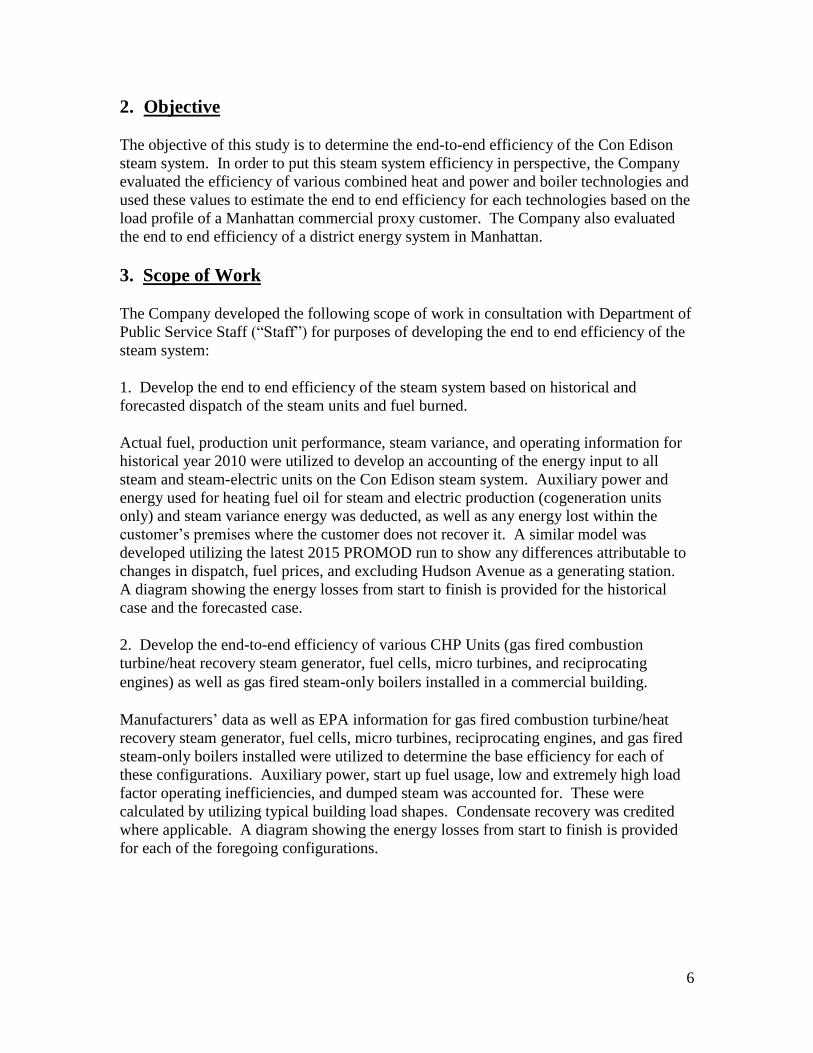
various types of manufacturers’ equipment that could be used by a customer. Figure 4
shows the end to end efficiency of a proxy customer’s building based on the type of
equipment used to provide energy to that building.
Figure 1
Steam System End to End Efficiency Results
2010 Con Edison Steam System 60%
2010 Con Edison Steam System – Winter 62%
2010 Con Edison Steam System – Summer 57%
2015 Con Edison Steam System 60%
2015 Con Edison Steam System – Winter 63%
2015 Con Edison Steam System – Summer 57%
4
Figure 2
Figure 3
Figure 4
Proxy Customer End to End Efficiency
Technology Annual Operation
Building Efficiency
Seasonal Operation
Building Efficiency
Gas Turbine w/ duct firing 37% 67%
Reciprocating Engine 46% 73%
Microturbine 56% 63%
Fuel Cell 63% 73%
Steam Boiler 79% N/A
Hydronic Boiler 82% N/A
Electric Resistance Heating 35% N/A
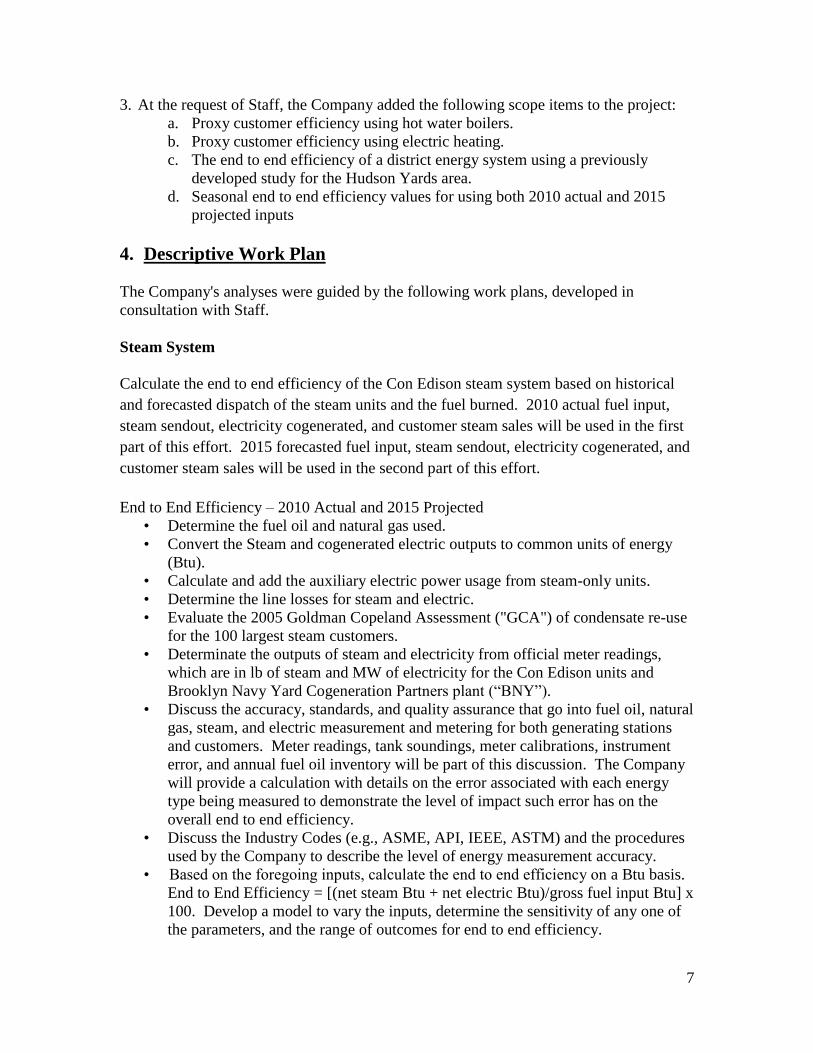
Figure 5 illustrates how the efficiencies of various types of technologies compare with the
Con Edison steam system. Except for Con Edison, the Technology Efficiencies within are
not reduced for aging, fouling, blowdown, any condensate losses, leaks, meter error, unit
cycling, or start up fuel.
District Energy System End to End Efficiency
District
System Type
Chilled
Water
Hot
Water
Combined Chilled
and Hot Water
Combined Chilled and
Hot Water with
Cogeneration
Calculated End
to End
Efficiency
72% 68% 70% 74%
Efficiency Range (Manufacturers’ Ideal Ratings)
Technology Minimum Efficiency Maximum Efficiency
Gas Turbine w/o duct firing 21% 79%
Gas Turbine w/ duct firing 21% 95%
Reciprocating Engine 34% 59%
Microturbine 26% 64%
Fuel Cell 36% 81%
Steam Boiler 79% 79%
Hydronic Boiler 82% 82%
Electric Resistance Heating 35% 35%
5
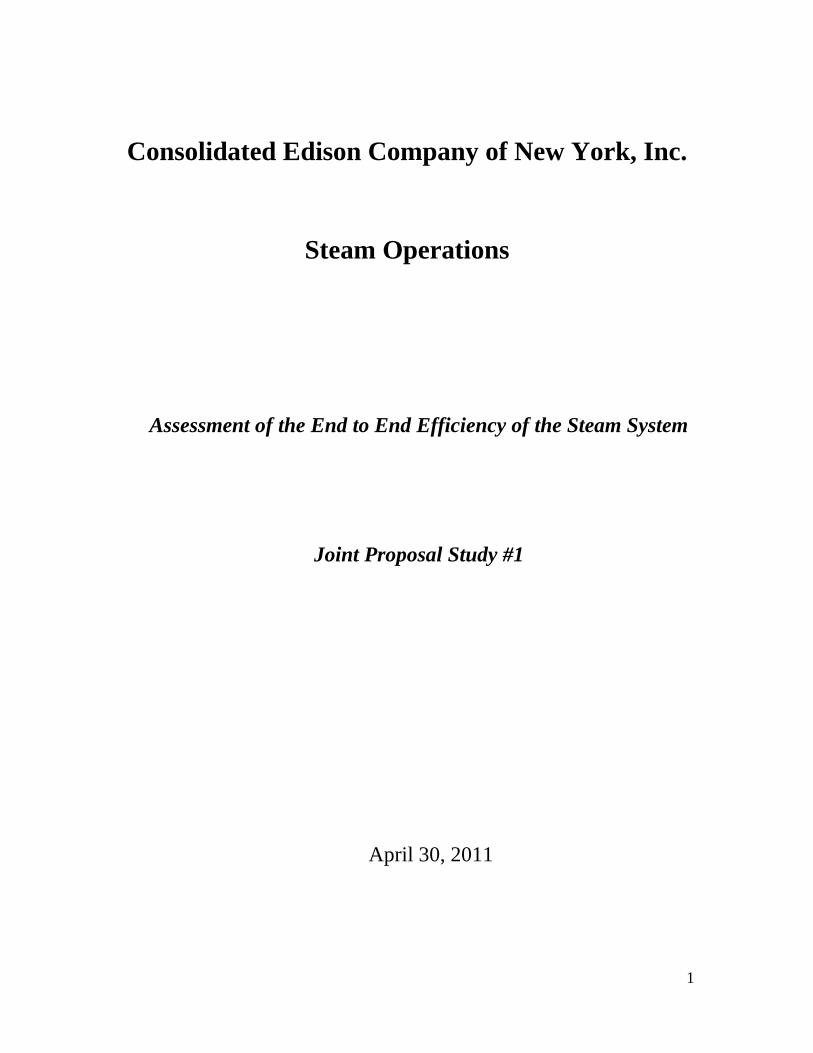
Figure 5
The end to end efficiency of the Con Edison steam system was 60% annually ranging
from 57% in the summer to 62% in the winter and compared favorably to many of the
alternative technologies. Since Con Edison is, in effect, a large distributed generator, its
equipment sees high thermal and electrical loads throughout the year and can operate at
higher efficiencies more often than most of the alternate technologies that a single
supplier can use in trying to meet its electrical and thermal needs. Moreover, as the graph
above shows, if the thermal loads are not being fully utilized, the efficiencies for all the
technologies except the Con Edison steam system and boilers can be low depending on
the building load factor and equipment sizing. Conversely, if a building or hospital
complex has a high electric and thermal load factor, it will realize higher efficiencies.
One size does not fit all when it comes to customer-sited steam and cogeneration choices.
Moreover, there are factors other than energy efficiency that should be considered in
evaluating whether to utilize Con Edison Steam or whether to go with customer-sited
boilers or some form of CHP. If a customer decides to exit the steam system, that
customer will need to invest significant capital in a new system and will incur annual
fuel, maintenance, and incremental property taxes. Based on the findings of Joint
Proposal Study # 4, Assessment of the Costs and Benefits of Alternatives to Steam Supply,
various first and annual costs associated with the installation of new alternative energy
sources may preclude the customer from realizing an acceptable payback period.
0%
20%
40%
60%
80%
100%
electric only max
Tota
l Eff
icie
ncy
Thermal Use
Technology EfficienciesGT (w/o duct)
Recip
Micro
Fuel Cell
Boiler
GT (w/ duct)
Hydronic
Con Edison Range
6
2. Objective
The objective of this study is to determine the end-to-end efficiency of the Con Edison
steam system. In order to put this steam system efficiency in perspective, the Company
evaluated the efficiency of various combined heat and power and boiler technologies and
used these values to estimate the end to end efficiency for each technologies based on the
load profile of a Manhattan commercial proxy customer. The Company also evaluated
the end to end efficiency of a district energy system in Manhattan.
3. Scope of Work
The Company developed the following scope of work in consultation with Department of
Public Service Staff (“Staff”) for purposes of developing the end to end efficiency of the
steam system:
1. Develop the end to end efficiency of the steam system based on historical and
forecasted dispatch of the steam units and fuel burned.
Actual fuel, production unit performance, steam variance, and operating information for
historical year 2010 were utilized to develop an accounting of the energy input to all
steam and steam-electric units on the Con Edison steam system. Auxiliary power and
energy used for heating fuel oil for steam and electric production (cogeneration units
only) and steam variance energy was deducted, as well as any energy lost within the
customer’s premises where the customer does not recover it. A similar model was
developed utilizing the latest 2015 PROMOD run to show any differences attributable to
changes in dispatch, fuel prices, and excluding Hudson Avenue as a generating station.
A diagram showing the energy losses from start to finish is provided for the historical
case and the forecasted case.
2. Develop the end-to-end efficiency of various CHP Units (gas fired combustion
turbine/heat recovery steam generator, fuel cells, micro turbines, and reciprocating
engines) as well as gas fired steam-only boilers installed in a commercial building.
Manufacturers’ data as well as EPA information for gas fired combustion turbine/heat
recovery steam generator, fuel cells, micro turbines, reciprocating engines, and gas fired
steam-only boilers installed were utilized to determine the base efficiency for each of
these configurations. Auxiliary power, start up fuel usage, low and extremely high load
factor operating inefficiencies, and dumped steam was accounted for. These were
calculated by utilizing typical building load shapes. Condensate recovery was credited
where applicable. A diagram showing the energy losses from start to finish is provided
for each of the foregoing configurations.
7
3. At the request of Staff, the Company added the following scope items to the project:
a. Proxy customer efficiency using hot water boilers.
b. Proxy customer efficiency using electric heating.
c. The end to end efficiency of a district energy system using a previously
developed study for the Hudson Yards area.
d. Seasonal end to end efficiency values for using both 2010 actual and 2015
projected inputs
4. Descriptive Work Plan
The Company's analyses were guided by the following work plans, developed in
consultation with Staff.
Steam System
Calculate the end to end efficiency of the Con Edison steam system based on historical
and forecasted dispatch of the steam units and the fuel burned. 2010 actual fuel input,
steam sendout, electricity cogenerated, and customer steam sales will be used in the first
part of this effort. 2015 forecasted fuel input, steam sendout, electricity cogenerated, and
customer steam sales will be used in the second part of this effort.
End to End Efficiency – 2010 Actual and 2015 Projected
• Determine the fuel oil and natural gas used.
• Convert the Steam and cogenerated electric outputs to common units of energy
(Btu).
• Calculate and add the auxiliary electric power usage from steam-only units.
• Determine the line losses for steam and electric.
• Evaluate the 2005 Goldman Copeland Assessment ("GCA") of condensate re-use
for the 100 largest steam customers.
• Determinate the outputs of steam and electricity from official meter readings,
which are in lb of steam and MW of electricity for the Con Edison units and
Brooklyn Navy Yard Cogeneration Partners plant (“BNY”).
• Discuss the accuracy, standards, and quality assurance that go into fuel oil, natural
gas, steam, and electric measurement and metering for both generating stations
and customers. Meter readings, tank soundings, meter calibrations, instrument
error, and annual fuel oil inventory will be part of this discussion. The Company
will provide a calculation with details on the error associated with each energy
type being measured to demonstrate the level of impact such error has on the
overall end to end efficiency.
• Discuss the Industry Codes (e.g., ASME, API, IEEE, ASTM) and the procedures
used by the Company to describe the level of energy measurement accuracy.
• Based on the foregoing inputs, calculate the end to end efficiency on a Btu basis.
End to End Efficiency = [(net steam Btu + net electric Btu)/gross fuel input Btu] x
100. Develop a model to vary the inputs, determine the sensitivity of any one of
the parameters, and the range of outcomes for end to end efficiency.

8
• For the 2015 end to end efficiency calculation, estimate the Steam Variance using
2015 steam sales forecast.
• Perform 2015 PROMOD run for new fuel prices, sales forecasts, steam peaks,
outage schedule, dispatch criteria, and other information.
• Input of all of the foregoing data into the end to end efficiency calculation,
including consideration of auxiliary power for production, meter and
measurement error, and the condensate losses determined in the first part of this
assessment for the 2015 end to end efficiency calculation.
CHP and Boilers
Calculate the end to end efficiency of CHP units, as well as gas fired steam-only boilers
installed in a commercial building.
• Obtain actual monthly steam and electric end use for a typical commercial (SC-2)
steam customer from the Company’s customer system.
• Identify specific commercially available equipment technical information for each of
the technology configurations previously identified above. Develop a configuration
using the identified equipment that matches the customer’s steam peak. Develop an
equipment dispatch profile for the selected configuration, based on the building loads.
• Calculate the CHP and boiler system efficiency for a year including any losses within
the building.
• Provide energy diagrams for all cases.
• Provide a set of line graphs that illustrate CHP and boiler system efficiencies across a
range of electric and thermal loads. Each line in the graph will be based on efficiency
ranges for the identified configuration technologies.
• Discuss the inputs, assumptions, and findings. For example,
o Discuss how equipment configuration and dispatch practice affects CHP
system efficiency.
o Con Edison assumes the same level of accuracy, due diligence for calibration
and proof testing of measurement and meter devices, standards and
frequency by customers in maintaining boilers clean when they foul with oil
ash as the Company maintains for its system.
Additional Scope Items
• Determine the end to end efficiency for a building utilizing hot water boilers.
• Determine the end to efficiency for a building utilizing electric radiant heat.
• Review the 2007 District Energy Study for the Hudson Yards and provide a best
estimate for what the end to end efficiency for such a district energy system would be.
• For the months of January through April and November and December, determine the
steam system end-to-end efficiency for 2010 Actual and 2015 Forecast.
9
• For the months of May through October, determine the steam system end-to-end
efficiency for 2010 Actual and 2015 Forecast.
5. Con Edison Steam End to End Efficiency
Approach
In calculating end to end efficiencies the Company used a consistent methodology for Con
Edison, customer technologies, and district energy. Input fuel, thermal output, and electric
output were all converted into MMBtu (1 million Btu) units. The final end to end
efficiency was calculated by dividing the total energy used by the customer (electric and
thermal) by the total fuel input. Refer to Appendix pages A1 to A18 for calculation details
and input summaries.
Data References
To accurately determine the end to end efficiency of the Con Edison steam system, the
Company needed to consolidate and analyze a large quantity of information from various
sources, including:
Con Edison Fuel Inventory Management System (“FIMS”)
o Fuel burn, net steam production, and cogenerated electric production.
o The BNY fuel, steam production, and electric production.
Con Edison PROMOD (Production Model)
o 2015 projections for fuel, steam production, and electric production.
o Steam variance.
o Electrical line losses.
o The estimated condensate heat recovery value was calculated based on a
previously developed 2005 study by Goldman Copeland Associates.
Con Edison Plant Information System ("PI")
o Weighted average steam enthalpy, ER6 cogeneration in fuel and electric
production.
Department of Environmental ("DEC") Protection Representative
o Weighted average city water enthalpy.
10
Measurement Uncertainties
As part of this study, a methodology was developed to integrate the measurement
uncertainty or error associated with the measurement/metering of steam, natural gas, fuel
oil, and electricity into a composite error factor that could be applied to the calculated end
to end efficiency of the steam system. A summary table, which illustrates the
measurement uncertainty for the Con Edison steam system, can be found in the Appendix
section of this report (Appendix page A18). The actual 2010 steam, electric, gas, and
fuel oil quantities were checked by comparison against standard measurement
instruments, and on an integrated basis were determined to be within 0.02% of these
standards. This error value was determined to be insignificant.
The Company judged that this measurement uncertainty can also be reasonably applied to
the customer sited solutions and the district energy configuration, assuming a similar
level of meter inspection and calibration to professional standards. Below are the
component contributions of the Fuel Oil, Natural Gas, Steam, and Electric
measurement/meter uncertainties.
Fuel Oil
The primary fuel oil burned at the Con Edison generating stations is low sulfur #6 fuel
oil. Less than 20% of Con Edison’s steam production comes from this fuel type. In
2010, approximately 17% of steam produced came from #6 fuel oil. This fuel type is
utilized primarily as a back up to natural gas and during high load periods (#6 fuel oil is
shipped via a barge into the generating stations). The #6 fuel oil supply for 74th
Street
Generating Station and the Ravenswood A-House Steam Plant is managed by the current
owner of the Ravenswood Electric Generating Station, TransCanada Ravenswood. When
fuel barges make deliveries to the generating stations, the quantity and quality of oil
supplied is measured using American Petroleum Institute Standards. A certified
independent inspector is required to make such measurements and sample the fuel oil for
sulfur content and calorific content testing for every delivery received. The sulfur
content must be below 0.30 % and the calorific value for #6 fuel burned is about 148,000
Btu/gal. #6 fuel oil must be kept hot and is re-circulated from storage tanks to the boiler
fronts to keep it flowing and ready for use. As such, the generating stations utilize main
fuel oil meters and recirculation fuel oils in order to account for the actual amount of fuel
oil burned.
Data showing the fuel oil measurement uncertainties were obtained from the fuel oil
barge delivery receipts, micro motion main meter proving calibration sheets, and micro
motion recirculation meter proving calibration sheets. This data as well as data from the
recirculation meter for the Con Edison Ravenswood A-House were considered.
11
There were twenty-one fuel oil delivery barges to the Hudson Avenue, East River, and
59th
Street Generating Stations in 2010. The Company’s FIMS reports show what was
certified delivered and what was measured before and after the barge and tank readings.
This error was calculated by multiplying the error times the quantity for each barge
delivery. Then all were summed and then divided by the delivered quantity to obtain the
error.
This also included the metering errors obtained from fuel meter calibration reports from
TransCanada . This covered both the main and recirculation fuel oil meters at 74th
Street
and the Ravenswood A-House.
Consistent with the Con Edison Fuel Oil Quality Assurance Program, all barge delivery
quantities are verified by an independent qualified API Inspector and annually, on
September 1st, a fuel oil inventory is performed on all Con Edison plant tanks to verify
the used quantities, inventory and deliveries during the year. The 74th
Street and
Ravenswood A-House main and recirculation meters are calibrated annually by
TransCanada Ravenswood.
For 2010, the fuel measurement error was -0.0281%.
Fuel Gas
The accuracy of the Company’s generating stations’ natural gas meters was determined to
be -0.0393%, which is based on the weight averaged for the natural gas quantities
delivered in 2010. This calculation is based on the Company’s Gas Metering report that
also looks at the results of meter accuracy tests obtained from vendors testing the meters
against their standards. American Gas Association standards are utilized.
In addition, consistent with Con Edison procedures, all meter pressure, delta pressure,
and temperature transducers are calibrated quarterly. The turbine meters are changed out
and tested every seven years and the ultrasonic meters are changed out and tested every
two years. This helps to ensure measurement accuracy of natural gas.
For 2010, the natural gas measurement error was -0.039%.
Electricity
Electric meter data was obtained from the Company’s meter calibration records.
Consistent with Con Edison procedures, electric generation meters are calibrated on an
annual basis.
The electric meters associated with East River Cogeneration Units 1, 2, and 6 were
calibrated and, according to Con Edison’s Electrical Engineering Department, the errors
were weight averaged to the megawatts generated during the year. An error of 0.00995%
was obtained.
12
Steam
The steam sendout metering errors were obtained from each generating station’s monthly
sendout sheets that list the correction factor applied to its steam flow. Steam meter data
was obtained from monthly steam usage reports from the generating stations. Meter
calibration checks are performed semi-annually by each station’s Results group pursuant
to Company procedures. In addition, the Company performs annual calibration checks
on the meters.
These corrections were weight averaged to the individual flows and a composite error of
0.049% was obtained.
Integrated Error Calculation Approach
The fuel input error was obtained by multiplying the error for oil times 17% for the
percentage of fuel oil used in 2010 plus the error in gas times 83% for the percentage of
natural gas used in 2010 to obtain an input error of -0.0374%.
An output error of 0.0370%.was obtained by multiplying the error for electric times the
MMBtu for electric for 2010 plus the error for steam times the MMBtu for steam divided
by the sum of MMBtu for electric and steam.
To determine the largest magnitude of error, the error in efficiency was obtained by
adding 1 to the error in output and subtracting the error in input from 1, and dividing this
ratio times the 60% end to end efficiency yielded a value of 59.979% and by subtraction
from 60% for an error of 0.02% in efficiency.
Steam Condensate Reuse and Heat Recovery
General
To accurately evaluate the end to end efficiency of the steam system, the energy
discharged in the form of steam condensate needs to be included in the analysis. Since
this condensate reuse and heat recovery process occurs on the customer side of the
system, it is difficult to determine its impact on the overall system effect. In 2005,
Goldman Copeland Associates prepared a study for the Company detailing the
condensate energy recovery and reuse strategies being implemented by the Company’s
top 100 customers. The study was titled “Assessment of the potential for customer
recovery/reuse of steam condensate.” Based on this study, the Company approximated
the quantity of energy recovered as well as the volume of condensate that was reused by
all customers. These values were included in the overall end to end calculation of the
steam system. Detailed calculation sheets can be found in the Appendix section of this
report on pages A23 to A27. Based on the age of the data used in the study, GCA
recently advised that the total volume of condensate collected and reused may be as high
as 50% compared to the 30% listed in the report. This increase is based on GCA’s
involvement in the commercial building energy services industry and experience with
13
retrofits and installations of heating, ventilation, air conditioning, and other building
energy systems in Manhattan. Moreover, to apply these values to the entire system, SC-1
customers should be removed as these small customers are unlikely to recover the capital
cost associated with condensate recovery. Based on the foregoing, the Company
analyzed the following scenarios:
1. Scenario # 1: Condensate water and heat recovery based on the study.
2. Scenario # 2: Condensate water and heat recovery based on the study with all SC-
1 customer steam sales removed.
3. Scenario # 3: Condensate water recovery 30% to 40% with all SC-1 customer
steam sales removed.
4. Scenario # 4: Condensate water recovery 30% to 50% with all SC-1 customer
steam sales removed.
After examining these various scenarios, the Company decided to utilize Scenario # 3 in
the steam end to end efficiency calculation to determine the quantity of heat recovery.
This value was determined to be the most accurate representation of the current steam
system customer base.
Condensate Reuse
Based on the survey results documented in the GCA study, the top 100 steam customers
produce 1,362,432,000 gallons of steam condensate per year. Of this produced volume, a
total of 544,972,800 gallons were collected for reuse. The intended use for this collected
water was for cooling tower make-up.
While 554,972,800 gallons of steam condensate was collected, only 46% of this collected
volume (250,837,985 gallons) was actually reused for cooling tower make-up. This is
mainly due to the season disparity of steam condensate produced and cooling tower
make-up required. The majority of steam condensate will be produced in the winter time
when steam loads are high but the cooling tower make-up water loads are low. The result
of this phenomenon is that a portion of the collected water is discharged to the sewer.
As per assumptions listed in the report and discussions with GCA, the majority of the
cooling tower water collected for reuse will be coupled with a heat recovery process.
This is mainly due to the temperature of the condensate being too high for use in the
cooling tower. Cooling towers typically have a design supply temperature of 85oF.
Based on the above analysis and information, the Company calculated that 18.4% of
steam condensate produced by the top 100 customers is collected and reused. This result
was then applied to the entire steam system in the end to end calculation.
14
Condensate Heat Recovery
As stated above, the top 100 steam customers produce 1,362,432,000 gallons of steam
condensate per year. Of this produced volume, thermal energy was recovered from a
total of 663,643,800 gallons. The intended use for this recovered thermal energy was for
domestic water heating.
A number of properties utilized a combined steam condensate reuse and thermal recovery
strategy while others simply captured the thermal energy without reusing the condensate
to offset potable water.
Based on the analysis and information listed above, the Company calculated that about
16% of available thermal energy wasted in the form of condensate, by the top 100
customers, is captured and used for domestic water heating. This result was derived from
considering only SC2 and SC3 steam customers. The 16% is a proxy for condensate
energy recovery.
Worksheet Navigation
2010 Con Edison End to End Efficiency
Fuel Sheet – Appendix Page: A1
This page consists of data from FIMS. Fuel oil and gas are expressed in millions of
Btu’s, steam flow is expressed in thousands of pounds, and electricity is expressed in
megawatts. Brooklyn Navy Yard data for the same quantities were obtained from
Company data. At the bottom of the fuel sheet, the quantities were summed up and for
steam they were grouped as HP (high pressure), package boilers ERRP duct and BNY
steam for both millions of Btu’s and thousands of pounds of steam.
The electrical quantities were summed up for ERRP, BNY, and ER6 (when in
cogeneration mode) production units for both millions of Btu’s and megawatts.
The East River 6 quantities for cogeneration mode were determined by using PI to
determine the MW for this unit for the year when steam flow was less than 20 Mlb.
Where steam flow is less than 20 Mlb/hr, the MW produced were not used for this study.
For the year 2010, PI determined that only 18% of the MW were for the cogeneration
mode and so only 18% of the MW and fuel were allocated to this unit for the study.
Tank Farm Heating Steam – Appendix Page: A2
This page is a breakdown of the tank farm steam usages for each plant as this must be
added to the fuel as it is broken out of fuel for the FIMS report and is not included as part
of the fuel. As noted, ER6, ER 7, South Steam Station, and Hudson Avenue use a factor
to determine the usage and the Ravenswood A-House uses a meter.
15
Auxiliaries – Appendix Page: A3
This page is a breakdown of the electrical auxiliaries used at the generating stations that
were determined to be included in the form of input fuel in the study as it is not normally
accounted for but must be in order to account for energy needed by the auxiliary
equipment to operate the boilers. As shown, 60th
Street, 74th
Street, 59th
Street Package,
East River South Steam Station, and Ravenswood A-House all have electric meters to
determine the kilowatt usage. This usage includes all energies to operate not only
auxiliaries but computers, lighting, and other gadgets and gizmos, used by station
personnel as this usage is part of the auxiliary usage in all power plants in general and is
netted out of the gross unit output. As such, the Company has only taken 75% of the total
amount towards production and utilized in the end to end efficiency calculations. Hudson
Avenue and 59th
Street Annex Boilers use estimates to determine the auxiliary
consumption.
End to End – Appendix Page: A4
This page displays the end to end diagram and the fuel, steam, and megawatts quantities.
In addition, a third column was added to break down the steam and megawatts to millions
of Btu’s in order to be able to express efficiency by dividing the useful output Btu’s by
the fuel input Btu’s. As noted at the bottom of the sheet, the tank farm and auxiliary
Btu’s are added to the fuel input Btu’s in order to capture and charge the system properly.
The megawatts were converted to Btu’s by using the universal 3,412 Btu’s per kilowatt
hour. The steam energy was converted from pounds using the conversion factor of
1,192.82 Btu’s per pound. This was determined by weight averaging all the steam
sendout enthalpies for the year 2010 by using PI to arrive at 1,215.3 Btu/lb. The DEP was
contacted to determine the average enthalpy of the cold city water coming into New York
City for year 2010. These temperatures are obtained internally from the water in the
piping coming into the City. This value was 22.48 Btu/lb obtained from the steam tables
using the DEP values of 40 psig water pressure and 54.25 F degrees. Subtraction of the
incoming City water enthalpy from the steam system weighted average enthalpy yields an
enthalpy of 1,192.82 Btu/lb, which represents the energy supplied to the water to make
steam for sendout.
At the top of the energy diagram the cogenerated megawatts are displayed and linked to
the totals that are lower on the sheet, continuing to the right is the conversion of
megawatts to millions of Btu’s and further to the right the quantities are reduced by 6.6%
for the average Con Edison transmission losses for the year 2010 in order to obtain the
useful energy delivered to the customers' wall.
At the bottom of the energy diagram the steam sendout in thousands of pounds is linked
to the tabulated sum further down on the sheet. Continuing to the right the steam is
converted from thousands of pounds to millions of Btu's using the derived enthalpy of
1,192.82 Btu/lb. Further to the right the 2010 steam variance, which is the difference
between Con Edison sendout meters from customer meters, times the 1,192.82 Btu/lb
was subtracted from the sendout Btu’s as this energy is lost through traps as condensate
16
from thermal losses in the steam distribution system. The remaining energy represents
the delivered energy to the customer. Further right shows that the energy is not all
consumed by the customer and all the condensate is rejected at a temperature of 180 F
degrees and 14.7 psia. This information was obtained from customer surveys by Con
Edison’s Building Services group. Further to the right shows the Btu’s that are on their
way to the sewer. These Btu’s are lowered due to the 2005 GCA Report and were
discussed with GCA in order to update to present day 2010. The Company determined
that 16% of the normally rejected Btu’s are reclaimed. At the extreme right is the useful
thermal energy utilized by the customers, which is the sendout Btu’s minus the variance
loss and sewer Btu’s.
The end to end efficiency was obtained by summing the useful megawatt and thermal
Btu’s by the total fuel Btu’s (including tank farm and auxiliaries) and was found to be
60%.
2010 End to End Winter and Summer Efficiencies
The FIMS data for 2010 was segregated to the period May through October to be called
the summer period and January through April and November and December to be called
the winter period. The BNY data for thermal and electrical Btu’s and pounds of steam and
megawatts were obtained from their Qualified Facility (“QF”) report (thermal), Load
Profile Display Report (“LPDS”) - steam and Table A from Energy Management-
megawatts. The fuel input for the electrical and steam from BNY was obtained by first
calculating the Electric Heat Rate from BNY for all of 2010 as 5,346 Btu/kWh. Then the
winter and summer output net megawatts were multiplied by the BNY Electric Heat Rate
(5,346 Btu/kWh) to obtain electric fuel input. Then knowing that 54% of BNY is electric,
the Company determined the total input by dividing the electric input by 0.54. The steam
input was obtained by subtracting the total input Btu’s from the electric input Btu’s. The
same methodology was conducted for each of these periods as was done for the year. The
seasonal efficiency values were determined to be 62% for the winter and 57% for the
summer. When combined, these values yield the overall annual efficiency of 60%. The
detailed seasonal efficiency calculation sheets can be found in the Appendix on pages A5
to A10.
2015 End to End Year, Winter and Summer
Data for fuel, steam and megawatts were obtained from PROMOD runs for each period
and again the BNY fuel input was obtained by using the 5,346 Btu/kWh electric heat rate
for year 2010 and multiplying that heat rate by the megawatts for the different periods to
obtain electric heat input and then dividing this result by the electric load ratio 0.54 to
obtain total fuel input for BNY as PROMOD doesn’t determine fuel input Btu’s, only
steam and megawatt Btu’s. The tank farm and auxiliary usage was determined from the
monthly quantity aggregate for 2010 and its summer and winter periods are applied to
each 2015 PROMOD case. The same enthalpy value for steam input 1,192.82 Btu/lb for
2010 was used for each of the other periods for both 2010 and 2015. The same electric
transmission loss (6.6%) was used for each of the actual 2010 and 2015 periods as well as
17
16% recovery of condensate. The steam variance loss was determined from the monthly
actual values for year 2010 and summer and winter losses and these same percentages
were applied to each of the year, summer and winter periods, respectively, in the
PROMOD models. The detailed 2015 projected system efficiency calculation sheets can
be found in the Appendix on pages A11 to A17.
Results
The following table summarizes the results of the end to end efficiency of the Con Edison
steam system.
Con Edison Steam System
Steam System End to End Efficiency Results
2010 Con Edison Steam System 60%
2010 Con Edison Steam System – Winter 62%
2010 Con Edison Steam System – Summer 57%
2015 Con Edison Steam System 60%
2015 Con Edison Steam System – Winter 63%
2015 Con Edison Steam System – Summer 57%
For Year 2010, actual data was utilized to develop the efficiencies. The analysis
considered the gross fuel that was used to produce steam and cogenerated electricity, any
auxiliary light and power taken from the grid for production of steam and cogenerated
electric, fuel used to heat #6 fuel oil, steam variance (line losses in the steam distribution
system), and any energy that was not recovered from hot condensate that was discharged
to the sewer. For any cogenerated electricity, the gross fuel input for such production
was considered as well as transmission and distribution losses up the customer’s
premises. Meter accuracy for steam, natural gas, fuel oil, and cogenerated electricity
were also considered in this assessment. Purchased steam and purchased cogenerated
electricity from BNY were included. For year 2015, the Company utilized its
production/dispatch model, PROMOD, as well as applied other parameters, such as steam
variance, auxiliary power, tank farm heating fuel, and customer side condensate losses.
As the table shows, the differences between 2010 and 2015 are insignificant. All results
are High Heating Value (“HHV”). The summer period is May through October and the
winter is January through April, November and December.
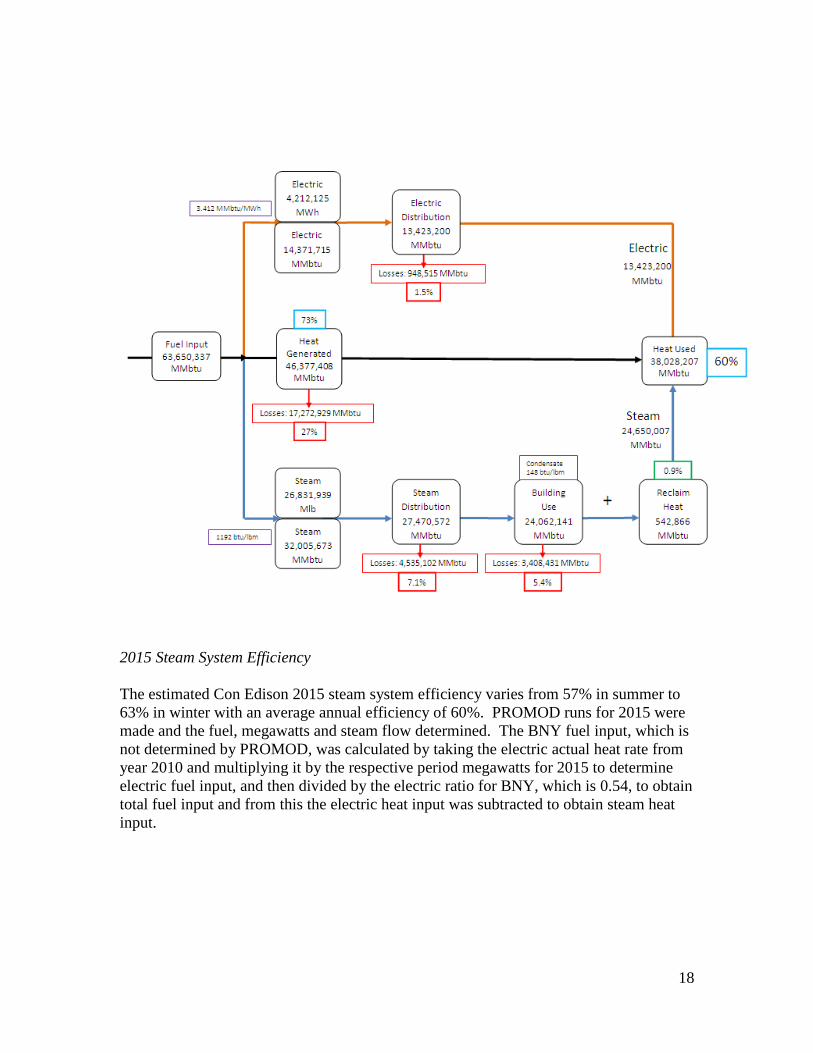
2010 Steam System Efficiency
The Con Edison 2010 steam system efficiency varies from 57% in summer to 62% in
winter with an average annual efficiency of 60%. The efficiency leaving the central
generating stations, including the steam and electric generated by BNY varies from 71%
in summer to 75% in winter with an annual average of 73%. Annually, the energy losses
with respect to the entire system are 27% in generation, 11.5% in steam distribution and
building condensate loss, and 1.5% electric distribution losses. The following diagram
illustrates the 2010 end to end efficiency for the steam system:
18
2015 Steam System Efficiency
The estimated Con Edison 2015 steam system efficiency varies from 57% in summer to
63% in winter with an average annual efficiency of 60%. PROMOD runs for 2015 were
made and the fuel, megawatts and steam flow determined. The BNY fuel input, which is
not determined by PROMOD, was calculated by taking the electric actual heat rate from
year 2010 and multiplying it by the respective period megawatts for 2015 to determine
electric fuel input, and then divided by the electric ratio for BNY, which is 0.54, to obtain
total fuel input and from this the electric heat input was subtracted to obtain steam heat
input.
19
6. District Energy System End to End Efficiency
The Company examined the end to end efficiency of the following district energy
distribution systems:
1. Chilled Water
2. Hot Water
3. Combination Chilled and Hot Water
4. Combination Chilled and Hot Water with Electric Cogeneration
The information utilized in the end to end study was taken directly from the District
Energy Feasibility Study for the Manhattan West Side (Hudson Yards Area), dated June
5, 2007. This study was prepared for the Company by Constellation Energy Projects &
Services Group, Inc. (“Constellation”). The Constellation study provided plant load
profiles, equivalent full load hours for each plant, and a map of the area with proposed
district energy distribution piping, a pipe sizing chart, and single line diagrams for each
of the proposed systems.
Approach
Chilled Water System
Based on the building load data analysis conducted by Constellation, the diversified peak
cooling load for the area was calculated to be 45,909 tons. A cooling load profile for the
area was reviewed and the equivalent full load cooling hours were determined to be
1,026. As stated in the report, to keep capital costs and pipe sizing reasonable, the
conceptual design specified two separate chilled water production facilities. When
combined, these two facilities would consist of the following equipment:
Thirteen water cooled dual compressor variable speed electric driven centrifugal
chillers with a peak capacity of 3,850 tons; each would operate using a 14oF
temperature difference. Twelve chillers would be required to operate at full load
and one chiller would be a standby unit providing N+1 redundancy.
Thirteen variable speed chilled water pumps with a maximum flow rate of 5,775
gallons per minute. Twelve pumps would be required to operate at full load and
one pump would be for standby providing N+1 redundancy.
Thirteen induced draft cooling towers with variable speed fans. Each tower
would be rated for 3,850 tons of heat rejection and would operate using a 15oF
temperature difference. Twelve towers would be required to operate at full load
and one tower would be for standby providing N+1 redundancy.
Thirteen constant speed condenser water pumps with a maximum flow rate of
6,160 gallons per minute. Twelve pumps would be required to operate at full load
and one pump would be for standby providing N+1 redundancy.
The district chilled water system end to end efficiency analysis utilized the data listed and
made the following assumptions in order to determine overall system efficiency:
20
1. Chilled/Condenser water pump operating horsepower – the pump operating
horsepower was calculated based on the distance of the furthest piping loop,
pressure loss through the equipment, and pressure losses from valves and fittings
in the system. Since these values are not known, certain assumptions were made
based on standard industry best practices and similar equipment cut sheets. The
district energy study provided site map was used to determine the maximum
piping loop distance.
2. Motor efficiency – it was assumed that high quality 90% efficient motors were
utilized.
3. Auxiliary pumps – various assumptions were made to include the energy
associated with operating the chemical feed and water filtration pumps. The
pump size and operation hours were estimated based on standard industry best
practices.
4. Free cooling (winterization of cooling towers) – the district energy study did not
include a free cooling option in the system design therefore a free cooling credit
was not included in this analysis.
5. Thermal Losses – it was assumed that the thermal loss of the distribution system
would be 10%, which includes thermal conduction losses as well as pipe and
valve failures.
6. Chiller efficiency and cooling tower fan size – these values were determined by
reviewing actual equipment cut sheets of similar equipment.
Based on the assumptions and data indicated above, the overall end to end efficiency of
the proposed district chilled water system was calculated to be 72%. Detailed
calculations and an associated energy diagram can be found in the Appendix section of
this report on pages A19 and A35.
Hot Water System
Based on the building load data analysis, conducted by Constellation, the diversified peak
heating load for the area was calculated to be 707 MMBtu/hr. A heating load profile for
the area was reviewed and the equivalent full load cooling hours were determined to be
1,982. Unlike the district chilled water system, the hot water system will be limited to a
single facility. This facility would consist of the following equipment:
Six high efficiency natural gas fired hot water boilers. Each boiler would be rated
for 150 MMBtu/hr of hot water production. Five boilers would be required to
operate at full load and one would be a standby providing N+1 redundancy.
Six variable speed hot water pumps with a maximum flow rate of 3,000 gallons
per minute. Five pumps would be required to operate at full load and one would
be a standby providing N+1 redundancy.
The district hot water system end to end efficiency analysis utilized the data listed above
and made the following assumptions in order to determine overall system efficiency:

21
1. Hot water pump operating horsepower – the pump operating horsepower was
calculated based on the distance of the furthest piping loop, pressure loss through
the equipment, and pressure losses from valves and fittings in the system. Since
these values are not known, certain assumptions were made based on standard
industry best practices and similar equipment cut sheets. The district energy
study provided site map was used to determine the maximum piping loop
distance.
2. Motor efficiency – it was assumed that high quality 90% efficient motors were
utilized.
3. Auxiliary pumps – various assumptions were made to include the energy
associated with operating the chemical feed pumps. The pump size and operation
hours were estimated based on standard industry best practices.
4. Thermal Losses – it was assumed that the thermal loss of the distribution system
would be 10%, which includes thermal conduction losses as well as pipe and
valve failures.
5. Electric Losses were assumed to be small, 1%.
6. Quantity of blow down and system make-up water – a value for boiler water
blowdown was assumed based on Con Edison boiler plant operation experience.
The energy associated with heating the make-up water was included in the
calculation.
7. Free heating (exhaust gas heat recovery) – the district energy study report did not
include a heat recovery option in the system design; therefore no heat recovery
credit was included in this analysis.
Based on the assumptions and data indicated above, the overall end to end efficiency of
the proposed district hot water system was calculated to be 68%. Detailed calculations
and an associated energy diagram can be found in the Appendix section of this report on
pages A20 and A36.
Combined Chilled and Hot Water System
To calculate the overall end to end efficiency of a combined chilled and hot water system,
the Company combined the two analyses listed above into a single conglomerate analysis
that would represent all of the energy delivered versus the energy consumed by the
system. Once all of the energy units were converted to similar terms (kilowatt hours -
kWh), the energy inputs for each section were combined and compared to the energy
delivered. The combined efficiency of the chilled and hot water district energy system
was calculated to be 70%. Detailed calculations and an associated energy diagram can be
found in the Appendix section of this report on pages A21 and A37.
Combined Chilled and Hot Water System with Cogeneration
In an alternate scenario, the Constellation report proposed that a natural gas fired turbine
cogeneration plant be added to the combined district chilled and hot water system. The
turbine would have an overall capacity of 7.5 MW with a thermal heat production large
enough to offset the capacity of a single boiler in the proposed boiler plant (150
22
MMBtu/hr). The operating hours of the cogeneration plant were assumed to be 3,120
hours per year (260 days at 12 hours per day). Based on these operating hours, the plant
would supply a total of 22,464,000 kWh of electricity to the grid for customer purchase.
Since the Constellation report does not describe a means to recover the heat input for
cooling use, it is assumed that the heat from the cogeneration plant is used for the hot
water system only. Any excess heat captured is released into the atmosphere if it is not
used by the hot water system.
When the district chilled and hot water plants are coupled with a small cogeneration
plant, the resulting end to end system efficiency was calculated to be 74%. Detailed
calculations and an associated energy diagram can be found in the Appendix section of
this report on pages A22 and A38.
Results
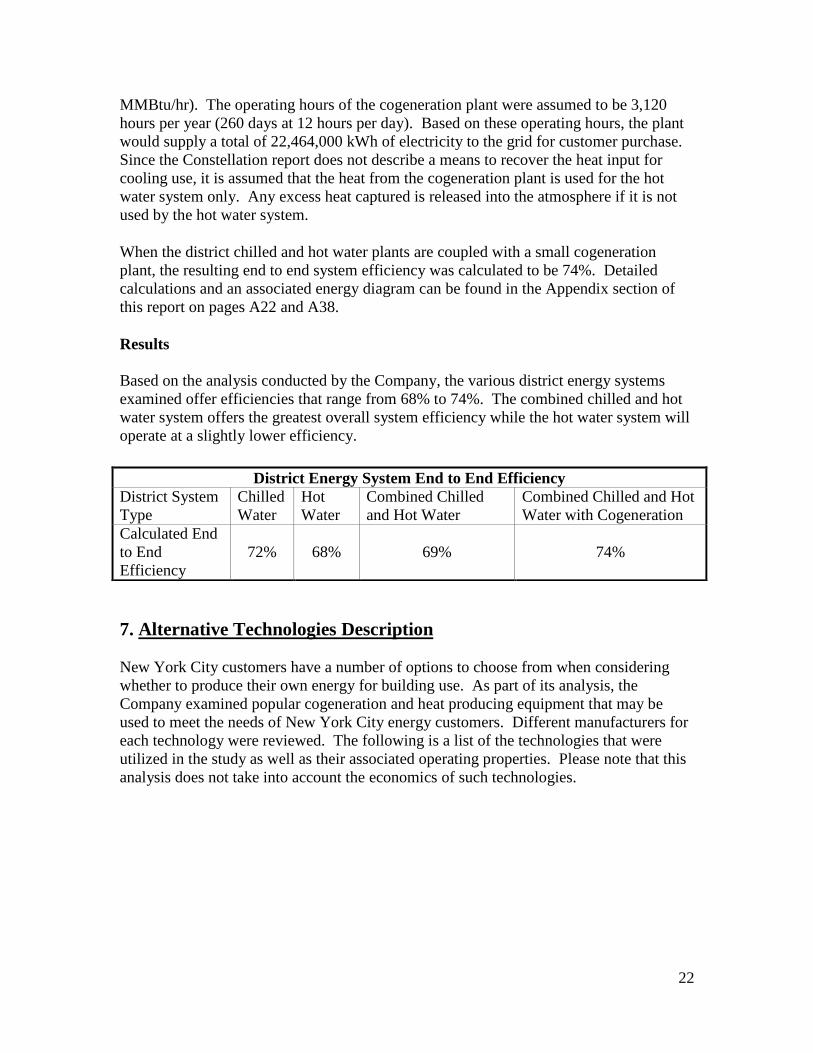
Based on the analysis conducted by the Company, the various district energy systems
examined offer efficiencies that range from 68% to 74%. The combined chilled and hot
water system offers the greatest overall system efficiency while the hot water system will
operate at a slightly lower efficiency.
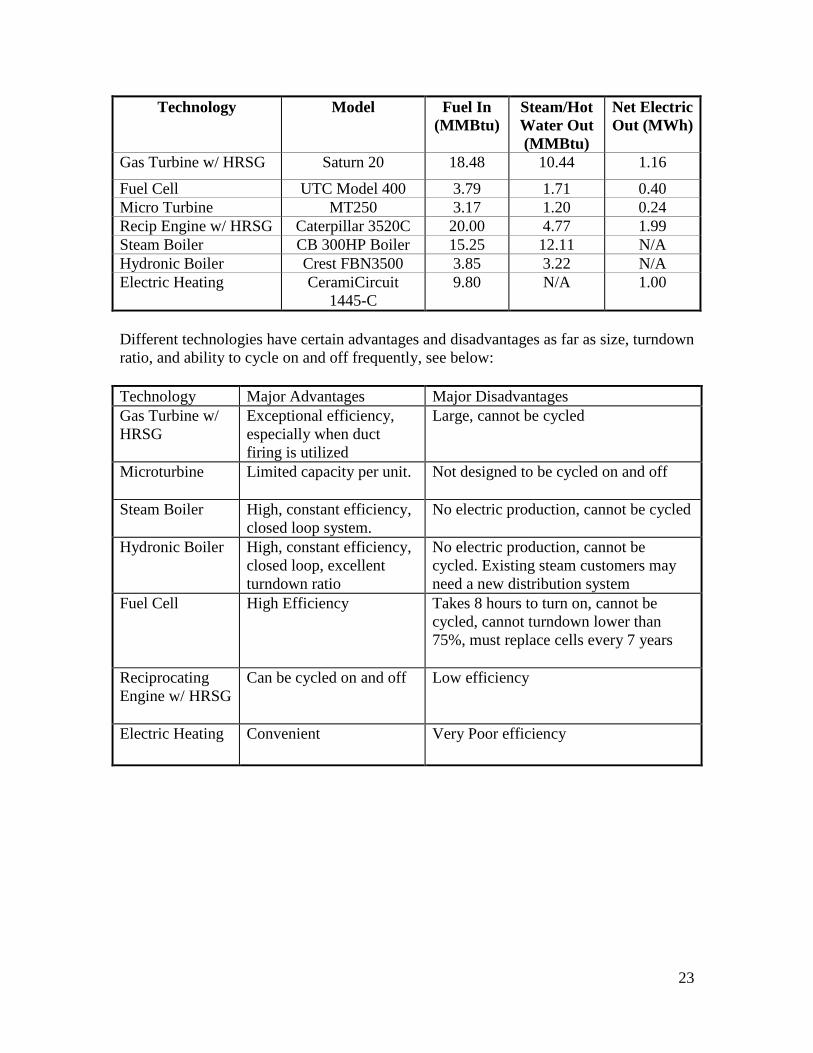
7. Alternative Technologies Description
New York City customers have a number of options to choose from when considering
whether to produce their own energy for building use. As part of its analysis, the
Company examined popular cogeneration and heat producing equipment that may be
used to meet the needs of New York City energy customers. Different manufacturers for
each technology were reviewed. The following is a list of the technologies that were
utilized in the study as well as their associated operating properties. Please note that this
analysis does not take into account the economics of such technologies.
District Energy System End to End Efficiency
District System
Type
Chilled
Water
Hot
Water
Combined Chilled
and Hot Water
Combined Chilled and Hot
Water with Cogeneration
Calculated End
to End
Efficiency
72% 68% 69% 74%
23
Technology
Model Fuel In
(MMBtu)
Steam/Hot
Water Out
(MMBtu)
Net Electric
Out (MWh)
Gas Turbine w/ HRSG Saturn 20 18.48 10.44 1.16
Fuel Cell UTC Model 400 3.79 1.71 0.40
Micro Turbine MT250 3.17 1.20 0.24
Recip Engine w/ HRSG Caterpillar 3520C 20.00 4.77 1.99
Steam Boiler CB 300HP Boiler 15.25 12.11 N/A
Hydronic Boiler Crest FBN3500 3.85 3.22 N/A
Electric Heating CeramiCircuit
1445-C
9.80 N/A 1.00
Different technologies have certain advantages and disadvantages as far as size, turndown
ratio, and ability to cycle on and off frequently, see below:
Technology Major Advantages Major Disadvantages
Gas Turbine w/
HRSG
Exceptional efficiency,
especially when duct
firing is utilized
Large, cannot be cycled
Microturbine
Limited capacity per unit. Not designed to be cycled on and off
Steam Boiler
High, constant efficiency,
closed loop system.
No electric production, cannot be cycled
Hydronic Boiler
High, constant efficiency,
closed loop, excellent
turndown ratio
No electric production, cannot be
cycled. Existing steam customers may
need a new distribution system
Fuel Cell
High Efficiency Takes 8 hours to turn on, cannot be
cycled, cannot turndown lower than
75%, must replace cells every 7 years
Reciprocating
Engine w/ HRSG
Can be cycled on and off
Low efficiency
Electric Heating
Convenient Very Poor efficiency
24
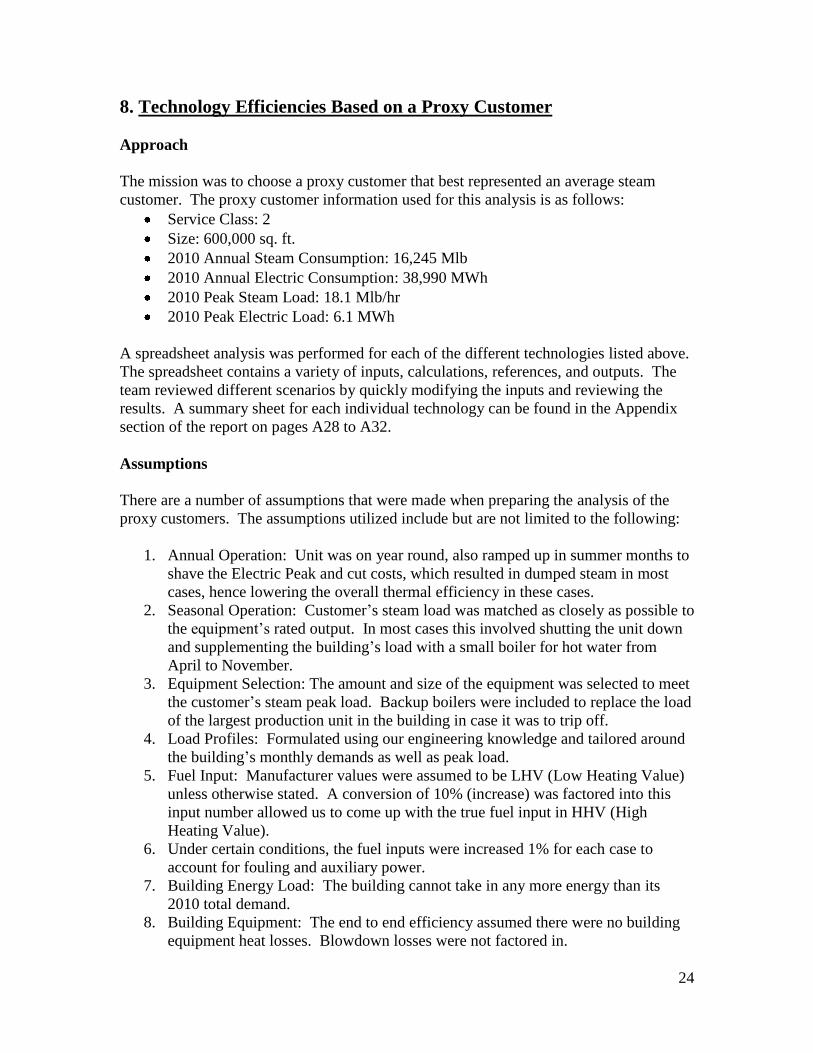
8. Technology Efficiencies Based on a Proxy Customer
Approach
The mission was to choose a proxy customer that best represented an average steam
customer. The proxy customer information used for this analysis is as follows:
Service Class: 2
Size: 600,000 sq. ft.
2010 Annual Steam Consumption: 16,245 Mlb
2010 Annual Electric Consumption: 38,990 MWh
2010 Peak Steam Load: 18.1 Mlb/hr
2010 Peak Electric Load: 6.1 MWh
A spreadsheet analysis was performed for each of the different technologies listed above.
The spreadsheet contains a variety of inputs, calculations, references, and outputs. The
team reviewed different scenarios by quickly modifying the inputs and reviewing the
results. A summary sheet for each individual technology can be found in the Appendix
section of the report on pages A28 to A32.
Assumptions
There are a number of assumptions that were made when preparing the analysis of the
proxy customers. The assumptions utilized include but are not limited to the following:
1. Annual Operation: Unit was on year round, also ramped up in summer months to
shave the Electric Peak and cut costs, which resulted in dumped steam in most
cases, hence lowering the overall thermal efficiency in these cases.
2. Seasonal Operation: Customer’s steam load was matched as closely as possible to
the equipment’s rated output. In most cases this involved shutting the unit down
and supplementing the building’s load with a small boiler for hot water from
April to November.
3. Equipment Selection: The amount and size of the equipment was selected to meet
the customer’s steam peak load. Backup boilers were included to replace the load
of the largest production unit in the building in case it was to trip off.
4. Load Profiles: Formulated using our engineering knowledge and tailored around
the building’s monthly demands as well as peak load.
5. Fuel Input: Manufacturer values were assumed to be LHV (Low Heating Value)
unless otherwise stated. A conversion of 10% (increase) was factored into this
input number allowed us to come up with the true fuel input in HHV (High
Heating Value).
6. Under certain conditions, the fuel inputs were increased 1% for each case to
account for fouling and auxiliary power.
7. Building Energy Load: The building cannot take in any more energy than its
2010 total demand.
8. Building Equipment: The end to end efficiency assumed there were no building
equipment heat losses. Blowdown losses were not factored in.
25
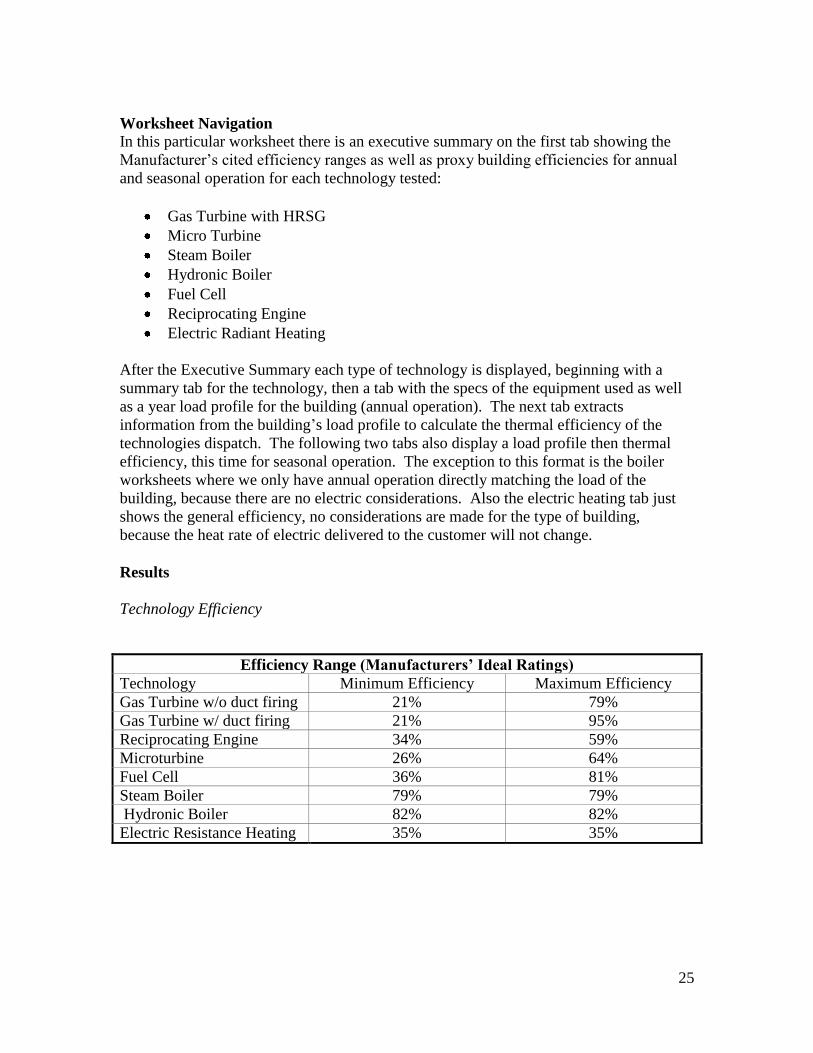
Worksheet Navigation
In this particular worksheet there is an executive summary on the first tab showing the
Manufacturer’s cited efficiency ranges as well as proxy building efficiencies for annual
and seasonal operation for each technology tested:
Gas Turbine with HRSG
Micro Turbine
Steam Boiler
Hydronic Boiler
Fuel Cell
Reciprocating Engine
Electric Radiant Heating
After the Executive Summary each type of technology is displayed, beginning with a
summary tab for the technology, then a tab with the specs of the equipment used as well
as a year load profile for the building (annual operation). The next tab extracts
information from the building’s load profile to calculate the thermal efficiency of the
technologies dispatch. The following two tabs also display a load profile then thermal
efficiency, this time for seasonal operation. The exception to this format is the boiler
worksheets where we only have annual operation directly matching the load of the
building, because there are no electric considerations. Also the electric heating tab just
shows the general efficiency, no considerations are made for the type of building,
because the heat rate of electric delivered to the customer will not change.
Results
Technology Efficiency
Efficiency Range (Manufacturers’ Ideal Ratings)
Technology Minimum Efficiency Maximum Efficiency
Gas Turbine w/o duct firing 21% 79%
Gas Turbine w/ duct firing 21% 95%
Reciprocating Engine 34% 59%
Microturbine 26% 64%
Fuel Cell 36% 81%
Steam Boiler 79% 79%
Hydronic Boiler 82% 82%
Electric Resistance Heating 35% 35%
26
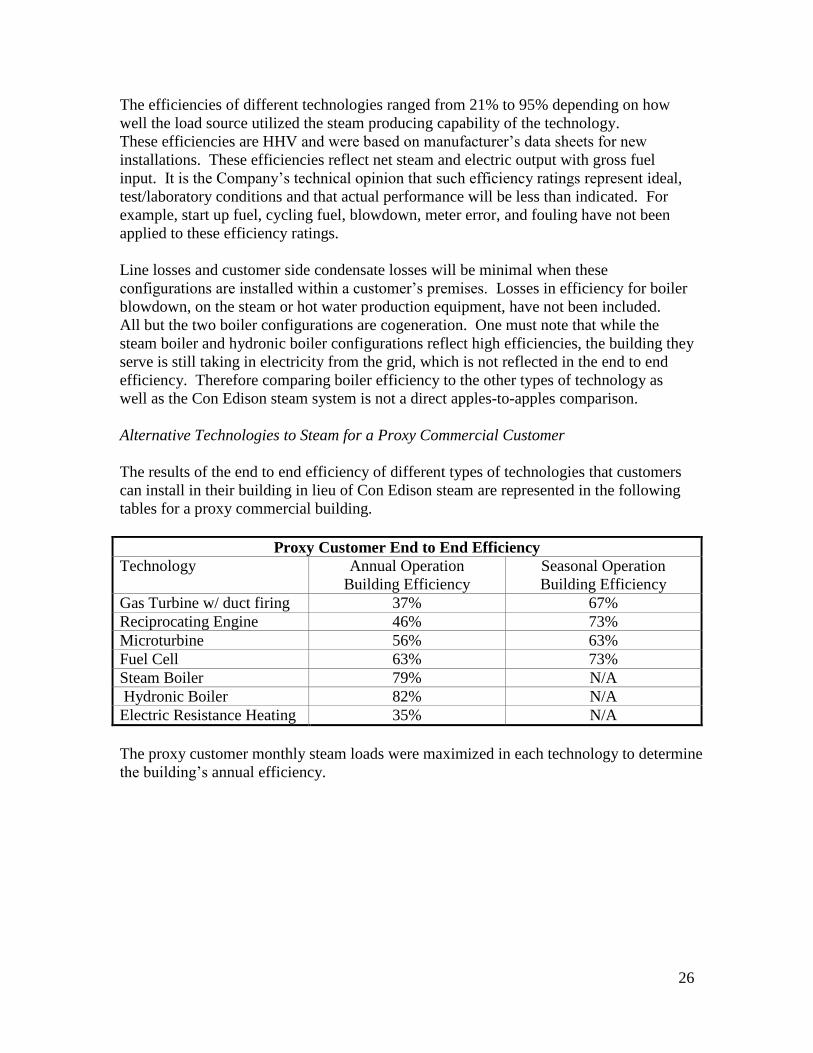
The efficiencies of different technologies ranged from 21% to 95% depending on how
well the load source utilized the steam producing capability of the technology.
These efficiencies are HHV and were based on manufacturer’s data sheets for new
installations. These efficiencies reflect net steam and electric output with gross fuel
input. It is the Company’s technical opinion that such efficiency ratings represent ideal,
test/laboratory conditions and that actual performance will be less than indicated. For
example, start up fuel, cycling fuel, blowdown, meter error, and fouling have not been
applied to these efficiency ratings.
Line losses and customer side condensate losses will be minimal when these
configurations are installed within a customer’s premises. Losses in efficiency for boiler
blowdown, on the steam or hot water production equipment, have not been included.
All but the two boiler configurations are cogeneration. One must note that while the
steam boiler and hydronic boiler configurations reflect high efficiencies, the building they
serve is still taking in electricity from the grid, which is not reflected in the end to end
efficiency. Therefore comparing boiler efficiency to the other types of technology as
well as the Con Edison steam system is not a direct apples-to-apples comparison.
Alternative Technologies to Steam for a Proxy Commercial Customer
The results of the end to end efficiency of different types of technologies that customers
can install in their building in lieu of Con Edison steam are represented in the following
tables for a proxy commercial building.
Proxy Customer End to End Efficiency
Technology Annual Operation
Building Efficiency
Seasonal Operation
Building Efficiency
Gas Turbine w/ duct firing 37% 67%
Reciprocating Engine 46% 73%
Microturbine 56% 63%
Fuel Cell 63% 73%
Steam Boiler 79% N/A
Hydronic Boiler 82% N/A
Electric Resistance Heating 35% N/A
The proxy customer monthly steam loads were maximized in each technology to determine
the building’s annual efficiency.
27
10. Conclusions
2010 Steam System Efficiency
The Con Edison steam system efficiency varies from 57% in summer to 62% in winter
with an average annual efficiency of 60%. The efficiency leaving the central generating
stations, including the steam and electric generated by BNY, varies from 71% in summer
to 75% in winter with an annual average of 73%. The energy losses with respect to the
entire system are 27% in generation, 11.5% for steam variance and customer condensate
loss, and 1.5% electric distribution losses.
2015 Steam System Efficiency
The estimated Con Edison 2015 steam system efficiency varies from 57% in summer to
63% in winter with an average annual efficiency of 60%. PROMOD was run for 2015
annual and seasonal periods. The fuel megawatts and steam flow determined. The BNY
fuel input is not determined by PROMOD and was obtained by calculating the electric
actual heat rate from year 2010 and multiplying it by the respective period’s megawatts
for 2015 to determine the electric fuel input. This in turn was divided by the electric ratio
for the BNY, which is 0.54, to obtain total fuel input and from this the electric heat input
was subtracted to obtain steam heat input.
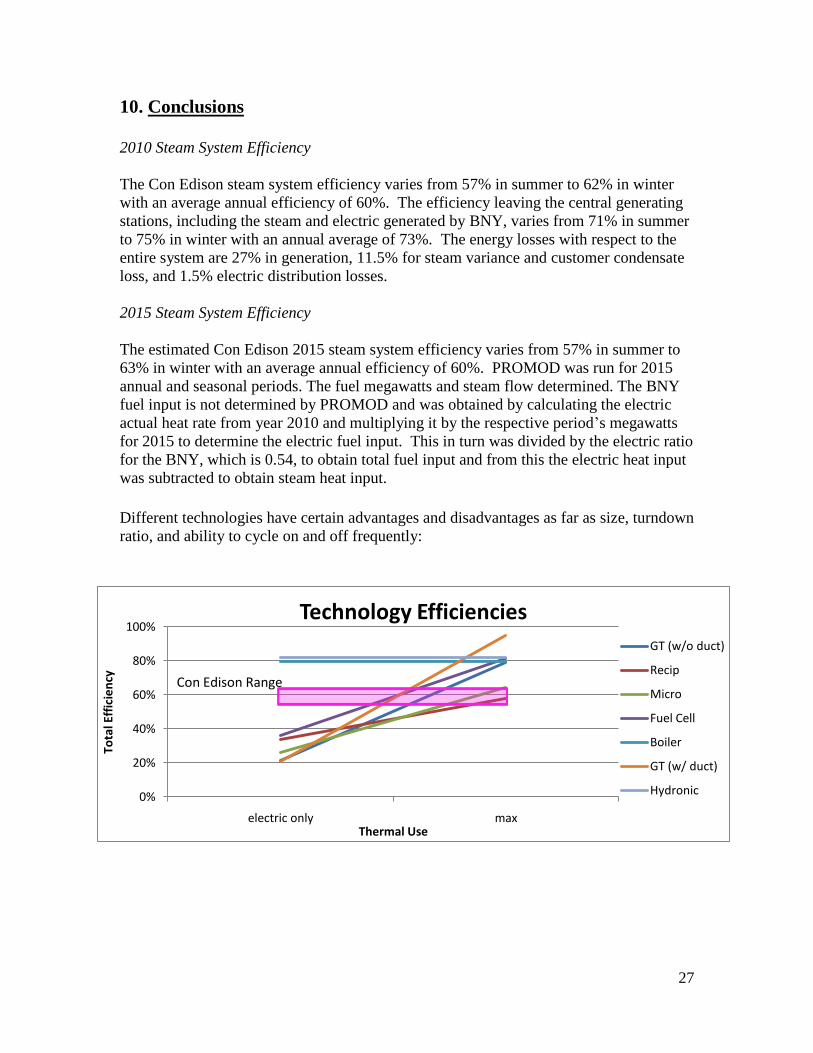
Different technologies have certain advantages and disadvantages as far as size, turndown
ratio, and ability to cycle on and off frequently:
0%
20%
40%
60%
80%
100%
electric only max
Tota
l Eff
icie
ncy
Thermal Use
Technology Efficiencies
GT (w/o duct)
Recip
Micro
Fuel Cell
Boiler
GT (w/ duct)
Hydronic
Con Edison Range

28
As the graph illustrates, if the thermal loads are not being fully utilized, the efficiencies
for all the technologies except the Con Edison steam system and boilers (which are really
not cogeneration technologies and not what most customers would opt for to replace Con
Edison as they want both heat and power) are poor as they are in the 20% to 40% range.
Boiler only options will still have to rely on the electric grid for light, power, and
possibly cooling, all fed with an electric efficiency of about 35%.
One cannot only consider energy efficiency when considering whether to utilize Con
Edison Steam or whether to go with customer-sited boilers or some form of CHP. For
example, the latter choice requires a significant capital investment for a new system and
annual expenses for fuel, maintenance, and incremental property taxes. Based on the
findings of Joint Proposal Study # 4, Assessment of the Costs and Benefits of Alternatives
to Steam Supply, various first and annual costs may prevent the customer from realizing
an acceptable payback period.
Proxy Customer
The proxy customer monthly steam loads were maximized in each technology to determine
its annual efficiency. We note that customers run their equipment for maximum electric
production rather than steam production as this study dictated. This would mean that the
proxy customer would experience lower efficiencies than indicated by the above-described
study and would not be a good fit for a new technology except boilers that are flexible to
their steam demands, which would result in the proxy customer continuing to purchase all
its electric at 35% efficiency. A separate analysis of the end to end efficiency for this
customer using these technologies and supplemented with purchasing electric to meet their
requirements, showed an end to end efficiency varying from 35% to 39%.
These efficiencies are HHV and were based on manufacturer’s data sheets for new
installations. As indicated above, we believe that actual performance will be less than
indicated in the foregoing graph, which reflects ideal laboratory conditions. Accordingly,
start up fuel, cycling fuel, aging, fouling, and auxiliary power consumption have been
applied to these efficiency ratings. Line losses and customer side condensate losses will
be minimal when these configurations are installed within a customer’s premises. As
such, no loss in efficiency has been applied.
The proxy commercial building is an existing Con Edison steam heat and hot water
customer located in Manhattan that has a winter steam peak demand of 18 Mlb/hr and
summer electric peak demand of 6 MW. For the cogeneration configurations, the end to
end efficiencies are low when looked at on an annual basis (Annual Operation Building
Efficiency). This is because the production equipment is sized to meet the winter steam
peak and when there is a very low thermal load in the building during the summer, and
the equipment is required for electric production, there is no place to put the steam
produced. As such this excess steam is vented to the atmosphere and is a loss. For the
Seasonal Operation Building Efficiency, the Company assumed that there was a
supplemental boiler in addition to the cogeneration equipment. The cogeneration
equipment was operated in the winter and not during the summer. It was assumed that in

29
the summer, the building would take electricity from the grid and run the boiler for its
thermal load. Doing this did increase the efficiency but did increase the capital
investment and electric purchases for the building. This clearly indicates that there exists
a balance between energy efficiency and cost efficiency. The two boiler configurations
reflect higher efficiencies than those of the cogeneration configurations. However, under
the boiler cases the building they serve is still taking in electricity from the grid, which is
not reflected in the end to end efficiency. Therefore comparing boiler efficiency to the
other types of technology as well as the Con Edison steam system is not a direct
comparison.
This study revealed how important it is to match the customer thermal and electric loading
to the technology in order to realize improved efficiency.
In general only large, steady high load usage customers, such as hospitals and databanks,
will be able to utilize the new technologies with any degree of suitable efficiency.
The new technologies in general generate much more thermal heat than electrical supply
causing customers to make large outside electrical purchases to meet their electrical
requirements that offset the efficiency gains because of the high heat rate of 9,192
Btu/kWh.
Con Edison’s efficiencies were 60% annually, ranging from 57% in the summer to 62% in
winter and compared favorably to all the technologies. Since Con Edison is a large
distributed generator, its equipment sees high thermal and electrical loads throughout the
year and so can operate at higher efficiencies than a single supplier trying to meet its
electrical and thermal needs. The months April through October for most customers in this
area of the United States do not have a large enough thermal load to be able to utilize the
cogeneration technologies efficiently.
The district energy systems examined operated between 68% and 74% with the
cogeneration plant being the most efficient. Since the energy content of steam is
significantly greater than that of water, at first glance it would appear that the efficiency of
these water based systems should be lower than the Con Edison steam system. However,
the district energy systems reviewed are closed systems where a portion of the energy
delivered is returned to the plant. This is not true for the Con Edison steam system.
Furthermore, even though the district system piping network would be larger than the Con
Edison steam system, the overall thermal losses would be less. This is due to the lower
temperature disparity between the fluid and the surrounding material as well as the
elimination of condensate removal losses. There is very limited potential for district
energy systems in Manhattan. This is due to physical constraints and interferences in the
street that will impact the many large diameter pipes required. The small campus like
district energy configuration only makes sense for an area not currently served with steam
and not as a replacement for existing steam service.

30
Appendix
Section