Embed Size (px)
Citation preview

Consolidated FinanCial statements
caisse centrale DesjarDins
62 2011 Annual Report | Audit Commission’s Annual Report
The role of the Audit Commission (the Commission) is to support the Board of Directors of Caisse centrale Desjardins (CCD) in its oversight responsibilities. Its mandate consists primarily of analyzing the financial statements, their presentation and the quality of the accounting principles adopted, risk management as it relates to financial reporting, internal control systems, internal and independent audit processes, the procedures applied to such audits, and the management of regulatory compliance.
To do so, the Commission reviews the quarterly and annual financial statements, related press releases, the annual Management’s Discussion and Analysis, the Annual Information Form and the prospectuses. In addition, it reviews various reports, including those on regulatory ratios, funding, and the quarterly valuation of the derivative portfolio.
The Commission ensures that management has designed and implemented an effective internal control system with respect to the organization’s business processes, financial reporting, asset protection, fraud detection, and regulatory compliance. It also ensures that management has implemented systems to manage the main risks that may influence the financial results of CCD. In this regard, the Commission reviews on a quarterly basis the information resulting from this financial governance process.
The independent auditor is under the authority of the Commission. To satisfy its responsibilities regarding the independent auditor, the Commission ensures and preserves the independent auditor’s independence by authorizing all non-audit-related services, by recommending auditor appointments and renewals, by setting and recommending auditor compensation, and by conducting annual auditor evaluations. In addition, the Commission supervises the work of the independent auditor and examines its audit proposal, its audit mandate, its annual audit strategy, its reports, its letter to management, and management’s comments. Desjardins Group has a policy that governs the awarding of contracts for related services, which addresses a) the services that can or cannot be performed by the independent auditor, b) the governance procedures that must be followed before mandates may be awarded, and c) the responsibilities of the key players involved. Accordingly, the Commission receives a quarterly report on the contracts awarded to the independent auditor by Caisse centrale Desjardins and Desjardins Group.
With respect to relations with the Autorité des marchés financiers, the Commission reviews and follows up on the inspection reports issued by the organization, as well as the financial reports that are submitted each quarter to the Autorité des marchés financiers.
The Commission ensures and preserves the independence of Desjardins Group’s internal audit service. It analyzes the internal audit team’s annual audit strategy with respect to CCD as well as its responsibilities, performance, objectivity and staffing. The Commission reviews the internal audit team’s summary reports and, if necessary, takes follow-up action. When doing so, the Commission meets with the head of Internal Audit of Desjardins Group to discuss any important matters submitted to management.
The Commission meets privately with the independent auditor, management, the Chief Financial Officer, the head of the Desjardins Group Monitoring Office and representatives from the Autorité des marchés financiers. Every quarter, it reports to the Board of Directors and, if necessary, makes recommendations.
Lastly, in accordance with sound corporate governance practices, the Commission annually reviews the degree of efficiency and effectiveness with which it has performed the tasks set out in its charter.
The Commission is made up of five independent directors. Desjardins Group does not remunerate any member, either directly or indirectly, for services other than those rendered as a member of the FCDQ’s Board of Directors or other Desjardins Group entities and their committees.
All the members of the Commission have the knowledge required to read and interpret the financial statements of a financial institution, based on the criteria established by the Commission’s charter. In that regard, in the context of the significant changes arising from the new accounting requirements related to financial accounting and disclosures, the members of the Commission attended several presentations and training sessions and a seminar during the year, in particular on the new International Financial Reporting Standards (IFRS) that have been effective since January 1, 2011 and on the impact of changes in normative and regulatory frameworks to which institutional governance is subject.
The Commission met on seven occasions and held two training sessions and one seminar during fiscal 2011. During the year, Mr Pierre Leblanc, FCA, left the Commission and Mr André Gagné, CGA became a member. As at December 31, the members of the Commission were Ms Andrée Lafortune, FCA, Ms Annie P. Bélanger, Mr Donat Boulerice, Mr André Gagné, CGA and Mr Pierre Levasseur.
AndRée LAfoRtune, fcaChair of the Audit Commission Montreal, Quebec
February 23, 2012
Audit Commission’s AnnuAl RepoRt
Management’s Responsibility for financial Reporting | 2011 Annual Report 63
The Consolidated Financial Statements of CCD and all information contained in this Annual Report are the responsibility of management, whose duty is to ensure reporting integrity and reliability.
The Consolidated Financial Statements were prepared in accordance with International Financial Reporting Standards and in accordance with the accounting requirements of the Autorité des marchés financiers as applicable. The Consolidated Financial Statements necessarily contain amounts established by management based on estimates which it deems fair and reasonable. All financial information in the Annual Report is consistent with the audited Consolidated Financial Statements.
As management is responsible for the reliability of CCD’s Consolidated Financial Statements and related information and the accounting systems from which they are derived, it maintains controls over transactions and related accounting practices. The controls in place notably include an organizational structure that ensures effective segregation of duties, a code of ethics, standards in personnel hiring and training, policies and procedure manuals, as well as the application of control methods that are regularly updated, thereby exercising adequate supervision of operations. The internal control systems are supplemented by regular independent reviews of CCD’s major business segments. In addition, in the course of his duties, the Internal Auditor of Desjardins Group may confer at any time with the Board of Directors’ Audit Commission (the Commission). Management also implemented a financial governance structure based on best market practices to ensure the effectiveness of the disclosure controls and procedures over the financial information presented in the annual and interim filings of CCD.
The Autorité des marchés financiers examines the affairs of CCD on a continuous basis to ensure that the provisions of its constituent legislation, particularly with respect to the protection of depositors, are duly observed and that CCD is in sound financial condition.
The Board of Directors approves the financial information contained in the Annual Report by relying on the recommendation of the Commission. To this effect, the Commission is mandated by the Board to review the Consolidated Financial Statements of CCD as well as the Management’s Discussion and Analysis. In addition, the Commission, comprised of directors who are neither officers nor employees of CCD, exercises an oversight role to ensure that management has developed and implemented adequate control procedures and systems to ensure quality financial reporting with all the required disclosures within the required timeframes.
The external auditors appointed at the general meeting of members, PricewaterhouseCoopers LLP, have the responsibility of auditing the Consolidated Financial Statements in accordance with Canadian generally accepted auditing standards and of expressing their opinion thereon. Their report follows. They may meet with the Commission at any time to discuss their audit and any questions related thereto, in particular the integrity of the financial information provided by CCD and the quality of internal control systems.
Monique f. LeRoux, fca, fcmaChair of the Board of Directors and Chief Executive Officer of Caisse centrale Desjardins
RAyMond LAuRin, fcaChief Financial Officer of Caisse centrale Desjardins andSenior Vice-President, Finance and Treasury and Chief Financial Officer, Desjardins Group
Montreal, QuebecFebruary 23, 2012
mAnAgement’s Responsibility foR finAnCiAl RepoRting
64 2011 Annual Report | independent Auditor’s Report
To The members of Caisse CenTrale DesjarDins
We have audited the accompanying consolidated financial statements of Caisse centrale Desjardins, which comprise the consolidated statements of financial position as at December 31, 2011 and 2010 and as at January 1, 2010, and the consolidated statements of income, comprehensive income, members’ equity for the years ended December 31, 2011 and 2010 and the consolidated statements of cash flows for the years ended December 31, 2011 and 2010, and the related notes including a summary of significant accounting policies and other explanatory information.
managemenT’s responsibiliTy for The ConsoliDaTeD finanCial sTaTemenTs
Management is responsible for the preparation and fair presentation of these consolidated financial statements in accordance with International Financial Reporting Standards (IFRS), and for such internal control as management determines is necessary to enable the preparation of consolidated financial statements that are free from material misstatement, whether due to fraud or error.
auDiTor’s responsibiliTy
Our responsibility is to express an opinion on these consolidated financial statements based on our audits. We conducted our audits in accordance with Canadian generally accepted auditing standards. Those standards require that we comply with ethical requirements and plan and perform the audit to obtain reasonable assurance about whether the consolidated financial statements are free from material misstatement.
An audit involves performing procedures to obtain audit evidence about the amounts and disclosures in the consolidated financial statements. The procedures selected depend on the auditor’s judgment, including the assessment of the risks of material misstatement of the consolidated financial statements, whether due to fraud or error. In making those risk assessments, the auditor considers internal control relevant to the entity’s preparation and fair presentation of the consolidated financial statements in order to design audit procedures that are appropriate in the circumstances, but not for the purpose of expressing an opinion on the effectiveness of the entity’s internal control. An audit also includes evaluating the appropriateness of accounting policies used and the reasonableness of accounting estimates made by management, as well as evaluating the overall presentation of the consolidated financial statements.
We believe that the audit evidence we have obtained in our audits is sufficient and appropriate to provide a basis for our audit opinion.
opinion
In our opinion, the consolidated financial statements present fairly, in all material respects, the financial position of Caisse centrale Desjardins as at December 31, 2011 and 2010 and as at January 1, 2010, and its financial performance and its cash flows for the years ended December 31, 2011 and 2010 in accordance with International Financial Reporting Standards (IFRS).
PRiCewAteRhouseCooPeRs LLP (1)
Montreal, QuebecFebruary 23, 2012
independent AuditoR’s RepoRt
(1) Chartered accountant auditor permit no. 14376
Consolidated financial statements |2011 Annual Report 65
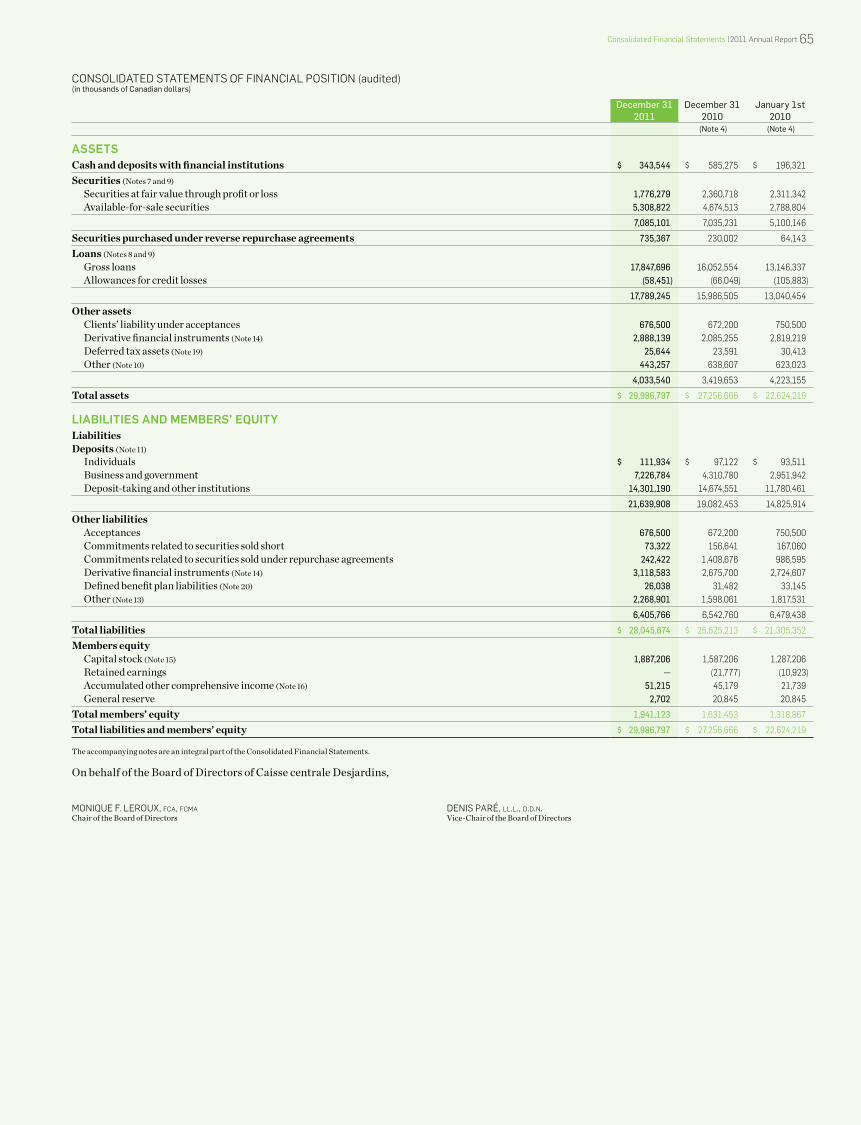
ConsoLidAted stAteMents of finAnCiAL Position (audited) (in thousands of Canadian dollars)
December 31 2011
December 31 2010
January 1st 2010
(Note 4) (Note 4)
ASSETSCash and deposits with financial institutions $ 343,544 $ 585,275 $ 196,321
Securities (Notes 7 and 9)Securities at fair value through profit or loss 1,776,279 2,360,718 2,311,342Available-for-sale securities 5,308,822 4,674,513 2,788,804
7,085,101 7,035,231 5,100,146
Securities purchased under reverse repurchase agreements 735,367 230,002 64,143
Loans (Notes 8 and 9)Gross loans 17,847,696 16,052,554 13,146,337Allowances for credit losses (58,451) (66,049) (105,883)
17,789,245 15,986,505 13,040,454
Other assets Clients’ liability under acceptances 676,500 672,200 750,500Derivative financial instruments (Note 14) 2,888,139 2,085,255 2,819,219Deferred tax assets (Note 19) 25,644 23,591 30,413Other (Note 10) 443,257 638,607 623,023
4,033,540 3,419,653 4,223,155
Total assets $ 29,986,797 $ 27,256,666 $ 22,624,219
LIABILITIES AND MEMBERS’ EQUITYLiabilitiesDeposits (Note 11)
Individuals $ 111,934 $ 97,122 $ 93,511Business and government 7,226,784 4,310,780 2,951,942Deposit-taking and other institutions 14,301,190 14,674,551 11,780,461
21,639,908 19,082,453 14,825,914
Other liabilitiesAcceptances 676,500 672,200 750,500Commitments related to securities sold short 73,322 156,641 167,060Commitments related to securities sold under repurchase agreements 242,422 1,408,676 986,595Derivative financial instruments (Note 14) 3,118,583 2,675,700 2,724,607Defined benefit plan liabilities (Note 20) 26,038 31,482 33,145Other (Note 13) 2,268,901 1,598,061 1,817,531
6,405,766 6,542,760 6,479,438
Total liabilities $ 28,045,674 $ 25,625,213 $ 21,305,352
Members equityCapital stock (Note 15) 1,887,206 1,587,206 1,287,206Retained earnings — (21,777) (10,923)Accumulated other comprehensive income (Note 16) 51,215 45,179 21,739General reserve 2,702 20,845 20,845
Total members’ equity 1,941,123 1,631,453 1,318,867
Total liabilities and members’ equity $ 29,986,797 $ 27,256,666 $ 22,624,219
The accompanying notes are an integral part of the Consolidated Financial Statements.
On behalf of the Board of Directors of Caisse centrale Desjardins,
Monique f. LeRoux, fca, fcma denis PARé, ll.l., d.d.n.Chair of the Board of Directors Vice-Chair of the Board of Directors
66 2011 Annual Report | Consolidated financial statements
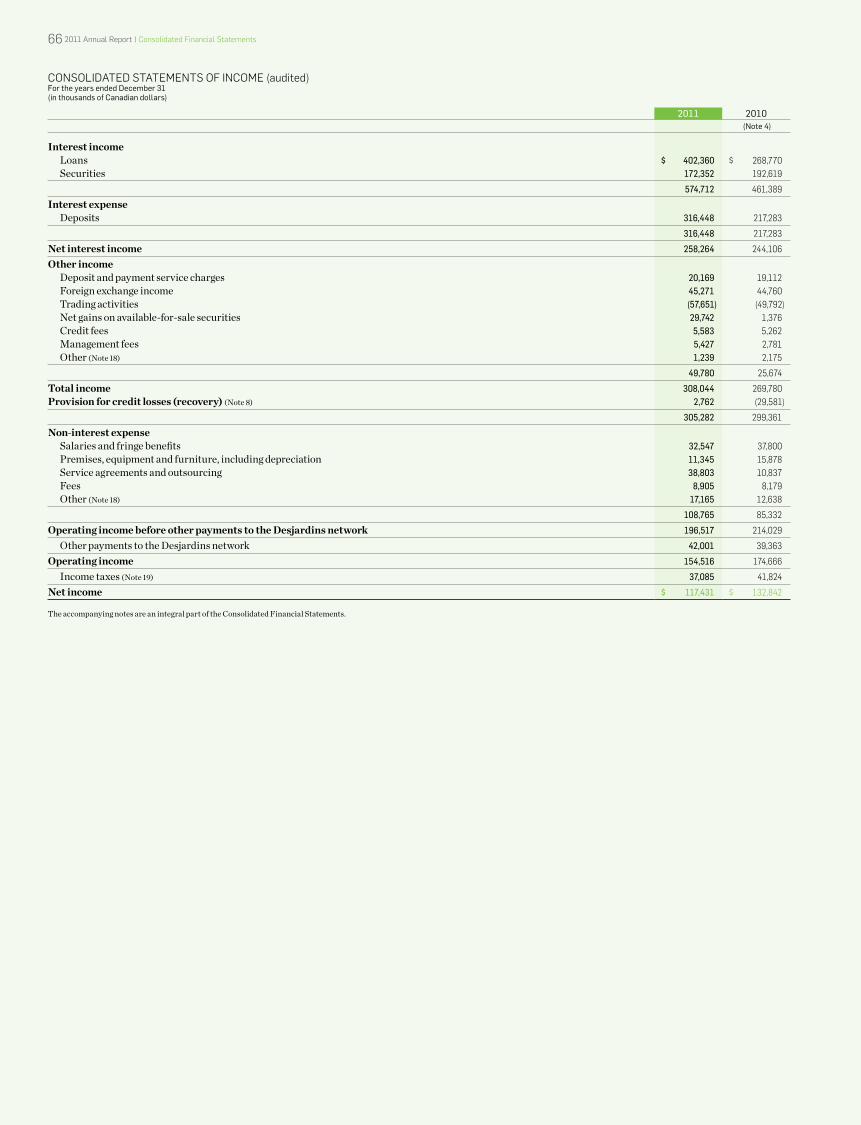
ConsoLidAted stAteMents of inCoMe (audited) For the years ended December 31 (in thousands of Canadian dollars)
2011 2010 (Note 4)
Interest income Loans $ 402,360 $ 268,770Securities 172,352 192,619
574,712 461,389
Interest expense Deposits 316,448 217,283
316,448 217,283
Net interest income 258,264 244,106
Other incomeDeposit and payment service charges 20,169 19,112Foreign exchange income 45,271 44,760Trading activities (57,651) (49,792)Net gains on available-for-sale securities 29,742 1,376Credit fees 5,583 5,262Management fees 5,427 2,781Other (Note 18) 1,239 2,175
49,780 25,674
Total income 308,044 269,780Provision for credit losses (recovery) (Note 8) 2,762 (29,581)
305,282 299,361
Non-interest expense Salaries and fringe benefits 32,547 37,800Premises, equipment and furniture, including depreciation 11,345 15,878Service agreements and outsourcing 38,803 10,837Fees 8,905 8,179Other (Note 18) 17,165 12,638
108,765 85,332
Operating income before other payments to the Desjardins network 196,517 214,029
Other payments to the Desjardins network 42,001 39,363
Operating income 154,516 174,666
Income taxes (Note 19) 37,085 41,824
Net income $ 117,431 $ 132,842
The accompanying notes are an integral part of the Consolidated Financial Statements.
Consolidated financial statements | 2011 Annual Report 67
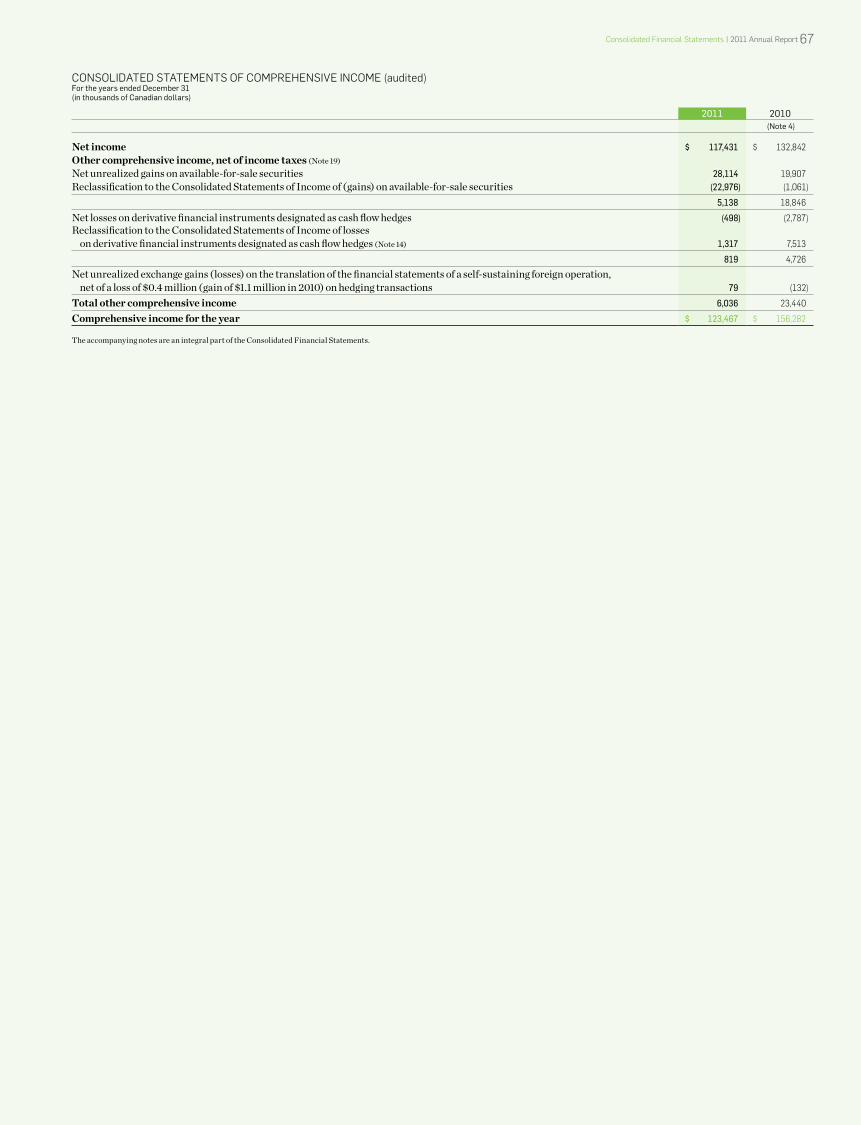
ConsoLidAted stAteMents of CoMPRehensiVe inCoMe (audited) For the years ended December 31 (in thousands of Canadian dollars)
2011 2010 (Note 4)
Net income $ 117,431 $ 132,842Other comprehensive income, net of income taxes (Note 19) Net unrealized gains on available-for-sale securities 28,114 19,907Reclassification to the Consolidated Statements of Income of (gains) on available-for-sale securities (22,976) (1,061)
5,138 18,846
Net losses on derivative financial instruments designated as cash flow hedges (498) (2,787)Reclassification to the Consolidated Statements of Income of losses
on derivative financial instruments designated as cash flow hedges (Note 14) 1,317 7,513
819 4,726
Net unrealized exchange gains (losses) on the translation of the financial statements of a self-sustaining foreign operation, net of a loss of $0.4 million (gain of $1.1 million in 2010) on hedging transactions 79 (132)
Total other comprehensive income 6,036 23,440
Comprehensive income for the year $ 123,467 $ 156,282
The accompanying notes are an integral part of the Consolidated Financial Statements.
68 2011 Annual Report | Consolidated financial statements
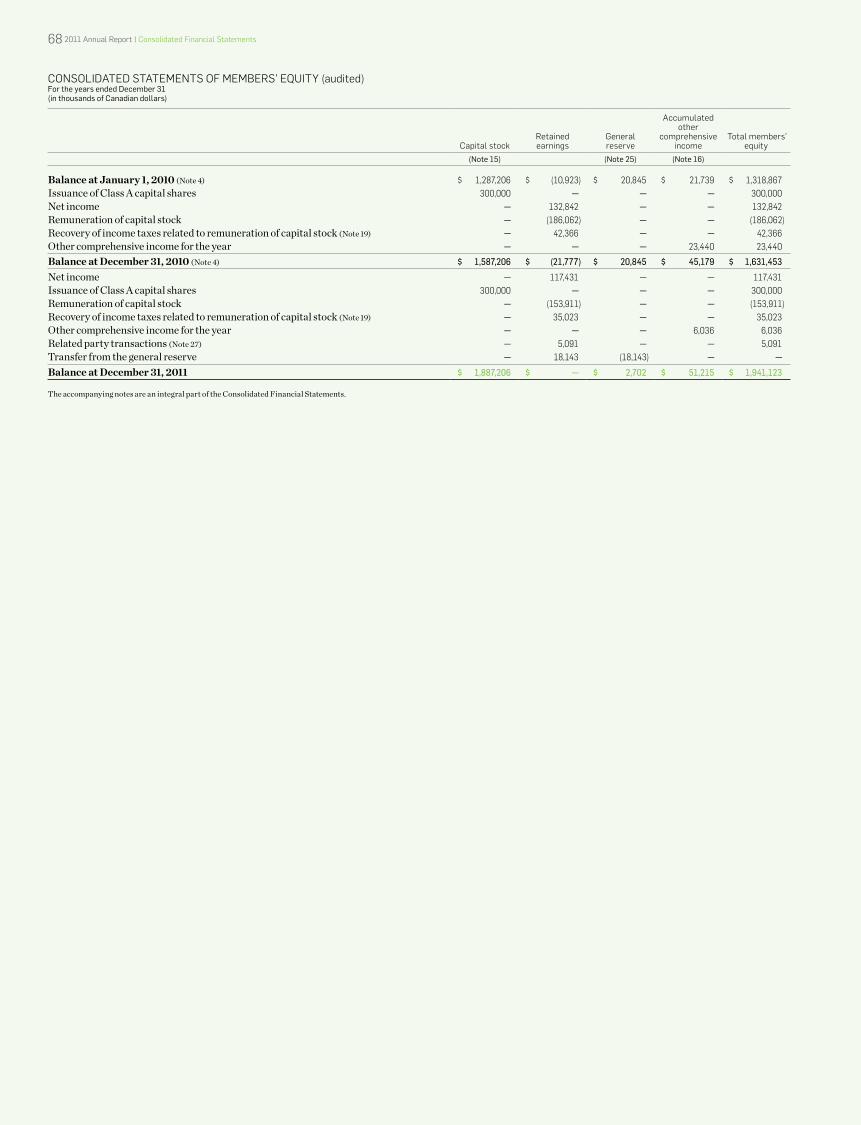
ConsoLidAted stAteMents of MeMBeRs’ equity (audited) For the years ended December 31 (in thousands of Canadian dollars)
Capital stockRetained earnings
General reserve
Accumulated other
comprehensive income
total members’equity
(Note 15) (Note 25) (Note 16)
Balance at January 1, 2010 (Note 4) $ 1,287,206 $ (10,923) $ 20,845 $ 21,739 $ 1,318,867Issuance of Class A capital shares 300,000 — — — 300,000Net income — 132,842 — — 132,842Remuneration of capital stock — (186,062) — — (186,062)Recovery of income taxes related to remuneration of capital stock (Note 19) — 42,366 — — 42,366Other comprehensive income for the year — — — 23,440 23,440
Balance at December 31, 2010 (Note 4) $ 1,587,206 $ (21,777) $ 20,845 $ 45,179 $ 1,631,453
Net income — 117,431 — — 117,431Issuance of Class A capital shares 300,000 — — — 300,000Remuneration of capital stock — (153,911) — — (153,911)Recovery of income taxes related to remuneration of capital stock (Note 19) — 35,023 — — 35,023Other comprehensive income for the year — — — 6,036 6,036Related party transactions (Note 27) — 5,091 — — 5,091Transfer from the general reserve — 18,143 (18,143) — —
Balance at December 31, 2011 $ 1,887,206 $ — $ 2,702 $ 51,215 $ 1,941,123
The accompanying notes are an integral part of the Consolidated Financial Statements.
Consolidated financial statements | 2011 Annual Report 69
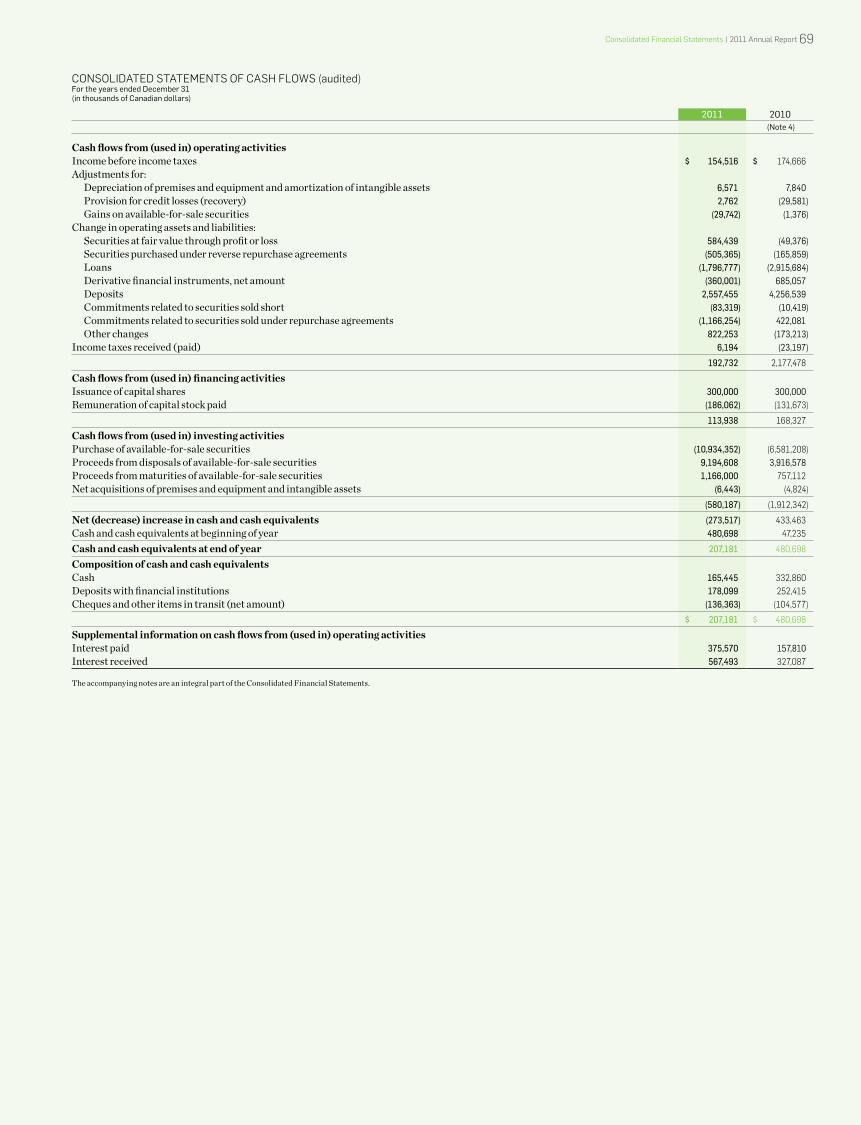
ConsoLidAted stAteMents of CAsh fLows (audited) For the years ended December 31 (in thousands of Canadian dollars)
2011 2010 (Note 4)
Cash flows from (used in) operating activitiesIncome before income taxes $ 154,516 $ 174,666Adjustments for:
Depreciation of premises and equipment and amortization of intangible assets 6,571 7,840Provision for credit losses (recovery) 2,762 (29,581)Gains on available-for-sale securities (29,742) (1,376)
Change in operating assets and liabilities:Securities at fair value through profit or loss 584,439 (49,376)Securities purchased under reverse repurchase agreements (505,365) (165,859)Loans (1,796,777) (2,915,684)Derivative financial instruments, net amount (360,001) 685,057Deposits 2,557,455 4,256,539Commitments related to securities sold short (83,319) (10,419)Commitments related to securities sold under repurchase agreements (1,166,254) 422,081Other changes 822,253 (173,213)
Income taxes received (paid) 6,194 (23,197)
192,732 2,177,478
Cash flows from (used in) financing activitiesIssuance of capital shares 300,000 300,000Remuneration of capital stock paid (186,062) (131,673)
113,938 168,327
Cash flows from (used in) investing activitiesPurchase of available-for-sale securities (10,934,352) (6,581,208)Proceeds from disposals of available-for-sale securities 9,194,608 3,916,578Proceeds from maturities of available-for-sale securities 1,166,000 757,112Net acquisitions of premises and equipment and intangible assets (6,443) (4,824)
(580,187) (1,912,342)
Net (decrease) increase in cash and cash equivalents (273,517) 433,463Cash and cash equivalents at beginning of year 480,698 47,235
Cash and cash equivalents at end of year 207,181 480,698
Composition of cash and cash equivalentsCash 165,445 332,860Deposits with financial institutions 178,099 252,415Cheques and other items in transit (net amount) (136,363) (104,577)
$ 207,181 $ 480,698
Supplemental information on cash flows from (used in) operating activitiesInterest paid 375,570 157,810Interest received 567,493 327,087
The accompanying notes are an integral part of the Consolidated Financial Statements.
note 01 | information on Caisse centrale desjardins70 2011 Annual Report | notes to the Condensed Consolidated financial statements
NOTE 01
infoRmAtion on CAisse CentRAle desJARdins
NATURE OF OPERATIONSCaisse centrale Desjardins du Québec (CCD), created on June 22, 1979, is a cooperative institution that offers financial services to Desjardins Group, governments, public and parapublic sector institutions, individuals, medium-sized businesses and large corporations. It serves the needs of its parent company, the Fédération des caisses Desjardins du Québec (the FCDQ), the Desjardins caisses (the member caisses) and other Desjardins Group components. CCD’s mandate is to provide institutional funding for the Desjardins network and to act as financial agent, in particular by supplying interbank exchange services, including clearing house settlements. CCD’s activities on the Canadian and international markets complement those of other Desjardins Group entities. The Desjardins network comprises the entities included in the scope of consolidation of Desjardins Group. The various business segments in which CCD operates are described in Note 27, “Segmented information”. The address of the Head Office is 1170 Peel Street, Suite 600, Montreal, Quebec, H3B 0B1, Canada.
NOTE 02
signifiCAnt ACCounting poliCies
(A) GENERAl INFORmATION
aDopTion of inTernaTional finanCial reporTing sTanDarDs (ifrs)
Pursuant to An Act Respecting Financial Services Cooperatives, these Consolidated Financial Statements have been prepared by CCD’s management in accordance with Canadian generally accepted accounting principles (GAAP) and the accounting requirements of the Autorité des marchés financiers (AMF) in Quebec, which do not differ from GAAP.
Since January 1, 2011, in accordance with the decision of the Canadian Accounting Standards Board, publicly accountable enterprises must prepare their financial statements under a new accounting framework, the International Financial Reporting Standards (IFRS), which constitute Part I of the Canadian Institute of Chartered Accountants (CICA) Handbook – Accounting.
These financial statements are the first Consolidated Financial Statements of CCD prepared under IFRS. Previously, CCD applied Canadian GAAP, which have been carried forward in Part V of the CICA Handbook – Accounting. In these Consolidated Financial Statements, the term “Canadian GAAP” refers to GAAP before the changeover to IFRS.
IFRS were applied retrospectively, with the exception of certain optional exemptions and mandatory exceptions under IFRS 1, “First-Time Adoption of International Financial Reporting Standards” (IFRS 1). The effects of this change of accounting framework on CCD’s consolidated income and financial position, and the methods used to calculate them, are presented in Note 4, “Impact of IFRS adoption”. The 2010 comparative figures presented in these Consolidated Financial Statements have been restated to take into account these new standards.
sTaTemenT of ComplianCe
The Consolidated Financial Statements of CCD have been prepared in accordance with IFRS, as issued by the International Accounting Standards Board (IASB), and more specifically in accordance with IFRS 1, as they are the first consolidated financial statements of CCD. These Consolidated Financial Statements for the year ended December 31, 2011 were approved by the Board of Directors of CCD on February 23, 2012.
The significant measurement and presentation rules applied to prepare these Consolidated Financial Statements are described below.
sCope of The group
The scope of these Consolidated Financial Statements of CCD consists of the operations of CCD and its wholly-owned U.S. subsidiary, Desjardins FSB Holdings Inc.
notes to tHe Condensed ConsolidAted finAnCiAl stAtements(Dollar amounts presented in the tables of the Notes to the Consolidated Financial Statements are in thousands of Canadian dollars, unless otherwise stated.)
note 02 (continued) | significant Accounting Policies notes to the Condensed Consolidated financial statements | 2011 Annual Report 71
CCD includes in its Consolidated Financial Statements the operations of the distinct legal structures specifically created to manage a transaction or a group of similar transactions (special purpose entities), even if it has no equity interest in these entities, provided that it exercises, in substance, control based on the following criteria:
• theactivitiesoftheentityarebeingconductedexclusivelyonbehalfofCCD,sothatCCDobtainsbenefitsfortheentity’soperations;
• CCDhasthedecision-makingandmanagementpowersneededtoobtainthemajorityofthebenefitsoftheongoingactivitiesoftheentity.Thesepowersarecharacterized,inparticular,bytheabilitytodissolvetheentity,tomodifyitsstatutesortoformallyvetoanymodificationthereto;
• CCDhastheabilitytoobtainthemajorityofthebenefitsoftheentityandthereforemaybeexposedtorisksincidenttotheactivitiesoftheentity.These benefits may take the form of rights to receive some or all of the profit or loss of the entity, measured on an annual basis, a share of its net assets, aswellastoselloneormoreassetsorreceivethemajorityoftheresidualassetsintheeventofliquidation;
• CCDretainsthemajorityoftheriskstakenbytheentityinordertoobtainbenefitsfromitsactivities;thiswouldbethecaseifCCDremainsexposedto the initial losses on the asset portfolio held by the entity.
The financial statements of the group entities have been prepared for the same reference period using similar accounting policies. All intercompany balances, income and expenses as well as gains and losses on internal transactions have been eliminated.
signifiCanT juDgmenTs, esTimaTes anD assumpTions
The preparation of consolidated financial statements in accordance with IFRS requires management to make judgments, estimates and assumptions, that are described in the following significant accounting policies with respect to fair value measurement of financial instruments, allowance for credit losses, objective evidence of impairment of available-for-sale securities, impairment of non-financial assets, income taxes and employee benefits.
(b) FINANcIAl ASSETS ANd lIAbIlITIES Financial assets mainly consist of securities, loans and derivative financial instruments, whereas financial liabilities mainly include deposits and derivative financial instruments.
Financial assets and liabilities are recognized on the date CCD becomes a party to their contractual provisions, namely the date of acquisition or issuance of the financial instrument.
ClassifiCaTion anD measuremenT
Financial assets and liabilities are classified based on their characteristics and the intention of management upon their acquisition.
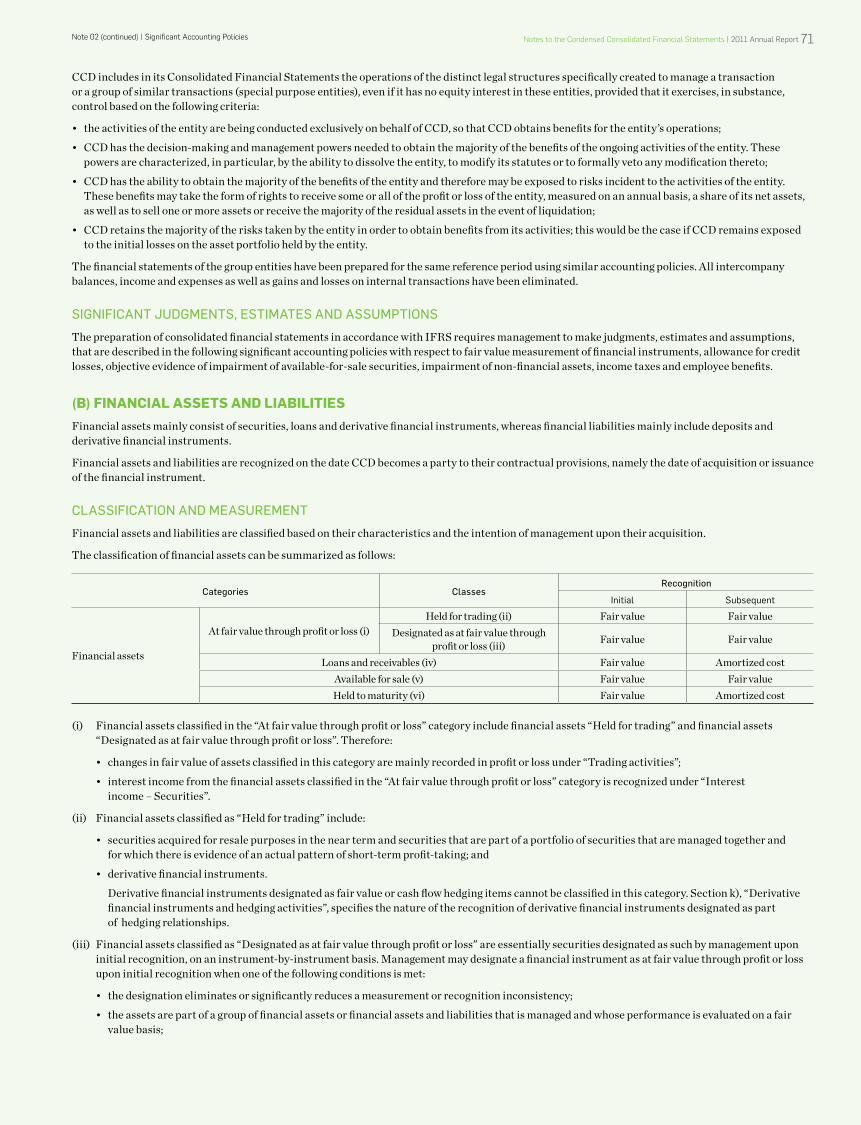
The classification of financial assets can be summarized as follows:
Categories Classesrecognition
Initial Subsequent
Financial assets
At fair value through profit or loss (i)Held for trading (ii) Fair value Fair value
Designated as at fair value through profit or loss (iii) Fair value Fair value
Loans and receivables (iv) Fair value Amortized costAvailable for sale (v) Fair value Fair valueHeld to maturity (vi) Fair value Amortized cost
(i) Financial assets classified in the “At fair value through profit or loss” category include financial assets “Held for trading” and financial assets “Designated as at fair value through profit or loss”. Therefore:
• changesinfairvalueofassetsclassifiedinthiscategoryaremainlyrecordedinprofitorlossunder“Tradingactivities”;
• interestincomefromthefinancialassetsclassifiedinthe“Atfairvaluethroughprofitorloss”categoryisrecognizedunder“Interest income – Securities”.
(ii) Financial assets classified as “Held for trading” include:
• securitiesacquiredforresalepurposesintheneartermandsecuritiesthatarepartofaportfolioofsecuritiesthataremanagedtogetherandfor whichthereisevidenceofanactualpatternofshort-termprofit-taking;and
• derivativefinancialinstruments.
Derivative financial instruments designated as fair value or cash flow hedging items cannot be classified in this category. Section k), “Derivative financial instruments and hedging activities”, specifies the nature of the recognition of derivative financial instruments designated as part of hedging relationships.
(iii) Financial assets classified as “Designated as at fair value through profit or loss” are essentially securities designated as such by management upon initial recognition, on an instrument-by-instrument basis. Management may designate a financial instrument as at fair value through profit or loss upon initial recognition when one of the following conditions is met:
• thedesignationeliminatesorsignificantlyreducesameasurementorrecognitioninconsistency;
• theassetsarepartofagroupoffinancialassetsorfinancialassetsandliabilitiesthatismanagedandwhoseperformanceisevaluatedonafairvaluebasis;
72 2011 Annual Report | notes to the Condensed Consolidated financial statements note 02 (continued) | significant Accounting Policies
• thefinancialinstrumentcontainsoneormoreembeddedderivativesthatsignificantlymodifythecashflowsandthatwouldotherwisebeseparated from their host contract.
CCD’s financial assets classified in this category comprise certain investments made in connection with derivative instruments that are not designated as part of a hedging relationship, thereby significantly reducing an accounting mismatch.
(iv) Securities classified in the “Loans and receivables” category are non-derivative financial assets with fixed or determinable income that are not quoted in an active market and that are not held for sale upon their acquisition or their granting. Securities in this category include “Cash and deposits with financial institutions”, “Securities purchased under reverse repurchase agreements”, “Loans”, “Clients’ liability under acceptances” and other assets.
Outstanding securities classified in the “Loans and receivables” category are initially recognized at fair value in the Consolidated Statements of Financial Position and, at subsequent reporting dates, they are measured at amortized cost using the effective interest method. Income recognized on securities in the “Loans and receivables” category is presented under “Interest income – Loans” in the Consolidated Statements of Income.
(v) Securities classified in the “Available-for-sale securities” category are non-derivative financial assets that are initially designated as available for sale or that are not classified in the “At fair value through profit or loss”, “Held to maturity” or “Loans and receivables” categories. Available-for-sale securities can be sold further to or in view of fluctuations in interest rates, exchange rates, prices of equity instruments or changes in financing sources or terms, or to meet the liquidity needs of CCD.
Gains and losses resulting from changes in fair value, except for impairment losses and foreign exchange gains and losses, are recognized in the Consolidated Statements of Comprehensive Income under “Net unrealized gains on available-for-sale securities” until the financial asset is derecognized. Premiums and discounts on the purchase of available-for-sale securities are amortized over the life of the security using the effective interest method and recognized in consolidated profit or loss.
(vi) Securities classified in the “Held to maturity” category are non-derivative financial assets with fixed or determinable payments and fixed maturities that management has the intention and ability to hold to maturity. These securities are recognized at amortized cost using the effective interest method. CCD held no instrument in this category at the reporting dates.
The classification of financial liabilities can be summarized as follows:
Categories Classesrecognition
Initial Subsequent
Financial liabilitiesAt fair value through profit or loss (i)
Held for trading (ii) Fair value Fair valueDesignated as at fair value through
profit or loss (iii) Fair value Fair value
At amortized cost (iv) Fair value Amortized cost
(i) Financial liabilities classified in the “At fair value through profit or loss” category include financial liabilities “Held for trading” and financial liabilities “Designated as at fair value through profit or loss”. Therefore:
• changesinfairvalueofliabilitiesclassifiedinthiscategoryarerecordedinprofitorlossunder“Tradingactivities”,
• interestexpenserelatedtofinancialliabilitiesclassifiedinthe“Atfairvaluethroughprofitorloss”categoryisrecognizedunder“Tradingactivities” using the effective interest method.
(ii) Financial liabilities classified as “Held for trading” are debt securities issued with the intention to repurchase them in the near term and securities that are part of a portfolio of securities that are managed together and for which there is evidence of an actual pattern of short term profit-taking, such as “Commitments related to securities sold short”. Derivative financial instruments are also classified as “Held for trading”. Derivative financial instruments designated as fair value or cash flow hedging items cannot be classified in this category. Section k), “Derivative financial instruments and hedging activities”, specifies the nature of the recognition of derivative financial instruments designated as part of hedging relationships.
(iii) Financial liabilities classified as “Designated as at fair value through profit or loss” have been designated as such by management upon initial recognition, on an instrument-by-instrument basis. Management may designate a financial instrument as at fair value through profit or loss upon initial recognition when one of the following conditions is met:
• thedesignationeliminatesorsignificantlyreducesameasurementorrecognitioninconsistency;
• theliabilitiesarepartofagroupoffinancialliabilitiesorfinancialassetsandliabilitiesthatismanagedandwhoseperformanceisevaluatedon a fairvaluebasis;
• thefinancialinstrumentcontainsoneormoreembeddedderivativesthatsignificantlymodifythecashflowsandthatwouldotherwisebeseparated from their host contract.
CCD held no instrument in this category at the reporting dates.
(iv) Financial liabilities that are not classified in the “At fair value through profit or loss” category are classified in the “At amortized cost” category. Financial liabilities measured at amortized cost include “Deposits”, “Acceptances”, “Commitments related to securities sold under repurchase agreements” and other liabilities.
Financial liabilities classified in the “At amortized cost” category are initially recognized at fair value in the Consolidated Statements of Financial Position and, at subsequent reporting dates, they are measured at amortized cost using the effective interest method. Interest expense on securities classified in the “At amortized cost” category is recognized under “Interest expense” in profit or loss.
notes to the Condensed Consolidated financial statements | 2011 Annual Report 73note 02 (continued) | significant Accounting Policies
fair Value measuremenT of finanCial insTrumenTs
The fair value of financial instruments, especially securities, obtained from quoted prices on active markets includes little subjectivity in the determination of fair value.
If there are no quoted prices on active markets, the fair value is determined using models based on observable market data or models that are not based on observable market data. When no quoted prices are available, the fair value is estimated using present value or other valuation methods, which are influenced by the assumptions used concerning the amount and timing of estimated future cash flows and discount rates, which reflect varying degrees of risk, including liquidity risk, credit risk, interest rates, exchange rates, and price and rate volatility. Given the role that judgment plays in applying many of the acceptable estimation and valuation techniques for calculating fair values, they are not identical. Estimated fair value reflects market conditions on a given date and for this reason cannot be representative of future fair values. It also cannot be considered as being realizable in the event of immediate settlement of these instruments.
LoAns
Changes in interest rates and in the creditworthiness of borrowers are the main causes of changes in the fair value of loans held by the CCD, which result in a favourable or unfavourable difference compared to their carrying amount. The fair value of loans is estimated by discounting expected cash flows using market interest rates charged for similar new loans at the reporting date. The fair value of impaired loans is assumed to be equal to their carrying amount.
dePosits
The fair value of deposits with floating rate features or with no stated maturity is assumed to be equal to their carrying amount. The fair value of fixed rate deposits is determined by discounting expected cash flows using market interest rates currently being offered for deposits with relatively the same term.
deRiVAtiVe finAnCiAL instRuMents
The fair value of derivative financial instruments is determined using pricing models that incorporate the current market prices and the contractual prices of the underlying instruments, the time value of money, yield curves and volatility factors. The fair value of derivative financial instruments is presented without taking into account the impact of legally binding master netting agreements. Note 14, “Derivative financial instruments and hedging activities”, specifies the nature of derivative financial instruments held by CCD.
finAnCiAL instRuMents whose fAiR VALue equALs CARRyinG AMount
The carrying amount of financial instruments that mature within the next twelve months is a reasonable approximation of their fair value. These financial instruments include the following items: “Cash and deposits with financial institutions”, “Securities purchased under reverse repurchase agreements”, “Clients’ liability under acceptances”, “Other assets – Other”, “Acceptances”, “Commitments related to securities sold under repurchase agreements”, and “Other liabilities – Other”.
TransaCTion CosTs
Transaction costs for financial instruments are capitalized and then amortized over the life of the instrument using the effective interest method, except if such instruments are classified or designated as part of the “At fair value through profit or loss” category, in which case these costs are expensed as incurred.
offseTTing of finanCial asseTs anD liabiliTies
Financial assets and liabilities are presented on a net basis when there is a legally enforceable right to set off the recognized amounts and CCD intends to settle on a net basis or to realize the asset and settle the liability simultaneously.
DereCogniTion of finanCial asseTs anD liabiliTies
A financial asset is derecognized when the contractual rights to the cash flows from the asset expire or when the contractual rights to the cash flows from the financial asset and substantially all risks and rewards of ownership of the asset are transferred to a third party.
When the cash flows from a financial asset have been transferred but CCD has retained substantially all the risks and rewards of ownership of the financial asset, it recognizes a separate asset or a separate liability presented in the Consolidated Statements of Financial Position under “Other assets – Other” or “Other liabilities – Other”, respectively, representing the rights and obligations created or retained in the asset transfer. If control of the financial asset is retained, CCD continues to recognize the asset in the Consolidated Statements of Financial Position to the extent of its continuing involvement in this asset.
When a financial asset is derecognized in full, a gain or a loss is recognized in the Consolidated Statements of Income for an amount equal to the difference between the carrying amount of the asset and the value of the consideration received.
A financial liability is derecognized when the related obligation is discharged, cancelled or expires.
74 2011 Annual Report | notes to the Condensed Consolidated financial statements note 02 (continued) | significant Accounting Policies
(c) cASh ANd dEPOSITS wITh FINANcIAl INSTITUTIONS“Cash and deposits with financial institutions” includes cash and cash equivalents. Cash equivalents consist of deposits with the Bank of Canada, deposits with financial institutions – including net amounts receivable related to cheques and other items in the clearing process – as well as the net amount of cheques and other items in transit. These financial instruments mature in the short term, are readily convertible to known amounts of cash and are subject to an insignificant risk of changes in value. They are classified as “Loans and receivables”.
(d) SEcURITIESSecurities are instruments classified based on their characteristics and management’s intention in the various categories presented in section b), “Financial assets and liabilities”.
seCuriTies purChaseD unDer reVerse repurChase agreemenTs
Securities purchased under reverse repurchase agreements are not recognized in the Consolidated Statements of Financial Position, as substantially all the risks and rewards of ownership of these securities have not been transferred.
Reverse repurchase agreements are accounted for as collateralized lending transactions. The consideration paid for the securities acquired, including accrued interest, is recognized under “Securities purchased under reverse repurchase agreements”.
The fair value of securities purchased under reverse repurchase agreements is presented in the notes as financial assets held as collateral. In addition, when the securities received can subsequently be resold or repledged as collateral, the fair value of securities purchased under reverse repurchase agreements is presented in Note 21, “Commitments, guarantees and contingent liabilities”, as financial assets held as collateral that can be sold or repledged.
seCuriTies solD unDer repurChase agreemenTs
Securities sold under repurchase agreements (to be repurchased at a subsequent date) do not result in the derecognition of securities in the Consolidated Statements of Financial Position, as substantially all the risks and rewards of ownership of these securities have not been transferred.
Repurchase agreements are accounted for as collateralized borrowing transactions. The consideration received for the securities sold, including accrued interest, is therefore recognized under “Cash and deposits with financial institutions” in the Consolidated Statements of Financial Position, and a liability representing the obligation to return the securities is recognized under “Commitments related to securities sold under repurchase agreements”. The difference between the price received and the repurchase price is recognized as interest expense.
The carrying amount of securities sold under repurchase agreements is presented in Note 21, “Commitments, guarantees and contingent liabilities”, as financial assets pledged as collateral.
seCuriTies solD shorT
Securities sold short as part of trading activities, which represent CCD’s obligation to deliver securities that it did not possess at the time of sale, are recognized as liabilities at their fair value. Realized and unrealized gains and losses on these securities are recognized in the Consolidated Statements of Income under “Trading activities”. Securities sold short are classified in the “Securities at fair value through profit or loss – held for trading” category.
(E) lOANSLoans are recorded at amortized cost using the effective interest method, net of the allowance for credit losses.
The fees collected and the direct costs related to the origination, restructuring, and renegotiation of loans are treated as being integral to the yield of the loan, unless the terms and conditions were changed in such a way that the transaction is treated as the granting of a new loan, in which case fees and direct costs are recorded in profit or loss for the year. Collateral is obtained if deemed necessary, based on an assessment of the borrower’s creditworthiness. Collateral normally takes the form of assets such as cash, government securities, shares, receivables, inventory or capital assets.
(F) ImPAIRmENT OF FINANcIAl ASSETS At the reporting date, CCD assesses whether there is any objective evidence that a financial asset or a group of financial assets is impaired.
alloWanCe for CreDiT losses
Evidence of depreciation result from a loss event that occurred after the loan was granted but before the reporting date and that has an impact on the estimated future cash flows of loans.
The impairment of a loan or a group of loans is determined by discounting future expected cash flows at the interest rate inherent in the financial asset. The allowance is equal to the difference between this value and the carrying amount. This allowance is presented in deduction of assets under “Allowance for credit losses”. To determine the estimated recoverable amount of a loan, CCD discounts the estimated future cash flows at the effective interest rate inherent in the loan. When the amounts and timing of future cash flows cannot be estimated with reasonable reliability, the estimated recoverable amount is determined using either the fair value of any security underlying the loan, net of expected costs of realization, or the observable market price for the loan. The security may vary depending on the type of loans.
notes to the Condensed Consolidated financial statements | 2011 Annual Report 75note 02 (continued) | significant Accounting Policies
The allowance resulting from this impairment is established using two components: individual allowances and collective allowance.
indiViduAL ALLowAnCes
CCD first reviews its loan portfolios on a loan-by-loan basis to assess credit risk and determine if there is any objective evidence of impairment for which a loss should be recognized in the Consolidated Statements of Income. Loan portfolios for which an individual allowance has not been established are then included in groups of assets having similar credit risk characteristics and are subject to a collective allowance.
There is an objective evidence of impairment when one of the following conditions is met:
• thereisreasontobelievethataportionoftheprincipalorinterestcannotbecollected;or
• theinterestorprincipalrepaymentiscontractually90daysormorepastdue,unlesstheloanisfullysecuredorintheprocessofcollection;or
• theinterestorprincipalismorethan180daysinarrears.
When a loan is impaired, the interest previously accrued but not collected is capitalized to the loan. Payments received subsequently are recorded as a deduction of the principal. A loan ceases to be considered impaired when principal and interest payments are up to date and there is no doubt as to the collection of the loan or when it is restructured, in which case it is treated as a new loan, and there is no doubt as to the collection of principal and interest.
Assets foreclosed to settle impaired loans and held for sale are recognized on the date of the foreclosure at their fair value less costs to sell. Any difference between the carrying amount and the fair value recorded for the acquired assets is recognized under “Provision for credit losses”.
A loan classified as “Loans and receivables” is written off when all attempts at restructuring or collection have been made and the likelihood of future recovery is remote. When a loan is written off completely, any subsequent payments are recorded under “Provision for credit losses” in the Consolidated Statements of Income.
Changes in the individual allowance for credit losses due to the passage of time are recognized under “Interest income – Loans”, while those that are due to a revision of expected receipts are recognized under “Provision for credit losses” in the Consolidated Statements of Income.
CoLLeCtiVe ALLowAnCe
Loan portfolios for which an individual allowance has not been established are included in groups of financial assets having similar credit characteristics and are subject to a collective allowance.
The method used by CCD to determine the collective allowance takes into account the risk parameters of the various loan portfolios, in particular through the integration of sophisticated credit risk models. These collective allowance impairment models take into account certain factors such as probabilities of default (loss frequency), loss given default (extent of losses) and gross exposures at default. These parameters, which are based on historical losses, are determined according to the category and the risk rating of each loan. The measurement of the collective allowance also depends on management’s assessment of current credit quality trends with respect to business sectors, the impact of changes to its credit policies and economic conditions.
The allowance related to off-balance sheet exposures, such as letters of guarantee and certain unrecognized credit commitments, is recognized under “Other liabilities – Other” in the Consolidated Statements of Financial Position and under “Provision for credit losses” in the Consolidated Statements of Income.
aVailable-for-sale seCuriTies
Securities classified in the “Available-for-sale” category are monitored on a regular basis to determine whether there is any objective evidence that they are impaired. In evaluating the decline in value, CCD takes into account many facts specific to each investment and all the factors that could indicate that there has been an impairment. Factors considered include, but are not limited to, a significant or prolonged decline in the fair value, significant financial difficulties of the issuer, a breach of contract, the increasing probability that the issuer will enter bankruptcy or a restructuring and the disappearance of an active market for that financial asset. Management also uses judgment to determine when to recognize an impairment loss.
Debt securities classified in the “Available-for-sale” category are individually assessed by CCD to determine whether there is any objective evidence of impairment. However, the impairment loss represents the cumulative loss measured as the difference between amortized cost and current fair value, less any impairment loss previously recognized. Future interest income is calculated on the reduced carrying amount using the same interest rate as the one used to discount future cash flows in order to measure the impairment loss. When, during a subsequent period, the fair value of a debt security increases and that increase can be objectively related to an event occurring after the impairment loss had been recognized in profit or loss, the impairment loss is reversed through profit or loss.
76 2011 Annual Report | notes to the Condensed Consolidated financial statements
For equity securities classified in the “Available-for-sale” category, the objective evidence would also include a “significant” or “prolonged” decline in the fair value below cost. In general, the terms “significant” and “prolonged” respectively mean a decline of 20% or more and a period of more than 12 months. When evidence of impairment exists, the cumulative loss (measured as the difference between acquisition cost and current fair value, less any impairment loss previously recognized) is transferred out of other comprehensive income, in the Consolidated Statements of Comprehensive Income, and recognized in the Consolidated Statements of Income. Impairment losses on equity securities are not reversed through profit or loss, and increases in fair value occurring subsequent to impairment are recorded directly in other comprehensive income, in the Consolidated Statements of Comprehensive Income. Any impairment loss on securities previously impaired is directly recognized in profit or loss.
(G) SEcURITIzATION As part of Desjardins Group’s liquidity and capital management strategy, CCD participates in the National Housing Act Mortgage-Backed Securities Program. Under this program, CCD bundles mortgage loans guaranteed by the Canada Mortgage and Housing Corporation (CMHC) previously acquired from Desjardins Group member caisses into NHA mortgage-backed securities (NHA MBSs) and then transfers them to the Canada Housing Trust. In addition, pursuant to this program, CCD acquires interests in securitized loans from Desjardins Group member caisses. The loans and interests acquired through these transactions do not meet the recognition criteria as members caisses retain substantially all the risks and rewards related to these loans and interests. In addition, CCD recognizes a liability equal to the consideration received from the CMHC with respect to the interests in securitized loans that do not meet the derecognition criteria. This liability is presented under “Deposits – Business and government” in the Consolidated Statements of Financial Position. Income related to securitization transactions is recognized under “Trading activities”, “Interest income – Securities” and “Interest income – Loans”.
(h) PREmISES ANd EqUIPmENT Premises and equipment consist of land, buildings, computer hardware, furniture, fixtures and other as well as leasehold improvements. These assets are recognized at cost less any accumulated depreciation and any accumulated impairment losses, and are depreciated over their expected useful life using the straight-line method.
The depreciable amount of an item of premises and equipment is determined after deducting its residual value less costs to sell. The useful life of premises and equipment is generally equal to their expected useful life.
The depreciation expense for premises and equipment is recognized under “Non-interest expense – Premises, equipment and furniture, including depreciation” in the Consolidated Statements of Income.
dePReCiAtion
Premises and equipment are depreciated over the following depreciation periods:
Depreciation periods
Land Non-depreciableBuildings 15 to 60 years Computer equipment 5 yearsFurniture, fixtures and other 5 yearsLeasehold improvements Expected term of the lease
When an item of premises and equipment is made up of several significant parts having different useful lives or providing economic benefits according to different patterns, each part is recognized separately and is depreciated over its own depreciation period.
deReCoGnition
Premises and equipment are derecognized on disposal or when they are permanently withdrawn from use and no future economic benefits are expected.
iMPAiRMent
Premises and equipment are tested for impairment whenever events or changes in circumstances indicate that their carrying amount may not be recoverable. Assessing whether such events or circumstances exist is subject to management’s judgment.
(I) INTANGIblE ASSETS Intangible assets include acquired and internally generated intangible assets and are initially recognized at cost. The cost of an intangible asset acquired as part of a business combination corresponds to its fair value at the date of acquisition. Subsequent to initial recognition, intangible assets are measured at cost less any accumulated amortization and any impairment losses. Expenditures related to internally generated intangible assets, except for development costs, are recognized in profit or loss as incurred.
CCD assesses whether the useful life of an intangible asset is finite or indefinite. Intangible assets with finite useful lives include software and are amortized using the straight-method over their estimated useful lives, which do not exceed five years. CCD does not own any intangible asset with an indefinite useful life.
note 02 (continued) | significant Accounting Policies
notes to the Condensed Consolidated financial statements | 2011 Annual Report 77note 02 (continued) | significant Accounting Policies
Gains or losses resulting from the derecognition of an intangible asset are determined as the difference between the net proceeds of disposal and the net carrying amount of the asset. They are recognized under “Non-interest expense – Other” in the Consolidated Statements of Income upon derecognition of the asset.
(J) ImPAIRmENT OF NON-FINANcIAl ASSETSCCD assesses at the reporting date whether there is an indication that an asset may be impaired. An impairment loss is recognized when the carrying amount of the asset exceeds its recoverable amount. The recoverable amount is the higher of its fair value less costs to sell and its value in use, which corresponds to the present value of the recoverable future cash flows. Any impairment loss recognized in the Consolidated Statements of Income represents the excess of the carrying amount of the asset over the recoverable amount. Impairment losses on that asset may be subsequently reversed and are recognized in the Consolidated Statements of Income in the year in which they occur.
Estimating the recoverable amount of a non-financial asset to determine if it is impaired requires also that management make estimates and assumptions, and any change in these estimates and assumptions could impact the determination of the recoverable amount of non-financial assets and, therefore, the outcome of the impairment test.
(K) AccEPTANcES ANd clIENTS’ lIAbIlITy UNdER AccEPTANcESThe potential liability of CCD under acceptances is recognized as a liability in the Consolidated Statements of Financial Position. Recourse against the client, in the event of a call on any of these commitments, is recorded as an equivalent offsetting asset. These financial instruments are classified in the “Loans and receivables” category.
(l) dERIvATIvE FINANcIAl INSTRUmENTS ANd hEdGING AcTIvITIES
DeriVaTiVe finanCial insTrumenTs
Derivative financial instruments are financial contracts whose value depends on assets, interest rates, foreign exchange rates, and other financial indexes. The vast majority of derivative financial instruments are negotiated by mutual agreement between CCD and the counterparty and include forward exchange contracts, cross-currency interest rate swaps, interest rate swaps, currency swaps, credit default swaps, total return swaps, forward rate agreements, and currency, interest rate and stock index options. The other transactions are carried out as part of regulated trades and mainly consist of futures. The types of contracts are defined in Note 14, “Derivative financial instruments and hedging activities”.
Derivative financial instruments, including embedded derivatives which are required to be recognized separately, are recognized at fair value in the Consolidated Statements of Financial Position.
Embedded derivative financial instruments are separated from their host contract and accounted for as derivatives if: (a) the economic characteristics andrisksoftheembeddedderivativesarenotcloselyrelatedtotheeconomiccharacteristicsandrisksofthehostcontract;(b)theembeddedderivativehasthesametermsasaseparateinstrument;(c)thehybridinstrumentorcontractisnotmeasuredatfairvaluewithchangesinfairvaluerecognizedin consolidated profit or loss. Embedded derivatives that are to be recognized separately are measured at fair value, and changes in their fair value are recognized under “Trading activities” in the Consolidated Statements of Income.
CCD uses derivative financial instruments for trading purposes or for asset-liability management purposes.
Derivative financial instruments held for trading purposes are mainly used in intermediation activities conducted to meet the needs of the Desjardins network or its clients. These derivative financial instruments are recognized at fair value in the Consolidated Statements of Financial Position, and changes in their fair value are recognized under “Trading activities” in the Consolidated Statements of Income.
Derivative financial instruments held for asset-liability management purposes are used to manage current and expected risks related to market risk. These instruments enable CCD to transfer, manage or reduce the interest rate and foreign currency exposures of assets and liabilities recorded on the Consolidated Statements of Financial Position, firm commitments and forecasted transactions.
heDging aCTiViTies
CCD designates its derivative financial instruments as part of a fair value, cash flow or net investment in a self-sustaining foreign operation hedging relationship.
When derivative financial instruments are used to manage assets and liabilities, CCD must determine, for each derivative, whether or not hedge accounting is appropriate. To qualify for hedge accounting, a hedge relationship must be designated and documented at its inception. Such documentation must address the specific strategy for managing risk, the asset, liability or cash flows that are being hedged as well as the measure of effectiveness of this hedge. Consequently, the effectiveness of each hedging relationship must be assessed, regularly and on an individual basis, to determine with reasonable assurance whether the relationship is effective and will continue to be effective. The derivative financial instrument must prove highly effective to offset changes in the fair value or the cash flows of the hedged item attributable to the risk being hedged.
CCD may also use derivative financial instruments as an economic hedge for certain transactions in situations where the hedging relationship does not qualify for hedge accounting or where it elects not to apply hedge accounting. In such circumstances, derivative financial instruments are classified as “Held for trading”, and realized and unrealized gains and losses are recognized in the Consolidated Statements of Income under “Trading activities”.
The designation of a derivative financial instrument as hedging item is discontinued in the following cases: the hedged item is sold or matures, the derivative financial instrument is repurchased or matures, the hedge is no longer effective, or CCD terminates the designation of the hedge or no longer expects that the forecasted transaction will occur.
78 2011 Annual Report | notes to the Condensed Consolidated financial statements note 02 (continued) | significant Accounting Policies
Hedging instruments that meet the strict hedge accounting conditions are recognized as follows:
fAiR VALue hedGes
Fair value hedge transactions involve mostly the use of interest rate swaps to hedge the changes in fair value of a fixed-rate financial instrument caused by a change in interest rates on the market. The change in fair value of hedging derivative financial instruments offsets the change in fair value of hedged items. CCD uses fair value hedge strategies for its securities, loan and deposit portfolios.
In a fair value hedge transaction, changes in the fair value of the hedging derivative financial instrument are recognized under “Trading activities” in the Consolidated Statements of Income, as well as changes in fair value of the hedged asset or liability attributable to the hedged risk. The gain or loss attributable to the hedged risk is applied to the carrying amount of the hedged item. When the changes in the fair value of the hedging derivative financial instrument and the hedge item do not entirely offset each other, the resulting amount, which represents the ineffective portion of the relationship, is recognized under “Trading activities” in the Consolidated Statements of Income.
When a fair value hedging relationship is discontinued, hedge accounting is discontinued prospectively. The hedged item is no longer adjusted to reflect the fair value impact of the designated risk. Adjustments previously recorded in the hedged item are amortized using the effective interest method and are recognized in net interest income, in the Consolidated Statements of Income, following the underlying instrument, over the remaining life of the hedged item, unless the hedged item ceased to exist, in which case the adjustments for the impact of the designated risk are immediately recognized under “Trading activities” in the Consolidated Statements of Income.
CAsh fLow hedGes
Cash flow hedge transactions involve mostly the use of interest rate swaps to hedge the changes in future cash flows from a floating-rate financial instrument. Hedging derivative financial instruments reduce the variability of future cash flows from the hedged item. CCD uses cash flow hedge strategies for its loan, deposit and securities portfolios.
In a cash flow hedge transaction, gains and losses resulting for changes in the fair value of the effective portion of the derivative financial instrument are recognized in other comprehensive income under “Gains (losses) on derivative financial instruments designated as cash flow hedges” until the hedged item is recognized in the Consolidated Statements of Income, at which time such changes are recognized under net interest income in the Consolidated Statements of Income, following the underlying instrument. The ineffective portion of cash flow hedge transactions is immediately recognized in the Consolidated Statements of Income under “Trading activities”.
When a cash flow hedging relationship no longer qualifies for hedge accounting, CCD discontinues hedge accounting prospectively. Gains or losses recognized in other comprehensive income are amortized to net interest income, in the Consolidated Statements of Income, following the underlying instrument, over the expected remaining life of the hedging relationship that was discontinued. If a designated hedged item is sold or matures before the related derivative financial instrument ceases to exist, all gains or losses are immediately recognized in profit or loss under “Trading activities”.
hedGes of A net inVestMent in A seLf-sustAininG foReiGn oPeRAtion
Non-derivative financial instruments are used to hedge the foreign exchange risk of hedging transactions of the net investment in a self-sustaining foreign operation. Exchange gains and losses are presented under “Net unrealized exchange gains (losses) on the translation of the financial statements of a self-sustaining foreign operation” in the Consolidated Statements of Comprehensive Income. The ineffective portion is immediately recognized in the Consolidated Statements of Income under “Trading activities”.
(m) FINANcIAl GUARANTEESA guarantee is a contract or an indemnification agreement that contingently requires CCD to make payments to the guaranteed party following a loss resulting from the default by a specified third party to make a payment upon maturity in accordance with the original or modified provisions of the borrowing instrument.
Financial guarantees are initially recognized in the Consolidated Financial Statements at the fair value at the date the guarantee is issued. After initial recognition, the guarantee is measured at the higher of the following amounts:
(i) theamountinitiallyrecordedless,whenappropriate,cumulativeamortizationofcostsrecognizedinprofitorloss;and
(ii) the best estimate of the expenditure required to settle the financial obligation resulting from the guarantee.
The obligations related to guarantees issued by CCD are presented under “Other liabilities – Derivative financial instruments”. The carrying amount of guarantees does not reflect the maximum potential amount of future payments under guarantees. Therefore, CCD continues to consider these guarantees as off-balance sheet credit instruments.
(N) RESERvEThegeneralreservepresentedinmembers’equityrepresentsamountsappropriatedbyCCD;italsocomprisesaportionofitssurplusearningssinceits inception. This reserve can only be used to eliminate a deficit and cannot be divided amongst members nor used to pay a member dividend.
(O) REmUNERATION OF cAPITAl STOcKRemuneration of capital stock represents interest declared by the Board of Directors on capital shares.
notes to the Condensed Consolidated financial statements | 2011 Annual Report 79note 02 (continued) | significant Accounting Policies
(P) REvENUE REcOGNITION Revenues are recognized to the extent that it is probable that the economic benefits will flow to CCD and that they can be measured reliably. In addition to the items mentioned in section b), “Financial assets and liabilities”, the specific recognition criteria that follow must also be met before revenues can be recognized.
neT inTeresT inCome
Interest income and expense are recognized using the effective interest method for all financial instruments measured at amortized cost, for interest-bearing financial assets classified in the “Available-for-sale” category and for financial instruments classified in the “Designated as at fair value through profit or loss” category.
The effective interest method is a method of calculating the amortized cost of a financial asset or a financial liability and of allocating the interest income or interest expense over the relevant period. The effective interest rate is the rate that exactly discounts estimated future cash payments or receipts through the expected life of the financial instrument or, when appropriate, a shorter period to the net carrying amount of the financial asset and the financial liability.
When calculating the effective interest rate, CCD estimates cash flows considering all contractual terms of the financial instruments (for example, prepayment options) but does not consider future credit losses. The calculation includes transaction costs and income between parties to the contract as well as premiums or discounts. Transaction costs and income that form an integral part of the effective rate of the contract, such as file setup fees and business getter commissions, are assimilated to supplemental interest.
serViCe Charges, fees anD managemenT fees
CCD earns income from service charges and fees as a result of the broad range of services and products it provides to its clients.
Service charges and fees are recognized once the service is provided or the product is delivered. Income from service charges is recognized under “Deposit and payment service charges” in the Consolidated Statements of Income.
Loan syndication fees are recognized as revenues when the syndication agreement is signed unless the yield on the loan retained by CCD is less than the yield of other comparable lending institutions that participate in the financing. In such instances, an appropriate portion of the fees is deferred using the effective interest method.
Fee income is recognized under “Credit fees” and “Other income – Other” in the Consolidated Statements of Income.
Management fees for portfolios under management are recognized based on the applicable service contracts pro rata over the period during which the service is provided. Portfolio management income is recognized under “Other income – Management fees” in the Consolidated Statements of Income.
oTher paymenTs To The DesjarDins neTWorK
The other payments to the Desjardins network represent a redistribution to the Desjardins network components of net income attributable to financial services offered as an intermediate in transactions carried out on behalf of these components. These redistributions are recognized when the service is provided.
(q) ASSETS UNdER mANAGEmENTCCD performs liquidity management on behalf of third parties. These assets under management are held by and for the benefit of clients. These assets under management are therefore excluded from the Consolidated Statements of Financial Position of CCD. Income from these management services is recognized under “Other income – Other” in the Consolidated Statements of Income when the service is provided.
(R) FOREIGN cURRENcy TRANSlATION Monetary assets and liabilities denominated in foreign currencies are translated into Canadian dollars at the exchange rate prevailing at the reporting date. Non-monetary assets and liabilities measured at historical cost are translated at the exchange rate prevailing at the transaction date, while those that are measured at fair value are translated at the exchange rate prevailing at the date fair value was determined. Income and expenses are translated at the average exchange rate for the year. Realized and unrealized gains and losses resulting from the translation are recognized in the Consolidated Statements of Income under “Other income – Other”. However, unrealized gains and losses on non-monetary financial instruments classified as “Available-for-sale”, and gains and losses on derivatives designated as cash flow hedges are presented in other comprehensive income in the Consolidated Statements of Comprehensive Income. All assets and liabilities of the self-sustaining foreign subsidiary denominated in foreign currencies are translated at rates prevailing on the reporting date, while income and expenses of this foreign operation are translated at the average rate for the year. Exchange gains and losses resulting from the translation of the financial statements of this subsidiary, including the related effects of hedging and taxes, are recorded in other comprehensive income.
(S) lEASES In a finance lease, the lessor transfers to the lessee substantially all the risks and rewards inherent to the asset. This type of lease is analyzed as financing granted to the lessee to purchase the asset. On the other hand, in an operating lease, the lessor retains substantially all the risks and rewards inherent to the leased asset. CCD mainly entered into operating leases. The recognition of operating leases depends on the position of CCD, namely as a lessor or as a lessee.
80 2011 Annual Report | notes to the Condensed Consolidated financial statements
The asset is not recognized as an asset by the lessee. Lease payments made under operating leases are recognized on a straight-line basis over the lease period under “Premises, equipment and furniture, including depreciation”, in the Consolidated Statements of Income.
(T) INcOmE TAxESThe calculation of income taxes is based on the expected tax treatment of the transactions recorded in the Consolidated Statements of Income, Consolidated Statements of Comprehensive Income and Consolidated Statements of Members’ Equity. To determine the current and deferred portions of income taxes, assumptions must be made concerning the dates on which deferred income tax assets and liabilities will be reversed. If CCD’s interpretation differs from that of the taxation authorities or if the reversal dates do not correspond with the forecasted dates, the provision for income taxes on surplus earnings may increase or decrease in subsequent years.
CurrenT inCome TaXes
Current income tax assets and liabilities for the current and prior years are measured at the amount expected to be paid to or recovered from the taxation authorities. Tax rates and tax laws applied to determine these amounts are those that have been enacted or substantively enacted at the reporting date.
Current taxes related to items recognized directly in members’ equity are recognized in retained earnings and not in profit or loss.
DeferreD inCome TaXes
Deferred taxes are recognized, using the liability method, for all temporary differences existing at the reporting date between the tax basis of assets and liabilities and their carrying amount in the Consolidated Statements of Financial Position.
Deferred tax liabilities are recognized for all taxable temporary differences, except:
(i) when the deferred tax liability arise from the initial recognition of goodwill or the initial recognition of an asset or liability in a transaction which is notabusinesscombinationandwhich,atthetimeofthetransaction,affectsneitheraccountingprofitnortaxableprofit(ortaxloss);and
(ii) for taxable temporary differences associated with investments in subsidiaries, when the date at which the temporary difference reverses can be controlled and it is probable that the temporary difference will not reverse in the foreseeable future.
Deferred tax assets are recognized for all deductible temporary differences, tax loss carryforwards and unused tax credits, to the extent that it is probable that a taxable profit will be available against which these deductible temporary differences, tax loss carryforwards and unused tax credits can be utilized, except:
(i) when the deferred tax asset associated to the deductible temporary difference arise from the initial recognition of an asset or liability in a transaction which is not a business combination and which, at the time of the transaction, affects neither accounting profit nor taxable profit (or tax loss);and
(ii) for deductible temporary differences associated to investments in subsidiaries. Deferred tax assets are recognized only to the extent that it is probable that the temporary difference will reverse in the foreseeable future and that a taxable profit will be available against which the temporary difference can be utilized.
The carrying amount of a deferred tax asset is reviewed at each reporting date and reduced to the extent that it is no longer probable that sufficient taxable profit will be available to allow the benefit of part or all of that deferred tax asset to be utilized. Unrecognized deferred tax assets are reassessed at each reporting date and are recognized to the extent that it becomes probable that a future taxable profit will be available to recover them.
Deferred tax assets and liabilities are measured at the tax rates that are expected to apply to the period when the asset is realized or the liability is settled, based on tax rates (and tax laws) that have been enacted or substantively enacted at the reporting date.
Current and deferred taxes related to items recognized directly in members’ equity are recognized in members’ equity and not in profit or loss.
Deferred tax assets and liabilities are offset if there is a legally enforceable right to set off current tax assets against current tax liabilities, and if these deferred taxes relate to the same taxable entity and the same taxation authority.
note 02 (continued) | significant Accounting Policies
notes to the Condensed Consolidated financial statements | 2011 Annual Report 81
(U) EmPlOyEE bENEFITS
shorT-Term benefiTs
Short-term benefits are benefits payable within twelve months after the reporting date, other than termination benefits, such as salaries and commissions, social security contributions and certain bonuses. An expense is recorded for these short-term benefits in the period during which the services giving right to them were rendered.
posT-employmenT benefiTs
Pension PLAns
CCD offers to its employees a pension plan and a supplemental plan, which provides pension benefits in excess of statutory limits, through the group plans in which all employers of Desjardins Group may participate. These group plans represent defined benefit pension plans of which the risks are shared by the Desjardins Group participating entities. The main CCD pension plan is funded by contributions from both employees and employers, which are determined based on the financial position and the funding policy of the plan. The contributions needed to fund benefits are collected based on the pensionable salaries of CCD as a percentage of total pensionable salaries for Desjardins Group as a whole. The supplemental pension plan is unfunded.
CCD also offers to certain active and retired executives another defined benefit supplemental pension plan. This supplemental pension plan provides pension benefits in excess of statutory limits and is unfunded. Benefits are calculated on the basis of the number of years of membership in the plan and take into consideration the average of the employee’s five most highly-paid years.
Defined benefit pension plans are plans in which CCD participates and for which it has formally committed to a level of benefits and therefore assumes actuarial and, when the plans are funded, investment risks. Benefits are calculated on the basis of the number of years of membership in the pension plans and take into consideration the average salary of the employee’s five most highly-paid years. Since the terms of the plans are such that future changes in salary levels will have an impact on the amount of future benefits, the cost of the benefits and the fair value of the defined benefit plan obligation are generally actuarially determined using the projected unit credit method. These calculations are made based on management’s best estimate assumptions concerning the expected rate of return of the plans’ investments and the plan obligation discount rate, and also, but to a lesser extent, salary increases, the retirement age of employees, the mortality rate and the rate of increase in pension benefits. A complete actuarial valuation is performed each year by a qualified actuary.
Actuarial gains (losses) result from the difference between the actual return on plan assets and the expected return for funded plans, the changes made to the actuarial assumptions used to determine the defined benefit plan obligation and the experience gains or losses on this obligation. Any actuarial gain or loss exceeding 10% of the greater of the value of the defined benefit plan obligation and the fair value of plan assets at the end of the previous year is amortized over the expected average remaining working lives of the employees participating in the plan.
Past service cost is recognized in profit or loss on a straight-line basis over the average period until the benefits become vested. To the extent that the benefits are already vested immediately following the introduction of, or changes to, a defined benefit plan, vested past service cost is recognized in profit or loss immediately.
The defined benefit asset or liability corresponds to the present value of the defined benefit obligation less the unrecognized past service cost, the fair value of pension plan assets and unamortized actuarial losses, plus unamortized actuarial gains. The value of any asset is limited to the total of actuarial losses, the unrecognized past service cost and the present value of any economic benefits available in the form of refunds from the plans or reductions in future contributions to the pension plans.
The defined benefit pension plan liability is recognized under “Defined benefit plan liabilities” in the Consolidated Statements of Financial Position.
CCD’s share in the cost recognized and the liability for the defined benefit group pension plans of Desjardins Group is determined based on the pensionable salaries of CCD as a percentage of total pensionable salaries for Desjardins Group as a whole.
otheR PLAns
CCD also offers medical, dental and life insurance coverage to retiring employees and their dependents through unfunded plans. The defined benefit group plan of Desjardins Group is the main plan in which CCD participates. The terms of these plans are such that future changes in salary levels or health costs will have an impact on the amount of future benefits. The cost of these benefits is accrued over the service life of employees according to accounting policies similar to those used for defined benefit pension plans. CCD’s share in the cost of these group plans of Desjardins Group is determined based on the number of active insureds of CCD as a percentage of total number of active insureds for Desjardins Group as a whole.
Liabilities related to these other plans are recognized under “Defined benefit plan liabilities” in the Consolidated Statements of Financial Position.
note 02 (continued) | significant Accounting Policies
note 03 | future Accounting Changes82 2011 Annual Report | notes to the Condensed Consolidated financial statements
NOTE 03
futuRe ACCounting CHAngesThe Consolidated Financial Statements of CCD as at December 31, 2011 and the main financial measures have been prepared in accordance with IFRS. The IASB has issued new accounting standards that will apply in the coming years. Regulatory authorities also stated that early adoption of these standards will not be permitted. Future accounting changes under IFRS are the following:
IFRS 7, FINANcIAl INSTRUmENTS: dISclOSURESIn October 2010 and December 2011, the IASB issued amendments to IFRS 7, “Financial Instruments: Disclosures”. IFRS 7 is a presentation standard whose objective is to provide disclosures to enable the users to better understand and evaluate the significance of financial instruments for the entity’s financial position and performance. Since the amendments to this standard specifically concern disclosures, they have no impact on CCD’s results and financial position.
tRAnsfeRs of finAnCiAL Assets
The amendments expand the disclosure requirements for transfers of financial assets that result in derecognition. They provide greater transparency around risk exposures relating to transfers of financial assets that are not derecognized in their entirety or are derecognized in their entirety, but with which the entity continues to have some continuing involvement, as well as about the effect of those risks on the entity’s financial position. CCD will have to apply these amendments prospectively for the year beginning January 1, 2012.
offsettinG of finAnCiAL Assets And LiABiLities
The amendments improve the disclosure requirements with respect to offsetting of financial assets and liabilities. The objective of these amendments is to help users of financial statements better evaluate the impact of netting agreements on the financial position of an entity and understand how an entity manages the credit risk associated with such agreements. CCD will have to apply these amendments retrospectively for the year beginning January 1, 2013.
IFRS 9, FINANcIAl INSTRUmENTSThe IASB issued in November 2009 and amended in October 2010 the first phase of a project that will replace International Accounting Standard (IAS) 39, “Financial Instruments: Recognition and Measurement” (IAS 39). This standard defines a new way to classify and measure financial assets and liabilities. Financial assets will be classified in three categories (amortized cost, fair value through profit or loss and fair value through equity) based on the entity’s business model to manage its financial assets and the contractual cash flow characteristics of the financial assets. Financial liabilities will be classified in the same categories as those defined in IAS 39, but measurement of financial liabilities under the fair value option has been modified. Impairment of financial asset methodology and hedging activities will be covered in future phases that will complete IFRS 9.
CCD is currently assessing the impact of the adoption of IFRS 9. Since the impact of the adoption depends on the financial instruments held by CCD on the date of adoption, we cannot quantify it. The application of all phases of the standard is expected for the years beginning on or after January 1, 2015, on a prospective basis. Upon adoption, additional disclosures will have to be provided on the transition from IAS 39 to IFRS 9 to help users of financial statements understand the impact of the first-time adoption of IFRS 9 on the classification and measurement of financial instruments.
IFRS 10, cONSOlIdATEd FINANcIAl STATEmENTS In May 2011, the IASB issued IFRS 10, “Consolidated Financial Statements”, which defines the principle of control and establishes that control serves as the basis to determine which entities are included in the scope of consolidation. This new standard replaces the requirements on consolidated financial statements included in IAS 27, “Consolidated and Separate Financial Statements”, and SIC 12, “Consolidation – Special Purpose Entities”.
CCD is currently assessing the impact of the adoption of this new standard, which applies retrospectively to annual periods beginning on or after January 1, 2013.
IFRS 12, dISclOSURE OF INTERESTS IN OThER ENTITIESIn May 2011, the IASB issued IFRS 12, “Disclosure of Interests in Other Entities”, which expands disclosure requirements for interests held by an entity in subsidiaries, joint arrangements, associates and unconsolidated structured entities. Some of the disclosures were already required by the current standards, while others are new, such as the significant judgments and assumptions the entity has made in determining the nature of its interests in another entity as well as the nature of, and risks associated with, its interests in other entities.
CCD is currently assessing the impact of the adoption of this new standard, which applies retrospectively to annual periods beginning on or after January 1, 2013.
note 03 (continued) | future Accounting Changes notes to the Condensed Consolidated financial statements | 2011 Annual Report 83
IFRS 13, FAIR vAlUE mEASUREmENTIn May 2011, the IASB issued IFRS 13, “Fair Value Measurement”, which defines fair value, sets out a single framework for measuring the fair value of all transactions and balances for which IFRS require or permit fair value measurement and prescribes disclosures for fair value measurements. This standard aims at improving the consistency between the fair value definitions appearing in the various existing standards. In addition, it carries forward disclosure requirements concerning the fair value of financial instruments and expands their scope to all items measured at fair value.
CCD is currently assessing the impact of the adoption of this new standard, which applies prospectively to annual periods beginning on or after January 1, 2013.
IAS 1, PRESENTATION OF FINANcIAl STATEmENTSIn June 2011, the IASB issued amendments to IAS 1, “Presentation of Financial Statements”, which improve the presentation of items of other comprehensive income. The amendments require the presentation by nature of items of other comprehensive income by distinguishing those that will not be reclassified to the statement of income in a subsequent period from those that will. CCD is currently assessing the impact of the adoption of this newstandard.TheeffectivedateofthisstandardisJuly1,2012;CCDwillthereforeapplyretrospectivelytheseamendmentstotheyearbeginningJanuary 1, 2013.
IAS 19, EmPlOyEE bENEFITSIn June 2011, the IASB issued an amended version of IAS 19, “Employee Benefits”, which requires that the funding status of a defined benefit plan be entirely reflected in the statement of financial position. This change therefore eliminates the option to defer the recognition of actuarial gains and losses, known as the “corridor approach”. All actuarial gains and losses will now be recognized immediately in other comprehensive income. The presentation and recognition of changes in the defined benefit plan obligation and plan assets will be modified, and disclosures about the characteristics of defined benefit plans and the risks to which an entity is exposed through its participation in such plans will be enhanced.
CCD is currently assessing the impact of the adoption of this new standard. It will have to apply retrospectively the amended version of IAS 19 to the year beginning January 1, 2013.
IAS 32, FINANcIAl INSTRUmENTS: PRESENTATIONIn December 2011, the IASB issued amendments to IAS 32, “Financial Instruments: Presentation”, to clarify the criteria for offsetting a financial asset and a financial liability.
CCD will have to apply these amendments retrospectively for the year beginning January 1, 2014.
NOTE 04
impACt of ifRs AdoptionSince January 1, 2011, the Consolidated Financial Statements of CCD have been prepared in accordance with IFRS, as stated in Note 2, “Significant accounting policies”. Previously, CCD issued financial statements prepared in accordance with Canadian GAAP, which have been carried forward in Part V of the CICA Handbook – Accounting.
When preparing its financial statements, CCD prepared a Consolidated Statement of Financial Position as at January 1, 2010, its date of transition to IFRS. This Note 4, “Impact of IFRS Adoption”, presents the primary adjustments made by CCD to restate its Consolidated Statements of Financial Position under Canadian GAAP as at January 1, 2010 and December 31, 2010, and its Consolidated Statement of Income and Consolidated Statement of Comprehensive Income for the year ended December 31, 2010.
IFRS were applied retrospectively, with the exception of certain optional exemptions and exceptions under IFRS 1. The effects of this change of accounting framework and the methods used to calculate them are presented on the following pages.
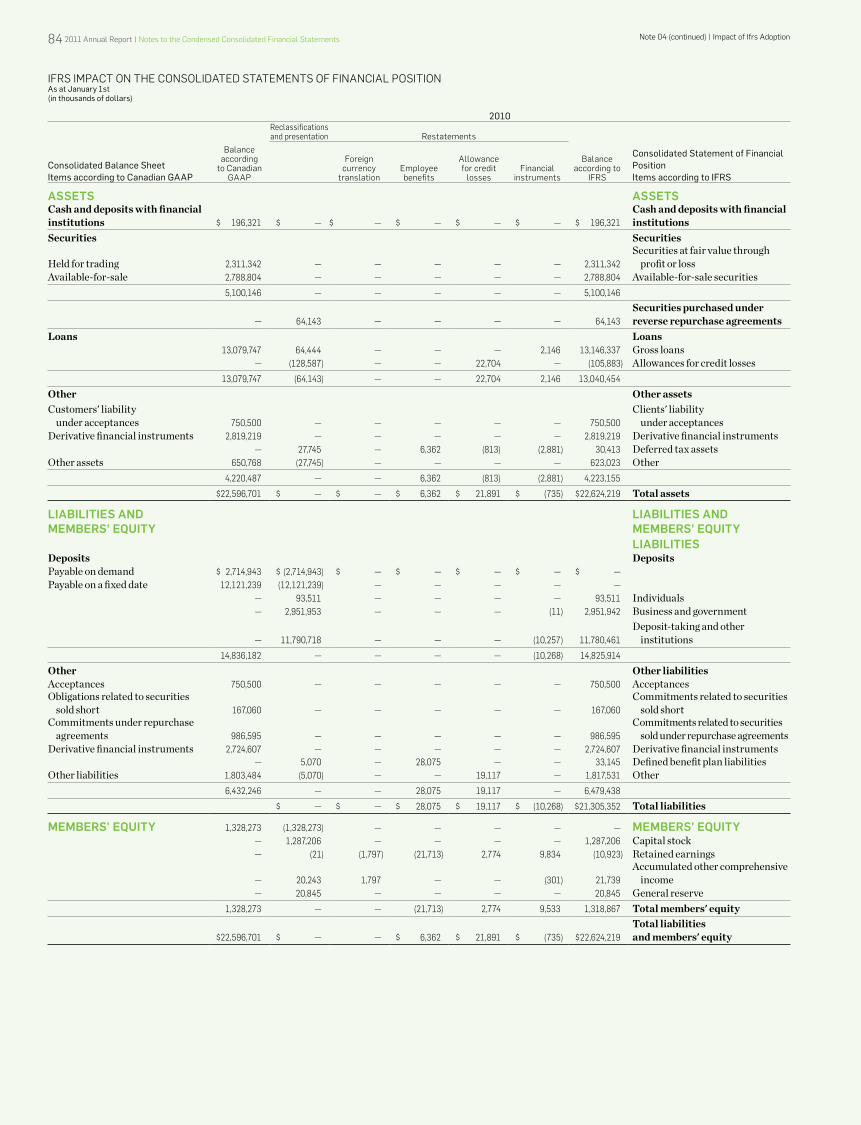
84 2011 Annual Report | notes to the Condensed Consolidated financial statements
ifRs iMPACt on the ConsoLidAted stAteMents of finAnCiAL Position As at January 1st (in thousands of dollars)
2010
Consolidated Balance Sheet Items according to Canadian GAAP
Reclassifications and presentation Restatements
Consolidated Statement of Financial PositionItems according to IFRS
Balance according
to Canadian GAAP
foreign currency
translationemployee benefits
Allowance for credit
lossesfinancial
instruments
Balance according to
ifRs
ASSETS ASSETSCash and deposits with financial institutions $ 196,321 $ — $ — $ — $ — $ — $ 196,321
Cash and deposits with financial institutions
Securities Securities
Held for trading 2,311,342 — — — — — 2,311,342 Securities at fair value through
profit or lossAvailable-for-sale 2,788,804 — — — — — 2,788,804 Available-for-sale securities
5,100,146 — — — — — 5,100,146
— 64,143 — — — — 64,143 Securities purchased under reverse repurchase agreements
Loans Loans 13,079,747 64,444 — — — 2,146 13,146,337 Gross loans
— (128,587) — — 22,704 — (105,883) Allowances for credit losses 13,079,747 (64,143) — — 22,704 2,146 13,040,454
Other Other assetsCustomers' liability
under acceptances 750,500 — — — — — 750,500 Clients' liability
under acceptancesDerivative financial instruments 2,819,219 — — — — — 2,819,219 Derivative financial instruments
— 27,745 — 6,362 (813) (2,881) 30,413 Deferred tax assetsOther assets 650,768 (27,745) — — — — 623,023 Other
4,220,487 — — 6,362 (813) (2,881) 4,223,155
$ 22,596,701 $ — $ — $ 6,362 $ 21,891 $ (735) $ 22,624,219 Total assets
LIABILITIES AND MEMBERS' EQUITY
LIABILITIES AND MEMBERS' EQUITYLIABILITIES
Deposits DepositsPayable on demand $ 2,714,943 $ (2,714,943) $ — $ — $ — $ — $ —Payable on a fixed date 12,121,239 (12,121,239) — — — — —
— 93,511 — — — — 93,511 Individuals— 2,951,953 — — — (11) 2,951,942 Business and government
— 11,790,718 — — — (10,257) 11,780,461 Deposit-taking and other
institutions 14,836,182 — — — — (10,268) 14,825,914
Other Other liabilitiesAcceptances 750,500 — — — — — 750,500 AcceptancesObligations related to securities
sold short 167,060 — — — — — 167,060 Commitments related to securities
sold shortCommitments under repurchase
agreements 986,595 — — — — — 986,595 Commitments related to securities
sold under repurchase agreementsDerivative financial instruments 2,724,607 — — — — — 2,724,607 Derivative financial instruments
— 5,070 — 28,075 — — 33,145 Defined benefit plan liabilitiesOther liabilities 1,803,484 (5,070) — — 19,117 — 1,817,531 Other
6,432,246 — — 28,075 19,117 — 6,479,438
$ — $ — $ 28,075 $ 19,117 $ (10,268) $21,305,352 Total liabilities
MEMBERS' EQUITY 1,328,273 (1,328,273) — — — — — MEMBERS' EQUITY— 1,287,206 — — — — 1,287,206 Capital stock— (21) (1,797) (21,713) 2,774 9,834 (10,923) Retained earnings
— 20,243 1,797 — — (301) 21,739 Accumulated other comprehensive
income— 20,845 — — — — 20,845 General reserve
1,328,273 — — (21,713) 2,774 9,533 1,318,867 Total members' equity
$ 22,596,701 $ — — $ 6,362 $ 21,891 $ (735) $ 22,624,219 Total liabilities and members' equity
note 04 (continued) | impact of ifrs Adoption
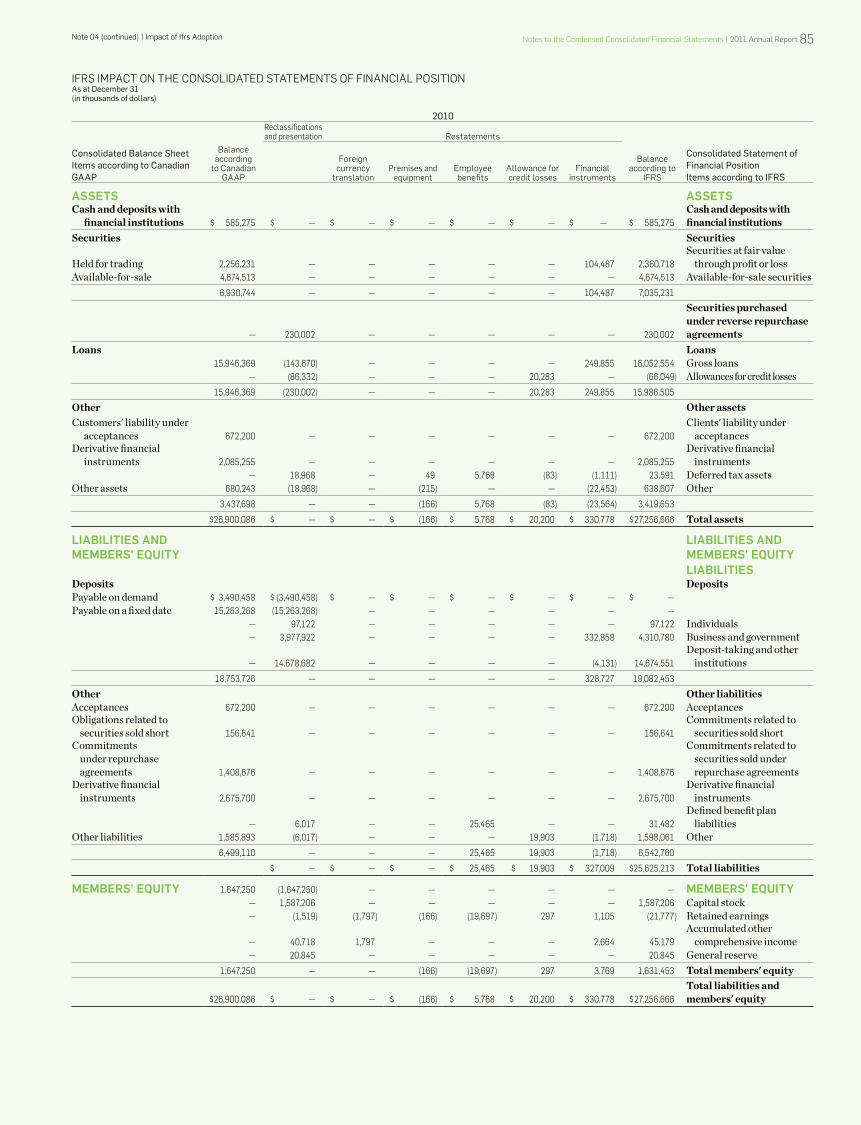
notes to the Condensed Consolidated financial statements | 2011 Annual Report 85
ifRs iMPACt on the ConsoLidAted stAteMents of finAnCiAL Position As at December 31 (in thousands of dollars)
2010
Consolidated Balance SheetItems according to Canadian GAAP
Reclassifications and presentation Restatements
Consolidated Statement of Financial PositionItems according to IFRS
Balance according
to Canadian GAAP
foreign currency
translationPremises and
equipmentemployee benefits
Allowance for credit losses
financial instruments
Balance according to
ifRs
ASSETS ASSETSCash and deposits with financial institutions $ 585,275 $ — $ — $ — $ — $ — $ — $ 585,275
Cash and deposits with financial institutions
Securities Securities
Held for trading 2,256,231 — — — — — 104,487 2,360,718 Securities at fair value
through profit or lossAvailable-for-sale 4,674,513 — — — — — — 4,674,513 Available-for-sale securities
6,930,744 — — — — — 104,487 7,035,231
— 230,002 — — — — — 230,002
Securities purchased under reverse repurchase agreements
Loans Loans 15,946,369 (143,670) — — — — 249,855 16,052,554 Gross loans
— (86,332) — — — 20,283 — (66,049) Allowances for credit losses 15,946,369 (230,002) — — — 20,283 249,855 15,986,505
Other Other assetsCustomers' liability under
acceptances 672,200 — — — — — — 672,200 Clients' liability under
acceptancesDerivative financial instruments 2,085,255 — — — — — — 2,085,255
Derivative financial instruments
— 18,968 — 49 5,768 (83) (1,111) 23,591 Deferred tax assetsOther assets 680,243 (18,968) — (215) — — (22,453) 638,607 Other
3,437,698 — — (166) 5,768 (83) (23,564) 3,419,653
$26,900,086 $ — $ — $ (166) $ 5,768 $ 20,200 $ 330,778 $ 27,256,666 Total assets
LIABILITIES AND MEMBERS' EQUITY
LIABILITIES AND MEMBERS' EQUITYLIABILITIES
Deposits DepositsPayable on demand $ 3,490,458 $ (3,490,458) $ — $ — $ — $ — $ — $ —Payable on a fixed date 15,263,268 (15,263,268) — — — — — —
— 97,122 — — — — — 97,122 Individuals— 3,977,922 — — — — 332,858 4,310,780 Business and government
— 14,678,682 — — — — (4,131) 14,674,551 Deposit-taking and other
institutions 18,753,726 — — — — — 328,727 19,082,453
Other Other liabilitiesAcceptances 672,200 — — — — — — 672,200 AcceptancesObligations related to
securities sold short 156,641 — — — — — — 156,641 Commitments related to
securities sold shortCommitments
under repurchase agreements 1,408,676 — — — — — — 1,408,676
Commitments related to securities sold under repurchase agreements
Derivative financial instruments 2,675,700 — — — — — — 2,675,700
Derivative financial instruments
— 6,017 — — 25,465 — — 31,482 Defined benefit plan
liabilitiesOther liabilities 1,585,893 (6,017) — — — 19,903 (1,718) 1,598,061 Other
6,499,110 — — — 25,465 19,903 (1,718) 6,542,760
$ — $ — $ — $ 25,465 $ 19,903 $ 327,009 $ 25,625,213 Total liabilities
MEMBERS' EQUITY 1,647,250 (1,647,250) — — — — — — MEMBERS' EQUITY— 1,587,206 — — — — — 1,587,206 Capital stock— (1,519) (1,797) (166) (19,697) 297 1,105 (21,777) Retained earnings
— 40,718 1,797 — — — 2,664 45,179 Accumulated other
comprehensive income— 20,845 — — — — — 20,845 General reserve
1,647,250 — — (166) (19,697) 297 3,769 1,631,453 Total members' equity
$26,900,086 $ — $ — $ (166) $ 5,768 $ 20,200 $ 330,778 $ 27,256,666 Total liabilities and members' equity
note 04 (continued) | impact of ifrs Adoption
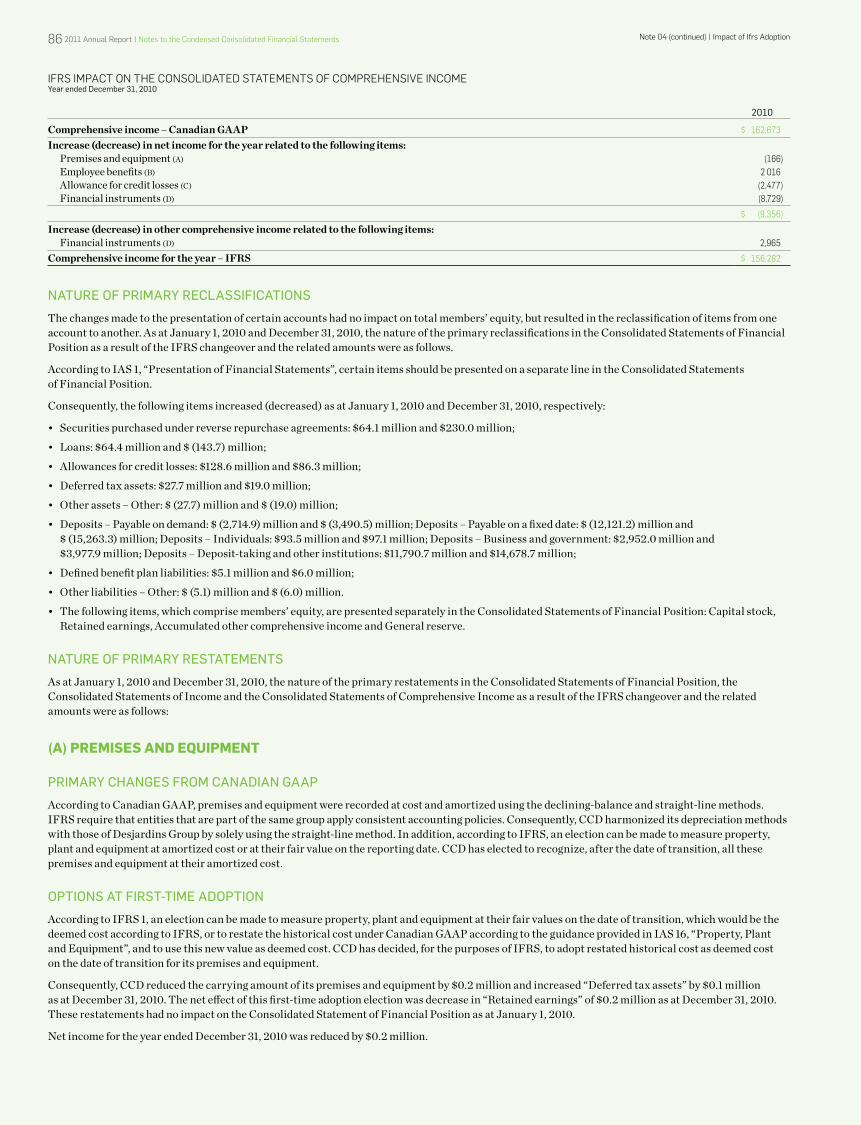
86 2011 Annual Report | notes to the Condensed Consolidated financial statements
ifRs iMPACt on the ConsoLidAted stAteMents of CoMPRehensiVe inCoMe Year ended December 31, 2010
2010
Comprehensive income – Canadian GAAP $ 162,673
Increase (decrease) in net income for the year related to the following items:Premises and equipment (A) (166)Employee benefits (B) 2 016Allowance for credit losses (C) (2,477)Financial instruments (D) (8,729)
$ (9,356)
Increase (decrease) in other comprehensive income related to the following items: Financial instruments (D) 2,965
Comprehensive income for the year – IFRS $ 156,282
naTure of primary reClassifiCaTions
The changes made to the presentation of certain accounts had no impact on total members’ equity, but resulted in the reclassification of items from one account to another. As at January 1, 2010 and December 31, 2010, the nature of the primary reclassifications in the Consolidated Statements of Financial Position as a result of the IFRS changeover and the related amounts were as follows.
According to IAS 1, “Presentation of Financial Statements”, certain items should be presented on a separate line in the Consolidated Statements of Financial Position.
Consequently, the following items increased (decreased) as at January 1, 2010 and December 31, 2010, respectively:
• Securitiespurchasedunderreverserepurchaseagreements:$64.1millionand$230.0million;
• Loans:$64.4millionand$(143.7)million;
• Allowancesforcreditlosses:$128.6millionand$86.3million;
• Deferredtaxassets:$27.7millionand$19.0million;
• Otherassets–Other:$(27.7)millionand$(19.0)million;
• Deposits–Payableondemand:$(2,714.9)millionand$(3,490.5)million;Deposits–Payableonafixeddate:$(12,121.2)millionand$ (15,263.3) million;Deposits–Individuals:$93.5millionand$97.1million;Deposits–Businessandgovernment:$2,952.0millionand$3,977.9 million;Deposits–Deposit-takingandotherinstitutions:$11,790.7millionand$14,678.7million;
• Definedbenefitplanliabilities:$5.1millionand$6.0million;
• Otherliabilities–Other:$(5.1)millionand$(6.0)million.
• Thefollowingitems,whichcomprisemembers’equity,arepresentedseparatelyintheConsolidatedStatementsofFinancialPosition:Capitalstock,Retained earnings, Accumulated other comprehensive income and General reserve.
naTure of primary resTaTemenTs
As at January 1, 2010 and December 31, 2010, the nature of the primary restatements in the Consolidated Statements of Financial Position, the Consolidated Statements of Income and the Consolidated Statements of Comprehensive Income as a result of the IFRS changeover and the related amounts were as follows:
(A) PREmISES ANd EqUIPmENT
primary Changes from CanaDian gaap
According to Canadian GAAP, premises and equipment were recorded at cost and amortized using the declining-balance and straight-line methods. IFRS require that entities that are part of the same group apply consistent accounting policies. Consequently, CCD harmonized its depreciation methods with those of Desjardins Group by solely using the straight-line method. In addition, according to IFRS, an election can be made to measure property, plant and equipment at amortized cost or at their fair value on the reporting date. CCD has elected to recognize, after the date of transition, all these premises and equipment at their amortized cost.
opTions aT firsT-Time aDopTion
According to IFRS 1, an election can be made to measure property, plant and equipment at their fair values on the date of transition, which would be the deemed cost according to IFRS, or to restate the historical cost under Canadian GAAP according to the guidance provided in IAS 16, “Property, Plant and Equipment”, and to use this new value as deemed cost. CCD has decided, for the purposes of IFRS, to adopt restated historical cost as deemed cost on the date of transition for its premises and equipment.
Consequently, CCD reduced the carrying amount of its premises and equipment by $0.2 million and increased “Deferred tax assets” by $0.1 million as at December 31, 2010. The net effect of this first-time adoption election was decrease in “Retained earnings” of $0.2 million as at December 31, 2010. These restatements had no impact on the Consolidated Statement of Financial Position as at January 1, 2010.
Net income for the year ended December 31, 2010 was reduced by $0.2 million.
note 04 (continued) | impact of ifrs Adoption
notes to the Condensed Consolidated financial statements | 2011 Annual Report 87
(b) EmPlOyEE bENEFITS
primary Changes from CanaDian gaap
According to Canadian GAAP, no assets or liabilities were recognized by CCD for the defined benefit employee plans offered to most Desjardins Group employees because these plans were accounted for by participating employers as defined contribution plans. According to IFRS, defined benefit plans in which the majority of Desjardins Group employers participate correspond to defined benefit group plans and must be accounted for according to the recommendations of IAS 19, “Employee Benefits”. Consequently, CCD must account for its share of the defined benefit plan obligation. This share is calculated based on the pensionable salaries as a percentage of total pensionable salaries for Desjardins Group as a whole, which is consistent with the Desjardins Practice regarding the funding needs of its defined benefit plans.
In addition, according to Canadian GAAP, the accrued benefit obligation was measured as at September 30, three months before the reporting date for the Consolidated Financial Statements. According to IFRS, the defined benefit obligation is measured as at the reporting date for the Consolidated Financial Statements.
opTions aT firsT-Time aDopTion
According to IFRS 1, CCD elected to use the optional exemption offered which allows an IFRS first-time adopter to depart from the retrospective application principle of IAS 19, “Employee Benefits”, and the optional exemption related to the presentation in Note 20, “Defined benefit plans”, of historical data summaries for periods prior to 2010.
As a result, on the date of transition, CCD charged all unamortized cumulative net actuarial losses to “Retained earnings”. Consequently, “Defined benefit plan liabilities” and “Deferred tax assets” increased respectively by $28.1 million and $6.4 million as at January 1, 2010 and $25.5 million and $5.8 million as at December 31, 2010. The net effect of this first-time adoption election was a reduction in “Retained earnings” of $21.7 million as at January 1, 2010 and $19.7 million as at December 31, 2010.
These adjustments had an impact of $2.0 million on net income for the year ended December 31, 2010.
(c) AllOwANcE FOR cREdIT lOSSES
CoLLeCtiVe ALLowAnCes foR CRedit Losses
primary Changes from CanaDian gaap
According to Canadian GAAP, general allowances are recognized to reflect management’s best estimate of probable losses related to the portion of the loan portfolio not yet subject to a specific allowance. Collective allowances are first determined by using a statistical model based on changes in losses by loan category. Moreover, an additional amount is taken into account in order to reflect the impact of economic and other factors.
According to IFRS, collective allowances include cumulative allowances for losses that are deemed to have occurred but that cannot be determined on an individual basis or cannot be detected yet. Collective allowances depend on an assessment of economic conditions, loss statistics and forecasts, the composition of the loan portfolio and other relevant indicators. Collective allowances must be classified in two categories in the Consolidated Statements of Financial Position depending on the accounting consideration for the credit facilities. Thus, the allowance generated by the outstanding amount of loans and credit margins must be presented in assets, while the allowance generated by off-balance sheet commitments must be presented separately in liabilities.
indiViduAL ALLowAnCes foR CRedit Losses
primary Changes from CanaDian gaap
According to its current accounting policy and to IFRS, CCD establishes specific allowances separately for each of the loans considered as impaired. Individually material loans are reviewed at the end of each period in order to determine whether there is any objective evidence of impairment for which a loss should be recognized in profit or loss.
Because of the adjustments made to the models underlying the measurement of the collective allowances, “Allowances for credit losses” and “Deferred tax assets” decreased respectively by $22.7 million and $0.8 million as at January 1, 2010 and $20.3 million and $0.1 million as at December 31, 2010. On the other hand, “Other liabilities” and “Retained earnings” increased respectively by $19.1 million and $2.8 million as at January 1, 2010 and $19.9 million and $0.3 million as at December 31, 2010.
Net income for the year ended December 31, 2010 was reduced by $2.5 million.
note 04 (continued) | impact of ifrs Adoption
88 2011 Annual Report | notes to the Condensed Consolidated financial statements
(d) FINANcIAl INSTRUmENTS
seCuRitizAtion of MoRtGAGe LoAns
primary Changes from CanaDian gaap
CCD transfers mortgage loans to the Canada Housing Trust. Even though, according to Canadian GAAP, these securitization transactions were recognized as transfers of receivables, they do not meet IFRS derecognition criteria. According to Canadian GAAP, the derecognition criteria for a financial asset were based on control or, more specifically, on the surrender of control. According to IFRS, an assessment must be made of a set of criteria based mainly on the transfer of risks and rewards as well as control of the financial asset.
opTions aT firsT-Time aDopTion
According to IFRS 1, which was amended in December 2010, at the date of transition to IFRS an enterprise must apply the transitional provisions in IAS 39, “Financial Instruments: Recognition and Measurement”, which provide for prospective treatment of its provisions to financial asset transfer transactions occurring on or after the date of transition. This standard applies to years beginning on or after July 1, 2011, and early adoption is allowed. Following approval from the AMF, CCD elected for early adoption of this amendment and applied it when preparing its Consolidated Statement of Financial Position as at January 1, 2010.
As a result, no restatement was recognized in the Consolidated Statement of Financial Position as at January 1, 2010. However, all transfers of loans carried out after January 1, 2010, and for which the IFRS derecognition criteria are not met must be maintained in assets with a corresponding debt to the acquirer. Any difference between the amount of the asset maintained and the liability recognized was recognized in profit or loss.
However, the Consolidated Statement of Financial Position as at December 31, 2010 was restated. Accordingly, “Securities”, “Loans”, “Deferred tax assets” and “Other assets – Other” increased (decreased) respectively by $104.5 million, $243.3 million, $1.3 million and ($22.5 million) as at December 31, 2010. On the other hand, “Deposits”, “Other liabilities – Other” and “Retained earnings” increased (decreased) respectively by $332.9 million, ($1.7 million) and ($4.5 million) as at December 31, 2010. Net income for the year ended December 31, 2010 was reduced by $4.5 million.
hedGinG ReLAtionshiPs
primary Changes from CanaDian gaap
In accordance with Canadian GAAP and in certain circumstances, CCD has used the change in variable cash flow method and the shortcut method to measure the effectiveness of hedging relationships. IFRS does not permit the use of either of these methods. In order to comply with the new requirements, CCD has developed substitute methods that may nevertheless increase the volatility of results in the Consolidated Statements of Income. However,certainhedgingrelationshipswerealreadyusingmethodsthatareacceptableunderIFRS;theyhavenotbeenmodifiedanddidnotrequireanyadjustments on the transition date.
The cumulative impact of using new methods to test the effectiveness of CCD’s hedging relationships has been recognized by increasing (decreasing) “Retained earnings” and “Accumulated other comprehensive income” by $8.9 million and ($0.3 million) as at January 1, 2010 and $3.9 million and $2.7 million as at December 31, 2010. On the other hand, “Deferred tax assets” and “Deposits” have respectively been reduced by ($2.6 million) and ($10.3 million) as at January 1, 2010 and ($1.9 million) and ($4.1 million) as at December 31, 2010, while “Loans” have been increased by $0.9 million as at January 1, 2010 and $4.4 million as at December 31, 2010.
Net income for the year ended December 31, 2010 was reduced by $5.0 million.
CLAssifiCAtion of finAnCiAL instRuMents
primary Changes from CanaDian gaap
As part of its securitization activities, CCD purchases mortgage loans from the Desjardins caisse network, and these loans are classified as “Held for trading” until they are sold. According to IFRS, however, securitization transactions no longer meet derecognition criteria. Consequently, loans acquired from the caisse network have been reclassified in the “Loans and receivables” category under IFRS.
The cumulative impact of this change was an increase in “Loans” and a decrease in “Deferred tax assets”, respectively, of $1.2 million and $0.3 million as at January 1, 2010 and $2.2 million and $0.5 million as at December 31, 2010. On the other hand, “Retained earnings” increased by $1.0 million as at January 1, 2010 and $1.7 million as at December 31, 2010. Net income for the year ended December 31, 2010 was increased by $0.7 million.
note 04 (continued) | impact of ifrs Adoption
notes to the Condensed Consolidated financial statements | 2011 Annual Report 89
(E) ImPAcT OF TRANSlATION OF FOREIGN cURRENcIES
primary Changes from CanaDian gaap
No material difference has been identified in that area between IFRS and Canadian GAAP. Even though the conceptual framework differs between these two reporting framework, the treatment for translating foreign currencies remains the same.
opTions aT firsT-Time aDopTion
CCD elected to use the optional exemption under IFRS 1 which allows cumulative translation differences to be reversed for all foreign operations at the date of transition to IFRS. Therefore, the profit or loss on a subsequent disposal of any foreign operation will need to exclude the translation differences arising before the date of transition to IFRS and include the translation differences subsequently recognized. As a result of this exemption, CCD recognized in “Retained earnings” the cumulative loss of $1.8 million that was in “Accumulated other comprehensive income” as at January 1, 2010.
aDjusTmenTs To The ConsoliDaTeD sTaTemenTs of Cash floWs
foR the yeAR ended deCeMBeR 31, 2010
The Consolidated Statements of Cash Flows have the same objectives and are based on similar principles under IFRS and under GAAP. Consequently, following the IFRS adoption, no significant adjustment had to be made to the presentation of the statement of cash flows prepared in accordance with IFRS for the year ended December, 31, 2010, except for the following:
Cash flows from net changes in “Securities purchased under reverse repurchase agreements”, “Loans”, “Deposits” and “Commitments related to securities sold under repurchase agreements” are classified in operating activities in accordance with IAS 7, “Statement of Cash Flows”, whereas they were previously classified in financing or investing activities.
Certain items have been aggregated to conform with the items presented in the Consolidated Statements of Financial Position.
note 04 (continued) | impact of ifrs Adoption
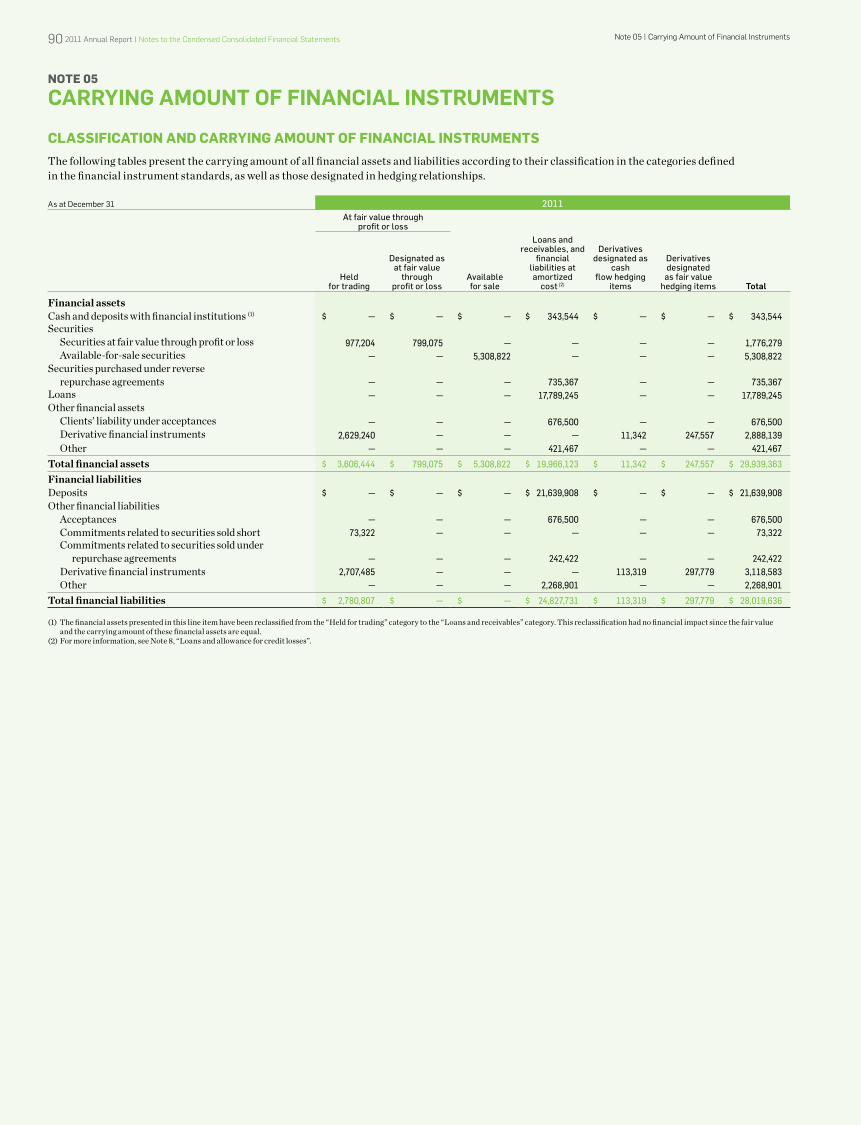
note 05 | Carrying Amount of financial instruments90 2011 Annual Report | notes to the Condensed Consolidated financial statements
NOTE 05
CARRying Amount of finAnCiAl instRuments
clASSIFIcATION ANd cARRyING AmOUNT OF FINANcIAl INSTRUmENTSThe following tables present the carrying amount of all financial assets and liabilities according to their classification in the categories defined in the financial instrument standards, as well as those designated in hedging relationships.
As at December 31 2011at fair value through
profit or loss
held for trading
Designated as at fair value
through profit or loss
availablefor sale
loans and receivables, and
financial liabilities at amortized
cost (2)
Derivatives designated as
cash flow hedging
items
Derivatives designated as fair value
hedging items Total
Financial assetsCash and deposits with financial institutions (1) $ — $ — $ — $ 343,544 $ — $ — $ 343,544Securities Securities at fair value through profit or loss 977,204 799,075 — — — — 1,776,279 Available-for-sale securities — — 5,308,822 — — — 5,308,822Securities purchased under reverse repurchase agreements — — — 735,367 — — 735,367Loans — — — 17,789,245 — — 17,789,245Other financial assets Clients’ liability under acceptances — — — 676,500 — — 676,500 Derivative financial instruments 2,629,240 — — — 11,342 247,557 2,888,139 Other — — — 421,467 — — 421,467
Total financial assets $ 3,606,444 $ 799,075 $ 5,308,822 $ 19,966,123 $ 11,342 $ 247,557 $ 29,939,363
Financial liabilitiesDeposits $ — $ — $ — $ 21,639,908 $ — $ — $ 21,639,908Other financial liabilities Acceptances — — — 676,500 — — 676,500 Commitments related to securities sold short 73,322 — — — — — 73,322 Commitments related to securities sold under repurchase agreements — — — 242,422 — — 242,422 Derivative financial instruments 2,707,485 — — — 113,319 297,779 3,118,583 Other — — — 2,268,901 — — 2,268,901
Total financial liabilities $ 2,780,807 $ — $ — $ 24,827,731 $ 113,319 $ 297,779 $ 28,019,636
(1) The financial assets presented in this line item have been reclassified from the “Held for trading” category to the “Loans and receivables” category. This reclassification had no financial impact since the fair value and the carrying amount of these financial assets are equal.
(2) For more information, see Note 8, “Loans and allowance for credit losses”.
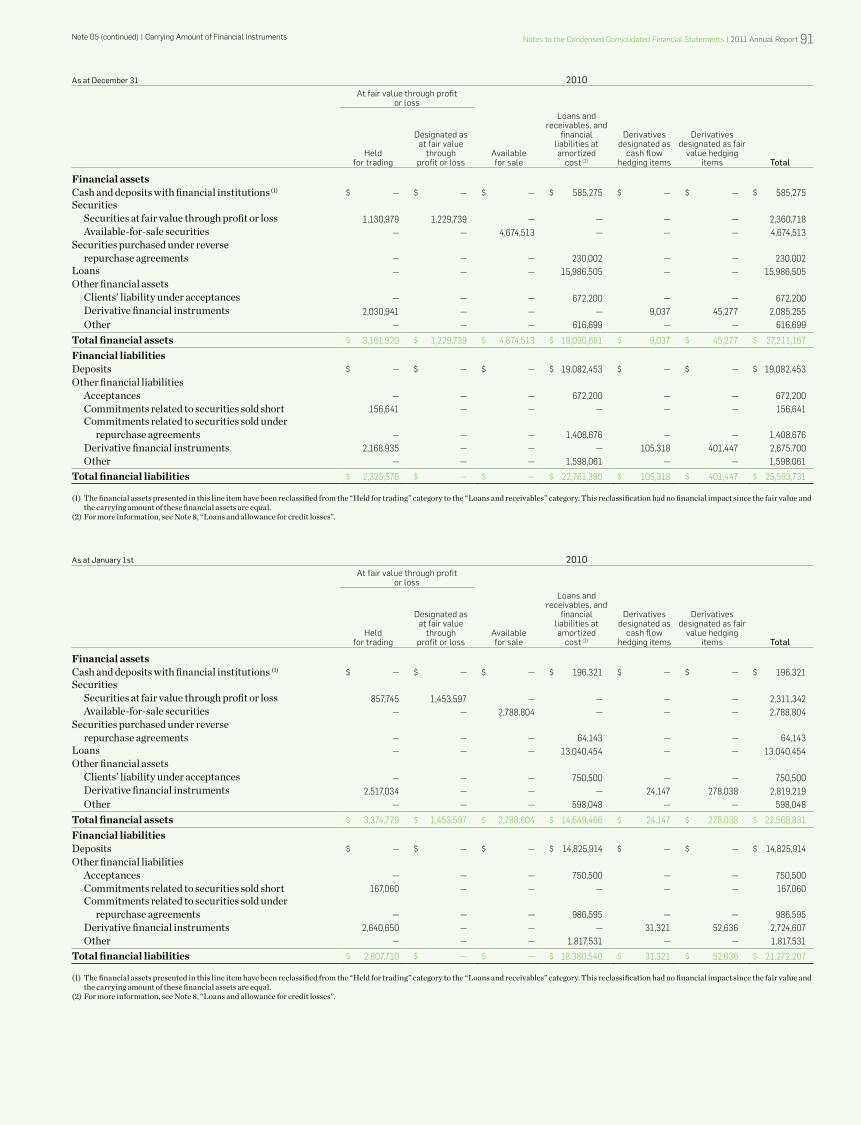
note 05 (continued) | Carrying Amount of financial instruments notes to the Condensed Consolidated financial statements | 2011 Annual Report 91
As at December 31 2010At fair value through profit
or loss
held for trading
designated as at fair value
through profit or loss
Available for sale
Loans and receivables, and
financial liabilities at amortized
cost (2)
derivatives designated as
cash flow hedging items
derivatives designated as fair
value hedging items Total
Financial assetsCash and deposits with financial institutions (1) $ — $ — $ — $ 585,275 $ — $ — $ 585,275Securities Securities at fair value through profit or loss 1,130,979 1,229,739 — — — — 2,360,718 Available-for-sale securities — — 4,674,513 — — — 4,674,513Securities purchased under reverse repurchase agreements — — — 230,002 — — 230,002Loans — — — 15,986,505 — — 15,986,505Other financial assets Clients’ liability under acceptances — — — 672,200 — — 672,200 Derivative financial instruments 2,030,941 — — — 9,037 45,277 2,085,255 Other — — — 616,699 — — 616,699
Total financial assets $ 3,161,920 $ 1,229,739 $ 4,674,513 $ 18,090,681 $ 9,037 $ 45,277 $ 27,211,167
Financial liabilitiesDeposits $ — $ — $ — $ 19,082,453 $ — $ — $ 19,082,453Other financial liabilities Acceptances — — — 672,200 — — 672,200 Commitments related to securities sold short 156,641 — — — — — 156,641 Commitments related to securities sold under repurchase agreements — — — 1,408,676 — — 1,408,676 Derivative financial instruments 2,168,935 — — — 105,318 401,447 2,675,700 Other — — — 1,598,061 — — 1,598,061
Total financial liabilities $ 2,325,576 $ — $ — $ 22,761,390 $ 105,318 $ 401,447 $ 25,593,731
(1) The financial assets presented in this line item have been reclassified from the “Held for trading” category to the “Loans and receivables” category. This reclassification had no financial impact since the fair value and the carrying amount of these financial assets are equal.
(2) For more information, see Note 8, “Loans and allowance for credit losses”.
As at January 1st 2010At fair value through profit
or loss
held for trading
designated as at fair value
through profit or loss
Available for sale
Loans and receivables, and
financial liabilities at amortized
cost (2)
derivatives designated as
cash flow hedging items
derivatives designated as fair
value hedging items Total
Financial assetsCash and deposits with financial institutions (1) $ — $ — $ — $ 196,321 $ — $ — $ 196,321Securities Securities at fair value through profit or loss 857,745 1,453,597 — — — — 2,311,342 Available-for-sale securities — — 2,788,804 — — — 2,788,804Securities purchased under reverse repurchase agreements — — — 64,143 — — 64,143Loans — — — 13,040,454 — — 13,040,454Other financial assets Clients’ liability under acceptances — — — 750,500 — — 750,500 Derivative financial instruments 2,517,034 — — — 24,147 278,038 2,819,219 Other — — — 598,048 — — 598,048
Total financial assets $ 3,374,779 $ 1,453,597 $ 2,788,804 $ 14,649,466 $ 24,147 $ 278,038 $ 22,568,831
Financial liabilitiesDeposits $ — $ — $ — $ 14,825,914 $ — $ — $ 14,825,914Other financial liabilities Acceptances — — — 750,500 — — 750,500 Commitments related to securities sold short 167,060 — — — — — 167,060 Commitments related to securities sold under repurchase agreements — — — 986,595 — — 986,595 Derivative financial instruments 2,640,650 — — — 31,321 52,636 2,724,607 Other — — — 1,817,531 — — 1,817,531
Total financial liabilities $ 2,807,710 $ — $ — $ 18,380,540 $ 31,321 $ 52,636 $ 21,272,207
(1) The financial assets presented in this line item have been reclassified from the “Held for trading” category to the “Loans and receivables” category. This reclassification had no financial impact since the fair value and the carrying amount of these financial assets are equal.(2) For more information, see Note 8, “Loans and allowance for credit losses”.
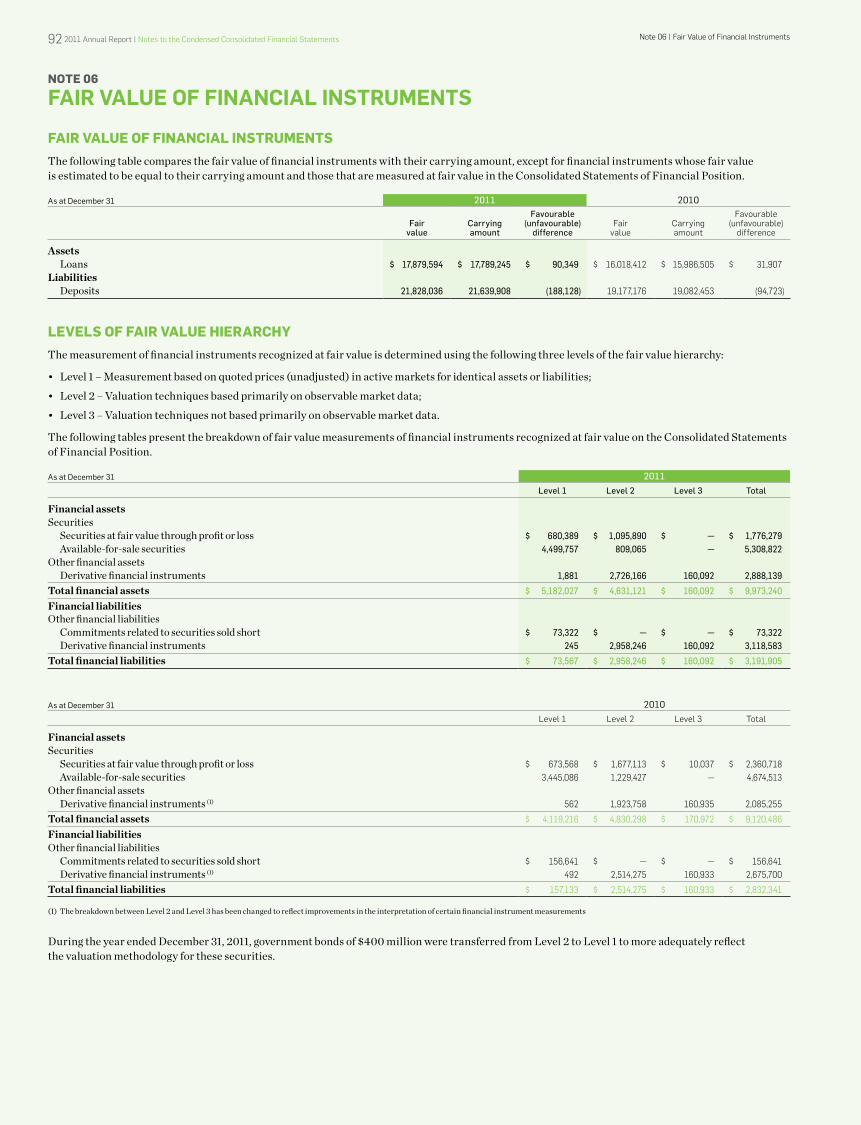
92 2011 Annual Report | notes to the Condensed Consolidated financial statements note 06 | fair Value of financial instruments
NOTE 06
fAiR VAlue of finAnCiAl instRuments
FAIR vAlUE OF FINANcIAl INSTRUmENTS The following table compares the fair value of financial instruments with their carrying amount, except for financial instruments whose fair value is estimated to be equal to their carrying amount and those that are measured at fair value in the Consolidated Statements of Financial Position.
As at December 31 2011 2010
fairvalue
Carrying amount
favourable (unfavourable)
differencefair
valueCarrying amount
favourable (unfavourable)
difference
AssetsLoans $ 17,879,594 $ 17,789,245 $ 90,349 $ 16,018,412 $ 15,986,505 $ 31,907
LiabilitiesDeposits 21,828,036 21,639,908 (188,128) 19,177,176 19,082,453 (94,723)
lEvElS OF FAIR vAlUE hIERARchyThe measurement of financial instruments recognized at fair value is determined using the following three levels of the fair value hierarchy:
• Level1–Measurementbasedonquotedprices(unadjusted)inactivemarketsforidenticalassetsorliabilities;
• Level2–Valuationtechniquesbasedprimarilyonobservablemarketdata;
• Level3–Valuationtechniquesnotbasedprimarilyonobservablemarketdata.
The following tables present the breakdown of fair value measurements of financial instruments recognized at fair value on the Consolidated Statements of Financial Position.
As at December 31 2011level 1 level 2 level 3 Total
Financial assets Securities Securities at fair value through profit or loss $ 680,389 $ 1,095,890 $ — $ 1,776,279 Available-for-sale securities 4,499,757 809,065 — 5,308,822Other financial assets
Derivative financial instruments 1,881 2,726,166 160,092 2,888,139
Total financial assets $ 5,182,027 $ 4,631,121 $ 160,092 $ 9,973,240
Financial liabilitiesOther financial liabilities
Commitments related to securities sold short $ 73,322 $ — $ — $ 73,322Derivative financial instruments 245 2,958,246 160,092 3,118,583
Total financial liabilities $ 73,567 $ 2,958,246 $ 160,092 $ 3,191,905
As at December 31 2010Level 1 Level 2 Level 3 total
Financial assets Securities Securities at fair value through profit or loss $ 673,568 $ 1,677,113 $ 10,037 $ 2,360,718 Available-for-sale securities 3,445,086 1,229,427 — 4,674,513Other financial assets
Derivative financial instruments (1) 562 1,923,758 160,935 2,085,255
Total financial assets $ 4,119,216 $ 4,830,298 $ 170,972 $ 9,120,486
Financial liabilitiesOther financial liabilities
Commitments related to securities sold short $ 156,641 $ — $ — $ 156,641Derivative financial instruments (1) 492 2,514,275 160,933 2,675,700
Total financial liabilities $ 157,133 $ 2,514,275 $ 160,933 $ 2,832,341
(1) The breakdown between Level 2 and Level 3 has been changed to reflect improvements in the interpretation of certain financial instrument measurements
During the year ended December 31, 2011, government bonds of $400 million were transferred from Level 2 to Level 1 to more adequately reflect the valuation methodology for these securities.
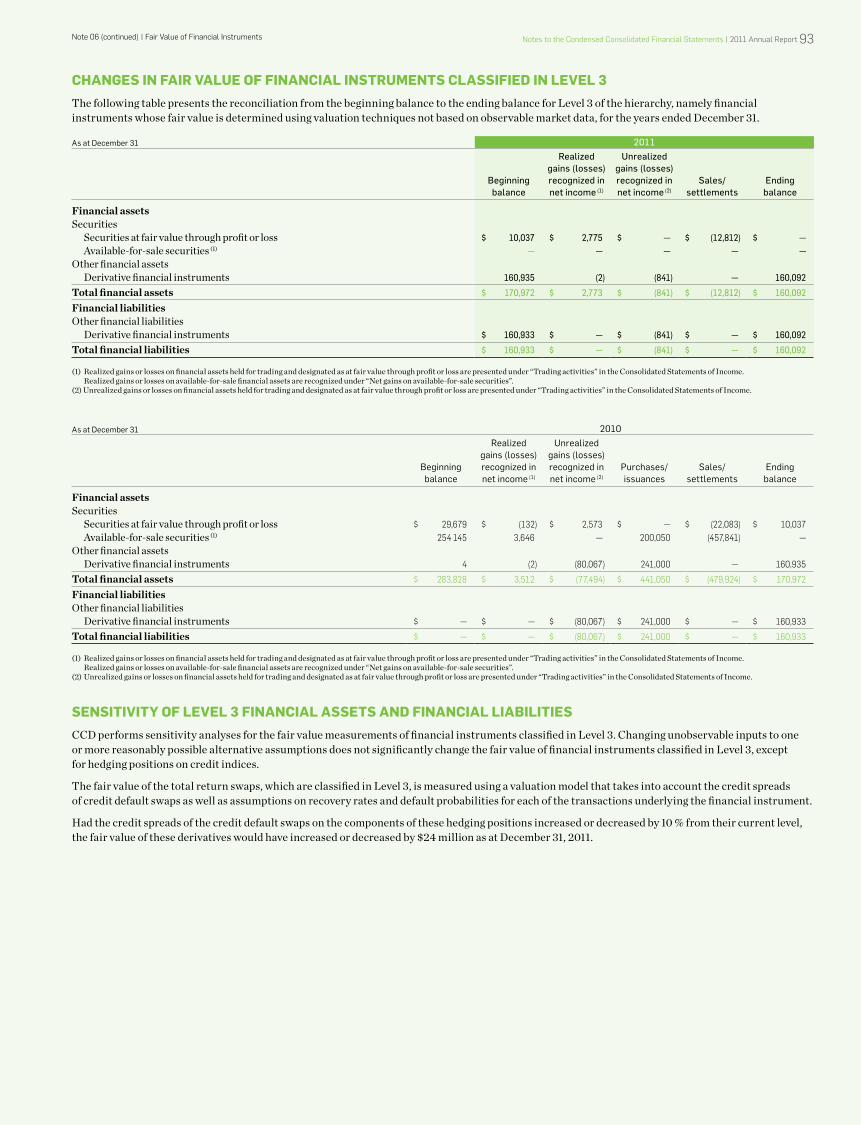
notes to the Condensed Consolidated financial statements | 2011 Annual Report 93note 06 (continued) | fair Value of financial instruments
chANGES IN FAIR vAlUE OF FINANcIAl INSTRUmENTS clASSIFIEd IN lEvEl 3The following table presents the reconciliation from the beginning balance to the ending balance for Level 3 of the hierarchy, namely financial instruments whose fair value is determined using valuation techniques not based on observable market data, for the years ended December 31.
As at December 31 2011
beginning balance
realized gains (losses) recognized in net income (1)
unrealized gains (losses) recognized in net income (2)
sales/settlements
ending balance
Financial assets Securities Securities at fair value through profit or loss $ 10,037 $ 2,775 $ — $ (12,812) $ — Available-for-sale securities (1) — — — — —Other financial assets
Derivative financial instruments 160,935 (2) (841) — 160,092
Total financial assets $ 170,972 $ 2,773 $ (841) $ (12,812) $ 160,092
Financial liabilitiesOther financial liabilities
Derivative financial instruments $ 160,933 $ — $ (841) $ — $ 160,092
Total financial liabilities $ 160,933 $ — $ (841) $ — $ 160,092
(1) Realized gains or losses on financial assets held for trading and designated as at fair value through profit or loss are presented under “Trading activities” in the Consolidated Statements of Income. Realized gains or losses on available-for-sale financial assets are recognized under “Net gains on available-for-sale securities”.(2) Unrealized gains or losses on financial assets held for trading and designated as at fair value through profit or loss are presented under “Trading activities” in the Consolidated Statements of Income.
As at December 31 2010
Beginning balance
Realized gains (losses) recognized in net income (1)
Unrealized gains (losses) recognized in net income (2)
Purchases/issuances
Sales/settlements
Ending balance
Financial assets Securities Securities at fair value through profit or loss $ 29,679 $ (132) $ 2,573 $ — $ (22,083) $ 10,037 Available-for-sale securities (1) 254 145 3,646 — 200,050 (457,841) —Other financial assets
Derivative financial instruments 4 (2) (80,067) 241,000 — 160,935
Total financial assets $ 283,828 $ 3,512 $ (77,494) $ 441,050 $ (479,924) $ 170,972
Financial liabilitiesOther financial liabilities
Derivative financial instruments $ — $ — $ (80,067) $ 241,000 $ — $ 160,933
Total financial liabilities $ — $ — $ (80,067) $ 241,000 $ — $ 160,933
(1) Realized gains or losses on financial assets held for trading and designated as at fair value through profit or loss are presented under “Trading activities” in the Consolidated Statements of Income. Realized gains or losses on available-for-sale financial assets are recognized under “Net gains on available-for-sale securities”.(2) Unrealized gains or losses on financial assets held for trading and designated as at fair value through profit or loss are presented under “Trading activities” in the Consolidated Statements of Income.
SENSITIvITy OF lEvEl 3 FINANcIAl ASSETS ANd FINANcIAl lIAbIlITIESCCD performs sensitivity analyses for the fair value measurements of financial instruments classified in Level 3. Changing unobservable inputs to one or more reasonably possible alternative assumptions does not significantly change the fair value of financial instruments classified in Level 3, except for hedging positions on credit indices.
The fair value of the total return swaps, which are classified in Level 3, is measured using a valuation model that takes into account the credit spreads of credit default swaps as well as assumptions on recovery rates and default probabilities for each of the transactions underlying the financial instrument.
Had the credit spreads of the credit default swaps on the components of these hedging positions increased or decreased by 10 % from their current level, the fair value of these derivatives would have increased or decreased by $24 million as at December 31, 2011.
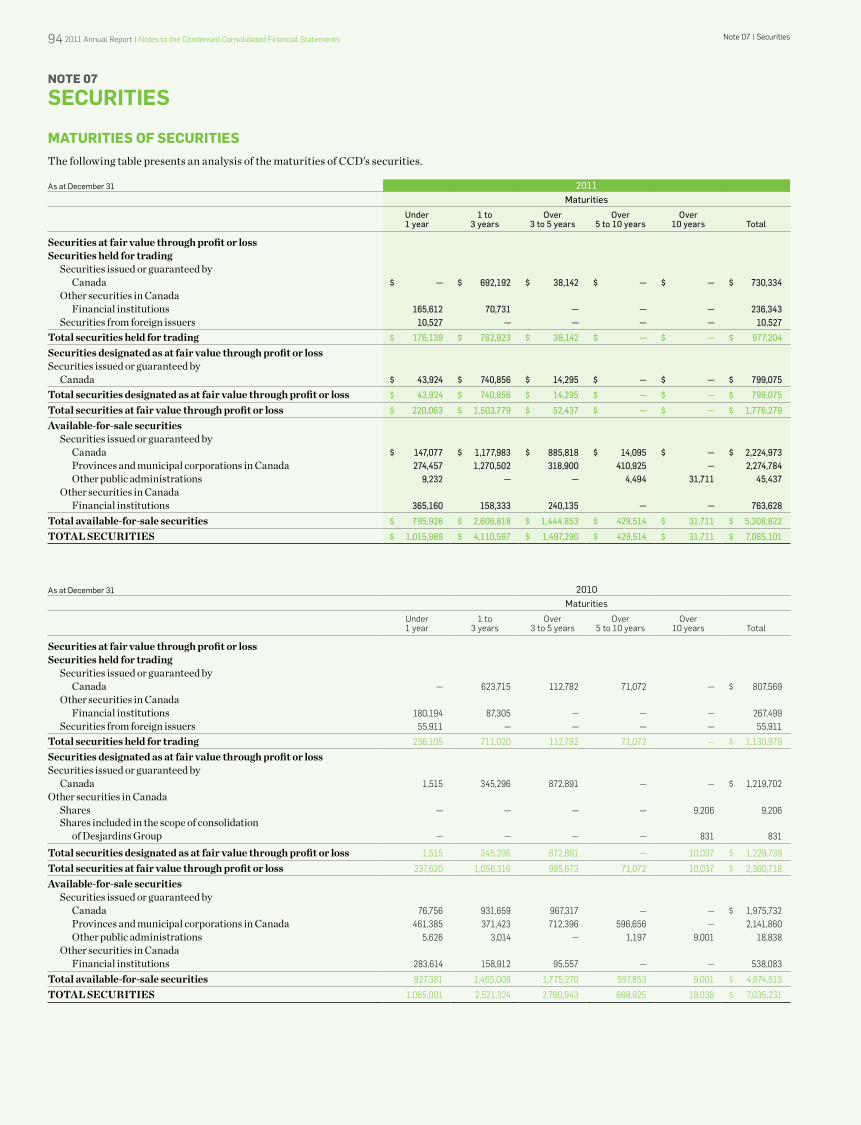
94 2011 Annual Report | notes to the Condensed Consolidated financial statements note 07 | securities
NOTE 07
seCuRities
mATURITIES OF SEcURITIESThe following table presents an analysis of the maturities of CCD’s securities.
As at December 31 2011maturities
under 1 year
1 to 3 years
over 3 to 5 years
over 5 to 10 years
over 10 years Total
Securities at fair value through profit or lossSecurities held for trading Securities issued or guaranteed by Canada $ — $ 692,192 $ 38,142 $ — $ — $ 730,334 Other securities in Canada Financial institutions 165,612 70,731 — — — 236,343
Securities from foreign issuers 10,527 — — — — 10,527
Total securities held for trading $ 176,139 $ 762,923 $ 38,142 $ — $ — $ 977,204
Securities designated as at fair value through profit or lossSecurities issued or guaranteed by
Canada $ 43,924 $ 740,856 $ 14,295 $ — $ — $ 799,075
Total securities designated as at fair value through profit or loss $ 43,924 $ 740,856 $ 14,295 $ — $ — $ 799,075
Total securities at fair value through profit or loss $ 220,063 $ 1,503,779 $ 52,437 $ — $ — $ 1,776,279
Available-for-sale securities Securities issued or guaranteed by Canada $ 147,077 $ 1,177,983 $ 885,818 $ 14,095 $ — $ 2,224,973 Provinces and municipal corporations in Canada 274,457 1,270,502 318,900 410,925 — 2,274,784 Other public administrations 9,232 — — 4,494 31,711 45,437 Other securities in Canada
Financial institutions 365,160 158,333 240,135 — — 763,628
Total available-for-sale securities $ 795,926 $ 2,606,818 $ 1,444,853 $ 429,514 $ 31,711 $ 5,308,822
TOTAL SECURITIES $ 1,015,989 $ 4,110,597 $ 1,497,290 $ 429,514 $ 31,711 $ 7,085,101
As at December 31 2010Maturities
under 1 year
1 to 3 years
over 3 to 5 years
over 5 to 10 years
over 10 years total
Securities at fair value through profit or lossSecurities held for trading Securities issued or guaranteed by Canada — 623,715 112,782 71,072 — $ 807,569 Other securities in Canada Financial institutions 180,194 87,305 — — — 267,499
Securities from foreign issuers 55,911 — — — — 55,911
Total securities held for trading 236,105 711,020 112,782 71,072 — $ 1,130,979
Securities designated as at fair value through profit or lossSecurities issued or guaranteed by
Canada 1,515 345,296 872,891 — — $ 1,219,702Other securities in Canada Shares — — — — 9,206 9,206
Shares included in the scope of consolidation of Desjardins Group — — — — 831 831
Total securities designated as at fair value through profit or loss 1,515 345,296 872,891 — 10,037 $ 1,229,739
Total securities at fair value through profit or loss 237,620 1,056,316 985,673 71,072 10,037 $ 2,360,718
Available-for-sale securities Securities issued or guaranteed by Canada 76,756 931,659 967,317 — — $ 1,975,732 Provinces and municipal corporations in Canada 461,385 371,423 712,396 596,656 — 2,141,860 Other public administrations 5,626 3,014 — 1,197 9,001 18,838 Other securities in Canada
Financial institutions 283,614 158,912 95,557 — — 538,083
Total available-for-sale securities 827,381 1,465,008 1,775,270 597,853 9,001 $ 4,674,513
TOTAL SECURITIES 1,065,001 2,521,324 2,760,943 668,925 19,038 $ 7,035,231
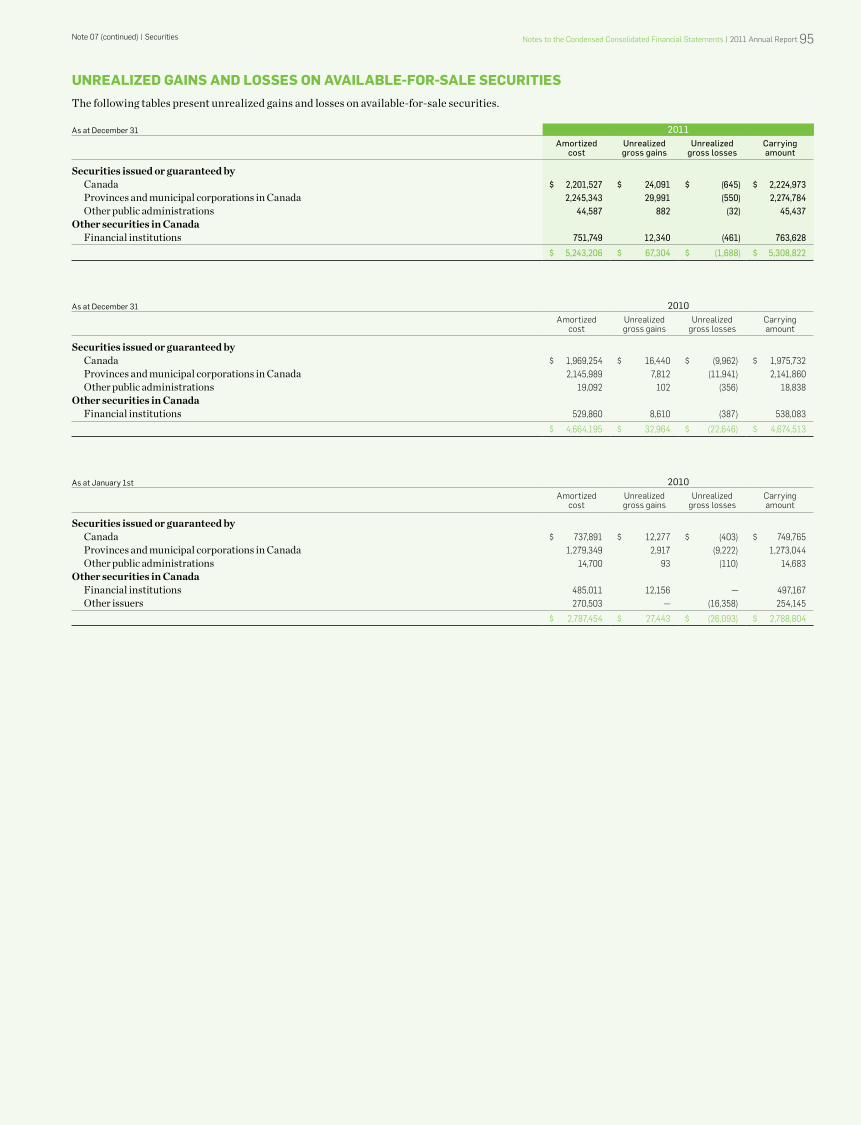
notes to the Condensed Consolidated financial statements | 2011 Annual Report 95note 07 (continued) | securities
UNREAlIzEd GAINS ANd lOSSES ON AvAIlAblE-FOR-SAlE SEcURITIESThe following tables present unrealized gains and losses on available-for-sale securities.
As at December 31 2011amortized
cost unrealized gross gains
unrealized gross losses
Carrying amount
Securities issued or guaranteed by Canada $ 2,201,527 $ 24,091 $ (645) $ 2,224,973 Provinces and municipal corporations in Canada 2,245,343 29,991 (550) 2,274,784 Other public administrations 44,587 882 (32) 45,437Other securities in Canada
Financial institutions 751,749 12,340 (461) 763,628
$ 5,243,206 $ 67,304 $ (1,688) $ 5,308,822
As at December 31 2010Amortized
cost unrealized gross gains
unrealized gross losses
Carrying amount
Securities issued or guaranteed by Canada $ 1,969,254 $ 16,440 $ (9,962) $ 1,975,732 Provinces and municipal corporations in Canada 2,145,989 7,812 (11,941) 2,141,860 Other public administrations 19,092 102 (356) 18,838Other securities in Canada
Financial institutions 529,860 8,610 (387) 538,083
$ 4,664,195 $ 32,964 $ (22,646) $ 4,674,513
As at January 1st 2010Amortized
cost unrealized gross gains
unrealized gross losses
Carrying amount
Securities issued or guaranteed by Canada $ 737,891 $ 12,277 $ (403) $ 749,765 Provinces and municipal corporations in Canada 1,279,349 2,917 (9,222) 1,273,044 Other public administrations 14,700 93 (110) 14,683Other securities in Canada
Financial institutions 485,011 12,156 — 497,167 Other issuers 270,503 — (16,358) 254,145
$ 2,787,454 $ 27,443 $ (26,093) $ 2,788,804
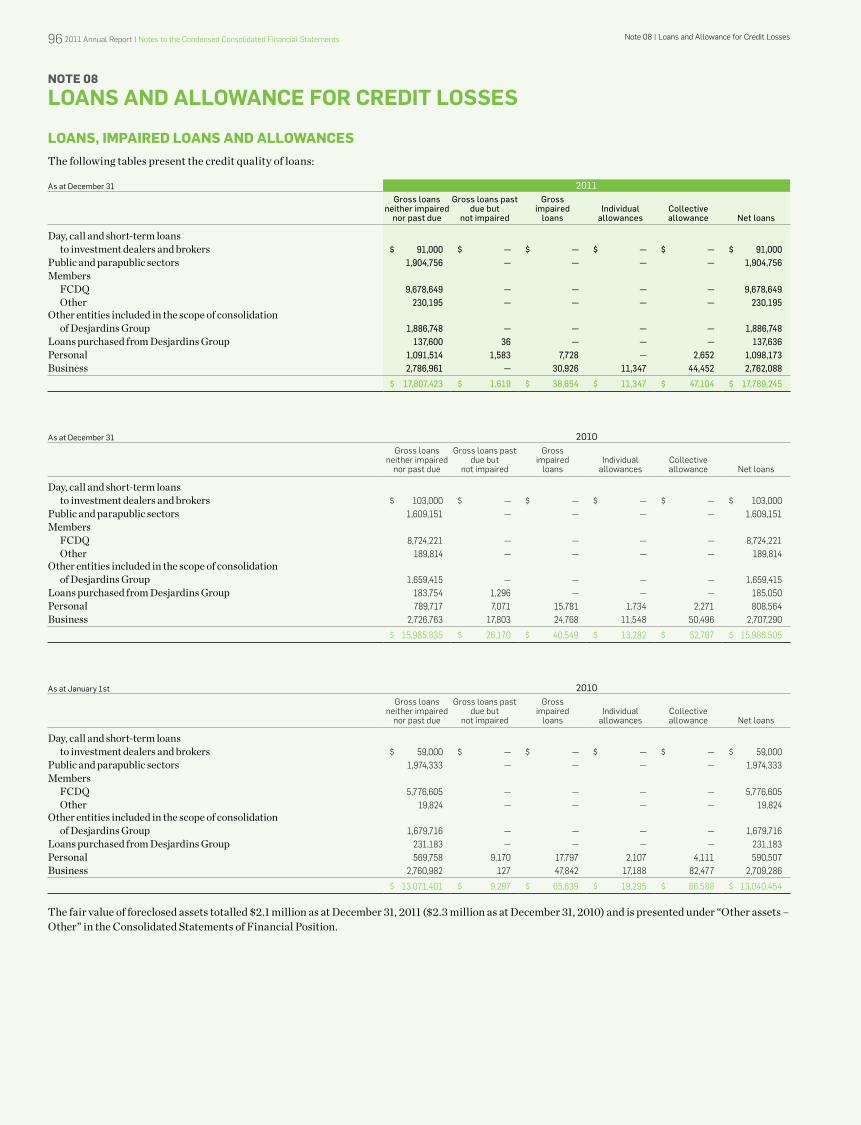
96 2011 Annual Report | notes to the Condensed Consolidated financial statements
NOTE 08
loAns And AllowAnCe foR CRedit losses
lOANS, ImPAIREd lOANS ANd AllOwANcESThe following tables present the credit quality of loans:
As at December 31 2011gross loans
neither impaired nor past due
gross loans past due but
not impaired
gross impaired
loansindividual
allowancesCollective allowance net loans
Day, call and short-term loans to investment dealers and brokers $ 91,000 $ — $ — $ — $ — $ 91,000Public and parapublic sectors 1,904,756 — — — — 1,904,756Members FCDQ 9,678,649 — — — — 9,678,649 Other 230,195 — — — — 230,195Other entities included in the scope of consolidation of Desjardins Group 1,886,748 — — — — 1,886,748Loans purchased from Desjardins Group 137,600 36 — — — 137,636Personal 1,091,514 1,583 7,728 — 2,652 1,098,173Business 2,786,961 — 30,926 11,347 44,452 2,762,088
$ 17,807,423 $ 1,619 $ 38,654 $ 11,347 $ 47,104 $ 17,789,245
As at December 31 2010Gross loans
neither impairednor past due
Gross loans past due but
not impaired
Gross impaired
loansindividual
allowancesCollective allowance net loans
Day, call and short-term loans to investment dealers and brokers $ 103,000 $ — $ — $ — $ — $ 103,000Public and parapublic sectors 1,609,151 — — — — 1,609,151Members FCDQ 8,724,221 — — — — 8,724,221 Other 189,814 — — — — 189,814Other entities included in the scope of consolidation of Desjardins Group 1,659,415 — — — — 1,659,415Loans purchased from Desjardins Group 183,754 1,296 — — — 185,050Personal 789,717 7,071 15,781 1,734 2,271 808,564Business 2,726,763 17,803 24,768 11,548 50,496 2,707,290
$ 15,985,835 $ 26,170 $ 40,549 $ 13,282 $ 52,767 $ 15,986,505
As at January 1st 2010Gross loans
neither impairednor past due
Gross loans past due but
not impaired
Gross impaired
loansindividual
allowancesCollective allowance net loans
Day, call and short-term loans to investment dealers and brokers $ 59,000 $ — $ — $ — $ — $ 59,000Public and parapublic sectors 1,974,333 — — — — 1,974,333Members FCDQ 5,776,605 — — — — 5,776,605 Other 19,824 — — — — 19,824Other entities included in the scope of consolidation of Desjardins Group 1,679,716 — — — — 1,679,716Loans purchased from Desjardins Group 231,183 — — — — 231,183Personal 569,758 9,170 17,797 2,107 4,111 590,507Business 2,760,982 127 47,842 17,188 82,477 2,709,286
$ 13,071,401 $ 9,297 $ 65,639 $ 19,295 $ 86,588 $ 13,040,454
The fair value of foreclosed assets totalled $2.1 million as at December 31, 2011 ($2.3 million as at December 31, 2010) and is presented under “Other assets – Other” in the Consolidated Statements of Financial Position.
note 08 | Loans and Allowance for Credit Losses
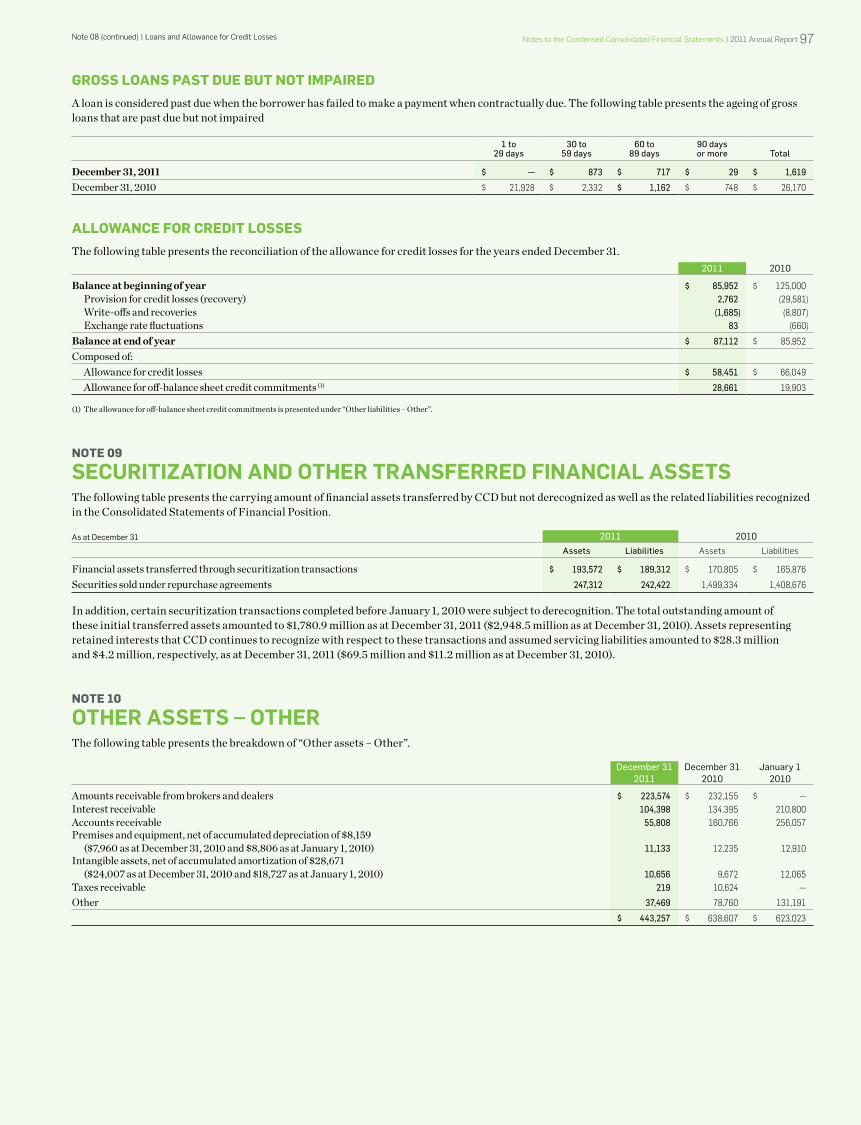
notes to the Condensed Consolidated financial statements | 2011 Annual Report 97
GROSS lOANS PAST dUE bUT NOT ImPAIREdA loan is considered past due when the borrower has failed to make a payment when contractually due. The following table presents the ageing of gross loans that are past due but not impaired
1 to29 days
30 to59 days
60 to89 days
90 daysor more Total
December 31, 2011 $ — $ 873 $ 717 $ 29 $ 1,619
December 31, 2010 $ 21,928 $ 2,332 $ 1,162 $ 748 $ 26,170
AllOwANcE FOR cREdIT lOSSESThe following table presents the reconciliation of the allowance for credit losses for the years ended December 31.
2011 2010
Balance at beginning of year $ 85,952 $ 125,000 Provision for credit losses (recovery) 2,762 (29,581) Write-offs and recoveries (1,685) (8,807) Exchange rate fluctuations 83 (660)
Balance at end of year $ 87,112 $ 85,952
Composed of: Allowance for credit losses $ 58,451 $ 66,049
Allowance for off-balance sheet credit commitments (1) 28,661 19,903
(1) The allowance for off-balance sheet credit commitments is presented under “Other liabilities – Other”.
NOTE 09
seCuRitiZAtion And otHeR tRAnsfeRRed finAnCiAl AssetsThe following table presents the carrying amount of financial assets transferred by CCD but not derecognized as well as the related liabilities recognized in the Consolidated Statements of Financial Position.
As at December 31 2011 2010assets liabilities Assets Liabilities
Financial assets transferred through securitization transactions $ 193,572 $ 189,312 $ 170,805 $ 165,876
Securities sold under repurchase agreements 247,312 242,422 1,499,334 1,408,676
In addition, certain securitization transactions completed before January 1, 2010 were subject to derecognition. The total outstanding amount of these initial transferred assets amounted to $1,780.9 million as at December 31, 2011 ($2,948.5 million as at December 31, 2010). Assets representing retained interests that CCD continues to recognize with respect to these transactions and assumed servicing liabilities amounted to $28.3 million and $4.2 million, respectively, as at December 31, 2011 ($69.5 million and $11.2 million as at December 31, 2010).
NOTE 10
otHeR Assets – otHeRThe following table presents the breakdown of “Other assets – Other”.
December 31 2011
December 31 2010
January 1 2010
Amounts receivable from brokers and dealers $ 223,574 $ 232,155 $ —Interest receivable 104,398 134,395 210,800Accounts receivable 55,808 160,766 256,057Premises and equipment, net of accumulated depreciation of $8,159 ($7,960 as at December 31, 2010 and $8,806 as at January 1, 2010) 11,133 12,235 12,910Intangible assets, net of accumulated amortization of $28,671 ($24,007 as at December 31, 2010 and $18,727 as at January 1, 2010) 10,656 9,672 12,065Taxes receivable 219 10,624 —
Other 37,469 78,760 131,191
$ 443,257 $ 638,607 $ 623,023
note 08 (continued) | Loans and Allowance for Credit Losses
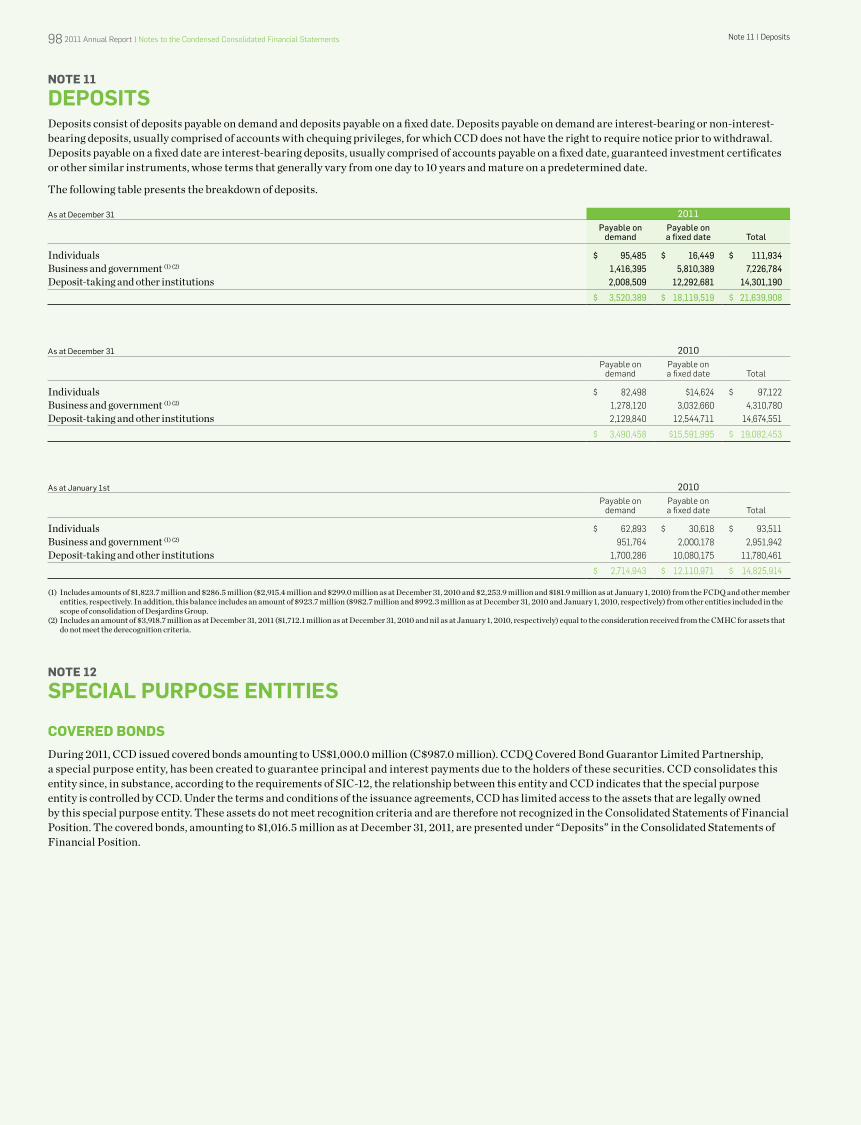
98 2011 Annual Report | notes to the Condensed Consolidated financial statements
NOTE 11
depositsDeposits consist of deposits payable on demand and deposits payable on a fixed date. Deposits payable on demand are interest-bearing or non-interest-bearing deposits, usually comprised of accounts with chequing privileges, for which CCD does not have the right to require notice prior to withdrawal. Deposits payable on a fixed date are interest-bearing deposits, usually comprised of accounts payable on a fixed date, guaranteed investment certificates or other similar instruments, whose terms that generally vary from one day to 10 years and mature on a predetermined date.
The following table presents the breakdown of deposits.
As at December 31 2011payable on
demandpayable on a fixed date Total
Individuals $ 95,485 $ 16,449 $ 111,934Business and government (1) (2) 1,416,395 5,810,389 7,226,784Deposit-taking and other institutions 2,008,509 12,292,681 14,301,190
$ 3,520,389 $ 18,119,519 $ 21,639,908
As at December 31 2010Payable on
demandPayable on a fixed date total
Individuals $ 82,498 $14,624 $ 97,122Business and government (1) (2) 1,278,120 3,032,660 4,310,780Deposit-taking and other institutions 2,129,840 12,544,711 14,674,551
$ 3,490,458 $15,591,995 $ 19,082,453
As at January 1st 2010Payable on
demandPayable on a fixed date total
Individuals $ 62,893 $ 30,618 $ 93,511Business and government (1) (2) 951,764 2,000,178 2,951,942Deposit-taking and other institutions 1,700,286 10,080,175 11,780,461
$ 2,714,943 $ 12,110,971 $ 14,825,914
(1) Includes amounts of $1,823.7 million and $286.5 million ($2,915.4 million and $299.0 million as at December 31, 2010 and $2,253.9 million and $181.9 million as at January 1, 2010) from the FCDQ and other member entities, respectively. In addition, this balance includes an amount of $923.7 million ($982.7 million and $992.3 million as at December 31, 2010 and January 1, 2010, respectively) from other entities included in the scope of consolidation of Desjardins Group.
(2) Includes an amount of $3,918.7 million as at December 31, 2011 ($1,712.1 million as at December 31, 2010 and nil as at January 1, 2010, respectively) equal to the consideration received from the CMHC for assets that do not meet the derecognition criteria.
NOTE 12
speCiAl puRpose entities
cOvEREd bONdSDuring 2011, CCD issued covered bonds amounting to US$1,000.0 million (C$987.0 million). CCDQ Covered Bond Guarantor Limited Partnership, a special purpose entity, has been created to guarantee principal and interest payments due to the holders of these securities. CCD consolidates this entity since, in substance, according to the requirements of SIC-12, the relationship between this entity and CCD indicates that the special purpose entity is controlled by CCD. Under the terms and conditions of the issuance agreements, CCD has limited access to the assets that are legally owned by this special purpose entity. These assets do not meet recognition criteria and are therefore not recognized in the Consolidated Statements of Financial Position. The covered bonds, amounting to $1,016.5 million as at December 31, 2011, are presented under “Deposits” in the Consolidated Statements of Financial Position.
note 11 | deposits
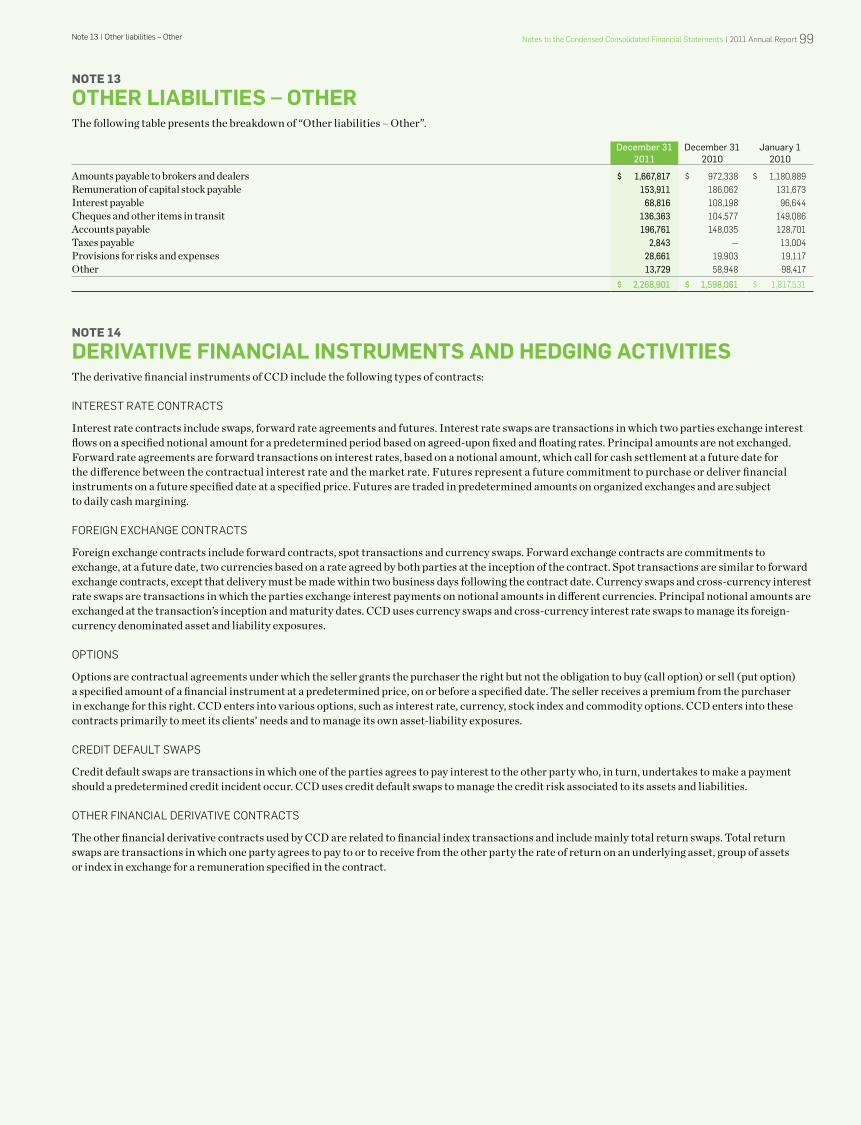
notes to the Condensed Consolidated financial statements | 2011 Annual Report 99
NOTE 13
otHeR liAbilities – otHeRThe following table presents the breakdown of “Other liabilities – Other”.
December 31 2011
December 312010
January 1 2010
Amounts payable to brokers and dealers $ 1,667,817 $ 972,338 $ 1,180,889Remuneration of capital stock payable 153,911 186,062 131,673Interest payable 68,816 108,198 96,644Cheques and other items in transit 136,363 104,577 149,086Accounts payable 196,761 148,035 128,701Taxes payable 2,843 — 13,004Provisions for risks and expenses 28,661 19,903 19,117Other 13,729 58,948 98,417
$ 2,268,901 $ 1,598,061 $ 1,817,531
NOTE 14
deRiVAtiVe finAnCiAl instRuments And Hedging ACtiVitiesThe derivative financial instruments of CCD include the following types of contracts:
inteRest RAte ContRACts
Interest rate contracts include swaps, forward rate agreements and futures. Interest rate swaps are transactions in which two parties exchange interest flows on a specified notional amount for a predetermined period based on agreed-upon fixed and floating rates. Principal amounts are not exchanged. Forward rate agreements are forward transactions on interest rates, based on a notional amount, which call for cash settlement at a future date for the difference between the contractual interest rate and the market rate. Futures represent a future commitment to purchase or deliver financial instruments on a future specified date at a specified price. Futures are traded in predetermined amounts on organized exchanges and are subject to daily cash margining.
foReiGn exChAnGe ContRACts
Foreign exchange contracts include forward contracts, spot transactions and currency swaps. Forward exchange contracts are commitments to exchange, at a future date, two currencies based on a rate agreed by both parties at the inception of the contract. Spot transactions are similar to forward exchange contracts, except that delivery must be made within two business days following the contract date. Currency swaps and cross-currency interest rate swaps are transactions in which the parties exchange interest payments on notional amounts in different currencies. Principal notional amounts are exchanged at the transaction’s inception and maturity dates. CCD uses currency swaps and cross-currency interest rate swaps to manage its foreign-currency denominated asset and liability exposures.
oPtions
Options are contractual agreements under which the seller grants the purchaser the right but not the obligation to buy (call option) or sell (put option) a specified amount of a financial instrument at a predetermined price, on or before a specified date. The seller receives a premium from the purchaser in exchange for this right. CCD enters into various options, such as interest rate, currency, stock index and commodity options. CCD enters into these contracts primarily to meet its clients’ needs and to manage its own asset-liability exposures.
CRedit defAuLt swAPs
Credit default swaps are transactions in which one of the parties agrees to pay interest to the other party who, in turn, undertakes to make a payment should a predetermined credit incident occur. CCD uses credit default swaps to manage the credit risk associated to its assets and liabilities.
otheR finAnCiAL deRiVAtiVe ContRACts
The other financial derivative contracts used by CCD are related to financial index transactions and include mainly total return swaps. Total return swaps are transactions in which one party agrees to pay to or to receive from the other party the rate of return on an underlying asset, group of assets or index in exchange for a remuneration specified in the contract.
note 13 | other liabilities – other
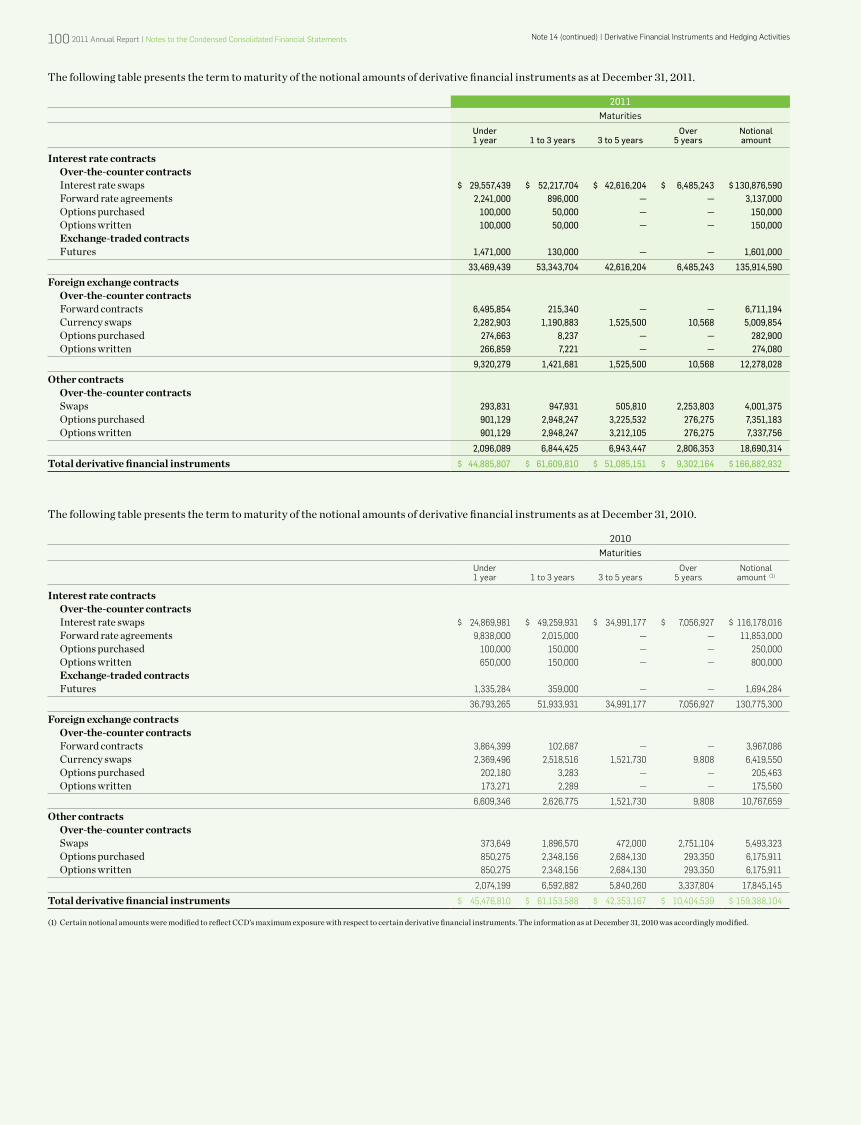
100 2011 Annual Report | notes to the Condensed Consolidated financial statements
The following table presents the term to maturity of the notional amounts of derivative financial instruments as at December 31, 2011.
2011Maturities
under 1 year 1 to 3 years 3 to 5 years
over 5 years
notional amount
Interest rate contracts Over-the-counter contracts Interest rate swaps $ 29,557,439 $ 52,217,704 $ 42,616,204 $ 6,485,243 $ 130,876,590 Forward rate agreements 2,241,000 896,000 — — 3,137,000 Options purchased 100,000 50,000 — — 150,000 Options written 100,000 50,000 — — 150,000 Exchange-traded contracts
Futures 1,471,000 130,000 — — 1,601,000
33,469,439 53,343,704 42,616,204 6,485,243 135,914,590
Foreign exchange contracts Over-the-counter contracts
Forward contracts 6,495,854 215,340 — — 6,711,194 Currency swaps 2,282,903 1,190,883 1,525,500 10,568 5,009,854 Options purchased 274,663 8,237 — — 282,900
Options written 266,859 7,221 — — 274,080
9,320,279 1,421,681 1,525,500 10,568 12,278,028
Other contracts Over-the-counter contracts Swaps 293,831 947,931 505,810 2,253,803 4,001,375 Options purchased 901,129 2,948,247 3,225,532 276,275 7,351,183
Options written 901,129 2,948,247 3,212,105 276,275 7,337,756
2,096,089 6,844,425 6,943,447 2,806,353 18,690,314
Total derivative financial instruments $ 44,885,807 $ 61,609,810 $ 51,085,151 $ 9,302,164 $ 166,882,932
The following table presents the term to maturity of the notional amounts of derivative financial instruments as at December 31, 2010.
2010Maturities
under 1 year 1 to 3 years 3 to 5 years
over 5 years
notional amount (1)
Interest rate contracts Over-the-counter contracts Interest rate swaps $ 24,869,981 $ 49,259,931 $ 34,991,177 $ 7,056,927 $ 116,178,016 Forward rate agreements 9,838,000 2,015,000 — — 11,853,000 Options purchased 100,000 150,000 — — 250,000 Options written 650,000 150,000 — — 800,000 Exchange-traded contracts
Futures 1,335,284 359,000 — — 1,694,284
36,793,265 51,933,931 34,991,177 7,056,927 130,775,300
Foreign exchange contracts Over-the-counter contracts
Forward contracts 3,864,399 102,687 — — 3,967,086 Currency swaps 2,369,496 2,518,516 1,521,730 9,808 6,419,550 Options purchased 202,180 3,283 — — 205,463
Options written 173,271 2,289 — — 175,560
6,609,346 2,626,775 1,521,730 9,808 10,767,659
Other contracts Over-the-counter contracts Swaps 373,649 1,896,570 472,000 2,751,104 5,493,323 Options purchased 850,275 2,348,156 2,684,130 293,350 6,175,911
Options written 850,275 2,348,156 2,684,130 293,350 6,175,911
2,074,199 6,592,882 5,840,260 3,337,804 17,845,145
Total derivative financial instruments $ 45,476,810 $ 61,153,588 $ 42,353,167 $ 10,404,539 $ 159,388,104
(1) Certain notional amounts were modified to reflect CCD’s maximum exposure with respect to certain derivative financial instruments. The information as at December 31, 2010 was accordingly modified.
note 14 (continued) | derivative financial instruments and hedging Activities
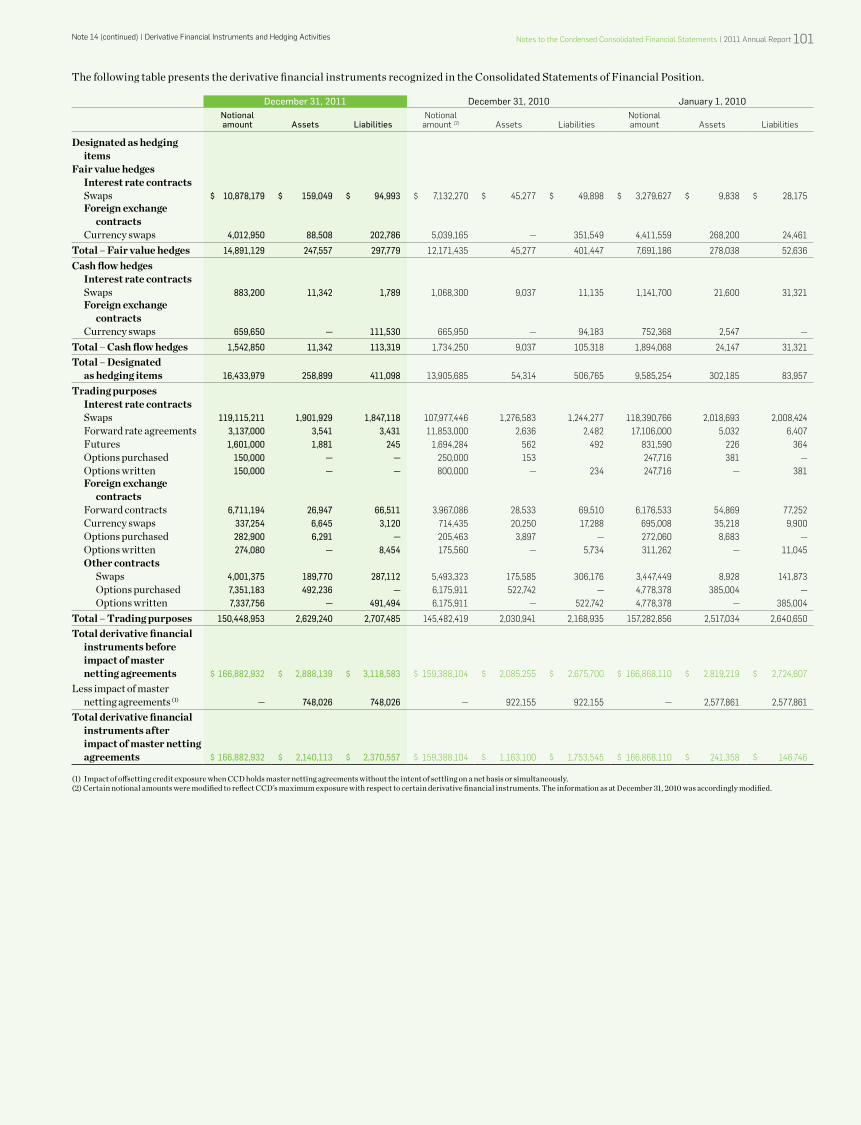
notes to the Condensed Consolidated financial statements | 2011 Annual Report 101
The following table presents the derivative financial instruments recognized in the Consolidated Statements of Financial Position.
December 31, 2011 December 31, 2010 January 1, 2010notional amount assets liabilities
notional amount (2) Assets Liabilities
notional amount Assets Liabilities
Designated as hedging itemsFair value hedges Interest rate contracts
Swaps $ 10,878,179 $ 159,049 $ 94,993 $ 7,132,270 $ 45,277 $ 49,898 $ 3,279,627 $ 9,838 $ 28,175 Foreign exchange contracts
Currency swaps 4,012,950 88,508 202,786 5,039,165 — 351,549 4,411,559 268,200 24,461
Total – Fair value hedges 14,891,129 247,557 297,779 12,171,435 45,277 401,447 7,691,186 278,038 52,636
Cash flow hedges Interest rate contracts
Swaps 883,200 11,342 1,789 1,068,300 9,037 11,135 1,141,700 21,600 31,321Foreign exchange contractsCurrency swaps 659,650 — 111,530 665,950 — 94,183 752,368 2,547 —
Total – Cash flow hedges 1,542,850 11,342 113,319 1,734,250 9,037 105,318 1,894,068 24,147 31,321
Total – Designated as hedging items 16,433,979 258,899 411,098 13,905,685 54,314 506,765 9,585,254 302,185 83,957
Trading purposesInterest rate contractsSwaps 119,115,211 1,901,929 1,847,118 107,977,446 1,276,583 1,244,277 118,390,766 2,018,693 2,008,424Forward rate agreements 3,137,000 3,541 3,431 11,853,000 2,636 2,482 17,106,000 5,032 6,407Futures 1,601,000 1,881 245 1,694,284 562 492 831,590 226 364Options purchased 150,000 — — 250,000 153 247,716 381 —Options written 150,000 — — 800,000 — 234 247,716 — 381Foreign exchange contractsForward contracts 6,711,194 26,947 66,511 3,967,086 28,533 69,510 6,176,533 54,869 77,252
Currency swaps 337,254 6,645 3,120 714,435 20,250 17,288 695,008 35,218 9,900 Options purchased 282,900 6,291 — 205,463 3,897 — 272,060 8,683 — Options written 274,080 — 8,454 175,560 — 5,734 311,262 — 11,045 Other contracts Swaps 4,001,375 189,770 287,112 5,493,323 175,585 306,176 3,447,449 8,928 141,873 Options purchased 7,351,183 492,236 — 6,175,911 522,742 — 4,778,378 385,004 — Options written 7,337,756 — 491,494 6,175,911 — 522,742 4,778,378 — 385,004
Total – Trading purposes 150,448,953 2,629,240 2,707,485 145,482,419 2,030,941 2,168,935 157,282,856 2,517,034 2,640,650
Total derivative financial instruments before impact of master netting agreements $ 166,882,932 $ 2,888,139 $ 3,118,583 $ 159,388,104 $ 2,085,255 $ 2,675,700 $ 166,868,110 $ 2,819,219 $ 2,724,607
Less impact of master netting agreements (1) — 748,026 748,026 — 922,155 922,155 — 2,577,861 2,577,861
Total derivative financial instruments after impact of master netting agreements $ 166,882,932 $ 2,140,113 $ 2,370,557 $ 159,388,104 $ 1,163,100 $ 1,753,545 $ 166,868,110 $ 241,358 $ 146,746
(1) Impact of offsetting credit exposure when CCD holds master netting agreements without the intent of settling on a net basis or simultaneously.(2) Certain notional amounts were modified to reflect CCD’s maximum exposure with respect to certain derivative financial instruments. The information as at December 31, 2010 was accordingly modified.
note 14 (continued) | derivative financial instruments and hedging Activities
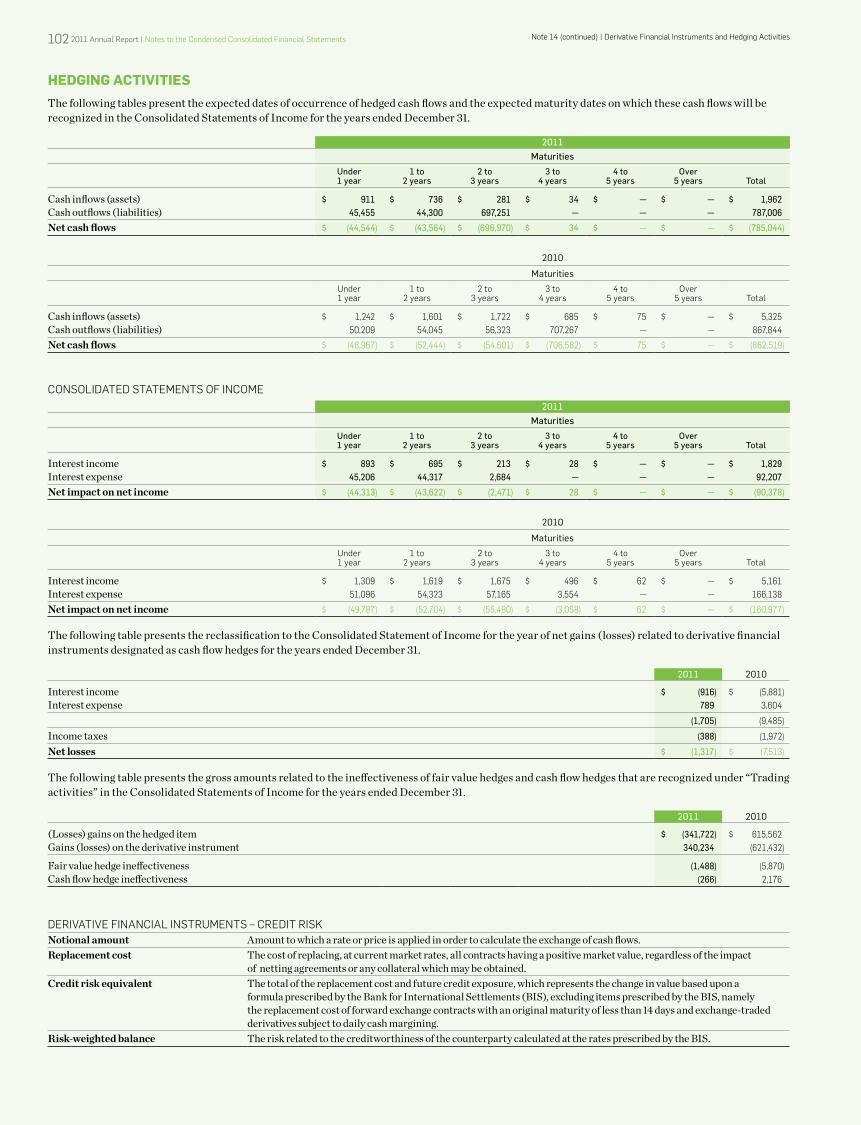
note 14 (continued) | derivative financial instruments and hedging Activities 102 2011 Annual Report | notes to the Condensed Consolidated financial statements
hEdGING AcTIvITIESThe following tables present the expected dates of occurrence of hedged cash flows and the expected maturity dates on which these cash flows will be recognized in the Consolidated Statements of Income for the years ended December 31.
2011maturities
under 1 year
1 to 2 years
2 to 3 years
3 to 4 years
4 to 5 years
over 5 years Total
Cash inflows (assets) $ 911 $ 736 $ 281 $ 34 $ — $ — $ 1,962Cash outflows (liabilities) 45,455 44,300 697,251 — — — 787,006
Net cash flows $ (44,544) $ (43,564) $ (696,970) $ 34 $ — $ — $ (785,044)
2010
Maturities
under 1 year
1 to 2 years
2 to 3 years
3 to 4 years
4 to 5 years
over 5 years total
Cash inflows (assets) $ 1,242 $ 1,601 $ 1,722 $ 685 $ 75 $ — $ 5,325Cash outflows (liabilities) 50,209 54,045 56,323 707,267 — — 867,844
Net cash flows $ (48,967) $ (52,444) $ (54,601) $ (706,582) $ 75 $ — $ (862,519)
ConsoLidAted stAteMents of inCoMe2011
maturitiesunder 1 year
1 to 2 years
2 to 3 years
3 to 4 years
4 to 5 years
over 5 years Total
Interest income $ 893 $ 695 $ 213 $ 28 $ — $ — $ 1,829Interest expense 45,206 44,317 2,684 — — — 92,207
Net impact on net income $ (44,313) $ (43,622) $ (2,471) $ 28 $ — $ — $ (90,378)
2010
Maturities
under 1 year
1 to 2 years
2 to 3 years
3 to 4 years
4 to 5 years
over 5 years total
Interest income $ 1,309 $ 1,619 $ 1,675 $ 496 $ 62 $ — $ 5,161Interest expense 51,096 54,323 57,165 3,554 — — 166,138
Net impact on net income $ (49,787) $ (52,704) $ (55,490) $ (3,058) $ 62 $ — $ (160,977)
The following table presents the reclassification to the Consolidated Statement of Income for the year of net gains (losses) related to derivative financial instruments designated as cash flow hedges for the years ended December 31.
2011 2010
Interest income $ (916) $ (5,881)Interest expense 789 3,604
(1,705) (9,485)
Income taxes (388) (1,972)
Net losses $ (1,317) $ (7,513)
The following table presents the gross amounts related to the ineffectiveness of fair value hedges and cash flow hedges that are recognized under “Trading activities” in the Consolidated Statements of Income for the years ended December 31.
2011 2010
(Losses) gains on the hedged item $ (341,722) $ 615,562Gains (losses) on the derivative instrument 340,234 (621,432)
Fair value hedge ineffectiveness (1,488) (5,870)Cash flow hedge ineffectiveness (266) 2,176
deRiVAtiVe finAnCiAL instRuMents – CRedit Risk Notional amount Amount to which a rate or price is applied in order to calculate the exchange of cash flows.Replacement cost The cost of replacing, at current market rates, all contracts having a positive market value, regardless of the impact
of netting agreements or any collateral which may be obtained.Credit risk equivalent The total of the replacement cost and future credit exposure, which represents the change in value based upon a
formula prescribed by the Bank for International Settlements (BIS), excluding items prescribed by the BIS, namely the replacement cost of forward exchange contracts with an original maturity of less than 14 days and exchange-traded derivatives subject to daily cash margining.
Risk-weighted balance The risk related to the creditworthiness of the counterparty calculated at the rates prescribed by the BIS.
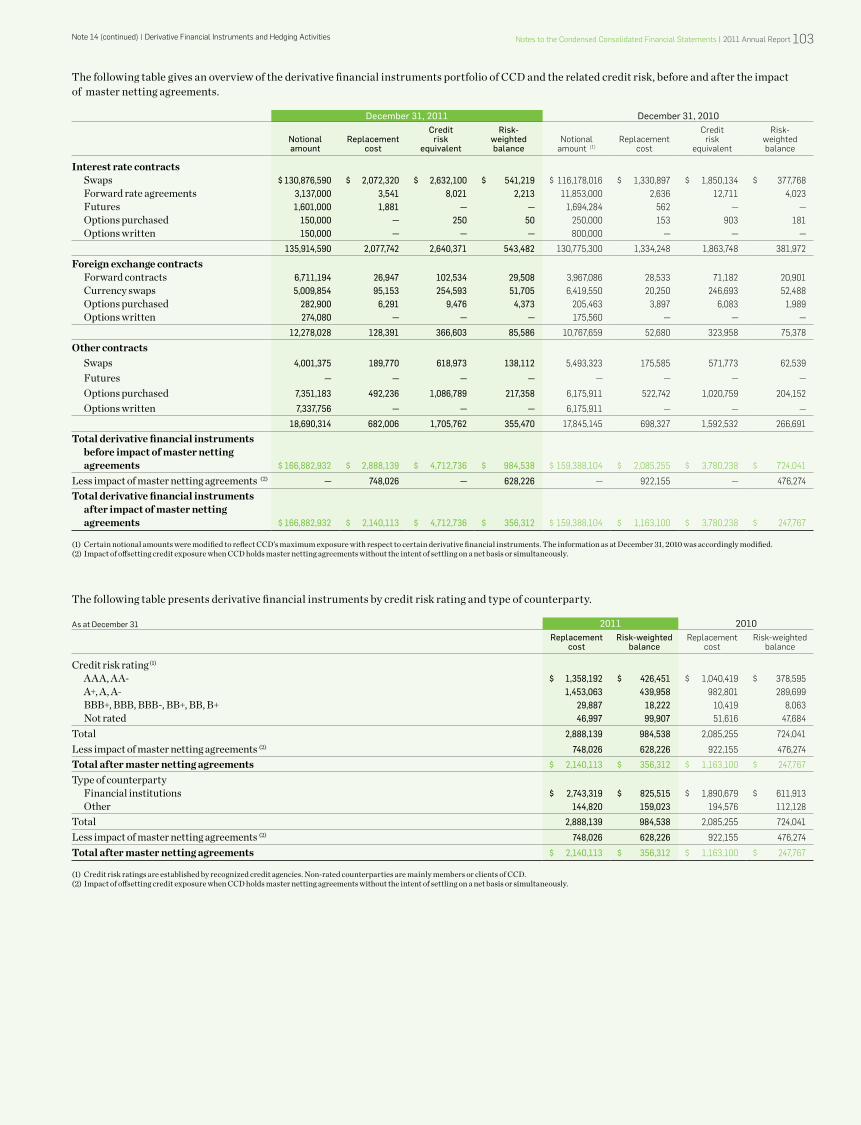
note 14 (continued) | derivative financial instruments and hedging Activities notes to the Condensed Consolidated financial statements | 2011 Annual Report 103
The following table gives an overview of the derivative financial instruments portfolio of CCD and the related credit risk, before and after the impact of master netting agreements.
December 31, 2011 December 31, 2010
notionalamount
replacementcost
Creditrisk
equivalent
risk-weightedbalance
notionalamount (1)
Replacementcost
Creditrisk
equivalent
Risk-weightedbalance
Interest rate contractsSwaps $ 130,876,590 $ 2,072,320 $ 2,632,100 $ 541,219 $ 116,178,016 $ 1,330,897 $ 1,850,134 $ 377,768Forward rate agreements 3,137,000 3,541 8,021 2,213 11,853,000 2,636 12,711 4,023Futures 1,601,000 1,881 — — 1,694,284 562 — —Options purchased 150,000 — 250 50 250,000 153 903 181Options written 150,000 — — — 800,000 — — —
135,914,590 2,077,742 2,640,371 543,482 130,775,300 1,334,248 1,863,748 381,972
Foreign exchange contractsForward contracts 6,711,194 26,947 102,534 29,508 3,967,086 28,533 71,182 20,901Currency swaps 5,009,854 95,153 254,593 51,705 6,419,550 20,250 246,693 52,488Options purchased 282,900 6,291 9,476 4,373 205,463 3,897 6,083 1,989Options written 274,080 — — — 175,560 — — —
12,278,028 128,391 366,603 85,586 10,767,659 52,680 323,958 75,378
Other contractsSwaps 4,001,375 189,770 618,973 138,112 5,493,323 175,585 571,773 62,539
Futures — — — — — — — —
Options purchased 7,351,183 492,236 1,086,789 217,358 6,175,911 522,742 1,020,759 204,152
Options written 7,337,756 — — — 6,175,911 — — —
18,690,314 682,006 1,705,762 355,470 17,845,145 698,327 1,592,532 266,691
Total derivative financial instruments before impact of master netting agreements $ 166,882,932 $ 2,888,139 $ 4,712,736 $ 984,538 $ 159,388,104 $ 2,085,255 $ 3,780,238 $ 724,041
Less impact of master netting agreements (2) — 748,026 — 628,226 — 922,155 — 476,274
Total derivative financial instruments after impact of master netting agreements $ 166,882,932 $ 2,140,113 $ 4,712,736 $ 356,312 $ 159,388,104 $ 1,163,100 $ 3,780,238 $ 247,767
(1) Certain notional amounts were modified to reflect CCD’s maximum exposure with respect to certain derivative financial instruments. The information as at December 31, 2010 was accordingly modified.(2) Impact of offsetting credit exposure when CCD holds master netting agreements without the intent of settling on a net basis or simultaneously.
The following table presents derivative financial instruments by credit risk rating and type of counterparty.
As at December 31 2011 2010replacement
costrisk-weighted
balanceReplacement
costRisk-weighted
balance
Credit risk rating (1)
AAA, AA- $ 1,358,192 $ 426,451 $ 1,040,419 $ 378,595 A+, A, A- 1,453,063 439,958 982,801 289,699 BBB+, BBB, BBB-, BB+, BB, B+ 29,887 18,222 10,419 8,063 Not rated 46,997 99,907 51,616 47,684
Total 2,888,139 984,538 2,085,255 724,041
Less impact of master netting agreements (2) 748,026 628,226 922,155 476,274
Total after master netting agreements $ 2,140,113 $ 356,312 $ 1,163,100 $ 247,767
Type of counterparty Financial institutions $ 2,743,319 $ 825,515 $ 1,890,679 $ 611,913 Other 144,820 159,023 194,576 112,128
Total 2,888,139 984,538 2,085,255 724,041
Less impact of master netting agreements (2) 748,026 628,226 922,155 476,274
Total after master netting agreements $ 2,140,113 $ 356,312 $ 1,163,100 $ 247,767
(1) Credit risk ratings are established by recognized credit agencies. Non-rated counterparties are mainly members or clients of CCD. (2) Impact of offsetting credit exposure when CCD holds master netting agreements without the intent of settling on a net basis or simultaneously.
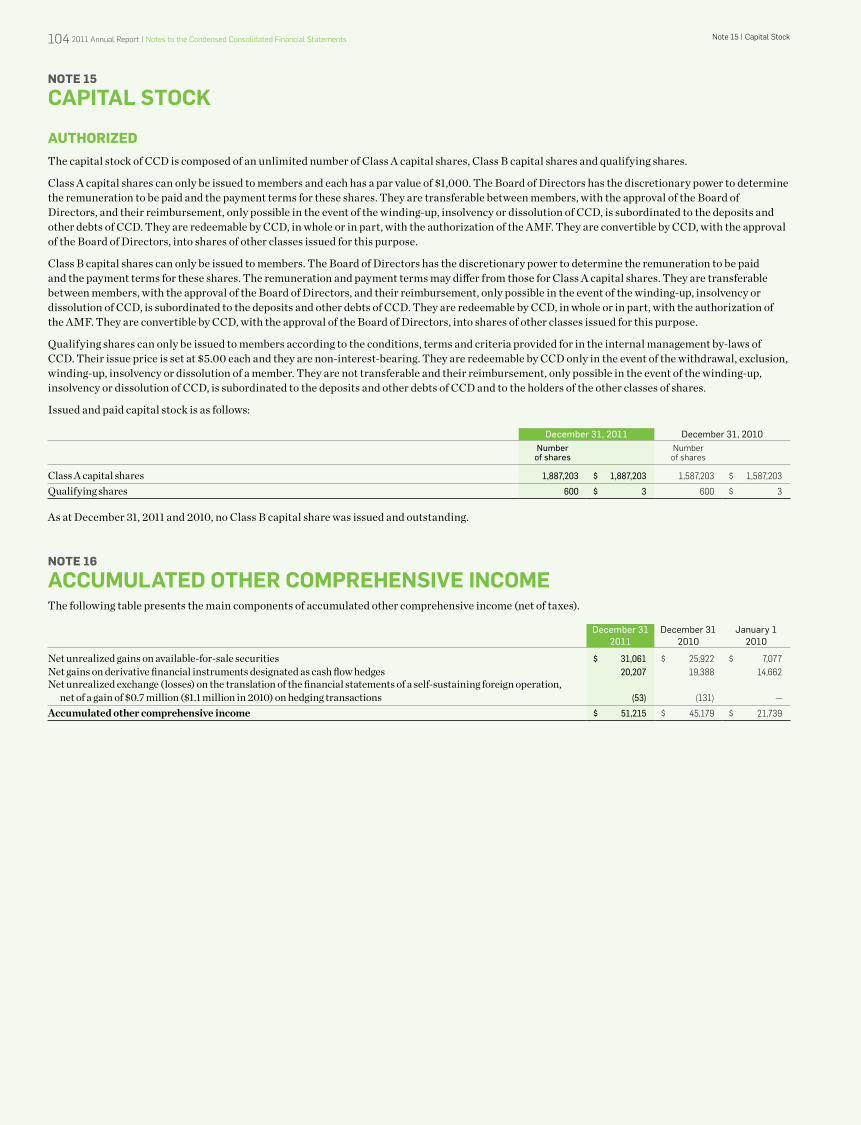
note 15 | Capital stock104 2011 Annual Report | notes to the Condensed Consolidated financial statements
NOTE 15
CApitAl stoCK
AUThORIzEdThe capital stock of CCD is composed of an unlimited number of Class A capital shares, Class B capital shares and qualifying shares.
Class A capital shares can only be issued to members and each has a par value of $1,000. The Board of Directors has the discretionary power to determine the remuneration to be paid and the payment terms for these shares. They are transferable between members, with the approval of the Board of Directors, and their reimbursement, only possible in the event of the winding-up, insolvency or dissolution of CCD, is subordinated to the deposits and other debts of CCD. They are redeemable by CCD, in whole or in part, with the authorization of the AMF. They are convertible by CCD, with the approval of the Board of Directors, into shares of other classes issued for this purpose.
Class B capital shares can only be issued to members. The Board of Directors has the discretionary power to determine the remuneration to be paid and the payment terms for these shares. The remuneration and payment terms may differ from those for Class A capital shares. They are transferable between members, with the approval of the Board of Directors, and their reimbursement, only possible in the event of the winding-up, insolvency or dissolution of CCD, is subordinated to the deposits and other debts of CCD. They are redeemable by CCD, in whole or in part, with the authorization of the AMF. They are convertible by CCD, with the approval of the Board of Directors, into shares of other classes issued for this purpose.
Qualifying shares can only be issued to members according to the conditions, terms and criteria provided for in the internal management by-laws of CCD. Their issue price is set at $5.00 each and they are non-interest-bearing. They are redeemable by CCD only in the event of the withdrawal, exclusion, winding-up, insolvency or dissolution of a member. They are not transferable and their reimbursement, only possible in the event of the winding-up, insolvency or dissolution of CCD, is subordinated to the deposits and other debts of CCD and to the holders of the other classes of shares.
Issued and paid capital stock is as follows:
December 31, 2011 December 31, 2010number
of sharesnumber
of shares
Class A capital shares 1,887,203 $ 1,887,203 1,587,203 $ 1,587,203
Qualifying shares 600 $ 3 600 $ 3
As at December 31, 2011 and 2010, no Class B capital share was issued and outstanding.
NOTE 16
ACCumulAted otHeR CompReHensiVe inComeThe following table presents the main components of accumulated other comprehensive income (net of taxes).
December 31 2011
December 31 2010
January 1 2010
Net unrealized gains on available-for-sale securities $ 31,061 $ 25,922 $ 7,077Net gains on derivative financial instruments designated as cash flow hedges 20,207 19,388 14,662Net unrealized exchange (losses) on the translation of the financial statements of a self-sustaining foreign operation, net of a gain of $0.7 million ($1.1 million in 2010) on hedging transactions (53) (131) —
Accumulated other comprehensive income $ 51,215 $ 45,179 $ 21,739
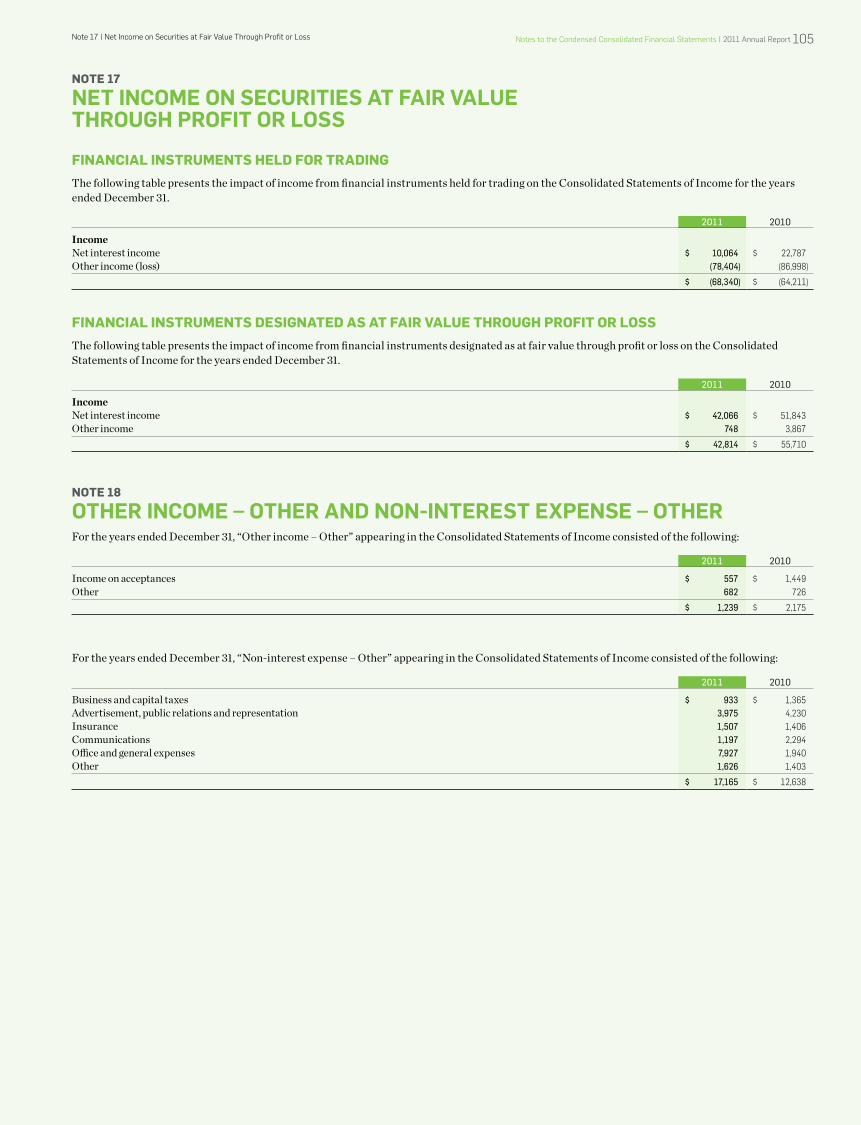
notes to the Condensed Consolidated financial statements | 2011 Annual Report 105note 17 | net income on securities at fair Value through Profit or Loss
NOTE 17
net inCome on seCuRities At fAiR VAlue tHRougH pRofit oR loss
FINANcIAl INSTRUmENTS hEld FOR TRAdINGThe following table presents the impact of income from financial instruments held for trading on the Consolidated Statements of Income for the years ended December 31.
2011 2010
IncomeNet interest income $ 10,064 $ 22,787Other income (loss) (78,404) (86,998)
$ (68,340) $ (64,211)
FINANcIAl INSTRUmENTS dESIGNATEd AS AT FAIR vAlUE ThROUGh PROFIT OR lOSSThe following table presents the impact of income from financial instruments designated as at fair value through profit or loss on the Consolidated Statements of Income for the years ended December 31.
2011 2010
IncomeNet interest income $ 42,066 $ 51,843Other income 748 3,867
$ 42,814 $ 55,710
NOTE 18
otHeR inCome – otHeR And non-inteRest eXpense – otHeRFor the years ended December 31, “Other income – Other” appearing in the Consolidated Statements of Income consisted of the following:
2011 2010
Income on acceptances $ 557 $ 1,449Other 682 726
$ 1,239 $ 2,175
For the years ended December 31, “Non-interest expense – Other” appearing in the Consolidated Statements of Income consisted of the following:
2011 2010
Business and capital taxes $ 933 $ 1,365Advertisement, public relations and representation 3,975 4,230Insurance 1,507 1,406Communications 1,197 2,294Office and general expenses 7,927 1,940Other 1,626 1,403
$ 17,165 $ 12,638
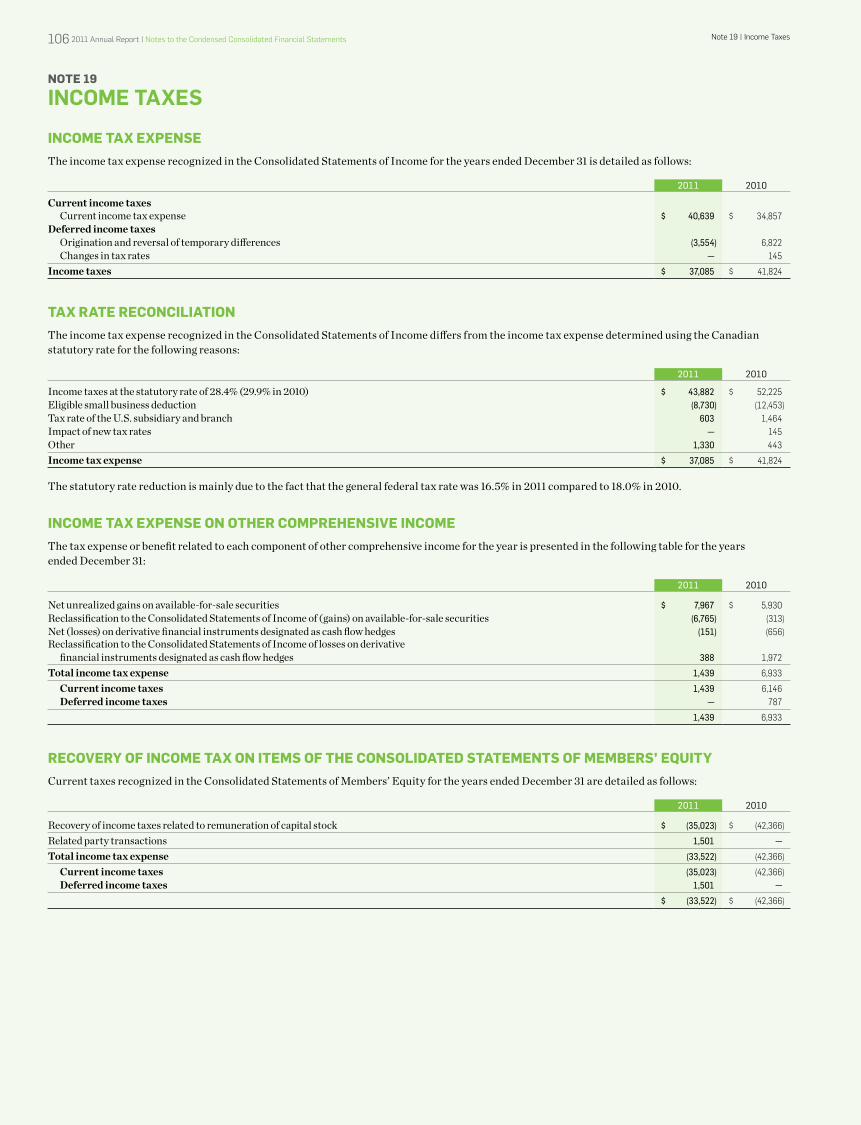
note 19 | income taxes106 2011 Annual Report | notes to the Condensed Consolidated financial statements
NOTE 19
inCome tAXes
INcOmE TAx ExPENSEThe income tax expense recognized in the Consolidated Statements of Income for the years ended December 31 is detailed as follows:
2011 2010
Current income taxes Current income tax expense $ 40,639 $ 34,857Deferred income taxes Origination and reversal of temporary differences (3,554) 6,822 Changes in tax rates — 145
Income taxes $ 37,085 $ 41,824
TAx RATE REcONcIlIATIONThe income tax expense recognized in the Consolidated Statements of Income differs from the income tax expense determined using the Canadian statutory rate for the following reasons:
2011 2010
Income taxes at the statutory rate of 28.4% (29.9% in 2010) $ 43,882 $ 52,225Eligible small business deduction (8,730) (12,453)Tax rate of the U.S. subsidiary and branch 603 1,464Impact of new tax rates — 145Other 1,330 443
Income tax expense $ 37,085 $ 41,824
The statutory rate reduction is mainly due to the fact that the general federal tax rate was 16.5% in 2011 compared to 18.0% in 2010.
INcOmE TAx ExPENSE ON OThER cOmPREhENSIvE INcOmEThe tax expense or benefit related to each component of other comprehensive income for the year is presented in the following table for the years ended December 31:
2011 2010
Net unrealized gains on available-for-sale securities $ 7,967 $ 5,930Reclassification to the Consolidated Statements of Income of (gains) on available-for-sale securities (6,765) (313)Net (losses) on derivative financial instruments designated as cash flow hedges (151) (656)Reclassification to the Consolidated Statements of Income of losses on derivative financial instruments designated as cash flow hedges 388 1,972
Total income tax expense 1,439 6,933
Current income taxes 1,439 6,146 Deferred income taxes — 787
1,439 6,933
REcOvERy OF INcOmE TAx ON ITEmS OF ThE cONSOlIdATEd STATEmENTS OF mEmbERS’ EqUITyCurrent taxes recognized in the Consolidated Statements of Members’ Equity for the years ended December 31 are detailed as follows:
2011 2010
Recovery of income taxes related to remuneration of capital stock $ (35,023) $ (42,366)
Related party transactions 1,501 —
Total income tax expense (33,522) (42,366)
Current income taxes (35,023) (42,366) Deferred income taxes 1,501 —
$ (33,522) $ (42,366)
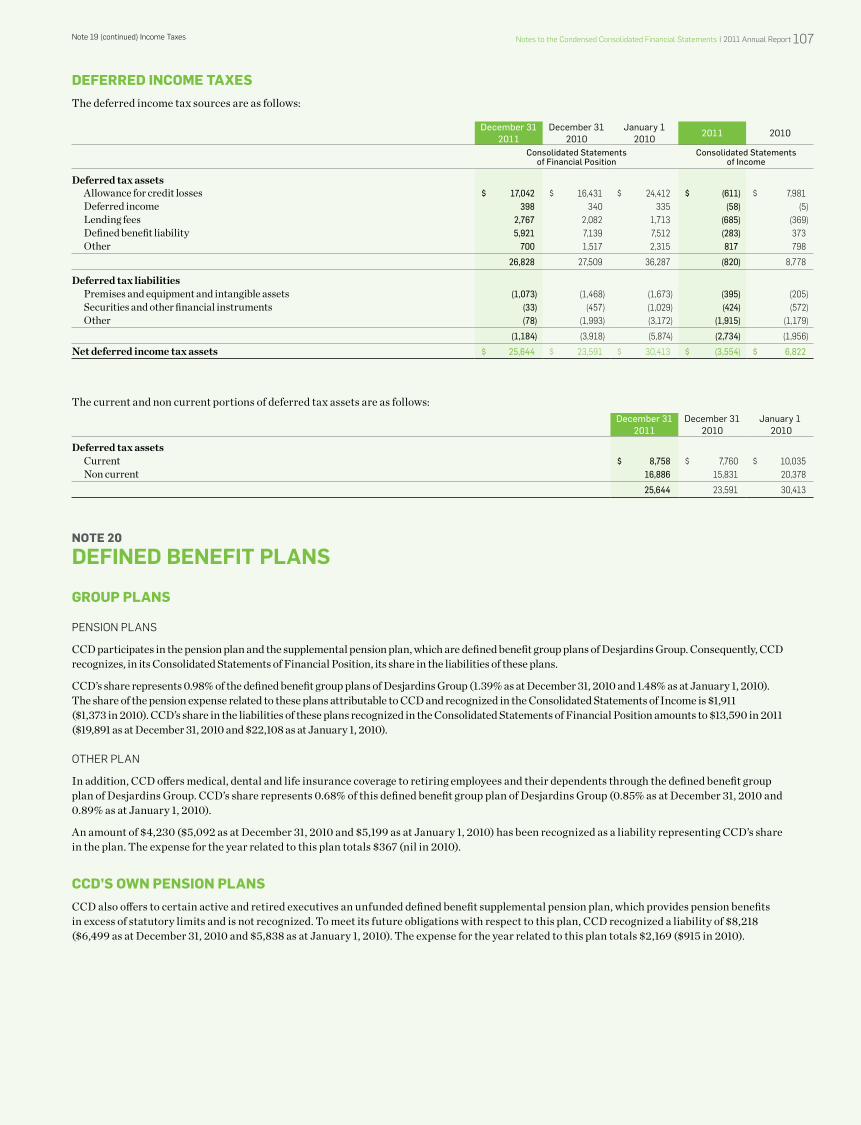
note 19 (continued) income taxes notes to the Condensed Consolidated financial statements | 2011 Annual Report 107
dEFERREd INcOmE TAxESThe deferred income tax sources are as follows:
December 31 2011
December 31 2010
January 12010
2011 2010
Consolidated statements of financial position
Consolidated statements of income
Deferred tax assets Allowance for credit losses $ 17,042 $ 16,431 $ 24,412 $ (611) $ 7,981 Deferred income 398 340 335 (58) (5) Lending fees 2,767 2,082 1,713 (685) (369) Defined benefit liability 5,921 7,139 7,512 (283) 373 Other 700 1,517 2,315 817 798
26,828 27,509 36,287 (820) 8,778
Deferred tax liabilities Premises and equipment and intangible assets (1,073) (1,468) (1,673) (395) (205) Securities and other financial instruments (33) (457) (1,029) (424) (572) Other (78) (1,993) (3,172) (1,915) (1,179)
(1,184) (3,918) (5,874) (2,734) (1,956)
Net deferred income tax assets $ 25,644 $ 23,591 $ 30,413 $ (3,554) $ 6,822
The current and non current portions of deferred tax assets are as follows:December 31
2011December 31
2010January 1
2010
Deferred tax assets Current $ 8,758 $ 7,760 $ 10,035 Non current 16,886 15,831 20,378
25,644 23,591 30,413
NOTE 20
defined benefit plAns
GROUP PlANS
Pension PLAns
CCD participates in the pension plan and the supplemental pension plan, which are defined benefit group plans of Desjardins Group. Consequently, CCD recognizes, in its Consolidated Statements of Financial Position, its share in the liabilities of these plans.
CCD’s share represents 0.98% of the defined benefit group plans of Desjardins Group (1.39% as at December 31, 2010 and 1.48% as at January 1, 2010). The share of the pension expense related to these plans attributable to CCD and recognized in the Consolidated Statements of Income is $1,911 ($1,373 in 2010). CCD’s share in the liabilities of these plans recognized in the Consolidated Statements of Financial Position amounts to $13,590 in 2011 ($19,891 as at December 31, 2010 and $22,108 as at January 1, 2010).
otheR PLAn
In addition, CCD offers medical, dental and life insurance coverage to retiring employees and their dependents through the defined benefit group plan of Desjardins Group. CCD’s share represents 0.68% of this defined benefit group plan of Desjardins Group (0.85% as at December 31, 2010 and 0.89% as at January 1, 2010).
An amount of $4,230 ($5,092 as at December 31, 2010 and $5,199 as at January 1, 2010) has been recognized as a liability representing CCD’s share in the plan. The expense for the year related to this plan totals $367 (nil in 2010).
ccd’S OwN PENSION PlANSCCD also offers to certain active and retired executives an unfunded defined benefit supplemental pension plan, which provides pension benefits in excess of statutory limits and is not recognized. To meet its future obligations with respect to this plan, CCD recognized a liability of $8,218 ($6,499 as at December 31, 2010 and $5,838 as at January 1, 2010). The expense for the year related to this plan totals $2,169 ($915 in 2010).
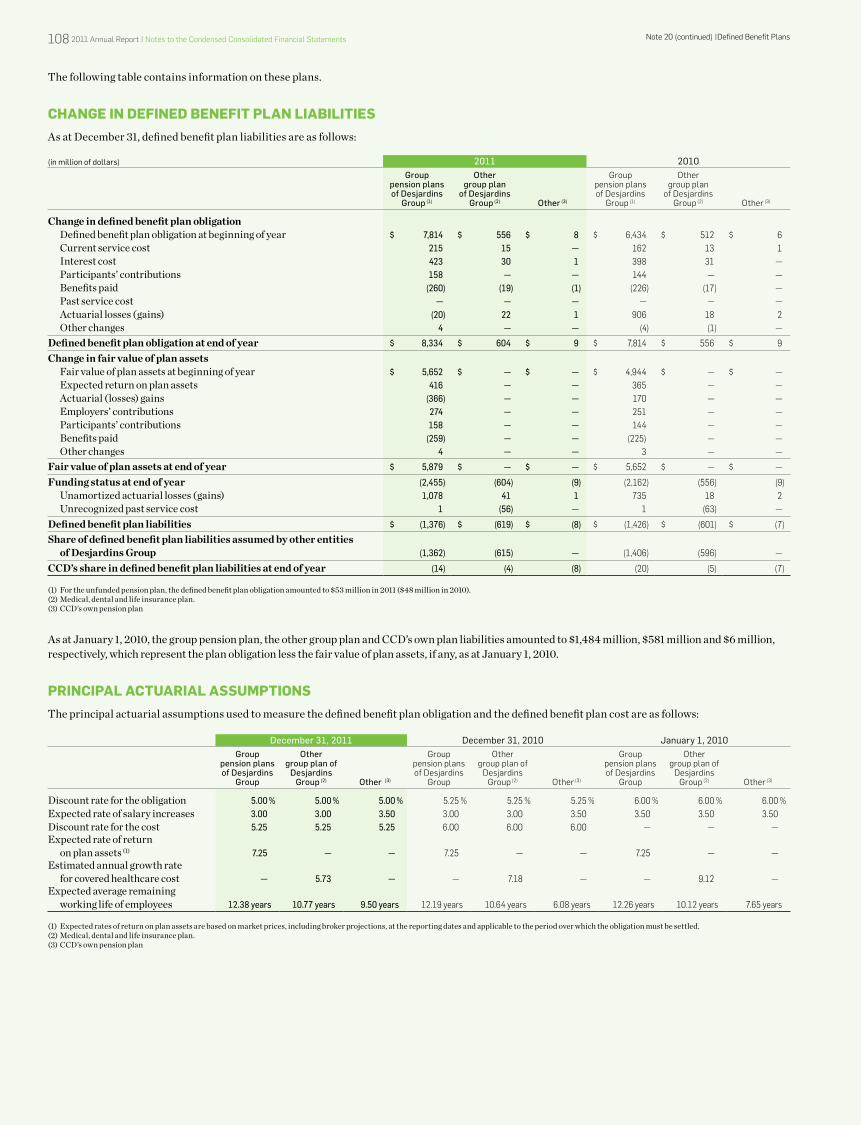
note 20 (continued) |defined Benefit Plans108 2011 Annual Report | notes to the Condensed Consolidated financial statements
The following table contains information on these plans.
chANGE IN dEFINEd bENEFIT PlAN lIAbIlITIESAs at December 31, defined benefit plan liabilities are as follows:
(in million of dollars) 2011 2010group
pension plansof Desjardins
group (1)
other group plan
of Desjardins group (2) other (3)
Grouppension plansof desjardins
Group (1)
othergroup plan
of desjardins Group (2) other (3)
Change in defined benefit plan obligationDefined benefit plan obligation at beginning of year $ 7,814 $ 556 $ 8 $ 6,434 $ 512 $ 6Current service cost 215 15 — 162 13 1Interest cost 423 30 1 398 31 —Participants’ contributions 158 — — 144 — —Benefits paid (260) (19) (1) (226) (17) —Past service cost — — — — — —Actuarial losses (gains) (20) 22 1 906 18 2Other changes 4 — — (4) (1) —
Defined benefit plan obligation at end of year $ 8,334 $ 604 $ 9 $ 7,814 $ 556 $ 9
Change in fair value of plan assetsFair value of plan assets at beginning of year $ 5,652 $ — $ — $ 4,944 $ — $ —Expected return on plan assets 416 — — 365 — —Actuarial (losses) gains (366) — — 170 — —Employers’ contributions 274 — — 251 — —Participants’ contributions 158 — — 144 — —Benefits paid (259) — — (225) — —Other changes 4 — — 3 — —
Fair value of plan assets at end of year $ 5,879 $ — $ — $ 5,652 $ — $ —
Funding status at end of year (2,455) (604) (9) (2,162) (556) (9) Unamortized actuarial losses (gains) 1,078 41 1 735 18 2
Unrecognized past service cost 1 (56) — 1 (63) —
Defined benefit plan liabilities $ (1,376) $ (619) $ (8) $ (1,426) $ (601) $ (7)
Share of defined benefit plan liabilities assumed by other entities of Desjardins Group (1,362) (615) — (1,406) (596) —
CCD’s share in defined benefit plan liabilities at end of year (14) (4) (8) (20) (5) (7)
(1) For the unfunded pension plan, the defined benefit plan obligation amounted to $53 million in 2011 ($48 million in 2010).(2) Medical, dental and life insurance plan.(3) CCD’s own pension plan
As at January 1, 2010, the group pension plan, the other group plan and CCD’s own plan liabilities amounted to $1,484 million, $581 million and $6 million, respectively, which represent the plan obligation less the fair value of plan assets, if any, as at January 1, 2010.
PRINcIPAl AcTUARIAl ASSUmPTIONSThe principal actuarial assumptions used to measure the defined benefit plan obligation and the defined benefit plan cost are as follows:
December 31, 2011 December 31, 2010 January 1, 2010group
pension plans of Desjardins
group
other group plan of
Desjardins group (2) other (3)
Grouppension plans of desjardins
Group
other group plan of
desjardins Group (2) other (3)
Grouppension plansof desjardins
Group
other group plan of
desjardins Group (2) other (3)
Discount rate for the obligation 5.00 % 5.00 % 5.00 % 5.25 % 5.25 % 5.25 % 6.00 % 6.00 % 6.00 %Expected rate of salary increases 3.00 3.00 3.50 3.00 3.00 3.50 3.50 3.50 3.50Discount rate for the cost 5.25 5.25 5.25 6.00 6.00 6.00 — — —Expected rate of return on plan assets (1) 7.25 — — 7.25 — — 7.25 — —Estimated annual growth rate for covered healthcare cost — 5.73 — — 7.18 — — 9.12 —Expected average remaining working life of employees 12.38 years 10.77 years 9.50 years 12.19 years 10.64 years 6.08 years 12.26 years 10.12 years 7.65 years
(1) Expected rates of return on plan assets are based on market prices, including broker projections, at the reporting dates and applicable to the period over which the obligation must be settled. (2) Medical, dental and life insurance plan.(3) CCD’s own pension plan
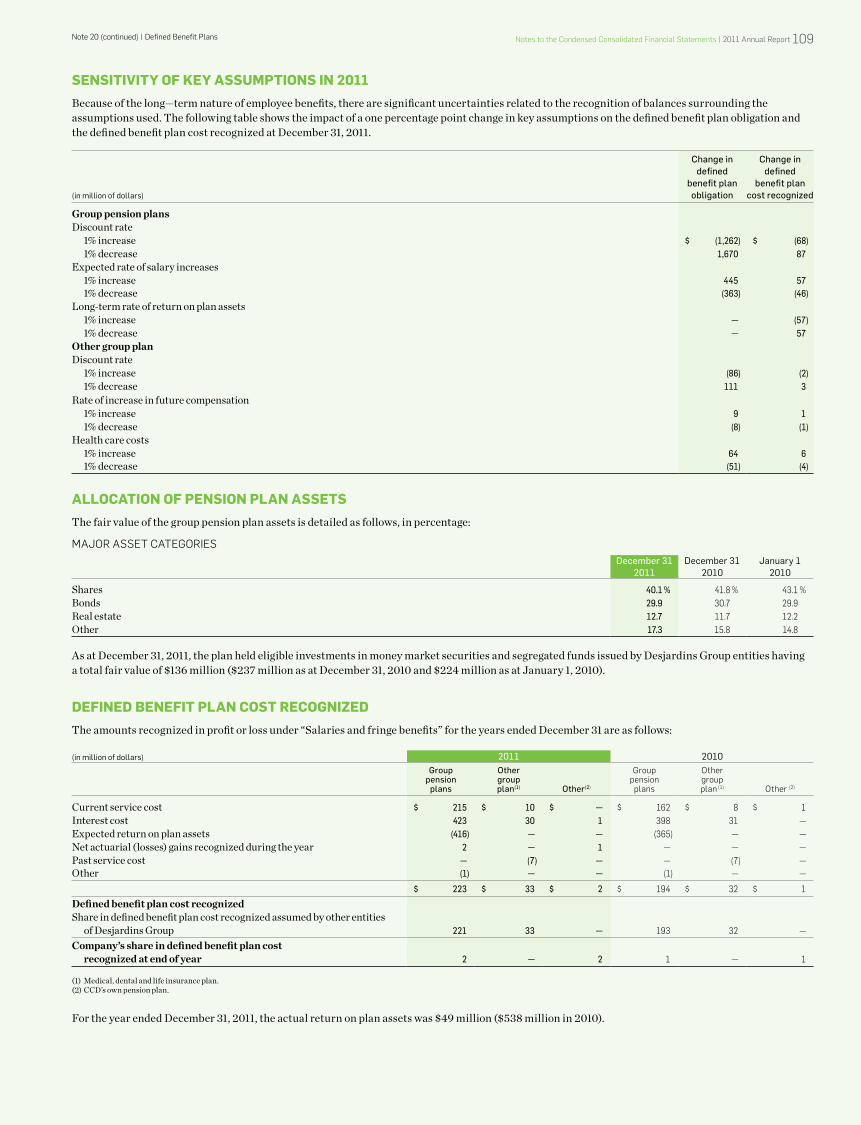
note 20 (continued) | defined Benefit Plans notes to the Condensed Consolidated financial statements | 2011 Annual Report 109
SENSITIvITy OF KEy ASSUmPTIONS IN 2011Because of the long—term nature of employee benefits, there are significant uncertainties related to the recognition of balances surrounding the assumptions used. The following table shows the impact of a one percentage point change in key assumptions on the defined benefit plan obligation and the defined benefit plan cost recognized at December 31, 2011.
(in million of dollars)
Change indefined
benefit plan obligation
Change indefined
benefit plancost recognized
Group pension plansDiscount rate 1% increase $ (1,262) $ (68) 1% decrease 1,670 87Expected rate of salary increases 1% increase 445 57 1% decrease (363) (46)Long-term rate of return on plan assets 1% increase — (57) 1% decrease — 57Other group planDiscount rate 1% increase (86) (2) 1% decrease 111 3Rate of increase in future compensation 1% increase 9 1 1% decrease (8) (1)Health care costs 1% increase 64 6 1% decrease (51) (4)
AllOcATION OF PENSION PlAN ASSETSThe fair value of the group pension plan assets is detailed as follows, in percentage:
MAjoR Asset CAteGoRiesDecember 31
2011December 31
2010January 1
2010
Shares 40.1 % 41.8 % 43.1 %Bonds 29.9 30.7 29.9Real estate 12.7 11.7 12.2Other 17.3 15.8 14.8
As at December 31, 2011, the plan held eligible investments in money market securities and segregated funds issued by Desjardins Group entities having a total fair value of $136 million ($237 million as at December 31, 2010 and $224 million as at January 1, 2010).
dEFINEd bENEFIT PlAN cOST REcOGNIzEdThe amounts recognized in profit or loss under “Salaries and fringe benefits” for the years ended December 31 are as follows:
(in million of dollars) 2011 2010group
pensionplans
othergroupplan(1) other(2)
Grouppension
plans
othergroupplan (1) other (2)
Current service cost $ 215 $ 10 $ — $ 162 $ 8 $ 1Interest cost 423 30 1 398 31 —Expected return on plan assets (416) — — (365) — —Net actuarial (losses) gains recognized during the year 2 — 1 — — —Past service cost — (7) — — (7) —Other (1) — — (1) — —
$ 223 $ 33 $ 2 $ 194 $ 32 $ 1
Defined benefit plan cost recognized Share in defined benefit plan cost recognized assumed by other entities of Desjardins Group 221 33 — 193 32 —
Company’s share in defined benefit plan cost recognized at end of year 2 — 2 1 — 1
(1) Medical, dental and life insurance plan.(2) CCD’s own pension plan.
For the year ended December 31, 2011, the actual return on plan assets was $49 million ($538 million in 2010).
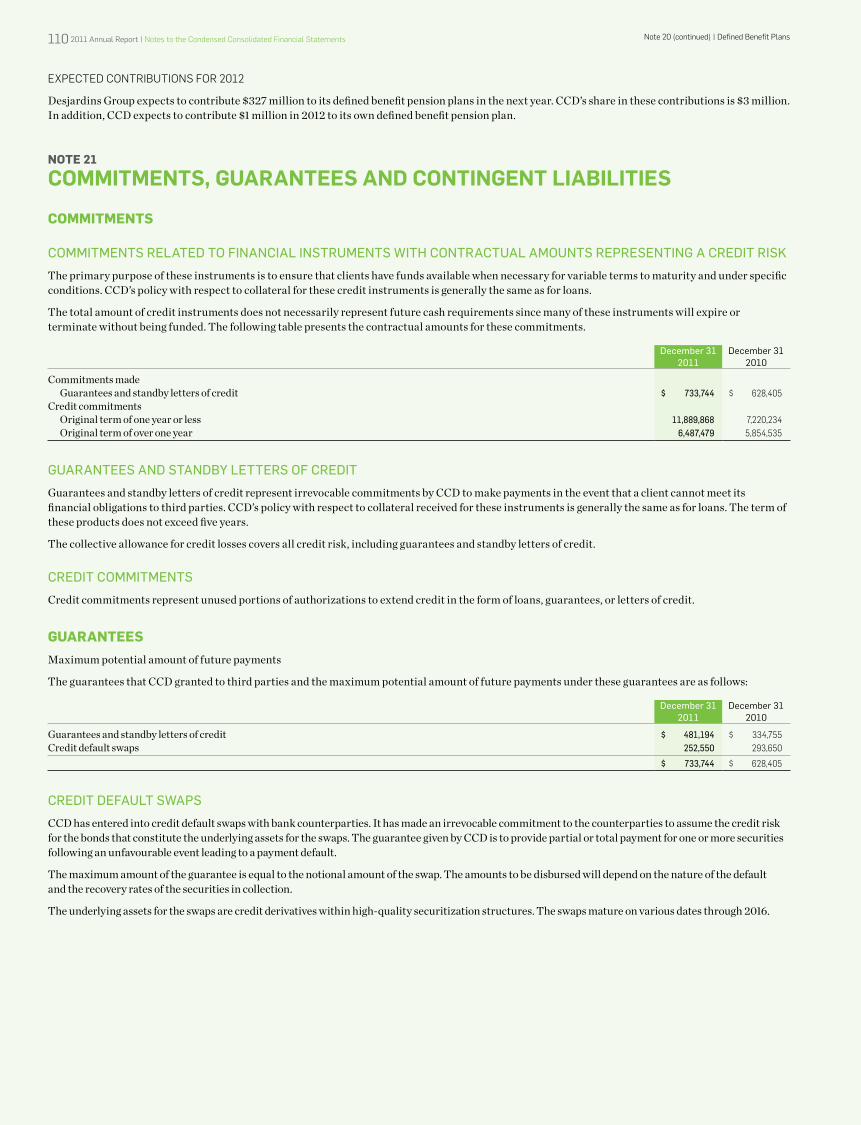
note 20 (continued) | defined Benefit Plans110 2011 Annual Report | notes to the Condensed Consolidated financial statements
exPeCted ContRiButions foR 2012
Desjardins Group expects to contribute $327 million to its defined benefit pension plans in the next year. CCD’s share in these contributions is $3 million. In addition, CCD expects to contribute $1 million in 2012 to its own defined benefit pension plan.
NOTE 21
Commitments, guARAntees And Contingent liAbilities
cOmmITmENTS
CommiTmenTs relaTeD To finanCial insTrumenTs WiTh ConTraCTual amounTs represenTing a CreDiT risK
The primary purpose of these instruments is to ensure that clients have funds available when necessary for variable terms to maturity and under specific conditions. CCD’s policy with respect to collateral for these credit instruments is generally the same as for loans.
The total amount of credit instruments does not necessarily represent future cash requirements since many of these instruments will expire or terminate without being funded. The following table presents the contractual amounts for these commitments.
December 31 2011
December 31 2010
Commitments made Guarantees and standby letters of credit $ 733,744 $ 628,405Credit commitments Original term of one year or less 11,889,868 7,220,234 Original term of over one year 6,487,479 5,854,535
guaranTees anD sTanDby leTTers of CreDiT
Guarantees and standby letters of credit represent irrevocable commitments by CCD to make payments in the event that a client cannot meet its financial obligations to third parties. CCD’s policy with respect to collateral received for these instruments is generally the same as for loans. The term of these products does not exceed five years.
The collective allowance for credit losses covers all credit risk, including guarantees and standby letters of credit.
CreDiT CommiTmenTs
Credit commitments represent unused portions of authorizations to extend credit in the form of loans, guarantees, or letters of credit.
GUARANTEESMaximum potential amount of future payments
The guarantees that CCD granted to third parties and the maximum potential amount of future payments under these guarantees are as follows:
December 31 2011
December 31 2010
Guarantees and standby letters of credit $ 481,194 $ 334,755Credit default swaps 252,550 293,650
$ 733,744 $ 628,405
CreDiT DefaulT sWaps
CCD has entered into credit default swaps with bank counterparties. It has made an irrevocable commitment to the counterparties to assume the credit risk for the bonds that constitute the underlying assets for the swaps. The guarantee given by CCD is to provide partial or total payment for one or more securities following an unfavourable event leading to a payment default.
The maximum amount of the guarantee is equal to the notional amount of the swap. The amounts to be disbursed will depend on the nature of the default and the recovery rates of the securities in collection.
The underlying assets for the swaps are credit derivatives within high-quality securitization structures. The swaps mature on various dates through 2016.
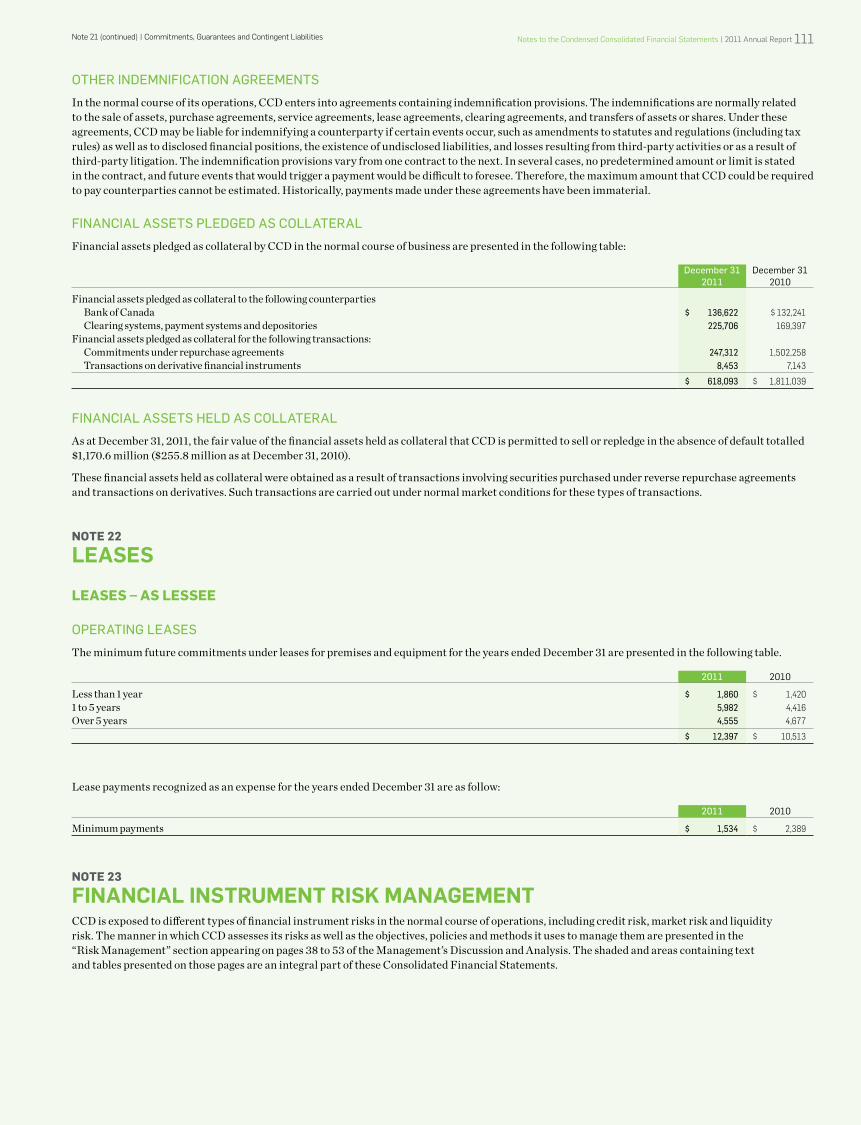
note 21 (continued) | Commitments, Guarantees and Contingent Liabilities notes to the Condensed Consolidated financial statements | 2011 Annual Report 111
oTher inDemnifiCaTion agreemenTs
In the normal course of its operations, CCD enters into agreements containing indemnification provisions. The indemnifications are normally related to the sale of assets, purchase agreements, service agreements, lease agreements, clearing agreements, and transfers of assets or shares. Under these agreements, CCD may be liable for indemnifying a counterparty if certain events occur, such as amendments to statutes and regulations (including tax rules) as well as to disclosed financial positions, the existence of undisclosed liabilities, and losses resulting from third-party activities or as a result of third-party litigation. The indemnification provisions vary from one contract to the next. In several cases, no predetermined amount or limit is stated in the contract, and future events that would trigger a payment would be difficult to foresee. Therefore, the maximum amount that CCD could be required to pay counterparties cannot be estimated. Historically, payments made under these agreements have been immaterial.
finanCial asseTs pleDgeD as CollaTeral
Financial assets pledged as collateral by CCD in the normal course of business are presented in the following table:
December 31 2011
December 31 2010
Financial assets pledged as collateral to the following counterparties Bank of Canada $ 136,622 $ 132,241 Clearing systems, payment systems and depositories 225,706 169,397Financial assets pledged as collateral for the following transactions: Commitments under repurchase agreements 247,312 1,502,258 Transactions on derivative financial instruments 8,453 7,143
$ 618,093 $ 1,811,039
finanCial asseTs helD as CollaTeral
As at December 31, 2011, the fair value of the financial assets held as collateral that CCD is permitted to sell or repledge in the absence of default totalled $1,170.6 million ($255.8 million as at December 31, 2010).
These financial assets held as collateral were obtained as a result of transactions involving securities purchased under reverse repurchase agreements and transactions on derivatives. Such transactions are carried out under normal market conditions for these types of transactions.
NOTE 22
leAses
lEASES – AS lESSEE
operaTing leases
The minimum future commitments under leases for premises and equipment for the years ended December 31 are presented in the following table.
2011 2010
Less than 1 year $ 1,860 $ 1,4201 to 5 years 5,982 4,416Over 5 years 4,555 4,677
$ 12,397 $ 10,513
Lease payments recognized as an expense for the years ended December 31 are as follow:
2011 2010
Minimum payments $ 1,534 $ 2,389
NOTE 23
finAnCiAl instRument RisK mAnAgementCCD is exposed to different types of financial instrument risks in the normal course of operations, including credit risk, market risk and liquidity risk. The manner in which CCD assesses its risks as well as the objectives, policies and methods it uses to manage them are presented in the “Risk Management” section appearing on pages 38 to 53 of the Management’s Discussion and Analysis. The shaded and areas containing text and tables presented on those pages are an integral part of these Consolidated Financial Statements.
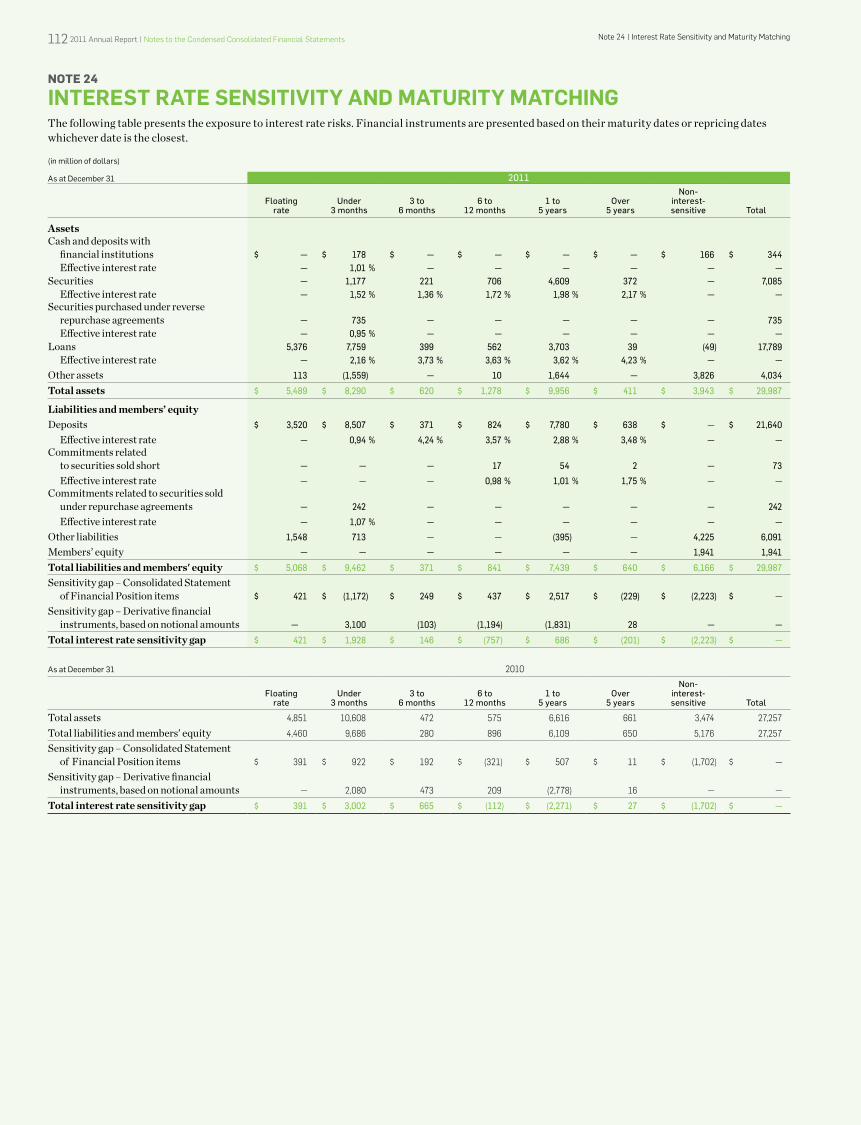
note 24 | interest Rate sensitivity and Maturity Matching112 2011 Annual Report | notes to the Condensed Consolidated financial statements
NOTE 24
inteRest RAte sensitiVity And mAtuRity mAtCHingThe following table presents the exposure to interest rate risks. Financial instruments are presented based on their maturity dates or repricing dates whichever date is the closest.
(in million of dollars)
As at December 31 2011
floating rate
under 3 months
3 to 6 months
6 to 12 months
1 to 5 years
over 5 years
non-interest-sensitive Total
AssetsCash and deposits with financial institutions $ — $ 178
$ —
$ — $ — $ — $ 166 $ 344
Effective interest rate — 1,01 % — — — — — —Securities — 1,177 221 706 4,609 372 — 7,085 Effective interest rate — 1,52 % 1,36 % 1,72 % 1,98 % 2,17 % — —Securities purchased under reverse repurchase agreements — 735 — — — — — 735 Effective interest rate — 0,95 % — — — — — —Loans 5,376 7,759 399 562 3,703 39 (49) 17,789 Effective interest rate — 2,16 % 3,73 % 3,63 % 3,62 % 4,23 % — —
Other assets 113 (1,559) — 10 1,644 — 3,826 4,034
Total assets $ 5,489 $ 8,290 $ 620 $ 1,278 $ 9,956 $ 411 $ 3,943 $ 29,987
Liabilities and members’ equityDeposits $ 3,520 $ 8,507 $ 371 $ 824 $ 7,780 $ 638 $ — $ 21,640
Effective interest rate — 0,94 % 4,24 % 3,57 % 2,88 % 3,48 % — —Commitments related to securities sold short — — — 17 54 2 — 73
Effective interest rate — — — 0,98 % 1,01 % 1,75 % — —Commitments related to securities sold under repurchase agreements — 242 — — — — — 242
Effective interest rate — 1,07 % — — — — — —
Other liabilities 1,548 713 — — (395) — 4,225 6,091
Members’ equity — — — — — — 1,941 1,941
Total liabilities and members' equity $ 5,068 $ 9,462 $ 371 $ 841 $ 7,439 $ 640 $ 6,166 $ 29,987
Sensitivity gap – Consolidated Statement of Financial Position items $ 421 $ (1,172) $ 249 $ 437 $ 2,517 $ (229) $ (2,223) $ —
Sensitivity gap – Derivative financial instruments, based on notional amounts — 3,100 (103) (1,194) (1,831) 28 — —
Total interest rate sensitivity gap $ 421 $ 1,928 $ 146 $ (757) $ 686 $ (201) $ (2,223) $ —
As at December 31 2010
floating rate
under 3 months
3 to 6 months
6 to 12 months
1 to 5 years
over 5 years
non-interest-sensitive Total
Total assets 4,851 10,608 472 575 6,616 661 3,474 27,257
Total liabilities and members’ equity 4,460 9,686 280 896 6,109 650 5,176 27,257
Sensitivity gap – Consolidated Statement of Financial Position items $ 391 $ 922 $ 192 $ (321) $ 507 $ 11 $ (1,702) $ —
Sensitivity gap – Derivative financial instruments, based on notional amounts — 2,080 473 209 (2,778) 16 — —
Total interest rate sensitivity gap $ 391 $ 3,002 $ 665 $ (112) $ (2,271) $ 27 $ (1,702) $ —
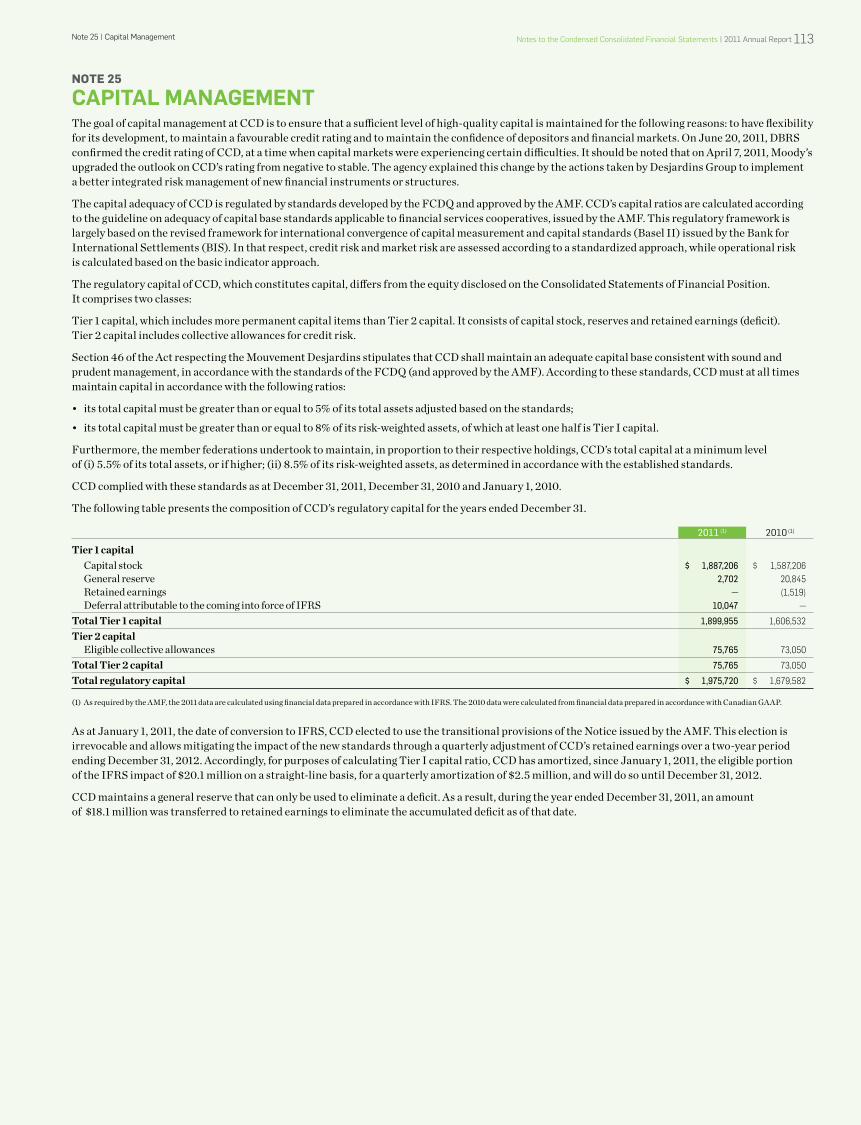
note 25 | Capital Management notes to the Condensed Consolidated financial statements | 2011 Annual Report 113
NOTE 25
CApitAl mAnAgementThe goal of capital management at CCD is to ensure that a sufficient level of high-quality capital is maintained for the following reasons: to have flexibility for its development, to maintain a favourable credit rating and to maintain the confidence of depositors and financial markets. On June 20, 2011, DBRS confirmed the credit rating of CCD, at a time when capital markets were experiencing certain difficulties. It should be noted that on April 7, 2011, Moody’s upgraded the outlook on CCD’s rating from negative to stable. The agency explained this change by the actions taken by Desjardins Group to implement a better integrated risk management of new financial instruments or structures.
The capital adequacy of CCD is regulated by standards developed by the FCDQ and approved by the AMF. CCD’s capital ratios are calculated according to the guideline on adequacy of capital base standards applicable to financial services cooperatives, issued by the AMF. This regulatory framework is largely based on the revised framework for international convergence of capital measurement and capital standards (Basel II) issued by the Bank for International Settlements (BIS). In that respect, credit risk and market risk are assessed according to a standardized approach, while operational risk is calculated based on the basic indicator approach.
The regulatory capital of CCD, which constitutes capital, differs from the equity disclosed on the Consolidated Statements of Financial Position. It comprises two classes:
Tier 1 capital, which includes more permanent capital items than Tier 2 capital. It consists of capital stock, reserves and retained earnings (deficit). Tier 2 capital includes collective allowances for credit risk.
Section 46 of the Act respecting the Mouvement Desjardins stipulates that CCD shall maintain an adequate capital base consistent with sound and prudent management, in accordance with the standards of the FCDQ (and approved by the AMF). According to these standards, CCD must at all times maintain capital in accordance with the following ratios:
• itstotalcapitalmustbegreaterthanorequalto5%ofitstotalassetsadjustedbasedonthestandards;
• itstotalcapitalmustbegreaterthanorequalto8%ofitsrisk-weightedassets,ofwhichatleastonehalfisTierIcapital.
Furthermore, the member federations undertook to maintain, in proportion to their respective holdings, CCD’s total capital at a minimum level of (i) 5.5%ofitstotalassets,orifhigher;(ii)8.5%ofitsrisk-weightedassets,asdeterminedinaccordancewiththeestablishedstandards.
CCD complied with these standards as at December 31, 2011, December 31, 2010 and January 1, 2010.
The following table presents the composition of CCD’s regulatory capital for the years ended December 31.
2011 (1) 2010 (1)
Tier 1 capital Capital stock $ 1,887,206 $ 1,587,206 General reserve 2,702 20,845 Retained earnings — (1,519) Deferral attributable to the coming into force of IFRS 10,047 —
Total Tier 1 capital 1,899,955 1,606,532
Tier 2 capital Eligible collective allowances 75,765 73,050
Total Tier 2 capital 75,765 73,050
Total regulatory capital $ 1,975,720 $ 1,679,582
(1) As required by the AMF, the 2011 data are calculated using financial data prepared in accordance with IFRS. The 2010 data were calculated from financial data prepared in accordance with Canadian GAAP.
As at January 1, 2011, the date of conversion to IFRS, CCD elected to use the transitional provisions of the Notice issued by the AMF. This election is irrevocable and allows mitigating the impact of the new standards through a quarterly adjustment of CCD’s retained earnings over a two-year period ending December 31, 2012. Accordingly, for purposes of calculating Tier I capital ratio, CCD has amortized, since January 1, 2011, the eligible portion of the IFRS impact of $20.1 million on a straight-line basis, for a quarterly amortization of $2.5 million, and will do so until December 31, 2012.
CCD maintains a general reserve that can only be used to eliminate a deficit. As a result, during the year ended December 31, 2011, an amount of $18.1 million was transferred to retained earnings to eliminate the accumulated deficit as of that date.
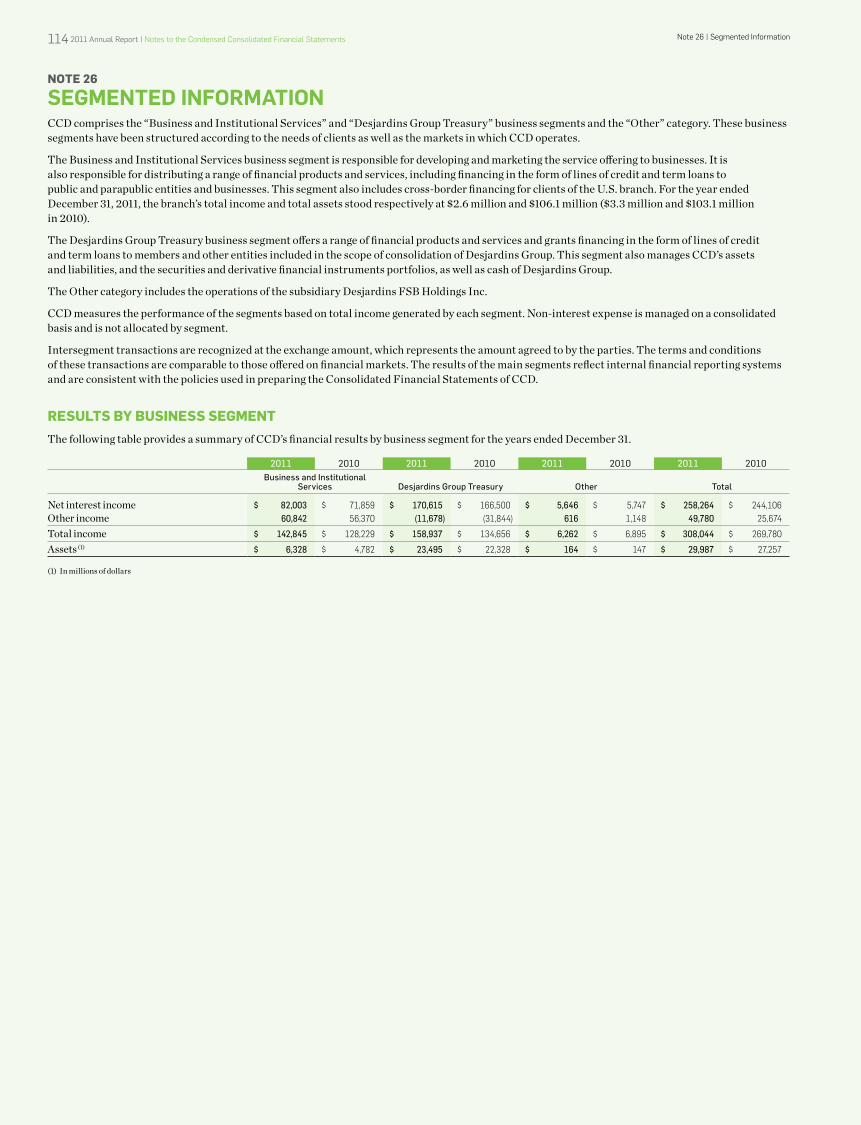
note 26 | segmented information114 2011 Annual Report | notes to the Condensed Consolidated financial statements
NOTE 26
segmented infoRmAtionCCD comprises the “Business and Institutional Services” and “Desjardins Group Treasury” business segments and the “Other” category. These business segments have been structured according to the needs of clients as well as the markets in which CCD operates.
The Business and Institutional Services business segment is responsible for developing and marketing the service offering to businesses. It is also responsible for distributing a range of financial products and services, including financing in the form of lines of credit and term loans to public and parapublic entities and businesses. This segment also includes cross-border financing for clients of the U.S. branch. For the year ended December 31, 2011, the branch’s total income and total assets stood respectively at $2.6 million and $106.1 million ($3.3 million and $103.1 million in 2010).
The Desjardins Group Treasury business segment offers a range of financial products and services and grants financing in the form of lines of credit and term loans to members and other entities included in the scope of consolidation of Desjardins Group. This segment also manages CCD’s assets and liabilities, and the securities and derivative financial instruments portfolios, as well as cash of Desjardins Group.
The Other category includes the operations of the subsidiary Desjardins FSB Holdings Inc.
CCD measures the performance of the segments based on total income generated by each segment. Non-interest expense is managed on a consolidated basis and is not allocated by segment.
Intersegment transactions are recognized at the exchange amount, which represents the amount agreed to by the parties. The terms and conditions of these transactions are comparable to those offered on financial markets. The results of the main segments reflect internal financial reporting systems and are consistent with the policies used in preparing the Consolidated Financial Statements of CCD.
RESUlTS by bUSINESS SEGmENTThe following table provides a summary of CCD’s financial results by business segment for the years ended December 31.
2011 2010 2011 2010 2011 2010 2011 2010business and institutional
services Desjardins group Treasury other Total
Net interest income $ 82,003 $ 71,859 $ 170,615 $ 166,500 $ 5,646 $ 5,747 $ 258,264 $ 244,106Other income 60,842 56,370 (11,678) (31,844) 616 1,148 49,780 25,674
Total income $ 142,845 $ 128,229 $ 158,937 $ 134,656 $ 6,262 $ 6,895 $ 308,044 $ 269,780
Assets (1) $ 6,328 $ 4,782 $ 23,495 $ 22,328 $ 164 $ 147 $ 29,987 $ 27,257
(1) In millions of dollars
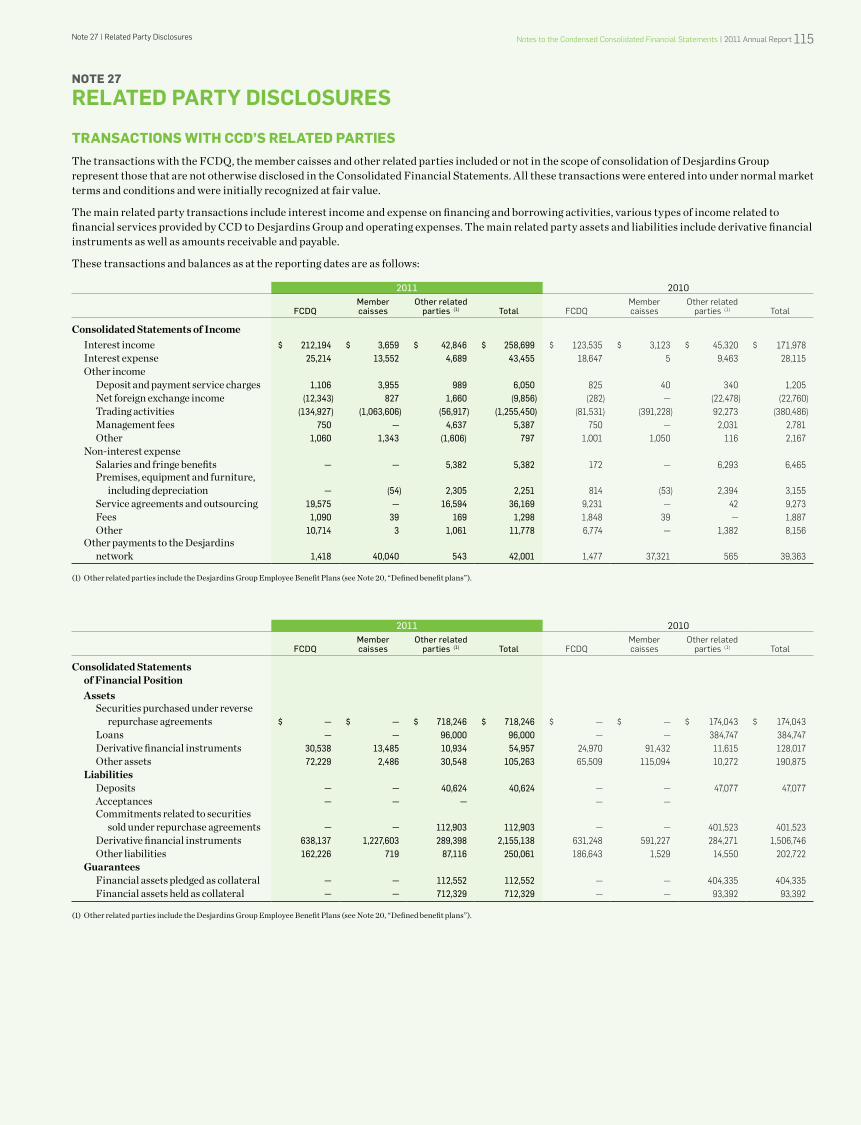
note 27 | Related Party disclosures notes to the Condensed Consolidated financial statements | 2011 Annual Report 115
NOTE 27
RelAted pARty disClosuRes
TRANSAcTIONS wITh ccd’S RElATEd PARTIESThe transactions with the FCDQ, the member caisses and other related parties included or not in the scope of consolidation of Desjardins Group represent those that are not otherwise disclosed in the Consolidated Financial Statements. All these transactions were entered into under normal market terms and conditions and were initially recognized at fair value.
The main related party transactions include interest income and expense on financing and borrowing activities, various types of income related to financial services provided by CCD to Desjardins Group and operating expenses. The main related party assets and liabilities include derivative financial instruments as well as amounts receivable and payable.
These transactions and balances as at the reporting dates are as follows:
2011 2010
fCDQmember caisses
other related parties (1) Total fCdq
Member caisses
other related parties (1) total
Consolidated Statements of Income Interest income $ 212,194 $ 3,659 $ 42,846 $ 258,699 $ 123,535 $ 3,123 $ 45,320 $ 171,978 Interest expense 25,214 13,552 4,689 43,455 18,647 5 9,463 28,115 Other income Deposit and payment service charges 1,106 3,955 989 6,050 825 40 340 1,205 Net foreign exchange income (12,343) 827 1,660 (9,856) (282) — (22,478) (22,760) Trading activities (134,927) (1,063,606) (56,917) (1,255,450) (81,531) (391,228) 92,273 (380,486) Management fees 750 — 4,637 5,387 750 — 2,031 2,781 Other 1,060 1,343 (1,606) 797 1,001 1,050 116 2,167 Non-interest expense Salaries and fringe benefits — — 5,382 5,382 172 — 6,293 6,465 Premises, equipment and furniture, including depreciation — (54) 2,305 2,251 814 (53) 2,394 3,155 Service agreements and outsourcing 19,575 — 16,594 36,169 9,231 — 42 9,273 Fees 1,090 39 169 1,298 1,848 39 — 1,887 Other 10,714 3 1,061 11,778 6,774 — 1,382 8,156 Other payments to the Desjardins network 1,418 40,040 543 42,001 1,477 37,321 565 39,363
(1) Other related parties include the Desjardins Group Employee Benefit Plans (see Note 20, “Defined benefit plans”).
2011 2010
fCDQmember caisses
other related parties (1) Total fCdq
Member caisses
other related parties (1) total
Consolidated Statements of Financial Position Assets Securities purchased under reverse repurchase agreements $ — $ — $ 718,246 $ 718,246 $ — $ — $ 174,043 $ 174,043 Loans — — 96,000 96,000 — — 384,747 384,747 Derivative financial instruments 30,538 13,485 10,934 54,957 24,970 91,432 11,615 128,017 Other assets 72,229 2,486 30,548 105,263 65,509 115,094 10,272 190,875 Liabilities Deposits — — 40,624 40,624 — — 47,077 47,077 Acceptances — — — — — Commitments related to securities sold under repurchase agreements — — 112,903 112,903 — — 401,523 401,523 Derivative financial instruments 638,137 1,227,603 289,398 2,155,138 631,248 591,227 284,271 1,506,746 Other liabilities 162,226 719 87,116 250,061 186,643 1,529 14,550 202,722 Guarantees Financial assets pledged as collateral — — 112,552 112,552 — — 404,335 404,335 Financial assets held as collateral — — 712,329 712,329 — — 93,392 93,392
(1) Other related parties include the Desjardins Group Employee Benefit Plans (see Note 20, “Defined benefit plans”).
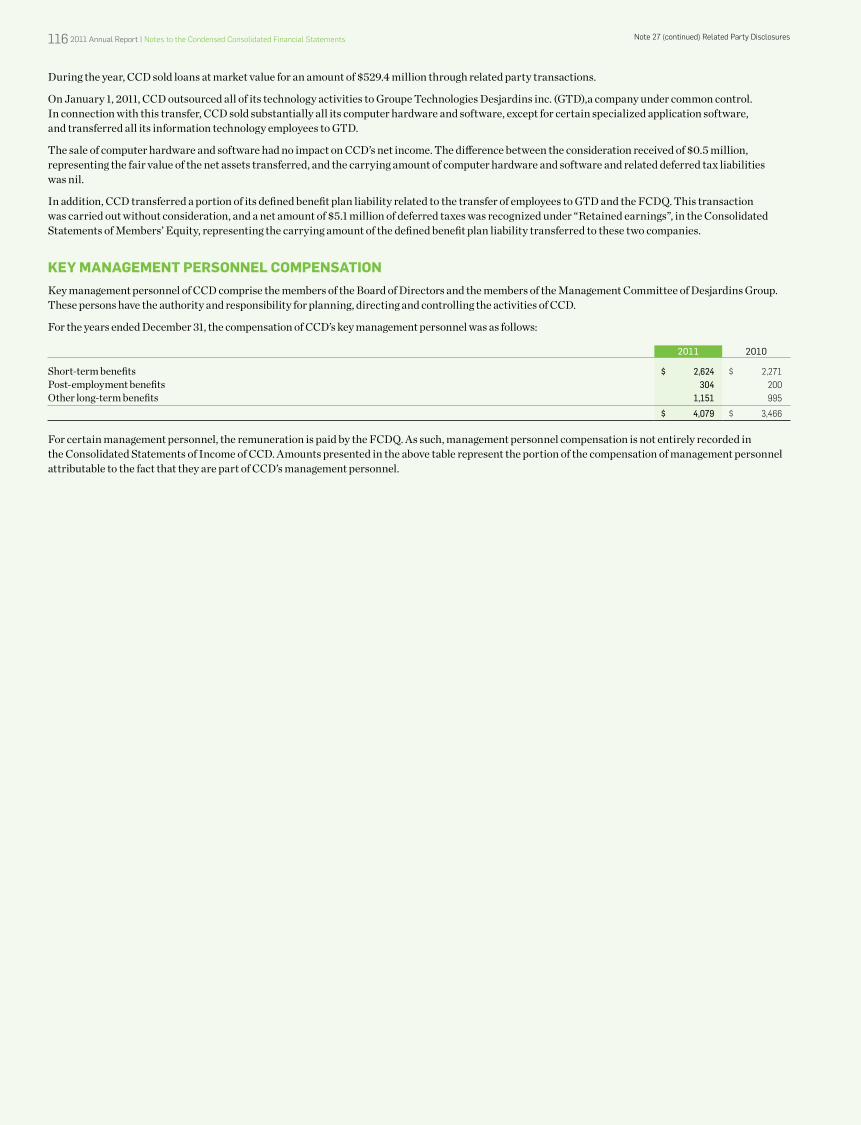
note 27 (continued) Related Party disclosures116 2011 Annual Report | notes to the Condensed Consolidated financial statements
During the year, CCD sold loans at market value for an amount of $529.4 million through related party transactions.
On January 1, 2011, CCD outsourced all of its technology activities to Groupe Technologies Desjardins inc. (GTD),a company under common control. In connection with this transfer, CCD sold substantially all its computer hardware and software, except for certain specialized application software, and transferred all its information technology employees to GTD.
The sale of computer hardware and software had no impact on CCD’s net income. The difference between the consideration received of $0.5 million, representing the fair value of the net assets transferred, and the carrying amount of computer hardware and software and related deferred tax liabilities was nil.
In addition, CCD transferred a portion of its defined benefit plan liability related to the transfer of employees to GTD and the FCDQ. This transaction was carried out without consideration, and a net amount of $5.1 million of deferred taxes was recognized under “Retained earnings”, in the Consolidated Statements of Members’ Equity, representing the carrying amount of the defined benefit plan liability transferred to these two companies.
KEy mANAGEmENT PERSONNEl cOmPENSATIONKey management personnel of CCD comprise the members of the Board of Directors and the members of the Management Committee of Desjardins Group. These persons have the authority and responsibility for planning, directing and controlling the activities of CCD.
For the years ended December 31, the compensation of CCD’s key management personnel was as follows:
2011 2010
Short-term benefits $ 2,624 $ 2,271Post-employment benefits 304 200Other long-term benefits 1,151 995
$ 4,079 $ 3,466
For certain management personnel, the remuneration is paid by the FCDQ. As such, management personnel compensation is not entirely recorded in the Consolidated Statements of Income of CCD. Amounts presented in the above table represent the portion of the compensation of management personnel attributable to the fact that they are part of CCD’s management personnel.