Embed Size (px)
Citation preview

1
Consolidated Financial Results for Fiscal 2021
(April 1, 2020 - March 31, 2021)
May 12, 2021 Listed Company Name: Rinnai Corporation Listings: First sections of the Tokyo and Nagoya Stock Exchanges (Securities Code: 5947) Website: https://www.rinnai.co.jp/ Representative: Hiroyasu Naito, President Contact: Takuya Ogawa, Senior Executive Officer, General Manager of Corporate Planning Headquarters TEL: +81 (52) 361-8211 Date of the General Meeting of Shareholders: June 29, 2021 Anticipated date to begin distributing dividends: June 30, 2021 Anticipated date for releasing annual securities report: June 29, 2021 Supplemental information sheets of financial results: Yes Information meeting of financial results: Yes (for analysts and institutional investors)
1. Performance for the Year Ended March 31, 2021 (April 1, 2020 to March 31, 2021; Amounts less than one million yen are omitted)
(1) Consolidated Operating Results (Year ended March 31) (Percentage figures in columns indicate increase or decrease from the previous term.)
(¥ millions /%)
Net Sales (% change)
Operating Income (% change)
Ordinary Income (% change)
Net income Attributable to Owners of the
Parent Company (% change)
Fiscal 2021 344,364 (+1.1) 40,690 (+18.2) 42,400 (+18.8) 27,581 (+27.9)
Fiscal 2020 340,460 (-2.2) 34,422 (+11.5) 35,679 (+7.1) 21,561 (+5.3)
Note: Comprehensive income:
Year ended March 31, 2021: ¥36,763 million (+51.0%)
Year ended March 31, 2020: ¥24,339 million (+41.3%)
Net Income per Share
(¥)
Fully Diluted Net Income per
Share (¥)
Ratio of Net Income
to Equity Capital (%)
Ratio of Ordinary
Income to Total Assets (%)
Ratio of Operating Income
to Net Sales (%)
Fiscal 2021 536.62 — 8.4 8.9 11.8
Fiscal 2020 419.49 — 7.0 8.1 10.1
References: Equity in earnings of companies accounted for using the equity method:
Year ended March 31, 2021: ¥8 million Year ended March 31, 2020: ¥(14) million
(2) Consolidated Financial Position (at March 31) (¥ millions) Total Assets Net Assets Equity Ratio (%) Net Assets per Share
(¥)
Fiscal 2021 497,291 371,318 68.8 6,660.40
Fiscal 2020 450,486 340,959 70.1 6,140.52
(Reference) Equity capital: Year ended March 31, 2021; ¥342,329 million
Year ended March 31, 2020; ¥315,615 million
(3) Consolidated Cash Flows (Years ended March 31) (¥ millions)
Cash Flows from Operating Activities
Cash Flows from Investing Activities
Cash Flows from Financing Activities
Cash and Cash Equivalents at End of Year
Fiscal 2021 49,491 (15,820) (7,269) 166,524
Fiscal 2020 37,694 (7,124) (6,436) 140,138

2
2. Dividends Dividend per Share
1st Quarter
(¥) Interim
(¥) 3rd Quarter
(¥)
Fiscal Year-End (¥)
Full Year (¥)
Fiscal 2020 — 48.00 — 50.00 98.00
Fiscal 2021 — 55.00 — 70.00 125.00
Fiscal 2022 (anticipated)
— 70.00 — 70.00 140.00
Total Dividends (Full Year) (¥ millions)
Consolidated Payout Ratio
(%)
Consolidated Ratio of Dividends to
Net Assets (%)
Fiscal 2020 5,037 23.4 1.6
Fiscal 2021 6,424 23.3 2.0
Fiscal 2022 (anticipated)
27.7
Note: Composition of interim dividends of Fiscal 2021;
common dividends ¥50.00,
memorable dividends of the 100th anniversary of its founding ¥5.00
Composition of year-end dividends of Fiscal 2021;
common dividends ¥65.00,
memorable dividends of the 100th anniversary of its founding ¥5.00
3. Forecast for the Fiscal Year Ending March 31, 2022 (April 1, 2021, to March 31, 2022)
(¥ millions)
Net Sales
(% change)
Operating Income
(% change)
Ordinary Income
(% change)
Net income Attributable to Owners of the
Parent Company (% change)
Net Income
per Share (¥)
Two-quarter total 169,000 (+13.5) 15,800 (+21.9) 16,300 (+17.1) 9,900 (-1.3) 192.62
Full year 365,000 (+6.0) 41,000 (+0.8) 42,000 (-0.9) 26,000 (-5.7) 505.86
(Percentage figures in columns indicate increase or decrease from the previous term.)
* Notes
(1) Changes in scope of consolidation of major subsidiaries during the period: None
Newly included one company — (Company name: —): Excluded — (Company name: —)
(2) Changes in accounting policies; changes in accounting estimates; retrospective restatement
(a) Changes due to revision of accounting standard: None
(b) Other changes than (a): None
(c) Changes in the rules for the accounting estimates: None
(d) Retrospective restatement: None
(3) Number of Outstanding Shares (Common Stock)
(a) Number of outstanding shares at fiscal year-end (including treasury stock)
Year ended March 31, 2021: 51,616,463 shares
Year ended March 31, 2020: 51,616,463 shares
(b) Number of treasury stock at fiscal year-end
Year ended March 31, 2021: 218,686 shares
Year ended March 31, 2020: 217,646 shares
(c) Average number of shares during the term
Year ended March 31, 2021: 51,398,382 shares
Year ended March 31, 2020: 51,399,210 shares

3
References: Summary of Nonconsolidated Results
1. Nonconsolidated Performance for the Year Ended March 31, 2021 (April 1, 2020 to March 31, 2021; Amounts less than one million yen are omitted)
(1) Nonconsolidated Operating Results (Years ended March 31) (¥ millions)
Net Sales (% change)
Operating Income (% change)
Ordinary Income (% change)
Net Income (% change)
Fiscal 2021 212,388 (+2.2) 20,612 (+18.7) 23,515 (+15.9) 18,208 (+20.9)
Fiscal 2020 207,805 (+0.9) 17,359 (+18.9) 20,295 (+6.7) 15,058 (+6.2)
(Percentage figures in columns indicate increase or decrease from the previous term.)
Net Income per Share
(¥)
Fully Diluted Net Income per
Share (¥)
Fiscal 2021 354.25 —
Fiscal 2020 292.97 —
(2) Nonconsolidated Financial Position (at March 31) (¥ millions) Total Assets Net Assets Equity Ratio (%) Net Assets per Share
(¥)
Fiscal 2021 290,346 234,199 80.7 4,556.61
Fiscal 2020 270,011 220,548 81.7 4,290.93
(Reference) Equity capital: Year ended March 31, 2021; ¥234,199 million
Year ended March 31, 2020; ¥220,548 million
* This report is exempt from an auditing process.
* Note on appropriate use of performance forecasts, and other specified notes
Performance forecasts contained in this document are based on information currently
available and certain judgments deemed by the Corporation to be reasonable. No intent is
implied of promise by the Corporation to achieve such forward-looking statements. Actual
results may differ significantly from such forecasts due to various factors. For more
information, please refer to “1. Consolidated Performance, (4) Consolidated Performance
Forecasts” on page 6 of this report.
*Supplemental information sheets of financial results are posted on the Corporation’s
website on Wednesday, May 12, 2021.

4
1. Consolidated Performance
(1) Fiscal Year in Review
In the fiscal year under review, the world economy was heavily affected by the spread of
COVID-19. Although there has been a gradual resumption of economic activity, there is no
end in sight for the pandemic, and the situation remains serious due to the tightening of
regulations on economic activities in many countries. In Japan, despite signs of a pickup in
economic activity, the outlook remains uncertain amid indications of weakness in non-
manufacturing sectors.
The domestic housing industry saw an ongoing moderate decline in new housing
starts despite signs of a recovery in among owner-occupied properties. In the household
appliance industry, there has been no recovery in demand due to a decrease in
opportunities for contact with consumers stemming from restraint in our participation in
trade shows and other events.
The period under review was the final year of the Rinnai Group’s medium-term business
plan, “G-shift 2020,” which started in April 2018. Under the plan (with the slogans “heat and
lifestyles” and “health and lifestyles”), we sought to create unique products and services by
incorporating new technologies into our core technologies, in addition to supplying existing
offerings.
The Group also celebrated its 100th anniversary in the year under review. As a company
that creates healthy and comfortable lifestyles, we are working to achieve sustainable
growth for the next 100 years.
During the year, we made relentless Groupwide efforts to cut basic costs despite the
impact of COVID-19 on our business activities. We also embraced solid stay-at-home
demand associated with the pandemic and posted year-on-year increases in sales of high-
value-added gas stoves and water heaters.
As a result, consolidated net sales for the year amounted to ¥344,364 million, up 1.1%
from the previous year. Operating income rose 18.2%, to ¥40,690 million, and ordinary
income climbed 18.8%, to ¥42,400 million. Net income attributable to owners of the parent
company jumped 27.9%, to ¥27,581 million.
Our results by geographical segment were as follows:
Japan
In Japan, we enjoyed growth in sales of gas clothes dryers and dishwashers, as well as
increased sales of gas stoves with automatic cooking functions amid growing demand
among people staying at home. We also benefited from replacement demand for water
heaters due to cold weather at the end of 2020. As a result, sales in Japan increased 1.1%
year on year, to ¥183,136 million, and operating income rose 18.6%, to ¥24,544 million.

5
United States
In the United States, we benefited from healthy demand among people staying at home due
to the COVID-19 pandemic, as well as a steady housing market buoyed by people
relocating to suburban areas to avoid infections. Sales of tankless gas water heaters also
continued to expand. Accordingly, sales increased 11.6%, to ¥36,971 million, and operating
income rose 12.3%, to ¥2,177 million.
Australia
Our business in Australia benefited from healthy sales of both tankless and storage-type
water heaters, as well as growth in sales of room heaters stemming from an increase in
people working at home due to COVID-19. As a result, sales increased 2.8%, to ¥24,311
million, and operating income surged 132.2% to ¥911 million.
China
Sales in China declined 6.9% year on year, to ¥41,160 million, reflecting a significant drop
in sales at the beginning of the period due to COVID-19. However, operating income rose
4.0%, to ¥6,667 million, thanks to a recovery in sales of water heaters, mainly through
Internet sales, following the lifting of restrictions on economic activities.
South Korea
In South Korea, we reported increases in sales of both gas and electric stoves thanks to
emergency disaster relief funds provided by the government to address the COVID-19
pandemic. We also posted growth in sales of high-efficiency boilers in response to stricter
environmental regulations. As a result, sales increased 2.4%, to ¥28,358 million, and
operating income was ¥141 million (compared with an operating loss of ¥17 million in the
previous year).
Indonesia
In Indonesia, we reported an increase in sales of tabletop stoves driven by stay-at-home
demand associated with COVID-19. We also posted significant growth in sales of high-
priced built-in hobs (stovetops) and range hoods as customers embraced new our new
products. As a result, sales increased 5.1%, to ¥11,248 million, and operating income
jumped 51.4%, to ¥2,423 million.

6
References 1: Net sales by product (¥ millions)
Year ended March 31, 2020 (April 1, 2019,
to March 31, 2020)
Year ended March 31, 2021 (April 1, 2020,
to March 31, 2021)
Change
Amount % of total Amount % of total Amount (%)
Water heaters 196,122 57.6 195,755 56.8 (366) (0.2)
Kitchen appliances 86,193 25.3 88,441 25.7 2,247 2.6
Air conditioning appliances 18,901 5.6 19,013 5.5 111 0.6
Commercial-use equipment 8,556 2.5 7,726 2.2 (829) (9.7)
Others 30,685 9.0 33,428 9.7 2,742 8.9
Total 340,460 100.0 344,364 100.0 3,904 1.1
References 2: Overseas sales (¥ millions)
Year ended March 31, 2020
(April 1, 2019,
to March 31, 2020)
Year ended March 31, 2021
(April 1, 2020,
to March 31, 2021)
Asia Other
regions Total Asia
Other regions
Total
I. Overseas sales 98,819 68,089 166,909 97,187 71,281 168,469
II. Consolidated net sales — — 340,460 — — 344,364
III. Composition ratio of
overseas sales to consolidated
net sales
29.0% 20.0% 49.0% 28.2% 20.7% 48.9%
Note: Overseas sales of the above indicate sales of the Corporations in overseas countries or regions.
(2) Financial Position
As of March 31, 2021, the Rinnai Group had total assets of ¥497,291 million, up ¥46,805
million from a year earlier. This rise stemmed mainly from an increase in cash and deposits.
Total liabilities increased ¥16,445 million, to ¥125,973 million, due to an increase in
notes and accounts payable.
Net assets were up ¥30,359 million, to ¥371,318 million, boosted by net income
attributable to owners of the parent company.
As a result, the equity ratio at fiscal year-end was 68.8%.
(3) Cash Flows
Cash and cash equivalents at March 31, 2021, stood at ¥166,524 million, up ¥26,385
million, or 18.8%, from a year earlier.
Net cash provided by operating activities amounted to ¥49,491 million, up 31.3%
from the previous year. Main factors included the secured operating income and a cash
decrease due to income taxes paid.
Net cash used in investing activities totaled ¥15,820 million, up 122.1% from the
previous year. Main factors were purchases of tangible fixed assets.
Net cash used in financing activities was ¥7,269 million, up 12.9% from the previous
year. Main factors were payment of dividends.
(4) Outlook for the Year Ending March 2022
Looking ahead, we believe that the impact of COVID-19 on economic activities, as well as
changes in people’s lifestyles and work styles associated with the prevention of infectious

7
diseases, will continue. In addition to trade-related issues between the United States and
China, meanwhile, business conditions for the Rinnai Group have become extremely
challenging due to soaring prices of materials and increasing risks affecting global
procurement of parts.
Under these circumstances, the Group launched its new medium-term business plan,
entitled “New ERA 2025,” covering the five-year period from April 2021 to March 2026. As a
company that creates healthy and comfortable ways of living, we will provide a variety of
products and services under the themes of “improving quality of life” and “Help resolve
global environmental problems.”
In Japan, we will step up sales of gas clothes dryers and dishwasher/dryers, which help
improve quality of life. We will also strengthen sales of products that are unique to our
business. These include environmentally friendly and energy-efficient water heaters, such
as ECO ONE hybrid water heaters and heating systems that help combat global warming.
Overseas, we will strive to increase sales of tankless gas water heaters, particularly in the
United States, and expand our sales channels in emerging nations and untapped regions.
Our consolidated forecasts for fiscal 2022, ending March 2022, are as follows: Net sales of
¥365.0 billion (up 6.0% year on year), operating income of ¥41.0 billion (up 0.8%), ordinary
income of ¥42.0 billion (down 0.9%), and net income attributable to owners of the parent
company of ¥26.0 billion (down 5.7%).
2. Medium-Term Business Plan
Although we expect COVID-19 vaccination programs to make good progress, the outlook
for the global economy will remain uncertain as there is no end in sight for the pandemic. In
addition to the impact of COVID-19, advances in artificial intelligence, IoT, and other
information technologies will continue transforming lifestyles and work styles, and people’s
value standards will also change dramatically. Meanwhile, countries around the world are
stepping up efforts to decarbonize their societies amid increasing international concern
about global warming. Accordingly, companies that handle fossil fuels we will be required to
change their business operations over the long term with a decarbonized society in mind.
Under these circumstances, the Rinnai Group changed the period of its medium-term
business plan from three years to five years in order to achieve sustainable corporate
growth from a long-term perspective, and unveiled its new medium-term business plan,
entitled “New ERA 2025,” covering the five-year period from April 2021 to March 2026.
The new plan has three key strategies: “Expansion of business scale” (expand
regional domains and expand business domains), “Revolution of corporate structure”
(become more consumer-oriented and make focused investments in intangible assets, and
enhance profitability), and “Advancement in addressing social issues” (improve quality of
life and promote products that benefit the global environment). In addition, we will make
forward-looking investments with an eye to the future business environment while deploying

8
all kinds of energy sources and our core technologies to help resolve global social issues in
the fields of “heat and lifestyles” and “health and lifestyles.” In these ways, we will fulfill our
promise to our customers—“Creating a healthier way of living”— and achieve sustainable
and robust long-term growth.
Three key strategies
1. Advancement in addressing social issues: Improve quality of life; Help resolve global
environmental problems
2. Expansion of business scale: Expand regional domains; Expand business domains
3. Revolution of corporate structure: Become more consumer-oriented; Make focused
investments in intangible assets; Enhance profitability
Numerical targets for fiscal 2026 (ending March 2026)
1. Consolidated net sales: ¥450 billion
2. Consolidated operating income: ¥50 billion
3. Consolidated operating margin: 11.1%
4. Return on invested capital (ROIC): 19%
5. Total return ratio (five-year average): 40%
6. Increase in sales of products that improve quality of life and benefit the global
environment: 50% or higher (compared with fiscal 2021)
*Products that improve quality of life: Products that make a special contribution to
improvements in quality of life in accordance with the living standards of each country.
Quality-of-life improvement criteria
1. Reduced stress through improved convenience
2. Increased safety of living spaces
3. Improved levels of hygiene and health
4. Enhanced resilience
*Products that benefit the global environment: Products that help reduce emissions of
greenhouse gases and air pollutants

9
3. Outline of Rinnai Group Companies The Rinnai Group consists of the parent company, 45 subsidiaries, and three affiliated companies, for a total of 49 companies. These include 36 consolidated subsidiaries, and an affiliated company (equity method applied). The Group is primarily engaged in the manufacture and sale of heating appliances and components, and related businesses. The Group’s structure and business flow are shown below.
Overseas (34 companies) Domestic (14 companies) Holding Company /
Sale of Products (1 company) Sale of Products (11 companies) Sale of Products (1 companies) \
Manufacture and Sale of Manufacture and Sale of Products (11 companies) Products (3 companies) Manufacture and Sale of Manufacture and Sale of Components (6 companies) Components (4 companies) Other Business (7 companies) Other Business (4 companies)
4. Basic Policy Regarding Selection of Accounting Standard The Rinnai Group has prepared these consolidated financial statements based on to the
“Ordinance on Terminology, Forms, and Preparation Methods of Consolidated Financial
Statements” (Ordinance of the Ministry of Finance No. 28 of 1976), except for Chapters 7 and 8.
With respect to application of international accounting standards, the Group’s policy is to
respond appropriately after considering various circumstances in Japan and overseas.
Rinnai Holdings (Pacific) Pte Ltd. (i)
Rinnai Italia s.r.l. (i) Rinnai Hong Kong Ltd. (i) Rinnai Canada Holdings Ltd. (i) Shanghai Rinnai Thermo Energy
Engineering Co., Ltd. (i) Guangzhou Rinnai Gas and Electric Appliance Co., Ltd. (i) Rinnai Plus Corp. (ii) Rinnai (Malaysia) Sdn. Bhd. (ii) Rinnai UK Ltd. (ii) Rinnai Trading B.V. (ii) Central Heating New Zealand Ltd. (iii) Hainan Rinnai Minsheng Kitchen (iv)
Rinnai America Corporation (i) Rinnai Australia Pty., Ltd. (i) Shanghai Rinnai Co., Ltd. (i) Rinnai Korea Corporation (i) P.T. Rinnai Indonesia (i) Rinnai New Zealand Ltd. (i) Rinnai Taiwan Corporation (i) Rinnai (Thailand) Co., Ltd. (i) Rinnai Viet Nam Co., Ltd. (i) Rinnai Brasil Heating Technology Ltd. (i) Rinnai Manufacturing Malaysia Sdn Bdh (i)
RB Korea Ltd. (i) RS Korea Ltd. (ii) Shanghai RB Controls Co., Ltd. (ii) Mikuni RK Corporation (iv)
Yanagisawa Manufacturing Co., Ltd. (i) Rinnai Technica Co., Ltd. (i) Gastar Co.,Ltd. (i)
RB Controls Co., Ltd. (i) Rinnai Precision Co., Ltd. (i) RT Engineering Co., Ltd. (i) Japan Ceramics Co., Ltd. (i) Noto Tech Co., Ltd. (i) Techno Parts Co., Ltd. (i)
Rinnai Net Co., Ltd. (i)
C
L
I
E
N
T
Gas Appliance Services Pty., Ltd. (i) and others
C
L
I
E
N
T
i. Consolidated subsidiary ii. Nonconsolidated subsidiary iii. Affiliated company (equity method applied) iv. Affiliated company (equity method not applied)
Production and consignment Product purchases and processing by outsourcing
R
I
N
N
A
I
Rinnai Enterprises (i) and others

10
5. Consolidated Financial Statements
(1) Consolidated Balance Sheets
(¥ millions)
At March 31, 2020
(Year ended
March 31, 2020)
At March 31, 2021
(Year ended
March 31, 2021)
Amount Amount
ASSETS
Current assets
Cash and deposits
Notes and accounts receivable
Electronically Recorded Monetary Claims
Marketable securities
Products
Raw materials and stores
Other
Less allowance for doubtful accounts
167,090
67,776
8,199
6,364
27,490
17,138
2,743
(2,090)
186,412
74,997
9,350
18,522
25,532
17,558
2,531
(2,751)
Total current assets 294,713 332,153
Fixed assets
Property, plant and equipment
Buildings and structures 73,355 74,800
Accumulated depreciation (38,762) (40,579)
Buildings and structures (net) 34,592 34,221
Machinery and vehicles 62,956 63,114
Accumulated depreciation (45,958) (47,495)
Machinery and vehicles (net) 16,997 15,618
Tools and fixtures 37,582 38,138
Accumulated depreciation (32,852) (33,612)
Tools and fixtures (net) 4,730 4,525
Land 22,697 24,078
Lease assets 4,220 4,513
Accumulated depreciation (792) (1,118)
Lease assets (net) 3,428 3,394
Construction in progress 2,187 4,834
Total property, plant and equipment 84,633 86,672
Intangible fixed assets 3,480 3,232
Investments and advances
Investments in securities
Net defined benefit assets
Deferred income taxes
Other
Less allowance for doubtful accounts
40,865
20,741
3,613
2,496
(58)
40,783
28,096
3,774
2,637
(57)
Total investments and advances 67,659 75,234
Total fixed assets 155,773 165,138
Total assets 450,486 497,291

11
(¥ millions)
At March 31, 2020
(Year ended
March 31, 2020)
At March 31, 2021
(Year ended
March 31, 2021)
Amount Amount
LIABILITIES
Current liabilities
Notes and accounts payable
Electronically recorded obligations
Other payables
Accrued consumption taxes
Accrued income taxes
Accrued employee’s bonuses
Allowance for product guarantee
Other
18,392
30,851
14,828
2,882
4,834
4,497
3,504
6,814
21,974
33,527
17,087
2,794
7,380
4,804
3,568
8,400
Total current liabilities 86,607 99,538
Long-term liabilities
Deferred tax liabilities
Allowance for environmental measures
Net defined benefit liabilities
Other
7,717
2,255
9,503
3,443
10,926
2,255
9,660
3,592
Total long-term liabilities 22,919 26,434
Total liabilities 109,527 125,973
NET ASSETS:
Shareholders’ equity:
Common stock
Capital surplus
Earned surplus
Treasury stock
6,459
8,756
293,807
(1,870)
6,459
8,648
315,992
(1,881)
Total shareholders’ equity 307,153 329,219
Other accumulated comprehensive income:
Unrealized gain on marketable securities
Foreign exchange translation adjustment
Remeasurements of defined benefit plans
5,144
(1,908)
5,225
6,058
(2,885)
9,937
Total other accumulated comprehensive
income 8,461 13,110
Non-controlling interests 25,343 28,989
Total net assets 340,959 371,318
Total liabilities and net assets 450,486 497,291

12
(2) Consolidated Statements of Income and Consolidated Statements of Comprehensive Income
Consolidated Statements of Income
(¥ millions)
Fiscal 2020
(April 1, 2019,
to March 31, 2020)
Fiscal 2021
(April 1, 2020,
to March 31, 2021)
Amount Amount
Net sales
Cost of Sales
340,460
227,885
344,364
229,032
Gross Profit 112,575 115,331
Selling, general and administrative
expenses
Transportation and packing
Advertising
Sales promotion
Transfer to allowance for product guarantee
Salary and bonuses
Transfer to allowance for employee’s
bonuses
Retirement benefit expenses
Depreciation
Other
9,447
3,729
9,763
3,513
24,591
2,174
416
2,594
21,920
9,370
3,444
8,117
3,494
23,397
2,401
500
2,663
21,250
Total selling, general and administrative
expenses 78,153 74,641
Operating income 34,422 40,690
Other income:
Interest income
Dividends received
Other
1,083
400
844
957
371
851
Total other income 2,328 2,179
Other expenses:
Interest expenses
Foreign exchange loss
Loss on retirement of fixed assets
Other
48
506
360
154
50
115
193
110
Total other expenses 1,070 469
Ordinary income 35,679 42,400
Extraordinary income:
Gain on sales of investment securities
—
1,445
Total extraordinary income — 1,445
Extraordinary losses:
Special retirement expenses
844
—
Total extraordinary losses 844 —
Income before income taxes 34,834 43,846
Income taxes:
Current
Deferred
8,852
292
11,017
585
Total income taxes 9,144 11,602
Net income 25,690 32,243
Net income attributable to non-controlling interests
4,128 4,662
Net income attributable to owners of the parent company
21,561 27,581

13
Consolidated Statements of Comprehensive Income
(¥ millions)
Fiscal 2020
(April 1, 2019,
to March 31, 2020)
Fiscal 2021
(April 1, 2020,
to March 31, 2021)
Amount Amount
Net income
Other comprehensive income
Unrealized gain on marketable securities
Foreign exchange translation adjustment
Remeasurements of defined benefit plans
Equity equivalents in equity method affiliates
25,690
(455)
(1,577)
682
(0)
32,243
916
(1,110)
4,711
2
Total other comprehensive income (1,350) 4,519
Comprehensive income 24,339 36,763
Total comprehensive income attributable to: Owners of Rinnai Corporation
Non-controlling interest
20,379
3,960
32,230
4,533

14
(3) Consolidated Statements of Shareholders’ Equity
Fiscal 2020 (April 1, 2019, to March 31, 2020) (¥ millions)
Shareholders’ equity
Common stock
Capital surplus
Earned surplus
Treasury stock
Total shareholders’
equity
Balance at the beginning of
current term
6,459 8,756 276,143 (1,864) 289,495
Net changes during the current
term
Dividends paid
Net income attributable to owners
of the parent company
Acquisition of treasury stock
Change in the scope of
consolidation
Change in ownership interest of
parent due to transactions with
non-controlling interests
Net other changes than
shareholders’ equity during the
current term
(4,934)
21,561
1,037
(6)
(4,934)
21,561
(6)
1,037
—
Total net changes during the
current term
— —
17,664 (6) 17,658
Balance at the end of current
term
6,459 8,756 293,807 (1,870) 307,153
Other accumulated comprehensive income
Non- controlling interests
Total net assets
Unrealized gain on
marketable securities
Foreign exchange translation adjustment
Remeasure-ments of defined benefit plans
Total other accumulated
comprehensive income
Balance at the beginning of
current term
5,599 (488) 4,529 9,640 21,560 320,696
Net changes during the current
term
Dividends paid
Net income attributable to owners
of the parent company
Acquisition of treasury stock
Change in the scope of
consolidation
Change in ownership interest of
parent due to transactions with
non-controlling interests
Net other changes than
shareholders’ equity during the
current term
(455)
(1,419)
695
(1,179)
3,783
(4,934)
21,561
(6)
1,037
—
2,604
Total net changes during the
current term
(455) (1,419) 695 (1,179) 3,783 20,262
Balance at the end of current
term
5,144 (1,908) 5,225 8,461 25,343 340,959
15
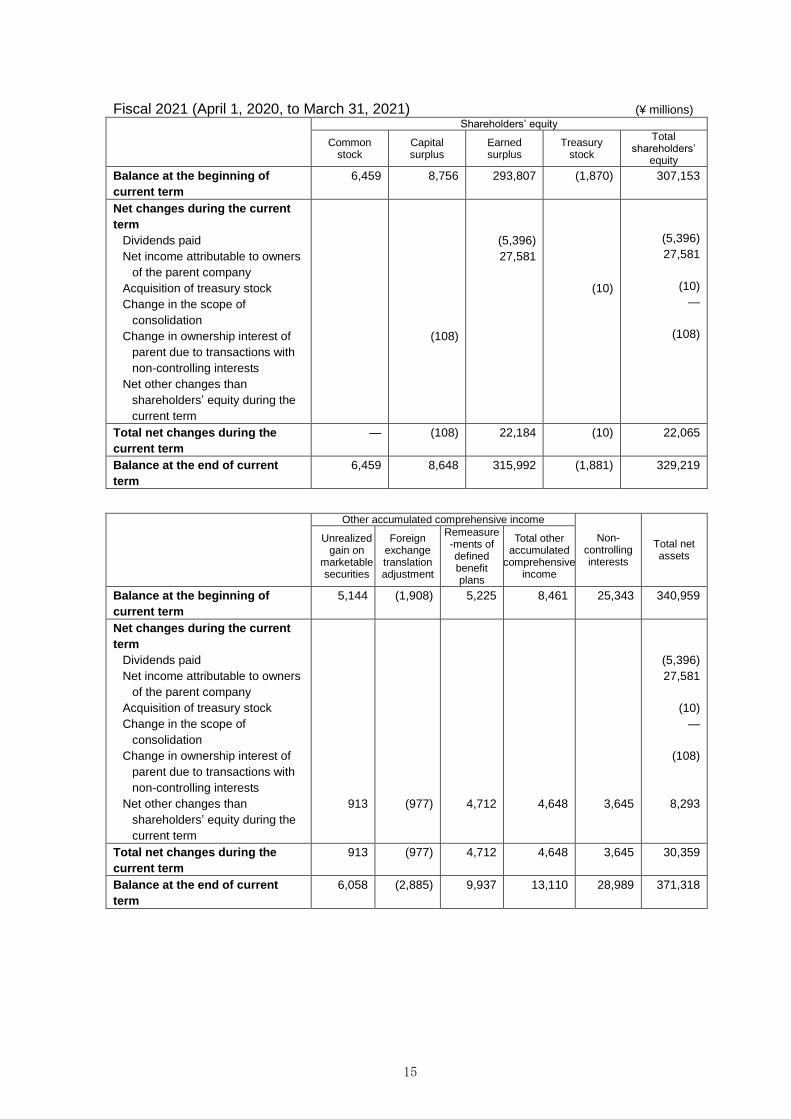
Fiscal 2021 (April 1, 2020, to March 31, 2021) (¥ millions)
Shareholders’ equity
Common stock
Capital surplus
Earned surplus
Treasury stock
Total shareholders’
equity
Balance at the beginning of
current term
6,459 8,756 293,807 (1,870) 307,153
Net changes during the current
term
Dividends paid
Net income attributable to owners
of the parent company
Acquisition of treasury stock
Change in the scope of
consolidation
Change in ownership interest of
parent due to transactions with
non-controlling interests
Net other changes than
shareholders’ equity during the
current term
(108)
(5,396)
27,581
(10)
(5,396)
27,581
(10)
—
(108)
Total net changes during the
current term
— (108) 22,184 (10) 22,065
Balance at the end of current
term
6,459 8,648 315,992 (1,881) 329,219
Other accumulated comprehensive income
Non- controlling interests
Total net assets
Unrealized gain on
marketable securities
Foreign exchange translation adjustment
Remeasure-ments of defined benefit plans
Total other accumulated
comprehensive income
Balance at the beginning of
current term
5,144 (1,908) 5,225 8,461 25,343 340,959
Net changes during the current
term
Dividends paid
Net income attributable to owners
of the parent company
Acquisition of treasury stock
Change in the scope of
consolidation
Change in ownership interest of
parent due to transactions with
non-controlling interests
Net other changes than
shareholders’ equity during the
current term
913
(977)
4,712
4,648
3,645
(5,396)
27,581
(10)
—
(108)
8,293
Total net changes during the
current term
913 (977) 4,712 4,648 3,645 30,359
Balance at the end of current
term
6,058 (2,885) 9,937 13,110 28,989 371,318

16
(4) Consolidated Statements of Cash Flows (¥ millions)
Fiscal 2020
(April 1, 2019,
to March 31,
2020)
Fiscal 2021
(April 1, 2020,
to March 31,
2021)
Amount Amount
Cash flows from operating activities
Income before income taxes
Depreciation and amortization
(Increase) decrease in net defined benefit assets
Increase (decrease) in net defined benefit liabilities
Interest and dividends income
Special retirement expenses
(Gains) losses on sales of investments in securities
Decrease (increase) in trade receivables
Decrease (increase) in inventories
Increase (decrease) in trade payables
Increase (decrease) in accrued consumption taxes
Increase (decrease) in other liability
Other
34,834
12,134
(1,087)
(471)
(1,483)
844
—
4,749
436
(5,580)
630
90
485
43,846
11,413
(645)
222
(1,328)
—
(1,445)
(8,506)
1,086
6,332
(84)
4,310
1,661
Subtotal 45,583 56,862
Interest and dividends received
Subsidy income received
Interest paid
Special retirement expenses paid
Income taxes paid
1,540
254
(44)
(696)
(8,942)
1,339
—
(50)
(142)
(8,516)
Net cash provided by operating activities 37,694 49,491
Cash flows from investing activities
Transfers to time deposits
Withdrawals from time deposits
Purchases of securities
Proceeds from redemption of securities
Purchases of tangible fixed assets
Purchases of intangible fixed assets
Purchases of investments in securities
Proceeds from sales/and redemption of investments
in securities
Other
(38,269)
35,480
(853)
1,749
(9,742)
(651)
(8,939)
14,662
(560)
(37,492)
33,453
(1,122)
1,384
(12,609)
(672)
(5,420)
6,786
(128)
Net cash used in investing activities (7,124) (15,820)
Cash flows from financing activities
Dividends paid
Dividends paid to non-controlling interests
Other
(4,933)
(838)
(664)
(5,395)
(455)
(1,418)
Net cash used in financing activities (6,436) (7,269)
Effect of exchange rate fluctuations on cash and cash
equivalents (377) (15)
Net increase (decrease) in cash and cash equivalents 23,755 26,385
Cash and cash equivalents at beginning of year 116,133 140,138
Increase in cash and cash equivalents due to newly
consolidation 249
—
Cash and cash equivalents at end of year 140,138 166,524
17
(5) Notes to Consolidated Financial Statements
Notes regarding the assumption of a going concern
There are no relevant items.
Segment Information
(1) Summary of Reportable Segments
With respect to its business segments, Rinnai is able to obtain delineated financial data
from among its structural units. Accordingly, its segments are subject to regular examination
in order to assist decision-making on allocation of managerial resources and evaluation of
business performance.
The Rinnai Group is engaged mainly in the production and sales of heat appliances.
The Corporation (parent company) and domestic subsidiaries are in charge of business
activities in Japan, while overseas subsidiaries in United States, Australia, and elsewhere
are in charge of business activities in the respective regions. Local subsidiaries operate as
independently managed units. With respect to products handled, they advance their
operations based on their comprehensive strategies for their specific regions.
Accordingly, the reportable segments of the Corporation, which are geographic
segments based on its production and sales system, consist of six regions: Japan, United
States, Australia, China, South Korea, and Indonesia.
(2) Calculation Methods of Sales, Income, Assets, and Other Items by
Reportable Segment
Accounting treatments of the reportable segments of the Corporation are much the same in
the accounting treatments of Consolidated Financial Statements.
Income of the reportable segment indicates figures based on operating income.

18
(3) Sales and Income (Loss), Assets, and Other Items by Reportable Segment Year ended March 31, 2020 (From April 1, 2019 to March 31, 2020) (¥ millions)
Reportable Segments
Others (Note 1)
Adjustments (Note 2, 3)
Amounts in Consolidated Statements of
Income (Note 4)
Japan United States
Australia China South Korea
Indonesia Total
Net sales
Sales to outside customers
181,072 33,133 23,652 44,226 27,695 10,699 320,481 19,979 — 340,460
Intersegment sales
35,632 — 108 1,744 955 563 39,004 2,417 (41,421) —
Total 216,704 33,133 23,760 45,971 28,651 11,263 359,485 22,396 (41,421) 340,460
Segment Income (loss)
20,703 1,939 392 6,410 (17) 1,600 31,029 2,976 416 34,422
Segment Assets 334,369 16,162 21,558 42,535 17,762 12,514 444,903 29,064 (23,482) 450,486
Others
Depreciation 7,732 297 553 1,500 1,196 333 11,613 520 — 12,134
Investments in company to which equity method applied
— — — — — — — 279 — 279
Amortization of goodwill
129 — 212 — — — 341 — — 341
Increase in property, plant and equipment and intangible fixed assets (Note 5)
7,856 807 439 835 505 181 10,624 607 — 11,232
Notes:1. “Others” include sales from subsidiaries in Taiwan, Thailand, Vietnam, New Zealand, Brazil and other
regions.
2. “Adjustments” of income (loss) refers to intersegment transactions to eliminate.
3. “Adjustments” of assets refers to intersegment transactions to eliminate.
4. “Income (loss)” is adjusted from operating income (loss) in Consolidated Statements of Income.
5. “Increase in property, plant and equipment and intangible fixed assets” do not include increase due
to newly consolidation
Year ended March 31, 2021 (From April 1, 2020 to March 31, 2021) (¥ millions)
Reportable Segments
Others (Note 1)
Adjustments (Note 2, 3)
Amounts in Consolidated Statements of
Income (Note 4)
Japan United States
Australia China South Korea
Indonesia Total
Net sales
Sales to outside customers
183,136 36,971 24,311 41,160 28,358 11,248 325,187 19,177 — 344,364
Intersegment sales
37,596 — 93 1,751 676 518 40,635 2,088 (42,724) —
Total 220,733 36,971 24,404 42,912 29,034 11,766 365,823 21,265 (42,724) 344,364
Segment Income (loss)
24,544 2,177 911 6,667 141 2,423 36,866 2,881 943 40,690
Segment Assets 364,659 25,949 24,950 51,786 17,895 13,758 499,000 30,697 (32,405) 497,291
Others
Depreciation 7,095 345 557 1,479 1,088 301 10,868 544 — 11,413
Investments in company to which equity method applied
— — — — — — — 290 — 290
Amortization of goodwill
133 — 27 — — — 161 — — 161
Increase in property, plant and equipment and intangible fixed assets (Note 5)
9,089 1,488 1,141 736 820 115 13,394 580 — 13,974
Notes:1. “Others” include sales from subsidiaries in Taiwan, Thailand, Vietnam, New Zealand, Brazil and other
regions.
2. “Adjustments” of income (loss) refers to intersegment transactions to eliminate.
3. “Adjustments” of assets refers to intersegment transactions to eliminate.
4. “Income (loss)” is adjusted from operating income (loss) in Consolidated Statements of Income.
5. “Increase in property, plant and equipment and intangible fixed assets” do not include increase due
to newly consolidation

19
Per Share Data
Fiscal 2020
(April 1, 2019,
to March 31, 2020)
Fiscal 2021
(April 1, 2020,
to March 31, 2021)
1. Net assets per share ¥6,140.52 ¥6,660.40
2. Net income per share ¥419.49 ¥536.62
Notes: 1. Fully diluted net income per share is not indicated because there is no residual equity.
2. Net assets per share are calculated based on the following amounts.
Fiscal 2020
(April 1, 2019,
to March 31, 2020)
Fiscal 2021
(April 1, 2020,
to March 31, 2021)
Net assets ¥340,959 million ¥371,318 million
Deduction from net assets ¥25,343 million ¥28,989 million
[Non-controlling interest] [¥25,343 million] [¥28,989 million]
Net assets at year-end related to common
shares ¥315,615 million ¥342,329 million
Number of common shares at year-end
used in calculations 51,398,817 shares 51,397,777 shares
3. Net income per share is calculated based on the following amounts.
Fiscal 2020
(April 1, 2019,
to March 31, 2020)
Fiscal 2021
(April 1, 2020,
to March 31, 2021)
Net income attributable to owners of the
parent company
¥21,561 million ¥27,581 million
Amount not attributable to common shares — million — million
Net income attributable to owners of the
parent company related to common shares
¥21,561 million ¥27,581 million
Average number of shares during the term 51,399,210 shares 51,398,382 shares
Subsequent Events
There are no relevant items.