Embed Size (px)
Citation preview
Note; This document is in English translation of “Kessan Tanshin” for the final Quarter of the Fiscal Year Ended March 31, 2019 and is provided solely for reference purposes. In the event of any inconsistency between the Japanese version and any English translation of it, the Japanese version will govern.
Consolidated Financial Results for the Fiscal Year Ended March 31, 2019
May 9, 2019Company name : NTT DATA CORPORATION (“NTTDATA”)Stock exchange on which the Company’s shares are listed : Tokyo Stock Exchange 1st SectionCode number : 9613URL : https://www.nttdata.com/global/en/Contacts Company representative : Yo Honma, President and Chief Executive Officer
Person in charge : Hiroshi Setoguchi, Senior Executive Manager,Investor Relations Office
Tel.:+81-3-5546-8119Scheduled date of the ordinary general meeting of shareholders : June 20, 2019Scheduled date of dividend payment : June 21, 2019Scheduled date of filing securities report : June 21, 2019Supplemental material on annual results : YesPresentation on annual results : Yes (for institutional investors and financial analysts)
(Amounts are rounded to the nearest 1 million yen)1. Consolidated Financial Results for FY2018 (From April 1, 2018 to March 31, 2019)(1) Consolidated Results of Operations
(% of change from the corresponding the previous fiscal year)
Net sales Operating income
Income before income taxes
Net incomeattributable to
shareholders of NTT DATA
Comprehensive income attributable to shareholders of
NTT DATA¥ million ¥ million ¥ million ¥ million ¥ million
FY2018 2,163,625 6.1 147,716 20.0 146,914 19.7 93,616 13.6 114,859 38.6FY2017 2,039,690 123,120 122,704 82,392 82,877
Net income pershare
Net income pershare (diluted)
ROE(Ratio of Net income to Equity attributable to
shareholders of NTT DATA
ROA(Ratio of Income before
income taxes to Total assets
Operatingincome margin
(Ratio of Operating income to Net sales
¥ ¥
FY2018 66.75 10.7 6.2 6.8FY2017 58.75 10.3 5.4 6.0
Reference: Equity in net income (losses) of affiliates: FY2018 175 million yen FY2017 909 million yenNote: Conducted stock split which shall split of common stock at a ratio of 1:5 as of the effective date of July 1, 2017.
Net income per share is calculated based on the assumption that the stock split was conducted at the beginning of the previous consolidated fiscal year.
(2) Consolidated Financial Position
Total assets Total equity
Equity attributable to shareholders of
NTT DATA
Equity ratioattributable to shareholders of
NTT DATA
Equity attributable to shareholders of
NTT DATAper share
¥ million ¥ million ¥ million % ¥
FY2018 2,476,062 966,809 925,667 37.4 660.01FY2017 2,270,203 860,506 826,179 36.4 589.08
Note: Conducted stock split which shall split of common stock at a ratio of 1:5 as of the effective date of July 1, 2017. Equity attributable to shareholders of NTT DATA per share is calculated based on the assumption that the stock split was conducted at the beginning of the previous consolidated fiscal year.

(3) Consolidated Cash FlowsCash flows from
operating activitiesCash flows from
investing activitiesCash flows from
financing activitiesCash and cash
equivalents at end of year
¥ million ¥ million ¥ million ¥ million
FY2018 242,009 186,879 5,451 251,309FY2017 234,692 203,998 90,855 190,070
2. DividendsCash dividends per share
Total amount of cash
dividends for the year
Dividends payoutratio
(consolidated)
Ratio of totalamount of
dividends to Equity
attributable to shareholders of
NTT DATA(consolidated)
End of thefirst
quarter
End of thesecond quarter
End of thethird
quarterYear-end Total
¥ ¥ ¥ ¥ ¥ ¥ million
FY2017 7.50 7.50 15.00 21,037 25.5 2.6FY2018 8.50 8.50 17.00 23,842 25.5 2.7FY2019Forecasts 9.00 9.00 18.00 27.4
Note: Conducted stock split which shall split of common stock at a ratio of 1:5 as of the effective date of July 1, 2017. Ratio of total amount of dividends to Equity attributable to shareholders of NTT DATA is calculated based on the assumption that the stock split was conducted at the beginning of the previous consolidated fiscal year.
3. Forecasts of Consolidated Results for FY2019 (From April 1, 2019 to March 31, 2020)(% of change from the corresponding the previous fiscal year)
Net sales Operating income
Income before Income Taxes
Net income attributable to shareholders of
NTT DATA
Net income pershare
¥ million ¥ million ¥ million ¥ million ¥
FY2019 2,240,000 3.5 148,000 0.2 145,000 1.3 92,000 1.7 65.60
* Notes:(1) Changes in significant subsidiaries during the current period: No
(Changes in specified subsidiaries resulting in the change in consolidation scope)
(2) Changes in accounting policies, changes in accounting estimates1) Changes in accounting policies required by IFRS : Yes2) Changes in accounting policies other than 1) : No3) Changes in accounting estimates : Yes
(3) Number of shares outstanding (common stock)1) Number of shares outstanding FY2018 1,402,500,000 shares FY2017 1,402,500,000 shares
(including treasury stock)2) Number of treasury stock FY2018 953 shares FY2017 953 shares3) Average number of shares over period FY2018 1,402,499,047 shares FY2017 1,402,499,177 shares
Note: Conducted stock split which shall split of common stock at a ratio of 1:5 as the effective date of July 1, 2017. The number of the shares are calculated based on the assumption of that the stock split was conducted at the beginning of the previous consolidated fiscal year.
* Kessan Tanshin” is an unaudited financial report.* Explanations for the appropriate use of results forecasts, and other noteworthy items
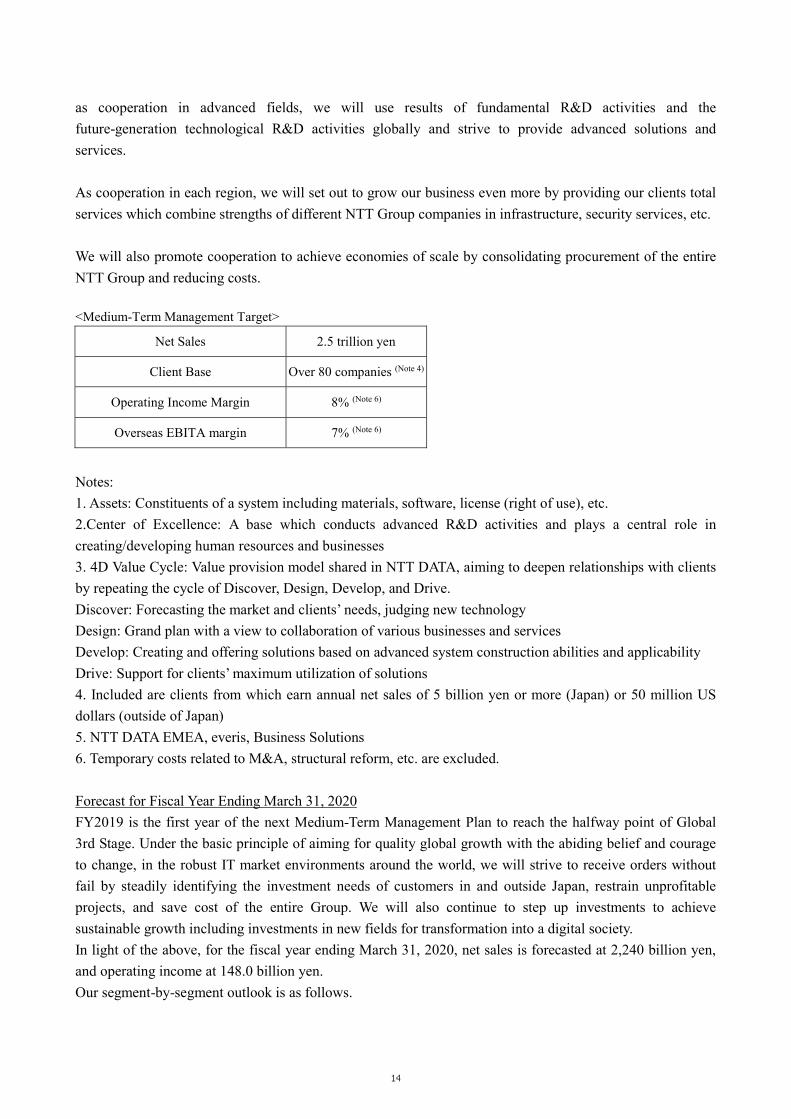
1. NTT DATA has adopted the International Financial Reporting Standards (IFRS) since the first quarter of FY2018. Financial information for the date of transition to IFRS and the previous fiscal year is presented in accordance with IFRS. For differences between IFRS and JGAAP regarding financial figures, please refer to“4.Consolidated Financial Statements and major notes, (5) Notes to Consolidated Financial Statements (First-Time Adoption of IFRS)”.

2. The results forecasts contained in this document are based on certain premises derived from information availableto the NTT DATA Group at this time. As a result of various factors that may arise in the future, actual results maydiffer from the Group’s forecasts.
3. Supplemental material on quarterly results will be uploaded on TDnet today, and will also be uploaded on ourhomepage. Presentation on quarterly results will be held today. This report will be uploaded on our homepagesoon.
4. Products and services referred to on this report (including the attachment) are trademarks or registered trademarksof NTT DATA or other companies.

Contents of Attachment
1.Overview of Business Results ·············································································· 2(1) Business Results and Analysis on Financial Conditions and Cash Flow ······················ 2(2) Forecast for the Next Term ············································································· 12
2.The Basic Stance Concerning The Selection of Accounting Standards ···························· 16 3.Matters on Summary Information (Notes) ······························································ 17 4.Consolidated Financial Statements and major notes ···················································· 18
(1) Consolidated Statement of Financial Position ······················································· 18(2) Consolidated Statements of Income and Comprehensive Income ································ 20(3) Consolidated Statement of Changes in Equity ······················································· 22(4) Consolidated Statement of Cash Flows ······························································· 23(5) Notes to Consolidated Financial Statements ························································· 24
Notes to Going Concern Assumptions ···························································· 24 Segment information ················································································ 24 Per share information ················································································ 26 Subsequent events ···················································································· 26 First-Time Adoption of IFRS ······································································· 27
1

1. Overview of Business Results
(1) Business Results and Analysis on Financial Conditions and Cash Flow
[1] Business Results of current fiscal yearThe economy and business environment for the information services industry in the current consolidatedfiscal year are as follows.The Japanese economy is moderately improving as capital investment is increasing though we have seen noprogress in the improvement of corporate profitability and business conditions. The future economic trendsare expected to continue this moderate improvement with the help of the effects of various policies where theemployment/income environment continues to improve, although the impacts of trade issues on the globaleconomy, the future trends of Chinese economy, uncertainty of the overseas economic trends and policies,and the influences of financial market fluctuations must be kept in mind.In domestic information services industry, the market is improving gradually as IT investments moved on torespond to system reforms and enforcement of new laws and regulations, enhance touch points, and expandbusinesses by utilizing digital (Note 1)technologies including AI and IoT. Meanwhile, needs for reducingmaintenance and operation costs and severity of price competition are expected to remain.In general, the overseas economy is also improving moderately, despite the poor economies in some of theAsian and European countries. Regarding the future economic trends, risks resulting from uncertainty relatedto the future economic trends in China and its policies as well as the influences of financial marketfluctuations must be kept in mind, but the economy is expected to continue this moderate improvement.In the international information service industry, the digital-related investments is on the rise. Stronggrowth is expected to continue in the U.S. market. In Europe, we have seen robustness but we need tocarefully watch over the impact of increasing uncertainty of the macro economy on IT investment. As forChina, the demand for IT investments has remained stable.
Review of the Previous Medium-Term Management Plan
During the period of the previous Medium-Term Management Plan (FY2016–FY2018), with the establishment of a global brand through the “enhanced local presence” as the foundation of our strategy, the NTT DATA Group aimed to achieve the Medium-Term Management Target of “attaining consolidated net sales of over 2 trillion yen” and “increasing consolidated operating income after adjustment by 50% (Note 2).”In particular, we took actions in accordance with the key principles of “Game-Changing Approach” and “Breakthrough Technology.”
As a result of “Game-Changing Approach,” we increased the number of clients, from which we earned net sales of 5 billion yen or more per year, from 50 at the end of FY2015 to 70 at the end of FY2018 and succeeded in building a trust relationship with many clients by pursuing the Clients First approach. As such, we have strengthened our customer base by building Long-Term Relationships with our clients and established a stable business foundation.Regarding “Breakthrough Technology,” we made efforts globally on “production technology innovation” and “leading-edge technologies.” In terms of “production technology innovation,” we increased productivity by globally promoting the standardization and automation of software development method as well as the
2

standardization of the infrastructure technologies (integrated development cloud). As for “leading-edge technologies,” we developed “Center of Excellence (Note3),” a base to accumulate expertise of cutting-edgetechnologies globally and create business jointly with clients by encouraging the usage of the base in each region.
As a result of these initiatives, we successfully achieved the Medium-Term Management Target of “attaining consolidated net sales of over 2 trillion yen” and “increasing consolidated operating income after adjustment by 50% (Note2)” in FY2018.
Note 1: Digital (digital transformation)Digital transformation is a concept wherein IT permeation will change citizens’ lives for the better in all respects. This concept is intended to realize a society where the social system is rebuilt to become user-friendly through cloud computing, as well as mobility and social technologies. With data growing exponentially due to IoT, by leveraging AI, this data will be converted to intelligence that is useful for living.
Note 2: Compared to FY2015 (After adjustment for incremental investments in new fields)
Note 3: Center of ExcellenceA base which conducts advanced R&D activities and plays a central role in creating/developing human resources and businesses
Status of business activities and performance of each segment
We strove to expand businesses in the global market to respond to the acceleration of digital transformation initiatives on a global basis and meet diversified and sophisticated needs. We also made efforts to expand diverse IT services including digital offering (Note1) and system integration in response to market changes and to stably provide such services.The following sections present descriptions of efforts made in each of the segments.
[Public & Social Infrastructure Segment]We aimed for receiving system renewal orders for core businesses from governments and infrastructure companies, and made efforts to grow our business through the following methods: creating new domestic and overseas businesses by utilizing the results and know-how that our group has cultivated; and responding to new businesses including those utilizing “My Number” and realizing new public-private social infrastructure in accordance with the Society 5.0/Digital Government Plan.
<The Labor Standards Administration System services launched to realize efficient customer operation>We developed the Labor Standards Administration System, a core system for providing national services,
including workers’ compensation insurance and supervising health and safety in Labor Offices and Labor Standards Supervision Offices across the country and launched the service in January 2019. To develop this system, we needed to integrate multiple existing subsystems for efficiency, which made the project highly difficult and enduring. By completing this project, we enabled efficient customer operations.
<Expanded business through public-private partnership and cross-industrial efforts >We provided services for efficient information exchange between government agencies and financial institutions. We also promoted co-creation activities, working together with companies and associations, to solve social issues and create new added values. These facilitated our business expansion.
3

We worked together with The Shizuoka Bank, Ltd. and Enshu Shinkin Bank as well as three municipalities to help them investigate the savings status of delinquent taxpayers. In this asset investigation operation, we used electronic data to reduce working hours and realize efficient operation. In October 2018, we completed the operational validation of this project. This resulted in “PipitLINQ,” launched in February 2019, which enables government agencies and financial institutions to mutually make inquiries about deposits and savings by using electronic data in a unified format.
In November 2018, TEPCO Power Grid, Inc. and NTT DATA established the “Grid Data Bank Laboratory LLP” to solve social issues and create new added values by using various cross-industrial data. In March 2019, THE KANSAI ELECTRIC POWER CO., INC and CHUBU Electric Power Co., Inc. joined the Lab as members. We now have about 30 corporate and organizational sponsors and members (as of March 2019). Also in March 2019, we opened an office-cum-laboratory in Chiyoda-ku, Tokyo, equipped with an innovative environment, which would facilitate the promotion of co-creation in this initiative.
The following is a breakdown of business results for the period by business segment.The net sales was 479.9 billion yen (7.9% increase compared to the previous year) due mainly to expansion of services for central government ministries and the telecommunication industry.The operating income was 43.9 billion yen (14.6% increase compared to the previous year) due mainly to growth in sales in spite of the increase in the amount of loss from unprofitable projects.
[Financial Segment]While the market environment such as the negative interest rate affects the management of financial institutions, the advancement of deregulation and technological innovation is accelerating the digitalization, bringing a great change to the business environment of the financial industry today. We continued to offer highly reliable and high-quality services to our clients and aimed to expand our business as a trusted financial IT platformer of the digital age by providing new values through combination of digital technologies and responding to changes in the business environment.
<We promoted various efforts to realize next-generation banking>While new digital-technology-enabled services are being provided, we have made efforts to enable financial institutions’ business infrastructures to quickly respond to various digital needs. We have also promoted theconstruction of a platform to create new business, not only connected to financial institutions, but also bridging all industries with financial services.
As a digital service platform, in October 2018, we launched “A-gate”, a solution which provides centralized support from implementation through operation of a public cloud (Note 2) such as “AWS” or “Azure”, in addition to “OpenCanvas”, our cloud service currently provided. It covers high security requirements by using OpenCanvas’ authentication function.
For financial institutions’ core systems that we had provided on a mainframe, we completed major technical validation to enable application of an open platform (Note 3) that has high affinity with digital technologies in June 2018 and started on the technical development in full scale.
As an effort to create new services through a combination of non-financial services with financial capabilities, we completed a proof of concept of Mambu’s globally acclaimed cloud-type accounting services for the first time in Japan in March 2019.
<We provided AI-enabled digital services>We provided various digital-related services for financial institutions to enhance our financial services.
4

In March 2019, we launched services to reduce workload on financing requests at financial institutions by using the NTT Group’s AI technology called “corevo.”
We developed services to grade various factors of face-to-face communication with AI by analyzing images and voices. In April 2018, we launched trial services mainly for the insurance industry.
“BeSTA FinTech Lab” is a site to create new businesses. To this we added a next-generation concept store, “Branch of the Future”, where a customer journey (Note 4) can be experienced with applied cutting-edge technologies.
The following is a breakdown of business results for the period by business segment.The net sales was 559.1 billion yen (0.1% decrease compared to the previous year) due mainly to growth in sales of services for the insurance industry in spite of less orders compared to the previous fiscal year such as for services for banks.The operating income was 52.9 billion yen (2.9% increase compared to the previous year) due mainly to growth in sales of services for the insurance industry in spite of less orders compared to the previous fiscal year such as for services for banks.
[Enterprise & Solutions Segment]We aimed for business expansion as a business partner who contributes to the digital transformation of clients, such as manufacturers, distributors, and service providers whose business environments are changing enormously as observed in further acceleration of trend in digital usage and rise in demand for global competitiveness enhancement. In responding to these changes, we leveraged our strengths such as our advanced technologies and know how in the digital field and experience of totally supporting many of our clients’ systems.
<We promoted the provision of highly convenient and advanced payment-related services>CAFIS” (Note 5) celebrated its 35th anniversary. It had allowed us to obtain “achievements,” “diversity,”
and “safety and security” as well as know-how, which served as the core of highly convenient and advanced payment-related services that we had promoted and provided. Thus, we contributed to the shift to cashless payments in Japan.
In April 2018, TOKYU CORPORATION and NTT DATA launched “.pay (dot pay),” a solution that enables smartphone-based payment by adding the cardless in-house credit function to promotional apps by companies and stores.
We added credit card payment functionality to our “Mobile Register” (Note 6), smartphone-based bar code payment service. In April 2018, we launched this as the Mobile Register Public Fund Credit Collection Service for local governments.
We worked to launch the service of the code payment gateway, which will enable retailers to use a single payment terminal or interface for domestic and overseas 1D barcode or QR code payments.
<The use of production-related information realized the maximization of information value inside a plant>In January 2019, we launched “DaTa TransLoader”, an application that runs on “FIELD system”, which is
an IoT platform (Note 7) provided by FANUC CORPORATION for manufacturers and also is what we have participated in developing for. This application enables important production-related information saved in the “FIELD system” connected to various machines and devices in a plant to be used in customers’ systems or external tools, thereby realizing the maximization of information value inside the plant.
The following is a breakdown of business results for the period by business segment.The net sales was 529.8 billion yen (10.8% increase compared to the previous year) due mainly to expansion
5

of services for the manufacturing and distribution industry including M&A in the previous fiscal year.The operating income was 48.5 billion yen (19.7% increase compared to the previous year) due mainly to growth in sales.
[North America Segment]We completed the organizational and structural foundation in North America and improved our capacity to respond to the digital field that leads the growth of the IT service market. In particular, we expanded our business in the healthcare, public and financial segments through the utilization of our wealth of achievements and expertise in outsourcing, etc., and accelerated our growth.
<Awarded new large-scale IT Service Agreement with British Columbia Health Authorities, leveraginghealthcare experience and exceptional expertise to increase presence in Canada>
NTT DATA Canada, a subsidiary of NTT DATA Corporation, signed an IT services contract with a new client, the Provincial Health Services Authority (PHSA) (Note 8), based in Canada, in March 2019. This contract is for a large-scale project with a period of 5 years and a total value of over CAD $400M. We will provide a range of end user IT support services including a clinical service desk provided by staff who are familiar with the usage of applications used in medical institutions and work flows in multiple health authorities (Note 9) throughout the province. We received the order for our strong willingness to invest in the Canadian IT market proven by our acquisition of Sierra Systems in December 2018, in addition to our track record of success in providing clinical services, our capability in responding to large-scale outsourcing projects, and our flexible attitude toward requests from clients.
Negotiated the acquisition of Cognosante Consulting, LLC for strengthening industry specific consulting services for U.S. federal and state agencies
NTT DATA Services, a subsidiary of NTT DATA Corporation, negotiated to acquire Cognosante Consulting, LLC, which provides consulting services for U.S. federal and state health agencies with its strength particularly in services for supporting systems related to Medicaid, a public medical insurance system (the acquisition was completed in April 2019). The acquisition will enable us to obtain the knowledge of Cognosante Consulting, LLC, which is based on its approximately 30 years of rich experience in providing services to U.S. federal and state agencies, and provide highly professional and industry specific consulting services in the field of healthcare.
The following is a breakdown of business results for the period by business segment.The net sales was 421.9 billion yen (1.4% decrease compared to the previous year) due mainly to a decline in sales of services for the healthcare and financial sectors in spite of growth in sales of services for the public and manufacturing sectors.The operating income was 3.5 billion yen (- compared to the previous year) due mainly to cost improvement and the decrease in PMI spending in spite of a decline in sales.
[EMEA & LATAM Segment]We gathered the strength and resources of group companies in EMEA & LATAM to promote integrated business management and increased profits through the synergy effect. We also increased our local presence further by strengthening the capacity to offer services in the digital field that is increasing in demand.
<everis Group won orders for large-scale projects in the public sector>everis Group, a subsidiary of NTT DATA Corporation (hereafter called “everis”), received orders for the
6

following projects in the public sector where advanced security and reliability are especially required. This is due to the recognition of its track record of having provided high quality services over the long years and its capabilities in the digital domain.
everis received an order from Aena SME, S.A., a Spanish airport operator, for the automated border control systems at seven airports in Spain. Following the installation and beginning of the service of 220 state-of-the-art automated border control gates at four airports including Barcelona and Mallorca, everis will be responsible for installing and operating another 81 of these gates in three airports including Seville in the future. The system integrates advanced verification of passports and other documents and biometric recognition, both facial and fingerprint, contributing to improving efficiency of the immigration process with quick and accurate identification of an individual.
everis signed a comprehensive contract with the Directorates-General for Informatics, an administrative enforcement agency of European Union (EU), for providing IT services to more than 30 European Union institutions and related organizations. everis started providing services for 14 countries including Belgium from October 2018.
<Expansion of capability centered on digital domain through M&AThrough subsidiaries, NTT DATA acquired companies with unique advantages centered on digital domain in an attempt to further enhance service delivery capability and generate synergy with the Group’s strengths.
In May 2018, NTT DATA EMEA LTD. turned MagenTys Holdings Limited in the U.K.—which provides consultancy and other services in the digital domain—into a subsidiary. Also, in June 2018, the Company turned gen-ius dms GmbH in Germany—which provides automotive dealer management system—into a subsidiary, with an aim to further enhance the presence in the automotive industry, which is the Group’s strength.
In August 2018, itelligence AG turned Sybit GmbH—a company with strengths in Customer Relationship Management (CRM) and e-commerce services using “SAP C4/HANA”(Note 10)—into a subsidiary, with an aim to enhance these services that are one of the strategic areas of SAP.
The following is a breakdown of business results for the period by business segment.The net sales was 440.1 billion yen (13.6% increase compared to the previous year) due mainly to expansion of businesses in Europe, mainly in Spain and Italy. The operating income was 7.9 billion yen (62.4% increase compared to the previous year) due mainly to growth in sales.
Note 1 Digital offeringProducts or services we provide to our clients by utilizing leading-edge technologies.
Note 2 Public cloudShared cloud services provided to many and unspecified number of users via the Internet.
Note 3 Open platformA platform (infrastructure of system or service) that does not depend on any specific hardware.
Note 4 Customer journeyA process of actions, thoughts, and emotions that a user takes before reaching to service use or purchase.
Note 5 “CAFIS”Largest comprehensive payment platform in Japan supporting various payment methods provided by NTT DATA.
7

Note 6 “Mobile Register”A service in which an app on a smartphone reads the barcode for convenience store payment to withdraw money from a bank account through Internet banking.
Note 7 “FIELD system”, which is an IoT platformFIELD system” is designed to further improve productivity and efficiency for manufacturers. Provided by FANUC
CORPORATION, it is an IoT platform for manufacturers.
Note 8 Provincial Health Services Authority (PHSA)The Provincial Health Services Authority oversees the co-ordination and delivery of provincial programs and highly specialized health-care services.
Note 9 Health Authorities Authorities that exists in 5 regions within the Province of British Columbia providing healthcare services according to characteristics of each region.
Note 10 “SAP C4/HANA”A digital commerce solution for enterprises with an abundance of functions suitable for omnichannels (the realization of an environment where customers can purchase goods in a similar manner from any sales channel by integrating sales channels and distribution channels including physical (real) and online (digital) stores) and flexibility and scalability forcustomization and add-ons.
The following shows the status of overseas bases during the period under review.Approx.85,300 employees deployed in 223 cities in 53 countries and regions outside of Japan.(Approx.123,000 employees include Japan)(AS of March 31, 2019)
Progress of technical developmentThe Group’s main business, system integration (SI), is seeing some improvement with the gradual recoveryof the Japanese economy. However, it is still exposed to a very tough competitive environment. In order tobeat the competition in such environment, we are focusing our R&D efforts on “innovation technologies todeliver solutions”, for faster and higher quality system development. In addition, we are also working on the
utilization of advanced technologies” with which we proactively incorporate new technological trends. With these two initiatives, we combine a development capability which enables us to respond flexibly tocircumstantial changes, and are working to strengthen our R&D so that we can propose and deliver attractivesystems to our clients.Through collaborative R&D with NIPPON TELEGRAPH AND TELEPHONE CORPORATION (NTT), weutilize the results of fundamental R&D themes from such R&D to focus our resources on applied R&Dthemes.The R&D costs for the consolidated fiscal year under review were 15.1 billion yen. The results of the R&Ds,which are commonly applicable to the Public & Social Infrastructure, the Financial, the Enterprise &Solutions, the North America and the EMEA & LATAM segments, are not separately recorded by eachsegment.
[Innovation technologies to deliver solutions]We have been working to achieve high speed and high quality development by automating software
8

development, which has given us a significant competitive edge. With this background, adding to furtheradvancement in automation technology, we have undertaken legacy modernization (Note1) and acceleratedinnovation in our development processes so that we can respond with agility to changes in developmentenvironments, and in our clients’ business environments. Additionally, we are promoting standardizationinitiatives on a global level.
<We enhanced information security measures inside and outside Japan as a leading IT company>As a leading IT company, we have protected important infrastructures indispensable to everyday life with our solid security technologies since the advent of the Internet, ahead of our competitors. As cyberattacks on information systems are becoming fiercer, we have further enhanced our security measures.
In September 2018, we signed a partnership agreement with Ierae Security, Inc. and Kobe Digital Labo Inc. that have advanced technology in security. This was to provide threat analysis services for controlling systems including monitoring control systems used in plants or electric power infrastructures and production line management systems used by manufacturers.
We implemented “Tanium”, which is capable of detecting, dealing with, and recovering from threats, reacting to ever-changing end-point (Note 2) situations in our domestic and overseas Group sites. We also began gradually implementing “Exabeam” or the Group’s security management platform, which can centrally collect and analyze logs from network and end-point equipment. These efforts helped to improve the Group’s information security level. On the basis of the expertise we had garnered from these solutions implemented for the Group’s sites, both NTT DATA and NTT DATA INTELLILINK Corporation began to collaborate with Tanium Inc. in November 2018 and with US Exabeam, Inc. in January 2019 to provide more advanced security consulting services to our clients.
While there is a growing concern over human resource shortages in the security field due to the high level of expertise required, the Group made active efforts to develop security human resources and improve their skills. In FY2018, more than 8,300 employees obtained the “security human resources certification” promoted by the NTT Group to play an active role inside and outside Japan.
To prevent growing security damages across the globe, we published a quarterly report on global trends in cyber security and their future outlook in both Japanese and English. We cooperated with TV broadcasters, newspapers, and journals for their coverage.
[Utilization of advanced technologies]NTT DATA has particularly focused on the technology themes of AI, IoT and advanced technology of ITinfrastructure (e.g., blockchain) and put priority on investment in PoCs for applicable research topics andclients. As a means of discerning research topics for the mid- to- long term, we try to grab the changes in thefuture with four perspectives such as politics, economy, society and technology in order to derive the
information society trends” and “technology trends” of near-future and formulate and publish these as NTTDATA Technology Foresight (Note3).
<We opened a design studio, AQUAIR in Roppongi and enhanced our global network to realize our customers’ digital businesses>
In June 2018, we opened a design studio, “Fluid Experience Design Studio: AQUAIR (hereafter the Studio)” to seamlessly realize our clients’ digital businesses from planning through proof of concept (POC) to marketing. The Studio is a facility where clients can experience cutting-edge technologies and work style. It also has a temporary store to perform POC. In FY2018, more than 100 clients and partners visited the Studio, where they had various experiences and tried out technical validation to realize new services that would integrate digital and real spaces. Through our “NTT DATA Design Network” (Note 4) that coordinates the Group’s international design studios, including this Studio (a total of 15 sites globally), we shared human
9

resources adept in UX-UI (Note 5) and various case studies and promoted cross-border projects.
Note 1 Legacy ModernizationThe entire operations realized by the current system, which has been maintained for a long period of time (legacy system), are becoming difficult to understand with the system becoming increasingly enlarged, complex, and dependent on individual skills from repeated additional developments. The aim of legacy modernization is to clear the specifications of such black-box systems, utilize existing assets, and renovate them into new systems.
Note 2 End pointA terminal such as a PC, smartphone or server, connected to the network.
Note 3 NTT DATA Technology ForesightThe near-future vision of the information society (information society trend) and IT-related technology trend. It is derived through comprehensive surveys of the trend relating to IT that are implemented from the perspectives of politics, economy, society and technology, as well as through hearings and discussions with domestic and foreign intellectuals. Trend information has been released since 2012, and is updated annually.
Note 4 “NTT DATA Design Network”The NTT DATA Group’s network to facilitate business designs from a wider perspective by enabling our 15 global design studios to share both case studies and know-how or to support projects.
Note 5 UX (User Experience) – UI (User Interface)UX (User Experience) is an experience and accompanying emotion that the user obtains when interacting with a product or a service. UI (User Interface) is an interface between a user and a service, and a mechanism through which information is exchanged between the two.
As a result of these activities, business performance during the period under review was as follows.
New Orders Received 2,076.1billion yen (up 6.5% year-on-yearNet Sales 2,163.6billion yen (up 6.1% year-on-yearOperating Income 147.7 billion yen (up 20.0% year-on-yearIncome before income taxes 146.9 billion yen (up 19.7% year-on-yearNet income attributable to shareholders of
NTT DATA93.6 billion yen (up 13.6% year-on-year
10

<Year-on-Year Changes by Business Segment>(Unit: billion yen)
Description FY2017 FY2018 Change (%)Share
(%)Share (%)
Net
Sal
es
Public & Social Infrastructure Segment 444.9 18.6 479.9 18.8 7.9
Financial Segment 559.9 23.4 559.1 22.0 (0.1)
Enterprise & Solutions Segment 478.1 20.0 529.8 20.8 10.8
North America Segment 427.9 17.9 421.9 16.6 (1.4)
EMEA & LATAM Segment 387.5 16.2 440.1 17.3 13.6
Others 96.4 4.0 116.2 4.6 20.6
Adjustments (355.1) (383.5) (8.0)
Total 2,039.7 2,163.6 6.1
Ope
ratin
g In
com
e
Public & Social Infrastructure Segment 38.3 28.8 43.9 27.6 14.6
Financial Segment 51.4 38.7 52.9 33.3 2.9
Enterprise & Solutions Segment 40.5 30.5 48.5 30.5 19.7
North America Segment (4.2) (3.2) 3.5 2.2
EMEA & LATAM Segment 4.9 3.7 7.9 5.0 62.4
Others 2.1 1.6 2.4 1.5 16.0
Adjustments (9.9) (11.4) (15.8)
Total 123.1 147.7 20.0
[2] Analysis on Financial ConditionsThe assets at the end of this current term increased by 205.9 billion yen from the end of the previous term to2,476.1 billion yen due mainly to the increase in cash and cash equivalents and trade receivables. Theliabilities increased by 99.6 billion yen from the end of the previous term to 1,509.3 billion yen due mainlyto the increase in trade payables and borrowings.Equity increased by 106.3 billion yen from the end of the previous term to 966.8 billion yen due mainly tothe increase of retained earnings.
[3] Analysis on Cash FlowThe cash flow from this term’s operations is revenue of 242.0 billion yen (7.3 billion yen increase comparedto the previous term) due mainly to the net income of 97.7 billion yen, the income of 158.0 billion yen of thedepreciation cost, which is a non-cash expenditure, and payment including coporate tax of 55.2 billion yen.The cash flow from investment activities resulted in a cash outflow of 186.9 billion yen (17.1 billion yendecrease compared to the previous term). This was due mainly to a capital investment expenditure of 180.0billion yen. Overall, the free cash flow of this term was 55.1 billion yen in the black (24.4 billion yen
11

increase compared to the previous term).The cash flow from financing activities resulted in a cash inflow of 5.5 billion yen (96.3 billion yen increase compared to the previous term). This was mainly attributable to the increase of interest-bearing liabilities due to financing for acquiring subsidiary stocks despite dividend payments.
The NTT DATA Group’s cash flow indicators are summarized as follows.Indicator FY2017 FY2018
Debt Equity Ratio (Times) 0.71 0.65
Notes: Debt Equity Ratio: Interest-bearing debt / Shareholders ' equity (Total net assets – Non-controlling interests)Interest-bearing debt: Borrowings and Bonds
(2) Forecast for the Next Term[Outlook of the business environment]As the trend of digital transformation accelerates due to the further advances in technology, our clients’ needsincluding those for business expansion and new business creation through strategic IT utilization areincreasingly diversified and sophisticated. For solving environmental/social challenges as typified bySustainable Development Goals (SDGs) in addition to the further growth of clients’ businesses, we believethat IT will play greater and more important roles globally.
[Challenges identified in the previous Medium-Term Management Plan]Under the previous Medium-Term Management Plan (FY2016-FY2018), we considered the restraint on unprofitable projects and the improvement in the profitability of overseas businesses as a significant management subject. While there were some positive effects for restraining unprofitable projects thanks to the Project Review Committee and other initiatives, we will continue to work towards further restraint on such projects. With respect to the improvement in the profitability of overseas businesses, we also recognize that continued efforts for profitability improvement are necessary as we have made prior investment to expand the business scale and enhance technological capabilities.Additionally, with a view to maximizing value we offer to our clients, we need to keep pace with their further accelerating needs for digital transformation and work towards maximizing our Group's global synergy in order to realize even greater sustainable growth.
[New Medium-Term Management Plan]Given the business environment outlook and challenges mentioned above, the NTT DATA Group has set a Medium-Term Management Plan for years between FY2019 and FY2021 as follows:
<Key principles> We will aim for growth which comes with quality in a global scale with our consistent belief and courage to change.
<Medium-term strategy>With our “consistent belief,” we will stick to our basic principle of “creating a future society together with our clients” and contribute to society through co-creation with our clients based on our Group’s source of competitive advantage that is “Long-Term Relationships” with clients. At the same time, we will practice
12

ESG management for sustainable improvement of our corporate value by promoting work-style reforms and other initiatives in our corporate activities and thereby contributing to realization of a society where people feel rewarded by working.As well, with our “courage to change,” we will implement three strategies through which we will further accelerate digital transformation and maximize our global synergy to offer maximized value to our clients.
Strategy 1. Enhancing global digital offeringBy deciding priority industries and technologies and making aggressive investment in such fields, we will create “strength” (offering), accelerating global cooperation which is integrated with marketing/technology application support. Specifically, we will improve our loyalty programs to individual clients and accelerate cooperation in industries while advancing external relation and promoting sharing and increasing of best practices.As well, by formulating a digital offering strategy which consolidates expertise in the industry and making aggressive investment in co-creation projects with clients while utilizing open innovation, we will create high-valued offering.In addition, we will realize fast creation and rollout of offering by accelerating consolidation and utilization of assets (Note 1) through enhancement of Center of Excellence (Note 2).Through these measures, we will promote expansion of digital business through integrated efforts of our Group companies across the globe.
Strategy 2. Advancing value we provide to clients according to their regional characteristicsBy advancing value we provide to clients through promotion of 4D Value Cycle (Note 3) according to their regional characteristics, we will further grow our client base that was made up of 70 companies (Note 4) as of the end of FY2018. Specifically, we will promote the following: “Creation of new value by leveraging our strengths in existing fields” in Japan; “Rapid business expansion based on the strong market growth” in China and APAC; “Creation of strengths and increase of pillar clients by focusing on priority” in North America; and “Enhancement of value offered to clients through integrated management of three companies (Note 5)” in EMEA and Central and South America.
Strategy 3. Maximization of our organizational strength by boosting abilities of all employees across the globeWith globally-shared value, we will promote collaboration and strive to maximize the organizational strength while improving abilities of individuals. Specifically, we will increase digital capabilities of all employees to bring out their maximum professionalism while improving employee engagement by revising systems and designs according to their diverse forms of self-fulfillment.As a work-style reform using digital technology, we will develop a platform through which expertise and knowhow can be shared globally and promote collaboration while further increasing productivity by continuing to improve production technology for the next generation.As well, we will further enhance our risk management by, for example, restraining unprofitable projects that were challenges addressed under the previous Medium-Term Management Plan, with a view to developing an appropriate governance system.
In addition to the above, we will promote enhanced cooperation with other NTT Group companies, create new value as a result of the NTT Group’s efforts, and increase our presence in the global market. Specifically,
13
as cooperation in advanced fields, we will use results of fundamental R&D activities and the future-generation technological R&D activities globally and strive to provide advanced solutions and services.
As cooperation in each region, we will set out to grow our business even more by providing our clients total services which combine strengths of different NTT Group companies in infrastructure, security services, etc.
We will also promote cooperation to achieve economies of scale by consolidating procurement of the entire NTT Group and reducing costs.
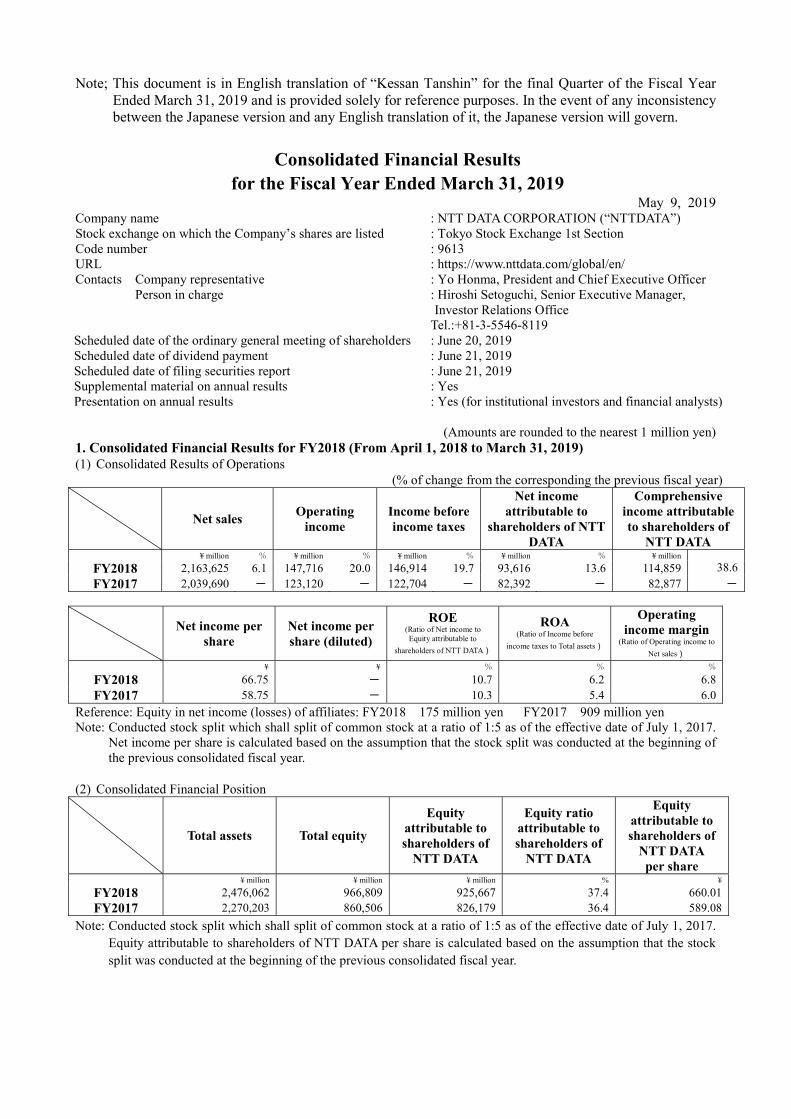
<Medium-Term Management Target>
Net Sales 2.5 trillion yen
Client Base Over 80 companies (Note 4)
Operating Income Margin 8% (Note 6)
Overseas EBITA margin 7% (Note 6)
Notes:1. Assets: Constituents of a system including materials, software, license (right of use), etc.2.Center of Excellence: A base which conducts advanced R&D activities and plays a central role increating/developing human resources and businesses3. 4D Value Cycle: Value provision model shared in NTT DATA, aiming to deepen relationships with clientsby repeating the cycle of Discover, Design, Develop, and Drive.Discover: Forecasting the market and clients’ needs, judging new technologyDesign: Grand plan with a view to collaboration of various businesses and servicesDevelop: Creating and offering solutions based on advanced system construction abilities and applicabilityDrive: Support for clients’ maximum utilization of solutions4. Included are clients from which earn annual net sales of 5 billion yen or more (Japan) or 50 million USdollars (outside of Japan)5. NTT DATA EMEA, everis, Business Solutions6. Temporary costs related to M&A, structural reform, etc. are excluded.
Forecast for Fiscal Year Ending March 31, 2020FY2019 is the first year of the next Medium-Term Management Plan to reach the halfway point of Global 3rd Stage. Under the basic principle of aiming for quality global growth with the abiding belief and courage to change, in the robust IT market environments around the world, we will strive to receive orders without fail by steadily identifying the investment needs of customers in and outside Japan, restrain unprofitable projects, and save cost of the entire Group. We will also continue to step up investments to achieve sustainable growth including investments in new fields for transformation into a digital society.In light of the above, for the fiscal year ending March 31, 2020, net sales is forecasted at 2,240 billion yen, and operating income at 148.0 billion yen.Our segment-by-segment outlook is as follows.
14

[Public & Social Infrastructure Segment]We aim for receiving system renewal orders for core businesses from governments and infrastructure companies, and make efforts to grow our business through the following methods: creating new businesses by utilizing the results and know-how that our group has cultivated and realizing a new public-private social system in accordance with Growth Strategy based on Society 5.0 and the Digital Government Action Plan.Net sales are forecast at 483.0 billion yen (net sales to external customers: 407.0 billion yen), and operating income at 53.0 billion yen.
[Financial Segment]Deregulations and technological innovations are bringing a great change to the business environment of financial institutions. Financial services taking advantage of digital technologies are emerging, with diversified players joining the financial business. Under such circumstance, we will continue to offer highly reliable and high-quality services to our clients. We will also seek to expand our business as a trusted financial IT platformer in the digital age, anticipating changes of the times.Net sales are forecast at 571.0 billion yen (net sales to external customers: 507.0 billion yen), and operating income at 53.0 billion yen.
[Enterprise & Solutions Segment]The further acceleration of trends in digital usage and the rise in demand for enhanced global competitiveness have greatly changed the business environments of manufacturers, distributors, and service providers. While responding to these changes, we will continue to provide highly added values that bring business and advanced professional technology together and support growth in our clients’ business domains, so that we can further expand our business.Net sales are forecast at 552.0 billion yen (net sales to external customers: 406.0 billion yen), and operating income at 49.0 billion yen.
[North America Segment]Towards sustainable growth in North America that is the world’s largest IT services market, we will accelerate advanced-technology-enabled innovations and enhance offerings in the digital domain. These will help us to improve our capacity to respond to our clients’ needs. We will also promote M&A to expand our business, increase our presence, and improve profitability.Net sales are forecast at 440.0 billion yen (net sales to external customers: 435.0 billion yen), and operating income at 9.0 billion yen.
[EMEA & LATAM Segment]While gathering the strengths of the group companies, we will optimize resources to further promote integrated business management and develop synergistic effects. To enhance our capacity to provide more services in the digital field, we will focus on investments in M&A and new solutions development.Net sales are forecast at 445.0 billion yen (net sales to external customers: 439.0 billion yen), and operating income at 0.0 billion yen.
Moreover, capital investment in the next term is expected to reach 202.0 billion yen,NTT DATA manages its business performance on an annual basis only, and therefore no results forecast forthe period to the end of the second quarter have been included in this report.
15

Notes: This material contains descriptions of future plans and strategies and of forecasts and projections relating to business performance. These descriptions reflect certain assumptions derived from judgments based on information currently available to the NTT DATA Group.The material also incorporates an unquantifiable degree of risk and uncertainty relating to factors such as economic trends, the fierce competition within the information service industry, market demand, and the tax and other systems. In view of this, excessive reliance should not be placed on these results or forecasts, and it should be noted that actual results may differ from the NTT DATA Group's forecasts.
2. The Basic Stance Concerning the Selection of Accounting StandardsNTT DATA has adopted International Financial Reporting Standards (IFRS) since the 1st quarter of the fiscal year ended March 31, 2019. The figures on the finantial statements of the day of transition and the previous fiscal year are presented in compliance with IFRS. Please refer to “4. Consolidated Financial Statements and Major Notes: (5) Notes to Consolidated Financial Statements (First-time adoption of IFRS)” for details on the difference between IFRS and JGAAP in relation to the financial statement figures.
16

3 Matters on Summary Information (Notes)(1) Changes in accounting policies
From the beginning of the period (April 1, 2018), the NTT DATA Group has adopted IFRS 9 "Financial Instruments" issued in
July 2014 (hereinafter referred to as IFRS 9). In accordance with the application of exemption provision of IFRS 7 "Financial
Instruments: Disclosure" (hereinafter referred to as IFRS 7) based on IFRS 1 and IFRS 9, we do not restate past periods.
The Group had complied with an accounting standard which is generally accepted as fair and valid in Japan (hereinafter
referred to as JGAAP) in the previous fiscal year, and has processed the difference of book values as of the beginning of the
current term under JGAAP and IFRS 9 as adjustments to retained earnings, other capital components and non-controlling interests.
In applying IFRS 9, there are provisions of exemption or prohibition of retrospective application of IFRS 9. The main details of
the provisions are as described below:
- Prohibition of retrospective judgment regarding classification of financial assets
- Exemption of retrospective application regarding specification of financial assets recognized in the past
- Prohibition of retrospective application of provisions regarding cancelation of recognition of financial assets and financial
liabilities
- Cancelation of hedge accounting based on JGAAP and fulfillment of hedge requirements under IFRS 9 upon application
date of IFRS 9
Impact from the changes in accounting policies
The changes in accounting policies are applied to financial assets/liabilities held by the NTT DATA Group at the beginning
of the current period.
Major cumulative impact amounts as of the beginning of the current period due to the application of IFRS 9 are as described
below. Without these, the impact of the changes of accounting policies is minor. Also, the impact on “current net income” and
“current net income per share” of the fiscal year under review is minor.
(Unit: million yen)
Other financial assets Deferred tax asset Retained earnings Other asset component
Hedge accounting 840 (77) 9 172
Fair value valuation of
unlisted stocks10,000 (3,083) 3,407 3,182
Total 10,840 (3,160) 3,416 3,354
(2) Changes in accounting estimates
In the current consolidated fiscal year, a defect was found in projects in the Public & Social Infrastructure Segment that could not
have been anticipated at the time of the previous review of total costs. As a result, the possibility of outflow of further economic
benefits has increased, we have changed the estimated total cost.
Accordingly, the additional provision for loss on order received which is within the “cost of sales” increased 13,239 million yen.
17

4. Consolidated Financial Statements and major notes
(1) Consolidated Statement of Financial PositionUnit: ¥ million
As of April 1, 2017(Date of transition to IFRS) As of March 31, 2018 As of March 31, 2019
Assets
Current assets
Cash and cash equivalents 253,984 190,070 251,309
Trade and other receivables 450,081 485,363 549,126
Contract asset 73,612 81,948 81,929
Inventories 14,059 21,543 15,294
Other financial assets 13,588 11,895 9,440
Other current assets 57,302 59,631 67,369
Total current assets 862,626 850,450 974,467
Non-current assets
Property, plant and equipment 316,843 348,398 355,717
Goodwill 342,378 335,887 357,014
Intangible fixed assets 430,348 431,412 444,444
Investment property 28,462 27,384 27,331
Investments accounted for using the equity method 6,591 6,831 6,573
Other financial assets 106,685 138,223 168,803
Deferred tax assets 114,171 95,757 98,220
Other non-current assets 33,439 35,860 43,493
Total non-current assets 1,378,917 1,419,752 1,501,595
Total assets 2,241,543 2,270,203 2,476,062
18

Unit: ¥ million
As of April 1, 2017(Date of transition to IFRS) As of March 31, 2018 As of March 31, 2019
Liabilities
Current liabilities
Trade and other payables 292,779 307,885 359,013
Advance received 185,847 213,791 218,774
Bonds and borrowings 318,254 97,413 134,586
Other financial liabilities 3,094 23,111 28,717
Income taxes payable 31,037 26,213 30,437
Provisions 6,072 7,935 12,434
Other current liabilities 38,741 30,870 32,898
Total current liabilities 875,824 707,217 816,859
Non-current liabilities
Bonds and borrowings 328,591 468,860 446,437
Other financial liabilities 8,762 10,936 21,908
Defined benefit liabilities 189,193 199,849 202,491
Provisions 2,692 3,208 3,562
Deferred tax liabilities 27,921 7,710 5,532
Other non-current liabilities 9,257 11,916 12,463
Total non-current liabilities 566,415 702,479 692,394
Total liabilities 1,442,239 1,409,696 1,509,253
Equity
Equity attributable to shareholders of NTT DATA
Capital stock 142,520 142,520 142,520
Capital surplus 119,301 116,193 115,740
Retained earnings 466,950 528,601 603,171
Treasury shares (1) (1) (1)
Other components of equity 39,779 38,865 64,236
Total equity attributable to shareholders of NTT DATA 768,550 826,179 925,667
Non-controlling interests 30,754 34,327 41,143
Total equity 799,304 860,506 966,809
Total liabilities and equity 2,241,543 2,270,203 2,476,062
19

Consolidated Statement of Income Unit: ¥ million
FY endedMarch 31, 2018
FY endedMarch 31, 2019
Net sales 2,039,690 2,163,625
Cost of sales 1,535,535 1,618,636
Gross profit 504,155 544,988
Selling, general and administrative expenses 381,035 397,272
Operating income 123,120 147,716
Financial income 5,867 6,848
Financial costs 7,193 7,825
Share of profit/loss of entities for using equity method 909 175
Income before income taxes 122,704 146,914
Income taxes 37,013 49,210
Net income 85,691 97,704
Net income attributable to
Shareholders of NTT DATA 82,392 93,616
Non-controlling interests 3,299 4,088
Total 85,691 97,704
Net income per share attributable to shareholders of NTT DATA
Net income per share (yen) 58.75 66.75
(2) Consolidated Statement of Income andStatement of Comprehensive Income
20

Consolidated Statement of Comprehensive Income Unit: ¥ million
FY endedMarch 31, 2018
FY endedMarch 31, 2019
Net income 85,691 97,704
Other comprehensive income (after taxes)
Items that will not be reclassified to profit/loss
Profit/Loss from investments in equity instruments designated at fair value through other comprehensive income
17,733 11,756
Remeasurements of defined benefit plans 1,426 (1,271)
Share of other comprehensive income of entities accounted for using equity method
0 (0)
Items that may be reclassified subsequently to profit/loss
Cash flow hedges 227 (731)
Hedges cost 100
Foreign currency translation adjustment (18,941) 11,273
Share of other comprehensive income of entities accounted for using equity method
193 (213)
Total other comprehensive income (after taxes) 638 20,913
Comprehensive income 86,329 118,617
Comprehensive income attributable to:
Shareholders of NTT DATA 82,877 114,859
Non-controlling interests 3,452 3,758
Total 86,329 118,617
21

(3)Consolidated Statement of Changes in Equity(FY ended March 31, 2018) Unit: ¥ million
Capital stock Capitalsurplus
Retainedearnings
Treasuryshares Other Total
Non-controlling
interestsTotal equity
As of April 1, 2017 142,520 119,301 466,950 (1) 39,779 768,550 30,754 799,304
Comprehensive income
Net income 82,392 82,392 3,299 85,691
Other comprehensive income 485 485 153 638
Comprehensive income 82,392 485 82,877 3,452 86,329
Transactions with shareholders
Dividends of surplus (21,739) (21,739) (773) (22,511)
Transfer to retained earnings 1,399 (1,399)
Acquisition and disposition of treasury shares (1) (1) (1)
Increase/decrease by business combination 1,148 1,148
Net changes in controlled subsidiaries' stocks 24 24 16 40
Other (3,132) (401) (3,533) (270) (3,803)
Total transactions with shareholders (3,108) (20,740) (1) (1,399) (25,248) 121 (25,127)
As of March 31, 2018 142,520 116,193 528,601 (1) 38,865 826,179 34,327 860,506
(FY ended March 31, 2019) Unit: ¥ million
Capital stock Capitalsurplus
Retainedearnings
Treasuryshares Other Total
Non-controlling
interestsTotal equity
As of April 1, 2018 142,520 116,193 528,601 (1) 38,865 826,179 34,327 860,506
Cumulative effect of first-time adoption of IFRS 9 3,416 3,354 6,770 328 7,099
Restarted balance (As of April 1, 2018) 142,520 116,193 532,018 (1) 42,220 832,949 34,656 867,605
Comprehensive income
Net income 93,616 93,616 4,088 97,704
Other comprehensive income 21,243 21,243 (330) 20,913
Comprehensive income 93,616 21,243 114,859 3,758 118,617
Transactions with shareholders
Dividends of surplus (22,440) (22,440) (751) (23,191)
Transfer to retained earnings (773) 773
Increase/decrease by business combination
Net changes in controlled subsidiaries' stocks (1,114) (1,114) 308 (807)
Other 661 751 1,412 (207) 1,205
Total transactions with shareholders (453) (22,462) 773 (22,142) 2,729 (19,413)
As of March 31, 2019 142,520 115,740 603,171 (1) 64,236 925,667 41,143 966,809
Equity attributable to shareholders of NTT DATA
Equity attributable to shareholders of NTT DATA
22

(4) Consolidated Statement of Cash Flows(Unit: ¥ million)
ダミー FY ended 31, March 2018 FY ended 31, March 2019
Cash Flows from Operating Activities Net income 85,691 97,704 Depreciation and amortization 158,054 158,038 Financial income and financial costs (1,557) 836 Share of (profit)/loss of entities for using equity method (909) (175) Income tax expenses 37,013 49,210 (Increase)/decrease in trade and other receivables (32,547) (43,290) (Increase)/decrease in inventories (7,125) 6,257 Increase/(decrease) in trade and other payables 43,116 32,765 Allowance for contract losses 1,911 4,205 Others 13,904 (9,131) Sub Total 297,549 296,420 Interest and dividends received 4,263 4,992 Interest paid (4,555) (4,193) Income taxes paid (62,565) (55,209)
Net cash provided by (used in) operating activities 234,692 242,009Cash Flows from Investing Activities Payments for acquisition of property, plant, equipment, and intangible fixed asset (199,142) (179,986) Payments for acquisition of other financial assets (21,892) (20,122) Proceeds from sales and redemption of other financial assets 24,113 23,130 Payments for investments in subsidiaries (4,832) (9,257) Others (2,245) (645)
Net cash provided by (used in) investing activities (203,998) (186,879) Cash Flows from Financing Activities Net Increase/(decrease) in short-term borrowings (169,620) 27,674 Proceeds from long-term debt and issuance of bonds 187,618 40,058 Repayments of long-term borrowings and redemption of bonds at maturity (103,689) (50,967) Purchase of equity interests of subsidiaries from non-controlling interests (114) (1,312) Proceeds from sale-and-leaseback - 11,799 Cash dividends paid (21,739) (22,438)
Increase/(decrease) in commercial paper, net 20,000 4,000 Cash dividends paid to non-controlling interests (773) (751) Payments for acquisition of treasury stock (1) -
Others (2,536) (2,612)Net cash provided by (used in) financing activities (90,855) 5,451
Net Increase/(Decrease) in Cash and Cash Equivalents (60,161) 60,581Cash and Cash Equivalents at Beginning of period 253,984 190,070Effect of Exchange Rate Changes on Cash and Cash Equivalents (3,753) 658Cash and Cash Equivalents at End of period 190,070 251,309
23

(5) Notes to Consolidated Financial Statement
(Notes to Going Concern Assumptions)
N/A
(Segment information)
For the year ended March 31, 2018
Information regarding net sales, income or loss by reportable segment Unit: ¥ million
Reportable segment
Others(Note 1)
Total Adjustments(Note 2)
Consolidated financial statement amount(Note 3)
Public & Social
InfrastructureFinancial Enterprise &
SolutionsNorth
AmericaEMEA &LATAM Total
Net sales
Sales to outside clients 361,767 496,427 340,186 422,262 383,863 2,004,505 34,053 2,038,558 1,132 2,039,690
Intersegmentsales and others 83,171 63,500 137,922 5,676 3,629 293,897 62,310 356,207 (356,207)
Total 444,938 559,927 478,107 427,938 387,492 2,298,403 96,362 2,394,765 (355,075) 2,039,690
Operatingincome or loss (the number shown in parentheses)
38,279 51,434 40,525 (4,219) 4,860 130,880 2,099 132,979 (9,859) 123,120
Financial income 5,867
Financial costs 7,193Share of profit/loss ofentities for usingequity method
909
Income beforeincome taxes 122,704
Information regarding other items by reportable segment Unit: ¥ million
Reportable segment
Others(Note 1)
Total Adjustments(Note 2)
Consolidated financial statement amount(Note 3)
Public & Social
InfrastructureFinancial Enterprise &
SolutionsNorth
AmericaEMEA & LATAM Total
Depreciation and amortization
22,145 75,726 19,877 19,691 12,670 150,110 1,377 151,487 1,440 152,926
Investmentsin non-current assets
18,321 100,396 45,853 14,035 12,157 190,762 1,102 191,864 2,950 194,814
(Note) 1. Classification of "Other" includes China & APAC regions and subsidiaries that mainly engage in supporting the business of
our head office departments.
2. (1) Adjustment of operating income or loss totaling minus 9,859 million yen mainly consist of consolidated adjustments not
appropriated to each reportable segment.
(2) Adjustment of depreciation and amortization totaling 1,440 million yen mainly consist of consolidated adjustments not
appropriated to each reportable segment.
(3) Adjustment of investments in non-current assets totaling 2,950 million yen mainly consist of consolidated adjustments not
appropriated to each reportable segment.
3. Operating income or loss is adjusted with current operating income under consolidated income statements.
24

For the year ended March 31, 2019
Information regarding net sales, income or loss by reportable segmentUnit: ¥ million
Reportable segment
Others(Note 1)
Total Adjustments(Note 2)
Consolidated financial statement amount(Note 3)
Public & Social
InfrastructureFinancial Enterprise &
SolutionsNorth
AmericaEMEA & LATAM Total
Net sales
Sales tooutside clients 399,581 491,579 379,234 416,484 433,858 2,120,735 42,132 2,162,867 758 2,163,625
Intersegmentsales and others 80,354 67,556 150,582 5,436 6,275 310,204 74,082 384,286 (384,286)
Total 479,935 559,135 529,816 421,920 440,133 2,430,939 116,214 2,547,153 (383,528) 2,163,625
Operatingincome or loss(the number shown in parentheses)
43,872 52,930 48,514 3,489 7,895 156,700 2,436 159,136 (11,420) 147,716
Financial income 6,848
Financial costs 7,825Share of profit/loss ofentities for using equity method
175
Income before Income taxes 146,914
Information regarding other items by reportable segment Unit: ¥ million
Reportable segment
Others(Note 1)
Total Adjustments(Note 2)
Consolidated financial statement amount(Note 3)
Public & Social
InfrastructureFinancial Enterprise &
Solutions North America EMEA &LATAM Total
Depreciation and amortization
20,448 76,670 20,976 21,203 12,992 152,289 1,654 153,944 (367) 153,577
Investments in non-current assets
21,821 83,303 37,139 12,151 16,137 170,550 1,939 172,490 6,724 179,214
(Note) 1. Classification of "Other" includes China & APAC regions and subsidiaries that mainly engage in supporting the business of
our head office departments.
2. (1) Adjustment of operating income or loss totaling minus 11,420 million yen mainly consist of consolidated adjustments not
appropriated to each reportable segment.
(2) Adjustment of depreciation and amortization totaling minus 367 million yen mainly consist of consolidated adjustments not
appropriated to each reportable segment.
(3) Adjustment of investments in non-current assets totaling 6,724 million yen mainly consist of consolidated adjustments not
appropriated to each reportable segment.
3. Operating income or loss is adjusted with current operating income under consolidated income statements.
25

(Per share information)
FY ended March 31, 2018
FY ended March 31, 2019
Equity attributable to shareholders of NTT DATA per share 589.08 yen 660.01 yen
Net income per share 58.75 yen 66.75 yenNote: Conducted stock split which shall split of common stock at a ratio of 1:5 as of the effective date of July 1, 2017. Equity attributable to shareholders of NTT DATA per share and Net income per share are calculated based on the assumption that the stock split was conducted at the beginning of the previous consolidated fiscal year.
(Subsequent events)
(NTT DATA Group’s conversion of Cognosante Consulting, LLC into a subsidiary)
(1) Outline of business combination
On April 1, 2019, NTT DATA, the company submitting consolidated financial statements, acquired equity interest of
Cognosante Consulting, LLC, the consulting division of Cognosante based in Virginia, U.S.A., to obtain 100% of voting rights
and control of the company through NTT DATA Services, the subsidiary in North America. The outline of this deal is shown
below. While NTT DATA applied IFRS 3 “Business Combination,” we do not disclose detailed information on accounting
treatment because we have not completed the accounting process for the business combination at the time of writing.
Name of the acquired company Cognosante Consulting, LLC
Main businessProviding healthcare-related agencies of the U.S. state governments with support for development of IT strategies and planning, quality assurance services, services to assist their project management, and others
Main reason for the business combination
The acquisition will enable NTT DATA Services to provide industry-focused professional consulting services in the healthcare-related field to which state governments allocate the largest portion of their budgets. Also, NTT DATA Services will accelerate its efforts to roll out services by acquiring the expertise of Cognosante Consulting, LLC based on their enriched experience of providing services for 48 state governments for nearly 30 years through the business combination.
Date of acquisition April 1, 2019Method adopted by the acquirer company to take control of the acquired company
Acquisition of equity interest in exchange for cash payment
Percentage of the voting rights acquired 100%
(2) Consideration of the transfer
The fair value in consideration of the transfer as of the day of acquisition is as follows.
Consideration of the transfer Cash
The fair value in consideration of the transfer 31,555 million yen
(3) Amount and item of acquisition-related costs
They have not been determined yet.
(4) Goodwill and identifiable assets acquired and liabilities assumed
They have not been determined yet because we are still calculating the fair value of acquired assets and assumed liabilities as of
the day of acquisition.
26

(First-Time Adoption of IFRS)
(1) Transition to financial reporting based on IFRS requirements
Beginning with the current consolidated fiscal year, the NTT DATA Group (hereafter, “the Group”) discloses its consolidated
financial statements in compliance with the IFRS. Its most recent consolidated financial statements (for the period from April 1,
2017 to March 31, 2018) were issued in compliance with JGAAP, and the transition to IFRS was implemented as of the transition
date of April 1, 2017.
IFRS 1 requires that companies adopting the IFRS for the first time apply new rules retrospectively, to periods before the transition.
However, there are certain exceptions in retrospective application, either voluntary or mandatory. The Group adjusted for
inconsistencies caused in complying with this requirement by modifying retained earnings and other capital components, as of the
transition date.
The voluntary exemptions that NTT DATA availed itself of are as follows:
1) Business combinations
Under IFRS 1, companies are allowed to apply IFRS 3 “Business Combinations” (hereinafter referred to as IFRS 3) retrospectively
to all business combinations that took place before the transition date or apply IFRS 3 only to specific business combinations taking
place on the transition date or prior dates.
NTT DATA has elected to apply IFRS 3 to business combinations taking place from the transition date.
2) Foreign currency translation differences for foreign operation
Under IFRS 1, first-time adopters of the IFRS are allowed to elect to either deem cumulative translation adjustments from foreign
operations as of the transition date as zero, or restate translation differences retrospectively to the date of establishment or acquisition
of their foreign businesses. NTT DATA has elected to deem any previous foreign currency translation differences booked as of the
transition date, as zero.
3) Use of deemed cost
Under IFRS 1, first-time adopters have an option to use fair value as of the transition date, as current deemed cost for properties,
plants and equipment. NTT DATA opted to use fair value as of the transition date, as current deemed cost for some of its properties,
plants and equipment.
4) Borrowing expenses
IFRS 1 allows first time adopters of the IFRS to choose not to apply IAS 23 “Borrowing Expenses” (hereinafter referred to as IAS
23) for borrowing expenses related to qualifying assets recognized before the transition date. The Group has elected not to apply IAS
23 for borrowing expenses related to qualifying assets recognized before the transition date.
5) Designation of financial instruments
Under IFRS 1, the Group had an option to designate any changes in the fair value of its equity instruments as “fair value through
other comprehensive income (FVTOCI)” financial assets, if deemed appropriate based on the facts and circumstances of these
financial instruments as of the beginning of the current term (April 1, 2018). NTT DATA has elected to designate its equity
27

instruments as FVTOCI financial assets based on the facts and circumstances of these financial instruments as of the beginning of
the current term (April 1, 2018).
6) Revenue
Under IFRS 1, first-time adopters of the IFRS are eligible for transitional relief provided in the paragraph C5 of IFRS 15 “Revenue
from Contracts with Customers” (hereinafter referred to as IFRS 15). NTT DATA has elected to apply IFRS 15 retrospectively,
while resorting to the practical expedient provided for in IFRS 15.C5(d), which exempts an entity from 1) disclosing any information
about the amount of transaction price allocated to the performance obligations that are not satisfied; and 2) providing an explanation
of when it expects to recognize this amount as revenue, for reporting periods before the current consolidated fiscal year (i.e., the first
IFRS reporting period for the Group).
7) Exemption from restatement of comparative period financial statements in case of applying IFRS 9
Under IFRS 1, if the first reporting period of a first-time adopter of the IFRS begins before January 1, 2019, and if applying IFRS 9
(2014 version), such adopter is not required to restate comparative period financial statements regarding items mentioned in IFRS 9,
in compliance with IFRS 7 and IFRS 9, and thus, is allowed to apply the previous accounting standards to these items.
Using this exemption, the Group applies the JGAAP in recognizing and measuring items mentioned in IFRS 9 in the consolidated
financial statements for comparative periods.
(2) Adjustments in shifting from JGAAP to IFRS
In shifting to the IFRS, NTT DATA has adjusted values reported in consolidated financial statements based on the JGAAP. The
effects that the Group’s shift to the IFRS may have on its financial position, business results, and cash flows are explained in the
table below and in the notes to the table.
Included in the “reclassification” column of the table are items that are irrelevant to equity and comprehensive income, while
“differences in recognition and measurement” represents items affecting equity and comprehensive income.
28

Adjustments of equity at the date of transition to IFRS (April 1, 2017)Unit: ¥ million
Japanese GAAP (line item) Japanese GAAP
Reclassifi-cations
Unificationof reporting
periods(a)(b)
Difference in recognition
and measurement
IFRS Notes IFRS (line item)
Assets AssetsCurrent assets Current assets
Cash and deposits 212,459 47,580 (6,054) 253,984 Cash and cashequivalents
Notes and accountsreceivable - trade 458,086 (3,494) (5,683) 1,172 450,081 Trade and other
receivablesLease receivables andinvestment assets 28,085 (28,085)
49,444 8,419 15,748 73,612 Contract assetInventories 31,211 (17,152) 14,059 InventoriesSecurities 4,303 8,871 414 13,588 Other financial assetsAllowance for doubtful
accounts (3,740) 3,740
Deposits paid 55,809 (55,809)Other 79,636 (22,479) 104 42 57,302 Other current assetsDeferred tax assets 32,062 (32,062)
Total current assets 897,910 (32,294) (2,800) (190) 862,626 Total current assetsNon-current assets Non-current assets
Property, plant andequipment 356,860 (28,377) (6,697) (4,943) 316,843 (c) Property, plant and
equipmentIntangible assets(Goodwill) 315,261 29,648 (2,531) 342,378 (b) Goodwill
Intangible assets(except for Goodwill) 462,022 (31,446) (228) 430,348 (d) Intangible fixed assets
Net defined benefit asset 5,604 (5,604)
28,377 84 28,462 Investment property
Investment securities 86,834 (80,243) 6,591Investments accounted
for using the equitymethod
105,978 813 (106) 106,685 Other financial assetsDeferred tax assets 60,803 32,062 6,116 15,190 114,171 (e) Deferred tax assets
Other 54,419 (20,885) (94) 33,439 Other non-currentassets
Allowance for doubtfulaccounts (773) 773
Total non-current assets 1,341,031 32,080 (1,577) 7,383 1,378,917 Total non-current assetsTotal assets 2,238,941 (214) (4,376) 7,192 2,241,543 Total assets
29

Unit: ¥ million
Japanese GAAP (line item) Japanese GAAP
Reclassifi-cations
Unification of reporting
periods(a)(b)
Difference in recognition
and measurement
IFRS Notes IFRS (line item)
Liabilities LiabilitiesCurrent liabilities Current liabilities
Accounts payable –trade 138,453 115,555 4,245 34,526 292,779 (f) Trade and other
payablesAdvances received 180,827 973 4,178 (132) 185,847 Advance receivedShort-term loans
payable 213,160 103,458 1,636 318,254 Bonds and borrowings
Current portion of long-term loans payable 53,462 (53,462)
Current portion ofbonds 49,997 (49,997)
3,037 56 3,094 Other financialliabilities
Income taxes payable 35,917 (367) (4,512) 31,037 Income taxes payableProvision for loss on
order received 3,452 (3,452)
5,712 361 (1) 6,072 ProvisionsOther 158,352 (121,706) (2,142) 4,237 38,741 (g) Other current liabilities
Total currentliabilities 833,620 (247) 3,822 38,629 875,824 Total current
liabilitiesNon-current liabilities Non-current liabilities
Bonds payable 160,075 168,618 (102) 328,591 Bonds and borrowingsLong-term loans
payable 168,618 (168,618)
7,363 (12) 1,411 8,762 Other financialliabilities
Net defined benefitliability 186,788 199 2,205 189,193 (h) Defined benefit
liabilitiesProvision for directors'retirement benefits 876 (876)
2,693 (1) 2,692 ProvisionsDeferred tax liabilities 30,367 832 (3,258) (21) 27,921 Deferred tax liabilities
Other 24,881 (9,979) (2,915) (2,730) 9,257 Other non-currentliabilities
Total non-currentliabilities 571,606 33 (6,088) 864 566,415 Total non-current
liabilitiesTotal liabilities 1,405,225 (214) (2,266) 39,494 1,442,239 Total liabilitiesNet assets Equity
Capital stock 142,520 142,520 Capital stockCapital surplus 141,048 (21,747) 119,301 Capital surplusRetained earnings 501,369 4,690 (39,109) 466,950 (k) Retained earningsTreasury shares (1) (1) Treasury sharesAccumulated other
comprehensive income 17,211 (6,801) 29,369 39,779 Other components ofequity
Non-controlling interests 31,568 1 (815) 30,754 Non-controlling interests
Total net assets 833,716 (2,110) (32,301) 799,304 Total equityTotal liabilities and
net assets 2,238,941 (214) (4,376) 7,192 2,241,543 Total liabilities and equity
30
Adjustments of equity as of March 31, 2018Unit: ¥ million
Japanese GAAP (line item) Japanese GAAP
Reclassifi-Cations
Unification of reporting
periods(a)(b)
Difference in recognition
and measurement
IFRS Notes IFRS (line item)
Assets AssetsCurrent assets Current assets
Cash and deposits 186,616 3,454 190,070 Cash and cashequivalents
Notes and accountsreceivable - trade 504,632 (15,640) (1,111) (2,518) 485,363 Trade and other
receivablesLease receivables andinvestment assets 26,525 (26,525)
62,479 1,191 18,279 81,948 Contract assetInventories 41,166 (32) (19,591) 21,543 InventoriesSecurities 2,298 9,597 11,895 Other financial assetsAllowance for doubtful
accounts (3,218) 3,218
Deposits paid 12,001 (12,001)Other 85,194 (24,788) (775) 59,631 Other current assetsDeferred tax assets 30,212 (30,212)
Total current assets 885,426 (30,450) 80 (4,605) 850,450 Total current assetsNon-current assets Non-current assets
Property, plant andequipment 380,350 (27,305) (375) (4,273) 348,398 (c) Property, plant and
equipmentIntangible assets(Goodwill) 311,658 24,229 335,887 (b) Goodwill
Intangible assets(except for Goodwill) 430,423 295 694 431,412 (d) Intangible fixed assets
Net defined benefit asset 6,932 (6,932)27,305 80 27,384 Investment property
Investment securities 112,803 (105,972) 6,831Investments accounted
for using the equitymethod
134,650 3,573 138,223 Other financial assetsDeferred tax assets 50,120 30,212 91 15,335 95,757 (e) Deferred tax assets
Other 57,300 (22,480) 1,040 35,860 Other non-currentassets
Allowance for doubtfulaccounts (734) 734
Total non-current assets 1,348,852 30,212 1,131 39,558 1,419,752 Total non-current assetsTotal assets 2,234,278 (239) 1,210 34,953 2,270,203 Total assets
31

t
Japanese GAAP (line item) Japanese GAAP
Reclassifi-cations
Unification of reporting
periods(a)(b)
Difference in recognition
and measurement
IFRS Notes IFRS (line item)
Liabilities LiabilitiesCurrent liabilities Current liabilities
Accounts payable –trade
145,372 125,023 767 36,722 307,885 (f) Trade and otherpayables
Advances received209,747 5,251 248 (1,455) 213,791
Advance received
Short-term loanspayable
46,846 50,567 97,413 Bonds and borrowings
Current portion of long-term loans payable
567 (567)
Current portion ofbonds
50,000 (50,000)
23,111 23,111 Other financialliabilities
Income taxes payable 26,212 0 26,213 Income taxes payableProvision for loss on
order received5,760 (5,760)
7,935 7,935 ProvisionsOther 181,468 (155,001) (248) 4,651 30,870 (g) Other current liabilities
Total currentliabilities
665,972 559 767 39,919 707,217 Total currentliabilities
Non-current liabilities Non-current liabilitiesBonds payable 110,081 358,779 468,860 Bonds and borrowingsLong-term loans
payable358,779 (358,779)
9,483 1,453 10,936 Other financialliabilities
Net defined benefitliability
197,924 1,925 199,849 (h) Defined benefitliabilities
Provision for directors'retirement benefits
909 (909)
3,208 3,208 ProvisionsDeferred tax liabilities 7,142 112 712 (255) 7,710 Deferred tax liabilities
Other 24,607 (12,691) 11,916 Other non-currentliabilities
Total non-currentliabilities
699,442 (798) 712 3,123 702,479 Total non-currentliabilities
Total liabilities 1,365,414 (239) 1,479 43,042 1,409,696 Total liabilitiesNet assets Equity
Capital stock 142,520 142,520 Capital stockCapital surplus 140,977 (24,784) 116,193 Capital surplusRetained earnings 537,369 317 (9,084) 528,601 (k) Retained earningsTreasury shares (1) (1) Treasury sharesAccumulated other
comprehensive income12,995 (585) 26,456 38,865 Other components of
equity
Non-controlling interests 35,004 (677) 34,327 Non-controlling interests
Total net assets 868,863 (268) (8,089) 860,506 Total equityTotal liabilities and
net assets2,234,278 (239) 1,210 34,953 2,270,203 Total liabilities and equity
32

Adjustments of profit/loss and comprehensive income for the year ended March 31, 2018Unit: ¥ million
Japanese GAAP (line item) Japanese GAAP
Reclassifi-cations
Unification of reporting
periods(a)(b)
Difference in recognition
and measurement
IFRS Notes IFRS (line item)
Net sales 2,117,167 (79,775) 2,298 2,039,690 Net salesCost of sales 1,592,746 1,805 (61,076) 2,060 1,535,535 Cost of salesGross profit 524,422 (1,805) (18,700) 238 504,155 Gross profitSelling, general and
administrative expenses 400,899 19,491 (13,178) (26,177) 381,035 (b) Selling, general andadministrative expenses
Operating income 123,522 (21,296) (5,522) 26,415 123,120 Operating incomeNon-operating income 10,161 (10,161)Non-operating expenses 12,120 (12,120)Ordinary income 121,564 (121,564)Extraordinary losses 21,480 (21,480)
5,988 (121) 5,867 Financial income9,103 (438) (1,473) 7,193 Financial costs
1,027 (118) 909Share of profit/loss of
entities for using equity method
Income before incometaxes 100,084 (5,323) 27,943 122,704 Income before income
taxesTotal income taxes 38,716 (1,641) (62) 37,013 Income taxesNet income 61,368 (3,682) 28,005 85,691 Net income
Net income attributable toNet income attributable toowners of parent 58,173 (3,680) 27,899 82,392 Shareholders of NTT
DATA
Net income attributable to non-controlling interests 3,195 (2) 106 3,299 Non-controlling
interests
33

Unit: ¥ million
Japanese GAAP (line item) Japanese GAAP
Reclassifi-cations
Unification of reporting
periods(a)(b)
Difference in recognition
and measurement
IFRS Notes IFRS (line item)
Net income 61,368 (3,682) 28,005 85,691 Net income
Other comprehensiveincome
Other comprehensiveincome (after taxes)
Items that will not bereclassified to profit orloss
Valuation differenceon available-for-salesecurities
17,786 (53) 17,733
Profit/Loss frominvestments in equityinstrumentsdesignated at fairvalue through othercomprehensiveincome
Remeasurements ofdefined benefit plans,net of tax
2,688 (1,262) 1,426 Remeasurements ofdefined benefit plans
0 0 0
Share of othercomprehensiveincome of entitiesaccounted for usingequity method
Other 213 (213)Items that may be
reclassifiedsubsequently toprofit/loss
Deferred gains or losseson hedges 227 227 Cash flow hedges
Foreign currencytranslation adjustment (24,993) 6,369 (317) (18,941) Foreign currency
translation adjustmentShare of other
comprehensive income of entitiesaccounted for usingequity method
152 (0) (9) 50 193
Share of othercomprehensiveincome of entitiesaccounted for usingequity method
Total other comprehensiveincome (3,926) 6,307 (1,742) 638 Total other comprehensive
income (after taxes)Comprehensive income 57,442 2,625 26,263 86,329 Comprehensive incomeComprehensive income
attributable toComprehensive income
attributable to:Comprehensive
income attributableto owners of parent
53,957 2,626 26,294 82,877 Shareholders of NTTDATA
ComprehensiveIncome attributableto non-controllinginterests
3,485 (2) (31) 3,452 Non-controlling interests
34

(3) Notes on adjustments to equity, profit/loss and comprehensive income
1) Reclassification
- Under the JGAAP, deferred tax assets are classified as either current assets or non-current assets, and deferred tax liabilities as
current liabilities or non-current liabilities. As the IFRS does not permit deferred tax assets/liabilities to be classified as current
assets/liabilities, they are classified as non-current assets or liabilities in the Group’s financial statements.
- Whether an accounting item is disclosed separately or grouped into some broader category is indicated in accordance with IFRS
items.
2) Differences in recognition and measurement between JGAAP and IFRS
(a) Alignment of reporting periods
Some subsidiaries had different reporting periods from NTT DATA, but their accounting periods were aligned with NTT DATA’s
in fiscal year 2017. Under the JGAAP, any gains/losses resulting from aligning the reporting periods of NTT DATA and its
subsidiaries were to be reported as net income/loss for the current fiscal year; under the IFRS, these gains/losses are not reflected in
net income/loss but included in retained earnings.
(b) Business combinations
Under the JGAAP, goodwill was amortized consistently over periods in which ROI is reasonably estimated to occur. Under the IFRS,
goodwill is not amortized.
Under the JGAAP, acquisition cost allocation was accounted for on the assumption that this revision was made in the fiscal year in
which the provisional accounting treatment was confirmed (fiscal year 2017, to which the transition date belongs). Under the IFRS,
the revisions related to acquisition cost allocation are accounted for retrospectively, by assuming that the provisional accounting
treatment was confirmed in the fiscal year in which business combinations occurred (fiscal year 2016).
(c) Deemed cost
The Group has elected to apply the optional exemption to use the fair value as of the transition date as deemed cost for some of its
properties, plants and equipment and investment properties.
(d) Intangible assets
Under the JGAAP, R&D costs are recognized as expense as incurred, except in cases where different accounting standards are
applied.
Under the IFRS, expenditures relating to development activities can be measured by the total of expenditure that recognized in the
period from the date on which these expenses meet the requirements all for recognition as intangible assets to the date on which the
development process essentially ends. Also, it has been recorded in the Consolidated Statement of Financial Position. The Group are
mainly developing system (System Integration) and providing services (Plan-Based Services).
(e) Deferred tax assets
Under the JGAAP, the Group recognized deferred tax assets by following the “Implementation Guidance on Recoverability of
Deferred Tax Assets” (ASBJ Guidance No.26); under the IFRS, only the portions of deductible temporary differences, amount of
loss carried forward and deductions of carryover tax that are highly likely to bring in tax benefits are recognized as deferred tax
assets.
(f) Unused paid holidays
The JGAAP has no provisions for unused paid holidays. Under the IFRS, unused paid holidays are accounted for as liability.
(g) Levies
Under the JGAAP, property taxes and other levies that have become payable were accounted for over the fiscal year. Under the IFRS,
35

these levies are to be booked as they become payable.
(h) Employee benefits
Under the JGAAP, service costs, interest expenses, and expected return on plan assets related to defined benefit post retirement plans
are recognized as retirement benefit expenses. In addition, the portions of actuarial differences arising from defined benefit post
retirement plans and prior service costs that are not recognized as retirement benefit expenses for the current term are recognized as
other cumulative comprehensive income, which shall be recognized as net income/loss for a certain period.
Under the IFRS, current service costs and prior service costs for plan assets related to defined benefit post retirement plans are
recognized as net income/loss; for net interest gains/expenses, net defined benefit liabilities (assets) multiplied by a discount rate are
recognized as net income/loss. In addition, actuarial differences arising from the re-measurement of net defined benefit liabilities
(assets) are recognized as components of other capital, and are classified as retained earnings incurred without being recognized
through profit or loss. Please note that the re-measurement of net defined benefit liabilities (assets) consists of actuarial differences
related to defined benefit obligation and return on plan assets (excluding interest income on plan assets).
(i) Foreign currency translation differences for foreign operations
NTT DATA deems any previous foreign currency translation differences booked as on the transition date, as zero.
(j) Stock issuance cost
Under the JGAAP, the transaction costs of equity transaction spent directly for stock issuance are recognized as net income/loss.
Under the IFRS, the transaction costs of equity transaction are accounted for as a deduction from equity, net of any related income
tax benefit.
(k) Adjustments to retained earnings
The effects that the adjustments mentioned above might have on retained earnings are as follows:
Items of adjustmentsAs of April 1, 2017
(Date of transition to IFRS)
As of March 31, 2018
Alignment of reporting periods (a) 4,690 317Differences in recognition and
MeasurementBusiness combinations (b) (2,987) 24,414Deemed cost (c) (3,453) (3,453)Intangible assets (d) 647 561Deferred tax assets (e) 863 909Unused paid holidays (f) (21,170) (22,553)Levies (g) (3,536) (3,582)Employee benefits (h) (31,571) (28,829)Foreign currency translation
differences for foreign operations (i) 16,605 16,605
Stock issuance cost (j) 5,708 5,708Other (215) 1,136Total differences in recognition and
measurement (39,109) (9,084)
Adjustments to retained earnings (34,419) (8,767)
(4) Adjustment to the consolidated statements of cash flows of the previous consolidated fiscal yearMost of the differences between the consolidated statements of cash flows in compliance with JGAAP and those in compliance with IFRS are resulted from aligning the reporting periods of NTT DATA and some of its subsidiaries.
35


![[Updated] Financial Results (Consolidated) for the Fiscal ...Meeting to explain operating results of the current fiscal year to be held: Yes (Consolidated financial statements are](https://img.pdfslide.net/doc/110x75/5ffa39e07afd7929d2378efb/updated-financial-results-consolidated-for-the-fiscal-meeting-to-explain.jpg)