Embed Size (px)
Citation preview
CONSOLIDATED FINANCIAL RESULTSFOR THE NINE MONTHS ENDED SEPTEMBER 30, 2018
〔Japanese GAAP〕November 13, 2018
(Monetary amounts are rounded down to the nearest million yen)
1. Results for the Nine Months Ended September 30, 2018(1) Financial Results
(Reference Information) Percentage Changes After AdjustmentThe percentages represent comparison between the results from the same period of the previous fiscal year (from January 1, 2017 to September 30, 2017) and the results for the nine months ended September 30, 2018 (from January 1, 2018 to September 30, 2018).
Company name: EBARA CORPORATIONStock exchange listings: TokyoCode number: 6361URL: http://www.ebara.com/en/Representative: Toichi Maeda, PresidentContact person: Akihiko Nagamine, Executive Officer, Finance & Accounting Division
Tel. +81-3-3743-6111
Scheduled date for submission of quarterly report: November 14, 2018Scheduled date for dividend payment: -
Preparing supplementary material on financial results: YesHolding financial results presentation meeting(for institutional investors and analysts): Yes
(% represents percentage change from a comparable previous period) Millions of yen
Net Sales Operating Income Ordinary Income Profit Attributable toOwners of Parent
Nine Months EndedSeptember 30, 2018 368,002 -% 20,451 -% 19,985 -% 11,212 -%
Nine Months EndedDecember 31, 2017 - -% - -% - -% - -%
Note: Comprehensive Income: Nine months ended September 30, 2018; 9,349 million yen -%Nine months ended December 31, 2017; - million yen -%
Net Income perShare (Yen)
Net Income perShare, Diluted
(Yen)
Nine Months EndedSeptember 30, 2018 110.27 109.68
Nine Months EndedDecember 31, 2017 - -
Note: Ebara Corporation has changed its fiscal year-end from March 31 to December 31, effective from the previous fiscal year ended December 31, 2017. Due to this change, consolidated financial statements were not prepared for the nine months ended December 31, 2017. Therefore, the results for the nine months ended December 31, 2017 and the percentage change from a comparable previous period are not presented.
Millions of yen
Net Sales Operating Income Ordinary Income Profit Attributable toOwners of Parent
368,002 0.0% 20,451 (26.1)% 19,985 (25.8)% 11,212 (42.0)%
- 1 -
Note: Shareholders’ Equity (Net assets excluding subscription rights to shares and non-controlling interests):
2. Dividends
3. Forecast of Financial Results for the Fiscal Year Ending December 31, 2018
(Reference Information) Percentage Changes After AdjustmentThe percentages represent comparison between the results from the same period of the previous fiscal year (from January 1, 2017 to December 31, 2017) and the forecast for the fiscal year ending December 31, 2018.
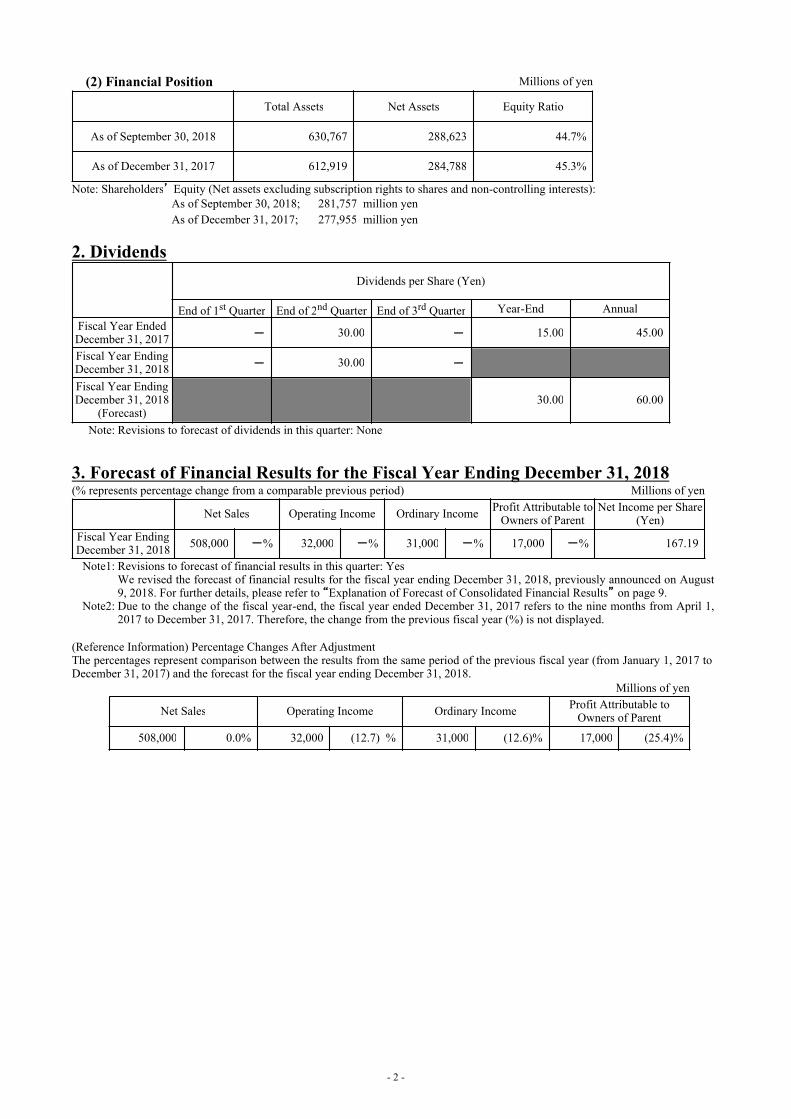
(2) Financial Position Millions of yen
Total Assets Net Assets Equity Ratio
As of September 30, 2018 630,767 288,623 44.7%
As of December 31, 2017 612,919 284,788 45.3%
As of September 30, 2018; 281,757 million yenAs of December 31, 2017; 277,955 million yen
Dividends per Share (Yen)
End of 1st Quarter End of 2nd Quarter End of 3rd Quarter Year-End Annual
Fiscal Year EndedDecember 31, 2017 - 30.00 - 15.00 45.00
Fiscal Year EndingDecember 31, 2018 - 30.00 -
Fiscal Year EndingDecember 31, 2018
(Forecast)30.00 60.00
Note: Revisions to forecast of dividends in this quarter: None
(% represents percentage change from a comparable previous period) Millions of yen
Net Sales Operating Income Ordinary Income Profit Attributable toOwners of Parent
Net Income per Share (Yen)
Fiscal Year EndingDecember 31, 2018 508,000 -% 32,000 -% 31,000 -% 17,000 -% 167.19
Note1:
Note2:
Revisions to forecast of financial results in this quarter: YesWe revised the forecast of financial results for the fiscal year ending December 31, 2018, previously announced on August9, 2018. For further details, please refer to “Explanation of Forecast of Consolidated Financial Results” on page 9. Due to the change of the fiscal year-end, the fiscal year ended December 31, 2017 refers to the nine months from April 1,2017 to December 31, 2017. Therefore, the change from the previous fiscal year (%) is not displayed.
Millions of yen
Net Sales Operating Income Ordinary Income Profit Attributable toOwners of Parent
508,000 0.0% 32,000 (12.7) % 31,000 (12.6)% 17,000 (25.4)%
- 2 -
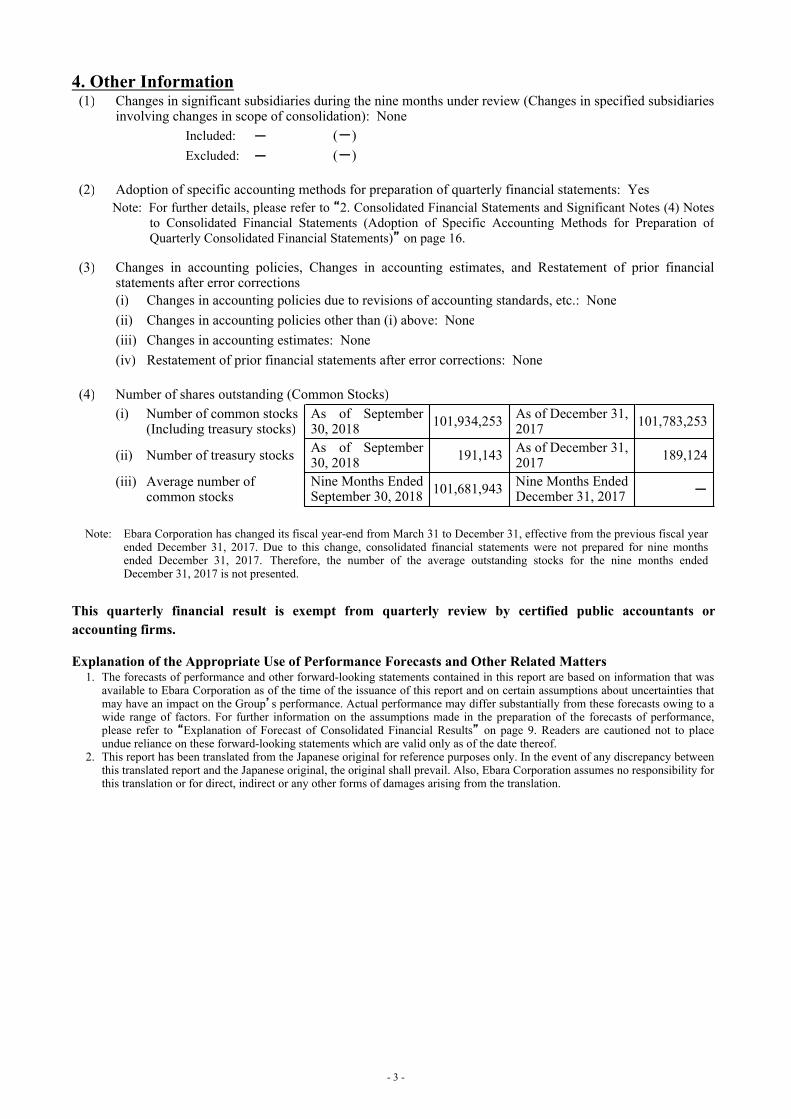
4. Other Information
This quarterly financial result is exempt from quarterly review by certified public accountants oraccounting firms.
Explanation of the Appropriate Use of Performance Forecasts and Other Related Matters
(1) Changes in significant subsidiaries during the nine months under review (Changes in specified subsidiaries involving changes in scope of consolidation): None
Included: - (-)
Excluded: - (-)
(2) Adoption of specific accounting methods for preparation of quarterly financial statements: YesNote: For further details, please refer to “2. Consolidated Financial Statements and Significant Notes (4) Notes
to Consolidated Financial Statements (Adoption of Specific Accounting Methods for Preparation of Quarterly Consolidated Financial Statements)” on page 16.
(3) Changes in accounting policies, Changes in accounting estimates, and Restatement of prior financialstatements after error corrections(i) Changes in accounting policies due to revisions of accounting standards, etc.: None
(ii) Changes in accounting policies other than (i) above: None
(iii) Changes in accounting estimates: None
(iv) Restatement of prior financial statements after error corrections: None
(4) Number of shares outstanding (Common Stocks)(i) Number of common stocks
(Including treasury stocks)As of September 30, 2018 101,934,253 As of December 31,
2017 101,783,253
(ii) Number of treasury stocks As of September 30, 2018 191,143 As of December 31,
2017 189,124
(iii) Average number of common stocks
Nine Months Ended September 30, 2018 101,681,943 Nine Months Ended
December 31, 2017 -
Note: Ebara Corporation has changed its fiscal year-end from March 31 to December 31, effective from the previous fiscal year ended December 31, 2017. Due to this change, consolidated financial statements were not prepared for nine months ended December 31, 2017. Therefore, the number of the average outstanding stocks for the nine months ended December 31, 2017 is not presented.
1. The forecasts of performance and other forward-looking statements contained in this report are based on information that was available to Ebara Corporation as of the time of the issuance of this report and on certain assumptions about uncertainties that may have an impact on the Group’s performance. Actual performance may differ substantially from these forecasts owing to a wide range of factors. For further information on the assumptions made in the preparation of the forecasts of performance, please refer to “Explanation of Forecast of Consolidated Financial Results” on page 9. Readers are cautioned not to place undue reliance on these forward-looking statements which are valid only as of the date thereof.
2. This report has been translated from the Japanese original for reference purposes only. In the event of any discrepancy between this translated report and the Japanese original, the original shall prevail. Also, Ebara Corporation assumes no responsibility for this translation or for direct, indirect or any other forms of damages arising from the translation.
- 3 -
Contents
1. Qualitative Information Regarding Consolidated Financial Results ・・・・・・・・・・・・・ P.5
(1) Explanation of Financial Results ・・・・・・・・・・・・・ P.5
(2) Explanation of Financial Position ・・・・・・・・・・・・・ P.8
(3) Explanation of Forecast of Consolidated Financial Results ・・・・・・・・・・・・・ P.9
2. Consolidated Financial Statements and Significant Notes ・・・・・・・・・・・・・P.10
(1) Consolidated Balance Sheets ・・・・・・・・・・・・・ P.10
(2) Consolidated Statements of Income and Comprehensive Income ・・・・・・・・・・・・・ P.12
(3) Consolidated Statements of Cash Flows ・・・・・・・・・・・・・ P.14
(4) Notes to Consolidated Financial Statements ・・・・・・・・・・・・・ P.16
(Note for the Assumption of Going Concern) ・・・・・・・・・・・・・ P.16
(Note for Significant Changes in the Amount of Shareholders’ Equity) ・・・・・・・・・・・・・ P.16(Adoption of Specific Accounting Methods for Preparation of Quarterly Consolidated Financial Statements) ・・・・・・・・・・・・・ P.16
(Segment Information) ・・・・・・・・・・・・・ P.16
(Additional Information) ・・・・・・・・・・・・・ P.17
(Subsequent Event) ・・・・・・・・・・・・・ P.17
3. Others ・・・・・・・・・・・・・P.18
(1) Segment Information ・・・・・・・・・・・・・ P.18
(2) Sales, Orders and Forecast by Subsegment ・・・・・・・・・・・・・ P.19
(3) Area Information ・・・・・・・・・・・・・ P.20
- 4 -
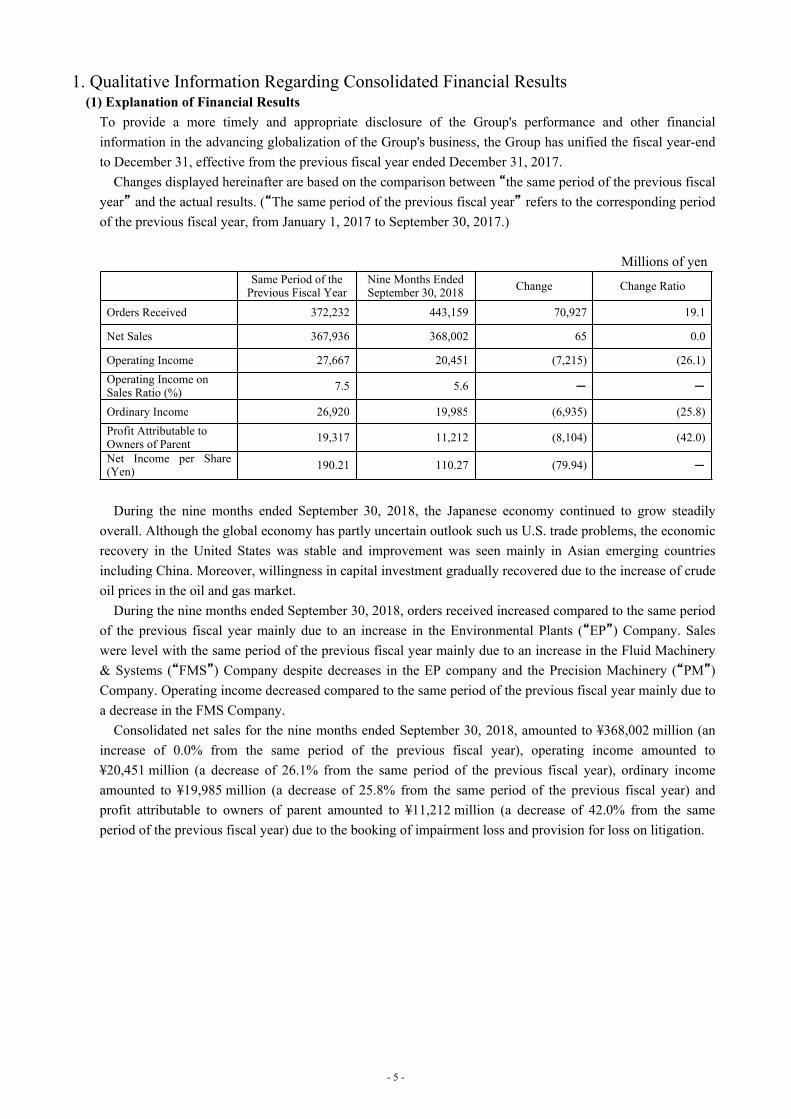
1. Qualitative Information Regarding Consolidated Financial Results(1) Explanation of Financial Results
To provide a more timely and appropriate disclosure of the Group's performance and other financial
information in the advancing globalization of the Group's business, the Group has unified the fiscal year-end
to December 31, effective from the previous fiscal year ended December 31, 2017.
Changes displayed hereinafter are based on the comparison between “the same period of the previous fiscal
year” and the actual results. (“The same period of the previous fiscal year” refers to the corresponding period
of the previous fiscal year, from January 1, 2017 to September 30, 2017.)
Millions of yen
During the nine months ended September 30, 2018, the Japanese economy continued to grow steadily
overall. Although the global economy has partly uncertain outlook such us U.S. trade problems, the economic
recovery in the United States was stable and improvement was seen mainly in Asian emerging countries
including China. Moreover, willingness in capital investment gradually recovered due to the increase of crude
oil prices in the oil and gas market.
During the nine months ended September 30, 2018, orders received increased compared to the same period
of the previous fiscal year mainly due to an increase in the Environmental Plants (“EP”) Company. Sales
were level with the same period of the previous fiscal year mainly due to an increase in the Fluid Machinery
& Systems (“FMS”) Company despite decreases in the EP company and the Precision Machinery (“PM”)
Company. Operating income decreased compared to the same period of the previous fiscal year mainly due to
a decrease in the FMS Company.
Consolidated net sales for the nine months ended September 30, 2018, amounted to ¥368,002 million (an
increase of 0.0% from the same period of the previous fiscal year), operating income amounted to
¥20,451 million (a decrease of 26.1% from the same period of the previous fiscal year), ordinary income
amounted to ¥19,985 million (a decrease of 25.8% from the same period of the previous fiscal year) and
profit attributable to owners of parent amounted to ¥11,212 million (a decrease of 42.0% from the same
period of the previous fiscal year) due to the booking of impairment loss and provision for loss on litigation.
Same Period of the Previous Fiscal Year
Nine Months EndedSeptember 30, 2018 Change Change Ratio
Orders Received 372,232 443,159 70,927 19.1
Net Sales 367,936 368,002 65 0.0
Operating Income 27,667 20,451 (7,215) (26.1)
Operating Income on Sales Ratio (%) 7.5 5.6 - -
Ordinary Income 26,920 19,985 (6,935) (25.8)
Profit Attributable to Owners of Parent
19,317 11,212 (8,104) (42.0)
Net Income per Share (Yen) 190.21 110.27 (79.94) -
- 5 -
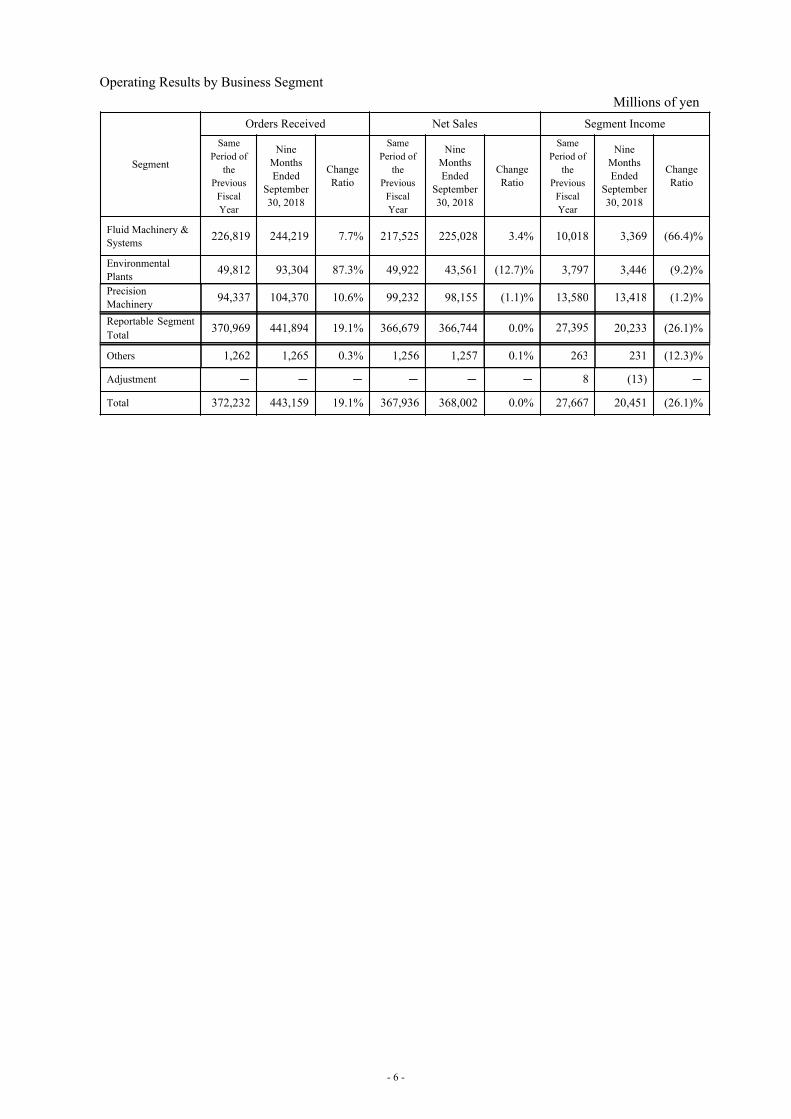
Operating Results by Business Segment
Millions of yen
Segment
Orders Received Net Sales Segment Income
Same Period of
the Previous
Fiscal Year
Nine Months Ended
September 30, 2018
Change Ratio
Same Period of
the Previous
Fiscal Year
Nine Months Ended
September 30, 2018
Change Ratio
Same Period of
the Previous
Fiscal Year
Nine Months Ended
September 30, 2018
Change Ratio
Fluid Machinery & Systems
226,819 244,219 7.7% 217,525 225,028 3.4% 10,018 3,369 (66.4)%
Environmental Plants
49,812 93,304 87.3% 49,922 43,561 (12.7)% 3,797 3,446 (9.2)%
Precision Machinery
94,337 104,370 10.6% 99,232 98,155 (1.1)% 13,580 13,418 (1.2)%
Reportable Segment Total
370,969 441,894 19.1% 366,679 366,744 0.0% 27,395 20,233 (26.1)%
Others 1,262 1,265 0.3% 1,256 1,257 0.1% 263 231 (12.3)%
Adjustment - - - - - - 8 (13) -
Total 372,232 443,159 19.1% 367,936 368,002 0.0% 27,667 20,451 (26.1)%
- 6 -
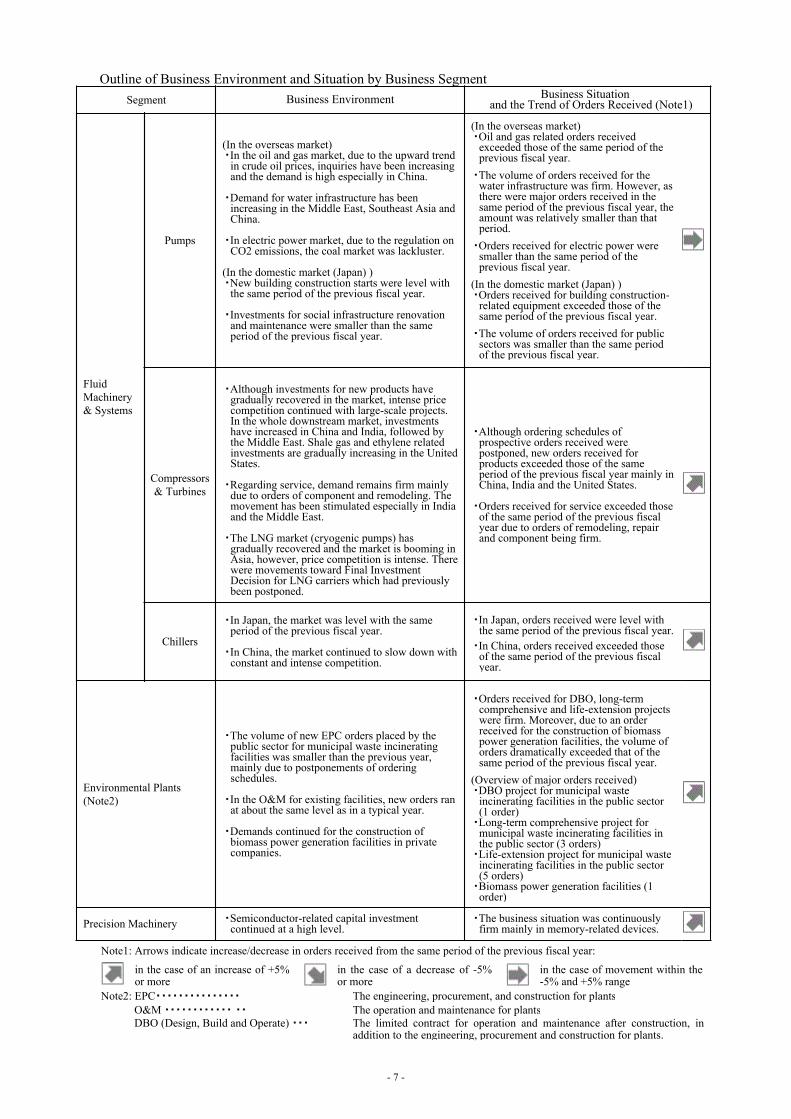
Outline of Business Environment and Situation by Business Segment
Note1: Arrows indicate increase/decrease in orders received from the same period of the previous fiscal year:
Segment Business Environment Business Situation and the Trend of Orders Received (Note1)
Fluid Machinery & Systems
Pumps
(In the overseas market)・In the oil and gas market, due to the upward trend
in crude oil prices, inquiries have been increasing and the demand is high especially in China.
・Demand for water infrastructure has been increasing in the Middle East, Southeast Asia and China.
・In electric power market, due to the regulation on CO2 emissions, the coal market was lackluster.
(In the domestic market (Japan) )・New building construction starts were level with
the same period of the previous fiscal year.
・Investments for social infrastructure renovation and maintenance were smaller than the same period of the previous fiscal year.
(In the overseas market)・Oil and gas related orders received
exceeded those of the same period of the previous fiscal year.
・The volume of orders received for the water infrastructure was firm. However, as there were major orders received in the same period of the previous fiscal year, the amount was relatively smaller than that period.
・Orders received for electric power were smaller than the same period of the previous fiscal year.
(In the domestic market (Japan) )・Orders received for building construction-
related equipment exceeded those of the same period of the previous fiscal year.
・The volume of orders received for public sectors was smaller than the same period of the previous fiscal year.
Compressors & Turbines
・Although investments for new products have gradually recovered in the market, intense price competition continued with large-scale projects. In the whole downstream market, investments have increased in China and India, followed by the Middle East. Shale gas and ethylene related investments are gradually increasing in the United States.
・Regarding service, demand remains firm mainly due to orders of component and remodeling. The movement has been stimulated especially in India and the Middle East.
・The LNG market (cryogenic pumps) has gradually recovered and the market is booming in Asia, however, price competition is intense. There were movements toward Final Investment Decision for LNG carriers which had previously been postponed.
・Although ordering schedules of prospective orders received were postponed, new orders received for products exceeded those of the same period of the previous fiscal year mainly in China, India and the United States.
・Orders received for service exceeded those of the same period of the previous fiscal year due to orders of remodeling, repair and component being firm.
Chillers
・In Japan, the market was level with the same period of the previous fiscal year.
・In China, the market continued to slow down with constant and intense competition.
・In Japan, orders received were level with the same period of the previous fiscal year.
・In China, orders received exceeded those of the same period of the previous fiscal year.
Environmental Plants (Note2)
・The volume of new EPC orders placed by the public sector for municipal waste incinerating facilities was smaller than the previous year, mainly due to postponements of ordering schedules.
・In the O&M for existing facilities, new orders ran at about the same level as in a typical year.
・Demands continued for the construction of biomass power generation facilities in private companies.
・Orders received for DBO, long-term comprehensive and life-extension projects were firm. Moreover, due to an order received for the construction of biomass power generation facilities, the volume of orders dramatically exceeded that of the same period of the previous fiscal year.
(Overview of major orders received)・DBO project for municipal waste
incinerating facilities in the public sector (1 order)
・Long-term comprehensive project for municipal waste incinerating facilities in the public sector (3 orders)
・Life-extension project for municipal waste incinerating facilities in the public sector (5 orders)
・Biomass power generation facilities (1 order)
Precision Machinery ・Semiconductor-related capital investment continued at a high level.
・The business situation was continuously firm mainly in memory-related devices.
in the case of an increase of +5% or more
in the case of a decrease of -5% or more
in the case of movement within the -5% and +5% range
Note2: EPC・・・・・・・・・・・・・・・ The engineering, procurement, and construction for plantsO&M ・・・・・・・・・・・・ ・・ The operation and maintenance for plantsDBO (Design, Build and Operate) ・・・ The limited contract for operation and maintenance after construction, in
addition to the engineering, procurement and construction for plants.
- 7 -
(2) Explanation of Financial Position
i. Assets
Total assets as of September 30, 2018 were ¥630,767 million, ¥17,847 million higher than as of December
31, 2017. Principal changes in asset items included an increase of ¥14,573 million in cash and deposits.
ii. Liabilities
Total liabilities as of September 30, 2018 were ¥342,144 million, ¥14,013 million higher than as of December
31, 2017. Principal changes in liability items included an increase of ¥4,710 million in short-term loans
payable, and an increase of ¥3,250 million in bonus payment reserve.
iii. Net Assets
Net assets as of September 30, 2018 amounted to ¥288,623 million, ¥3,834 million higher than as of
December 31, 2017. Principal changes affecting net asset items were profit attributable to owners of parent of
¥11,212 million, cash dividends paid of ¥4,575 million, and a decrease of ¥2,379 million in translation
adjustments. Shareholders’ equity (Net assets excluding subscription rights to shares and non-controlling
interests) amounted to ¥281,757 million, and equity ratio was 44.7%.
- 8 -
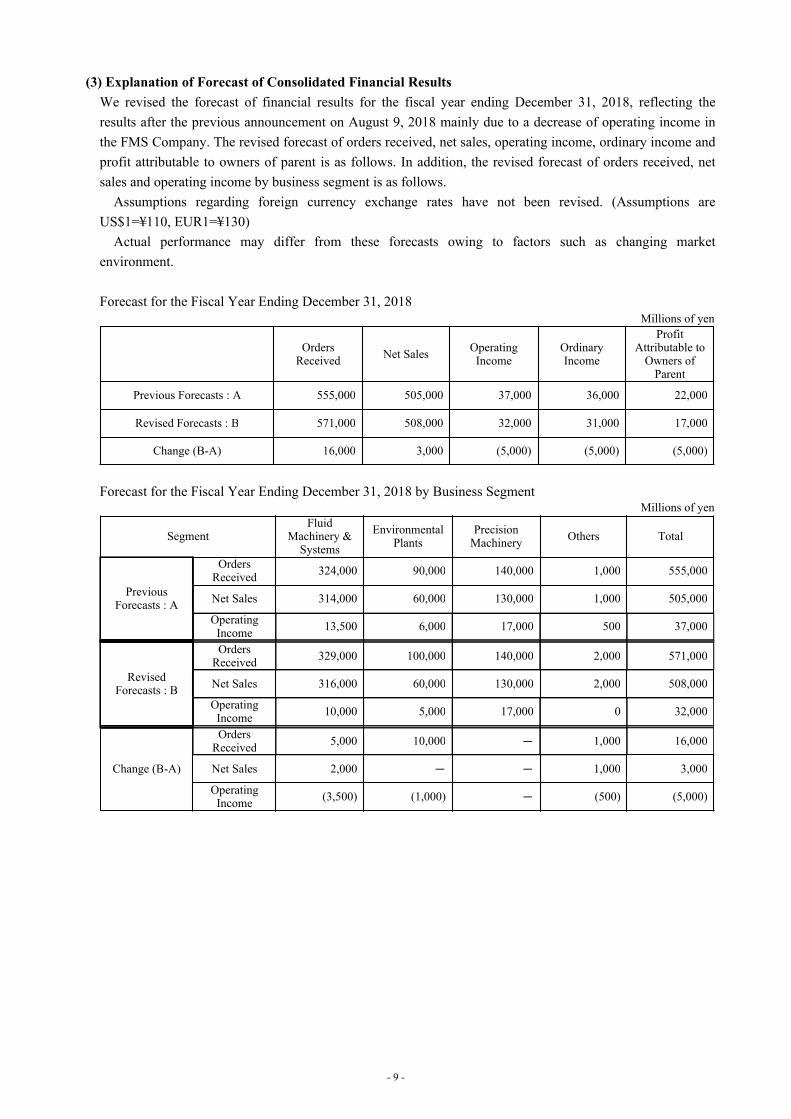
(3) Explanation of Forecast of Consolidated Financial Results
We revised the forecast of financial results for the fiscal year ending December 31, 2018, reflecting the
results after the previous announcement on August 9, 2018 mainly due to a decrease of operating income in
the FMS Company. The revised forecast of orders received, net sales, operating income, ordinary income and
profit attributable to owners of parent is as follows. In addition, the revised forecast of orders received, net
sales and operating income by business segment is as follows.
Assumptions regarding foreign currency exchange rates have not been revised. (Assumptions are
US$1=¥110, EUR1=¥130)
Actual performance may differ from these forecasts owing to factors such as changing market
environment.
Forecast for the Fiscal Year Ending December 31, 2018
Forecast for the Fiscal Year Ending December 31, 2018 by Business Segment
Millions of yen
Orders Received Net Sales
Operating Income
Ordinary Income
Profit Attributable to
Owners of Parent
Previous Forecasts : A 555,000 505,000 37,000 36,000 22,000
Revised Forecasts : B 571,000 508,000 32,000 31,000 17,000
Change (B-A) 16,000 3,000 (5,000) (5,000) (5,000)
Millions of yen
SegmentFluid
Machinery & Systems
Environmental Plants
Precision Machinery
Others Total
Previous Forecasts : A
Orders Received 324,000 90,000 140,000 1,000 555,000
Net Sales 314,000 60,000 130,000 1,000 505,000
Operating Income
13,500 6,000 17,000 500 37,000
Revised Forecasts : B
Orders Received 329,000 100,000 140,000 2,000 571,000
Net Sales 316,000 60,000 130,000 2,000 508,000
Operating Income 10,000 5,000 17,000 0 32,000
Change (B-A)
Orders Received
5,000 10,000 - 1,000 16,000
Net Sales 2,000 - - 1,000 3,000
Operating Income (3,500) (1,000) - (500) (5,000)
- 9 -
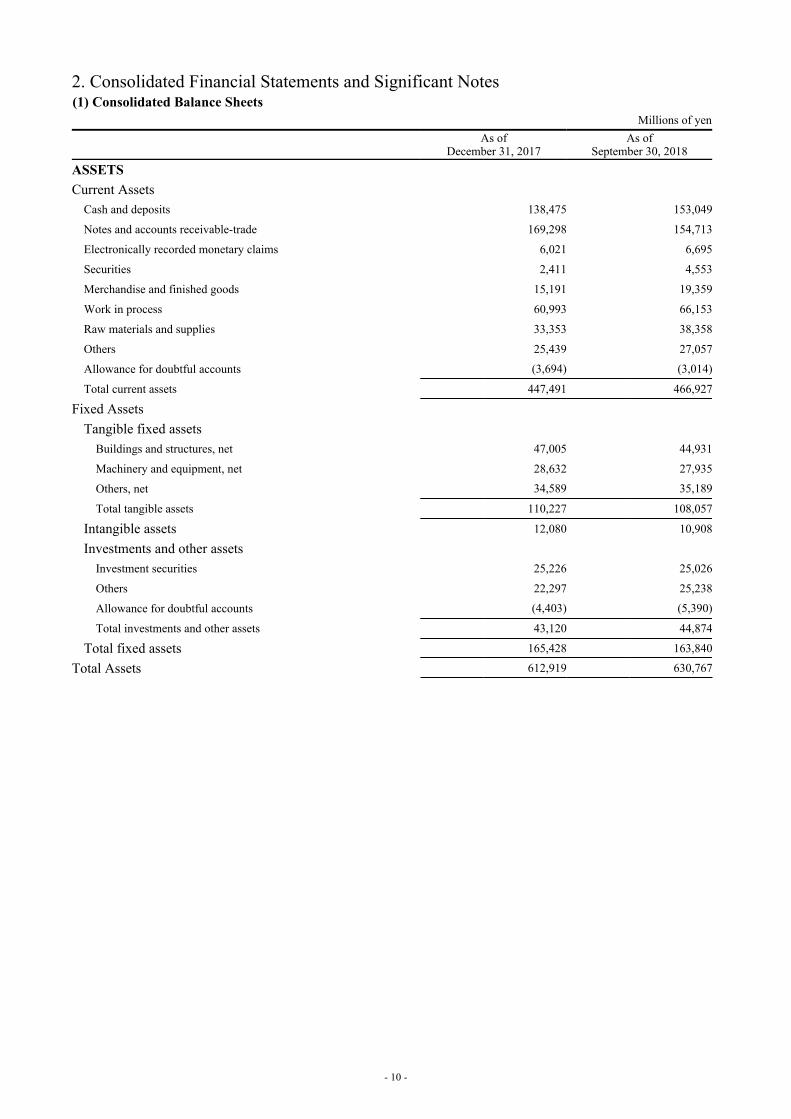
2. Consolidated Financial Statements and Significant Notes(1) Consolidated Balance Sheets
Millions of yen
As ofDecember 31, 2017
As ofSeptember 30, 2018
ASSETS
Current AssetsCash and deposits 138,475 153,049
Notes and accounts receivable-trade 169,298 154,713
Electronically recorded monetary claims 6,021 6,695
Securities 2,411 4,553
Merchandise and finished goods 15,191 19,359
Work in process 60,993 66,153
Raw materials and supplies 33,353 38,358
Others 25,439 27,057
Allowance for doubtful accounts (3,694) (3,014)
Total current assets 447,491 466,927
Fixed Assets
Tangible fixed assetsBuildings and structures, net 47,005 44,931
Machinery and equipment, net 28,632 27,935
Others, net 34,589 35,189
Total tangible assets 110,227 108,057
Intangible assets 12,080 10,908
Investments and other assetsInvestment securities 25,226 25,026
Others 22,297 25,238
Allowance for doubtful accounts (4,403) (5,390)
Total investments and other assets 43,120 44,874
Total fixed assets 165,428 163,840
Total Assets 612,919 630,767
- 10 -
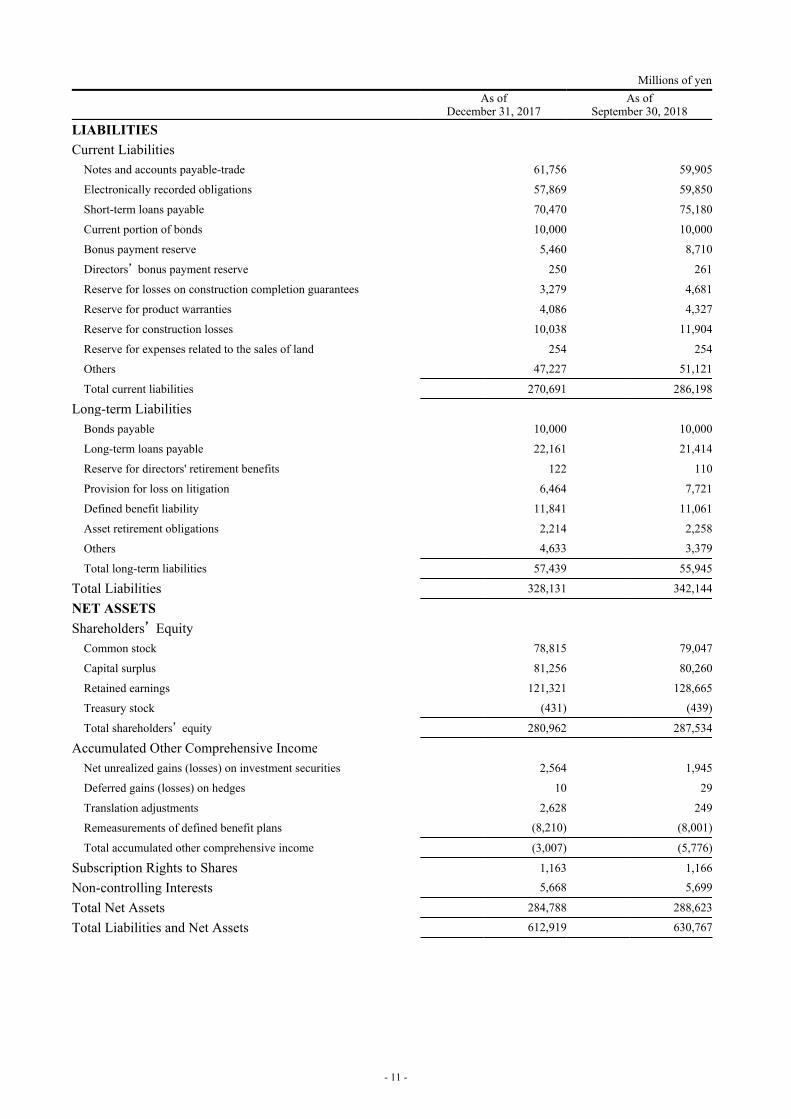
Millions of yen
As ofDecember 31, 2017
As ofSeptember 30, 2018
LIABILITIES
Current LiabilitiesNotes and accounts payable-trade 61,756 59,905
Electronically recorded obligations 57,869 59,850
Short-term loans payable 70,470 75,180
Current portion of bonds 10,000 10,000
Bonus payment reserve 5,460 8,710
Directors’ bonus payment reserve 250 261
Reserve for losses on construction completion guarantees 3,279 4,681
Reserve for product warranties 4,086 4,327
Reserve for construction losses 10,038 11,904
Reserve for expenses related to the sales of land 254 254
Others 47,227 51,121
Total current liabilities 270,691 286,198
Long-term LiabilitiesBonds payable 10,000 10,000
Long-term loans payable 22,161 21,414
Reserve for directors' retirement benefits 122 110
Provision for loss on litigation 6,464 7,721
Defined benefit liability 11,841 11,061
Asset retirement obligations 2,214 2,258
Others 4,633 3,379
Total long-term liabilities 57,439 55,945
Total Liabilities 328,131 342,144
NET ASSETS
Shareholders’ EquityCommon stock 78,815 79,047
Capital surplus 81,256 80,260
Retained earnings 121,321 128,665
Treasury stock (431) (439)
Total shareholders’ equity 280,962 287,534
Accumulated Other Comprehensive IncomeNet unrealized gains (losses) on investment securities 2,564 1,945
Deferred gains (losses) on hedges 10 29
Translation adjustments 2,628 249
Remeasurements of defined benefit plans (8,210) (8,001)
Total accumulated other comprehensive income (3,007) (5,776)
Subscription Rights to Shares 1,163 1,166
Non-controlling Interests 5,668 5,699
Total Net Assets 284,788 288,623
Total Liabilities and Net Assets 612,919 630,767
- 11 -
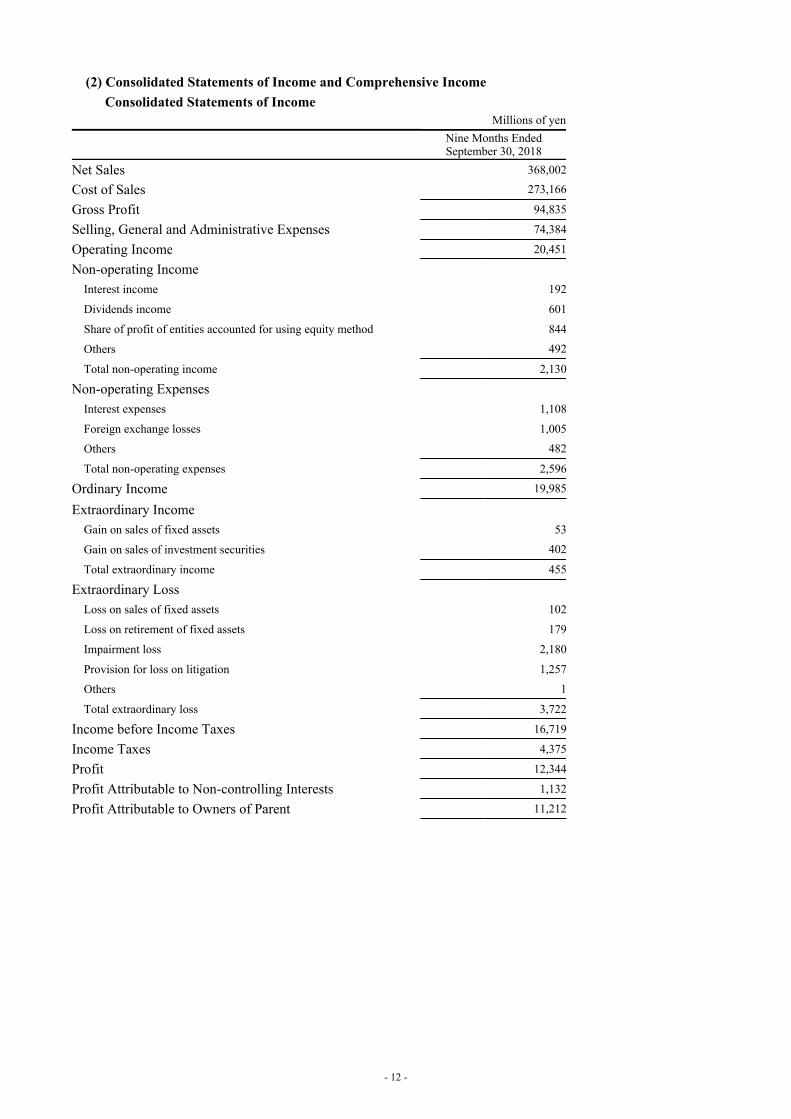
(2) Consolidated Statements of Income and Comprehensive Income
Consolidated Statements of IncomeMillions of yen
Nine Months EndedSeptember 30, 2018
Net Sales 368,002
Cost of Sales 273,166
Gross Profit 94,835
Selling, General and Administrative Expenses 74,384
Operating Income 20,451
Non-operating IncomeInterest income 192
Dividends income 601
Share of profit of entities accounted for using equity method 844
Others 492
Total non-operating income 2,130
Non-operating ExpensesInterest expenses 1,108
Foreign exchange losses 1,005
Others 482
Total non-operating expenses 2,596
Ordinary Income 19,985
Extraordinary IncomeGain on sales of fixed assets 53
Gain on sales of investment securities 402
Total extraordinary income 455
Extraordinary LossLoss on sales of fixed assets 102
Loss on retirement of fixed assets 179
Impairment loss 2,180
Provision for loss on litigation 1,257
Others 1
Total extraordinary loss 3,722
Income before Income Taxes 16,719
Income Taxes 4,375
Profit 12,344
Profit Attributable to Non-controlling Interests 1,132
Profit Attributable to Owners of Parent 11,212
- 12 -
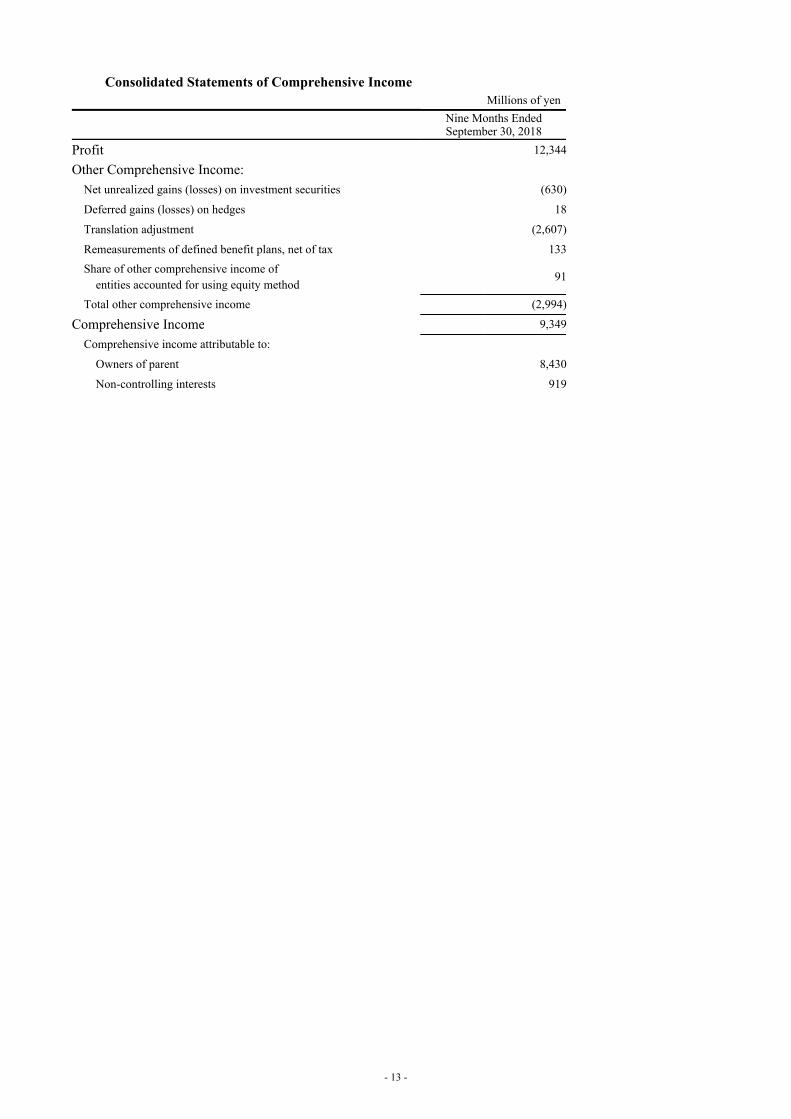
Consolidated Statements of Comprehensive IncomeMillions of yen
Nine Months EndedSeptember 30, 2018
Profit 12,344
Other Comprehensive Income:Net unrealized gains (losses) on investment securities (630)
Deferred gains (losses) on hedges 18
Translation adjustment (2,607)
Remeasurements of defined benefit plans, net of tax 133
Share of other comprehensive income ofentities accounted for using equity method
91
Total other comprehensive income (2,994)
Comprehensive Income 9,349
Comprehensive income attributable to:
Owners of parent 8,430
Non-controlling interests 919
- 13 -
Millions of yen
Nine Months Ended September 30, 2018
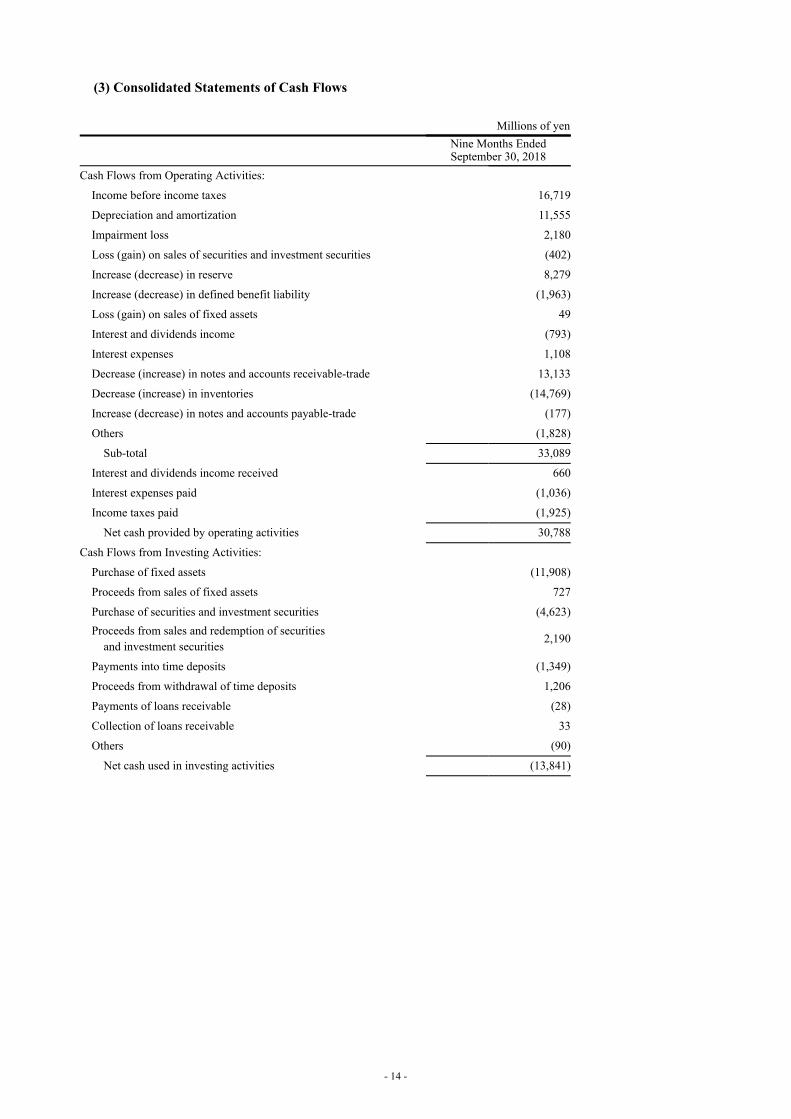
Cash Flows from Operating Activities: Income before income taxes 16,719
Depreciation and amortization 11,555
Impairment loss 2,180
Loss (gain) on sales of securities and investment securities (402)
Increase (decrease) in reserve 8,279
Increase (decrease) in defined benefit liability (1,963)
Loss (gain) on sales of fixed assets 49
Interest and dividends income (793)
Interest expenses 1,108
Decrease (increase) in notes and accounts receivable-trade 13,133
Decrease (increase) in inventories (14,769)
Increase (decrease) in notes and accounts payable-trade (177)
Others (1,828)
Sub-total 33,089
Interest and dividends income received 660
Interest expenses paid (1,036)
Income taxes paid (1,925)
Net cash provided by operating activities 30,788
Cash Flows from Investing Activities: Purchase of fixed assets (11,908)
Proceeds from sales of fixed assets 727
Purchase of securities and investment securities (4,623)Proceeds from sales and redemption of securities
and investment securities 2,190
Payments into time deposits (1,349)
Proceeds from withdrawal of time deposits 1,206
Payments of loans receivable (28)
Collection of loans receivable 33
Others (90)
Net cash used in investing activities (13,841)
(3) Consolidated Statements of Cash Flows
- 14 -
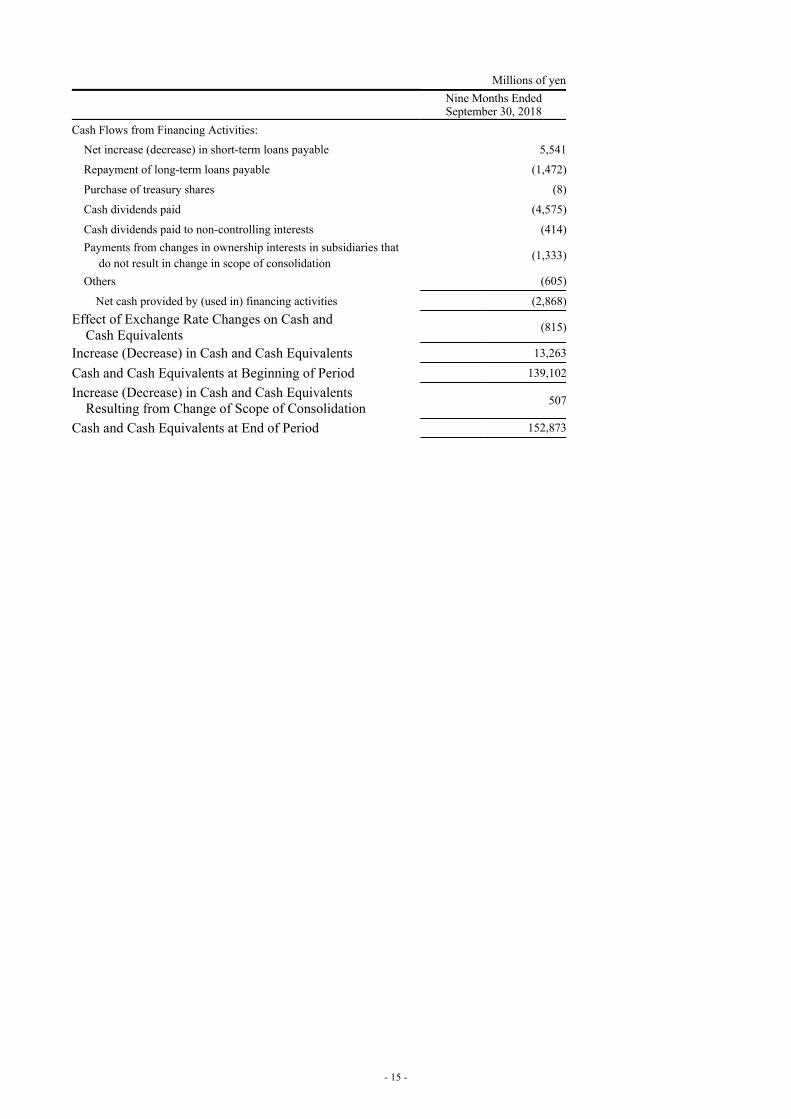
Millions of yen
Nine Months EndedSeptember 30, 2018
Cash Flows from Financing Activities:
Net increase (decrease) in short-term loans payable 5,541
Repayment of long-term loans payable (1,472)
Purchase of treasury shares (8)
Cash dividends paid (4,575)
Cash dividends paid to non-controlling interests (414)
Payments from changes in ownership interests in subsidiaries that do not result in change in scope of consolidation
(1,333)
Others (605)
Net cash provided by (used in) financing activities (2,868)
Effect of Exchange Rate Changes on Cash and Cash Equivalents
(815)
Increase (Decrease) in Cash and Cash Equivalents 13,263
Cash and Cash Equivalents at Beginning of Period 139,102
Increase (Decrease) in Cash and Cash EquivalentsResulting from Change of Scope of Consolidation
507
Cash and Cash Equivalents at End of Period 152,873
- 15 -
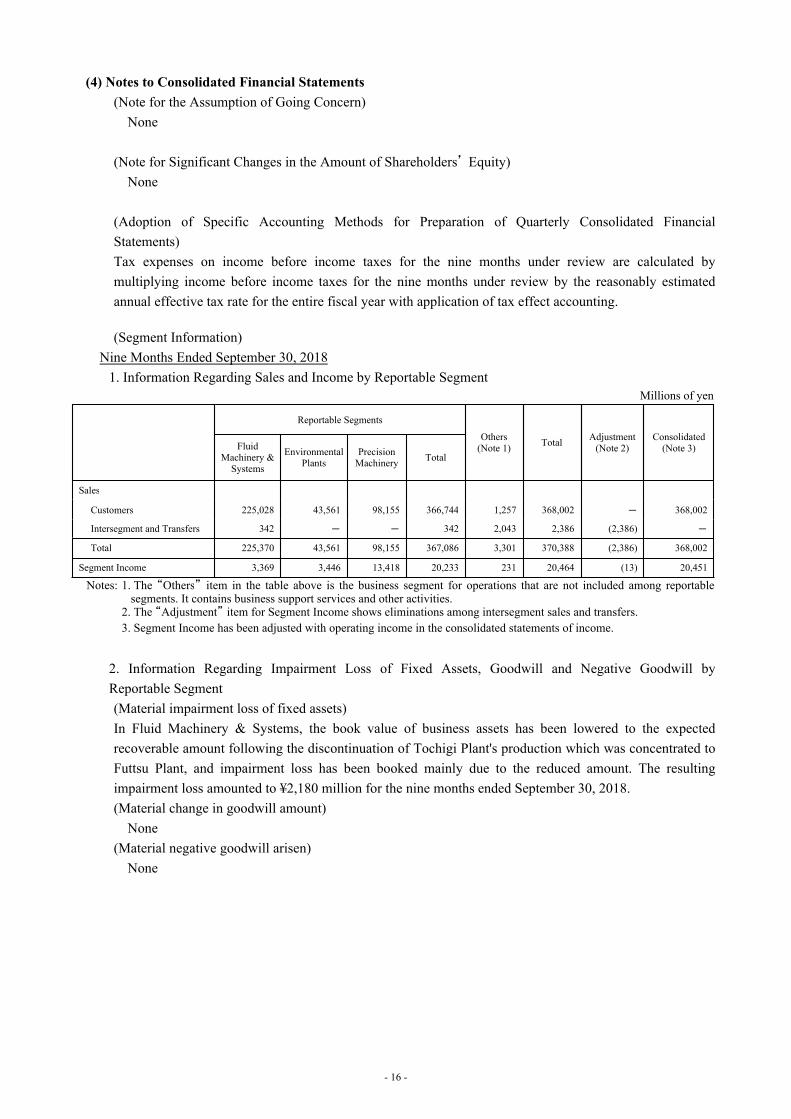
(4) Notes to Consolidated Financial Statements
(Note for the Assumption of Going Concern)
None
(Note for Significant Changes in the Amount of Shareholders’ Equity)
None
(Adoption of Specific Accounting Methods for Preparation of Quarterly Consolidated Financial
Statements)
Tax expenses on income before income taxes for the nine months under review are calculated by
multiplying income before income taxes for the nine months under review by the reasonably estimated
annual effective tax rate for the entire fiscal year with application of tax effect accounting.
(Segment Information)
Nine Months Ended September 30, 2018
1. Information Regarding Sales and Income by Reportable Segment
2. Information Regarding Impairment Loss of Fixed Assets, Goodwill and Negative Goodwill by
Reportable Segment
(Material impairment loss of fixed assets)
In Fluid Machinery & Systems, the book value of business assets has been lowered to the expected
recoverable amount following the discontinuation of Tochigi Plant's production which was concentrated to
Futtsu Plant, and impairment loss has been booked mainly due to the reduced amount. The resulting
impairment loss amounted to ¥2,180 million for the nine months ended September 30, 2018.
(Material change in goodwill amount)
None
(Material negative goodwill arisen)
None
Millions of yen
Reportable Segments
Others(Note 1)
TotalAdjustment
(Note 2)Consolidated
(Note 3)FluidMachinery &
Systems
Environmental Plants
PrecisionMachinery
Total
Sales
Customers 225,028 43,561 98,155 366,744 1,257 368,002 - 368,002
Intersegment and Transfers 342 - - 342 2,043 2,386 (2,386) -
Total 225,370 43,561 98,155 367,086 3,301 370,388 (2,386) 368,002
Segment Income 3,369 3,446 13,418 20,233 231 20,464 (13) 20,451
Notes: 1. The “Others” item in the table above is the business segment for operations that are not included among reportablesegments. It contains business support services and other activities.
2. The “Adjustment” item for Segment Income shows eliminations among intersegment sales and transfers.3. Segment Income has been adjusted with operating income in the consolidated statements of income.
- 16 -
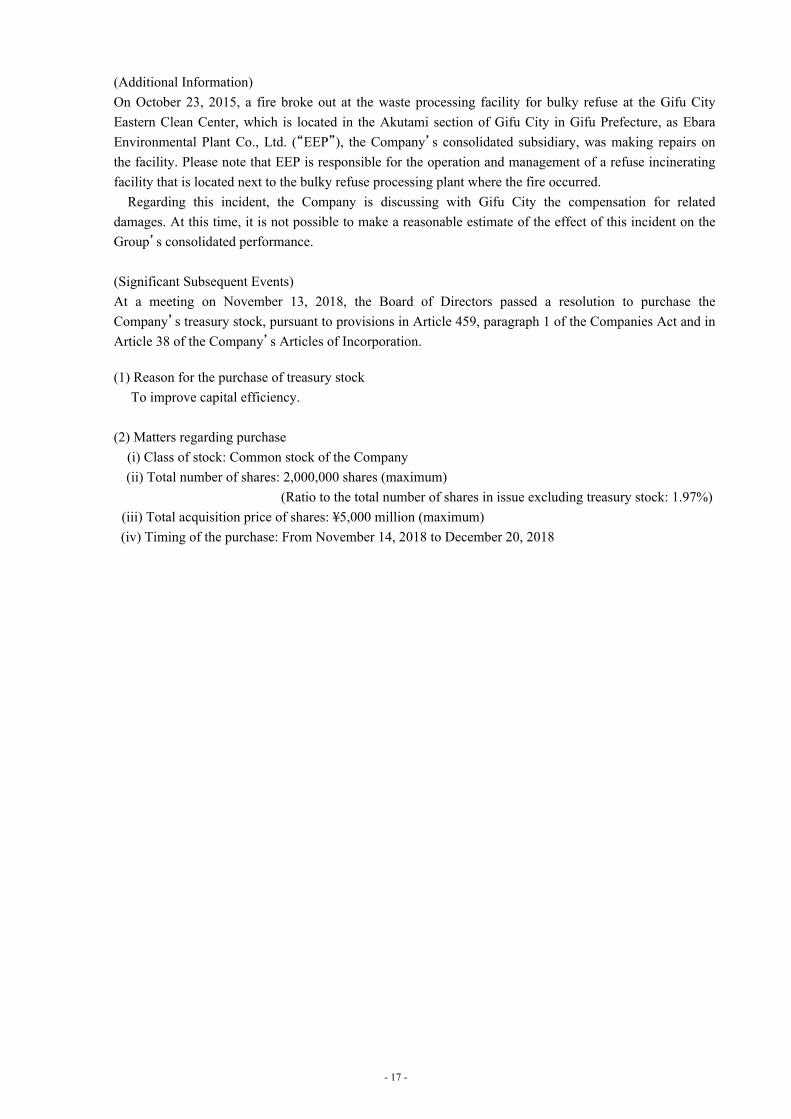
(Additional Information)
On October 23, 2015, a fire broke out at the waste processing facility for bulky refuse at the Gifu City
Eastern Clean Center, which is located in the Akutami section of Gifu City in Gifu Prefecture, as Ebara
Environmental Plant Co., Ltd. (“EEP”), the Company’s consolidated subsidiary, was making repairs on
the facility. Please note that EEP is responsible for the operation and management of a refuse incinerating
facility that is located next to the bulky refuse processing plant where the fire occurred.
Regarding this incident, the Company is discussing with Gifu City the compensation for related
damages. At this time, it is not possible to make a reasonable estimate of the effect of this incident on the
Group’s consolidated performance.
(Significant Subsequent Events)
At a meeting on November 13, 2018, the Board of Directors passed a resolution to purchase the
Company’s treasury stock, pursuant to provisions in Article 459, paragraph 1 of the Companies Act and in
Article 38 of the Company’s Articles of Incorporation.
(1) Reason for the purchase of treasury stock
To improve capital efficiency.
(2) Matters regarding purchase
(i) Class of stock: Common stock of the Company
(ii) Total number of shares: 2,000,000 shares (maximum)
(Ratio to the total number of shares in issue excluding treasury stock: 1.97%)
(iii) Total acquisition price of shares: ¥5,000 million (maximum)
(iv) Timing of the purchase: From November 14, 2018 to December 20, 2018
- 17 -
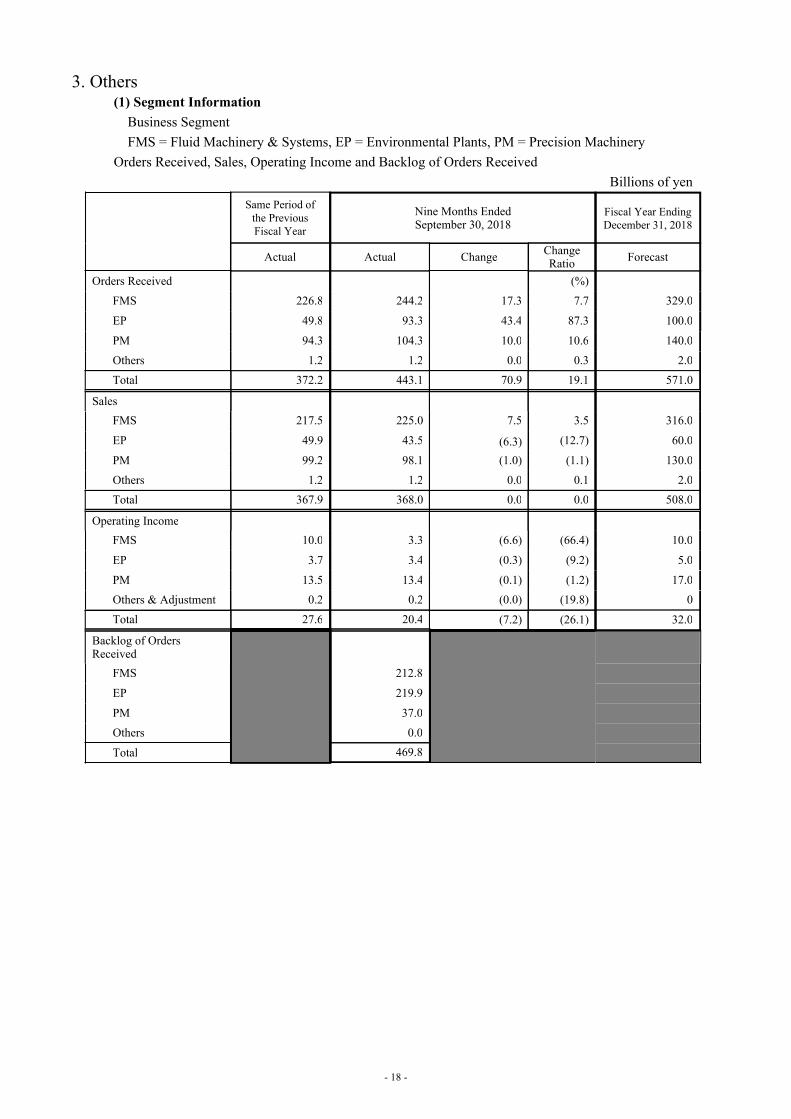
3. Others(1) Segment Information
Business Segment
FMS = Fluid Machinery & Systems, EP = Environmental Plants, PM = Precision Machinery
Orders Received, Sales, Operating Income and Backlog of Orders Received
Billions of yen
Same Period of the Previous Fiscal Year
Nine Months Ended September 30, 2018
Fiscal Year EndingDecember 31, 2018
Actual Actual Change Change Ratio Forecast
Orders Received (%)
FMS 226.8 244.2 17.3 7.7 329.0
EP 49.8 93.3 43.4 87.3 100.0
PM 94.3 104.3 10.0 10.6 140.0
Others 1.2 1.2 0.0 0.3 2.0
Total 372.2 443.1 70.9 19.1 571.0
Sales
FMS 217.5 225.0 7.5 3.5 316.0
EP 49.9 43.5 (6.3) (12.7) 60.0
PM 99.2 98.1 (1.0) (1.1) 130.0
Others 1.2 1.2 0.0 0.1 2.0
Total 367.9 368.0 0.0 0.0 508.0
Operating Income
FMS 10.0 3.3 (6.6) (66.4) 10.0
EP 3.7 3.4 (0.3) (9.2) 5.0
PM 13.5 13.4 (0.1) (1.2) 17.0
Others & Adjustment 0.2 0.2 (0.0) (19.8) 0
Total 27.6 20.4 (7.2) (26.1) 32.0
Backlog of Orders Received
FMS 212.8
EP 219.9
PM 37.0
Others 0.0
Total 469.8
- 18 -
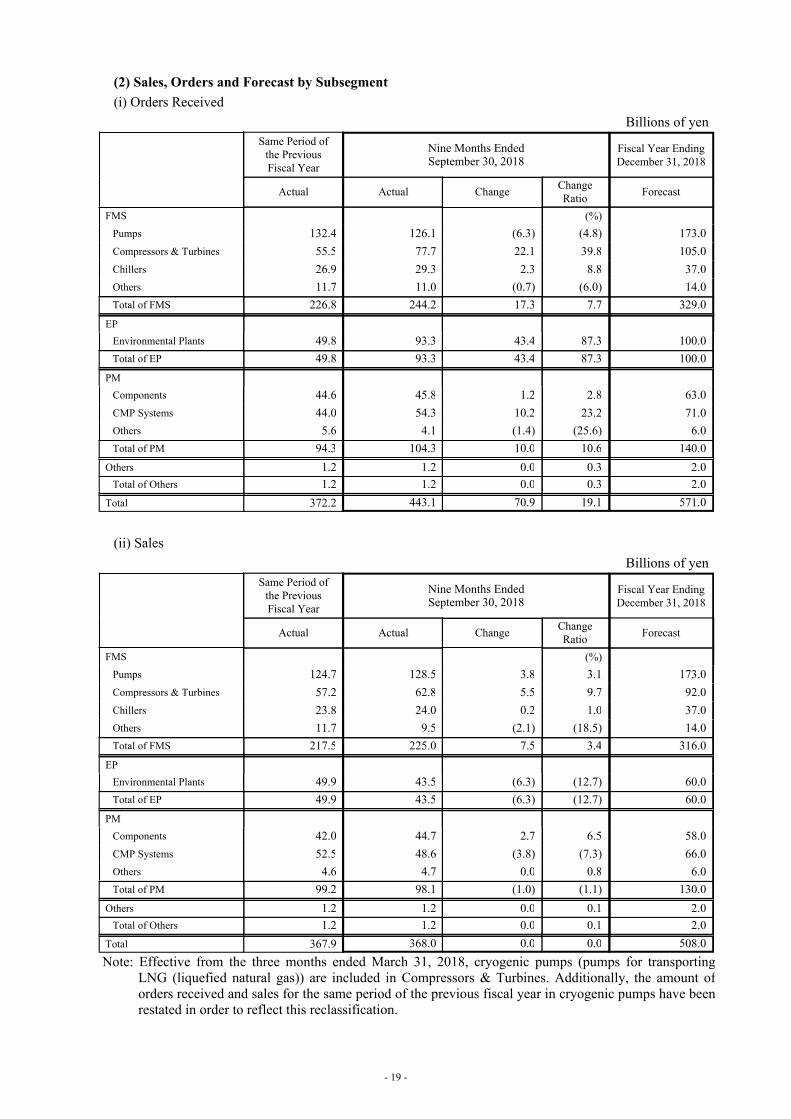
(2) Sales, Orders and Forecast by Subsegment
(i) Orders Received
Billions of yen
(ii) Sales
Billions of yen
Note: Effective from the three months ended March 31, 2018, cryogenic pumps (pumps for transportingLNG (liquefied natural gas)) are included in Compressors & Turbines. Additionally, the amount oforders received and sales for the same period of the previous fiscal year in cryogenic pumps have beenrestated in order to reflect this reclassification.
Same Period of the Previous Fiscal Year
Nine Months Ended September 30, 2018
Fiscal Year Ending December 31, 2018
Actual Actual ChangeChange Ratio
Forecast
FMS (%)
Pumps 132.4 126.1 (6.3) (4.8) 173.0
Compressors & Turbines 55.5 77.7 22.1 39.8 105.0
Chillers 26.9 29.3 2.3 8.8 37.0
Others 11.7 11.0 (0.7) (6.0) 14.0
Total of FMS 226.8 244.2 17.3 7.7 329.0
EP
Environmental Plants 49.8 93.3 43.4 87.3 100.0
Total of EP 49.8 93.3 43.4 87.3 100.0
PM
Components 44.6 45.8 1.2 2.8 63.0
CMP Systems 44.0 54.3 10.2 23.2 71.0
Others 5.6 4.1 (1.4) (25.6) 6.0
Total of PM 94.3 104.3 10.0 10.6 140.0
Others 1.2 1.2 0.0 0.3 2.0
Total of Others 1.2 1.2 0.0 0.3 2.0
Total 372.2 443.1 70.9 19.1 571.0
Same Period of the Previous Fiscal Year
Nine Months Ended September 30, 2018
Fiscal Year Ending December 31, 2018
Actual Actual ChangeChange Ratio
Forecast
FMS (%)
Pumps 124.7 128.5 3.8 3.1 173.0
Compressors & Turbines 57.2 62.8 5.5 9.7 92.0
Chillers 23.8 24.0 0.2 1.0 37.0
Others 11.7 9.5 (2.1) (18.5) 14.0
Total of FMS 217.5 225.0 7.5 3.4 316.0
EP
Environmental Plants 49.9 43.5 (6.3) (12.7) 60.0
Total of EP 49.9 43.5 (6.3) (12.7) 60.0
PM
Components 42.0 44.7 2.7 6.5 58.0
CMP Systems 52.5 48.6 (3.8) (7.3) 66.0
Others 4.6 4.7 0.0 0.8 6.0
Total of PM 99.2 98.1 (1.0) (1.1) 130.0
Others 1.2 1.2 0.0 0.1 2.0
Total of Others 1.2 1.2 0.0 0.1 2.0
Total 367.9 368.0 0.0 0.0 508.0
- 19 -
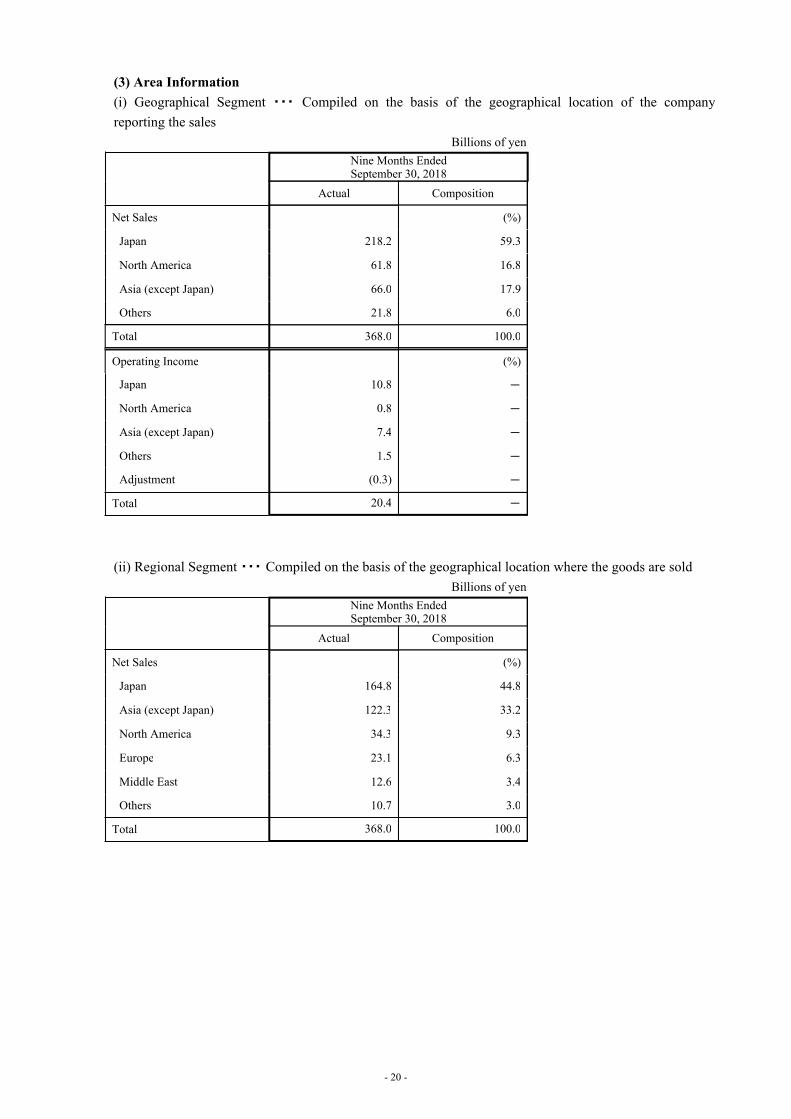
(3) Area Information
(i) Geographical Segment ・・・ Compiled on the basis of the geographical location of the company
reporting the sales
Billions of yen
(ii) Regional Segment ・・・ Compiled on the basis of the geographical location where the goods are sold
Billions of yen
Nine Months Ended September 30, 2018
Actual Composition
Net Sales (%)
Japan 218.2 59.3
North America 61.8 16.8
Asia (except Japan) 66.0 17.9
Others 21.8 6.0
Total 368.0 100.0
Operating Income (%)
Japan 10.8 -
North America 0.8 -
Asia (except Japan) 7.4 -
Others 1.5 -
Adjustment (0.3) -
Total 20.4 -
Nine Months Ended September 30, 2018
Actual Composition
Net Sales (%)
Japan 164.8 44.8
Asia (except Japan) 122.3 33.2
North America 34.3 9.3
Europe 23.1 6.3
Middle East 12.6 3.4
Others 10.7 3.0
Total 368.0 100.0
- 20 -