Embed Size (px)
Citation preview
Consolidated Financial Statements and Notes
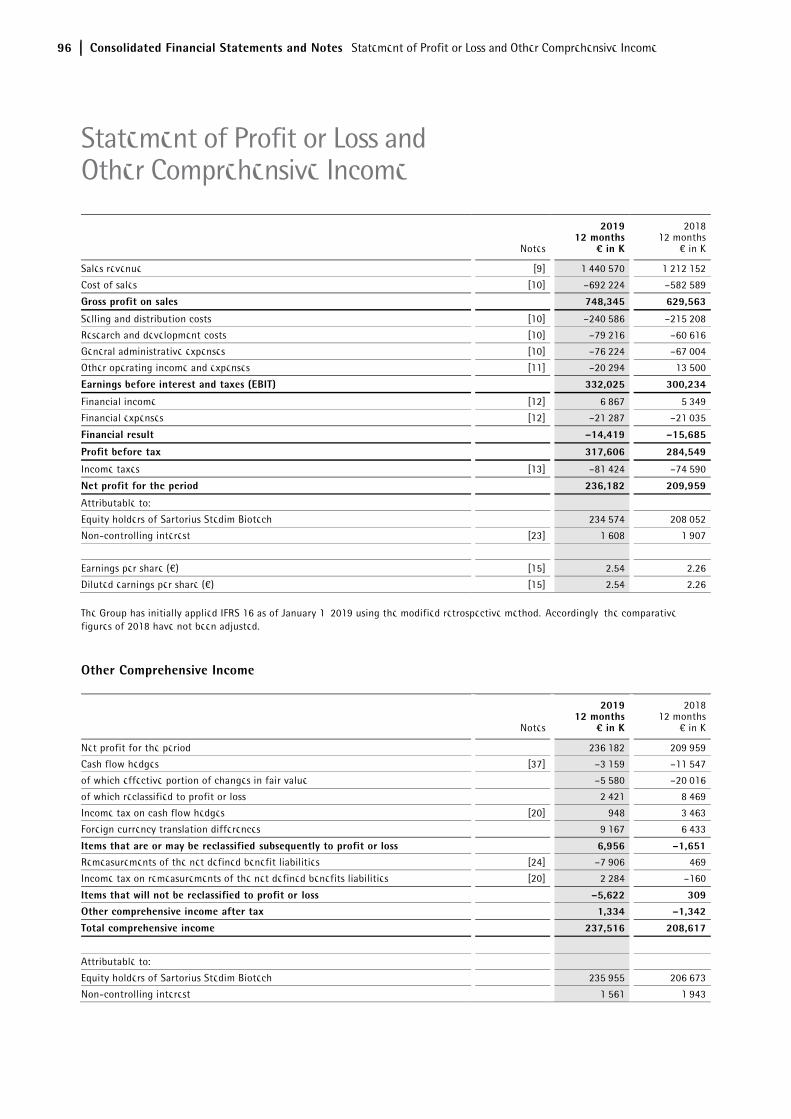
96 Consolidated Financial Statements and Notes Statement of Profit or Loss and Other Comprehensive Income
Notes
2019 12 months
¤ in K
2018 12 months
€ in K
Sales revenue [9] 1,440,570 1,212,152
Cost of sales [10] –692,224 –582,589
Gross profit on sales 748,345 629,563
Selling and distribution costs [10] –240,586 –215,208
Research and development costs [10] –79,216 –60,616
General administrative expenses [10] –76,224 –67,004
Other operating income and expenses [11] –20,294 13,500
Earnings before interest and taxes (EBIT) 332,025 300,234
Financial income [12] 6,867 5,349
Financial expenses [12] –21,287 –21,035
Financial result –14,419 –15,685
Profit before tax 317,606 284,549
Income taxes [13] –81,424 –74,590
Net profit for the period 236,182 209,959
Attributable to:
Equity holders of Sartorius Stedim Biotech 234,574 208,052
Non-controlling interest [23] 1,608 1,907
Earnings per share (€) [15] 2.54 2.26
Diluted earnings per share (€) [15] 2.54 2.26 The Group has initially applied IFRS 16 as of January 1, 2019 using the modified retrospective method. Accordingly, the comparative figures of 2018 have not been adjusted.
Other Comprehensive Income
Notes
2019 12 months
¤ in K
2018 12 months
€ in K
Net profit for the period 236,182 209,959
Cash flow hedges [37] –3,159 –11,547
of which effective portion of changes in fair value –5,580 –20,016
of which reclassified to profit or loss 2,421 8,469
Income tax on cash flow hedges [20] 948 3,463
Foreign currency translation differences 9,167 6,433
Items that are or may be reclassified subsequently to profit or loss 6,956 –1,651 Remeasurements of the net defined benefit liabilities [24] –7,906 469
Income tax on remeasurements of the net defined benefits liabilities [20] 2,284 –160
Items that will not be reclassified to profit or loss –5,622 309 Other comprehensive income after tax 1,334 –1,342
Total comprehensive income 237,516 208,617
Attributable to:
Equity holders of Sartorius Stedim Biotech 235,955 206,673
Non-controlling interest 1,561 1,943
Statement of Profit or Loss and Other Comprehensive Income
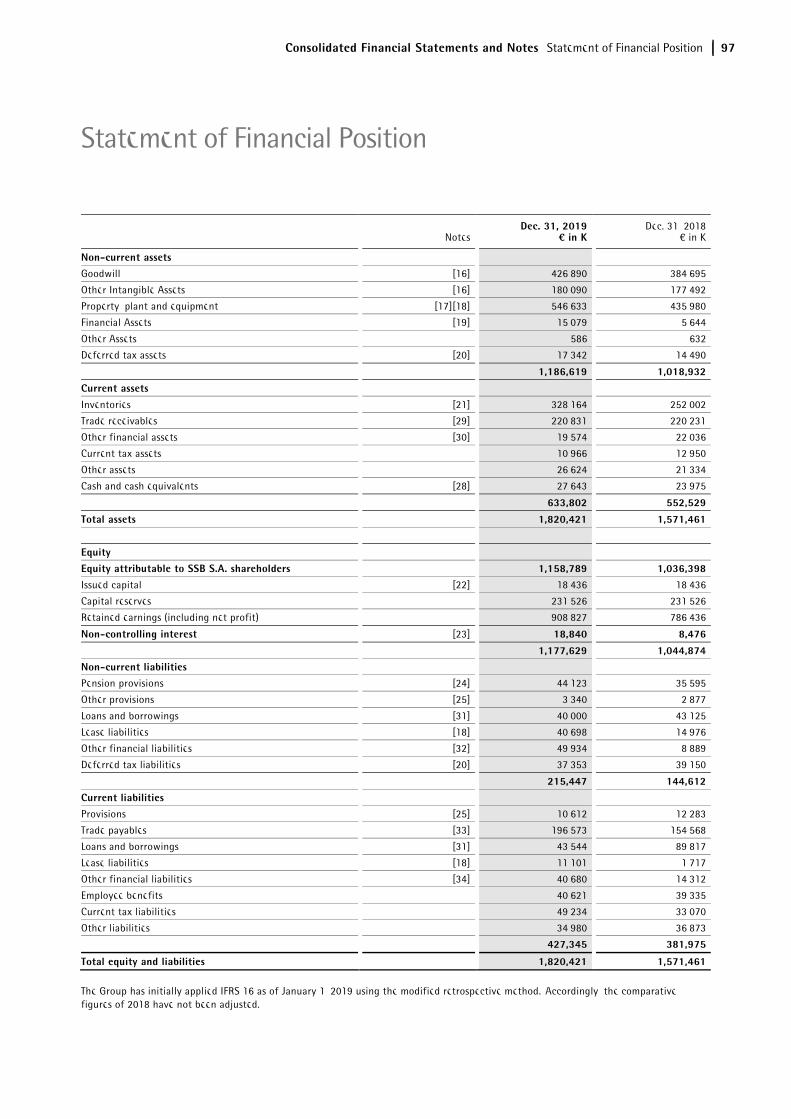
Consolidated Financial Statements and Notes Statement of Financial Position 97
Notes Dec. 31, 2019
¤ in K Dec. 31, 2018
€ in K
Non-current assets Goodwill [16] 426,890 384,695
Other Intangible Assets [16] 180,090 177,492
Property, plant and equipment [17][18] 546,633 435,980
Financial Assets [19] 15,079 5,644
Other Assets 586 632
Deferred tax assets [20] 17,342 14,490
1,186,619 1,018,932
Current assets Inventories [21] 328,164 252,002
Trade receivables [29] 220,831 220,231
Other financial assets [30] 19,574 22,036
Current tax assets 10,966 12,950
Other assets 26,624 21,334
Cash and cash equivalents [28] 27,643 23,975
633,802 552,529
Total assets 1,820,421 1,571,461
Equity Equity attributable to SSB S.A. shareholders 1,158,789 1,036,398 Issued capital [22] 18,436 18,436
Capital reserves 231,526 231,526
Retained earnings (including net profit) 908,827 786,436
Non-controlling interest [23] 18,840 8,476
1,177,629 1,044,874 Non-current liabilities Pension provisions [24] 44,123 35,595
Other provisions [25] 3,340 2,877
Loans and borrowings [31] 40,000 43,125
Lease liabilities [18] 40,698 14,976
Other financial liabilities [32] 49,934 8,889
Deferred tax liabilities [20] 37,353 39,150
215,447 144,612 Current liabilities Provisions [25] 10,612 12,283
Trade payables [33] 196,573 154,568
Loans and borrowings [31] 43,544 89,817
Lease liabilities [18] 11,101 1,717
Other financial liabilities [34] 40,680 14,312
Employee benefits 40,621 39,335
Current tax liabilities 49,234 33,070
Other liabilities 34,980 36,873
427,345 381,975
Total equity and liabilities 1,820,421 1,571,461 The Group has initially applied IFRS 16 as of January 1, 2019 using the modified retrospective method. Accordingly, the comparative figures of 2018 have not been adjusted.
Statement of Financial Position
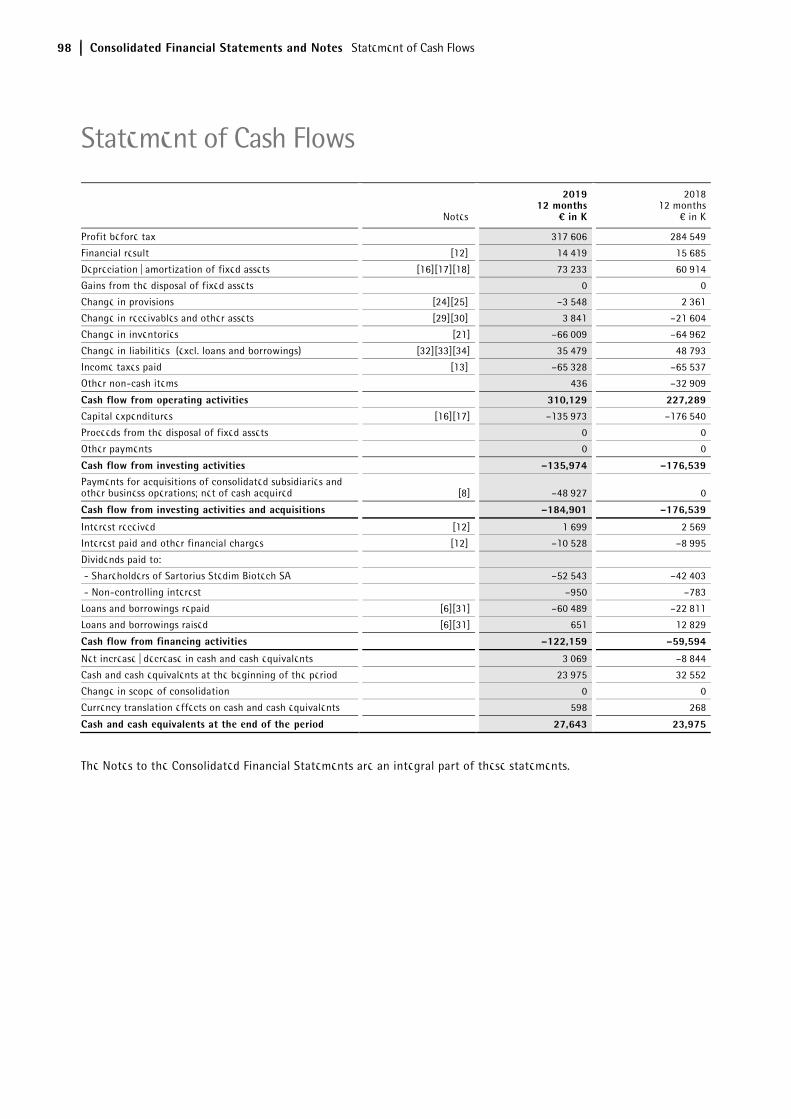
98 Consolidated Financial Statements and Notes Statement of Cash Flows
Notes
2019 12 months
¤ in K
2018 12 months
€ in K
Profit before tax 317,606 284,549
Financial result [12] 14,419 15,685
Depreciation | amortization of fixed assets [16][17][18] 73,233 60,914
Gains from the disposal of fixed assets 0 0
Change in provisions [24][25] –3,548 2,361
Change in receivables and other assets [29][30] 3,841 –21,604
Change in inventories [21] –66,009 –64,962
Change in liabilities (excl. loans and borrowings) [32][33][34] 35,479 48,793
Income taxes paid [13] –65,328 –65,537
Other non-cash items 436 –32,909
Cash flow from operating activities 310,129 227,289 Capital expenditures [16][17] –135,973 –176,540
Proceeds from the disposal of fixed assets 0 0
Other payments 0 0
Cash flow from investing activities –135,974 –176,539 Payments for acquisitions of consolidated subsidiaries and other business operations; net of cash acquired [8] –48,927 0
Cash flow from investing activities and acquisitions –184,901 –176,539
Interest received [12] 1,699 2,569
Interest paid and other financial charges [12] –10,528 –8,995
Dividends paid to:
- Shareholders of Sartorius Stedim Biotech SA –52,543 –42,403
- Non-controlling interest –950 –783
Loans and borrowings repaid [6][31] –60,489 –22,811
Loans and borrowings raised [6][31] 651 12,829
Cash flow from financing activities –122,159 –59,594
Net increase | decrease in cash and cash equivalents 3,069 –8,844
Cash and cash equivalents at the beginning of the period 23,975 32,552
Change in scope of consolidation 0 0
Currency translation effects on cash and cash equivalents 598 268
Cash and cash equivalents at the end of the period 27,643 23,975
The Notes to the Consolidated Financial Statements are an integral part of these statements.
Statement of Cash Flows
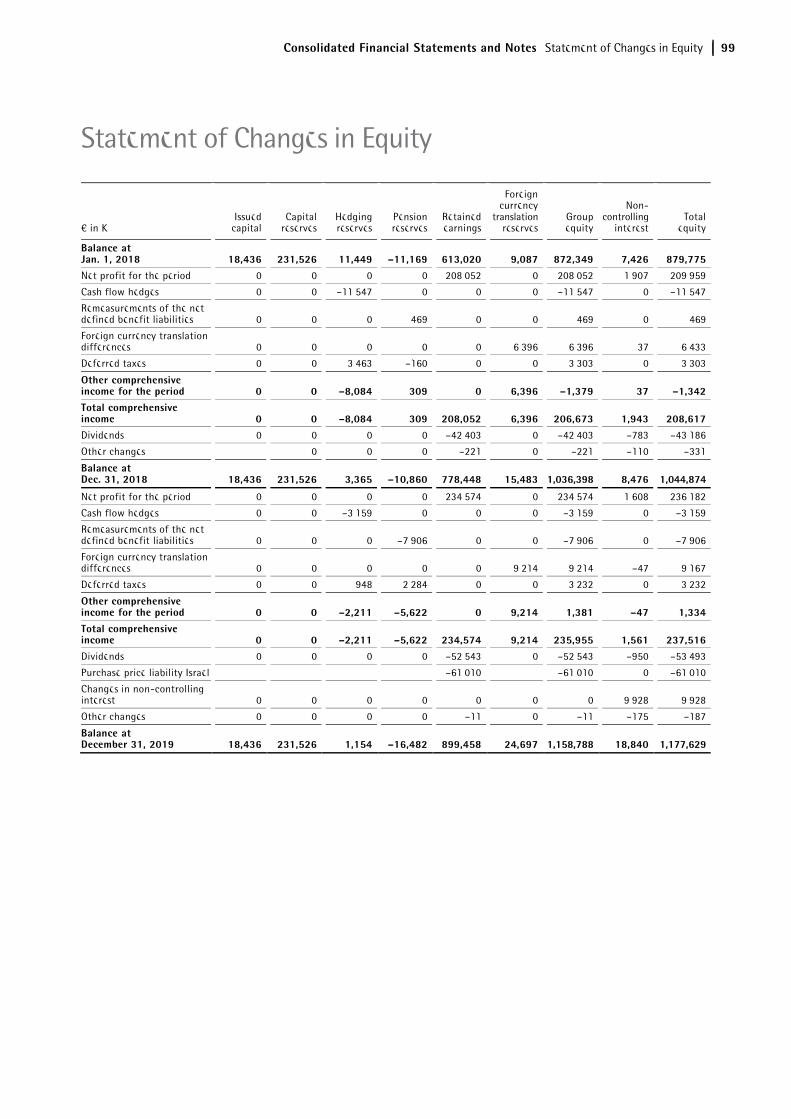
Consolidated Financial Statements and Notes Statement of Changes in Equity 99
€ in K Issued
capital Capital
reserves Hedging reserves
Pension reserves
Retained earnings
Foreign currency
translation reserves
Group equity
Non-controlling
interest Total
equity
Balance at Jan. 1, 2018 18,436 231,526 11,449 –11,169 613,020 9,087 872,349 7,426 879,775 Net profit for the period 0 0 0 0 208,052 0 208,052 1,907 209,959
Cash flow hedges 0 0 –11,547 0 0 0 –11,547 0 –11,547
Remeasurements of the net defined benefit liabilities 0 0 0 469 0 0 469 0 469
Foreign currency translation differences 0 0 0 0 0 6,396 6,396 37 6,433
Deferred taxes 0 0 3,463 –160 0 0 3,303 0 3,303
Other comprehensive income for the period 0 0 –8,084 309 0 6,396 –1,379 37 –1,342 Total comprehensive income 0 0 –8,084 309 208,052 6,396 206,673 1,943 208,617 Dividends 0 0 0 0 –42,403 0 –42,403 –783 –43,186
Other changes 0 0 0 –221 0 –221 –110 –331
Balance at Dec. 31, 2018 18,436 231,526 3,365 –10,860 778,448 15,483 1,036,398 8,476 1,044,874
Net profit for the period 0 0 0 0 234,574 0 234,574 1,608 236,182
Cash flow hedges 0 0 –3,159 0 0 0 –3,159 0 –3,159
Remeasurements of the net defined benefit liabilities 0 0 0 –7,906 0 0 –7,906 0 –7,906
Foreign currency translation differences 0 0 0 0 0 9,214 9,214 –47 9,167
Deferred taxes 0 0 948 2,284 0 0 3,232 0 3,232
Other comprehensive income for the period 0 0 –2,211 –5,622 0 9,214 1,381 –47 1,334 Total comprehensive income 0 0 –2,211 –5,622 234,574 9,214 235,955 1,561 237,516 Dividends 0 0 0 0 –52,543 0 –52,543 –950 –53,493
Purchase price liability Israel –61,010 –61,010 0 –61,010
Changes in non-controlling interest 0 0 0 0 0 0 0 9,928 9,928
Other changes 0 0 0 0 –11 0 –11 –175 –187
Balance at December 31, 2019 18,436 231,526 1,154 –16,482 899,458 24,697 1,158,788 18,840 1,177,629
Statement of Changes in Equity
100 Consolidated Financial Statements and Notes Notes to the Financial Statements
1. General Information
Sartorius Stedim Biotech is a leading international supplier of products and services that enable the biopharmaceutical industry to develop and manufacture drugs safely and efficiently. As a total solutions provider, Sartorius Stedim Biotech offers a portfolio covering nearly all steps of biopharmaceutical manufacture. The company focuses on single-use technologies and value-added services to meet the rapidly changing technology requirements of the industry it serves. With its own manufacturing and R&D sites in Europe, North America and Asia and an international network of sales companies, Sartorius Stedim Biotech has a global reach.
Headquartered in Aubagne, France, Sartorius Stedim Biotech S.A. is listed on the Euronext Paris (ISIN code: FR 0000053266).
Sartorius Stedim Biotech S.A.'s ultimate parent company is Sartorius AG, headquartered in Goettingen, Germany, and listed at several German stock exchanges (ISIN codes: 0007165607 ordinary shares, 0007165631 preference shares).
In compliance with the European Regulation 1606/2002 of July 19, 2002, requiring listed companies to use International Accounting Standards, the consolidated financial statements of the Sartorius Stedim Biotech Group for the year ended December 31, 2019, are compliant with the Standards and Interpretations IFRS and IFRIC of the IASB as adopted by the European Union, which are available at the following site:
https://ec.europa.eu/commission/index_fr.
The consolidated financial statements are prepared in euros. Unless otherwise specified, all amounts are disclosed in thousands of euros (abbreviated as € in K). In some cases, the sum of the figures given in this report may not precisely equal the stated totals and percentages may not be exact due to rounding.
These consolidated financial statements were approved by the Board of Directors on February 6, 2020 and will be submitted for approval by the Shareholders' Meeting on March 24, 2020.
2. Effects of New Financial Reporting Standards
The following major new accounting rules were applicable for the first time to the present consolidated financial statements of the Group:
– IFRS 16, Leases
This standard changes the accounting for leases. For detailed information on these changes and the initial application of IFRS 16, see note 18.
The following new accounting rules were applicable for the first time to the present financial statements and had no material impact on the presentation of the company’s financial position and financial per-formance:
– Annual Improvements to IFRSs – Cycle 2015–2017 (issued in Dec. 2017), Amendments to IFRS 3, IFRS 11, IAS 12 and IAS 23
The amendments to IFRS 3 and IFRS 11 clarify the remeasurement of previously held interests in a business when an entity obtains control or joint control of a business that is a joint operation. The amendment to IAS 12 clarifies the applicability of the requirements regarding income tax consequences of dividends. The amendment to IAS 23 clarifies the treatment of any specific borrowing that remains outstanding after the related asset is ready for its intended use or sale.
– Amendments to IAS 19, Plan Amendment, Curtailment or Settlement
The amendments are applicable to plan amendments, curtailments or settlements. It is now mandatory that the current service cost and the net interest for the period after the remeasurement are determined using the assumptions used for the remeasurement. The amendment further includes clarifications regarding the effect of a plan amendment, curtailment or settlement on the requirements regarding the asset ceiling.
– Amendments to IAS 28, Long-term Interests in Associates and Joint Ventures
The amendment clarifies that an entity applies IFRS 9 to long-term interests in an associate or joint venture that form part of the net investment in the associate
Notes to the Financial Statements
Consolidated Financial Statements and Notes Notes to the Financial Statements 101
or joint venture but to which the equity method is not applied.
– Amendments to IFRS 9, Prepayment Features with Negative Compensation
The amendment to IFRS 9 amends existing requirements regarding termination rights with negative compensation features. Furthermore, a clarification regarding the accounting for a modification or exchange of a financial liability measured at amortised cost that does not result in the derecognition of the financial liability is included in the Basis for Conclusions. It clarifies that an entity recognises any adjustment to the amortised cost of the financial liability
arising from a modification or exchange in profit or loss at the date of the modification or exchange.
– IFRIC 23, Uncertainty over Income Tax Treatments
IFRIC 23 clarifies how the recognition and measurement requirements of IAS 12 are applied where there is uncertainty over income tax treatments.
The following standards, interpretations and amend-ments were not yet applied to the consolidated financial statements of the reporting year as they had not yet been adopted by the EU or their application was not mandatory for 2019:
Standard | Interpretation Title
Applicable for financial years from1)
Endorsement by the
EU Commission
IFRS 14 Regulatory Deferral Accounts January 1, 2016 No
Amendments to IAS 1 and IAS 8 Definition of Material January 1, 2020 Yes
Various Standards / Framework
Amendments to References to the Conceptual Framework in IFRS Standards January 1, 2020 Yes
Amendments to IFRS 3 Definition of a Business January 1, 2020 No
Amendments to IFRS 9, IAS 39 and IFRS 7 Interest Rate Benchmark Reform January 1, 2020 Yes
IFRS 17 Insurance Contracts January 1, 2021 No
Amendments to IFRS 10 and IAS 28
Sale or Contribution of Assets between an Investor and its Associate or Joint Venture n/a No
1) These are required to be applied once they are endorsed by the EU Commission.
The dates mentioned above are those required by the standard themselves (IASB effective dates).
3. Significant Accounting Policies
Basis of Preparation
The consolidated financial statements of the Group are based on the principle of the historical cost of acquisition, construction or production, with the exception of the items reflected at fair value, such as derivative financial instruments.
Consolidation
The consolidated financial statements of the Sartorius Stedim Biotech Group include the annual financial statements of all companies, which are controlled directly or indirectly by Sartorius Stedim Biotech S.A. In terms of IFRS 10, Consolidated Financial Statements, the Group Sartorius Stedim Biotech controls an entity when it is exposed to, or has rights to, variable returns from its involvement with the entity and has the ability to affect those returns through its power over the entity.
Such entities are included in the consolidated financial statements from the time when Sartorius Stedim Biotech S.A. or its subsidiaries obtain such control until the date on which control ceases.
Subsidiaries have been included on the basis of their annual financial statements for the same reporting period as the parent company, using uniform Group recognition and measurement methods.
All intragroup assets and liabilities, equity, income, expenses and cash flows relating to transactions be-tween members of the Group are eliminated on consolidation.
102 Consolidated Financial Statements and Notes Notes to the Financial Statements
Business Combinations
Business combinations are accounted according to the acquisition method. The identifiable assets acquired and liabilities assumed are generally recorded at fair value on the date of acquisition.
For significant acquisitions, the purchase price allocation is carried out with assistance from independent third-party valuation specialists. The valuations are based on the information available at the acquisition date.
The Group determines goodwill at the acquisition date as:
– the fair value of the consideration transferred; and
– the amount recognized for any non-controlling interest in the acquiree; and
– if the business combination is carried out in stages, the fair value of any previously held equity interest in the acquiree; less
– the net recognized amount for the identifiable assets acquired and liabilities assumed.
When the difference is negative, the purchase gain is recognized immediately in income. Expenses directly related to business combinations are recorded in the profit or loss as they are incurred.
Foreign Currency Transactions
The presentation currency of the consolidated financial statements of the Sartorius Stedim Biotech Group is the euro (financial statements presented in thousands of euros). In the financial statements of each company, transactions denominated in foreign currencies have been translated into the functional currency of the subsidiary at the exchange rate applicable on the date of the transaction. Monetary assets and debts denominated in a foreign currency have been translated at the exchange rate on the balance sheet date. Rate gains and losses have been recognized in profit or loss for the period.
Translation of financial statements prepared in foreign currencies
Subsidiaries’ financial statements prepared in foreign currencies have been translated pursuant to IAS 21, The Effects of Changes in Foreign Exchange Rates, in accordance with the concept of a functional currency. Foreign subsidiaries have been regarded as independent subdivisions of the Sartorius Stedim Biotech Group. The assets (including goodwill) and
liabilities of the entities that have a functional currency different from the presentation currency are translated at the exchange rate prevailing at the balance sheet date. The incomes, expenses, and cash flows of these entities have been translated using the average rate for the year, to the extent that this rate represents an approximate value of exchange rates used as of the date of the transaction in the absence of significant fluctuations. Resulting translation differences are recognized in other comprehensive income.
For long-term loans for which settlement is neither planned nor likely in the foreseeable future, the Group applies the principle of "net investment in a foreign operation." Exchange differences resulting from these loans are recognized in other comprehensive income in accordance with IAS 21.32.
The exchange rates for major currencies against the euro were considered as follows:
Year-end exchange rates Average exchange rates
For 1 € 2019 2018 2019 2018
USD 1.12340 1.14500 1.11956 1.18129
GBP 0.85080 0.89453 0.87787 0.88465
JPY 121.94000 125.85000 122.01949 130.40242
CHF 1.08540 1.12690 1.11255 1.15517
INR 80.18700 79.72980 78.84689 80.69389
KRW 1296.28000 1277.93000 1305.50569 1299.12464
CNY 7.82050 7.87510 7.73613 7.80666
4. Use of Judgments and Estimates
During the preparation of consolidated financial statements, management uses estimates and assumptions based on their best knowledge of the current and future situation. However, actual results may differ from these estimates. These estimates and assumptions are revised on a regular basis, and the impact of changes in estimates is recognized prospectively.
In addition, Group management exercises its judgment in defining the accounting treatment of specific trans-actions when the existing Standards and Inter-pretations do not specifically treat the accounting problems concerned.
Assumptions and estimates primarily concern the following topics:
Consolidated Financial Statements and Notes Notes to the Financial Statements 103
Business Combinations
The accounting for business combinations requires that the assets acquired and liabilities assumed be recorded at their respective fair values on the date the Group obtains control. The application of the acquisition method requires estimates and assumptions to be made, especially concerning the fair values of the acquired intangible assets, property, plant and equipment and the liabilities assumed at the acquisition date, and the useful lives of the acquired intangible assets, property, plant and equipment.
These measurements are based to a large extent on anticipated cash flows. If actual cash flows vary from those used in calculating fair values, this may materially affect the Group’s future results of operations.
Impairment of Assets
The book values (carrying amounts) of property, plant and equipment and intangible assets are subject to impairment testing if there is an indication of impairment and at least once a year for assets with an indefinite useful life or not yet available for use in accordance with IAS 36, Impairment of Assets. When an asset is tested, the recoverable amount of the asset is estimated. The recoverable amount of an asset or a cash-generating unit (CGU) is the higher of its fair value – less costs to sell the asset or its CGU – and its value in use. In the event the individual asset’s recoverable amount cannot be estimated, the recoverable amount of the asset’s CGU is estimated.
If the estimated recoverable amount of an asset (or a CGU) goes below its book value (carrying amount), this carrying amount is reduced to the recoverable amount (impairment allocated in priority to goodwill).
If the causes of the asset impairment are removed, the book value of the asset (or the CGU) is credited to the newly estimated recoverable amount. However, the book value increase is limited to the value that the asset (or CGU) would have had if no asset impairment loss had been recognized in previous financial years.
The calculation of the value in use is generally based on discounted cash flow methods using cash flow projections up to five years. These projections take into account past experience and represent management's best estimate about future sales revenue and cost developments. Cash flows after the planning period are extrapolated using individual growth rates. Key assumptions on which management
has based its determination of the value in use include estimated growth rates, weighted average cost of capital and tax rates. These estimates can have a material impact on the respective values and ultimately the amount of any impairment.
Intangible Assets
The capitalization of self-constructed intangible assets also includes a significant level of judgment, e.g. the evaluation of feasibility of a development project, the expected market prospects and the determination of useful lives.
Employee Benefits - Pension Provisions
Obligations for pension and other post-employment benefits are determined in accordance with actuarial valuations. These valuations rely on key assumptions including discount rates, expected salary increases and mortality rates. The discount rate assumptions are determined by reference to yields on high-quality corporate bonds of appropriate duration and currency at the end of the reporting period.
Due to changing market and economic conditions the underlying key assumptions may differ from actual developments and may lead to significant changes in pension and other post-employment benefit obligations.
Such differences are recognized in other compre-hensive income in the period in which they occur. For a sensitivity analysis, see note 24, Pension and Employee Benefits Provisions.
Provisions, Contingent Liabilities and Contingent Assets
Provisions are recognized for legal or constructive obligations that exist as of the balance sheet date. To determine the amount of the obligations, certain estimates and assumptions have to be applied, including the determination of the probability and the amount of future outflows of resources. Typically, significant estimates are involved in the determination of provisions related to onerous contracts, warranty costs, asset retirement obligations and legal proceedings.
104 Consolidated Financial Statements and Notes Notes to the Financial Statements
Income Taxes
The Group operates in various tax jurisdictions and therefore has to determine tax positions under respective local tax laws and tax authorities’ views which can be complex and subject to different interpretations of taxpayers and local tax authorities. Deferred tax assets have to be recognized for all deductible temporary differences and unused tax losses to the extent that it is probable that future taxable profit will be available against which the deductible temporary differences and unused tax losses can be utilized. As future developments are uncertain and partly beyond management’s control, assumptions are necessary to estimate future taxable profits as well as the period in which deferred tax assets will be recovered.
Estimates are revised in the period in which there is sufficient evidence to revise the assumption. If management considers it probable that all or a portion of a deferred tax asset cannot be realized, the corresponding amount is not recorded as an asset.
Fair Value Measurement
A number of the Group’s accounting policies and disclosures may require the measurement of fair values, for both financial and non-financial assets and liabilities, including Level 3 fair values (unobservable inputs).
If third party information, such as broker quotes or pricing services, is used to measure fair values, then management assesses the evidence obtained from the third parties to support the conclusion that these valuations meet the requirements of IFRS, including the level in the fair value hierarchy in which the valuations should be classified.
When measuring the fair value of an asset or a liability, the Group uses observable market data as far as possible. If the inputs used to measure the fair value of an asset or a liability fall into different levels of the fair value hierarchy, then the fair value measurement is categorized in its entirety in the same level of the fair value hierarchy as the lowest level input that is significant to the entire measurement.
5. Operating Segments
According to IFRS 8, Operating Segments the identification of reportable operating segments is based on the "management approach"; i.e. the segments are defined analogously to the internal financial reporting of an entity. Therefore, an area of activity is to be considered an operating segment if its business activities may result in revenues and expenses, its operating results are regularly reviewed by the entity's chief operating decision maker (= the Executive Members of the Board of Directors) and discrete financial information is available in its internal reporting. Internal control and reporting within Sartorius Stedim Biotech is based on the approach of operating as a "total solution provider" for its customers. Accordingly, there is only one single segment to be identified for Sartorius Stedim Biotech, driven by the product and customer perspective: Biopharm.
The key performance indicator of the operating segment of the Sartorius Stedim Biotech Group is the so-called “underlying EBITDA”, as the board monitors this performance measure at a consolidated level and they believe this measure is relevant to an understanding of the Group’s financial performance.
EBITDA corresponds to earnings before interest, taxes, depreciation and amortization; “underlying EBITDA” means EBITDA adjusted for extraordinary items. In this connection, extraordinary items are expenses and income that are of an exceptional or a one-time nature and accordingly distort the sustainable profitability of a segment and have a material impact on the net worth, financial position and earnings of the Group. Examples of such items are restructuring expenses, large Group projects as well as proceeds or losses from the disposal, sale or other transfer of financial assets or of property, plant and equipment, provided that these are not of a recurrent nature.
Underlying EBITDA is not a defined performance measure in IFRS. The Group’s definition of underlying EBITDA may not be comparable with similarly titled performance measures and disclosures by other entities.
Segment assets and segment liabilities are not analyzed on a regular basis to the chief operating decision maker and are therefore not part of the segment report.
Consolidated Financial Statements and Notes Notes to the Financial Statements 105
Biopharm Group
€ in K 2019 2018 Change 2019 2018 Change
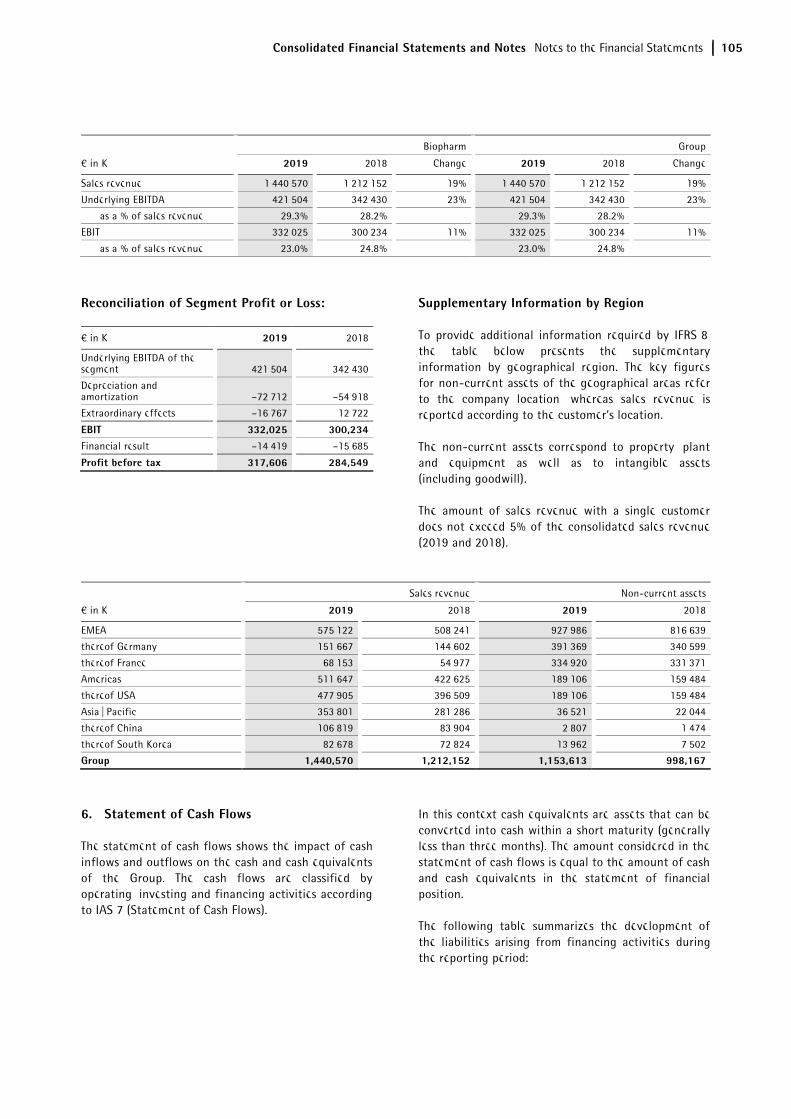
Sales revenue 1,440,570 1,212,152 19% 1,440,570 1,212,152 19%
Underlying EBITDA 421,504 342,430 23% 421,504 342,430 23%
as a % of sales revenue 29.3% 28.2% 29.3% 28.2%
EBIT 332,025 300,234 11% 332,025 300,234 11%
as a % of sales revenue 23.0% 24.8% 23.0% 24.8%
Reconciliation of Segment Profit or Loss:
€ in K 2019 2018
Underlying EBITDA of the segment 421,504 342,430
Depreciation and amortization –72,712 –54,918
Extraordinary effects –16,767 12,722
EBIT 332,025 300,234 Financial result –14,419 –15,685
Profit before tax 317,606 284,549
Supplementary Information by Region
To provide additional information required by IFRS 8, the table below presents the supplementary information by geographical region. The key figures for non-current assets of the geographical areas refer to the company location, whereas sales revenue is reported according to the customer’s location.
The non-current assets correspond to property, plant and equipment as well as to intangible assets (including goodwill).
The amount of sales revenue with a single customer does not exceed 5% of the consolidated sales revenue (2019 and 2018).
Sales revenue Non-current assets
€ in K 2019 2018 2019 2018
EMEA 575,122 508,241 927,986 816,639
thereof Germany 151,667 144,602 391,369 340,599
thereof France 68,153 54,977 334,920 331,371
Americas 511,647 422,625 189,106 159,484
thereof USA 477,905 396,509 189,106 159,484
Asia | Pacific 353,801 281,286 36,521 22,044
thereof China 106,819 83,904 2,807 1,474
thereof South Korea 82,678 72,824 13,962 7,502
Group 1,440,570 1,212,152 1,153,613 998,167
6. Statement of Cash Flows
The statement of cash flows shows the impact of cash inflows and outflows on the cash and cash equivalents of the Group. The cash flows are classified by operating, investing and financing activities according to IAS 7 (Statement of Cash Flows).
In this context cash equivalents are assets that can be converted into cash within a short maturity (generally less than three months). The amount considered in the statement of cash flows is equal to the amount of cash and cash equivalents in the statement of financial position.
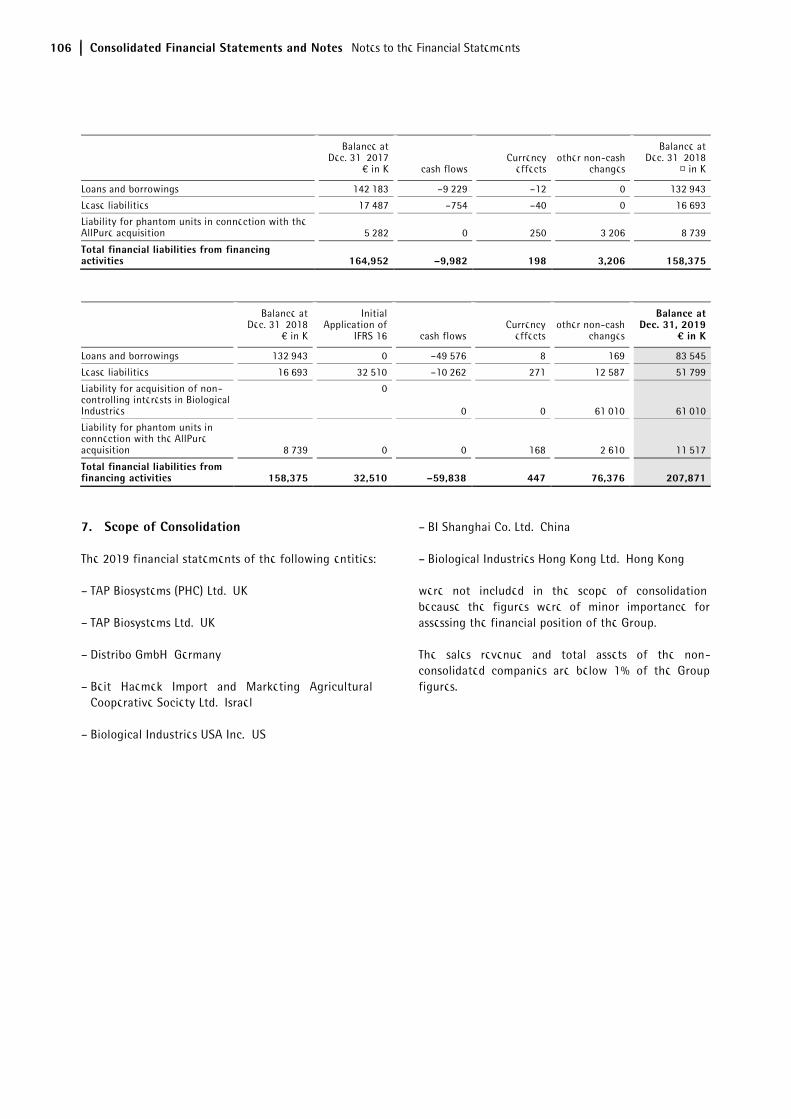
The following table summarizes the development of the liabilities arising from financing activities during the reporting period:
106 Consolidated Financial Statements and Notes Notes to the Financial Statements
Balance at Dec. 31, 2017
€ in K cash flows Currency
effects other non-cash
changes
Balance at Dec. 31, 2018
¤ in K
Loans and borrowings 142,183 –9,229 –12 0 132,943
Lease liabilities 17,487 –754 –40 0 16,693
Liability for phantom units in connection with the AllPure acquisition 5,282 0 250 3,206 8,739
Total financial liabilities from financing activities 164,952 –9,982 198 3,206 158,375
Balance at Dec. 31, 2018
€ in K
Initial Application of
IFRS 16 cash flows Currency
effects other non-cash
changes
Balance at Dec. 31, 2019
¤ in K
Loans and borrowings 132,943 0 –49,576 8 169 83,545
Lease liabilities 16,693 32,510 –10,262 271 12,587 51,799
Liability for acquisition of non-controlling interests in Biological Industries
0
0 0 61,010 61,010
Liability for phantom units in connection with the AllPure acquisition 8,739 0 0 168 2,610 11,517
Total financial liabilities from financing activities 158,375 32,510 –59,838 447 76,376 207,871
7. Scope of Consolidation
The 2019 financial statements of the following entities:
– TAP Biosystems (PHC) Ltd., UK
– TAP Biosystems Ltd., UK
– Distribo GmbH, Germany
– Beit Haemek Import and Marketing Agricultural Cooperative Society Ltd., Israel
– Biological Industries USA Inc., US
– BI Shanghai Co. Ltd., China
– Biological Industries Hong Kong Ltd., Hong Kong
were not included in the scope of consolidation, because the figures were of minor importance for assessing the financial position of the Group.
The sales revenue and total assets of the non-consolidated companies are below 1% of the Group figures.
Consolidated Financial Statements and Notes Notes to the Financial Statements 107
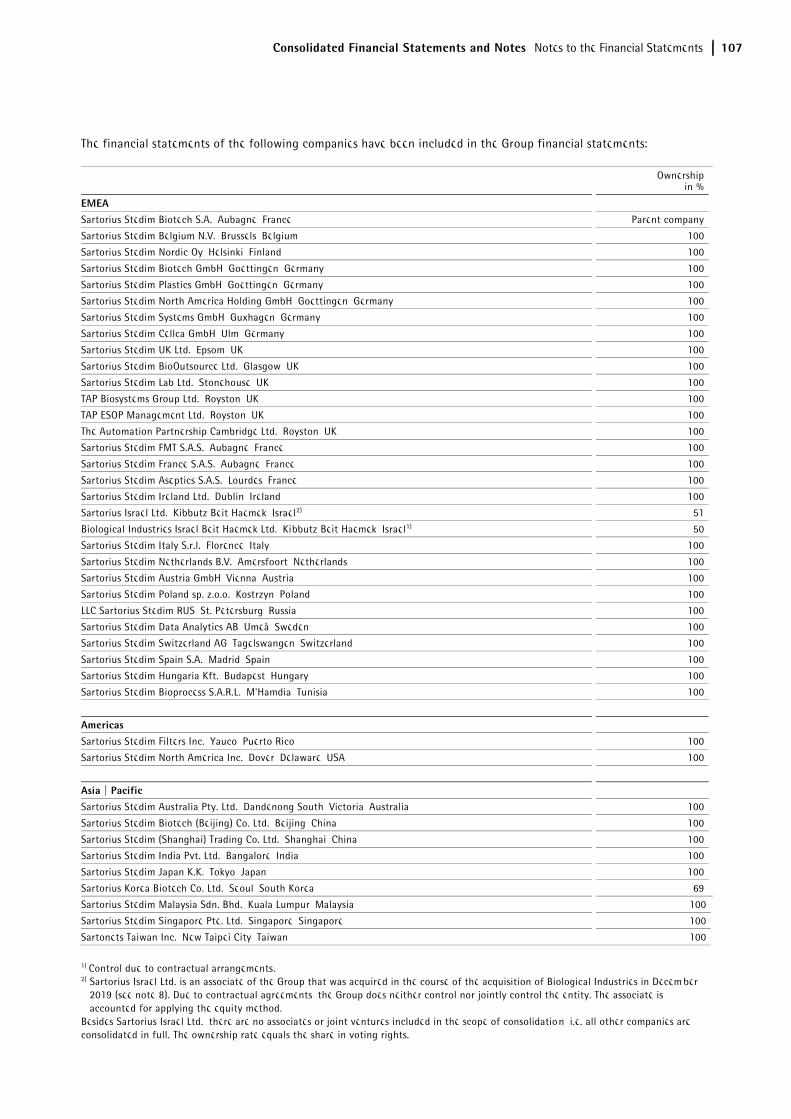
The financial statements of the following companies have been included in the Group financial statements:
Ownership
in %
EMEA Sartorius Stedim Biotech S.A., Aubagne, France Parent company
Sartorius Stedim Belgium N.V., Brussels, Belgium 100
Sartorius Stedim Nordic Oy, Helsinki, Finland 100
Sartorius Stedim Biotech GmbH, Goettingen, Germany 100
Sartorius Stedim Plastics GmbH, Goettingen, Germany 100
Sartorius Stedim North America Holding GmbH, Goettingen, Germany 100
Sartorius Stedim Systems GmbH, Guxhagen, Germany 100
Sartorius Stedim Cellca GmbH, Ulm, Germany 100
Sartorius Stedim UK Ltd., Epsom, UK 100
Sartorius Stedim BioOutsource Ltd., Glasgow, UK 100
Sartorius Stedim Lab Ltd., Stonehouse, UK 100
TAP Biosystems Group Ltd., Royston, UK 100
TAP ESOP Management Ltd., Royston, UK 100
The Automation Partnership Cambridge Ltd., Royston, UK 100
Sartorius Stedim FMT S.A.S., Aubagne, France 100
Sartorius Stedim France S.A.S., Aubagne, France 100
Sartorius Stedim Aseptics S.A.S., Lourdes, France 100
Sartorius Stedim Ireland Ltd., Dublin, Ireland 100
Sartorius Israel Ltd., Kibbutz Beit Haemek, Israel2) 51
Biological Industries Israel Beit Haemek Ltd., Kibbutz Beit Haemek, Israel1) 50
Sartorius Stedim Italy S.r.l., Florence, Italy 100
Sartorius Stedim Netherlands B.V., Amersfoort, Netherlands 100
Sartorius Stedim Austria GmbH, Vienna, Austria 100
Sartorius Stedim Poland sp. z.o.o., Kostrzyn, Poland 100
LLC Sartorius Stedim RUS, St. Petersburg, Russia 100
Sartorius Stedim Data Analytics AB, Umeå, Sweden 100
Sartorius Stedim Switzerland AG, Tagelswangen, Switzerland 100
Sartorius Stedim Spain S.A., Madrid, Spain 100
Sartorius Stedim Hungaria Kft., Budapest, Hungary 100
Sartorius Stedim Bioprocess S.A.R.L., M'Hamdia, Tunisia 100
Americas Sartorius Stedim Filters Inc., Yauco, Puerto Rico 100
Sartorius Stedim North America Inc., Dover, Delaware, USA 100
Asia | Pacific Sartorius Stedim Australia Pty. Ltd., Dandenong South, Victoria, Australia 100
Sartorius Stedim Biotech (Beijing) Co. Ltd., Beijing, China 100
Sartorius Stedim (Shanghai) Trading Co. Ltd., Shanghai, China 100
Sartorius Stedim India Pvt. Ltd., Bangalore, India 100
Sartorius Stedim Japan K.K., Tokyo, Japan 100
Sartorius Korea Biotech Co. Ltd., Seoul, South Korea 69
Sartorius Stedim Malaysia Sdn. Bhd., Kuala Lumpur, Malaysia 100
Sartorius Stedim Singapore Pte. Ltd., Singapore, Singapore 100
Sartonets Taiwan Inc., New Taipei City, Taiwan 100
1) Control due to contractual arrangements. 2) Sartorius Israel Ltd. is an associate of the Group that was acquired in the course of the acquisition of Biological Industries in Decem ber
2019 (see note 8). Due to contractual agreements, the Group does neither control nor jointly control the entity. The associate is accounted for applying the equity method.
Besides Sartorius Israel Ltd., there are no associates or joint ventures included in the scope of consolidation, i.e. all other companies are consolidated in full. The ownership rate equals the share in voting rights.
108 Consolidated Financial Statements and Notes Notes to the Financial Statements
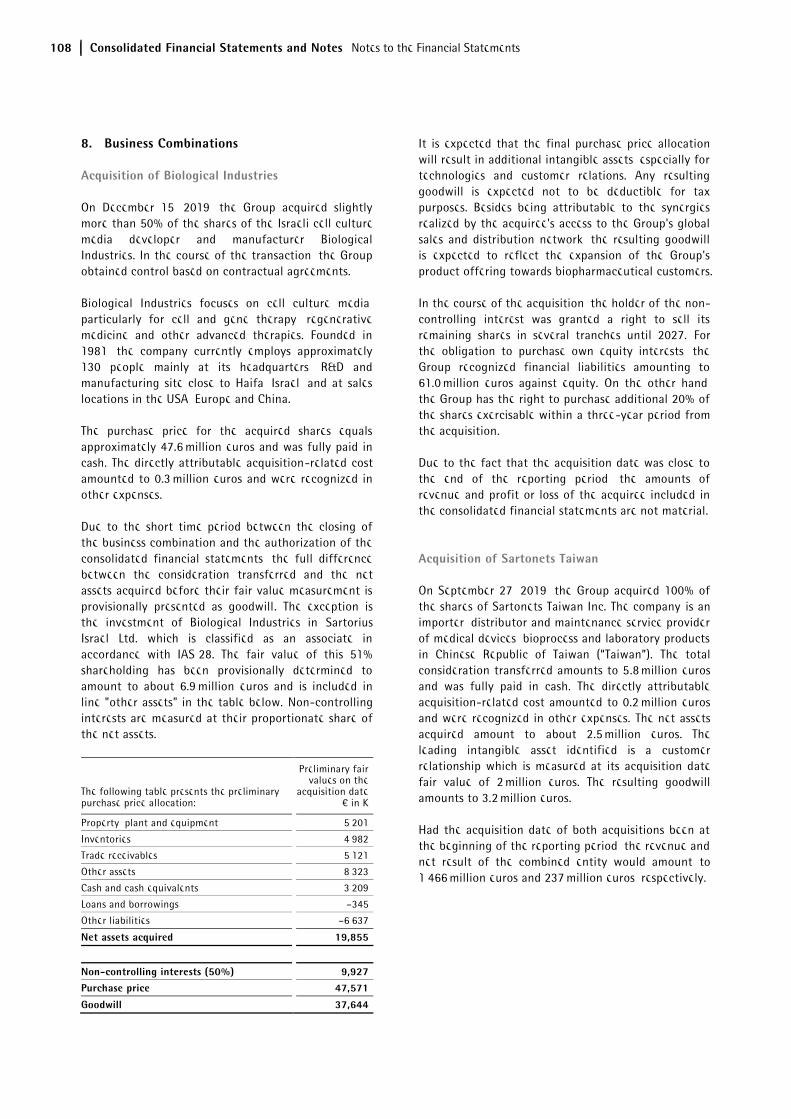
8. Business Combinations
Acquisition of Biological Industries
On December 15, 2019, the Group acquired slightly more than 50% of the shares of the Israeli cell culture media developer and manufacturer Biological Industries. In the course of the transaction, the Group obtained control based on contractual agreements.
Biological Industries focuses on cell culture media, particularly for cell and gene therapy, regenerative medicine and other advanced therapies. Founded in 1981, the company currently employs approximately 130 people mainly at its headquarters, R&D and manufacturing site close to Haifa, Israel, and at sales locations in the USA, Europe and China.
The purchase price for the acquired shares equals approximately 47.6 million euros and was fully paid in cash. The directly attributable acquisition-related cost amounted to 0.3 million euros and were recognized in other expenses.
Due to the short time period between the closing of the business combination and the authorization of the consolidated financial statements, the full difference between the consideration transferred and the net assets acquired before their fair value measurement is provisionally presented as goodwill. The exception is the investment of Biological Industries in Sartorius Israel Ltd. which is classified as an associate in accordance with IAS 28. The fair value of this 51% shareholding has been provisionally determined to amount to about 6.9 million euros and is included in line "other assets" in the table below. Non-controlling interests are measured at their proportionate share of the net assets.
The following table presents the preliminary purchase price allocation:
Preliminary fair values on the
acquisition date € in K
Property, plant and equipment 5,201
Inventories 4,982
Trade receivables 5,121
Other assets 8,323
Cash and cash equivalents 3,209
Loans and borrowings –345
Other liabilities –6,637
Net assets acquired 19,855
Non-controlling interests (50%) 9,927 Purchase price 47,571
Goodwill 37,644
It is expected that the final purchase price allocation will result in additional intangible assets, especially for technologies and customer relations. Any resulting goodwill is expected not to be deductible for tax purposes. Besides being attributable to the synergies realized by the acquiree's access to the Group's global sales and distribution network, the resulting goodwill is expected to reflect the expansion of the Group's product offering towards biopharmaceutical customers.
In the course of the acquisition, the holder of the non-controlling interest was granted a right to sell its remaining shares in several tranches until 2027. For the obligation to purchase own equity interests, the Group recognized financial liabilities amounting to 61.0 million euros against equity. On the other hand, the Group has the right to purchase additional 20% of the shares exercisable within a three-year period from the acquisition.
Due to the fact that the acquisition date was close to the end of the reporting period, the amounts of revenue and profit or loss of the acquiree included in the consolidated financial statements are not material.
Acquisition of Sartonets Taiwan
On September 27, 2019, the Group acquired 100% of the shares of Sartonets Taiwan Inc. The company is an importer, distributor and maintenance service provider of medical devices, bioprocess and laboratory products in Chinese Republic of Taiwan (“Taiwan”). The total consideration transferred amounts to 5.8 million euros and was fully paid in cash. The directly attributable acquisition-related cost amounted to 0.2 million euros and were recognized in other expenses. The net assets acquired amount to about 2.5 million euros. The leading intangible asset identified is a customer relationship which is measured at its acquisition date fair value of 2 million euros. The resulting goodwill amounts to 3.2 million euros.
Had the acquisition date of both acquisitions been at the beginning of the reporting period, the revenue and net result of the combined entity would amount to 1,466 million euros and 237 million euros, respectively.
Consolidated Financial Statements and Notes Notes to the Statement of Profit or Loss 109
9. Sales Revenue
Revenue recognition follows IFRS 15, Revenue from Contracts with Customers. The standard defines a comprehensive model to determine when to recognize revenue and in which amount. The revenues from contracts with customers according to IFRS 15 are disaggregated into geographical regions (see Segment Report, note 5).
The Group produces and sells instruments and consumables for customers in the Biopharm segment. The Group satisfies its performance obligations depending on the goods to be transferred and the promised services. The far majority of the revenues from sales of products is recognized at a point in time when the customer obtains control over the goods. This is typically the case when the significant risks and rewards of ownership of the goods are transferred to the customer. Therefore, the point in time may vary depending on the agreement with the individual customer.
For complex products that require installation at the customer’s site, revenue is recognized upon formal customer acceptance. To a low extent, revenue is recognized over time in the customer-specific project business. In these cases, revenue is recognized according to the project progress which is measured based on the percentage of costs to date compared to the total estimated contract costs. The amount of actual costs incurred to date reflects the progress and the transfer of control to the customer appropriately as the Group has a right to a reimbursement of cost to date plus an appropriate margin, if the project is cancelled by the customer without cause.
Revenue from services is generally recognized when the services are performed or have been performed. When the services are performed continuously over a period of time, the Group recognizes the related revenue over time. In this case, revenue is generally recognized pro rata temporis in relation to the total contract period. Product sales are typically accompanied by the legally required warranty. Any material extended warranties are accounted for as separate performance obligations.
According to the general payment terms, customer payments are due in the short-term, typically within 30 days. To some extent, the Group obtains advance payments, e.g. to avoid credit risks. Therefore, the Group regularly has contract liabilities (payments received on account of orders). In addition, the Group recognizes contract liabilities in connection with service contracts (deferred revenues) when customers pay in advance.
There are no material effects from contracts with significant financing components. The Group uses the practical expedient regarding the existence of a significant financing component. This means that a financing component is only taken into consideration when the length of time between the transfer of goods or services and the receipt of consideration is expected to exceed one year and the effect is material. As of December 31, 2019, the Group has refund liabilities in the amount of 4,740 k euros as a result from incentive agreements with customers (2018: €5,755 k).
The aggregate amount of the transaction price allocated to the performance obligations that are unsatisfied (or partially unsatisfied) at the end of the reporting period (orders on hand) amounts to 606.9 million euros (2018: €489.0 million). The Group expects that these unsatisfied performance obligations will be satisfied to a large extent in 2020.
There were no extraordinary changes in the carrying amounts of the contract liabilities and contract assets in the reporting period. Revenue in the amount of 51,244 k euros was recognized in the reporting period that was included in the contract liability balance at the beginning of the reporting period (2018: €41,182 k).
The balances of trade receivables and contract assets are presented in note 29. For details on the impairments on trade receivables and contract assets recognized in the reporting period see note 40. The following table presents the balances of the Group’s contract liabilities.
Notes to the Statement of Profit or Loss
110 Consolidated Financial Statements and Notes Notes to the Statement of Profit or Loss
Line item in statement of
financial position
Carrying amount as of December 31,
2019
Carrying amount as of December 31,
2018
€ in k € in k
Deferred revenue Other liabilities 14,138 16,235
Payments received on account of orders Trade payables 80,574 51,000
Contract liabilities (total) 94,712 67,234
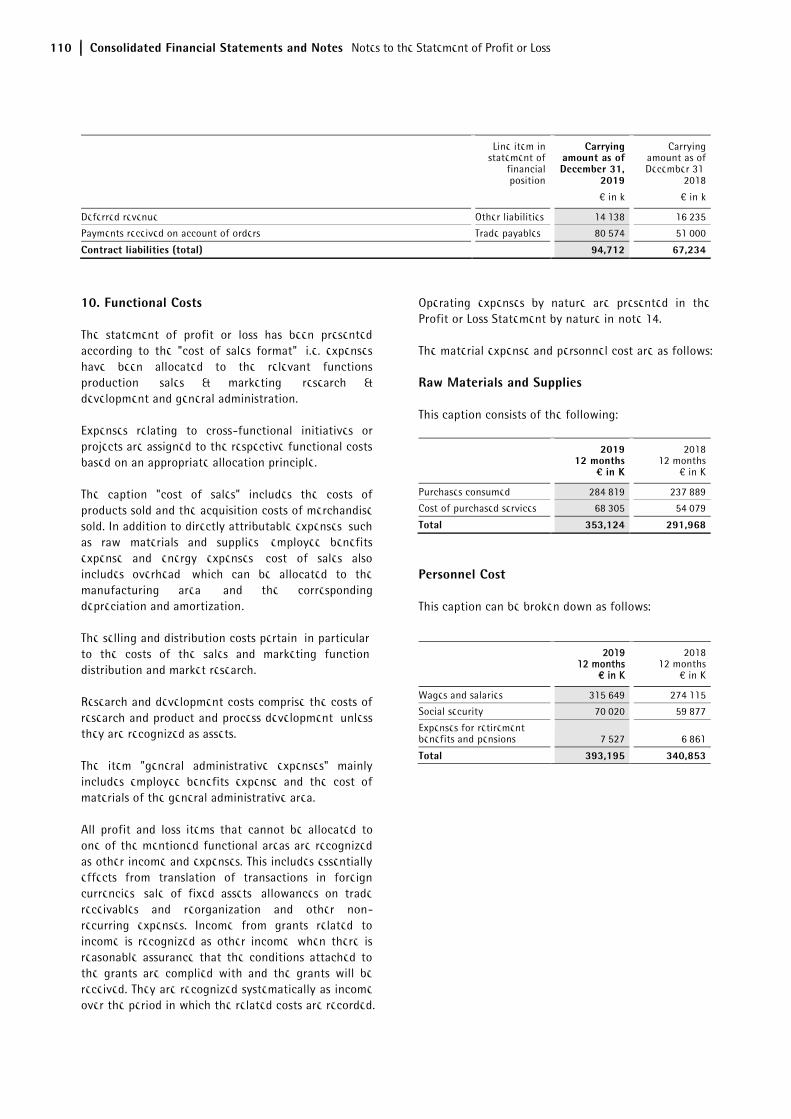
10. Functional Costs
The statement of profit or loss has been presented according to the "cost of sales format", i.e. expenses have been allocated to the relevant functions production, sales & marketing, research & development and general administration.
Expenses relating to cross-functional initiatives or projects are assigned to the respective functional costs based on an appropriate allocation principle.
The caption "cost of sales" includes the costs of products sold and the acquisition costs of merchandise sold. In addition to directly attributable expenses, such as raw materials and supplies, employee benefits expense and energy expenses, cost of sales also includes overhead, which can be allocated to the manufacturing area, and the corresponding depreciation and amortization.
The selling and distribution costs pertain, in particular, to the costs of the sales and marketing function, distribution and market research.
Research and development costs comprise the costs of research and product and process development, unless they are recognized as assets.
The item "general administrative expenses" mainly includes employee benefits expense and the cost of materials of the general administrative area.
All profit and loss items that cannot be allocated to one of the mentioned functional areas are recognized as other income and expenses. This includes essentially effects from translation of transactions in foreign currencies, sale of fixed assets, allowances on trade receivables and reorganization and other non-recurring expenses. Income from grants related to income is recognized as other income, when there is reasonable assurance that the conditions attached to the grants are complied with and the grants will be received. They are recognized systematically as income over the period in which the related costs are recorded.
Operating expenses by nature are presented in the Profit or Loss Statement by nature in note 14.
The material expense and personnel cost are as follows:
Raw Materials and Supplies
This caption consists of the following:
2019 12 months
¤ in K
2018 12 months
€ in K
Purchases consumed 284,819 237,889
Cost of purchased services 68,305 54,079
Total 353,124 291,968
Personnel Cost
This caption can be broken down as follows:
2019 12 months
€ in K
2018 12 months
€ in K
Wages and salaries 315,649 274,115
Social security 70,020 59,877
Expenses for retirement benefits and pensions 7,527 6,861
Total 393,195 340,853
Consolidated Financial Statements and Notes Notes to the Statement of Profit or Loss 111
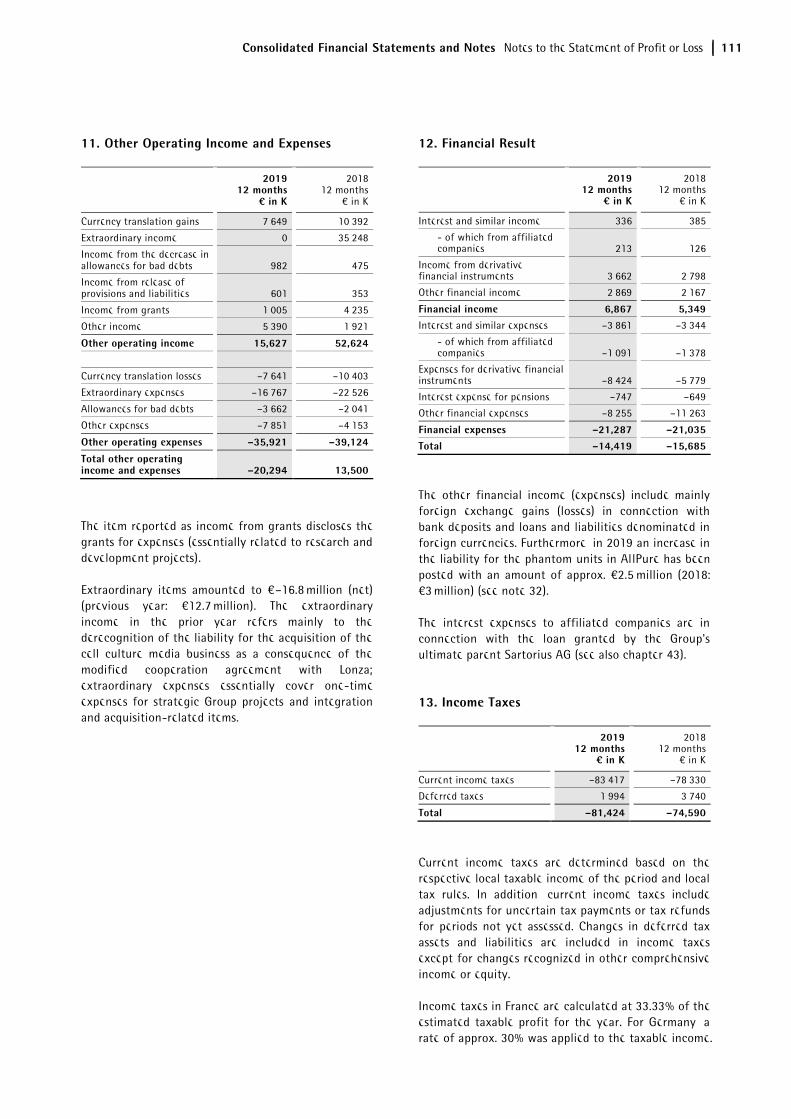
11. Other Operating Income and Expenses
2019 12 months
¤ in K
2018 12 months
€ in K
Currency translation gains 7,649 10,392
Extraordinary income 0 35,248
Income from the decrease in allowances for bad debts 982 475
Income from release of provisions and liabilities 601 353
Income from grants 1,005 4,235
Other income 5,390 1,921
Other operating income 15,627 52,624
Currency translation losses –7,641 –10,403
Extraordinary expenses –16,767 –22,526
Allowances for bad debts –3,662 –2,041
Other expenses –7,851 –4,153
Other operating expenses –35,921 –39,124
Total other operating income and expenses –20,294 13,500
The item reported as income from grants discloses the grants for expenses (essentially related to research and development projects).
Extraordinary items amounted to €–16.8 million (net) (previous year: €12.7 million). The extraordinary income in the prior year refers mainly to the derecognition of the liability for the acquisition of the cell culture media business as a consequence of the modified cooperation agreement with Lonza; extraordinary expenses essentially cover one-time expenses for strategic Group projects and integration and acquisition-related items.
12. Financial Result
2019 12 months
¤ in K
2018 12 months
€ in K
Interest and similar income 336 385
- of which from affiliated companies 213 126
Income from derivative financial instruments 3,662 2,798
Other financial income 2,869 2,167
Financial income 6,867 5,349 Interest and similar expenses –3,861 –3,344
- of which from affiliated companies –1,091 –1,378
Expenses for derivative financial instruments –8,424 –5,779
Interest expense for pensions –747 –649
Other financial expenses –8,255 –11,263
Financial expenses –21,287 –21,035 Total –14,419 –15,685
The other financial income (expenses) include mainly foreign exchange gains (losses) in connection with bank deposits and loans and liabilities denominated in foreign currencies. Furthermore, in 2019 an increase in the liability for the phantom units in AllPure has been posted with an amount of approx. €2.5 million (2018: €3 million) (see note 32).
The interest expenses to affiliated companies are in connection with the loan granted by the Group's ultimate parent Sartorius AG (see also chapter 43).
13. Income Taxes
2019 12 months
¤ in K
2018 12 months
€ in K
Current income taxes –83,417 –78,330
Deferred taxes 1,994 3,740
Total –81,424 –74,590
Current income taxes are determined based on the respective local taxable income of the period and local tax rules. In addition, current income taxes include adjustments for uncertain tax payments or tax refunds for periods not yet assessed. Changes in deferred tax assets and liabilities are included in income taxes except for changes recognized in other comprehensive income or equity.
Income taxes in France are calculated at 33.33% of the estimated taxable profit for the year. For Germany, a rate of approx. 30% was applied to the taxable income.
112 Consolidated Financial Statements and Notes Notes to the Statement of Profit or Loss
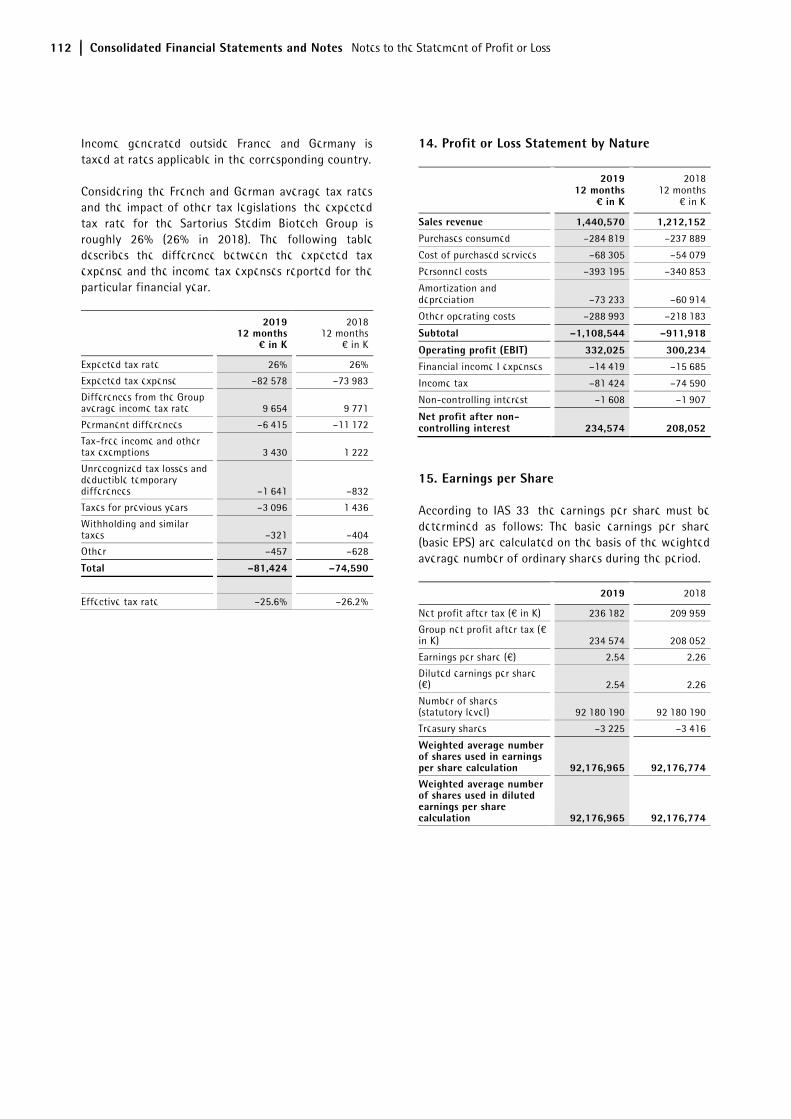
Income generated outside France and Germany is taxed at rates applicable in the corresponding country.
Considering the French and German average tax rates and the impact of other tax legislations, the expected tax rate for the Sartorius Stedim Biotech Group is roughly 26% (26% in 2018). The following table describes the difference between the expected tax expense and the income tax expenses reported for the particular financial year.
2019 12 months
¤ in K
2018 12 months
€ in K
Expected tax rate 26% 26%
Expected tax expense –82,578 –73,983
Differences from the Group average income tax rate 9,654 9,771
Permanent differences –6,415 –11,172
Tax-free income and other tax exemptions 3,430 1,222
Unrecognized tax losses and deductible temporary differences –1,641 –832
Taxes for previous years –3,096 1,436
Withholding and similar taxes –321 –404
Other –457 –628
Total –81,424 –74,590
Effective tax rate –25.6% –26.2%
14. Profit or Loss Statement by Nature
2019 12 months
¤ in K
2018 12 months
€ in K
Sales revenue 1,440,570 1,212,152 Purchases consumed –284,819 –237,889
Cost of purchased services –68,305 –54,079
Personnel costs –393,195 –340,853
Amortization and depreciation –73,233 –60,914
Other operating costs –288,993 –218,183
Subtotal –1,108,544 –911,918
Operating profit (EBIT) 332,025 300,234 Financial income I expenses –14,419 –15,685
Income tax –81,424 –74,590
Non-controlling interest –1,608 –1,907
Net profit after non-controlling interest 234,574 208,052
15. Earnings per Share
According to IAS 33, the earnings per share must be determined as follows: The basic earnings per share (basic EPS) are calculated on the basis of the weighted average number of ordinary shares during the period.
2019 2018
Net profit after tax (€ in K) 236,182 209,959
Group net profit after tax (€ in K) 234,574 208,052
Earnings per share (€) 2.54 2.26
Diluted earnings per share (€) 2.54 2.26
Number of shares (statutory level) 92,180,190 92,180,190
Treasury shares –3,225 –3,416
Weighted average number of shares used in earnings per share calculation 92,176,965 92,176,774 Weighted average number of shares used in diluted earnings per share calculation 92,176,965 92,176,774
Consolidated Financial Statements and Notes Notes to the Individual Balance Sheet Items 113
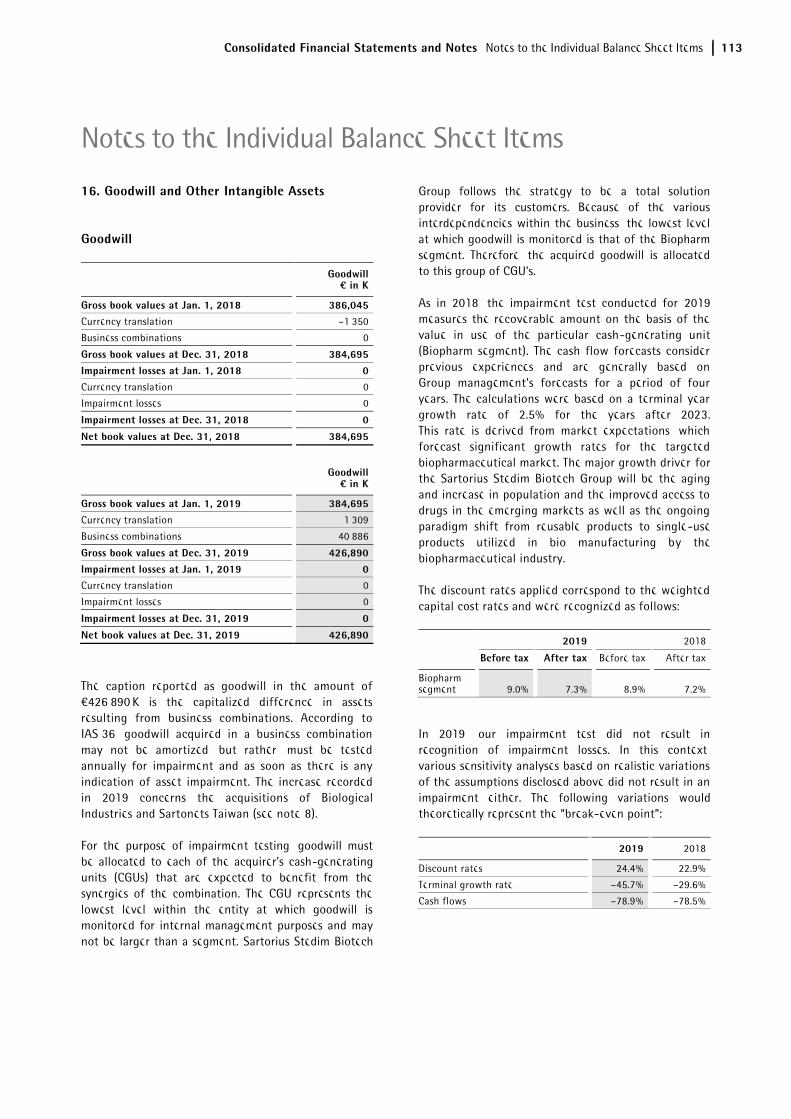
16. Goodwill and Other Intangible Assets
Goodwill
Goodwill ¤ in K
Gross book values at Jan. 1, 2018 386,045 Currency translation –1,350
Business combinations 0
Gross book values at Dec. 31, 2018 384,695 Impairment losses at Jan. 1, 2018 0 Currency translation 0
Impairment losses 0
Impairment losses at Dec. 31, 2018 0
Net book values at Dec. 31, 2018 384,695
Goodwill ¤ in K
Gross book values at Jan. 1, 2019 384,695 Currency translation 1,309
Business combinations 40,886
Gross book values at Dec. 31, 2019 426,890 Impairment losses at Jan. 1, 2019 0 Currency translation 0
Impairment losses 0
Impairment losses at Dec. 31, 2019 0
Net book values at Dec. 31, 2019 426,890
The caption reported as goodwill in the amount of €426,890 K is the capitalized difference in assets resulting from business combinations. According to IAS 36, goodwill acquired in a business combination may not be amortized, but rather, must be tested annually for impairment and as soon as there is any indication of asset impairment. The increase recorded in 2019 concerns the acquisitions of Biological Industries and Sartonets Taiwan (see note 8).
For the purpose of impairment testing, goodwill must be allocated to each of the acquirer’s cash-generating units (CGUs) that are expected to benefit from the synergies of the combination. The CGU represents the lowest level within the entity at which goodwill is monitored for internal management purposes and may not be larger than a segment. Sartorius Stedim Biotech
Group follows the strategy to be a total solution provider for its customers. Because of the various interdependencies within the business, the lowest level at which goodwill is monitored is that of the Biopharm segment. Therefore, the acquired goodwill is allocated to this group of CGU’s.
As in 2018, the impairment test conducted for 2019 measures the recoverable amount on the basis of the value in use of the particular cash-generating unit (Biopharm segment). The cash flow forecasts consider previous experiences and are generally based on Group management's forecasts for a period of four years. The calculations were based on a terminal year growth rate of 2.5% for the years after 2023. This rate is derived from market expectations, which forecast significant growth rates for the targeted biopharmaceutical market. The major growth driver for the Sartorius Stedim Biotech Group will be the aging and increase in population and the improved access to drugs in the emerging markets as well as the ongoing paradigm shift from reusable products to single-use products utilized in bio manufacturing by the biopharmaceutical industry.
The discount rates applied correspond to the weighted capital cost rates and were recognized as follows:
2019 2018
Before tax After tax Before tax After tax
Biopharm segment 9.0% 7.3% 8.9% 7.2%
In 2019, our impairment test did not result in recognition of impairment losses. In this context, various sensitivity analyses based on realistic variations of the assumptions disclosed above did not result in an impairment either. The following variations would theoretically represent the “break-even point”:
2019 2018
Discount rates 24.4% 22.9%
Terminal growth rate –45.7% –29.6%
Cash flows –78.9% –78.5%
Notes to the Individual Balance Sheet Items
114 Consolidated Financial Statements and Notes Notes to the Individual Balance Sheet Items
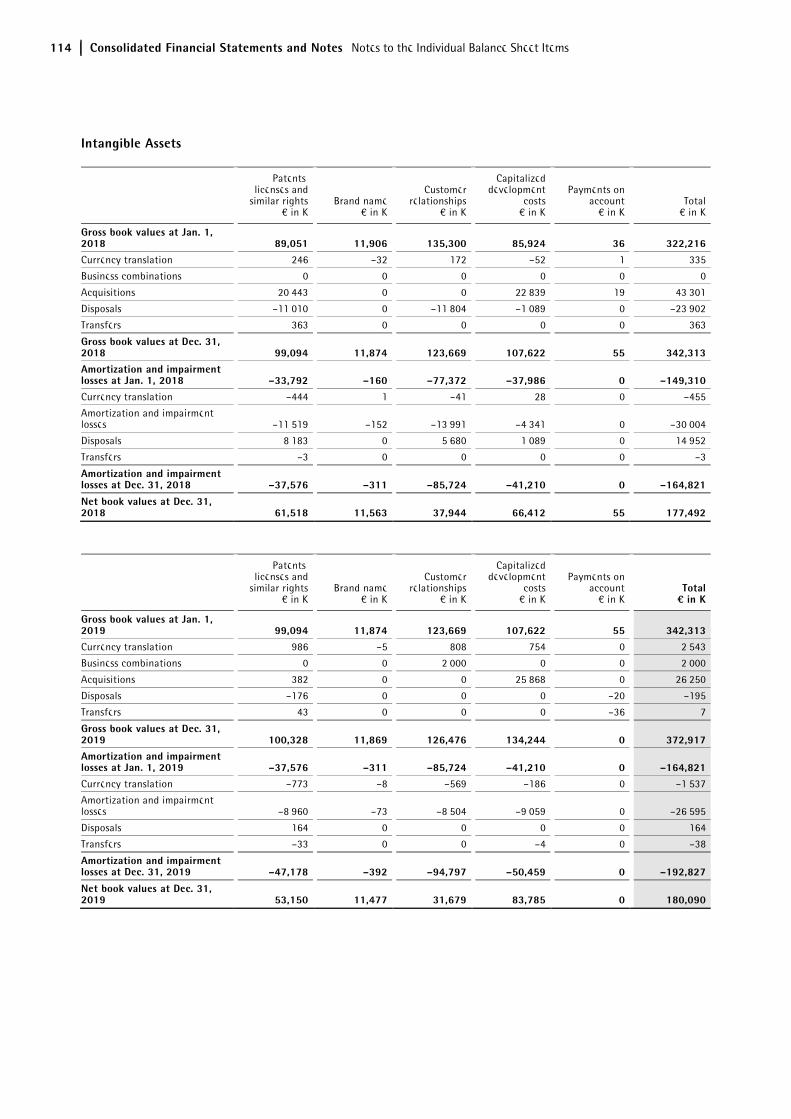
Intangible Assets
Patents, licenses and
similar rights € in K
Brand name € in K
Customer relationships
€ in K
Capitalized development
costs € in K
Payments on account
€ in K Total
€ in K
Gross book values at Jan. 1, 2018 89,051 11,906 135,300 85,924 36 322,216 Currency translation 246 –32 172 –52 1 335
Business combinations 0 0 0 0 0 0
Acquisitions 20,443 0 0 22,839 19 43,301
Disposals –11,010 0 –11,804 –1,089 0 –23,902
Transfers 363 0 0 0 0 363
Gross book values at Dec. 31, 2018 99,094 11,874 123,669 107,622 55 342,313 Amortization and impairment losses at Jan. 1, 2018 –33,792 –160 –77,372 –37,986 0 –149,310 Currency translation –444 1 –41 28 0 –455
Amortization and impairment losses –11,519 –152 –13,991 –4,341 0 –30,004
Disposals 8,183 0 5,680 1,089 0 14,952
Transfers –3 0 0 0 0 –3
Amortization and impairment losses at Dec. 31, 2018 –37,576 –311 –85,724 –41,210 0 –164,821
Net book values at Dec. 31, 2018 61,518 11,563 37,944 66,412 55 177,492
Patents, licenses and
similar rights € in K
Brand name € in K
Customer relationships
€ in K
Capitalized development
costs € in K
Payments on account
€ in K Total ¤ in K
Gross book values at Jan. 1, 2019 99,094 11,874 123,669 107,622 55 342,313 Currency translation 986 –5 808 754 0 2,543
Business combinations 0 0 2,000 0 0 2,000
Acquisitions 382 0 0 25,868 0 26,250
Disposals –176 0 0 0 –20 –195
Transfers 43 0 0 0 –36 7
Gross book values at Dec. 31, 2019 100,328 11,869 126,476 134,244 0 372,917 Amortization and impairment losses at Jan. 1, 2019 –37,576 –311 –85,724 –41,210 0 –164,821 Currency translation –773 –8 –569 –186 0 –1,537
Amortization and impairment losses –8,960 –73 –8,504 –9,059 0 –26,595
Disposals 164 0 0 0 0 164
Transfers –33 0 0 –4 0 –38
Amortization and impairment losses at Dec. 31, 2019 –47,178 –392 –94,797 –50,459 0 –192,827
Net book values at Dec. 31, 2019 53,150 11,477 31,679 83,785 0 180,090
Consolidated Financial Statements and Notes Notes to the Individual Balance Sheet Items 115
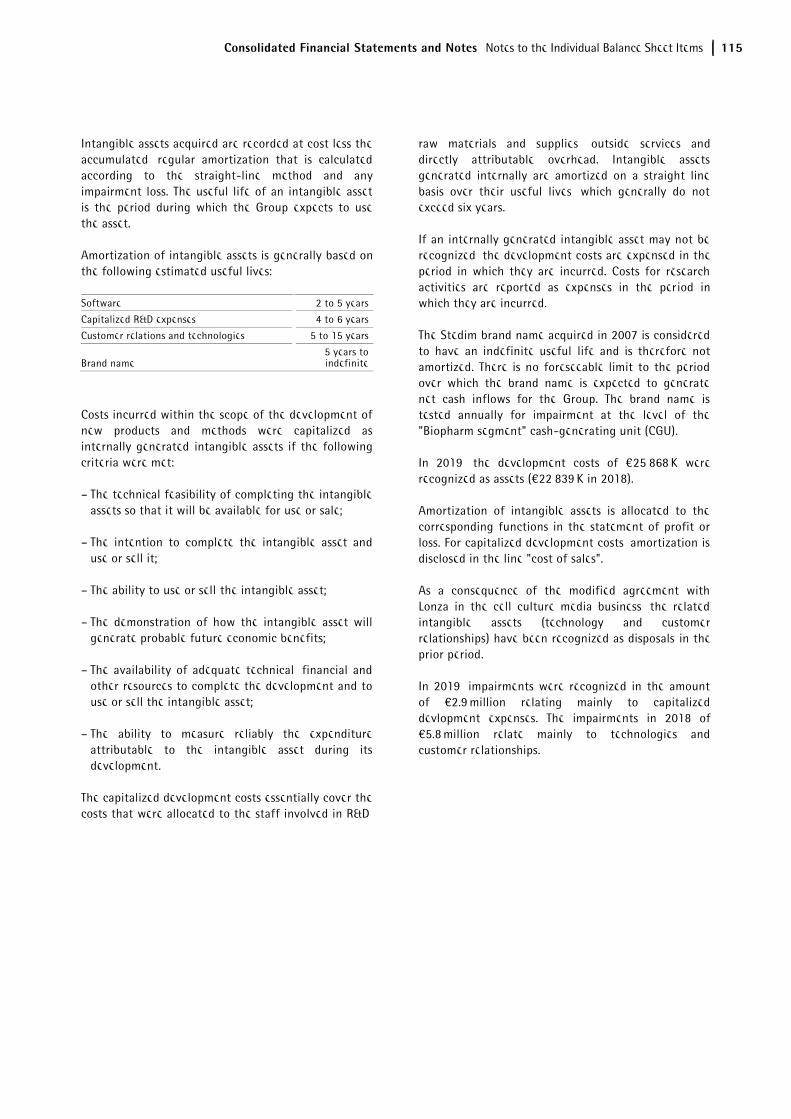
Intangible assets acquired are recorded at cost less the accumulated, regular amortization that is calculated according to the straight-line method and any impairment loss. The useful life of an intangible asset is the period during which the Group expects to use the asset.
Amortization of intangible assets is generally based on the following estimated useful lives:
Software 2 to 5 years
Capitalized R&D expenses 4 to 6 years
Customer relations and technologies 5 to 15 years
Brand name 5 years to indefinite
Costs incurred within the scope of the development of new products and methods were capitalized as internally generated intangible assets if the following criteria were met:
– The technical feasibility of completing the intangible assets so that it will be available for use or sale;
– The intention to complete the intangible asset and use or sell it;
– The ability to use or sell the intangible asset;
– The demonstration of how the intangible asset will generate probable future economic benefits;
– The availability of adequate technical, financial and other resources to complete the development and to use or sell the intangible asset;
– The ability to measure reliably the expenditure attributable to the intangible asset during its development.
The capitalized development costs essentially cover the costs that were allocated to the staff involved in R&D,
raw materials and supplies, outside services and directly attributable overhead. Intangible assets generated internally are amortized on a straight line basis over their useful lives, which generally do not exceed six years.
If an internally generated intangible asset may not be recognized, the development costs are expensed in the period in which they are incurred. Costs for research activities are reported as expenses in the period in which they are incurred.
The Stedim brand name acquired in 2007 is considered to have an indefinite useful life and is therefore not amortized. There is no foreseeable limit to the period over which the brand name is expected to generate net cash inflows for the Group. The brand name is tested annually for impairment at the level of the "Biopharm segment" cash-generating unit (CGU).
In 2019, the development costs of €25,868 K were recognized as assets (€22,839 K in 2018).
Amortization of intangible assets is allocated to the corresponding functions in the statement of profit or loss. For capitalized development costs, amortization is disclosed in the line "cost of sales".
As a consequence of the modified agreement with Lonza in the cell culture media business, the related intangible assets (technology and customer relationships) have been recognized as disposals in the prior period.
In 2019, impairments were recognized in the amount of €2.9 million relating mainly to capitalized devlopment expenses. The impairments in 2018 of €5.8 million relate mainly to technologies and customer relationships.
116 Consolidated Financial Statements and Notes Notes to the Individual Balance Sheet Items
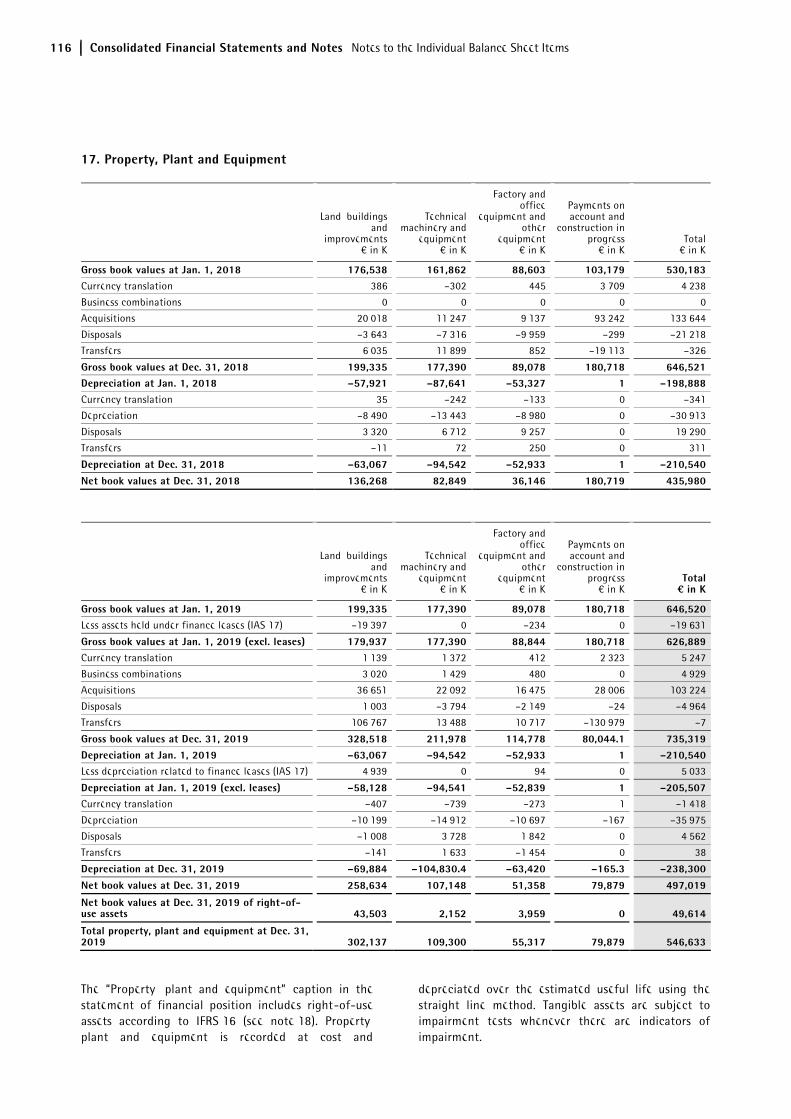
17. Property, Plant and Equipment
Land, buildings and
improvements € in K
Technical machinery and
equipment € in K
Factory and office
equipment and other
equipment € in K
Payments on account and
construction in progress
€ in K Total
€ in K
Gross book values at Jan. 1, 2018 176,538 161,862 88,603 103,179 530,183 Currency translation 386 –302 445 3,709 4,238
Business combinations 0 0 0 0 0
Acquisitions 20,018 11,247 9,137 93,242 133,644
Disposals –3,643 –7,316 –9,959 –299 –21,218
Transfers 6,035 11,899 852 –19,113 –326
Gross book values at Dec. 31, 2018 199,335 177,390 89,078 180,718 646,521 Depreciation at Jan. 1, 2018 –57,921 –87,641 –53,327 1 –198,888 Currency translation 35 –242 –133 0 –341
Depreciation –8,490 –13,443 –8,980 0 –30,913
Disposals 3,320 6,712 9,257 0 19,290
Transfers –11 72 250 0 311
Depreciation at Dec. 31, 2018 –63,067 –94,542 –52,933 1 –210,540 Net book values at Dec. 31, 2018 136,268 82,849 36,146 180,719 435,980
Land, buildings and
improvements € in K
Technical machinery and
equipment € in K
Factory and office
equipment and other
equipment € in K
Payments on account and
construction in progress
€ in K Total ¤ in K
Gross book values at Jan. 1, 2019 199,335 177,390 89,078 180,718 646,520 Less assets held under finance leases (IAS 17) –19,397 0 –234 0 –19,631
Gross book values at Jan. 1, 2019 (excl. leases) 179,937 177,390 88,844 180,718 626,889 Currency translation 1,139 1,372 412 2,323 5,247
Business combinations 3,020 1,429 480 0 4,929
Acquisitions 36,651 22,092 16,475 28,006 103,224
Disposals 1,003 –3,794 –2,149 –24 –4,964
Transfers 106,767 13,488 10,717 –130,979 –7
Gross book values at Dec. 31, 2019 328,518 211,978 114,778 80,044.1 735,319 Depreciation at Jan. 1, 2019 –63,067 –94,542 –52,933 1 –210,540 Less depreciation related to finance leases (IAS 17) 4,939 0 94 0 5,033
Depreciation at Jan. 1, 2019 (excl. leases) –58,128 –94,541 –52,839 1 –205,507 Currency translation –407 –739 –273 1 –1,418
Depreciation –10,199 –14,912 –10,697 –167 –35,975
Disposals –1,008 3,728 1,842 0 4,562
Transfers –141 1,633 –1,454 0 38
Depreciation at Dec. 31, 2019 –69,884 –104,830.4 –63,420 –165.3 –238,300 Net book values at Dec. 31, 2019 258,634 107,148 51,358 79,879 497,019
Net book values at Dec. 31, 2019 of right-of-use assets 43,503 2,152 3,959 0 49,614
Total property, plant and equipment at Dec. 31, 2019 302,137 109,300 55,317 79,879 546,633
The “Property, plant and equipment” caption in the statement of financial position includes right-of-use assets according to IFRS 16 (see note 18). Property, plant and equipment is recorded at cost and
depreciated over the estimated useful life using the straight line method. Tangible assets are subject to impairment tests whenever there are indicators of impairment.
Consolidated Financial Statements and Notes Notes to the Individual Balance Sheet Items 117
Depreciation of fixed assets is based on the following periods of useful life:
Buildings 15 to 50 years
Machinery 5 to 15 years
Factory and office equipment 3 to 13 years
Depreciation is included in the statement of profit or loss according to use of the assets in the cost of sales, selling and distribution costs, research and development costs, general administrative expenses and other operating expenses.
Borrowing costs are expensed as incurred unless they are directly attributable to the acquisition, construction or production of a qualifying asset and are therefore part of the cost of that asset. A qualifying asset is defined as an asset that takes a substantial period of time (six to twelve months) to get ready for its intended use.
Grants related to assets are deducted from the cost of the related asset.
In 2019, as for fiscal 2018, there were no significant impairment losses to be recognized with regard to property, plant and equipment.
18. Leases
Lease accounting in 2019 according to IFRS 16
A lease is a contract, or part of a contract, that conveys the right to use an asset for a period of time in exchange for consideration. For the financing structure of the Group, leases are not of high relevance. The main considerations in relation to leases are therefore generally of a practical nature, for example, with regard to the management of IT hardware or the fleet management. Accordingly, leases of IT hardware and cars represent the major part of the Group’s lease contracts. The lease term of such leases is generally fixed and extends typically over 3 to 5 years. However, those leases of the Group in which the lessor is a related party that is an entity controlled by the ultimate parent, Sartorius AG, are generally of a short-term nature providing both contract parties with operational flexibility. Furthermore, at some sites, the Group has long-term leases of buildings. The lease contracts are managed by the local management and may contain extension options which are included in the lease term according to IFRS 16 when the Group is reasonably certain that the option will be exercised. The Group does not act as a lessor to a material extent.
IFRS 16 introduces a standardized accounting model according to which leases are generally to be recognized on the lessee's balance sheet. A lessee recognizes a right-of-use asset representing its right to use a lease asset, as well as a liability resulting from the lease, which represents its obligation to make lease payments. There are exemptions for short-term leases and leases of low-value assets.
The Group makes use of the exemptions for short-term leases and leases of low-value assets and recognizes the corresponding lease payments as an expense generally on a straight-line basis over the particular lease term. Accordingly, no right-of-use assets and no lease liabilities are recognized for these leases. Furthermore, no right-of-use assets and no liabilities are recognized for leases between Group entities. The Group does not apply the standard to leases of intangible assets.
In the statement of financial position, the Group presents the right-of-use assets according to the nature of the underlying lease assets within “Property, plant and equipment.” The right-of-use assets are recognized at cost less accumulated depreciation and any impairments. The cost of the right-of-use assets comprises the present value of the future lease payments, any payments paid upon or before commencement of the lease, any initial direct costs, and costs for dismantling or removing the lease asset. The right-of-use assets are typically depreciated over the lease term. If the transfer of legal ownership of the lease asset is planned at the end of the lease term, the right-of-use asset is depreciated over the economic useful life of the lease asset. In the statement of profit or loss, depreciation is recognized within functional costs.
The lease liabilities are presented separately on the face of the statement of financial position. Lease liabilities are initially recognized at an amount equal to the present value of the future lease payments. The lease payments do generally not include any payments in relation to non-lease components. In general, the incremental borrowing rate of the Group specific to the respective country, currency and lease term is used for discounting. Subsequently, the carrying amount of the lease liabilities is increased by the interest expenses and reduced by the lease payments. Interest expenses are reported in the financial result and, to the extent they are paid, in the financing section of the cash flow statement.
118 Consolidated Financial Statements and Notes Notes to the Individual Balance Sheet Items
Accounting for the lessor is comparable to that of the previous standard IAS 17; i.e., lessors continue to classify leases as finance or operating leases. The transition method and the effects from the initial application of IFRS 16 on the consolidated financial statements for the period 2019 are described below.
Initial Application of IFRS 16, Leases in 2019
The Group has initially applied IFRS 16 in the 2019 reporting period. Accordingly, the date of initial application is January 1, 2019. In accordance with IFRS 16, the Group applies this standard using the modified retrospective transition approach. Therefore, the cumulative effect of initially applying the standard is recognized on January 1, 2019. There was no material transition effect to be recognized in retained earnings. In line with the transition regulations, the Group does not adjust the prior-year figures. The significant accounting policies and disclosures for the comparative period are disclosed separately at the end of this notes section.
The Group is mainly affected by the new standard in its role as a lessee as its lessor activities are not material. For leases that were previously classified as operating leases under IAS 17, the Group recognized a lease liability on January 1, 2019. The liabilities were measured at the present value of the remaining lease payments discounted using the respective incremental borrowing rate of the Group as of the date of initial application. The weighted average incremental borrowing rate was 2.1%. On the same date, for each of these leases, a right-of-use asset was recognized at an amount equal to the corresponding lease liability, adjusted for any prepaid or deferred lease payments. At the date of initial application, initial direct costs were not taken into consideration when the right-of-use assets were measured. Furthermore, the Group did not perform an impairment review but relied on its assessment of whether a lease was onerous in accordance with IAS 37 immediately before the date of initial application of IFRS 16. On this basis, no adjustments were necessary on the date of initial application.
No lease liabilities and no right-of-use assets were recognized in the course of the initial application of IFRS 16 for short-term leases and leases of low value assets that were previously classified as operating leases. Instead, in accordance with this standard, the lease payments for these leases are recognized as an expense on a straight-line basis over the lease term. Regardless of their original lease term, leases for which the remaining lease term did not exceed 12 months from the date of initial application onwards were generally not considered lease liabilities and
right-of-use assets. Accounting for such leases follows the general accounting rule for short-term leases. The remaining lease terms of the leases were determined based on the knowledge of the Group as of January 1, 2019.
For leases that were previously classified as finance leases and, thus, already reflected on the Group’s statement of financial position, the carrying amounts of the corresponding assets and liabilities as of December 31, 2018 were considered as carrying amounts of the right-of-use assets and lease liabilities at the date of initial application of IFRS 16 without any adjustments.
In the course of the transition to IFRS 16, right-of-use assets of €47 million (including €15 million related to leases previously classified as finance leases), as well as lease liabilities of €49 million (including €17 million related to leases previously classified as finance leases) were recognized as of January 1, 2019. As expected, the new standard led to an increase in total assets of about €32 million on the date of initial application. This corresponds to a reduction in the equity ratio of a little more than one percentage point.
Consolidated Financial Statements and Notes Notes to the Individual Balance Sheet Items 119
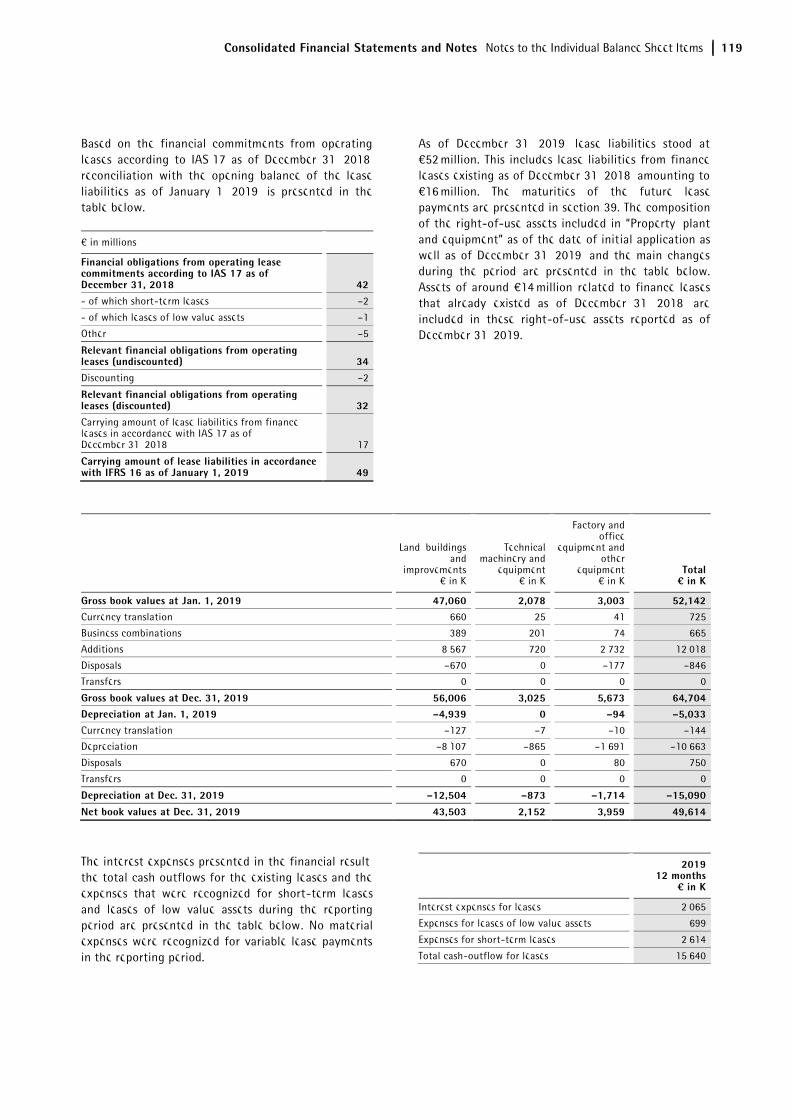
Based on the financial commitments from operating leases according to IAS 17 as of December 31, 2018, reconciliation with the opening balance of the lease liabilities as of January 1, 2019, is presented in the table below.
€ in millions
Financial obligations from operating lease commitments according to IAS 17 as of December 31, 2018 42 - of which short-term leases –2
- of which leases of low value assets –1
Other –5
Relevant financial obligations from operating leases (undiscounted) 34 Discounting –2
Relevant financial obligations from operating leases (discounted) 32 Carrying amount of lease liabilities from finance leases in accordance with IAS 17 as of December 31, 2018 17
Carrying amount of lease liabilities in accordance with IFRS 16 as of January 1, 2019 49
As of December 31, 2019, lease liabilities stood at €52 million. This includes lease liabilities from finance leases existing as of December 31, 2018, amounting to €16 million. The maturities of the future lease payments are presented in section 39. The composition of the right-of-use assets included in “Property, plant and equipment” as of the date of initial application as well as of December 31, 2019, and the main changes during the period are presented in the table below. Assets of around €14 million related to finance leases that already existed as of December 31, 2018, are included in these right-of-use assets reported as of December 31, 2019.
Land, buildings and
improvements € in K
Technical machinery and
equipment € in K
Factory and office
equipment and other
equipment € in K
Total ¤ in K
Gross book values at Jan. 1, 2019 47,060 2,078 3,003 52,142 Currency translation 660 25 41 725
Business combinations 389 201 74 665
Additions 8,567 720 2,732 12,018
Disposals –670 0 –177 –846
Transfers 0 0 0 0
Gross book values at Dec. 31, 2019 56,006 3,025 5,673 64,704 Depreciation at Jan. 1, 2019 –4,939 0 –94 –5,033 Currency translation –127 –7 –10 –144
Depreciation –8,107 –865 –1,691 –10,663
Disposals 670 0 80 750
Transfers 0 0 0 0
Depreciation at Dec. 31, 2019 –12,504 –873 –1,714 –15,090 Net book values at Dec. 31, 2019 43,503 2,152 3,959 49,614
The interest expenses presented in the financial result, the total cash outflows for the existing leases and the expenses that were recognized for short-term leases and leases of low value assets during the reporting period are presented in the table below. No material expenses were recognized for variable lease payments in the reporting period.
2019 12 months
¤ in K
Interest expenses for leases 2,065
Expenses for leases of low value assets 699
Expenses for short-term leases 2,614
Total cash-outflow for leases 15,640
120 Consolidated Financial Statements and Notes Notes to the Individual Balance Sheet Items
Lease accounting in 2018 according to IAS 17
Following the transition approach described above, IAS 17 is the standard applied for lease accounting in 2018. According to IAS 17, a lessee as well as a lessor classify a lease as either an operating or a finance lease. A finance lease is a lease that transfers substantially all the risks and rewards incidental to ownership of an asset. All other leases are designated as operating leases.
When the Group is a lessee in a finance lease, the amount equal to the fair value of the leased property, or if lower, the present value of the minimum lease payments is recognized as an asset on the balance sheet and simultaneously recognized as a financial liability. The minimum lease payments essentially consist of the finance charge and the reduction of the outstanding liability, which are measured according to the effective interest method. A leased asset is depreciated on a straight-line basis over the period of its expected useful life or over the shorter lease term.
For an operating lease, the lease instalments to be paid by the lessee are recognized as expenses over the lease term and the lease payments received by the lessor are recognized as income, respectively. The leased asset continues to be recognized on the lessor's balance sheet as property, plant and equipment.
Capitalized property, plant and equipment for assets held under finance leases amounted to €14,599 K in 2018. The cost of acquisition of these assets totaled €19,631 K. In 2018 rental payments amounting to €14.0 million were made for assets leased under operating leases.
The Group's financial obligations from operating lease commitments (future minimum lease payments under non-cancellable leases), were as follows:
Dec. 31, 2018
€ in K
Operate leases
- due within one year 11,434
- due within 2 to 5 years 22,145
- due thereafter 8,813
19. Investments in Associates
In December 2019, the Group obtained control over Biological Industries. For details regarding this business combination see note 8. Biological Industries owns a shareholding of 51% in Sartorius Israel Ltd. that is located in Kibbutz Beit Haemek, Israel. Due to contractual agreements, Sartorius Israel is ultimately controlled by Sartorius AG via subsidiaries that are not part of Sartorius Stedim Biotech Group. The Group therefore concluded that it has significant influence according to IAS 28 over Sartorius Israel Ltd., despite owning more than half of the shares.
The Group measures its investment in Sartorius Israel Ltd. applying the equity accounting method. The Group did not obtain dividends from Sartorius Israel Ltd. in 2019. As the acquisition of Biological Industries was closed on December 15, 2019, the purchase price allocation has not been finalized when the consolidated financial statements were authorized for issue. On a preliminary basis, the fair value of the investment in Sartorius Israel Ltd. amounts to €6.9 million at the date of acquisition. No equity accounting adjustments were made for the short time period between the date of acquisition and the balance sheet date. The investment is reported under Financial Assets (non-current) in the statement of financial position.
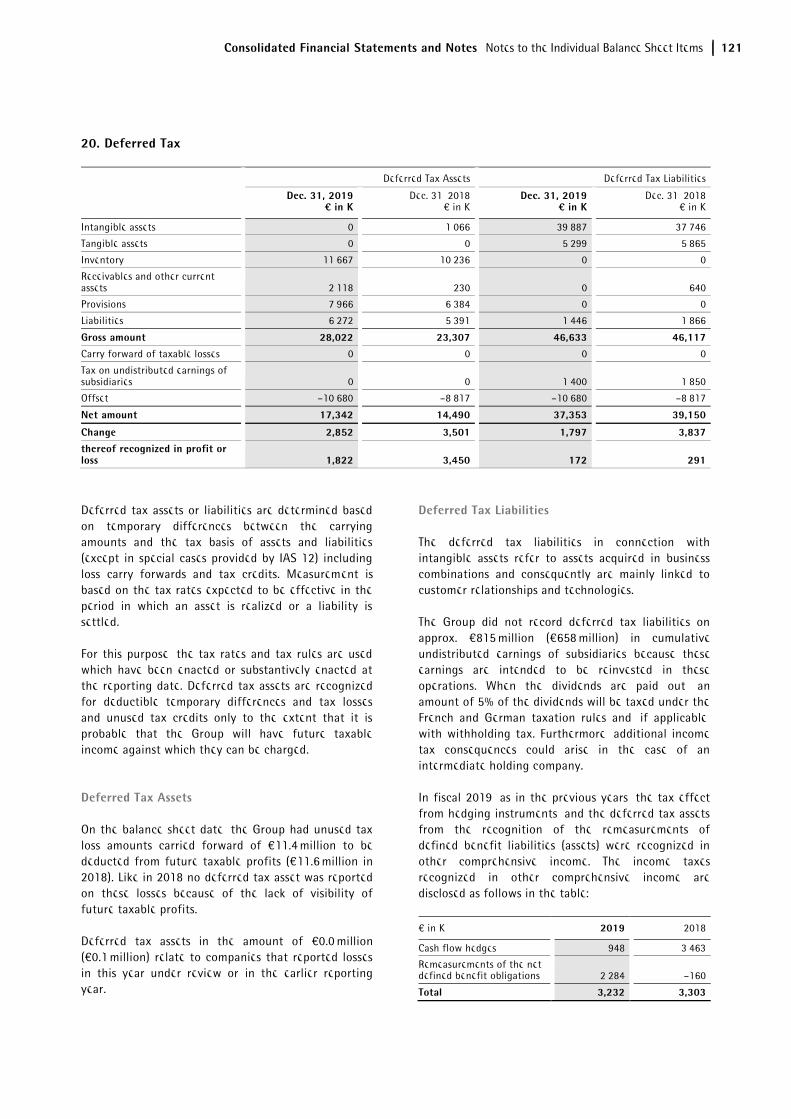
Consolidated Financial Statements and Notes Notes to the Individual Balance Sheet Items 121
20. Deferred Tax
Deferred Tax Assets Deferred Tax Liabilities
Dec. 31, 2019
¤ in K Dec. 31, 2018
€ in K Dec. 31, 2019
¤ in K Dec. 31, 2018
€ in K
Intangible assets 0 1,066 39,887 37,746
Tangible assets 0 0 5,299 5,865
Inventory 11,667 10,236 0 0
Receivables and other current assets 2,118 230 0 640
Provisions 7,966 6,384 0 0
Liabilities 6,272 5,391 1,446 1,866
Gross amount 28,022 23,307 46,633 46,117 Carry forward of taxable losses 0 0 0 0
Tax on undistributed earnings of subsidiaries 0 0 1,400 1,850
Offset –10,680 –8,817 –10,680 –8,817
Net amount 17,342 14,490 37,353 39,150
Change 2,852 3,501 1,797 3,837 thereof recognized in profit or loss 1,822 3,450 172 291
Deferred tax assets or liabilities are determined based on temporary differences between the carrying amounts and the tax basis of assets and liabilities (except in special cases provided by IAS 12) including loss carry forwards and tax credits. Measurement is based on the tax rates expected to be effective in the period in which an asset is realized or a liability is settled.
For this purpose, the tax rates and tax rules are used which have been enacted or substantively enacted at the reporting date. Deferred tax assets are recognized for deductible temporary differences and tax losses and unused tax credits only to the extent that it is probable that the Group will have future taxable income against which they can be charged.
Deferred Tax Assets
On the balance sheet date, the Group had unused tax loss amounts carried forward of €11.4 million to be deducted from future taxable profits (€11.6 million in 2018). Like in 2018 no deferred tax asset was reported on these losses because of the lack of visibility of future taxable profits.
Deferred tax assets in the amount of €0.0 million (€0.1 million) relate to companies that reported losses in this year under review or in the earlier reporting year.
Deferred Tax Liabilities
The deferred tax liabilities in connection with intangible assets refer to assets acquired in business combinations and consequently are mainly linked to customer relationships and technologies.
The Group did not record deferred tax liabilities on approx. €815 million (€658 million) in cumulative undistributed earnings of subsidiaries because these earnings are intended to be reinvested in these operations. When the dividends are paid out, an amount of 5% of the dividends will be taxed under the French and German taxation rules and, if applicable, with withholding tax. Furthermore, additional income tax consequences could arise in the case of an intermediate holding company.
In fiscal 2019, as in the previous years, the tax effect from hedging instruments, and the deferred tax assets from the recognition of the remeasurements of defined benefit liabilities (assets) were recognized in other comprehensive income. The income taxes recognized in other comprehensive income are disclosed as follows in the table:
€ in K 2019 2018
Cash flow hedges 948 3,463
Remeasurements of the net defined benefit obligations 2,284 –160
Total 3,232 3,303
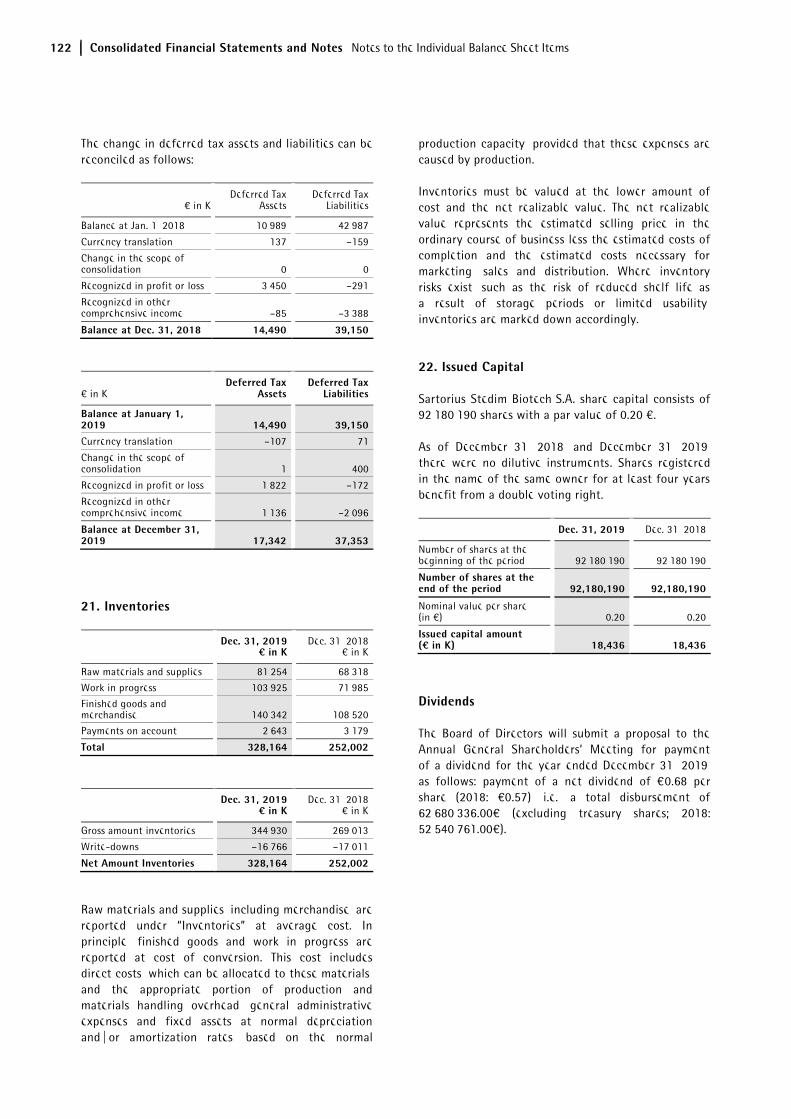
122 Consolidated Financial Statements and Notes Notes to the Individual Balance Sheet Items
The change in deferred tax assets and liabilities can be reconciled as follows:
€ in K Deferred Tax
Assets Deferred Tax
Liabilities
Balance at Jan. 1, 2018 10,989 42,987
Currency translation 137 –159
Change in the scope of consolidation 0 0
Recognized in profit or loss 3,450 –291
Recognized in other comprehensive income –85 –3,388
Balance at Dec. 31, 2018 14,490 39,150
€ in K Deferred Tax
Assets Deferred Tax
Liabilities
Balance at January 1, 2019 14,490 39,150 Currency translation –107 71
Change in the scope of consolidation 1 400
Recognized in profit or loss 1,822 –172
Recognized in other comprehensive income 1,136 –2,096
Balance at December 31, 2019 17,342 37,353
21. Inventories
Dec. 31, 2019 ¤ in K
Dec. 31, 2018 € in K
Raw materials and supplies 81,254 68,318
Work in progress 103,925 71,985
Finished goods and merchandise 140,342 108,520
Payments on account 2,643 3,179
Total 328,164 252,002
Dec. 31, 2019
¤ in K Dec. 31, 2018
€ in K
Gross amount inventories 344,930 269,013
Write-downs –16,766 –17,011
Net Amount Inventories 328,164 252,002
Raw materials and supplies, including merchandise, are reported under “Inventories” at average cost. In principle, finished goods and work in progress are reported at cost of conversion. This cost includes direct costs, which can be allocated to these materials, and the appropriate portion of production and materials handling overhead, general administrative expenses and fixed assets at normal depreciation and | or amortization rates, based on the normal
production capacity, provided that these expenses are caused by production.
Inventories must be valued at the lower amount of cost and the net realizable value. The net realizable value represents the estimated selling price in the ordinary course of business less the estimated costs of completion and the estimated costs necessary for marketing, sales and distribution. Where inventory risks exist, such as the risk of reduced shelf life as a result of storage periods or limited usability, inventories are marked down accordingly.
22. Issued Capital
Sartorius Stedim Biotech S.A. share capital consists of 92,180,190 shares with a par value of 0.20 €.
As of December 31, 2018, and December 31, 2019, there were no dilutive instruments. Shares registered in the name of the same owner for at least four years benefit from a double voting right.
Dec. 31, 2019 Dec. 31, 2018
Number of shares at the beginning of the period 92,180,190 92,180,190
Number of shares at the end of the period 92,180,190 92,180,190
Nominal value per share (in €) 0.20 0.20
Issued capital amount (¤ in K) 18,436 18,436
Dividends
The Board of Directors will submit a proposal to the Annual General Shareholders’ Meeting for payment of a dividend for the year ended December 31, 2019, as follows: payment of a net dividend of €0.68 per share (2018: €0.57), i.e., a total disbursement of 62,680,336.00€ (excluding treasury shares; 2018: 52,540,761.00€).
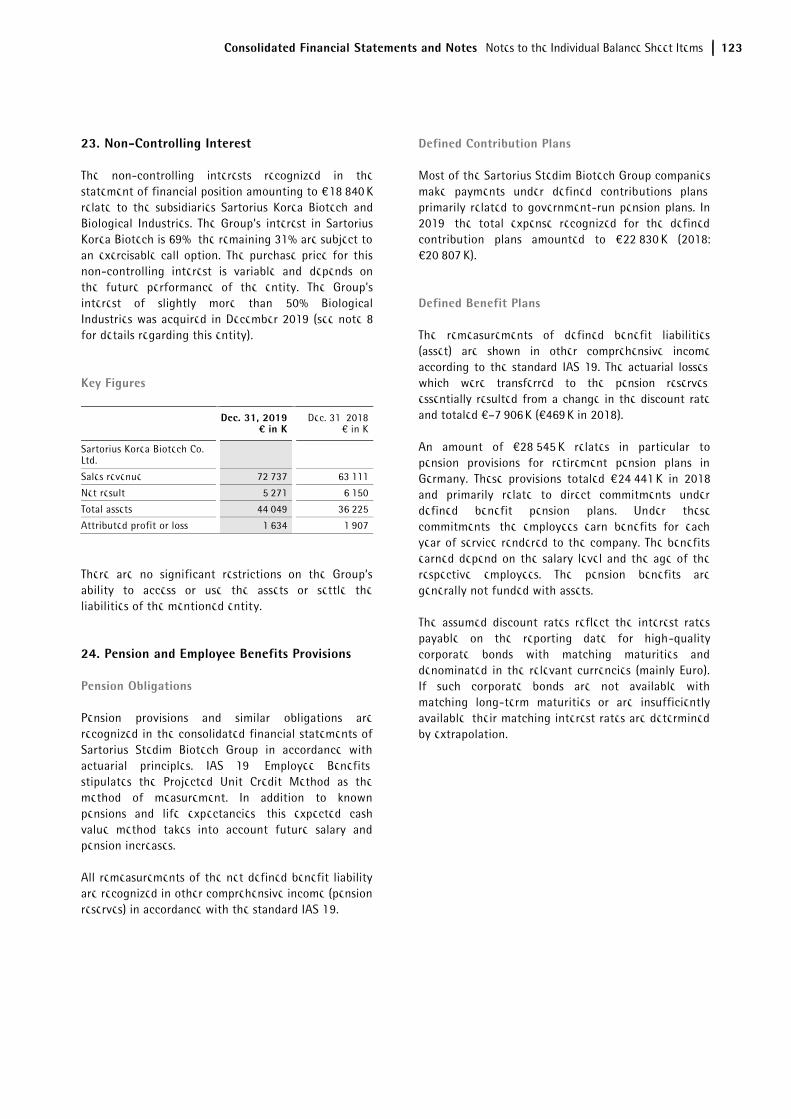
Consolidated Financial Statements and Notes Notes to the Individual Balance Sheet Items 123
23. Non-Controlling Interest
The non-controlling interests recognized in the statement of financial position amounting to €18,840 K relate to the subsidiaries Sartorius Korea Biotech and Biological Industries. The Group's interest in Sartorius Korea Biotech is 69%, the remaining 31% are subject to an exercisable call option. The purchase price for this non-controlling interest is variable and depends on the future performance of the entity. The Group's interest of slightly more than 50% Biological Industries was acquired in December 2019 (see note 8 for details regarding this entity).
Key Figures
Dec. 31, 2019
¤ in K Dec. 31, 2018
€ in K
Sartorius Korea Biotech Co. Ltd.
Sales revenue 72,737 63,111
Net result 5,271 6,150
Total assets 44,049 36,225
Attributed profit or loss 1,634 1,907
There are no significant restrictions on the Group’s ability to access or use the assets or settle the liabilities of the mentioned entity.
24. Pension and Employee Benefits Provisions
Pension Obligations
Pension provisions and similar obligations are recognized in the consolidated financial statements of Sartorius Stedim Biotech Group in accordance with actuarial principles. IAS 19, Employee Benefits, stipulates the Projected Unit Credit Method as the method of measurement. In addition to known pensions and life expectancies, this expected cash value method takes into account future salary and pension increases.
All remeasurements of the net defined benefit liability are recognized in other comprehensive income (pension reserves) in accordance with the standard IAS 19.
Defined Contribution Plans
Most of the Sartorius Stedim Biotech Group companies make payments under defined contributions plans, primarily related to government-run pension plans. In 2019, the total expense recognized for the defined contribution plans amounted to €22,830 K (2018: €20,807 K).
Defined Benefit Plans
The remeasurements of defined benefit liabilities (asset) are shown in other comprehensive income according to the standard IAS 19. The actuarial losses, which were transferred to the pension reserves, essentially resulted from a change in the discount rate and totaled €–7,906 K (€469 K in 2018).
An amount of €28,545 K relates in particular to pension provisions for retirement pension plans in Germany. These provisions totaled €24,441 K in 2018 and primarily relate to direct commitments under defined benefit pension plans. Under these commitments, the employees earn benefits for each year of service rendered to the company. The benefits earned depend on the salary level and the age of the respective employees. The pension benefits are generally not funded with assets.
The assumed discount rates reflect the interest rates payable on the reporting date for high-quality corporate bonds with matching maturities and denominated in the relevant currencies (mainly Euro). If such corporate bonds are not available with matching long-term maturities or are insufficiently available, their matching interest rates are determined by extrapolation.
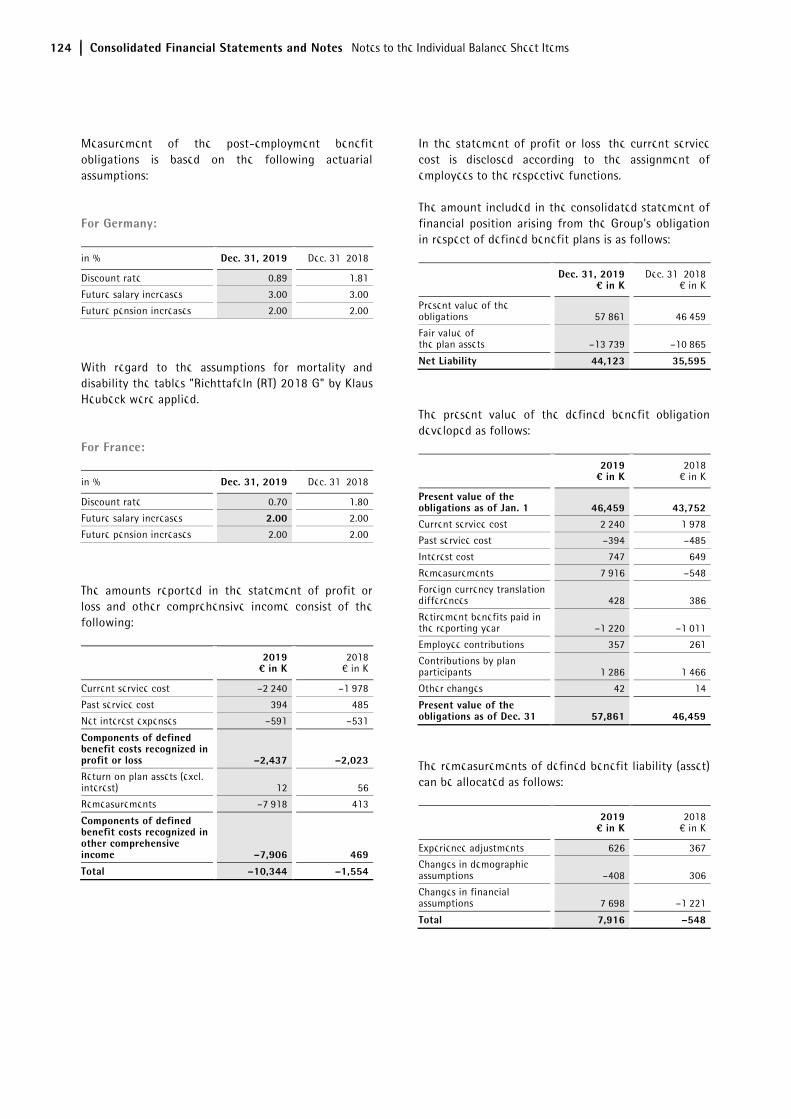
124 Consolidated Financial Statements and Notes Notes to the Individual Balance Sheet Items
Measurement of the post-employment benefit obligations is based on the following actuarial assumptions:
For Germany:
in % Dec. 31, 2019 Dec. 31, 2018
Discount rate 0.89 1.81
Future salary increases 3.00 3.00
Future pension increases 2.00 2.00
With regard to the assumptions for mortality and disability the tables "Richttafeln (RT) 2018 G" by Klaus Heubeck were applied.
For France:
in % Dec. 31, 2019 Dec. 31, 2018
Discount rate 0.70 1.80
Future salary increases 2.00 2.00
Future pension increases 2.00 2.00
The amounts reported in the statement of profit or loss and other comprehensive income consist of the following:
2019 ¤ in K
2018 € in K
Current service cost –2,240 –1,978
Past service cost 394 485
Net interest expenses –591 –531
Components of defined benefit costs recognized in profit or loss –2,437 –2,023 Return on plan assets (excl. interest) 12 56
Remeasurements –7,918 413
Components of defined benefit costs recognized in other comprehensive income –7,906 469
Total –10,344 –1,554
In the statement of profit or loss, the current service cost is disclosed according to the assignment of employees to the respective functions.
The amount included in the consolidated statement of financial position arising from the Group's obligation in respect of defined benefit plans is as follows:
Dec. 31, 2019
¤ in K Dec. 31, 2018
€ in K
Present value of the obligations 57,861 46,459
Fair value of the plan assets –13,739 –10,865
Net Liability 44,123 35,595
The present value of the defined benefit obligation developed as follows:
2019 ¤ in K
2018 € in K
Present value of the obligations as of Jan. 1 46,459 43,752 Current service cost 2,240 1,978
Past service cost –394 –485
Interest cost 747 649
Remeasurements 7,916 –548
Foreign currency translation differences 428 386
Retirement benefits paid in the reporting year –1,220 –1,011
Employee contributions 357 261
Contributions by plan participants 1,286 1,466
Other changes 42 14
Present value of the obligations as of Dec. 31 57,861 46,459
The remeasurements of defined benefit liability (asset) can be allocated as follows:
2019 ¤ in K
2018 € in K
Experience adjustments 626 367
Changes in demographic assumptions –408 306
Changes in financial assumptions 7,698 –1,221
Total 7,916 –548
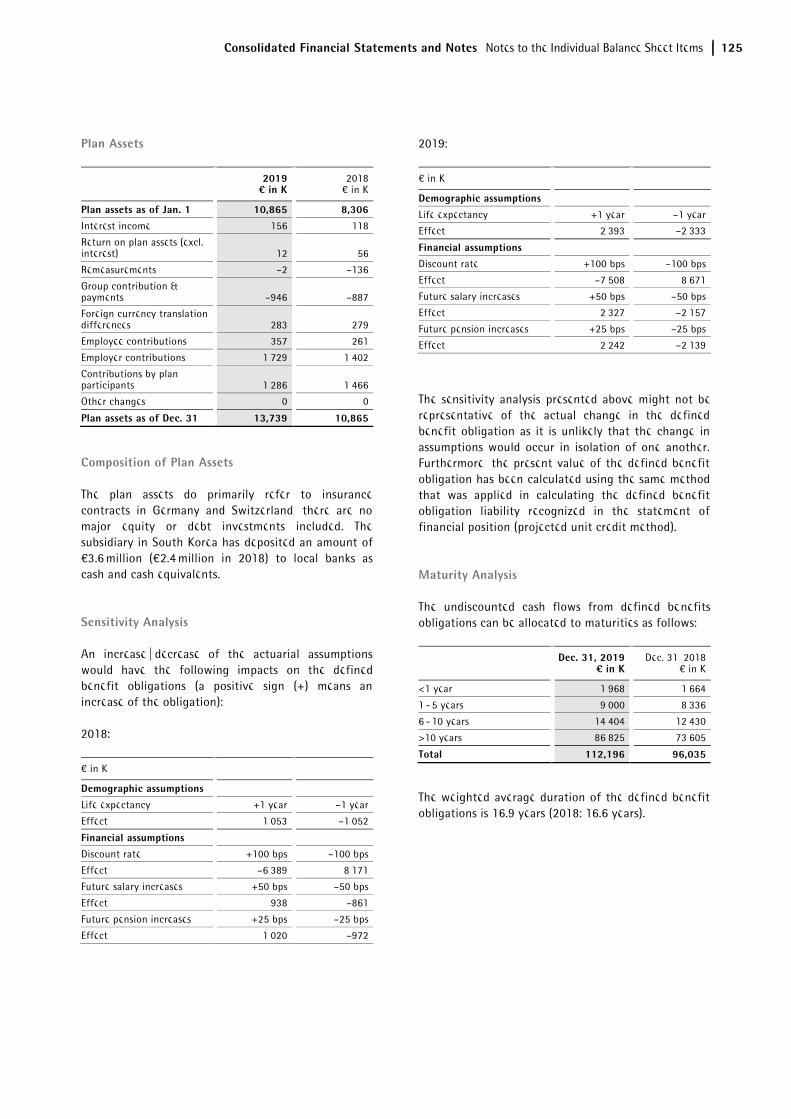
Consolidated Financial Statements and Notes Notes to the Individual Balance Sheet Items 125
Plan Assets
2019 ¤ in K
2018 € in K
Plan assets as of Jan. 1 10,865 8,306 Interest income 156 118
Return on plan assets (excl. interest) 12 56
Remeasurements –2 –136
Group contribution & payments –946 –887
Foreign currency translation differences 283 279
Employee contributions 357 261
Employer contributions 1,729 1,402
Contributions by plan participants 1,286 1,466
Other changes 0 0
Plan assets as of Dec. 31 13,739 10,865
Composition of Plan Assets
The plan assets do primarily refer to insurance contracts in Germany and Switzerland, there are no major equity or debt investments included. The subsidiary in South Korea has deposited an amount of €3.6 million (€2.4 million in 2018) to local banks as cash and cash equivalents.
Sensitivity Analysis
An increase | decrease of the actuarial assumptions would have the following impacts on the defined benefit obligations (a positive sign (+) means an increase of the obligation):
2018:
€ in K
Demographic assumptions Life expectancy +1 year –1 year
Effect 1,053 –1,052
Financial assumptions Discount rate +100 bps –100 bps
Effect –6,389 8,171
Future salary increases +50 bps –50 bps
Effect 938 –861
Future pension increases +25 bps –25 bps
Effect 1,020 –972
2019:
€ in K
Demographic assumptions Life expectancy +1 year –1 year
Effect 2,393 –2,333
Financial assumptions Discount rate +100 bps –100 bps
Effect –7,508 8,671
Future salary increases +50 bps –50 bps
Effect 2,327 –2,157
Future pension increases +25 bps –25 bps
Effect 2,242 –2,139
The sensitivity analysis presented above might not be representative of the actual change in the defined benefit obligation as it is unlikely that the change in assumptions would occur in isolation of one another. Furthermore, the present value of the defined benefit obligation has been calculated using the same method that was applied in calculating the defined benefit obligation liability recognized in the statement of financial position (projected unit credit method).
Maturity Analysis
The undiscounted cash flows from defined benefits obligations can be allocated to maturities as follows:
Dec. 31, 2019
¤ in K Dec. 31, 2018
€ in K
<1 year 1,968 1,664
1 - 5 years 9,000 8,336
6 - 10 years 14,404 12,430
>10 years 86,825 73,605
Total 112,196 96,035
The weighted average duration of the defined benefit obligations is 16.9 years (2018: 16.6 years).
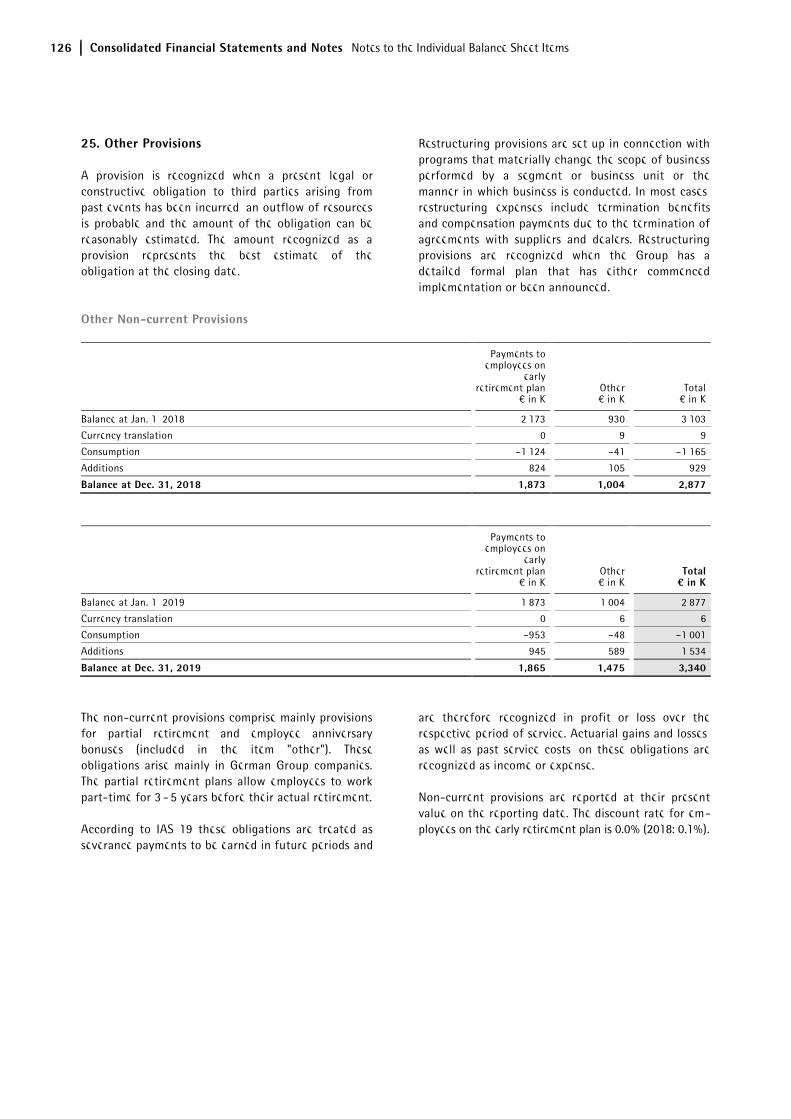
126 Consolidated Financial Statements and Notes Notes to the Individual Balance Sheet Items
25. Other Provisions
A provision is recognized when a present legal or constructive obligation to third parties arising from past events has been incurred, an outflow of resources is probable and the amount of the obligation can be reasonably estimated. The amount recognized as a provision represents the best estimate of the obligation at the closing date.
Restructuring provisions are set up in connection with programs that materially change the scope of business performed by a segment or business unit or the manner in which business is conducted. In most cases, restructuring expenses include termination benefits and compensation payments due to the termination of agreements with suppliers and dealers. Restructuring provisions are recognized when the Group has a detailed formal plan that has either commenced implementation or been announced.
Other Non-current Provisions
Payments to employees on
early retirement plan
€ in K Other € in K
Total € in K
Balance at Jan. 1, 2018 2,173 930 3,103
Currency translation 0 9 9
Consumption –1,124 –41 –1,165
Additions 824 105 929
Balance at Dec. 31, 2018 1,873 1,004 2,877
Payments to employees on
early retirement plan
€ in K Other € in K
Total ¤ in K
Balance at Jan. 1, 2019 1,873 1,004 2,877
Currency translation 0 6 6
Consumption –953 –48 –1,001
Additions 945 589 1,534
Balance at Dec. 31, 2019 1,865 1,475 3,340
The non-current provisions comprise mainly provisions for partial retirement and employee anniversary bonuses (included in the item "other"). These obligations arise mainly in German Group companies. The partial retirement plans allow employees to work part-time for 3 - 5 years before their actual retirement.
According to IAS 19 these obligations are treated as severance payments to be earned in future periods and
are therefore recognized in profit or loss over the respective period of service. Actuarial gains and losses, as well as past service costs, on these obligations are recognized as income or expense.
Non-current provisions are reported at their present value on the reporting date. The discount rate for em-ployees on the early retirement plan is 0.0% (2018: 0.1%).
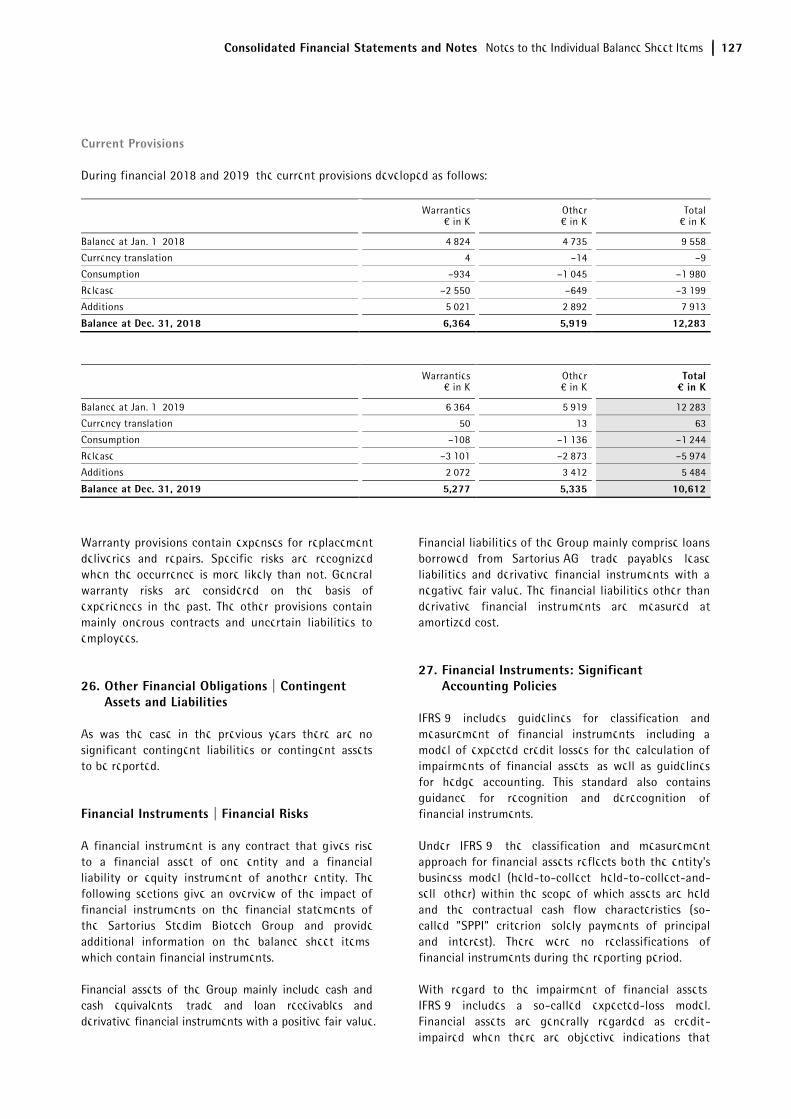
Consolidated Financial Statements and Notes Notes to the Individual Balance Sheet Items 127
Current Provisions
During financial 2018 and 2019, the current provisions developed as follows:
Warranties € in K
Other € in K
Total € in K
Balance at Jan. 1, 2018 4,824 4,735 9,558
Currency translation 4 –14 –9
Consumption –934 –1,045 –1,980
Release –2,550 –649 –3,199
Additions 5,021 2,892 7,913
Balance at Dec. 31, 2018 6,364 5,919 12,283
Warranties € in K
Other € in K
Total ¤ in K
Balance at Jan. 1, 2019 6,364 5,919 12,283
Currency translation 50 13 63
Consumption –108 –1,136 –1,244
Release –3,101 –2,873 –5,974
Additions 2,072 3,412 5,484
Balance at Dec. 31, 2019 5,277 5,335 10,612
Warranty provisions contain expenses for replacement deliveries and repairs. Specific risks are recognized when the occurrence is more likely than not. General warranty risks are considered on the basis of experiences in the past. The other provisions contain mainly onerous contracts and uncertain liabilities to employees.
26. Other Financial Obligations | Contingent Assets and Liabilities
As was the case in the previous years there are no significant contingent liabilities or contingent assets to be reported.
Financial Instruments | Financial Risks
A financial instrument is any contract that gives rise to a financial asset of one entity and a financial liability or equity instrument of another entity. The following sections give an overview of the impact of financial instruments on the financial statements of the Sartorius Stedim Biotech Group and provide additional information on the balance sheet items, which contain financial instruments.
Financial assets of the Group mainly include cash and cash equivalents, trade and loan receivables and derivative financial instruments with a positive fair value.
Financial liabilities of the Group mainly comprise loans borrowed from Sartorius AG, trade payables, lease liabilities and derivative financial instruments with a negative fair value. The financial liabilities other than derivative financial instruments are measured at amortized cost.
27. Financial Instruments: Significant Accounting Policies
IFRS 9 includes guidelines for classification and measurement of financial instruments, including a model of expected credit losses for the calculation of impairments of financial assets, as well as guidelines for hedge accounting. This standard also contains guidance for recognition and derecognition of financial instruments.
Under IFRS 9, the classification and measurement approach for financial assets reflects both the entity's business model (held-to-collect, held-to-collect-and-sell, other) within the scope of which assets are held and the contractual cash flow characteristics (so-called "SPPI" criterion, solely payments of principal and interest). There were no reclassifications of financial instruments during the reporting period.
With regard to the impairment of financial assets, IFRS 9 includes a so-called expected-loss model. Financial assets are generally regarded as credit-impaired when there are objective indications that
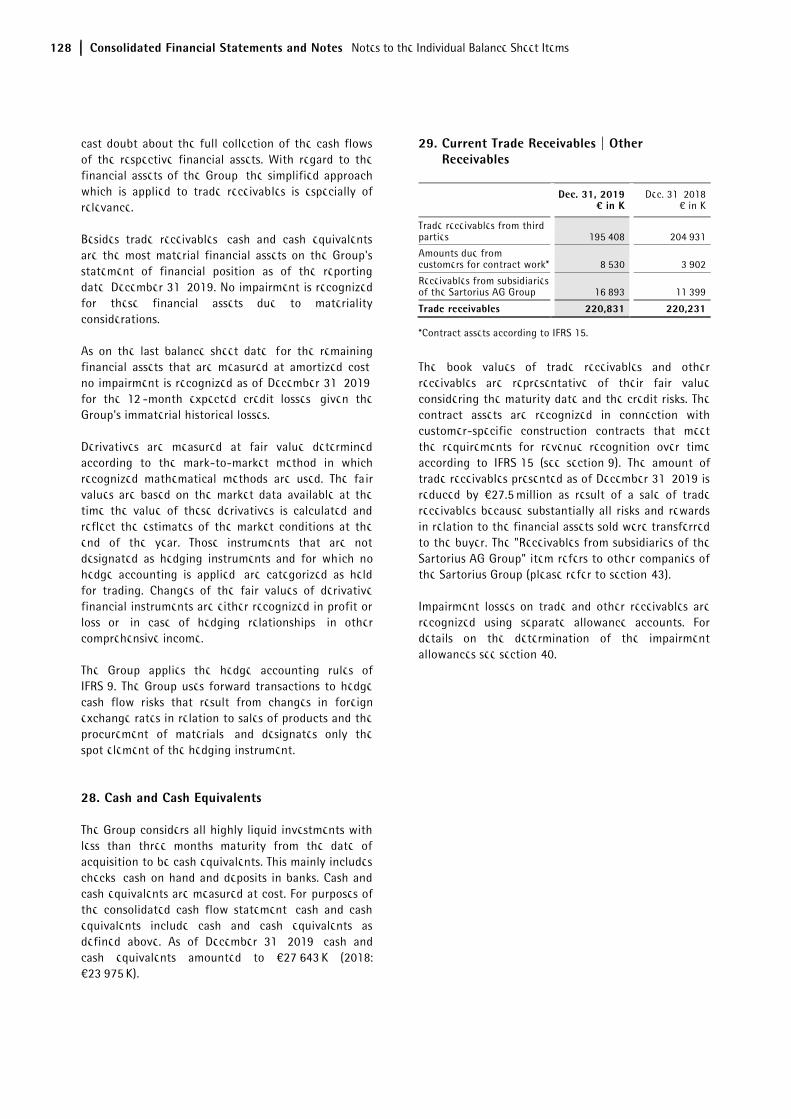
128 Consolidated Financial Statements and Notes Notes to the Individual Balance Sheet Items
cast doubt about the full collection of the cash flows of the respective financial assets. With regard to the financial assets of the Group, the simplified approach which is applied to trade receivables is especially of relevance.
Besides trade receivables, cash and cash equivalents are the most material financial assets on the Group's statement of financial position as of the reporting date, December 31, 2019. No impairment is recognized for these financial assets due to materiality considerations.
As on the last balance sheet date, for the remaining financial assets that are measured at amortized cost, no impairment is recognized as of December 31, 2019, for the 12 -month expected credit losses, given the Group's immaterial historical losses.
Derivatives are measured at fair value determined according to the mark-to-market method in which recognized mathematical methods are used. The fair values are based on the market data available at the time the value of these derivatives is calculated and reflect the estimates of the market conditions at the end of the year. Those instruments that are not designated as hedging instruments and for which no hedge accounting is applied, are categorized as held for trading. Changes of the fair values of derivative financial instruments are either recognized in profit or loss or, in case of hedging relationships, in other comprehensive income.
The Group applies the hedge accounting rules of IFRS 9. The Group uses forward transactions to hedge cash flow risks that result from changes in foreign exchange rates in relation to sales of products and the procurement of materials, and designates only the spot element of the hedging instrument.
28. Cash and Cash Equivalents
The Group considers all highly liquid investments with less than three months maturity from the date of acquisition to be cash equivalents. This mainly includes checks, cash on hand and deposits in banks. Cash and cash equivalents are measured at cost. For purposes of the consolidated cash flow statement, cash and cash equivalents include cash and cash equivalents as defined above. As of December 31, 2019, cash and cash equivalents amounted to €27,643 K (2018: €23,975 K).
29. Current Trade Receivables | Other Receivables
Dec. 31, 2019
¤ in K Dec. 31, 2018
€ in K
Trade receivables from third parties 195,408 204,931
Amounts due from customers for contract work* 8,530 3,902
Receivables from subsidiaries of the Sartorius AG Group 16,893 11,399
Trade receivables 220,831 220,231
*Contract assets according to IFRS 15.
The book values of trade receivables and other receivables are representative of their fair value considering the maturity date and the credit risks. The contract assets are recognized in connection with customer-specific construction contracts that meet the requirements for revenue recognition over time according to IFRS 15 (see section 9). The amount of trade receivables presented as of December 31, 2019 is reduced by €27.5 million as result of a sale of trade receivables because substantially all risks and rewards in relation to the financial assets sold were transferred to the buyer. The "Receivables from subsidiaries of the Sartorius AG Group" item refers to other companies of the Sartorius Group (please refer to section 43).
Impairment losses on trade and other receivables are recognized using separate allowance accounts. For details on the determination of the impairment allowances see section 40.
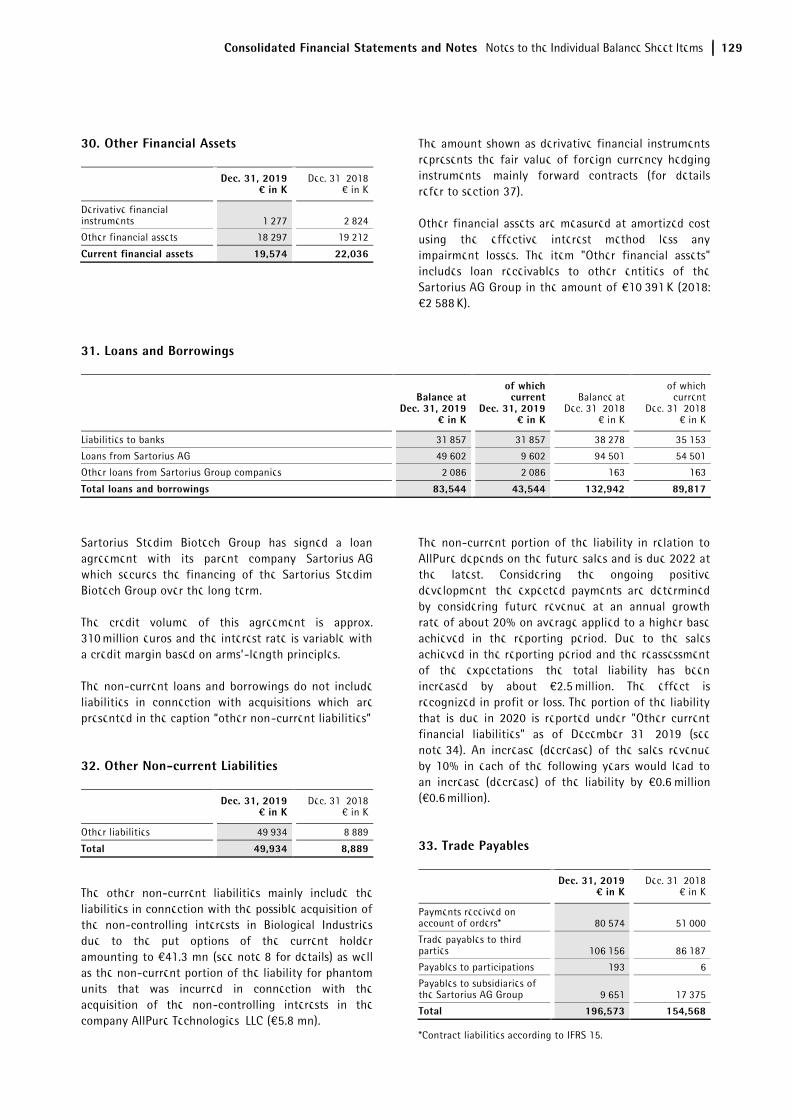
Consolidated Financial Statements and Notes Notes to the Individual Balance Sheet Items 129
30. Other Financial Assets
Dec. 31, 2019
¤ in K Dec. 31, 2018
€ in K
Derivative financial instruments 1,277 2,824
Other financial assets 18,297 19,212
Current financial assets 19,574 22,036
The amount shown as derivative financial instruments represents the fair value of foreign currency hedging instruments, mainly forward contracts (for details refer to section 37).
Other financial assets are measured at amortized cost using the effective interest method less any impairment losses. The item "Other financial assets" includes loan receivables to other entities of the Sartorius AG Group in the amount of €10,391 K (2018: €2,588 K).
31. Loans and Borrowings
Balance at Dec. 31, 2019
¤ in K
of which current
Dec. 31, 2019 ¤ in K
Balance at Dec. 31, 2018
€ in K
of which current
Dec. 31, 2018 € in K
Liabilities to banks 31,857 31,857 38,278 35,153
Loans from Sartorius AG 49,602 9,602 94,501 54,501
Other loans from Sartorius Group companies 2,086 2,086 163 163
Total loans and borrowings 83,544 43,544 132,942 89,817
Sartorius Stedim Biotech Group has signed a loan agreement with its parent company Sartorius AG which secures the financing of the Sartorius Stedim Biotech Group over the long term.
The credit volume of this agreement is approx. 310 million euros and the interest rate is variable with a credit margin based on arms’-length principles.
The non-current loans and borrowings do not include liabilities in connection with acquisitions which are presented in the caption “other non-current liabilities”
32. Other Non-current Liabilities
Dec. 31, 2019
¤ in K Dec. 31, 2018
€ in K
Other liabilities 49,934 8,889
Total 49,934 8,889
The other non-current liabilities mainly include the liabilities in connection with the possible acquisition of the non-controlling interests in Biological Industries due to the put options of the current holder amounting to €41.3 mn (see note 8 for details) as well as the non-current portion of the liability for phantom units that was incurred in connection with the acquisition of the non-controlling interests in the company AllPure Technologies, LLC (€5.8 mn).
The non-current portion of the liability in relation to AllPure depends on the future sales and is due 2022 at the latest. Considering the ongoing positive development, the expected payments are determined by considering future revenue at an annual growth rate of about 20% on average applied to a higher base achieved in the reporting period. Due to the sales achieved in the reporting period and the reassessment of the expectations, the total liability has been increased by about €2.5 million. The effect is recognized in profit or loss. The portion of the liability that is due in 2020 is reported under "Other current financial liabilities" as of December 31, 2019 (see note 34). An increase (decrease) of the sales revenue by 10% in each of the following years would lead to an increase (decrease) of the liability by €0.6 million (€0.6 million).
33. Trade Payables
Dec. 31, 2019 ¤ in K
Dec. 31, 2018 € in K
Payments received on account of orders* 80,574 51,000
Trade payables to third parties 106,156 86,187
Payables to participations 193 6
Payables to subsidiaries of the Sartorius AG Group 9,651 17,375
Total 196,573 154,568
*Contract liabilities according to IFRS 15.
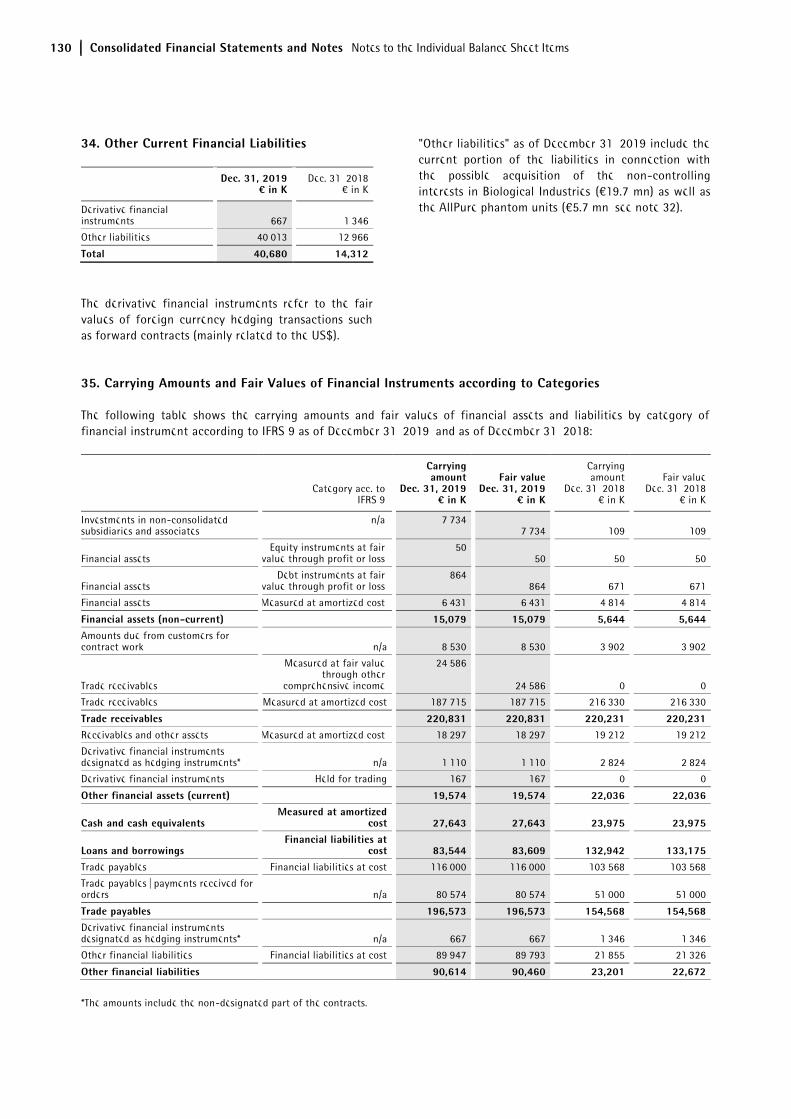
130 Consolidated Financial Statements and Notes Notes to the Individual Balance Sheet Items
34. Other Current Financial Liabilities
Dec. 31, 2019
¤ in K Dec. 31, 2018
€ in K
Derivative financial instruments 667 1,346
Other liabilities 40,013 12,966
Total 40,680 14,312
The derivative financial instruments refer to the fair values of foreign currency hedging transactions such as forward contracts (mainly related to the US$).
"Other liabilities" as of December 31, 2019 include the current portion of the liabilities in connection with the possible acquisition of the non-controlling interests in Biological Industries (€19.7 mn) as well as the AllPure phantom units (€5.7 mn, see note 32).
35. Carrying Amounts and Fair Values of Financial Instruments according to Categories
The following table shows the carrying amounts and fair values of financial assets and liabilities by category of financial instrument according to IFRS 9 as of December 31, 2019, and as of December 31, 2018:
Category acc. to
IFRS 9
Carrying amount
Dec. 31, 2019 ¤ in K
Fair value Dec. 31, 2019
¤ in K
Carrying amount
Dec. 31, 2018 € in K
Fair value Dec. 31, 2018
€ in K
Investments in non-consolidated subsidiaries and associates
n/a 7,734 7,734 109 109
Financial assets Equity instruments at fair
value through profit or loss 50
50 50 50
Financial assets Debt instruments at fair
value through profit or loss 864
864 671 671
Financial assets Measured at amortized cost 6,431 6,431 4,814 4,814
Financial assets (non-current) 15,079 15,079 5,644 5,644 Amounts due from customers for contract work n/a 8,530 8,530 3,902 3,902
Trade receivables
Measured at fair value through other
comprehensive income
24,586
24,586 0 0
Trade receivables Measured at amortized cost 187,715 187,715 216,330 216,330
Trade receivables 220,831 220,831 220,231 220,231 Receivables and other assets Measured at amortized cost 18,297 18,297 19,212 19,212
Derivative financial instruments designated as hedging instruments* n/a 1,110 1,110 2,824 2,824
Derivative financial instruments Held for trading 167 167 0 0
Other financial assets (current) 19,574 19,574 22,036 22,036
Cash and cash equivalents Measured at amortized
cost 27,643 27,643 23,975 23,975
Loans and borrowings Financial liabilities at
cost 83,544 83,609 132,942 133,175 Trade payables Financial liabilities at cost 116,000 116,000 103,568 103,568
Trade payables | payments received for orders n/a 80,574 80,574 51,000 51,000
Trade payables 196,573 196,573 154,568 154,568 Derivative financial instruments designated as hedging instruments* n/a 667 667 1,346 1,346
Other financial liabilities Financial liabilities at cost 89,947 89,793 21,855 21,326
Other financial liabilities 90,614 90,460 23,201 22,672
*The amounts include the non-designated part of the contracts.
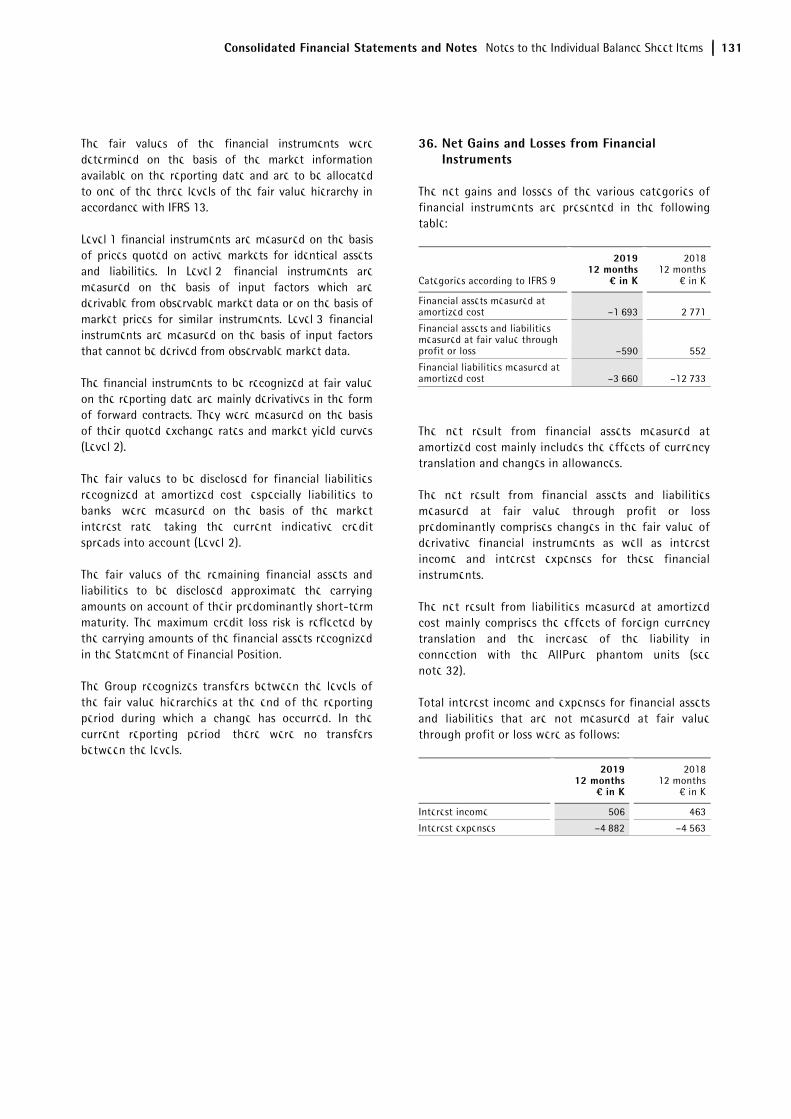
Consolidated Financial Statements and Notes Notes to the Individual Balance Sheet Items 131
The fair values of the financial instruments were determined on the basis of the market information available on the reporting date and are to be allocated to one of the three levels of the fair value hierarchy in accordance with IFRS 13.
Level 1 financial instruments are measured on the basis of prices quoted on active markets for identical assets and liabilities. In Level 2, financial instruments are measured on the basis of input factors which are derivable from observable market data or on the basis of market prices for similar instruments. Level 3 financial instruments are measured on the basis of input factors that cannot be derived from observable market data.
The financial instruments to be recognized at fair value on the reporting date are mainly derivatives in the form of forward contracts. They were measured on the basis of their quoted exchange rates and market yield curves (Level 2).
The fair values to be disclosed for financial liabilities recognized at amortized cost, especially liabilities to banks, were measured on the basis of the market interest rate, taking the current indicative credit spreads into account (Level 2).
The fair values of the remaining financial assets and liabilities to be disclosed approximate the carrying amounts on account of their predominantly short-term maturity. The maximum credit loss risk is reflected by the carrying amounts of the financial assets recognized in the Statement of Financial Position.
The Group recognizes transfers between the levels of the fair value hierarchies at the end of the reporting period during which a change has occurred. In the current reporting period, there were no transfers between the levels.
36. Net Gains and Losses from Financial Instruments
The net gains and losses of the various categories of financial instruments are presented in the following table:
Categories according to IFRS 9
2019 12 months
¤ in K
2018 12 months
€ in K
Financial assets measured at amortized cost –1,693 2,771
Financial assets and liabilities measured at fair value through profit or loss –590 552
Financial liabilities measured at amortized cost –3,660 –12,733
The net result from financial assets measured at amortized cost mainly includes the effects of currency translation and changes in allowances.
The net result from financial assets and liabilities measured at fair value through profit or loss predominantly comprises changes in the fair value of derivative financial instruments as well as interest income and interest expenses for these financial instruments.
The net result from liabilities measured at amortized cost mainly comprises the effects of foreign currency translation and the increase of the liability in connection with the AllPure phantom units (see note 32).
Total interest income and expenses for financial assets and liabilities that are not measured at fair value through profit or loss were as follows:
2019 12 months
¤ in K
2018 12 months
€ in K
Interest income 506 463
Interest expenses –4,882 –4,563
132 Consolidated Financial Statements and Notes Notes to the Individual Balance Sheet Items
Capital and Financial Risk Management
Capital Risk Management
In the Sartorius Stedim Biotech Group, capital is managed in order to maximize earnings of those participating in the company by optimizing the ratio of equity to liabilities. Furthermore, we ensure that all Group companies operate under the premise of the going-concern principle.
The financial liabilities detailed above are regarded as managed capital and, furthermore, so are the cash and cash equivalents as well as equity capital.
Goals of Financial Risk Management
The Treasury Department of the Sartorius Stedim Biotech Group is centrally focused in Sartorius Corporate Administration GmbH, a subsidiary of Sartorius AG. This centralized Treasury Department performs services for all companies of the Sartorius Group, including the Sartorius Stedim Biotech Group, and coordinates access to national and international financial markets. In addition, the Treasury Department monitors and controls financial risks by internal risk reporting, which analyzes risks according to their degree and scope. Essentially, these risks entail currency, interest rate and liquidity risks as well as credit risks.
The Sartorius Stedim Biotech Group strives to minimize the impact of currency and interest rate risks using appropriate derivative financial instruments. Hedging transactions and their controlling are carried out by different staff members. Moreover, the Group’s Internal Auditing Department regularly monitors the use of such financial instruments. Trading with derivative financial instruments is done for hedging purposes only.
37. Management of Exchange Rate Risks and Hedge Accounting
The Group is exposed to currency risks as more than one third of sales revenue is generated in U.S. dollars or currencies linked to the U.S. dollar and, to a lesser extent, in other foreign currencies. At the same time, the Group is able to compensate the major part of the revenues denominated in foreign currencies with costs incurred in the same currencies due its global production network. The share of revenues generated in foreign currencies that exceeds such costs, the so-called net currency exposure, is hedged with derivative financial instruments to a large extent (generally 70% to 80%). The Group generally follows a rolling hedging strategy of up to 12 months in advance. Also, the hedging measures are reviewed at regular intervals in order to adapt them to currency fluctuations.
For currency hedging, forward contracts are used. Forward contracts secure the right, and simultaneously create the obligation, to sell an established foreign currency amount on the exercise date at a specific exchange rate against the euro, independently of the exchange rate actually valid on this date. The profit or loss resulting from the difference between the current and the previously established exchange rate is recognized as income or expense in the statement of profit or loss.
At the balance sheet date, forward contracts have been carried out in an amount of $120 million (2018: $137 million) to hedge against the risk of fluctuation in the EUR | USD exchange rate. This amount covers roughly half of the expected net exposure for the U.S. dollar within the period of 12 months. Furthermore, other foreign currencies have been hedged in smaller volumes.
Moreover, the currency risk associated with the financing of the announced acquisition of selected Danaher Life Science businesses was hedged by the purchase of currency options with a nominal amount of $180 million. The fair value of the derivatives as of December 31, 2019 amounts to €166
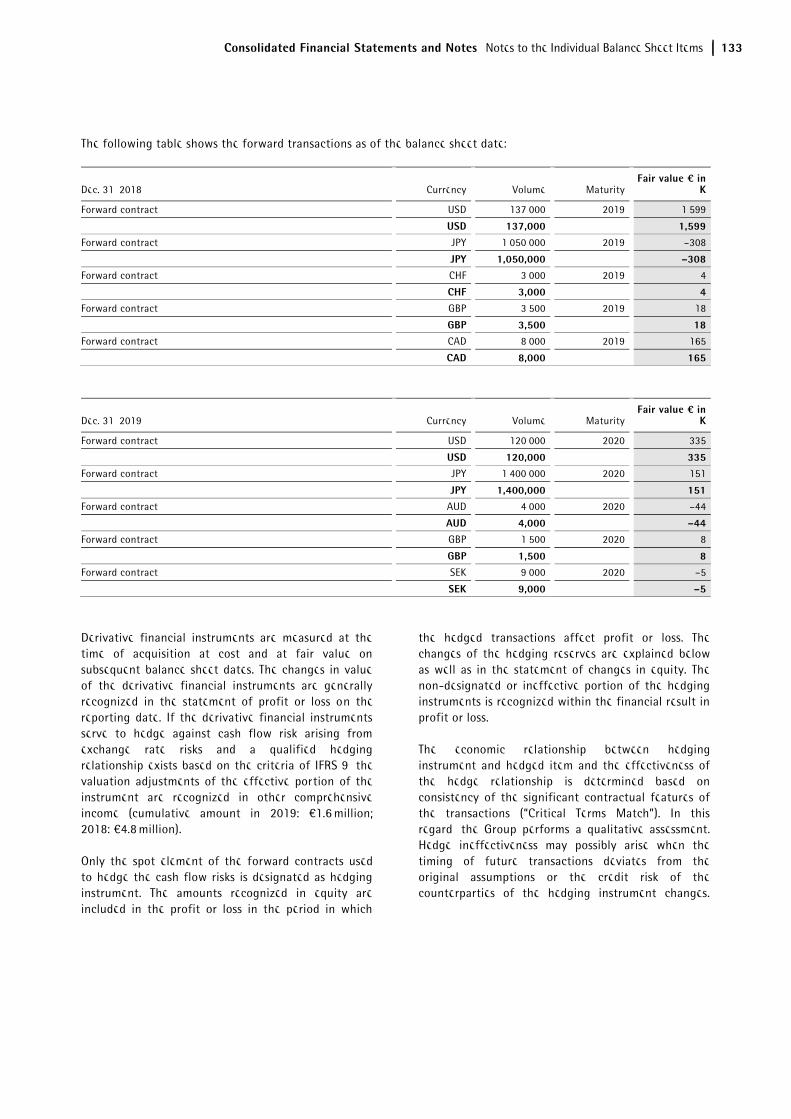
Consolidated Financial Statements and Notes Notes to the Individual Balance Sheet Items 133
The following table shows the forward transactions as of the balance sheet date:
Dec. 31, 2018 Currency Volume Maturity Fair value ¤ in
K
Forward contract USD 137,000 2019 1,599
USD 137,000 1,599 Forward contract JPY 1,050,000 2019 –308
JPY 1,050,000 –308 Forward contract CHF 3,000 2019 4
CHF 3,000 4 Forward contract GBP 3,500 2019 18
GBP 3,500 18 Forward contract CAD 8,000 2019 165
CAD 8,000 165
Dec. 31, 2019 Currency Volume Maturity Fair value ¤ in
K
Forward contract USD 120,000 2020 335
USD 120,000 335 Forward contract JPY 1,400,000 2020 151
JPY 1,400,000 151 Forward contract AUD 4,000 2020 –44
AUD 4,000 –44 Forward contract GBP 1,500 2020 8
GBP 1,500 8 Forward contract SEK 9,000 2020 –5
SEK 9,000 –5
Derivative financial instruments are measured at the time of acquisition at cost and at fair value on subsequent balance sheet dates. The changes in value of the derivative financial instruments are generally recognized in the statement of profit or loss on the reporting date. If the derivative financial instruments serve to hedge against cash flow risk arising from exchange rate risks and a qualified hedging relationship exists based on the criteria of IFRS 9, the valuation adjustments of the effective portion of the instrument are recognized in other comprehensive income (cumulative amount in 2019: €1.6 million; 2018: €4.8 million).
Only the spot element of the forward contracts used to hedge the cash flow risks is designated as hedging instrument. The amounts recognized in equity are included in the profit or loss in the period in which
the hedged transactions affect profit or loss. The changes of the hedging reserves are explained below as well as in the statement of changes in equity. The non-designated or ineffective portion of the hedging instruments is recognized within the financial result in profit or loss.
The economic relationship between hedging instrument and hedged item and the effectiveness of the hedge relationship is determined based on consistency of the significant contractual features of the transactions (“Critical Terms Match”). In this regard, the Group performs a qualitative assessment. Hedge ineffectiveness may possibly arise when the timing of future transactions deviates from the original assumptions or the credit risk of the counterparties of the hedging instrument changes.
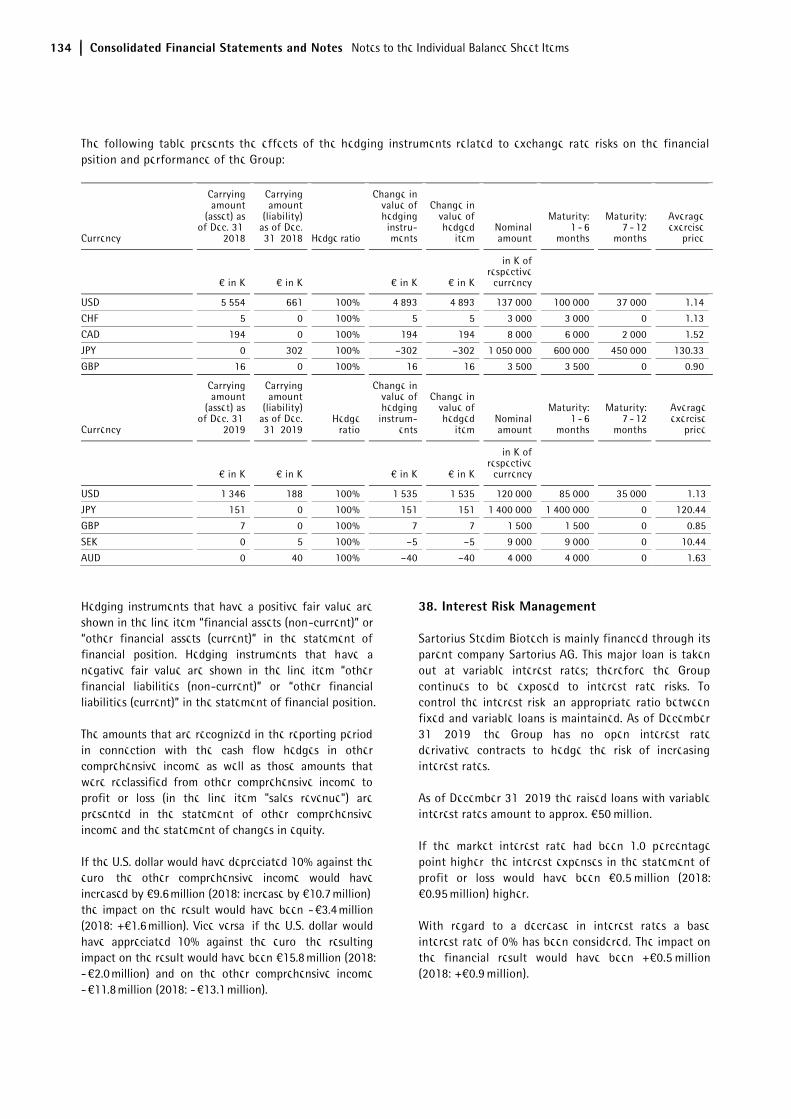
134 Consolidated Financial Statements and Notes Notes to the Individual Balance Sheet Items
The following table presents the effects of the hedging instruments related to exchange rate risks on the financial psition and performance of the Group:
Currency
Carrying amount
(asset) as of Dec. 31,
2018
Carrying amount
(liability) as of Dec. 31, 2018 Hedge ratio
Change in value of hedging instru-ments
Change in value of hedged
item Nominal amount
Maturity: 1 - 6
months
Maturity: 7 - 12
months
Average exercise
price
€ in K € in K € in K € in K
in K of respective
currency
USD 5,554 661 100% 4,893 4,893 137,000 100,000 37,000 1.14
CHF 5 0 100% 5 5 3,000 3,000 0 1.13
CAD 194 0 100% 194 194 8,000 6,000 2,000 1.52
JPY 0 302 100% –302 –302 1,050,000 600,000 450,000 130.33
GBP 16 0 100% 16 16 3,500 3,500 0 0.90
Currency
Carrying amount
(asset) as of Dec. 31,
2019
Carrying amount
(liability) as of Dec. 31, 2019
Hedge ratio
Change in value of hedging
instrum-ents
Change in value of hedged
item Nominal amount
Maturity: 1 - 6
months
Maturity: 7 - 12
months
Average exercise
price
€ in K € in K € in K € in K
in K of respective
currency
USD 1,346 188 100% 1,535 1,535 120,000 85,000 35,000 1.13
JPY 151 0 100% 151 151 1,400,000 1,400,000 0 120.44
GBP 7 0 100% 7 7 1,500 1,500 0 0.85
SEK 0 5 100% –5 –5 9,000 9,000 0 10.44
AUD 0 40 100% –40 –40 4,000 4,000 0 1.63
Hedging instruments that have a positive fair value are shown in the line item “financial assets (non-current)” or “other financial assets (current)” in the statement of financial position. Hedging instruments that have a negative fair value are shown in the line item “other financial liabilities (non-current)” or “other financial liabilities (current)” in the statement of financial position.
The amounts that are recognized in the reporting period in connection with the cash flow hedges in other comprehensive income as well as those amounts that were reclassified from other comprehensive income to profit or loss (in the line item "sales revenue") are presented in the statement of other comprehensive income and the statement of changes in equity.
If the U.S. dollar would have depreciated 10% against the euro, the other comprehensive income would have increased by €9.6 million (2018: increase by €10.7 million), the impact on the result would have been - €3.4 million (2018: +€1.6 million). Vice versa, if the U.S. dollar would have appreciated 10% against the euro, the resulting impact on the result would have been €15.8 million (2018: - €2.0 million) and on the other comprehensive income - €11.8 million (2018: - €13.1 million).
38. Interest Risk Management
Sartorius Stedim Biotech is mainly financed through its parent company Sartorius AG. This major loan is taken out at variable interest rates; therefore the Group continues to be exposed to interest rate risks. To control the interest risk, an appropriate ratio between fixed and variable loans is maintained. As of December 31, 2019, the Group has no open interest rate derivative contracts to hedge the risk of increasing interest rates.
As of December 31, 2019 the raised loans with variable interest rates amount to approx. €50 million.
If the market interest rate had been 1.0 percentage point higher, the interest expenses in the statement of profit or loss would have been €0.5 million (2018: €0.95 million) higher.
With regard to a decrease in interest rates a base interest rate of 0% has been considered. The impact on the financial result would have been +€0.5 million (2018: +€0.9 million).
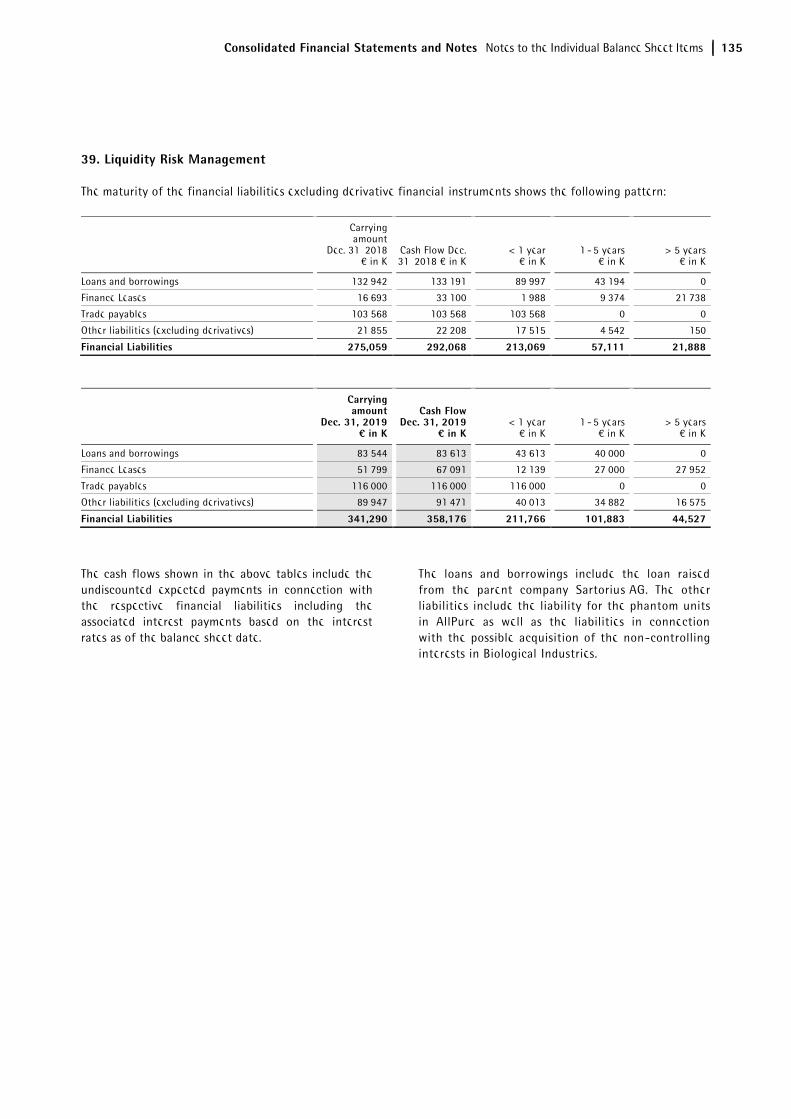
Consolidated Financial Statements and Notes Notes to the Individual Balance Sheet Items 135
39. Liquidity Risk Management
The maturity of the financial liabilities excluding derivative financial instruments shows the following pattern:
Carrying amount
Dec. 31, 2019 ¤ in K
Cash Flow Dec. 31, 2019
¤ in K < 1 year
€ in K 1 - 5 years
€ in K > 5 years
€ in K
Loans and borrowings 83,544 83,613 43,613 40,000 0
Finance Leases 51,799 67,091 12,139 27,000 27,952
Trade payables 116,000 116,000 116,000 0 0
Other liabilities (excluding derivatives) 89,947 91,471 40,013 34,882 16,575
Financial Liabilities 341,290 358,176 211,766 101,883 44,527
The cash flows shown in the above tables include the undiscounted expected payments in connection with the respective financial liabilities including the associated interest payments based on the interest rates as of the balance sheet date.
The loans and borrowings include the loan raised from the parent company Sartorius AG. The other liabilities include the liability for the phantom units in AllPure as well as the liabilities in connection with the possible acquisition of the non-controlling interests in Biological Industries.
Carrying amount
Dec. 31, 2018 € in K
Cash Flow Dec. 31, 2018 € in K
< 1 year € in K
1 - 5 years € in K
> 5 years € in K
Loans and borrowings 132,942 133,191 89,997 43,194 0
Finance Leases 16,693 33,100 1,988 9,374 21,738
Trade payables 103,568 103,568 103,568 0 0
Other liabilities (excluding derivatives) 21,855 22,208 17,515 4,542 150
Financial Liabilities 275,059 292,068 213,069 57,111 21,888
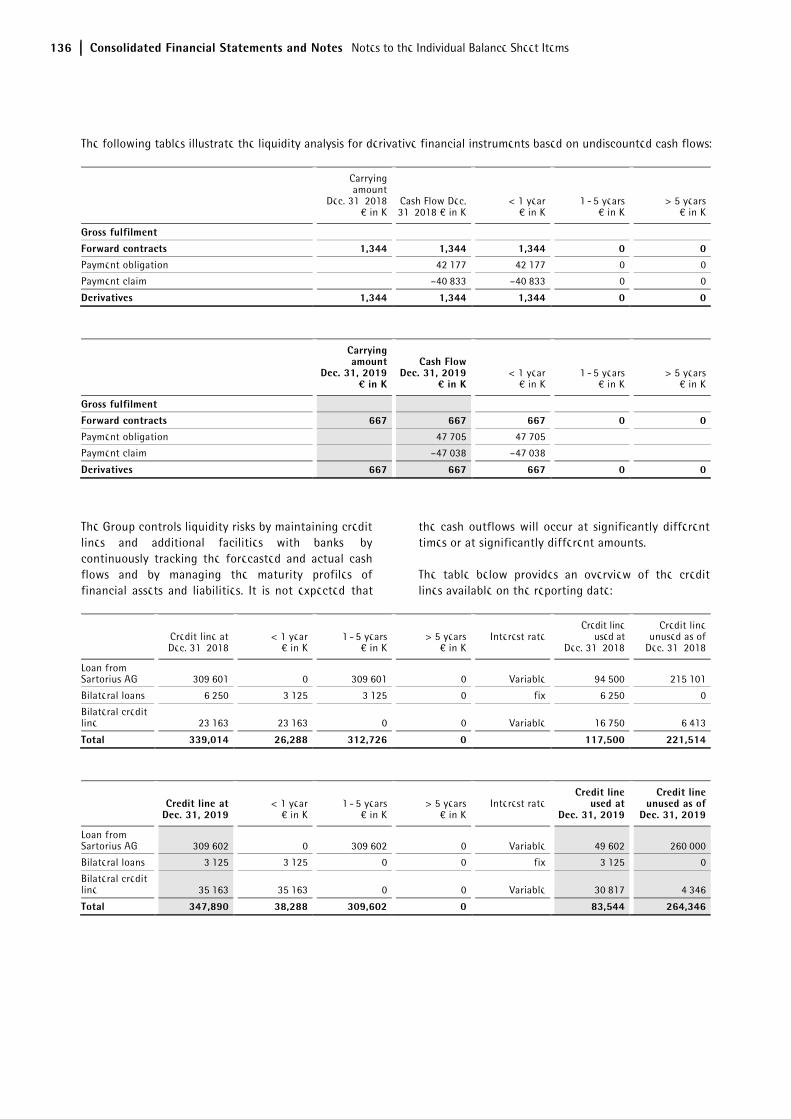
136 Consolidated Financial Statements and Notes Notes to the Individual Balance Sheet Items
The following tables illustrate the liquidity analysis for derivative financial instruments based on undiscounted cash flows:
Carrying amount
Dec. 31, 2018 € in K
Cash Flow Dec. 31, 2018 € in K
< 1 year € in K
1 - 5 years € in K
> 5 years € in K
Gross fulfilment Forward contracts 1,344 1,344 1,344 0 0 Payment obligation 42,177 42,177 0 0
Payment claim –40,833 –40,833 0 0
Derivatives 1,344 1,344 1,344 0 0
Carrying amount
Dec. 31, 2019 ¤ in K
Cash Flow Dec. 31, 2019
¤ in K < 1 year
€ in K 1 - 5 years
€ in K > 5 years
€ in K
Gross fulfilment Forward contracts 667 667 667 0 0 Payment obligation 47,705 47,705
Payment claim –47,038 –47,038
Derivatives 667 667 667 0 0
The Group controls liquidity risks by maintaining credit lines and additional facilities with banks, by continuously tracking the forecasted and actual cash flows and by managing the maturity profiles of financial assets and liabilities. It is not expected that
the cash outflows will occur at significantly different times or at significantly different amounts.
The table below provides an overview of the credit lines available on the reporting date:
Credit line at Dec. 31, 2018
< 1 year € in K
1 - 5 years € in K
> 5 years € in K
Interest rate
Credit line used at
Dec. 31, 2018
Credit line unused as of
Dec. 31, 2018
Loan from Sartorius AG 309,601 0 309,601 0 Variable 94,500 215,101
Bilateral loans 6,250 3,125 3,125 0 fix 6,250 0
Bilateral credit line 23,163 23,163 0 0 Variable 16,750 6,413
Total 339,014 26,288 312,726 0 117,500 221,514
Credit line at
Dec. 31, 2019 < 1 year
€ in K 1 - 5 years
€ in K > 5 years
€ in K Interest rate
Credit line used at
Dec. 31, 2019
Credit line unused as of
Dec. 31, 2019
Loan from Sartorius AG 309,602 0 309,602 0 Variable 49,602 260,000
Bilateral loans 3,125 3,125 0 0 fix 3,125 0
Bilateral credit line 35,163 35,163 0 0 Variable 30,817 4,346
Total 347,890 38,288 309,602 0 83,544 264,346
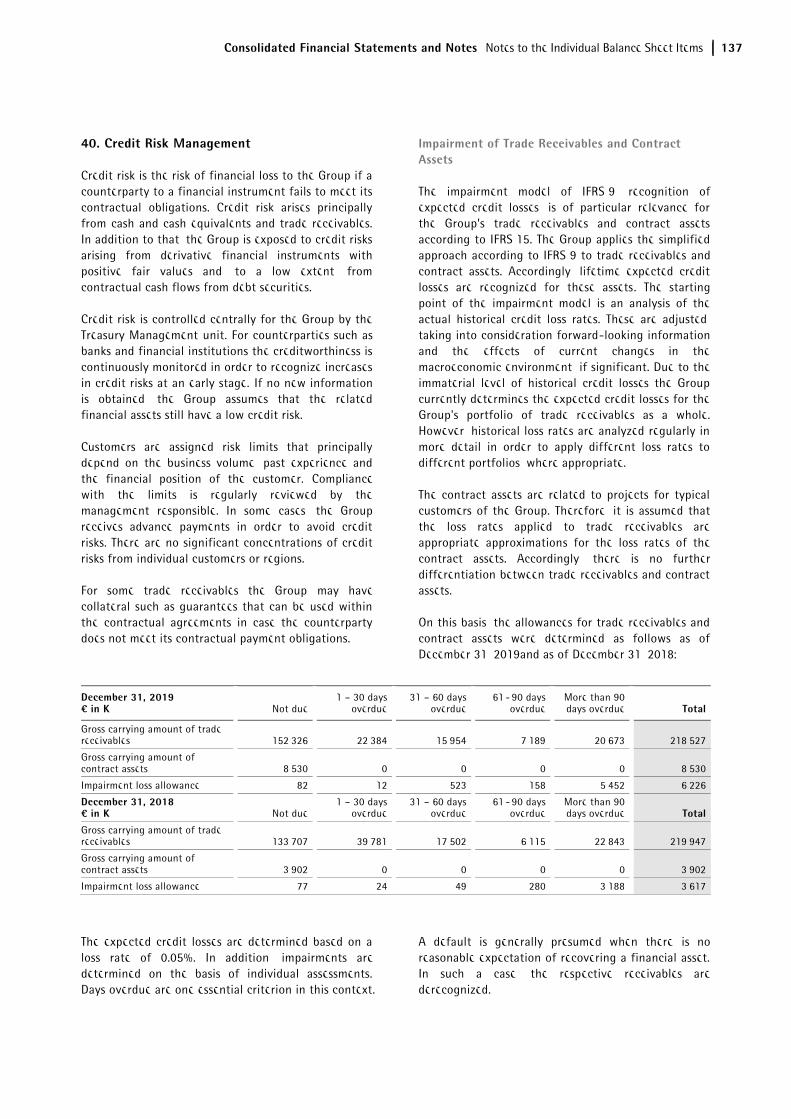
Consolidated Financial Statements and Notes Notes to the Individual Balance Sheet Items 137
40. Credit Risk Management
Credit risk is the risk of financial loss to the Group if a counterparty to a financial instrument fails to meet its contractual obligations. Credit risk arises principally from cash and cash equivalents and trade receivables. In addition to that, the Group is exposed to credit risks arising from derivative financial instruments with positive fair values and, to a low extent, from contractual cash flows from debt securities.
Credit risk is controlled centrally for the Group by the Treasury Management unit. For counterparties such as banks and financial institutions the creditworthiness is continuously monitored in order to recognize increases in credit risks at an early stage. If no new information is obtained, the Group assumes that the related financial assets still have a low credit risk.
Customers are assigned risk limits that principally depend on the business volume, past experience and the financial position of the customer. Compliance with the limits is regularly reviewed by the management responsible. In some cases, the Group receives advance payments in order to avoid credit risks. There are no significant concentrations of credit risks from individual customers or regions.
For some trade receivables the Group may have collateral such as guarantees that can be used within the contractual agreements in case the counterparty does not meet its contractual payment obligations.
Impairment of Trade Receivables and Contract Assets
The impairment model of IFRS 9, recognition of expected credit losses, is of particular relevance for the Group’s trade receivables and contract assets according to IFRS 15. The Group applies the simplified approach according to IFRS 9 to trade receivables and contract assets. Accordingly, lifetime expected credit losses are recognized for these assets. The starting point of the impairment model is an analysis of the actual historical credit loss rates. These are adjusted, taking into consideration forward-looking information and the effects of current changes in the macroeconomic environment, if significant. Due to the immaterial level of historical credit losses the Group currently determines the expected credit losses for the Group's portfolio of trade receivables as a whole. However, historical loss rates are analyzed regularly in more detail in order to apply different loss rates to different portfolios, where appropriate.
The contract assets are related to projects for typical customers of the Group. Therefore, it is assumed that the loss rates applied to trade receivables are appropriate approximations for the loss rates of the contract assets. Accordingly, there is no further differentiation between trade receivables and contract assets.
On this basis, the allowances for trade receivables and contract assets were determined as follows as of December 31, 2019and as of December 31, 2018:
December 31, 2019 ¤ in K Not due
1 – 30 days overdue
31 – 60 days overdue
61 - 90 days overdue
More than 90 days overdue Total
Gross carrying amount of trade receivables 152,326 22,384 15,954 7,189 20,673 218,527
Gross carrying amount of contract assets 8,530 0 0 0 0 8,530
Impairment loss allowance 82 12 523 158 5,452 6,226
December 31, 2018 ¤ in K Not due
1 – 30 days overdue
31 – 60 days overdue
61 - 90 days overdue
More than 90 days overdue Total
Gross carrying amount of trade receivables 133,707 39,781 17,502 6,115 22,843 219,947
Gross carrying amount of contract assets 3,902 0 0 0 0 3,902
Impairment loss allowance 77 24 49 280 3,188 3,617
The expected credit losses are determined based on a loss rate of 0.05%. In addition, impairments are determined on the basis of individual assessments. Days overdue are one essential criterion in this context.
A default is generally presumed when there is no reasonable expectation of recovering a financial asset. In such a case, the respective receivables are derecognized.
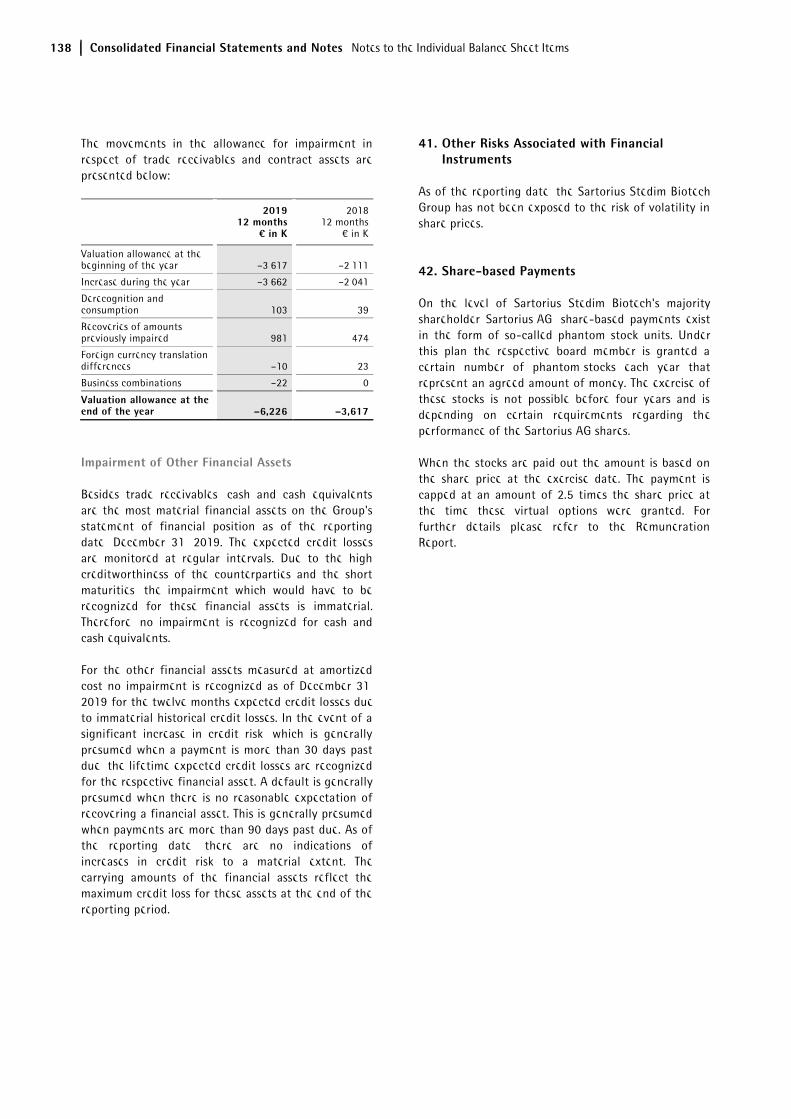
138 Consolidated Financial Statements and Notes Notes to the Individual Balance Sheet Items
The movements in the allowance for impairment in respect of trade receivables and contract assets are presented below:
2019 12 months
¤ in K
2018 12 months
€ in K
Valuation allowance at the beginning of the year –3,617 –2,111
Increase during the year –3,662 –2,041
Derecognition and consumption 103 39
Recoveries of amounts previously impaired 981 474
Foreign currency translation differences –10 23
Business combinations –22 0
Valuation allowance at the end of the year –6,226 –3,617
Impairment of Other Financial Assets
Besides trade receivables, cash and cash equivalents are the most material financial assets on the Group's statement of financial position as of the reporting date, December 31, 2019. The expected credit losses are monitored at regular intervals. Due to the high creditworthiness of the counterparties and the short maturities, the impairment which would have to be recognized for these financial assets is immaterial. Therefore, no impairment is recognized for cash and cash equivalents.
For the other financial assets measured at amortized cost no impairment is recognized as of December 31, 2019 for the twelve months expected credit losses due to immaterial historical credit losses. In the event of a significant increase in credit risk, which is generally presumed when a payment is more than 30 days past due, the lifetime expected credit losses are recognized for the respective financial asset. A default is generally presumed when there is no reasonable expectation of recovering a financial asset. This is generally presumed when payments are more than 90 days past due. As of the reporting date, there are no indications of increases in credit risk to a material extent. The carrying amounts of the financial assets reflect the maximum credit loss for these assets at the end of the reporting period.
41. Other Risks Associated with Financial Instruments
As of the reporting date, the Sartorius Stedim Biotech Group has not been exposed to the risk of volatility in share prices.
42. Share-based Payments
On the level of Sartorius Stedim Biotech's majority shareholder Sartorius AG, share-based payments exist in the form of so-called phantom stock units. Under this plan the respective board member is granted a certain number of phantom stocks each year that represent an agreed amount of money. The exercise of these stocks is not possible before four years and is depending on certain requirements regarding the performance of the Sartorius AG shares.
When the stocks are paid out the amount is based on the share price at the exercise date. The payment is capped at an amount of 2.5 times the share price at the time these virtual options were granted. For further details please refer to the Remuneration Report.
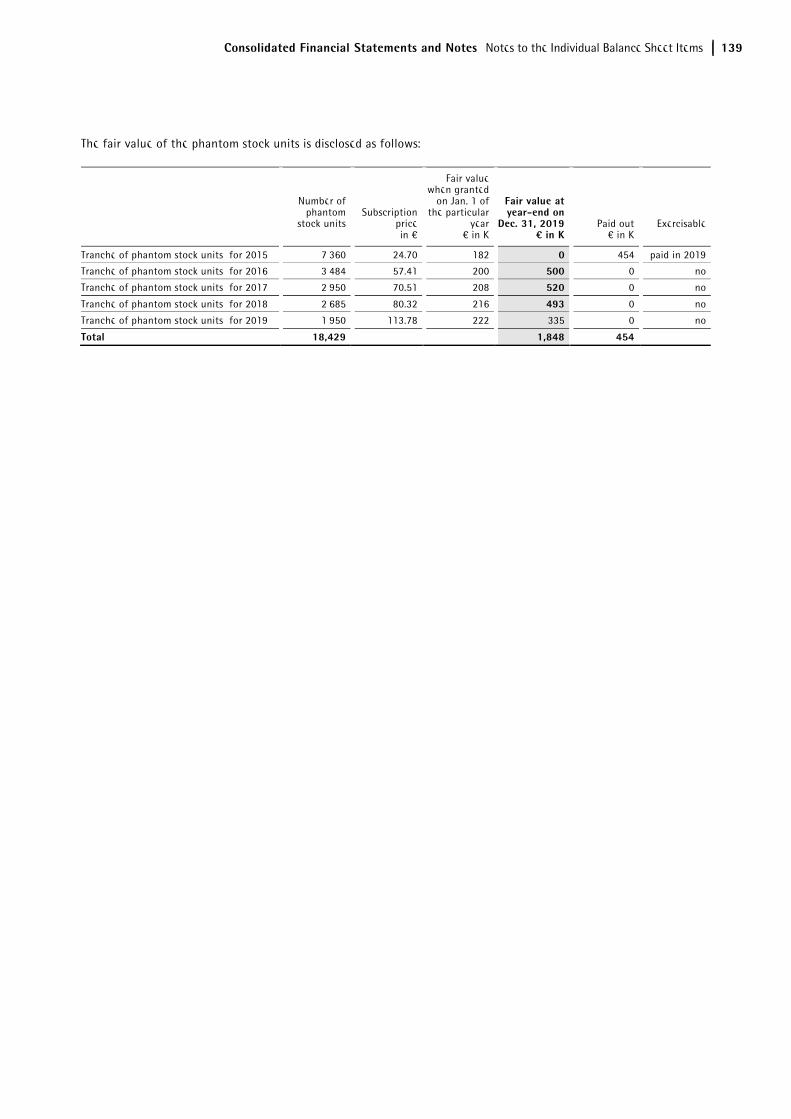
Consolidated Financial Statements and Notes Notes to the Individual Balance Sheet Items 139
The fair value of the phantom stock units is disclosed as follows:
Number of phantom
stock units
Subscription price in €
Fair value when granted
on Jan. 1 of the particular
year € in K
Fair value at year-end on
Dec. 31, 2019 ¤ in K
Paid out € in K
Exercisable
Tranche of phantom stock units for 2015 7,360 24.70 182 0 454 paid in 2019
Tranche of phantom stock units for 2016 3,484 57.41 200 500 0 no
Tranche of phantom stock units for 2017 2,950 70.51 208 520 0 no
Tranche of phantom stock units for 2018 2,685 80.32 216 493 0 no
Tranche of phantom stock units for 2019 1,950 113.78 222 335 0 no
Total 18,429 1,848 454
140 Consolidated Financial Statements and Notes Other Disclosures
The consolidated financial statements were prepared on a going concern basis.
Material Events after the Reporting Date
No material events occurred after the reporting date.
Number of Employees
The average workforce employed during the year 2019 was 5,991 (5,412 in 2018).
43. Related Parties
General
The majority shareholder of Sartorius Stedim Biotech S.A. is Sartorius AG, which holds a controlling stake in the company of 74.3% in equity capital – and 84.5% of the voting rights. The Sartorius Group itself is organized in two divisions: Bioprocess Solutions (mainly run by the Sartorius Stedim Biotech Group) and Lab Products & Services (mainly run by the other companies of Sartorius Group). This structure leads to the fact that the Group holds two subsidiaries in most of the countries and these companies partially share space, staff and other resources. Furthermore, the German group companies carry out various central functions and accordingly deliver services to the worldwide entities (e.g. IT support). The company Sartorius Corporate Administration GmbH, a 100% subsidiary of Sartorius AG has incorporated numerous Group functions like Group Finance, HR, IT, Investor Relations and Legal. These services are charged within the Group and to a significant extent also to Sartorius Stedim Biotech.
The described structures lead to various relations and transactions with related parties. Transactions between Sartorius Stedim Biotech S.A. and its subsidiaries (presented in note 7) have been eliminated on consolidation and are not disclosed under this Note. Details of transactions between the Group and other related parties, belonging to the Sartorius Group, are disclosed below.
Sales, Purchases and Commissions
In certain business areas members of the Sartorius Group act as contract manufacturers for the Sartorius Stedim Biotech Group and vice versa. The respective transactions are carried out at arms' length principles and are disclosed in the table below as "sales revenue" and "purchases".
Sales revenue 2019 ¤ in K
Purchases 2019 ¤ in K
Related parties of Sartorius Group 83,025 11,458
Sales revenue 2018 ¤ in K
Purchases 2018 ¤ in K
Related parties of Sartorius Group 72,221 7,061
Certain product groups of the Sartorius Stedim Biotech portfolio are sold through the sales force of other Sartorius entities. For the arranging of the sale the Sartorius Stedim Biotech Group has paid commissions in the amount of €0.4 million (€0.4 million in 2018). These commissions are typically calculated as a percentage of the generated sales revenue.
Other Disclosures
Consolidated Financial Statements and Notes Other Disclosures 141
Management Fees and Other Shareholder Costs
The Executive Board of Sartorius AG, the German parent company of Sartorius Stedim Biotech, is to a large extent also managing Sartorius Stedim Biotech Group. Two of Sartorius Stedim Biotech S.A.’s board members are also members of the Sartorius AG Executive Board. For their services to Sartorius Stedim Biotech a portion of the remuneration is charged to Sartorius Stedim Biotech S.A. (€1.0 million in 2019; €1.3 million in 2018) and charged to Sartorius Stedim Biotech GmbH (€1.2 million in 2019; €1.6 million in 2018).
Other shareholder functions like Group Financial Reporting, Compliance and Investor Relations are performed by the above mentioned Sartorius Corporate Administration GmbH in Germany. These services have been charged to Sartorius Stedim Biotech S.A. in the amount of €1.2 million (2018: €0.8 million).
Shareholder Loan
As described in note 31 the Sartorius Stedim Biotech Group has raised a loan from its parent company Sartorius AG with a credit volume of approx. €310 million and a current utilization of approx. €50 million (2018: €95 million). The interest charged is based on a variable interest rate plus an arms'-length credit margin.
Administration Charges and Shared Costs
As described above the companies in most of the countries share certain functions and costs. The underlying contracts include mainly agreements to share office space and central administrative functions, such as accounting and controlling, human resource management and IT. In this respect, the relevant companies charge rent, salaries, social security costs and other expenses for such services, as well as a pro-rated profit margin for the services they provide.
The most significant contract in this context is the one between Sartorius Stedim Biotech GmbH, Germany, and Sartorius Corporate Administration GmbH. This company provides all central service and administrative functions to Sartorius Stedim Biotech GmbH and other Group companies. The calculation for services fees typically includes a surcharge of 3% on total costs. 3% is a surcharge compliant with arm´s length principles for routine tasks, following OECD and EU guidelines. In 2019, services for approx. €56.6 million were provided to Sartorius Stedim Biotech GmbH (€53.4 million in 2018). This amount covers the following functions:
– Marketing Communication, e-Business, Business Development
– Environment, Health & Security, Factory Maintenance
– Finance, Human Resources, Information Technology
– Central Services & General Organization.
Compensation of Key Management Personnel
In 2018 and 2019, the Executive Board Management received the following remuneration:
Total
€ in K
Short-term benefits
€ in K
Post-employment benefits
€ in K
Other long-term benefits
€ in K
Termination benefits
€ in K
Share-based payments
€ in K
20191) 2,735 1,398 270 201 0 866 20181) 2,522 1,333 257 189 0 743
1) For more information please refer to the chapter Corporate Governance (See pages 61 to 94)
142 Consolidated Financial Statements and Notes Statutory Auditors' Report on the Consolidated Financial Statements
This is a translation into English of the statutory auditors’ report on the consolidated financial statements of the Company issued in French and it is provided solely for the convenience of English speaking users.
This statutory auditors’ report includes information required by European regulation and French law, such as information about the appointment of the statutory auditors or verification of the information concerning the Group presented in the management report.
This report should be read in conjunction with, and construed in accordance with, French law and professional auditing standards applicable in France
For the year ended 31 December 2019
To the Shareholders of SARTORIUS STEDIM BIOTECH S.A.,
Opinion
In compliance with the assignment entrusted to us by your shareholders’ meetings, we have audited the accompanying consolidated financial statements of SARTORIUS STEDIM BIOTECH S.A. for the year ended 31 December 2019.
In our opinion, the consolidated financial statements give a true and fair view of the assets and liabilities and of the financial position of the Group as at 31 December 2019 and of the results of its operations for the year then ended in accordance with International Financial Reporting Standards as adopted by the European Union.
The audit opinion expressed above is consistent with our report to the Audit Committee.
Basis for Opinion
Audit Framework
We conducted our audit in accordance with professional standards applicable in France. We believe that the audit evidence we have obtained is sufficient and appropriate to provide a basis for our opinion.
Our responsibilities under those standards are further described in the Statutory Auditors’ Responsibilities for the Audit of the Consolidated Financial Statements section of our report.
Independence
We conducted our audit engagement in compliance with independence rules applicable to us, for the period from 1 January 2019 to the date of our report and specifically we did not provide any prohibited non-audit services referred to in Article 5(1) of Regulation (EU) No 537/2014 or in the French Code of ethics (code de déontologie) for statutory auditors.
Emphasis of Matter
We draw attention to the following matter described in Note 18 to the consolidated financial statements which sets out the change of accounting method relating to the application of IFRS 16 "Leases" as of January 1, 2019. Our opinion is not modified in respect of this matter.
Justification of Assessments - Key Audit Matters
In accordance with the requirements of Articles L.823-9 and R.823-7 of the French Commercial Code (code de commerce) relating to the justification of our assessments, we inform you of the key audit matters relating to risks of material misstatement that, in our professional judgment, were of most significance in our audit of the consolidated financial statements of the current period, as well as how we addressed those risks.
These matters were addressed in the context of our audit of the consolidated financial statements as a whole, and in forming our opinion thereon, and we do not provide a separate opinion on specific items of the consolidated financial statements.
Statutory Auditors' Report on the Consolidated Financial Statements
Consolidated Financial Statements and Notes Statutory Auditors' Report on the Consolidated Financial Statements 143
Goodwill valuation – Impairment test
Identified risk
As of 31 December 31 2019, goodwill amounts to 426.9 M€, or 23.4% of total consolidated assets.
As described in Note 5 to the consolidated financial statements, SARTORIUS STEDIM BIOTECH is an "integrated solution provider" for its customers, and as a result there is only one operating segment from a product and customer perspective: "Biopharm ". In addition, as indicated in Note 16 to the consolidated financial statements, because of the interdependence of the market in which your group operates, the lowest level at which goodwill can be allocated is the Biopharm segment. The goodwill has therefore been fully allocated to the Cash Generating Units (C.G.U.) corresponding to the Biopharm segment.
Goodwill is subject to an annual impairment test and whenever there are indicators of impairment in accordance with the methods and assumptions described in Notes 3 and 16 to the consolidated financial statements. In particular, in view of what has been described above, the impairment test is carried out at the level of the Biopharm segment.
We considered that the determination of the value of goodwill is a key point of our audit given its significance in the consolidated financial statements of your group, and because the determination of the recoverable amount taken into account in the impairment test on the basis of the value in use of the C.G.U. requires the use of estimates and assumptions (including future cash flows, perpetual revenue growth rates and the discount rate) that require significant management judgment.
Responses obtained during our audit
We obtained the impairment test from the C.G.U. group corresponding to the Biopharm segment as well as the forecasts underlying the calculation (4-year plan).
We reviewed the compliance of the company's methodology in accordance with applicable accounting standards.
We also performed a critical analysis of how the company has implemented this methodology, including the following procedures:
– Assess the reasonableness of the key assumptions used to determine the cash flow of the Biopharm
segment as well as that used for the perpetual growth rate;
– Assess, with the support of our valuation specialists, the discount rate used by management. We compared this rate with our own estimates and analysed its various constituent components;
– Check the arithmetical accuracy of the impairment test performed by your group.
We have also obtained and assessed the sensitivity analyses carried out by management, as shown in Note 16 of the notes to the consolidated financial statements. As a result, we were able to verify that only an extremely large change in the main assumptions could lead to the recognition of an impairment of goodwill.
Lastly, we verified the appropriateness of the information provided in Notes 3 and 16 to the consolidated financial statements.
Specific verifications
We have also performed, in accordance with professional standards applicable in France, the specific verifications required by laws and regulations of the information given in the Group’s management report of the Board of Directors.
We have no matters to report as to its fair presentation and its consistency with the consolidated financial statements.
Report on Other Legal and Regulatory Requirements
Appointment of the Statutory Auditors
We were appointed as statutory auditors of SARTORIUS STEDIM BIOTECH S.A. by the annual general meeting held on 7 April 7 2015 for KPMG S.A. and on 19 May 2006 for Deloitte & Associés.
As at 31 December 2019, KPMG S.A. was in its 5th year of the audit mandate without interruption and Deloitte & Associés was in its 14th year.
144 Consolidated Financial Statements and Notes Statutory Auditors' Report on the Consolidated Financial Statements
Responsibilities of Management and Those Charged with Governance for the Consolidated Financial Statements
Management is responsible for the preparation and fair presentation of the consolidated financial statements in accordance with International Financial Reporting Standards as adopted by the European Union and for such internal control as management determines is necessary to enable the preparation of consolidated financial statements that are free from material misstatement, whether due to fraud or error.
In preparing the consolidated financial statements, management is responsible for assessing the Company’s ability to continue as a going concern, disclosing, as applicable, matters related to going concern and using the going concern basis of accounting unless it is expected to liquidate the Company or to cease operations.
The Audit Committee is responsible for monitoring the financial reporting process and the effectiveness of internal control and risks management systems and where applicable, its internal audit, regarding the accounting and financial reporting procedures.
The consolidated financial statements were approved by the Board of Directors
Statutory Auditors’ Responsibilities for the Audit of the Consolidated Financial Statements
Objectives and audit approach
Our role is to issue a report on the consolidated financial statements. Our objective is to obtain reasonable assurance about whether the consolidated financial statements as a whole are free from material misstatement. Reasonable assurance is a high level of assurance, but is not a guarantee that an audit conducted in accordance with professional standards will always detect a material misstatement when it exists. Misstatements can arise from fraud or error and are considered material if, individually or in the aggregate, they could reasonably be expected to influence the economic decisions of users taken on the basis of these consolidated financial statements.
As specified in Article L.823-10-1 of the French Commercial Code (code de commerce), our statutory audit does not include assurance on the viability of the Company or the quality of management of the affairs of the Company.
As part of an audit conducted in accordance with professional standards applicable in France, the statutory auditor exercises professional judgment throughout the audit and furthermore:
– Identifies and assesses the risks of material misstatement of the consolidated financial statements, whether due to fraud or error, designs and performs audit procedures responsive to those risks, and obtains audit evidence considered to be sufficient and appropriate to provide a basis for his opinion. The risk of not detecting a material misstatement resulting from fraud is higher than for one resulting from error, as fraud may involve collusion, forgery, intentional omissions, misrepresentations, or the override of internal control.
– Obtains an understanding of internal control relevant to the audit in order to design audit procedures that are appropriate in the circumstances, but not for the purpose of expressing an opinion on the effectiveness of the internal control. Evaluates the appropriateness of accounting policies used and the reasonableness of accounting estimates and related disclosures made by management in the consolidated financial statements. Assesses the appropriateness of management’s use of the going concern basis of accounting and, based on the audit evidence obtained, whether a material uncertainty exists related to events or conditions that may cast significant doubt on the Company’s ability to continue as a going concern. This assessment is based on the audit evidence obtained up to the date of his audit report. However, future events or conditions may cause the Company to cease to continue as a going concern. If the statutory auditor concludes that a material uncertainty exists, there is a requirement to draw attention in the audit report to the related disclosures in the consolidated financial statements or, if such disclosures are not provided or inadequate, to modify the opinion expressed therein.
– Evaluates the overall presentation of the consolidated financial statements and assesses whether these statements represent the underlying transactions and events in a manner that achieves fair presentation.
– Obtains sufficient appropriate audit evidence regarding the financial information of the entities or business activities within the Group to express an opinion on the consolidated financial statements. The statutory auditor is responsible for the direction, supervision and performance of the audit of the consolidated financial statements and for the opinion expressed on these consolidated financial statements.
Consolidated Financial Statements and Notes Statutory Auditors' Report on the Consolidated Financial Statements 145
Report to the Audit Committee
We submit a report to the Audit Committee which includes in particular a description of the scope of the audit and the audit program implemented, as well as the results of our audit. We also report, if any, significant deficiencies in internal control regarding the accounting and financial reporting procedures that we have identified.
Our report to the Audit Committee includes the risks of material misstatement that, in our professional judgment, were of most significance in the audit of the consolidated financial statements of the current period and which are therefore the key audit matters, that we are required to describe in this audit report.
We also provide the Audit Committee with the declaration provided for in Article 6 of Regulation (EU) N° 537/2014, confirming our independence within the meaning of the rules applicable in France such as they are set in particular by Articles L.822-10 to L.822-14 of the French Commercial Code (code de commerce) and in the French Code of Ethics (code de déontologie) for statutory auditors. Where appropriate, we discuss with the Audit Committee the risks that may reasonably be thought to bear on our independence, and the related safeguards.
Marseille, 7 February 2020
The Statutory Auditors
French original signed by
KPMG Audit Deloitte & Associés A division of KPMG S.A.
John Evans Philippe Battisti