Embed Size (px)
Citation preview
Commonwealth of Australia
CONSOLIDATED FINANCIAL STATEMENTS FOR THE YEAR ENDED 30 JUNE 2015
CIRCULATED BY
SENATOR THE HONOURABLE MATHIAS CORMANN MINISTER FOR FINANCE OF THE COMMONWEALTH OF AUSTRALIA DECEMBER 2015
© Commonwealth of Australia 2015
ISSN 2205-9008 (print) 2205-9016 (online)
This publication is available for your use under a Creative Commons Attribution 3.0 Australia licence, with the exception of the Commonwealth Coat of Arms, the Department of Finance logo, photographs, images, signatures and where otherwise stated. The full licence terms are available from http://creativecommons.org/ licenses/by/3.0/au/legalcode.
Use of Department of Finance material under a Creative Commons Attribution 3.0 Australia licence requires you to attribute the work (but not in any way that suggests that the Treasury endorses you or your use of the work).
Department of Finance material used ‘as supplied’.
Provided you have not modified or transformed Department of Finance material in any way including, for example, by changing the Department of Finance text; calculating percentage changes; graphing or charting data; or deriving new statistics from published Treasury statistics — then Department of Finance prefers the following attribution:
Source: The Australian Government Department of Finance.
Derivative material
If you have modified or transformed Department of Finance material, or derived new material from those of the Department of Finance in any way, then Department of Finance prefers the following attribution:
Based on The Australian Government Department of Finance data.
Use of the Coat of Arms
The terms under which the Coat of Arms can be used are set out on the It’s an Honour website (see www.itsanhonour.gov.au).
Internet
The Consolidated Financial Statements are available on the Department of Finance website at: www.finance.gov.au.
Printed by Canprint Communications Pty Ltd.
iii
CONTENTS
PREFACE ......................................................................................................... 1
COMMENTARY ON THE FINANCIAL STATEMENTS ................................................. 3 Introduction .................................................................................................................... 5 Discussion and analysis ................................................................................................ 7
CONSOLIDATED FINANCIAL STATEMENTS, INCLUDING THE AUSTRALIAN GOVERNMENT (WHOLE OF GOVERNMENT) AND GENERAL GOVERNMENT SECTOR FINANCIAL REPORTS......................................................................... 33 Independent audit report ............................................................................................. 35 Statement of compliance ............................................................................................. 38 Australian Government operating statement .............................................................. 39 Australian Government balance sheet ........................................................................ 41 Australian Government cash flow statement .............................................................. 42 Australian Government statement of changes in equity ............................................. 43
SECTOR STATEMENTS .................................................................................... 45 Australian Government operating statement by sector –
including General Government Sector Financial Report ........................... 47 Australian Government balance sheet by sector –
including General Government Sector Financial Report ........................... 49 Australian Government cash flow statement by sector –
including General Government Sector Financial Report ........................... 52 Australian Government statement of changes in equity –
General Government Sector ..................................................................... 54
NOTES TO THE FINANCIAL STATEMENTS .......................................................... 55

1
PREFACE I am pleased to present the Consolidated Financial Statements (CFS) for the Australian Government for the financial year ended 30 June 2015. The CFS presents the whole of government and general government sector (GGS) financial reports. It consolidates the audited accounts of 184 entities across the public sector.
The CFS has been prepared in accordance with the regulations of the Public Governance, Performance and Accountability Act 2013 (the PGPA Act) and applicable Australian Accounting Standards (AAS), including the requirements of AASB 1049 Whole of Government and General Government Sector Financial Reporting (AASB 1049). The CFS shows the results of the Australian Government’s financial performance and cash flows for the year ended 30 June 2015 and the Australian Government’s financial position as at 30 June 2015.
The Preface and the Commentary should be read in light of the information and explanations provided in the CFS.
Fiscal balance The Australian Government fiscal balance for the year ended 30 June 2015 was a deficit of $46.5 billion. For the year ended 30 June 2014, the Australian Government reported a fiscal balance deficit of $43.3 billion.
Australian Government taxation revenue increased by $6.7 billion (1.9 per cent) in 2014-15, reflecting an increase in taxes from individuals, customs duty and sales, offset by a decrease in carbon price revenue, company tax and excise duty. Non-taxation revenue increased by $2.7 billion (8.8 per cent).
Australian Government expenses increased by $15.9 billion (3.8 per cent) in 2014-15. This was mainly driven by an $8.7 billion increase in current and capital transfers, a $5.3 billion increase in operating expenses, a $1.2 billion increase in interest expenses and a $0.8 billion increase in superannuation interest expenses.
The increase in current and capital transfers was due largely to an increase of $5.5 billion in current and capital grants and $4.0 billion in personal benefits, partially offset by a $0.9 billion decrease in subsidy expenses.
Within operating expenses, supply of goods and services increased by $4.6 billion, depreciation and amortisation increased by $0.7 billion, and superannuation expenses increased by $0.4 billion, partially offset by smaller movements in other line items.
In addition, the Australian Government’s net acquisition of non-financial assets decreased by $3.4 billion.
Preface
2
Balance sheet The Australian Government’s net worth was negative $309.0 billion at 30 June 2015. As at 30 June 2014, the Australian Government’s net worth was negative $264.7 billion.
The Australian Government’s financial assets increased by $34.6 billion (9.8 per cent) in 2014-15. Total non-financial assets increased by $8.7 billion (6.3 per cent).
The Australian Government’s liabilities increased by $87.5 billion (11.6 per cent) to $841.3 billion. The increase is primarily as a result of an increase in interest bearing liabilities of $57.9 billion (14.6 per cent) which includes a $57.4 billion increase in the value of Australian Government Securities. Provisions and payables increased by $29.6 billion (8.3 per cent) mainly due to an increase in the superannuation liability of $26.6 billion.
Cash flow The Australian Government recorded a cash deficit of $37.6 billion in 2014-15 from operating activities and investing activities in non-financial assets. The closing cash position was $4.8 billion.
Contingent liabilities, contingent assets and risks Contingent liabilities and contingent assets for the Australian Government are not disclosed in the balance sheet but are set out in detail in Note 12A. Analysis of interest rate, foreign currency, default and other risks that could potentially impact on the Australian Government’s financial position is included in Note 12B.
Final Budget Outcome Under the Charter of Budget Honesty Act 1998 (the Charter), the Australian Government is also required to publicly release and table a Final Budget Outcome (FBO) report no later than three months after the end of the financial year. The FBO for the 2014-15 financial year was released by the Treasurer and I on 21 September 2015. The FBO is unaudited but is derived from materially audit-cleared financial statements. Under the Charter, the FBO must be based on external reporting standards; including AAS and the concepts and classifications set out in Government Finance Statistics (GFS), with any departures from those standards to be documented.
I would like to thank the many Australian Government employees whose efforts have contributed to the completion of the 2014-15 CFS.
Senator the Hon Mathias Cormann Minister for Finance

COMMENTARY ON THE FINANCIAL STATEMENTS


Commentary on the financial statements
5
INTRODUCTION
The 2014-15 Consolidated Financial Statements (CFS) for the Australian Government are required by section 48 of the Public Governance, Performance and Accountability Act 2013 (PGPA Act)1. The CFS present the whole of government and general government sector (GGS) financial reports and are prepared in accordance with AASB 1049 Whole of Government and General Government Sector Financial Reporting (AASB 1049).
The financial report includes consolidated results for all Australian Government controlled entities as well as disaggregated information on the sectors of government (GGS, public non-financial corporations (PNFC) and public financial corporations (PFC) sectors).2 The institutional structure of the public sector is explained in Note 1. Note 16 provides the list of Australian Government controlled reporting entities, including their sectoral classification.
AT A GLANCE
Table 1: Financial results for the year ended 30 June (2010-11 to 2014-15) 2010-11
$b2011-12
$b2012-13
$b2013-14
$b2014-15
$bRevenue 322.3 350.4 370.4 378.9 388.2
Expenses 368.0 389.8 393.9 413.1 429.0
Net capital investment 6.7 6.9 4.5 9.0 5.6
Fiscal balance (52.4) (46.3) (28.0) (43.3) (46.5)Total assets 377.0 390.6 430.9 489.0 532.3
Total liabilities 480.2 647.4 641.4 753.8 841.3
Net worth (103.1) (256.9) (210.5) (264.7) (309.0)Operating activities (33.7) (29.6) (10.3) (27.5) (24.9)
Investing activities in non-financial assets (11.5) (12.5) (9.2) (12.5) (12.7)
Cash surplus/(deficit) (45.2) (42.1) (19.5) (40.0) (37.6)
1 The Financial Management and Accountability Act 1997 was replaced by the PGPA Act on 1 July 2014.
2 Unless explicitly stated, the financial results reported in this commentary comprise consolidated amounts for the Australian Government as a whole, inclusive of the GGS, PNFC and PFC sectors. The balances and movements detailed in the commentary have been rounded to the nearest tenth of a billion. Discrepancies between totals and sums of components are due to rounding.
Commentary on the financial statements
6
The Australian Government financial results for 2014-15 were as follows:
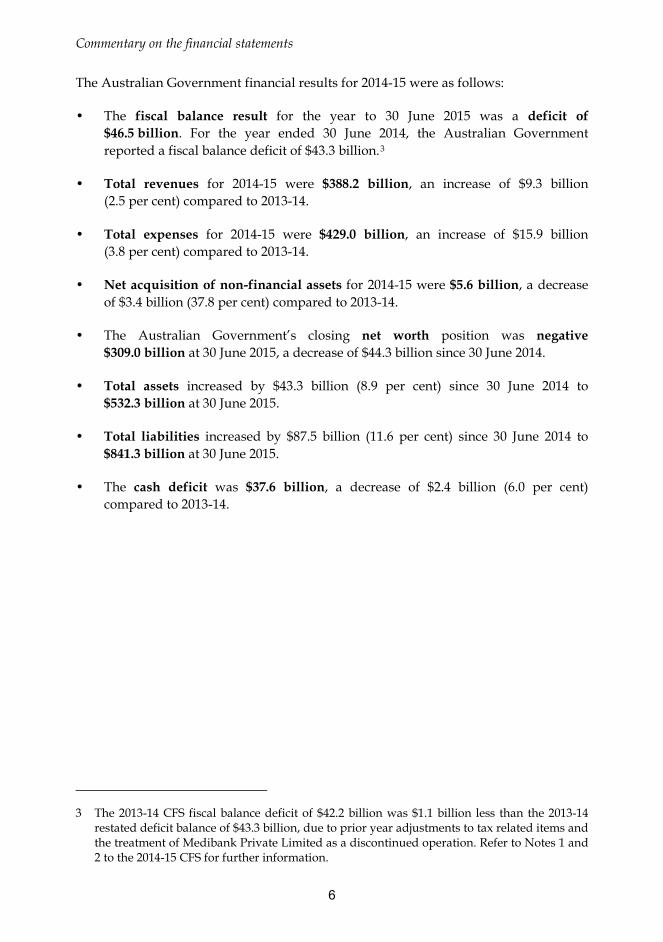
• The fiscal balance result for the year to 30 June 2015 was a deficit of $46.5 billion. For the year ended 30 June 2014, the Australian Government reported a fiscal balance deficit of $43.3 billion.3
• Total revenues for 2014-15 were $388.2 billion, an increase of $9.3 billion (2.5 per cent) compared to 2013-14.
• Total expenses for 2014-15 were $429.0 billion, an increase of $15.9 billion (3.8 per cent) compared to 2013-14.
• Net acquisition of non-financial assets for 2014-15 were $5.6 billion, a decrease of $3.4 billion (37.8 per cent) compared to 2013-14.
• The Australian Government’s closing net worth position was negative $309.0 billion at 30 June 2015, a decrease of $44.3 billion since 30 June 2014.
• Total assets increased by $43.3 billion (8.9 per cent) since 30 June 2014 to $532.3 billion at 30 June 2015.
• Total liabilities increased by $87.5 billion (11.6 per cent) since 30 June 2014 to $841.3 billion at 30 June 2015.
• The cash deficit was $37.6 billion, a decrease of $2.4 billion (6.0 per cent) compared to 2013-14.
3 The 2013-14 CFS fiscal balance deficit of $42.2 billion was $1.1 billion less than the 2013-14 restated deficit balance of $43.3 billion, due to prior year adjustments to tax related items and the treatment of Medibank Private Limited as a discontinued operation. Refer to Notes 1 and 2 to the 2014-15 CFS for further information.
Commentary on the financial statements
7
DISCUSSION AND ANALYSIS
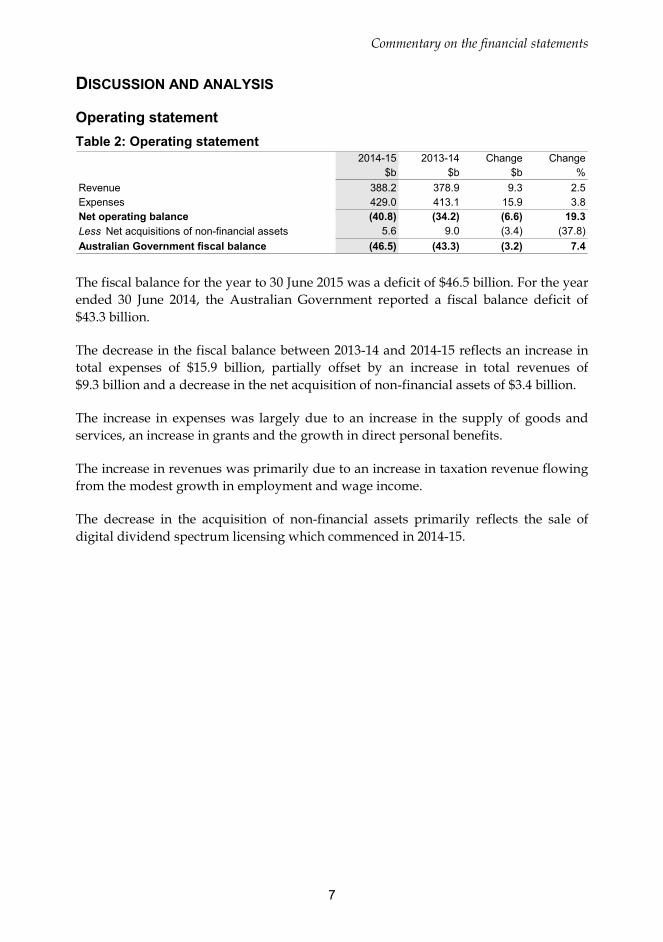
Operating statement Table 2: Operating statement
2014-15 2013-14 Change Change$b $b $b %
Revenue 388.2 378.9 9.3 2.5Expenses 429.0 413.1 15.9 3.8Net operating balance (40.8) (34.2) (6.6) 19.3Less Net acquisitions of non-financial assets 5.6 9.0 (3.4) (37.8)Australian Government fiscal balance (46.5) (43.3) (3.2) 7.4 The fiscal balance for the year to 30 June 2015 was a deficit of $46.5 billion. For the year ended 30 June 2014, the Australian Government reported a fiscal balance deficit of $43.3 billion.
The decrease in the fiscal balance between 2013-14 and 2014-15 reflects an increase in total expenses of $15.9 billion, partially offset by an increase in total revenues of $9.3 billion and a decrease in the net acquisition of non-financial assets of $3.4 billion.
The increase in expenses was largely due to an increase in the supply of goods and services, an increase in grants and the growth in direct personal benefits.
The increase in revenues was primarily due to an increase in taxation revenue flowing from the modest growth in employment and wage income.
The decrease in the acquisition of non-financial assets primarily reflects the sale of digital dividend spectrum licensing which commenced in 2014-15.
Commentary on the financial statements
8
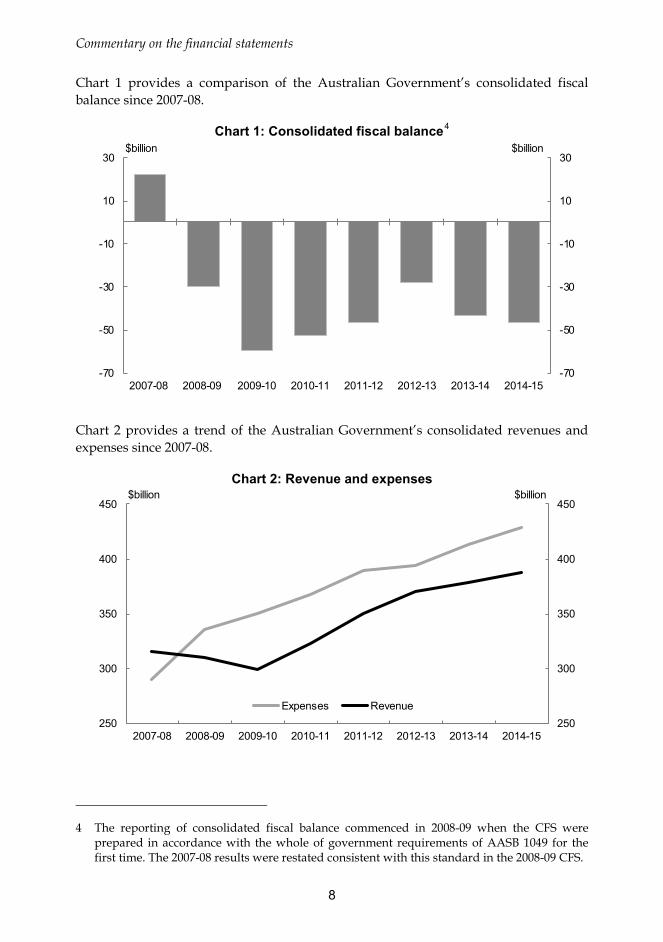
Chart 1 provides a comparison of the Australian Government’s consolidated fiscal balance since 2007-08.
Chart 1: Consolidated fiscal balance4
-70
-50
-30
-10
10
30
-70
-50
-30
-10
10
30
2007-08 2008-09 2009-10 2010-11 2011-12 2012-13 2013-14 2014-15
$billion$billion
Chart 2 provides a trend of the Australian Government’s consolidated revenues and expenses since 2007-08.
Chart 2: Revenue and expenses
250
300
350
400
450
250
300
350
400
450
2007-08 2008-09 2009-10 2010-11 2011-12 2012-13 2013-14 2014-15
$billion$billion
Expenses Revenue
4 The reporting of consolidated fiscal balance commenced in 2008-09 when the CFS were prepared in accordance with the whole of government requirements of AASB 1049 for the first time. The 2007-08 results were restated consistent with this standard in the 2008-09 CFS.
Commentary on the financial statements
9
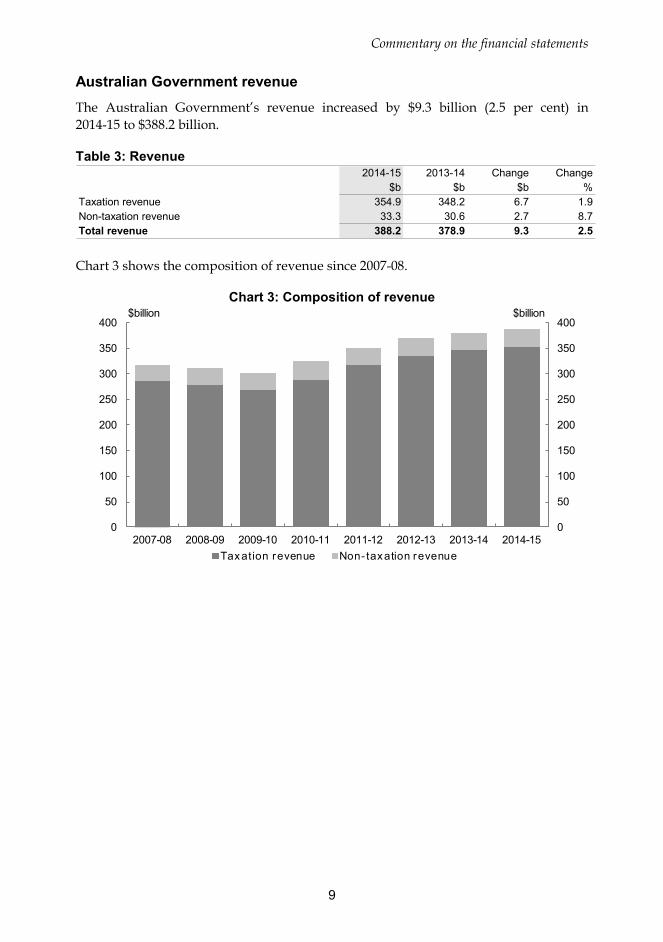
Australian Government revenue The Australian Government’s revenue increased by $9.3 billion (2.5 per cent) in 2014-15 to $388.2 billion.
Table 3: Revenue 2014-15 2013-14 Change Change
$b $b $b %Taxation revenue 354.9 348.2 6.7 1.9Non-taxation revenue 33.3 30.6 2.7 8.7Total revenue 388.2 378.9 9.3 2.5 Chart 3 shows the composition of revenue since 2007-08.
Chart 3: Composition of revenue
0
50
100
150
200
250
300
350
400
0
50
100
150
200
250
300
350
400
2007-08 2008-09 2009-10 2010-11 2011-12 2012-13 2013-14 2014-15
$billion$billion
Taxation revenue Non- taxation revenue

Commentary on the financial statements
10
Taxation revenue The Australian Government total taxation revenue for the year ended on 30 June 2015 was $354.9 billion. The composition of taxation revenue is shown in Chart 4 below.
Chart 4: Composition of taxation revenue
Individuals and other withholding taxation
51%
Company tax19%
Sales taxes16%
Customs duty 3%
Excise duty7%
Other*4%
*Other includes superannuation funds ($5.9 billion), fringe benefits tax ($4.4 billion), other — indirect taxation ($3.8 billion) and resource rent tax ($1.4 billion).
Table 4: Australian Government — taxation revenue 2014-15 2013-14 Change Change
$b $b $b %Income taxation
Individuals and other withholding taxation 181.2 167.2 14.0 8.4Company tax 65.9 68.5 (2.6) (3.8)Fringe benefits tax 4.4 4.3 0.1 2.3Superannuation funds 5.9 6.1 (0.2) (3.3)Resource rent taxes 1.4 1.8 (0.4) (22.2)
Total income taxation 258.8 247.9 10.9 4.4Sales taxes 57.8 56.8 1.0 1.8Excise duty 23.7 25.6 (1.9) (7.4)Customs duty 10.9 9.3 1.6 17.2Carbon pricing mechanism 0.0 4.7 (4.7) (100.0)Other - indirect taxation 3.8 3.8 0.0 0.0
Total taxation revenue 354.9 348.2 6.7 1.9
Commentary on the financial statements
11
Taxation revenue increased by $6.7 billion (1.9 per cent) to $354.9 billion. The key movements in taxation revenue from 2013-14 to 2014-15 were:
• an increase of $14.0 billion (8.4 per cent) from individuals and other withholding taxation. The growth in individuals and other withholding taxation is broadly consistent with conditions in the labour market;
• a decrease of $4.7 billion (100.0 per cent) in the carbon pricing mechanism as a result of the carbon tax being repealed;
• a decrease of $2.6 billion (3.8 per cent) from company tax. This was due to weaker corporate profitability, as well as lower commodity prices affecting the mining sector;
• a decrease in excise duty of $1.9 billion (7.4 per cent) and a corresponding increase in customs duty of $1.6 billion (17.2 per cent) as a result of a greater share of tobacco products being cleared through Customs; and
• an increase of $1.0 billion (1.8 per cent) in sales taxes, with the main contributor being a $0.9 billion increase in goods and services tax (GST), consistent with growth in consumption subject to GST.
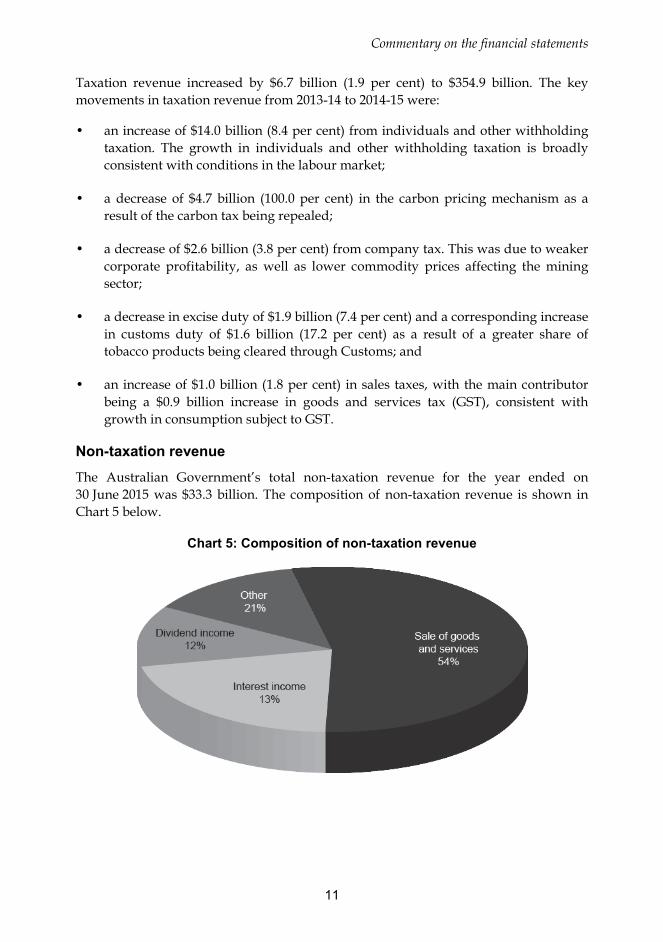
Non-taxation revenue The Australian Government’s total non-taxation revenue for the year ended on 30 June 2015 was $33.3 billion. The composition of non-taxation revenue is shown in Chart 5 below.
Chart 5: Composition of non-taxation revenue
Commentary on the financial statements
12
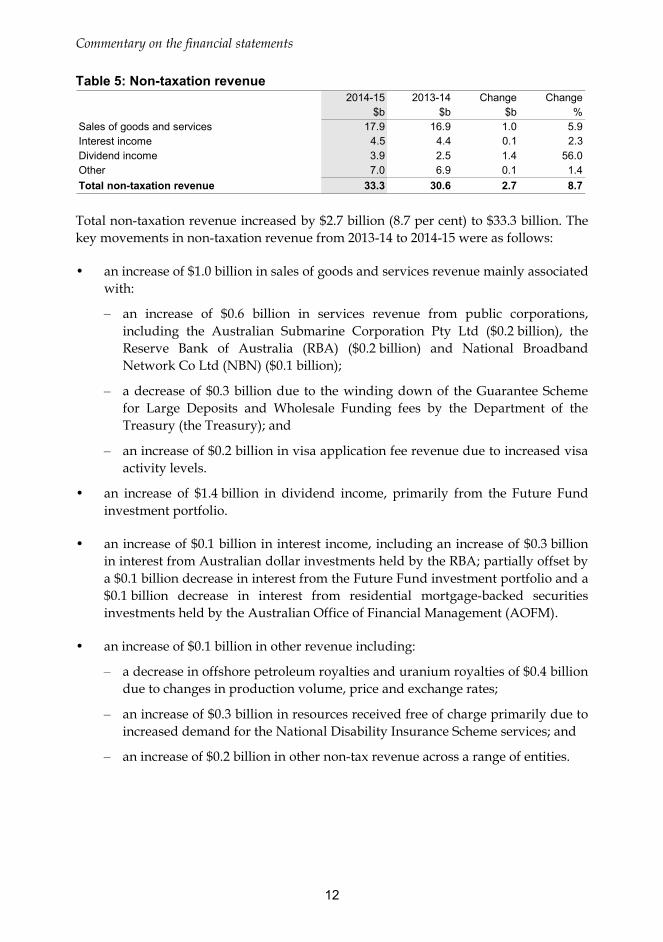
Table 5: Non-taxation revenue 2014-15 2013-14 Change Change
$b $b $b %Sales of goods and services 17.9 16.9 1.0 5.9Interest income 4.5 4.4 0.1 2.3Dividend income 3.9 2.5 1.4 56.0Other 7.0 6.9 0.1 1.4Total non-taxation revenue 33.3 30.6 2.7 8.7 Total non-taxation revenue increased by $2.7 billion (8.7 per cent) to $33.3 billion. The key movements in non-taxation revenue from 2013-14 to 2014-15 were as follows:
• an increase of $1.0 billion in sales of goods and services revenue mainly associated with:
– an increase of $0.6 billion in services revenue from public corporations, including the Australian Submarine Corporation Pty Ltd ($0.2 billion), the Reserve Bank of Australia (RBA) ($0.2 billion) and National Broadband Network Co Ltd (NBN) ($0.1 billion);
– a decrease of $0.3 billion due to the winding down of the Guarantee Scheme for Large Deposits and Wholesale Funding fees by the Department of the Treasury (the Treasury); and
– an increase of $0.2 billion in visa application fee revenue due to increased visa activity levels.
• an increase of $1.4 billion in dividend income, primarily from the Future Fund investment portfolio.
• an increase of $0.1 billion in interest income, including an increase of $0.3 billion in interest from Australian dollar investments held by the RBA; partially offset by a $0.1 billion decrease in interest from the Future Fund investment portfolio and a $0.1 billion decrease in interest from residential mortgage-backed securities investments held by the Australian Office of Financial Management (AOFM).
• an increase of $0.1 billion in other revenue including:
– a decrease in offshore petroleum royalties and uranium royalties of $0.4 billion due to changes in production volume, price and exchange rates;
– an increase of $0.3 billion in resources received free of charge primarily due to increased demand for the National Disability Insurance Scheme services; and
– an increase of $0.2 billion in other non-tax revenue across a range of entities.
Commentary on the financial statements
13
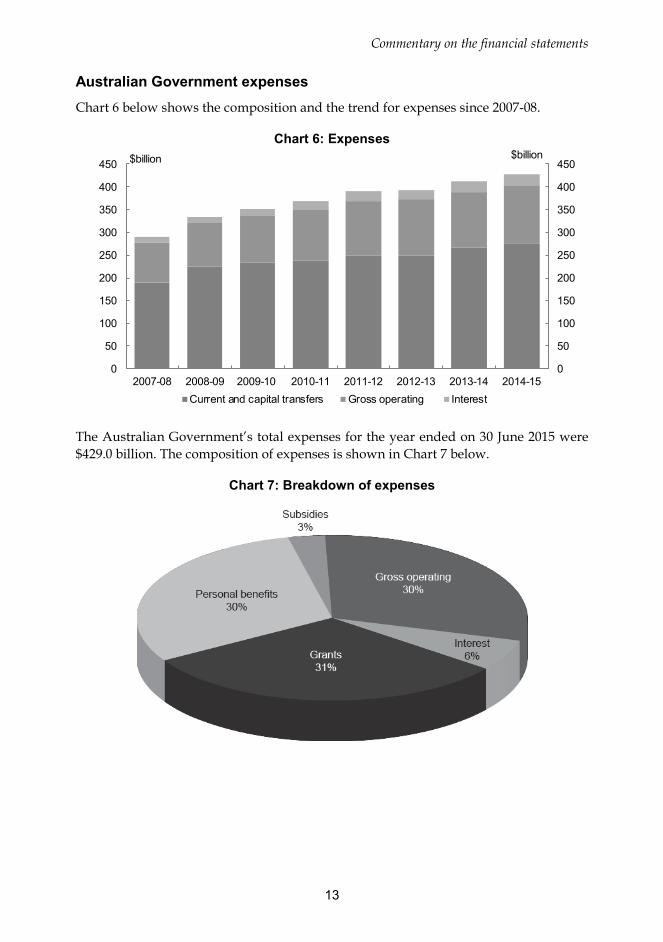
Australian Government expenses Chart 6 below shows the composition and the trend for expenses since 2007-08.
Chart 6: Expenses
0
50
100
150
200
250
300
350
400
450
0
50
100
150
200
250
300
350
400
450
2007-08 2008-09 2009-10 2010-11 2011-12 2012-13 2013-14 2014-15
$billion
Current and capital transfers Gross operating Interest
$billion
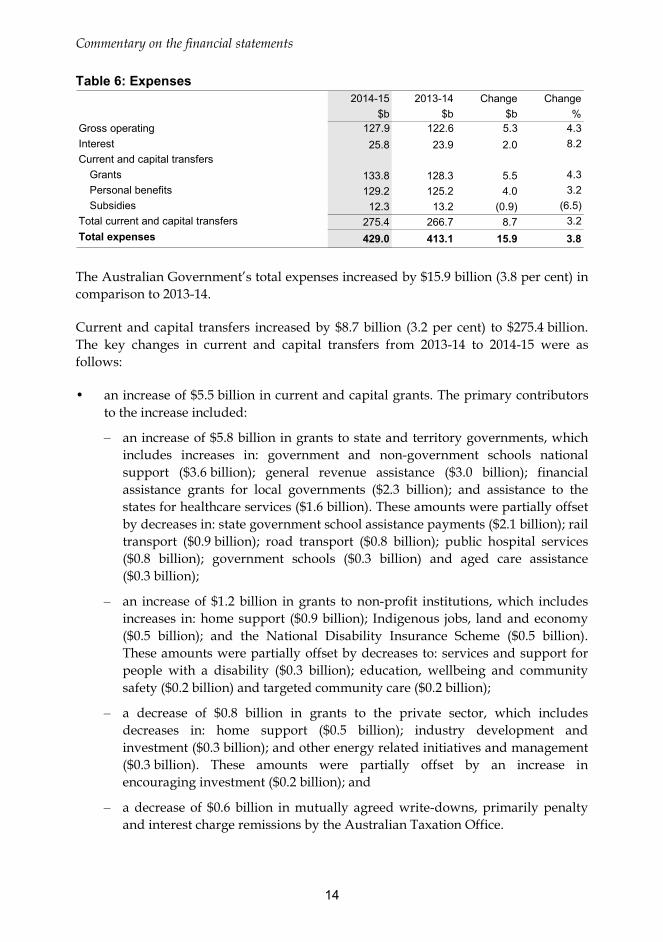
The Australian Government’s total expenses for the year ended on 30 June 2015 were $429.0 billion. The composition of expenses is shown in Chart 7 below.
Chart 7: Breakdown of expenses
Commentary on the financial statements
14
Table 6: Expenses 2014-15 2013-14 Change Change
$b $b $b %Gross operating 127.9 122.6 5.3 4.3Interest 25.8 23.9 2.0 8.2Current and capital transfers
Grants 133.8 128.3 5.5 4.3Personal benefits 129.2 125.2 4.0 3.2Subsidies 12.3 13.2 (0.9) (6.5)
Total current and capital transfers 275.4 266.7 8.7 3.2Total expenses 429.0 413.1 15.9 3.8 The Australian Government’s total expenses increased by $15.9 billion (3.8 per cent) in comparison to 2013-14.
Current and capital transfers increased by $8.7 billion (3.2 per cent) to $275.4 billion. The key changes in current and capital transfers from 2013-14 to 2014-15 were as follows:
• an increase of $5.5 billion in current and capital grants. The primary contributors to the increase included:
– an increase of $5.8 billion in grants to state and territory governments, which includes increases in: government and non-government schools national support ($3.6 billion); general revenue assistance ($3.0 billion); financial assistance grants for local governments ($2.3 billion); and assistance to the states for healthcare services ($1.6 billion). These amounts were partially offset by decreases in: state government school assistance payments ($2.1 billion); rail transport ($0.9 billion); road transport ($0.8 billion); public hospital services ($0.8 billion); government schools ($0.3 billion) and aged care assistance ($0.3 billion);
– an increase of $1.2 billion in grants to non-profit institutions, which includes increases in: home support ($0.9 billion); Indigenous jobs, land and economy ($0.5 billion); and the National Disability Insurance Scheme ($0.5 billion). These amounts were partially offset by decreases to: services and support for people with a disability ($0.3 billion); education, wellbeing and community safety ($0.2 billion) and targeted community care ($0.2 billion);
– a decrease of $0.8 billion in grants to the private sector, which includes decreases in: home support ($0.5 billion); industry development and investment ($0.3 billion); and other energy related initiatives and management ($0.3 billion). These amounts were partially offset by an increase in encouraging investment ($0.2 billion); and
– a decrease of $0.6 billion in mutually agreed write-downs, primarily penalty and interest charge remissions by the Australian Taxation Office.
Commentary on the financial statements
15
• an increase of $4.0 billion in personal benefits expense. This includes increases in: the age pension ($2.2 billion); child care benefits ($1.2 billion); and student payments ($0.8 billion).
• a decrease of $0.9 billion in subsidy expenses primarily as a result of the repeal of the carbon tax ($1.2 billion), partially offset by increases for the fuel tax credit scheme ($0.3 billion) and stronger uptake of the research and development tax incentive ($0.2 billion).
Gross operating expenses increased by $5.3 billion (4.3 per cent) to $127.9 billion. The key changes in gross operating expenses from 2013-14 to 2014-15 were as follows:
• the supply of goods and services expense increased by $4.6 billion, including increases in: Defence related expenditure ($1.0 billion); Medicare services ($0.9 billion); child care rebate ($0.8 billion); residential and flexible care ($0.8 billion); disability and carers ($0.7 billion); dental services ($0.3 billion), and public corporations, including Australia Post ($0.2 billion) and NBN ($0.2 billion). These increases were partially offset by a $0.5 billion decrease, which was driven by the closure of several detention centres.
• depreciation and amortisation expenses increased by $0.7 billion consistent with the increase in non-financial assets.
• the current service cost of the Australian Government’s unfunded superannuation provisions increased by $0.4 billion. The current service cost recognises the increase in the superannuation liability that results from employee service in the reporting period. As the calculation of the amount is based on a present value, it is sensitive to changes in the discount rate used for the calculation.5 The longer the length of service, the greater the impact of discount rate changes.
Interest (excluding superannuation interest) expenses increased by $1.2 billion (7.5 per cent) during 2014-15 to $16.8 billion as a result of an increased volume of Australian Government Securities on issue for the year. Superannuation interest expenses increased by $0.8 billion (9.6 per cent) during 2014-15 to $9.0 billion.
5 Under AASB 119 Employee Benefits, the expenses recognised in the operating statement, including the current service cost and the nominal interest on superannuation, are determined with reference to the yield on government bonds (discount rate) at the start of the reporting period (4.1 per cent in 2014-15; 4.3 per cent in 2013-14), with the change in interest rates reflected as an actuarial revaluation in ‘other economic flows’.
Commentary on the financial statements
16
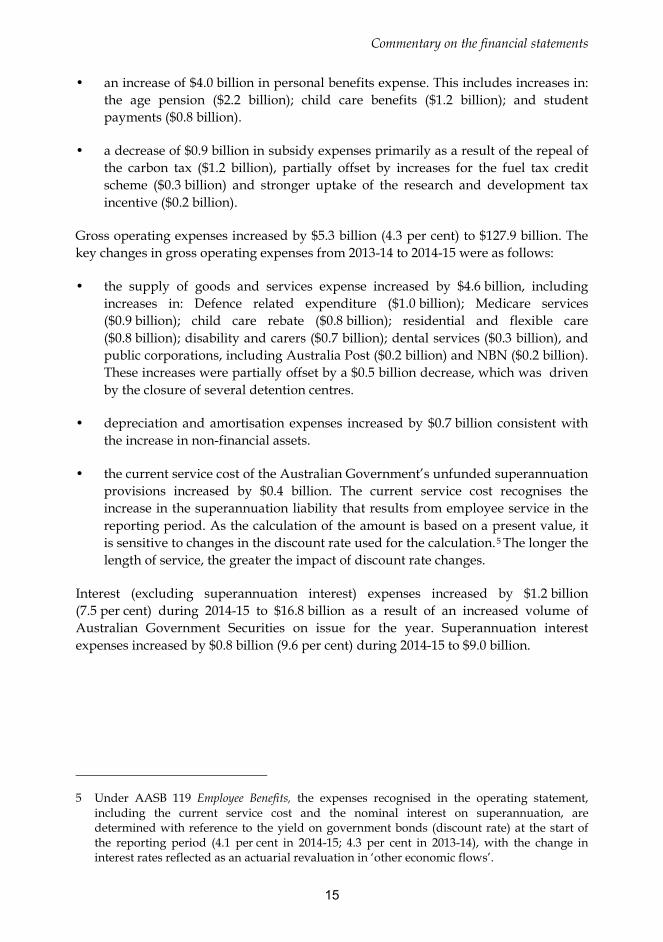
Chart 8 below provides a presentation of total expenses based on how the Australian Government allocated resources across the range of policy areas. The chart highlights the relative cost of each function for 2014-15 compared with the previous year.
Chart 8: Total expenses by function
0 20 40 60 80 100 120 140
Social security and welfare
Other purposes
Health
Education
General public services
Defence
Transport and communication
Other economic affairs
Fuel and energy
Housing and community amenities
Public order and safety
Recreation and culture
Agriculture, forestry and fishing
Mining, manufacturing and construction
$billion2014-15 2013-14
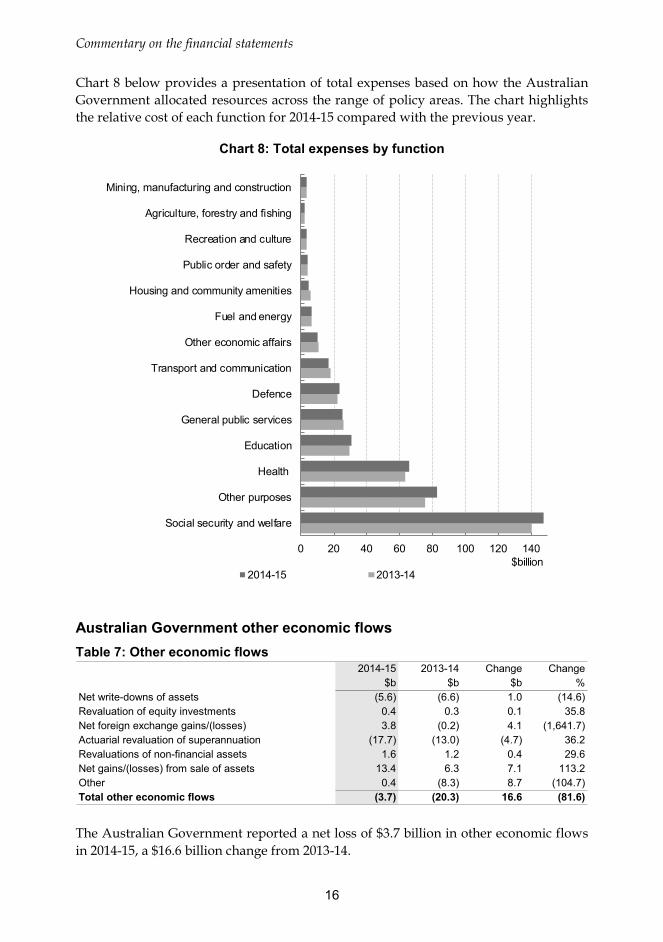
Australian Government other economic flows Table 7: Other economic flows
2014-15 2013-14 Change Change$b $b $b %
Net write-downs of assets (5.6) (6.6) 1.0 (14.6)Revaluation of equity investments 0.4 0.3 0.1 35.8Net foreign exchange gains/(losses) 3.8 (0.2) 4.1 (1,641.7)Actuarial revaluation of superannuation (17.7) (13.0) (4.7) 36.2Revaluations of non-financial assets 1.6 1.2 0.4 29.6Net gains/(losses) from sale of assets 13.4 6.3 7.1 113.2Other 0.4 (8.3) 8.7 (104.7)Total other economic flows (3.7) (20.3) 16.6 (81.6) The Australian Government reported a net loss of $3.7 billion in other economic flows in 2014-15, a $16.6 billion change from 2013-14.

Commentary on the financial statements
17
The $4.7 billion change in the actuarial revaluation of superannuation primarily relates to discount rate changes. Under the accounting standards, the superannuation liability is calculated using a discount rate based on current long-term government bond rates. Movement in the discount rate can cause significant movements in the valuation of the liability. In 2014-15, the discount rate decreased from 4.1 per cent to 3.7 per cent (increasing the liability and reducing net worth). In 2013-14, the discount rate decreased from 4.3 per cent to 4.1 per cent. The actuarial assumptions applied in the calculation of the Australian Government’s liability are detailed in Note 12C.
The major contributor to the $8.7 billion change in ‘other’ relates to a one-off variation in indexation arrangements for military superannuation in 2013-14 ($7.8 billion).
The $7.1 billion increase in net gains from sale of assets primarily relates to the sale of Medibank Private ($4.3 billion) and the digital dividend from spectrum licensing ($2.0 billion) in 2014-15.
The $4.1 billion increase in net foreign exchange gains/(losses) relates largely to $6.0 billion in gains for foreign currency held by the RBA, partially offset by $2.1 billion in foreign exchange losses relating to the Future Fund investment portfolio.
Australian Government net acquisition of non-financial assets Table 8: Net acquisition of non-financial assets
2014-15 2013-14 Change Change$b $b $b %
Purchases of non-financial assets 15.6 15.1 0.5 3.3less Sale of non-financial assets 2.5 0.4 2.1 525.0less Depreciation 8.1 7.4 0.7 9.5plus Change in inventories and other movements 0.6 0.7 (0.1) (14.3)plus Other movements in non-financial assets 0.0 1.0 (1.0) (100.0)Total net acquisition of non-financial assets 5.6 9.0 (3.4) (37.8) The Australian Government’s net acquisition of non-financial assets showed a decrease of $3.4 billion from last year to $5.6 billion in 2014-15. The increase in sale of non-financial assets is reflective of proceeds from the sale of digital dividend spectrum licensing which commenced in 2014-15 ($2.0 billion).
Commentary on the financial statements
18
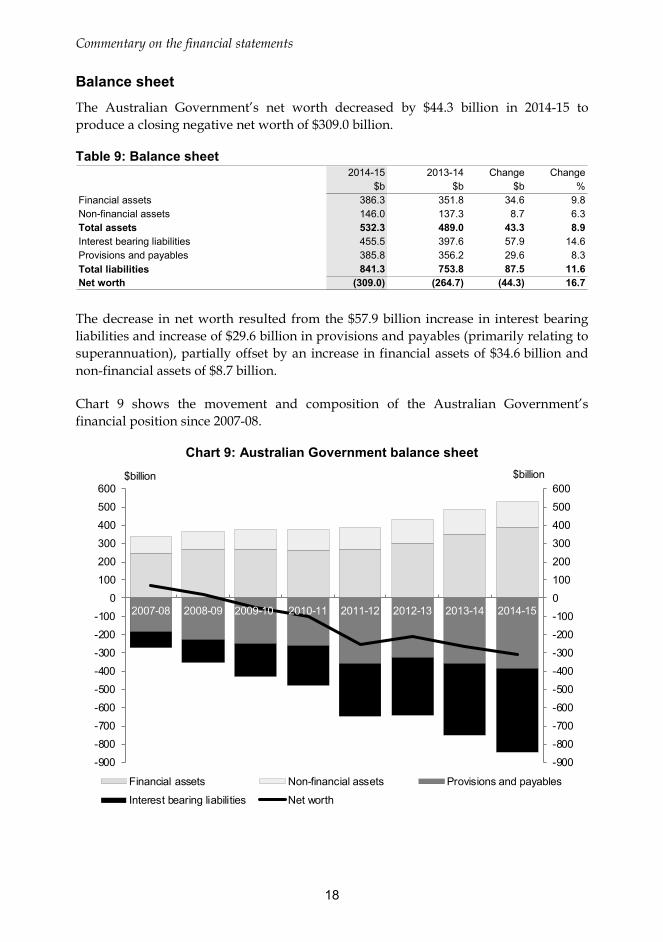
Balance sheet The Australian Government’s net worth decreased by $44.3 billion in 2014-15 to produce a closing negative net worth of $309.0 billion.
Table 9: Balance sheet 2014-15 2013-14 Change Change
$b $b $b %Financial assets 386.3 351.8 34.6 9.8Non-financial assets 146.0 137.3 8.7 6.3Total assets 532.3 489.0 43.3 8.9Interest bearing liabilities 455.5 397.6 57.9 14.6Provisions and payables 385.8 356.2 29.6 8.3Total liabilities 841.3 753.8 87.5 11.6Net worth (309.0) (264.7) (44.3) 16.7 The decrease in net worth resulted from the $57.9 billion increase in interest bearing liabilities and increase of $29.6 billion in provisions and payables (primarily relating to superannuation), partially offset by an increase in financial assets of $34.6 billion and non-financial assets of $8.7 billion.
Chart 9 shows the movement and composition of the Australian Government’s financial position since 2007-08.
Chart 9: Australian Government balance sheet
-900
-800
-700
-600
-500
-400
-300
-200
-100
0
100
200
300
400
500
600
-900
-800
-700
-600
-500
-400
-300
-200
-100
0
100
200
300
400
500
600
2007-08 2008-09 2009-10 2010-11 2011-12 2012-13 2013-14 2014-15
$billion
Financial assets Non-financial assets Provisions and payables
Interest bearing liabilities Net worth
$billion
Commentary on the financial statements
19
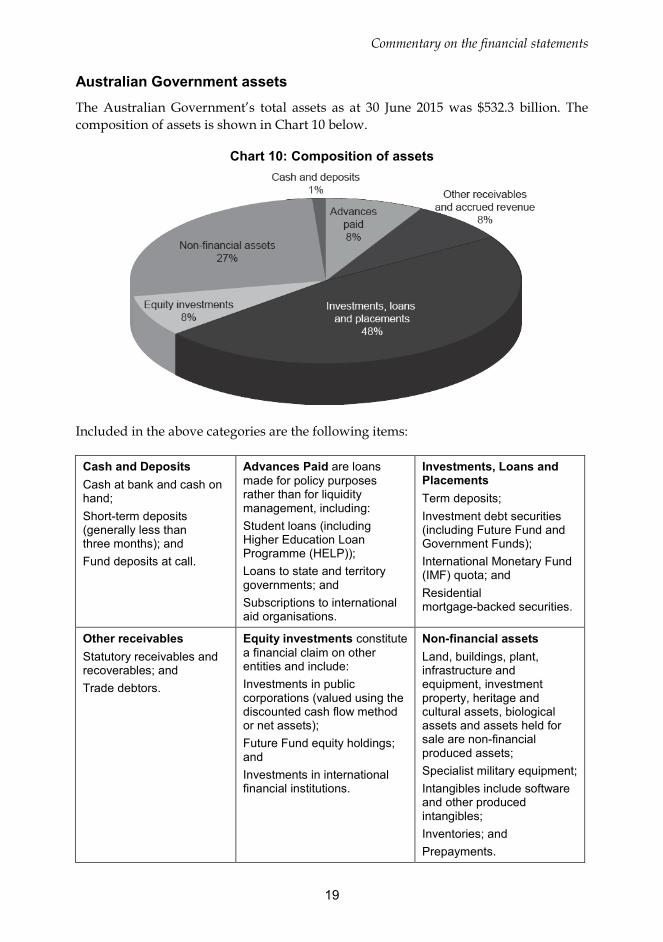
Australian Government assets The Australian Government’s total assets as at 30 June 2015 was $532.3 billion. The composition of assets is shown in Chart 10 below.
Chart 10: Composition of assets
Included in the above categories are the following items:
Cash and Deposits Cash at bank and cash on hand; Short-term deposits (generally less than three months); and Fund deposits at call.
Advances Paid are loans made for policy purposes rather than for liquidity management, including: Student loans (including Higher Education Loan Programme (HELP)); Loans to state and territory governments; and Subscriptions to international aid organisations.
Investments, Loans and Placements Term deposits; Investment debt securities (including Future Fund and Government Funds); International Monetary Fund (IMF) quota; and Residential mortgage-backed securities.
Other receivables Statutory receivables and recoverables; and Trade debtors.
Equity investments constitute a financial claim on other entities and include: Investments in public corporations (valued using the discounted cash flow method or net assets); Future Fund equity holdings; and Investments in international financial institutions.
Non-financial assets Land, buildings, plant, infrastructure and equipment, investment property, heritage and cultural assets, biological assets and assets held for sale are non-financial produced assets; Specialist military equipment; Intangibles include software and other produced intangibles; Inventories; and Prepayments.
Commentary on the financial statements
20
Table 10: Australian Government’s assets 2014-15 2013-14 Change Change
$b $b $b %Financial assets
Cash and deposits 4.8 4.5 0.3 6.8Advances paid 41.8 34.8 6.9 19.9Other receivables and accrued revenue 41.2 42.2 (1.0) (2.3)Investments, loans and placements 254.5 229.8 24.7 10.7Equity investments 44.1 40.5 3.6 8.9
Total financial assets 386.3 351.8 34.6 9.8Non-financial assets 146.0 137.3 8.7 6.3Total assets 532.3 489.0 43.3 8.9 The Australian Government’s total assets increased by $43.3 billion (8.9 per cent) since 30 June 2014.
This included a $34.6 billion (9.8 per cent) increase in financial assets to $386.3 billion at 30 June 2015, and a $8.7 billion (6.3 per cent) increase in non-financial assets to $146.0 billion at 30 June 2015. This continues the trend of recent years where a greater proportion of the Australian Government’s assets held are financial assets.
The key movements in financial assets between 30 June 2014 and 30 June 2015 included the following:
• an increase of $24.7 billion in investments, loans and placements. This included a $14.8 billion increase in Australian dollar securities and foreign exchange holdings held by the RBA and an increase of $11.2 billion in non-equity investments held by the Future Fund. These increases were partially offset by a $1.8 billion decrease in residential mortgage-backed securities held by the AOFM;
• an increase of $6.9 billion in advances paid, mainly due to a $5.3 billion increase in the HELP scheme reflecting increased loan numbers; and
• an increase of $3.6 billion in equity investments, primarily resulting from an increased holding of listed equities and listed managed investment schemes by the Future Fund.
The key movements in non-financial assets between 30 June 2014 and 30 June 2015 included the following:
• an increase of $3.5 billion for infrastructure, plant and equipment including an increase of $3.1 billion in network assets for the rollout of the NBN;
• an increase of $1.5 billion for other non-financial assets, primarily driven by an increase in Defence prepayments for foreign military sales;
• an increase of $1.4 billion for specialist military equipment;
Commentary on the financial statements
21
• an increase of $0.9 billion for buildings primarily due to revaluations by Defence and of overseas property purchases by the Department of Foreign Affairs and Trade;
• an increase in land of $0.6 billion mainly due to revaluations; and
• an increase in heritage and cultural assets of $0.5 billion, mainly due to revaluation of cultural institution collections.
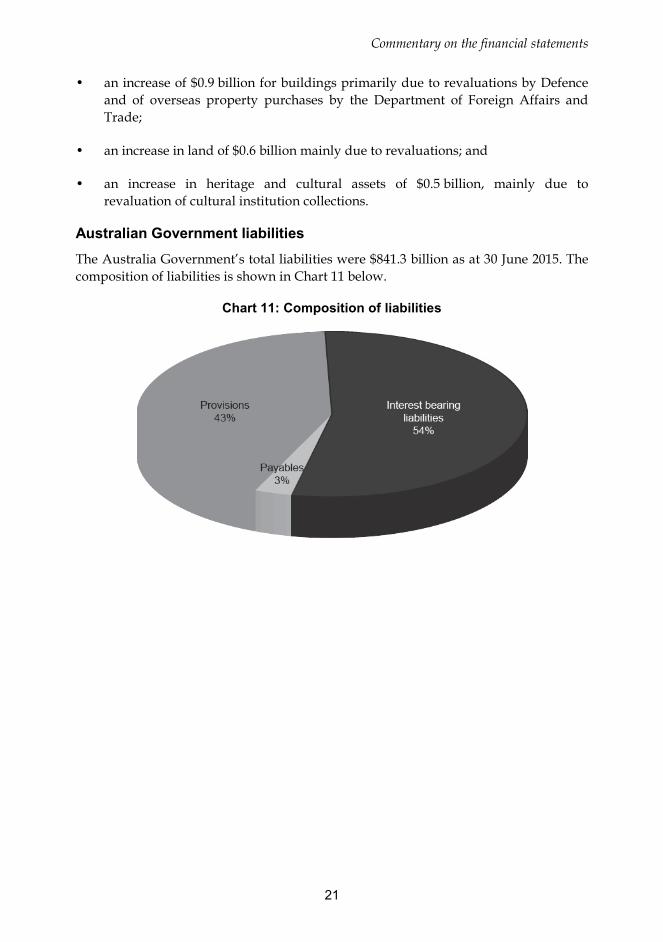
Australian Government liabilities The Australia Government’s total liabilities were $841.3 billion as at 30 June 2015. The composition of liabilities is shown in Chart 11 below.
Chart 11: Composition of liabilities
Commentary on the financial statements
22
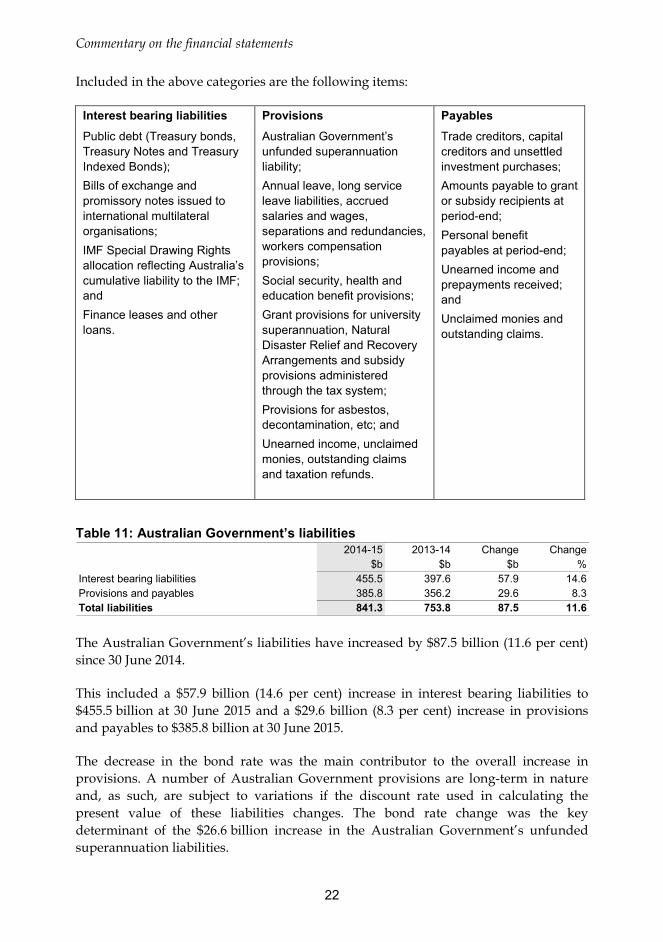
Included in the above categories are the following items:
Interest bearing liabilities Provisions Payables
Public debt (Treasury bonds, Treasury Notes and Treasury Indexed Bonds); Bills of exchange and promissory notes issued to international multilateral organisations; IMF Special Drawing Rights allocation reflecting Australia’s cumulative liability to the IMF; and Finance leases and other loans.
Australian Government’s unfunded superannuation liability; Annual leave, long service leave liabilities, accrued salaries and wages, separations and redundancies, workers compensation provisions; Social security, health and education benefit provisions; Grant provisions for university superannuation, Natural Disaster Relief and Recovery Arrangements and subsidy provisions administered through the tax system; Provisions for asbestos, decontamination, etc; and Unearned income, unclaimed monies, outstanding claims and taxation refunds.
Trade creditors, capital creditors and unsettled investment purchases; Amounts payable to grant or subsidy recipients at period-end; Personal benefit payables at period-end; Unearned income and prepayments received; and Unclaimed monies and outstanding claims.
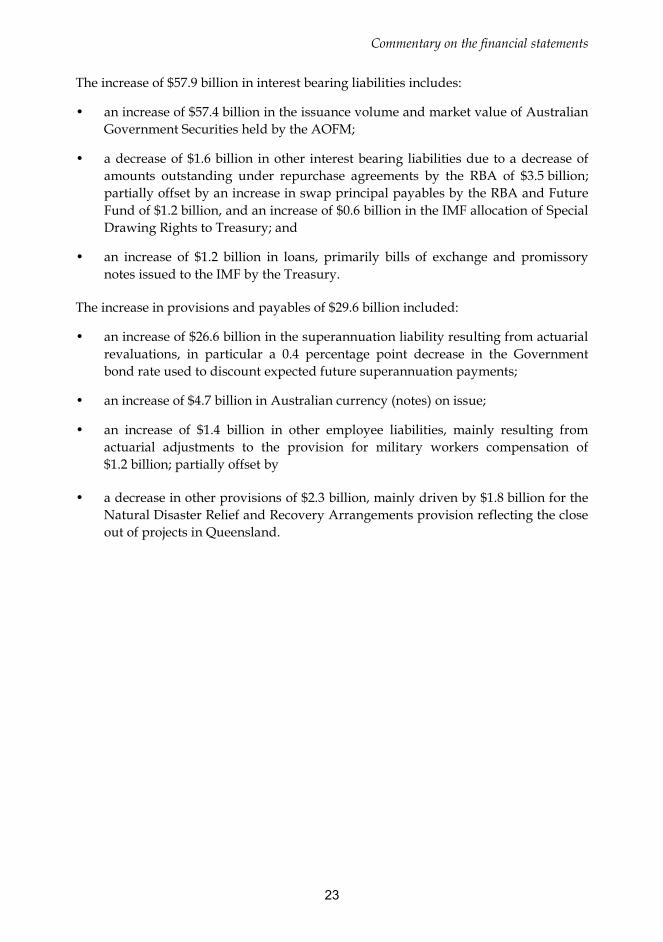
Table 11: Australian Government’s liabilities 2014-15 2013-14 Change Change
$b $b $b %Interest bearing liabilities 455.5 397.6 57.9 14.6Provisions and payables 385.8 356.2 29.6 8.3Total liabilities 841.3 753.8 87.5 11.6 The Australian Government’s liabilities have increased by $87.5 billion (11.6 per cent) since 30 June 2014.
This included a $57.9 billion (14.6 per cent) increase in interest bearing liabilities to $455.5 billion at 30 June 2015 and a $29.6 billion (8.3 per cent) increase in provisions and payables to $385.8 billion at 30 June 2015.
The decrease in the bond rate was the main contributor to the overall increase in provisions. A number of Australian Government provisions are long-term in nature and, as such, are subject to variations if the discount rate used in calculating the present value of these liabilities changes. The bond rate change was the key determinant of the $26.6 billion increase in the Australian Government’s unfunded superannuation liabilities.
Commentary on the financial statements
23
The increase of $57.9 billion in interest bearing liabilities includes:
• an increase of $57.4 billion in the issuance volume and market value of Australian Government Securities held by the AOFM;
• a decrease of $1.6 billion in other interest bearing liabilities due to a decrease of amounts outstanding under repurchase agreements by the RBA of $3.5 billion; partially offset by an increase in swap principal payables by the RBA and Future Fund of $1.2 billion, and an increase of $0.6 billion in the IMF allocation of Special Drawing Rights to Treasury; and
• an increase of $1.2 billion in loans, primarily bills of exchange and promissory notes issued to the IMF by the Treasury.
The increase in provisions and payables of $29.6 billion included:
• an increase of $26.6 billion in the superannuation liability resulting from actuarial revaluations, in particular a 0.4 percentage point decrease in the Government bond rate used to discount expected future superannuation payments;
• an increase of $4.7 billion in Australian currency (notes) on issue;
• an increase of $1.4 billion in other employee liabilities, mainly resulting from actuarial adjustments to the provision for military workers compensation of $1.2 billion; partially offset by
• a decrease in other provisions of $2.3 billion, mainly driven by $1.8 billion for the Natural Disaster Relief and Recovery Arrangements provision reflecting the close out of projects in Queensland.
Commentary on the financial statements
24
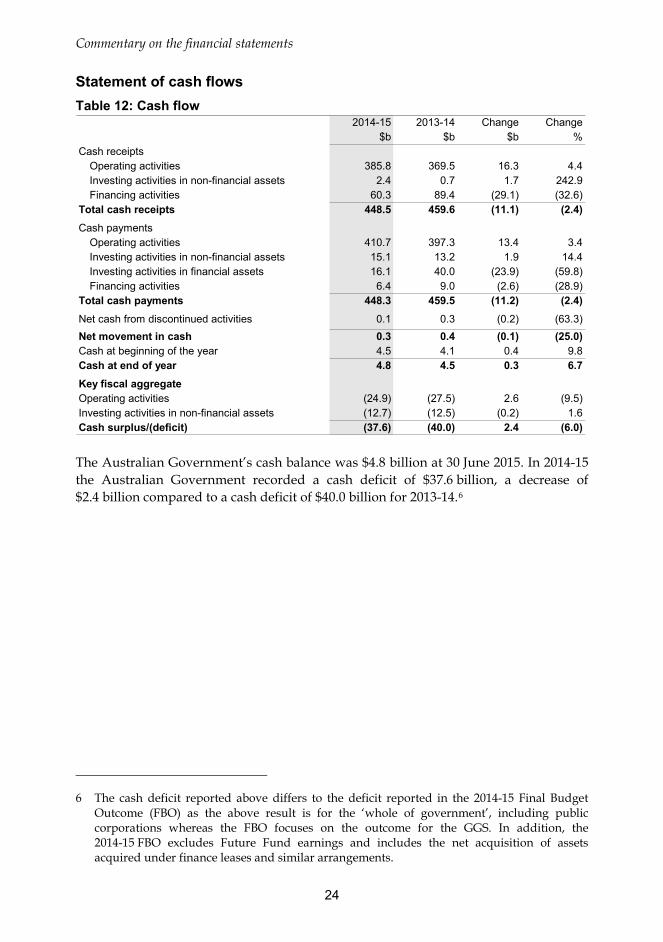
Statement of cash flows Table 12: Cash flow
2014-15 2013-14 Change Change$b $b $b %
Cash receiptsOperating activities 385.8 369.5 16.3 4.4Investing activities in non-financial assets 2.4 0.7 1.7 242.9Financing activities 60.3 89.4 (29.1) (32.6)
Total cash receipts 448.5 459.6 (11.1) (2.4)Cash payments
Operating activities 410.7 397.3 13.4 3.4Investing activities in non-financial assets 15.1 13.2 1.9 14.4Investing activities in financial assets 16.1 40.0 (23.9) (59.8)Financing activities 6.4 9.0 (2.6) (28.9)
Total cash payments 448.3 459.5 (11.2) (2.4)Net cash from discontinued activities 0.1 0.3 (0.2) (63.3)Net movement in cash 0.3 0.4 (0.1) (25.0)Cash at beginning of the year 4.5 4.1 0.4 9.8Cash at end of year 4.8 4.5 0.3 6.7Key fiscal aggregateOperating activities (24.9) (27.5) 2.6 (9.5)Investing activities in non-financial assets (12.7) (12.5) (0.2) 1.6Cash surplus/(deficit) (37.6) (40.0) 2.4 (6.0) The Australian Government’s cash balance was $4.8 billion at 30 June 2015. In 2014-15 the Australian Government recorded a cash deficit of $37.6 billion, a decrease of $2.4 billion compared to a cash deficit of $40.0 billion for 2013-14.6
6 The cash deficit reported above differs to the deficit reported in the 2014-15 Final Budget Outcome (FBO) as the above result is for the ‘whole of government’, including public corporations whereas the FBO focuses on the outcome for the GGS. In addition, the 2014-15 FBO excludes Future Fund earnings and includes the net acquisition of assets acquired under finance leases and similar arrangements.
Commentary on the financial statements
25
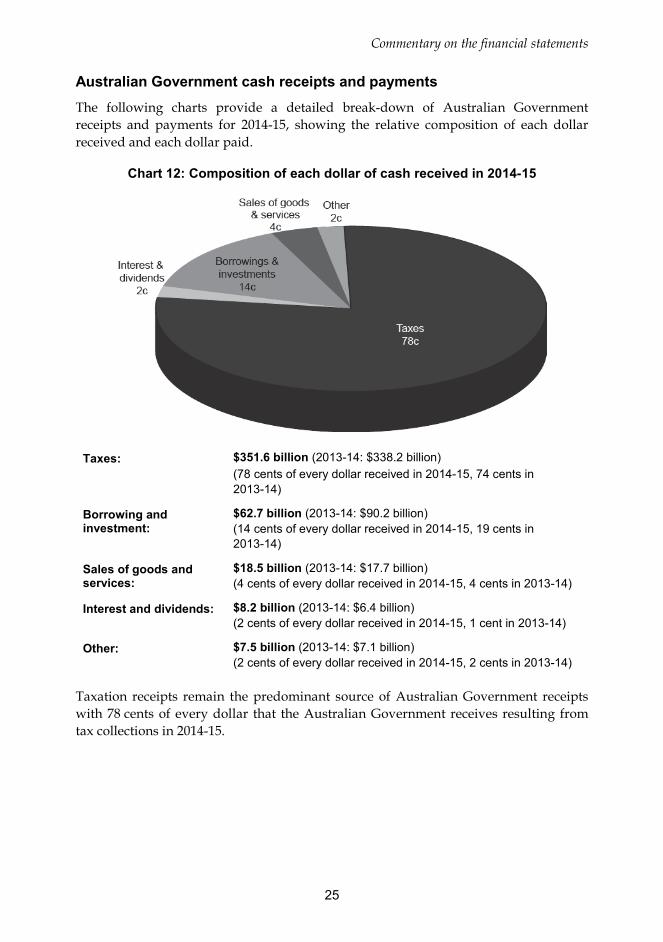
Australian Government cash receipts and payments The following charts provide a detailed break-down of Australian Government receipts and payments for 2014-15, showing the relative composition of each dollar received and each dollar paid.
Chart 12: Composition of each dollar of cash received in 2014-15
Taxes: $351.6 billion (2013-14: $338.2 billion) (78 cents of every dollar received in 2014-15, 74 cents in 2013-14)
Borrowing and investment:
$62.7 billion (2013-14: $90.2 billion) (14 cents of every dollar received in 2014-15, 19 cents in 2013-14)
Sales of goods and services:
$18.5 billion (2013-14: $17.7 billion) (4 cents of every dollar received in 2014-15, 4 cents in 2013-14)
Interest and dividends: $8.2 billion (2013-14: $6.4 billion) (2 cents of every dollar received in 2014-15, 1 cent in 2013-14)
Other: $7.5 billion (2013-14: $7.1 billion) (2 cents of every dollar received in 2014-15, 2 cents in 2013-14)
Taxation receipts remain the predominant source of Australian Government receipts with 78 cents of every dollar that the Australian Government receives resulting from tax collections in 2014-15.
Commentary on the financial statements
26
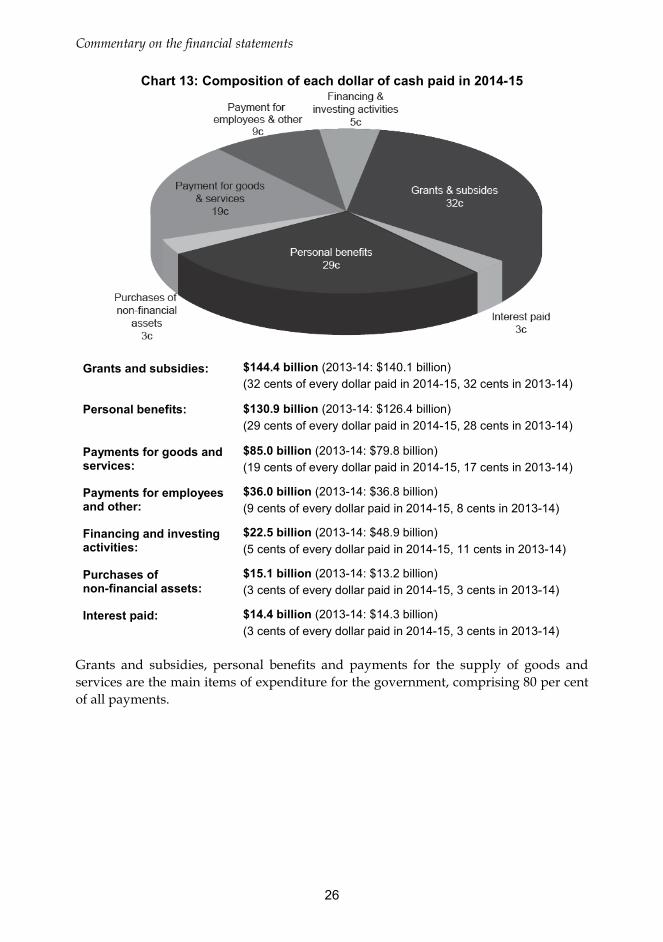
Chart 13: Composition of each dollar of cash paid in 2014-15
Grants and subsidies:
$144.4 billion (2013-14: $140.1 billion) (32 cents of every dollar paid in 2014-15, 32 cents in 2013-14)
Personal benefits: $130.9 billion (2013-14: $126.4 billion) (29 cents of every dollar paid in 2014-15, 28 cents in 2013-14)
Payments for goods and services:
$85.0 billion (2013-14: $79.8 billion) (19 cents of every dollar paid in 2014-15, 17 cents in 2013-14)
Payments for employees and other:
$36.0 billion (2013-14: $36.8 billion) (9 cents of every dollar paid in 2014-15, 8 cents in 2013-14)
Financing and investing activities:
$22.5 billion (2013-14: $48.9 billion) (5 cents of every dollar paid in 2014-15, 11 cents in 2013-14)
Purchases of non-financial assets:
$15.1 billion (2013-14: $13.2 billion) (3 cents of every dollar paid in 2014-15, 3 cents in 2013-14)
Interest paid: $14.4 billion (2013-14: $14.3 billion) (3 cents of every dollar paid in 2014-15, 3 cents in 2013-14)
Grants and subsidies, personal benefits and payments for the supply of goods and services are the main items of expenditure for the government, comprising 80 per cent of all payments.
Commentary on the financial statements
27
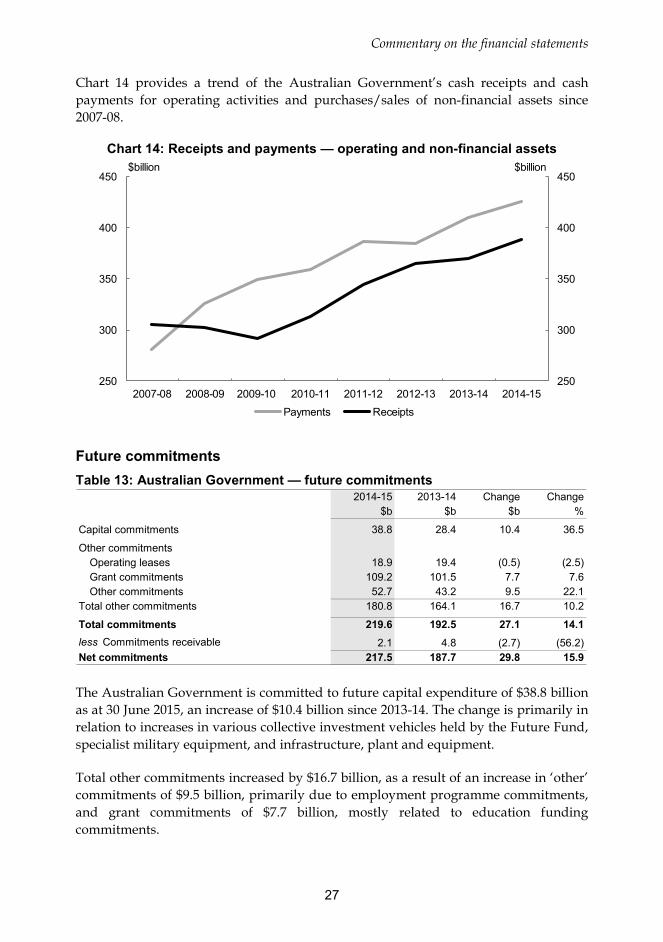
Chart 14 provides a trend of the Australian Government’s cash receipts and cash payments for operating activities and purchases/sales of non-financial assets since 2007-08.
Chart 14: Receipts and payments — operating and non-financial assets
250
300
350
400
450
250
300
350
400
450
2007-08 2008-09 2009-10 2010-11 2011-12 2012-13 2013-14 2014-15
$billion$billion
Payments Receipts
Future commitments Table 13: Australian Government — future commitments
2014-15 2013-14 Change Change$b $b $b %
Capital commitments 38.8 28.4 10.4 36.5
Other commitmentsOperating leases 18.9 19.4 (0.5) (2.5)Grant commitments 109.2 101.5 7.7 7.6Other commitments 52.7 43.2 9.5 22.1
Total other commitments 180.8 164.1 16.7 10.2
Total commitments 219.6 192.5 27.1 14.1less Commitments receivable 2.1 4.8 (2.7) (56.2)Net commitments 217.5 187.7 29.8 15.9 The Australian Government is committed to future capital expenditure of $38.8 billion as at 30 June 2015, an increase of $10.4 billion since 2013-14. The change is primarily in relation to increases in various collective investment vehicles held by the Future Fund, specialist military equipment, and infrastructure, plant and equipment.
Total other commitments increased by $16.7 billion, as a result of an increase in ‘other’ commitments of $9.5 billion, primarily due to employment programme commitments, and grant commitments of $7.7 billion, mostly related to education funding commitments.
Commentary on the financial statements
28
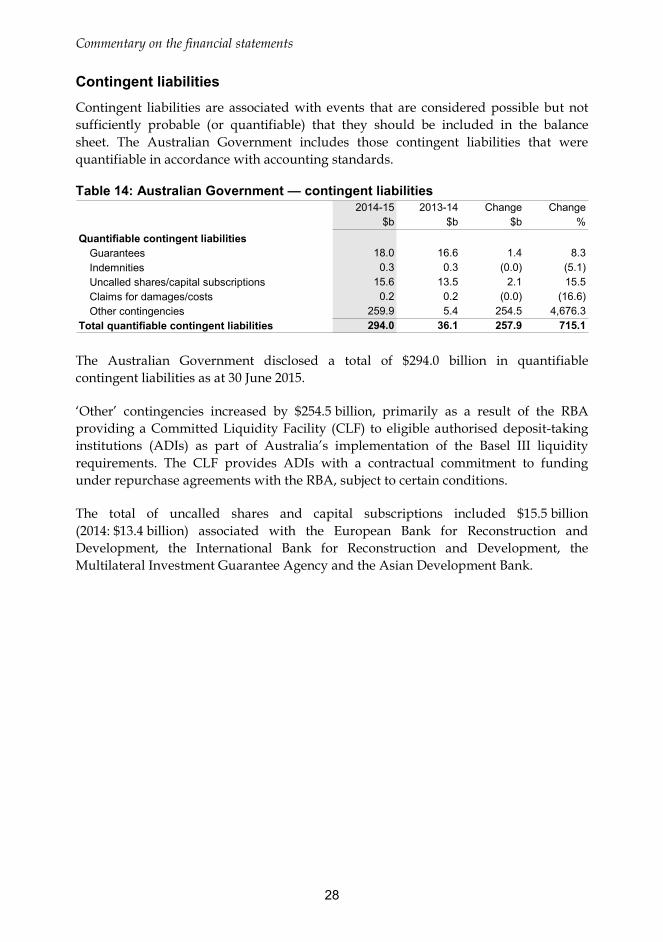
Contingent liabilities Contingent liabilities are associated with events that are considered possible but not sufficiently probable (or quantifiable) that they should be included in the balance sheet. The Australian Government includes those contingent liabilities that were quantifiable in accordance with accounting standards.
Table 14: Australian Government — contingent liabilities 2014-15 2013-14 Change Change
$b $b $b %Quantifiable contingent liabilities
Guarantees 18.0 16.6 1.4 8.3Indemnities 0.3 0.3 (0.0) (5.1)Uncalled shares/capital subscriptions 15.6 13.5 2.1 15.5Claims for damages/costs 0.2 0.2 (0.0) (16.6)Other contingencies 259.9 5.4 254.5 4,676.3
Total quantifiable contingent liabilities 294.0 36.1 257.9 715.1 The Australian Government disclosed a total of $294.0 billion in quantifiable contingent liabilities as at 30 June 2015.
‘Other’ contingencies increased by $254.5 billion, primarily as a result of the RBA providing a Committed Liquidity Facility (CLF) to eligible authorised deposit-taking institutions (ADIs) as part of Australia’s implementation of the Basel III liquidity requirements. The CLF provides ADIs with a contractual commitment to funding under repurchase agreements with the RBA, subject to certain conditions.
The total of uncalled shares and capital subscriptions included $15.5 billion (2014: $13.4 billion) associated with the European Bank for Reconstruction and Development, the International Bank for Reconstruction and Development, the Multilateral Investment Guarantee Agency and the Asian Development Bank.
29
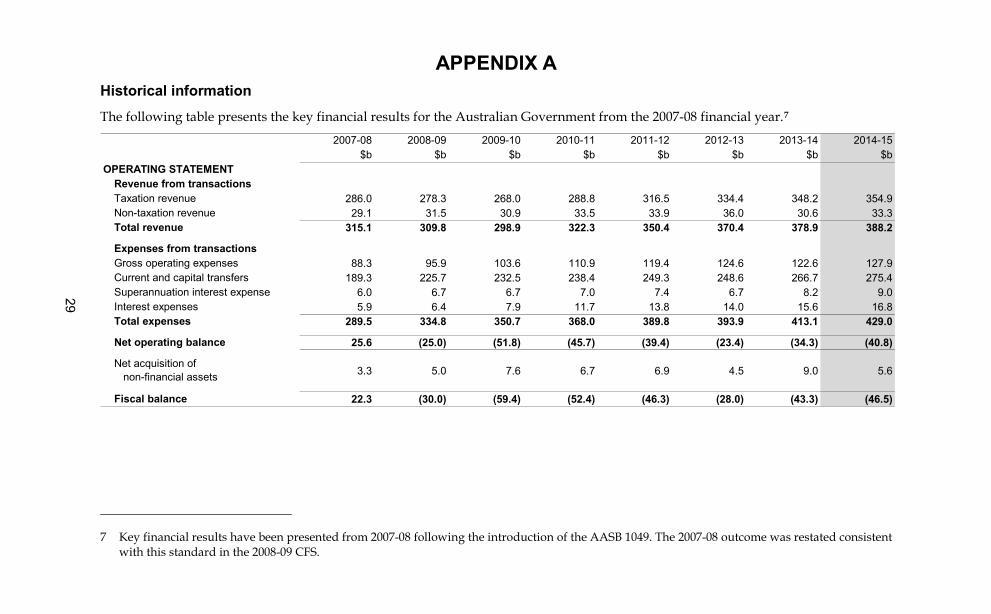
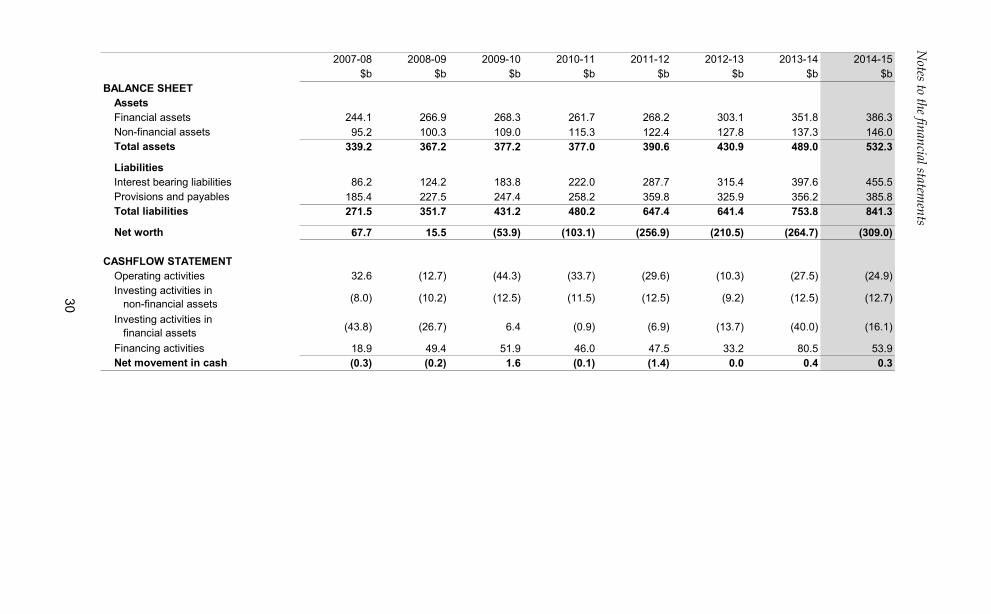
APPENDIX A Historical information The following table presents the key financial results for the Australian Government from the 2007-08 financial year.7
2007-08 2008-09 2009-10 2010-11 2011-12 2012-13 2013-14 2014-15$b $b $b $b $b $b $b $b
OPERATING STATEMENTRevenue from transactionsTaxation revenue 286.0 278.3 268.0 288.8 316.5 334.4 348.2 354.9Non-taxation revenue 29.1 31.5 30.9 33.5 33.9 36.0 30.6 33.3Total revenue 315.1 309.8 298.9 322.3 350.4 370.4 378.9 388.2
Expenses from transactionsGross operating expenses 88.3 95.9 103.6 110.9 119.4 124.6 122.6 127.9Current and capital transfers 189.3 225.7 232.5 238.4 249.3 248.6 266.7 275.4Superannuation interest expense 6.0 6.7 6.7 7.0 7.4 6.7 8.2 9.0Interest expenses 5.9 6.4 7.9 11.7 13.8 14.0 15.6 16.8Total expenses 289.5 334.8 350.7 368.0 389.8 393.9 413.1 429.0
Net operating balance 25.6 (25.0) (51.8) (45.7) (39.4) (23.4) (34.3) (40.8)
Net acquisition of non-financial assets 3.3 5.0 7.6 6.7 6.9 4.5 9.0 5.6
Fiscal balance 22.3 (30.0) (59.4) (52.4) (46.3) (28.0) (43.3) (46.5)
7 Key financial results have been presented from 2007-08 following the introduction of the AASB 1049. The 2007-08 outcome was restated consistent with this standard in the 2008-09 CFS.
Notes to the financial statem
ents
30
2007-08 2008-09 2009-10 2010-11 2011-12 2012-13 2013-14 2014-15$b $b $b $b $b $b $b $b
BALANCE SHEETAssetsFinancial assets 244.1 266.9 268.3 261.7 268.2 303.1 351.8 386.3Non-financial assets 95.2 100.3 109.0 115.3 122.4 127.8 137.3 146.0Total assets 339.2 367.2 377.2 377.0 390.6 430.9 489.0 532.3
LiabilitiesInterest bearing liabilities 86.2 124.2 183.8 222.0 287.7 315.4 397.6 455.5Provisions and payables 185.4 227.5 247.4 258.2 359.8 325.9 356.2 385.8Total liabilities 271.5 351.7 431.2 480.2 647.4 641.4 753.8 841.3
Net worth 67.7 15.5 (53.9) (103.1) (256.9) (210.5) (264.7) (309.0)
CASHFLOW STATEMENTOperating activities 32.6 (12.7) (44.3) (33.7) (29.6) (10.3) (27.5) (24.9)Investing activities in non-financial assets (8.0) (10.2) (12.5) (11.5) (12.5) (9.2) (12.5) (12.7)
Investing activities in financial assets (43.8) (26.7) 6.4 (0.9) (6.9) (13.7) (40.0) (16.1)
Financing activities 18.9 49.4 51.9 46.0 47.5 33.2 80.5 53.9Net movement in cash (0.3) (0.2) 1.6 (0.1) (1.4) 0.0 0.4 0.3
Commentary on the Financial Statements
31
APPENDIX B
LINKS TO OTHER PUBLICATIONS PUBLISHED BY THE AUSTRALIAN GOVERNMENT ABOUT ITS PROJECTED AND ACTUAL FINANCIAL POSITION FOR THE 2014-15 FINANCIAL YEAR
The Australian Government publishes a range of information about its projected and actual financial position. Links to some of these documents are set out below. The information in the following documents has been prepared for different purposes and therefore does not form part of the CFS. Further, the documents listed below are not subject to audit.
2014-15 Final Budget Outcome The 2014-15 Final Budget Outcome (FBO) was prepared in a manner consistent with the Charter of Budget Honesty Act 1998 (the Charter). The Charter requires that, inter alia, the Government provide the FBO no later than three months after the end of the financial year. Consistent with these requirements, the FBO encompasses Australian Government GGS fiscal outcomes for the 2014-15 financial year and is based on external reporting standards.
The FBO is available on the Australian Government website at: http://www.budget.gov.au/2014-15/content/fbo/html/index.htm.
Australian Government (GGS) Monthly Financial Statements The Australian Government (GGS) Monthly Financial Statements are prepared on a basis consistent with the Budget as required under section 47 of the PGPA Act. The statements are prepared in accordance with AASB 1049.
The Australian Government Monthly Financial Statements are available on the Department of Finance website and the Minister for Finance website at: http://www.finance.gov.au/publications/commonwealth-monthly-financial-statements/; and http://www.financeminister.gov.au/media/2015/index.html.
Budget Strategy and Outlook and Mid-Year Economic and Fiscal Outlook The Budget Strategy and Outlook — Budget Paper — 2014-15, the Mid-Year Economic and Fiscal Outlook 2014-15 and the Budget Strategy and Outlook — Budget Paper — 2015-16 have been prepared in accordance with the Charter.
The aforementioned Budget Papers are available on the Australian Government website at http://www.budget.gov.au/.
Commentary on the Financial Statements
32
Tax Expenditures Statement 2014
The Tax Expenditures Statement (TES) provides details of concessions, benefits, incentives and charges provided through the tax system (tax expenditures) to taxpayers by the Australian Government. The TES is available on the Treasury website at: http://www.treasury.gov.au/PublicationsAndMedia/Publications/2015/TES-2014.
CONSOLIDATED FINANCIAL STATEMENTS, INCLUDING THE AUSTRALIAN GOVERNMENT (WHOLE OF
GOVERNMENT) AND GENERAL GOVERNMENT SECTOR FINANCIAL REPORTS

35
INDEPENDENT AUDIT REPORT
Consolidated financial statements
36
37
Consolidated financial statements
38
Consolidated financial statements
39
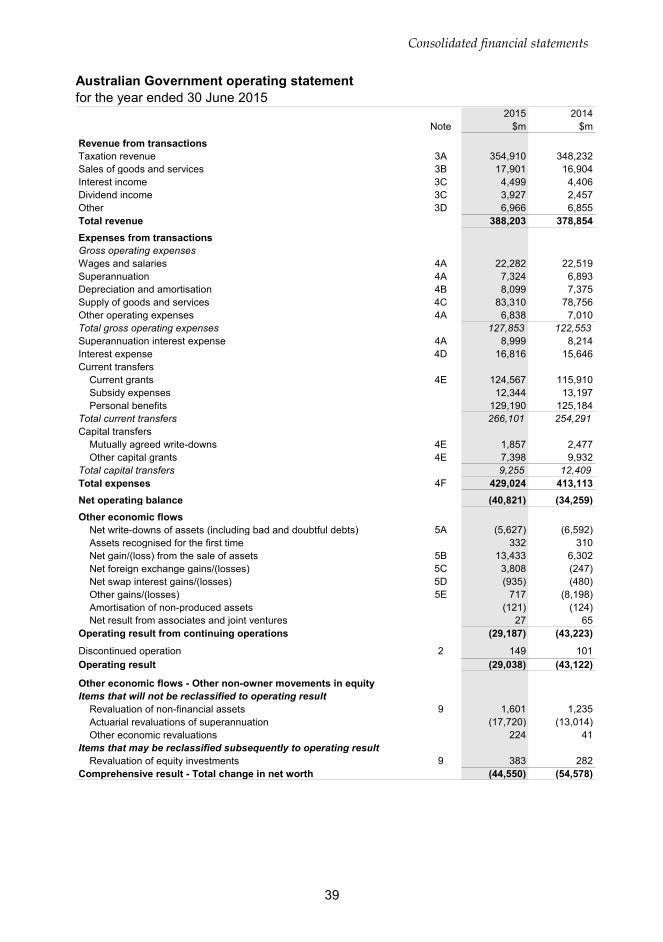
Australian Government operating statement for the year ended 30 June 2015
2015 2014Note $m $m
Revenue from transactionsTaxation revenue 3A 354,910 348,232Sales of goods and services 3B 17,901 16,904Interest income 3C 4,499 4,406Dividend income 3C 3,927 2,457Other 3D 6,966 6,855Total revenue 388,203 378,854Expenses from transactionsGross operating expensesWages and salaries 4A 22,282 22,519Superannuation 4A 7,324 6,893Depreciation and amortisation 4B 8,099 7,375Supply of goods and services 4C 83,310 78,756Other operating expenses 4A 6,838 7,010Total gross operating expenses 127,853 122,553Superannuation interest expense 4A 8,999 8,214Interest expense 4D 16,816 15,646Current transfers
Current grants 4E 124,567 115,910Subsidy expenses 12,344 13,197Personal benefits 129,190 125,184
Total current transfers 266,101 254,291Capital transfers
Mutually agreed write-downs 4E 1,857 2,477Other capital grants 4E 7,398 9,932
Total capital transfers 9,255 12,409Total expenses 4F 429,024 413,113Net operating balance (40,821) (34,259)Other economic flows - included in Operating Result
Net write-downs of assets (including bad and doubtful debts) 5A (5,627) (6,592)Assets recognised for the first time 332 310Net gain/(loss) from the sale of assets 5B 13,433 6,302Net foreign exchange gains/(losses) 5C 3,808 (247)Net swap interest gains/(losses) 5D (935) (480)Other gains/(losses) 5E 717 (8,198)Amortisation of non-produced assets (121) (124)Net result from associates and joint ventures 27 65
Operating result from continuing operations (29,187) (43,223)
Discontinued operation 2 149 101Operating result (29,038) (43,122)
Other economic flows - Other non-owner movements in equityItems that will not be reclassified to operating result
Revaluation of non-financial assets 9 1,601 1,235Actuarial revaluations of superannuation (17,720) (13,014)Other economic revaluations 224 41
Items that may be reclassified subsequently to operating resultRevaluation of equity investments 9 383 282
Comprehensive result - Total change in net worth (44,550) (54,578)
Consolidated financial statements
40
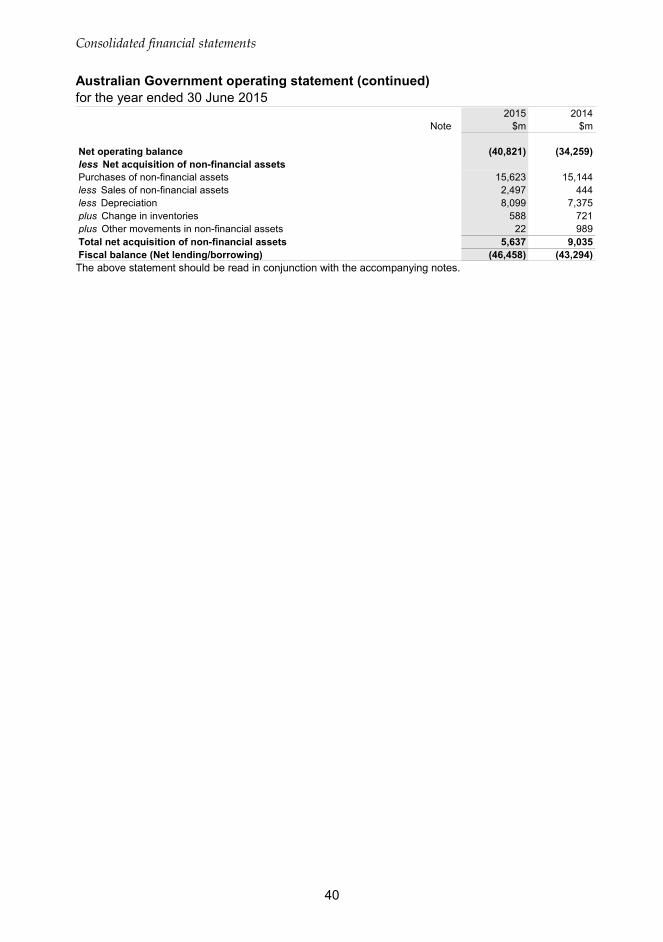
Australian Government operating statement (continued) for the year ended 30 June 2015
2015 2014Note $m $m
Net operating balance (40,821) (34,259)less Net acquisition of non-financial assetsPurchases of non-financial assets 15,623 15,144less Sales of non-financial assets 2,497 444less Depreciation 8,099 7,375plus Change in inventories 588 721plus Other movements in non-financial assets 22 989Total net acquisition of non-financial assets 5,637 9,035Fiscal balance (Net lending/borrowing) (46,458) (43,294) The above statement should be read in conjunction with the accompanying notes.
Consolidated financial statements
41
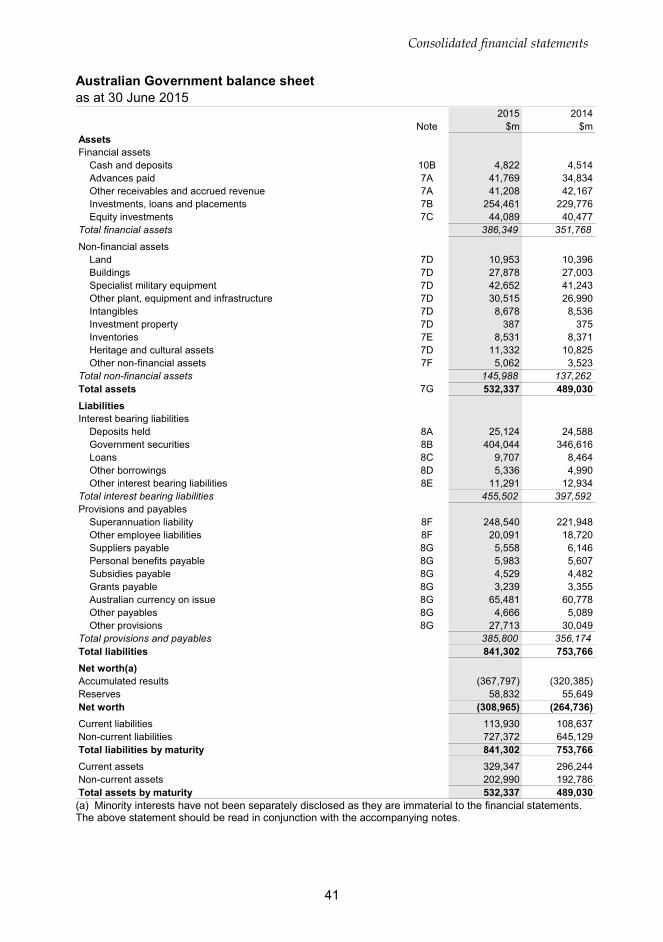
Australian Government balance sheet as at 30 June 2015
2015 2014Note $m $m
AssetsFinancial assets
Cash and deposits 10B 4,822 4,514Advances paid 7A 41,769 34,834Other receivables and accrued revenue 7A 41,208 42,167Investments, loans and placements 7B 254,461 229,776Equity investments 7C 44,089 40,477
Total financial assets 386,349 351,768
Non-financial assetsLand 7D 10,953 10,396Buildings 7D 27,878 27,003Specialist military equipment 7D 42,652 41,243Other plant, equipment and infrastructure 7D 30,515 26,990Intangibles 7D 8,678 8,536Investment property 7D 387 375Inventories 7E 8,531 8,371Heritage and cultural assets 7D 11,332 10,825Other non-financial assets 7F 5,062 3,523
Total non-financial assets 145,988 137,262Total assets 7G 532,337 489,030LiabilitiesInterest bearing liabilities
Deposits held 8A 25,124 24,588Government securities 8B 404,044 346,616Loans 8C 9,707 8,464Other borrowings 8D 5,336 4,990Other interest bearing liabilities 8E 11,291 12,934
Total interest bearing liabilities 455,502 397,592Provisions and payables
Superannuation liability 8F 248,540 221,948Other employee liabilities 8F 20,091 18,720Suppliers payable 8G 5,558 6,146Personal benefits payable 8G 5,983 5,607Subsidies payable 8G 4,529 4,482Grants payable 8G 3,239 3,355Australian currency on issue 8G 65,481 60,778Other payables 8G 4,666 5,089Other provisions 8G 27,713 30,049
Total provisions and payables 385,800 356,174Total liabilities 841,302 753,766Net worth(a)Accumulated results (367,797) (320,385)Reserves 58,832 55,649Net worth (308,965) (264,736)Current liabilities 113,930 108,637Non-current liabilities 727,372 645,129Total liabilities by maturity 841,302 753,766Current assets 329,347 296,244Non-current assets 202,990 192,786Total assets by maturity 532,337 489,030 (a) Minority interests have not been separately disclosed as they are immaterial to the financial statements. The above statement should be read in conjunction with the accompanying notes.
Consolidated financial statements
42
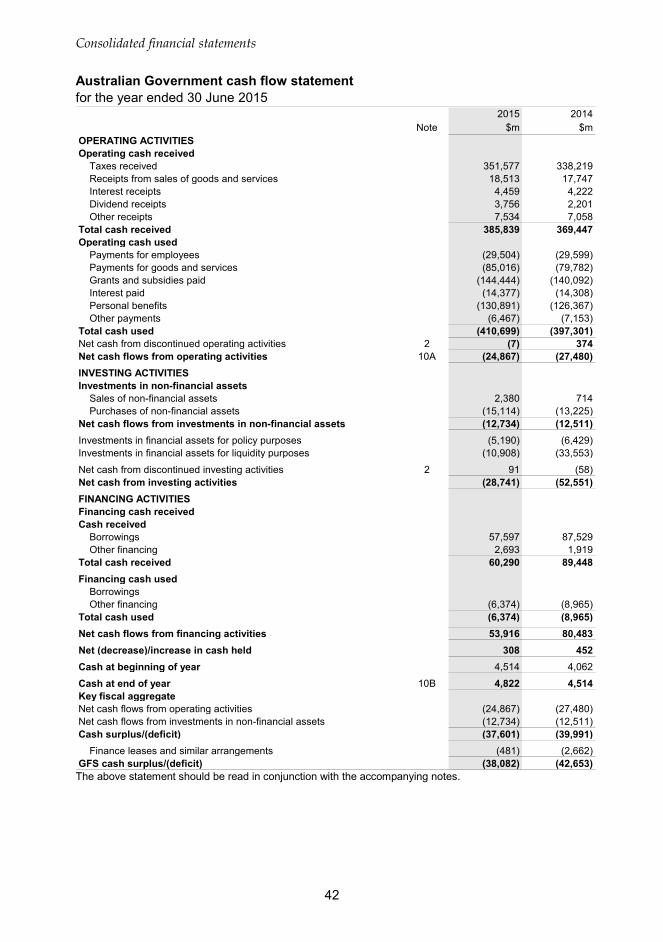
Australian Government cash flow statement for the year ended 30 June 2015
2015 2014Note $m $m
OPERATING ACTIVITIESOperating cash received
Taxes received 351,577 338,219Receipts from sales of goods and services 18,513 17,747Interest receipts 4,459 4,222Dividend receipts 3,756 2,201Other receipts 7,534 7,058
Total cash received 385,839 369,447Operating cash used
Payments for employees (29,504) (29,599)Payments for goods and services (85,016) (79,782)Grants and subsidies paid (144,444) (140,092)Interest paid (14,377) (14,308)Personal benefits (130,891) (126,367)Other payments (6,467) (7,153)
Total cash used (410,699) (397,301)Net cash from discontinued operating activities 2 (7) 374Net cash flows from operating activities 10A (24,867) (27,480)INVESTING ACTIVITIESInvestments in non-financial assets
Sales of non-financial assets 2,380 714Purchases of non-financial assets (15,114) (13,225)
Net cash flows from investments in non-financial assets (12,734) (12,511)Investments in financial assets for policy purposes (5,190) (6,429)Investments in financial assets for liquidity purposes (10,908) (33,553)
Net cash from discontinued investing activities 2 91 (58)Net cash from investing activities (28,741) (52,551)FINANCING ACTIVITIESFinancing cash receivedCash received
Borrowings 57,597 87,529Other financing 2,693 1,919
Total cash received 60,290 89,448Financing cash used
BorrowingsOther financing (6,374) (8,965)
Total cash used (6,374) (8,965)Net cash flows from financing activities 53,916 80,483Net (decrease)/increase in cash held 308 452Cash at beginning of year 4,514 4,062
Cash at end of year 10B 4,822 4,514Key fiscal aggregateNet cash flows from operating activities (24,867) (27,480)Net cash flows from investments in non-financial assets (12,734) (12,511)Cash surplus/(deficit) (37,601) (39,991)
Finance leases and similar arrangements (481) (2,662)GFS cash surplus/(deficit) (38,082) (42,653) The above statement should be read in conjunction with the accompanying notes.
43
Consolidated financial statements
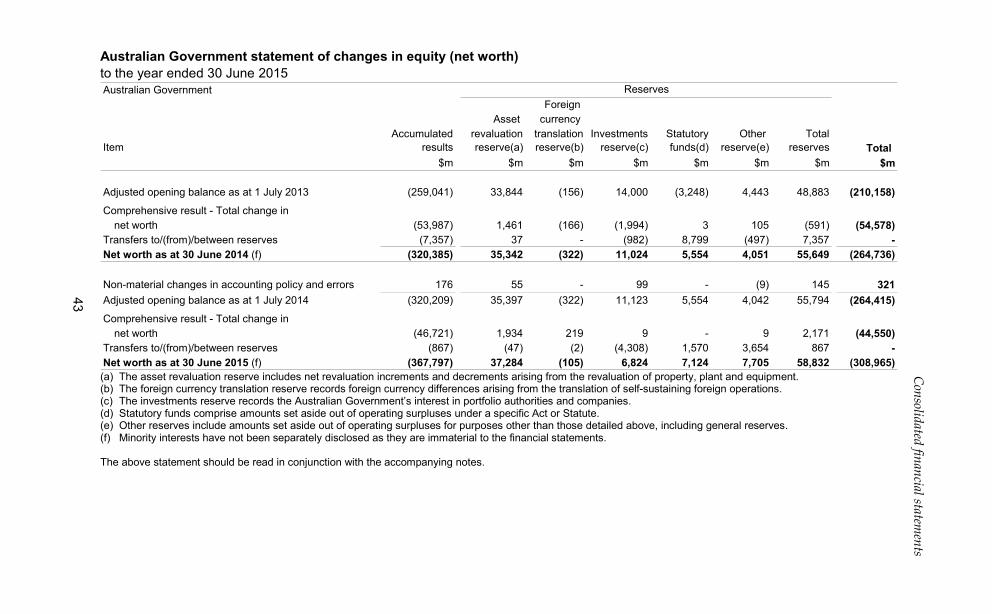
Australian Government statement of changes in equity (net worth) to the year ended 30 June 2015 Australian Government
Foreign Asset currency
Accumulated revaluation translation Investments Statutory Other TotalItem results reserve(a) reserve(b) reserve(c) funds(d) reserve(e) reserves Total
$m $m $m $m $m $m $m $m
Adjusted opening balance as at 1 July 2013 (259,041) 33,844 (156) 14,000 (3,248) 4,443 48,883 (210,158)Comprehensive result - Total change in
net worth (53,987) 1,461 (166) (1,994) 3 105 (591) (54,578)Transfers to/(from)/between reserves (7,357) 37 - (982) 8,799 (497) 7,357 -Net worth as at 30 June 2014 (f) (320,385) 35,342 (322) 11,024 5,554 4,051 55,649 (264,736)
Non-material changes in accounting policy and errors 176 55 - 99 - (9) 145 321Adjusted opening balance as at 1 July 2014 (320,209) 35,397 (322) 11,123 5,554 4,042 55,794 (264,415)Comprehensive result - Total change in
net worth (46,721) 1,934 219 9 - 9 2,171 (44,550)Transfers to/(from)/between reserves (867) (47) (2) (4,308) 1,570 3,654 867 -Net worth as at 30 June 2015 (f) (367,797) 37,284 (105) 6,824 7,124 7,705 58,832 (308,965)
Reserves
(a) The asset revaluation reserve includes net revaluation increments and decrements arising from the revaluation of property, plant and equipment. (b) The foreign currency translation reserve records foreign currency differences arising from the translation of self-sustaining foreign operations. (c) The investments reserve records the Australian Government’s interest in portfolio authorities and companies. (d) Statutory funds comprise amounts set aside out of operating surpluses under a specific Act or Statute. (e) Other reserves include amounts set aside out of operating surpluses for purposes other than those detailed above, including general reserves. (f) Minority interests have not been separately disclosed as they are immaterial to the financial statements. The above statement should be read in conjunction with the accompanying notes.

SECTOR STATEMENTS

47
Sector statements
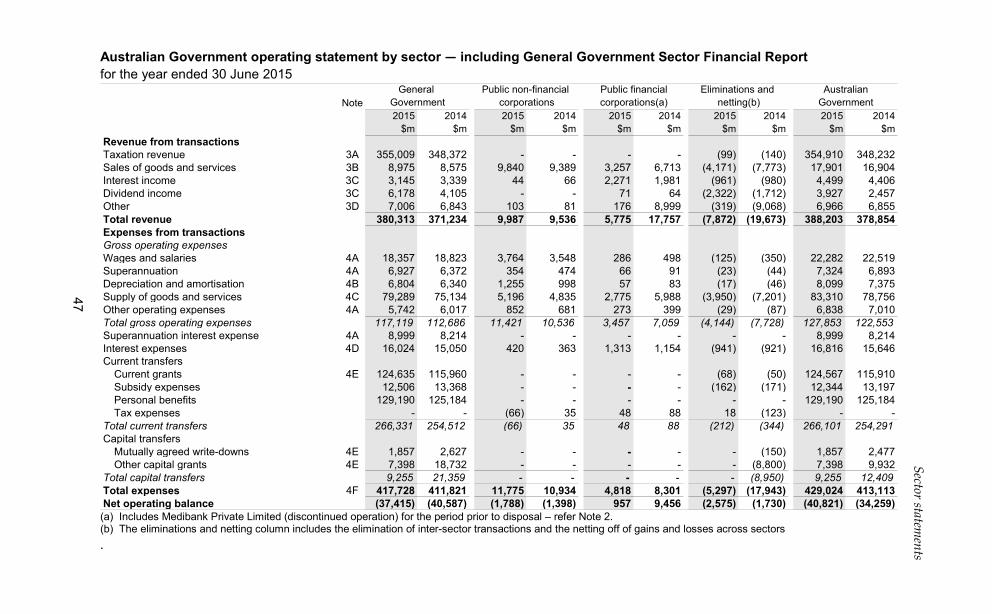
Australian Government operating statement by sector — including General Government Sector Financial Report for the year ended 30 June 2015
Note2015 2014 2015 2014 2015 2014 2015 2014 2015 2014
$m $m $m $m $m $m $m $m $m $mRevenue from transactionsTaxation revenue 3A 355,009 348,372 - - - - (99) (140) 354,910 348,232Sales of goods and services 3B 8,975 8,575 9,840 9,389 3,257 6,713 (4,171) (7,773) 17,901 16,904Interest income 3C 3,145 3,339 44 66 2,271 1,981 (961) (980) 4,499 4,406Dividend income 3C 6,178 4,105 - - 71 64 (2,322) (1,712) 3,927 2,457Other 3D 7,006 6,843 103 81 176 8,999 (319) (9,068) 6,966 6,855Total revenue 380,313 371,234 9,987 9,536 5,775 17,757 (7,872) (19,673) 388,203 378,854Expenses from transactionsGross operating expensesWages and salaries 4A 18,357 18,823 3,764 3,548 286 498 (125) (350) 22,282 22,519Superannuation 4A 6,927 6,372 354 474 66 91 (23) (44) 7,324 6,893Depreciation and amortisation 4B 6,804 6,340 1,255 998 57 83 (17) (46) 8,099 7,375Supply of goods and services 4C 79,289 75,134 5,196 4,835 2,775 5,988 (3,950) (7,201) 83,310 78,756Other operating expenses 4A 5,742 6,017 852 681 273 399 (29) (87) 6,838 7,010Total gross operating expenses 117,119 112,686 11,421 10,536 3,457 7,059 (4,144) (7,728) 127,853 122,553Superannuation interest expense 4A 8,999 8,214 - - - - - - 8,999 8,214Interest expenses 4D 16,024 15,050 420 363 1,313 1,154 (941) (921) 16,816 15,646Current transfers
Current grants 4E 124,635 115,960 - - - - (68) (50) 124,567 115,910Subsidy expenses 12,506 13,368 - - - - (162) (171) 12,344 13,197Personal benefits 129,190 125,184 - - - - - - 129,190 125,184Tax expenses - - (66) 35 48 88 18 (123) - -
Total current transfers 266,331 254,512 (66) 35 48 88 (212) (344) 266,101 254,291Capital transfers
Mutually agreed write-downs 4E 1,857 2,627 - - - - - (150) 1,857 2,477Other capital grants 4E 7,398 18,732 - - - - - (8,800) 7,398 9,932
Total capital transfers 9,255 21,359 - - - - - (8,950) 9,255 12,409Total expenses 4F 417,728 411,821 11,775 10,934 4,818 8,301 (5,297) (17,943) 429,024 413,113Net operating balance (37,415) (40,587) (1,788) (1,398) 957 9,456 (2,575) (1,730) (40,821) (34,259)
netting(b)General
Government corporations corporations(a)Public non-financial Public financial
GovernmentAustralianEliminations and
(a) Includes Medibank Private Limited (discontinued operation) for the period prior to disposal – refer Note 2. (b) The eliminations and netting column includes the elimination of inter-sector transactions and the netting off of gains and losses across sectors .
48
Sector statements
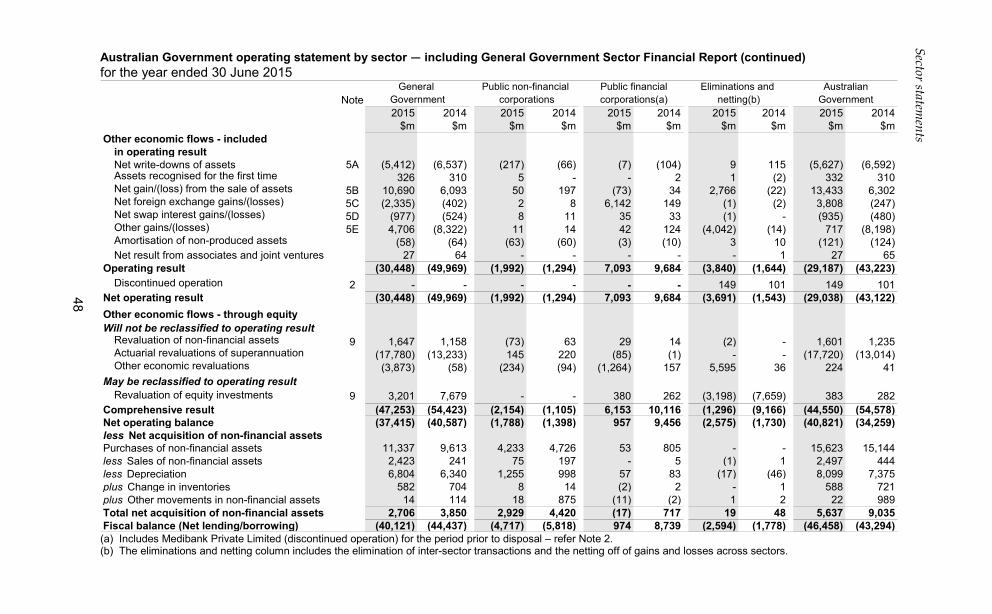
Australian Government operating statement by sector — including General Government Sector Financial Report (continued) for the year ended 30 June 2015
Note2015 2014 2015 2014 2015 2014 2015 2014 2015 2014
$m $m $m $m $m $m $m $m $m $mOther economic flows - included
in operating resultNet write-downs of assets 5A (5,412) (6,537) (217) (66) (7) (104) 9 115 (5,627) (6,592)Assets recognised for the first time 326 310 5 - - 2 1 (2) 332 310Net gain/(loss) from the sale of assets 5B 10,690 6,093 50 197 (73) 34 2,766 (22) 13,433 6,302Net foreign exchange gains/(losses) 5C (2,335) (402) 2 8 6,142 149 (1) (2) 3,808 (247)Net swap interest gains/(losses) 5D (977) (524) 8 11 35 33 (1) - (935) (480)Other gains/(losses) 5E 4,706 (8,322) 11 14 42 124 (4,042) (14) 717 (8,198)Amortisation of non-produced assets (58) (64) (63) (60) (3) (10) 3 10 (121) (124)Net result from associates and joint ventures 27 64 - - - - - 1 27 65
Operating result (30,448) (49,969) (1,992) (1,294) 7,093 9,684 (3,840) (1,644) (29,187) (43,223)Discontinued operation 2 - - - - - - 149 101 149 101
Net operating result (30,448) (49,969) (1,992) (1,294) 7,093 9,684 (3,691) (1,543) (29,038) (43,122)Other economic flows - through equityWill not be reclassified to operating result
Revaluation of non-financial assets 9 1,647 1,158 (73) 63 29 14 (2) - 1,601 1,235Actuarial revaluations of superannuation (17,780) (13,233) 145 220 (85) (1) - - (17,720) (13,014)Other economic revaluations (3,873) (58) (234) (94) (1,264) 157 5,595 36 224 41
May be reclassified to operating resultRevaluation of equity investments 9 3,201 7,679 - - 380 262 (3,198) (7,659) 383 282
Comprehensive result (47,253) (54,423) (2,154) (1,105) 6,153 10,116 (1,296) (9,166) (44,550) (54,578)Net operating balance (37,415) (40,587) (1,788) (1,398) 957 9,456 (2,575) (1,730) (40,821) (34,259)less Net acquisition of non-financial assetsPurchases of non-financial assets 11,337 9,613 4,233 4,726 53 805 - - 15,623 15,144less Sales of non-financial assets 2,423 241 75 197 - 5 (1) 1 2,497 444less Depreciation 6,804 6,340 1,255 998 57 83 (17) (46) 8,099 7,375plus Change in inventories 582 704 8 14 (2) 2 - 1 588 721plus Other movements in non-financial assets 14 114 18 875 (11) (2) 1 2 22 989Total net acquisition of non-financial assets 2,706 3,850 2,929 4,420 (17) 717 19 48 5,637 9,035Fiscal balance (Net lending/borrowing) (40,121) (44,437) (4,717) (5,818) 974 8,739 (2,594) (1,778) (46,458) (43,294)
Government corporations corporations(a)General Public non-financial Public financial
netting(b) GovernmentEliminations and Australian
(a) Includes Medibank Private Limited (discontinued operation) for the period prior to disposal – refer Note 2. (b) The eliminations and netting column includes the elimination of inter-sector transactions and the netting off of gains and losses across sectors.
49
Sector statements
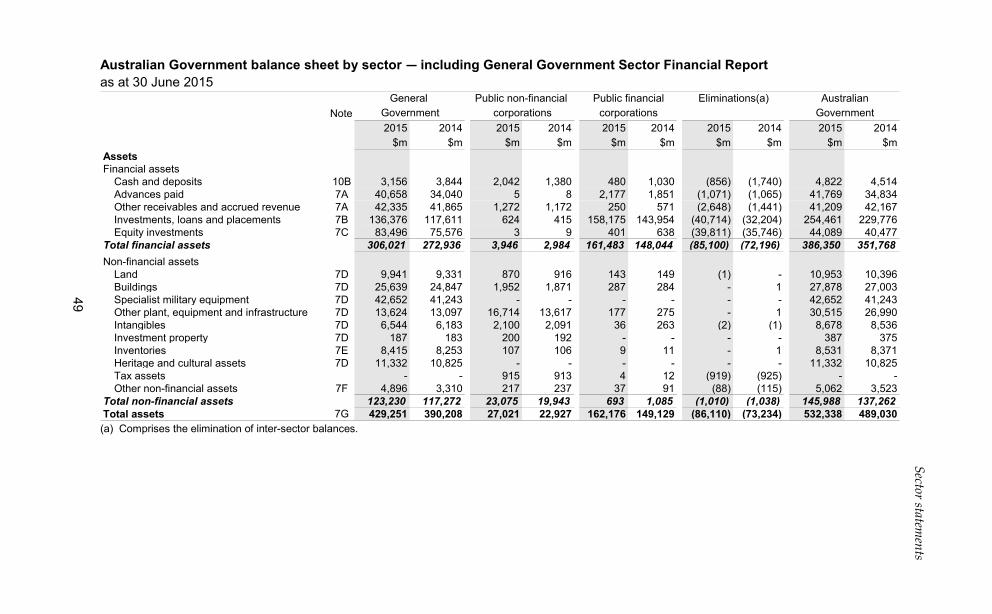
Australian Government balance sheet by sector — including General Government Sector Financial Report as at 30 June 2015
Note2015 2014 2015 2014 2015 2014 2015 2014 2015 2014
$m $m $m $m $m $m $m $m $m $mAssetsFinancial assets
Cash and deposits 10B 3,156 3,844 2,042 1,380 480 1,030 (856) (1,740) 4,822 4,514Advances paid 7A 40,658 34,040 5 8 2,177 1,851 (1,071) (1,065) 41,769 34,834Other receivables and accrued revenue 7A 42,335 41,865 1,272 1,172 250 571 (2,648) (1,441) 41,209 42,167Investments, loans and placements 7B 136,376 117,611 624 415 158,175 143,954 (40,714) (32,204) 254,461 229,776Equity investments 7C 83,496 75,576 3 9 401 638 (39,811) (35,746) 44,089 40,477
Total financial assets 306,021 272,936 3,946 2,984 161,483 148,044 (85,100) (72,196) 386,350 351,768Non-financial assets
Land 7D 9,941 9,331 870 916 143 149 (1) - 10,953 10,396Buildings 7D 25,639 24,847 1,952 1,871 287 284 - 1 27,878 27,003Specialist military equipment 7D 42,652 41,243 - - - - - - 42,652 41,243Other plant, equipment and infrastructure 7D 13,624 13,097 16,714 13,617 177 275 - 1 30,515 26,990Intangibles 7D 6,544 6,183 2,100 2,091 36 263 (2) (1) 8,678 8,536Investment property 7D 187 183 200 192 - - - - 387 375Inventories 7E 8,415 8,253 107 106 9 11 - 1 8,531 8,371Heritage and cultural assets 7D 11,332 10,825 - - - - - - 11,332 10,825Tax assets - - 915 913 4 12 (919) (925) - -Other non-financial assets 7F 4,896 3,310 217 237 37 91 (88) (115) 5,062 3,523
Total non-financial assets 123,230 117,272 23,075 19,943 693 1,085 (1,010) (1,038) 145,988 137,262Total assets 7G 429,251 390,208 27,021 22,927 162,176 149,129 (86,110) (73,234) 532,338 489,030
General Government
AustralianGovernmentcorporations
Public financial Eliminations(a)Public non-financial corporations
(a) Comprises the elimination of inter-sector balances.
50
Sector statements
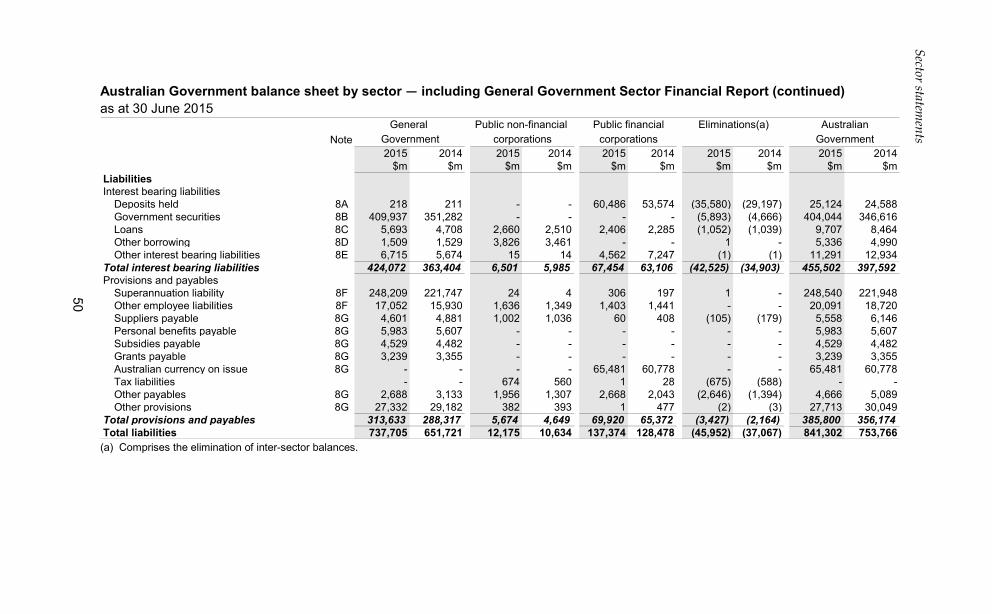
Australian Government balance sheet by sector — including General Government Sector Financial Report (continued) as at 30 June 2015
Note2015 2014 2015 2014 2015 2014 2015 2014 2015 2014
$m $m $m $m $m $m $m $m $m $mLiabilitiesInterest bearing liabilities
Deposits held 8A 218 211 - - 60,486 53,574 (35,580) (29,197) 25,124 24,588Government securities 8B 409,937 351,282 - - - - (5,893) (4,666) 404,044 346,616Loans 8C 5,693 4,708 2,660 2,510 2,406 2,285 (1,052) (1,039) 9,707 8,464Other borrowing 8D 1,509 1,529 3,826 3,461 - - 1 - 5,336 4,990Other interest bearing liabilities 8E 6,715 5,674 15 14 4,562 7,247 (1) (1) 11,291 12,934
Total interest bearing liabilities 424,072 363,404 6,501 5,985 67,454 63,106 (42,525) (34,903) 455,502 397,592Provisions and payables
Superannuation liability 8F 248,209 221,747 24 4 306 197 1 - 248,540 221,948Other employee liabilities 8F 17,052 15,930 1,636 1,349 1,403 1,441 - - 20,091 18,720Suppliers payable 8G 4,601 4,881 1,002 1,036 60 408 (105) (179) 5,558 6,146Personal benefits payable 8G 5,983 5,607 - - - - - - 5,983 5,607Subsidies payable 8G 4,529 4,482 - - - - - - 4,529 4,482Grants payable 8G 3,239 3,355 - - - - - - 3,239 3,355Australian currency on issue 8G - - - - 65,481 60,778 - - 65,481 60,778Tax liabilities - - 674 560 1 28 (675) (588) - -Other payables 8G 2,688 3,133 1,956 1,307 2,668 2,043 (2,646) (1,394) 4,666 5,089Other provisions 8G 27,332 29,182 382 393 1 477 (2) (3) 27,713 30,049
Total provisions and payables 313,633 288,317 5,674 4,649 69,920 65,372 (3,427) (2,164) 385,800 356,174Total liabilities 737,705 651,721 12,175 10,634 137,374 128,478 (45,952) (37,067) 841,302 753,766
General Government Government
Australiancorporations corporations
Public non-financial Public financial Eliminations(a)
(a) Comprises the elimination of inter-sector balances.
51
Sector statements
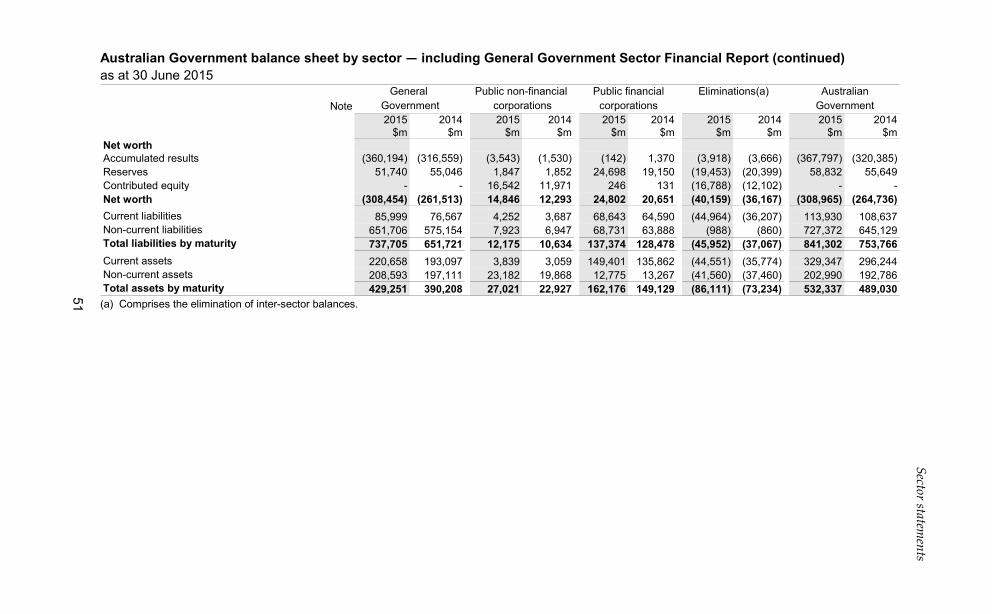
Australian Government balance sheet by sector — including General Government Sector Financial Report (continued) as at 30 June 2015
Note2015 2014 2015 2014 2015 2014 2015 2014 2015 2014
$m $m $m $m $m $m $m $m $m $mNet worthAccumulated results (360,194) (316,559) (3,543) (1,530) (142) 1,370 (3,918) (3,666) (367,797) (320,385)Reserves 51,740 55,046 1,847 1,852 24,698 19,150 (19,453) (20,399) 58,832 55,649Contributed equity - - 16,542 11,971 246 131 (16,788) (12,102) - -Net worth (308,454) (261,513) 14,846 12,293 24,802 20,651 (40,159) (36,167) (308,965) (264,736)Current liabilities 85,999 76,567 4,252 3,687 68,643 64,590 (44,964) (36,207) 113,930 108,637Non-current liabilities 651,706 575,154 7,923 6,947 68,731 63,888 (988) (860) 727,372 645,129Total liabilities by maturity 737,705 651,721 12,175 10,634 137,374 128,478 (45,952) (37,067) 841,302 753,766Current assets 220,658 193,097 3,839 3,059 149,401 135,862 (44,551) (35,774) 329,347 296,244Non-current assets 208,593 197,111 23,182 19,868 12,775 13,267 (41,560) (37,460) 202,990 192,786Total assets by maturity 429,251 390,208 27,021 22,927 162,176 149,129 (86,111) (73,234) 532,337 489,030
GovernmentGeneral Australian
corporations corporations GovernmentPublic non-financial Public financial Eliminations(a)
(a) Comprises the elimination of inter-sector balances.
52
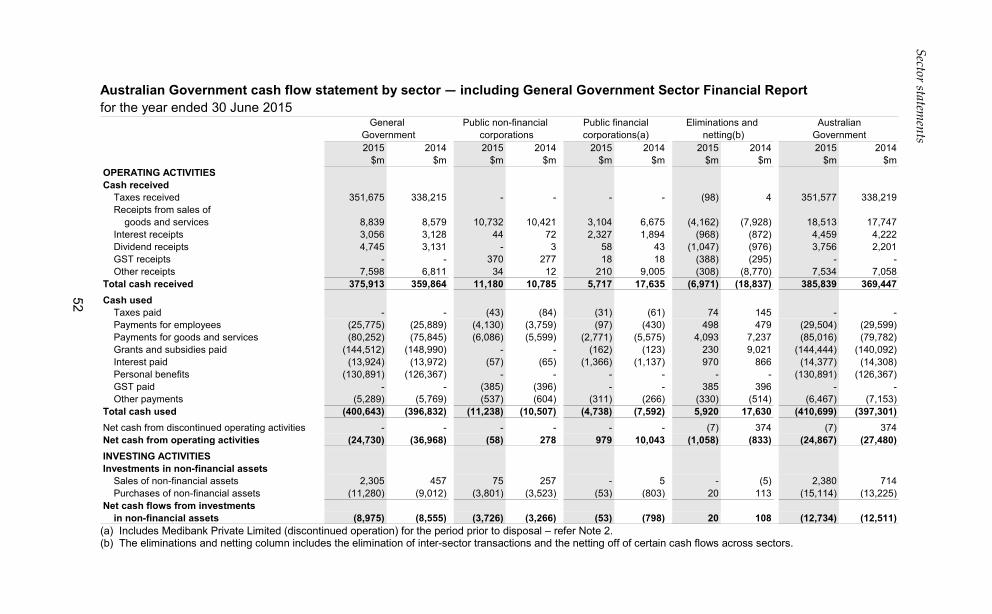
Sector statements
Australian Government cash flow statement by sector — including General Government Sector Financial Report
for the year ended 30 June 2015
2015 2014 2015 2014 2015 2014 2015 2014 2015 2014$m $m $m $m $m $m $m $m $m $m
OPERATING ACTIVITIESCash received
Taxes received 351,675 338,215 - - - - (98) 4 351,577 338,219Receipts from sales of
goods and services 8,839 8,579 10,732 10,421 3,104 6,675 (4,162) (7,928) 18,513 17,747Interest receipts 3,056 3,128 44 72 2,327 1,894 (968) (872) 4,459 4,222Dividend receipts 4,745 3,131 - 3 58 43 (1,047) (976) 3,756 2,201GST receipts - - 370 277 18 18 (388) (295) - -Other receipts 7,598 6,811 34 12 210 9,005 (308) (8,770) 7,534 7,058
Total cash received 375,913 359,864 11,180 10,785 5,717 17,635 (6,971) (18,837) 385,839 369,447Cash used
Taxes paid - - (43) (84) (31) (61) 74 145 - -Payments for employees (25,775) (25,889) (4,130) (3,759) (97) (430) 498 479 (29,504) (29,599)Payments for goods and services (80,252) (75,845) (6,086) (5,599) (2,771) (5,575) 4,093 7,237 (85,016) (79,782)Grants and subsidies paid (144,512) (148,990) - - (162) (123) 230 9,021 (144,444) (140,092)Interest paid (13,924) (13,972) (57) (65) (1,366) (1,137) 970 866 (14,377) (14,308)Personal benefits (130,891) (126,367) - - - - - - (130,891) (126,367)GST paid - - (385) (396) - - 385 396 - -Other payments (5,289) (5,769) (537) (604) (311) (266) (330) (514) (6,467) (7,153)
Total cash used (400,643) (396,832) (11,238) (10,507) (4,738) (7,592) 5,920 17,630 (410,699) (397,301)Net cash from discontinued operating activities - - - - - - (7) 374 (7) 374Net cash from operating activities (24,730) (36,968) (58) 278 979 10,043 (1,058) (833) (24,867) (27,480)INVESTING ACTIVITIESInvestments in non-financial assets
Sales of non-financial assets 2,305 457 75 257 - 5 - (5) 2,380 714Purchases of non-financial assets (11,280) (9,012) (3,801) (3,523) (53) (803) 20 113 (15,114) (13,225)
Net cash flows from investmentsin non-financial assets (8,975) (8,555) (3,726) (3,266) (53) (798) 20 108 (12,734) (12,511)
Public non-financial corporations
Public financialcorporations(a)
General Government
Eliminations and Australiannetting(b) Government
(a) Includes Medibank Private Limited (discontinued operation) for the period prior to disposal – refer Note 2. (b) The eliminations and netting column includes the elimination of inter-sector transactions and the netting off of certain cash flows across sectors.
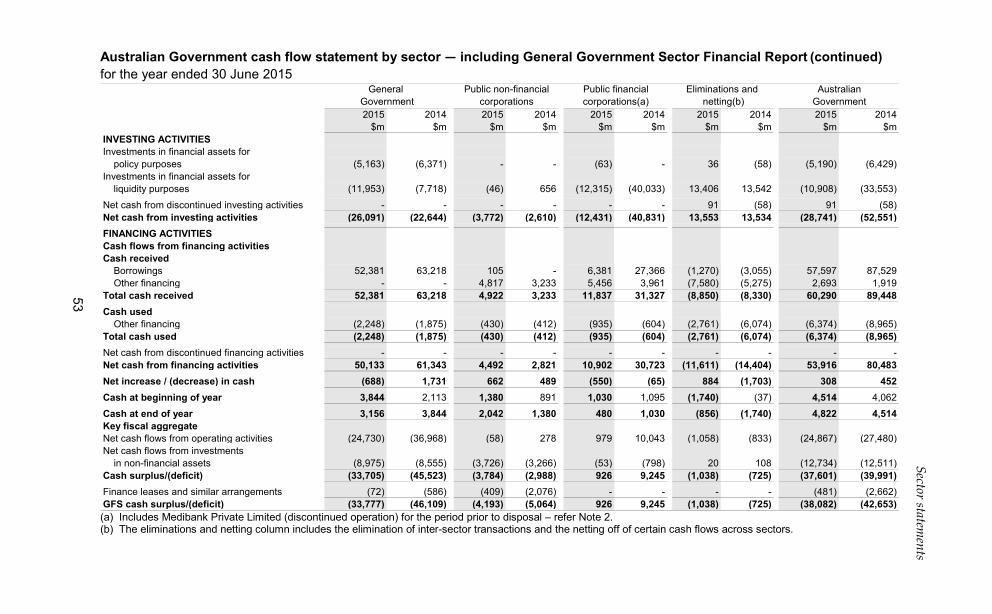
53
Sector statements
Australian Government cash flow statement by sector — including General Government Sector Financial Report (continued) for the year ended 30 June 2015
2015 2014 2015 2014 2015 2014 2015 2014 2015 2014$m $m $m $m $m $m $m $m $m $m
INVESTING ACTIVITIESInvestments in financial assets for
policy purposes (5,163) (6,371) - - (63) - 36 (58) (5,190) (6,429)Investments in financial assets for
liquidity purposes (11,953) (7,718) (46) 656 (12,315) (40,033) 13,406 13,542 (10,908) (33,553)
Net cash from discontinued investing activities - - - - - - 91 (58) 91 (58)Net cash from investing activities (26,091) (22,644) (3,772) (2,610) (12,431) (40,831) 13,553 13,534 (28,741) (52,551)FINANCING ACTIVITIESCash flows from financing activitiesCash received
Borrowings 52,381 63,218 105 - 6,381 27,366 (1,270) (3,055) 57,597 87,529Other financing - - 4,817 3,233 5,456 3,961 (7,580) (5,275) 2,693 1,919
Total cash received 52,381 63,218 4,922 3,233 11,837 31,327 (8,850) (8,330) 60,290 89,448Cash used
Other financing (2,248) (1,875) (430) (412) (935) (604) (2,761) (6,074) (6,374) (8,965)Total cash used (2,248) (1,875) (430) (412) (935) (604) (2,761) (6,074) (6,374) (8,965)Net cash from discontinued financing activities - - - - - - - - - -Net cash from financing activities 50,133 61,343 4,492 2,821 10,902 30,723 (11,611) (14,404) 53,916 80,483Net increase / (decrease) in cash (688) 1,731 662 489 (550) (65) 884 (1,703) 308 452Cash at beginning of year 3,844 2,113 1,380 891 1,030 1,095 (1,740) (37) 4,514 4,062
Cash at end of year 3,156 3,844 2,042 1,380 480 1,030 (856) (1,740) 4,822 4,514Key fiscal aggregateNet cash flows from operating activities (24,730) (36,968) (58) 278 979 10,043 (1,058) (833) (24,867) (27,480)Net cash flows from investments
in non-financial assets (8,975) (8,555) (3,726) (3,266) (53) (798) 20 108 (12,734) (12,511)Cash surplus/(deficit) (33,705) (45,523) (3,784) (2,988) 926 9,245 (1,038) (725) (37,601) (39,991)Finance leases and similar arrangements (72) (586) (409) (2,076) - - - - (481) (2,662)GFS cash surplus/(deficit) (33,777) (46,109) (4,193) (5,064) 926 9,245 (1,038) (725) (38,082) (42,653)
Government corporationsPublic financialcorporations(a)
Public non-financialGeneral AustralianGovernment
Eliminations and netting(b)
(a) Includes Medibank Private Limited (discontinued operation) for the period prior to disposal – refer Note 2. (b) The eliminations and netting column includes the elimination of inter-sector transactions and the netting off of certain cash flows across sectors.
54
Sector statements
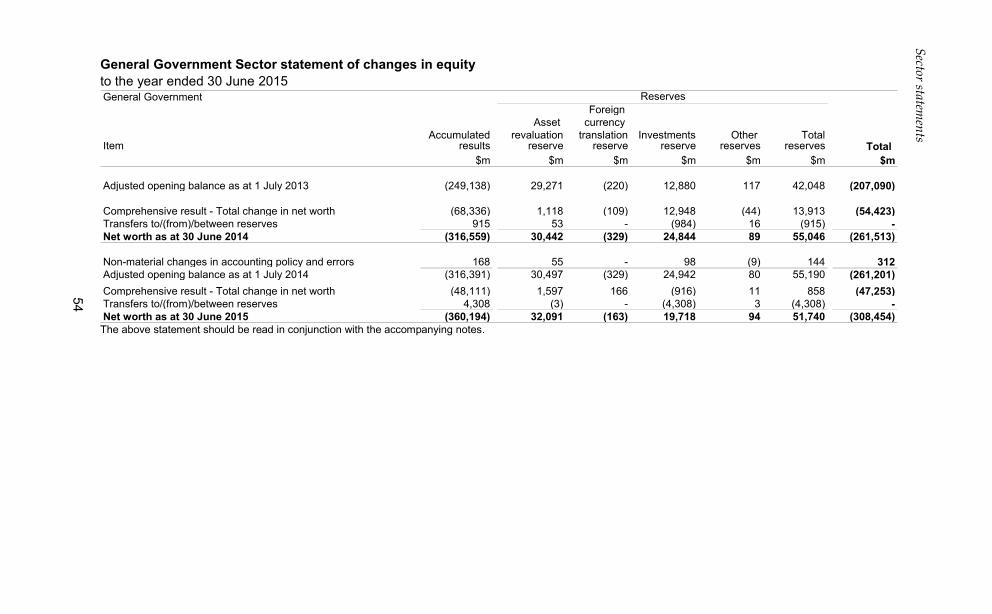
General Government Sector statement of changes in equity to the year ended 30 June 2015 General Government
Foreign Asset currency
Accumulated revaluation translation Investments Other TotalItem results reserve reserve reserve reserves reserves Total
$m $m $m $m $m $m $m
Adjusted opening balance as at 1 July 2013 (249,138) 29,271 (220) 12,880 117 42,048 (207,090)
Comprehensive result - Total change in net worth (68,336) 1,118 (109) 12,948 (44) 13,913 (54,423)Transfers to/(from)/between reserves 915 53 - (984) 16 (915) -Net worth as at 30 June 2014 (316,559) 30,442 (329) 24,844 89 55,046 (261,513)
Non-material changes in accounting policy and errors 168 55 - 98 (9) 144 312Adjusted opening balance as at 1 July 2014 (316,391) 30,497 (329) 24,942 80 55,190 (261,201)Comprehensive result - Total change in net worth (48,111) 1,597 166 (916) 11 858 (47,253)Transfers to/(from)/between reserves 4,308 (3) - (4,308) 3 (4,308) -Net worth as at 30 June 2015 (360,194) 32,091 (163) 19,718 94 51,740 (308,454)
Reserves
The above statement should be read in conjunction with the accompanying notes.

NOTES TO THE FINANCIAL STATEMENTS

57
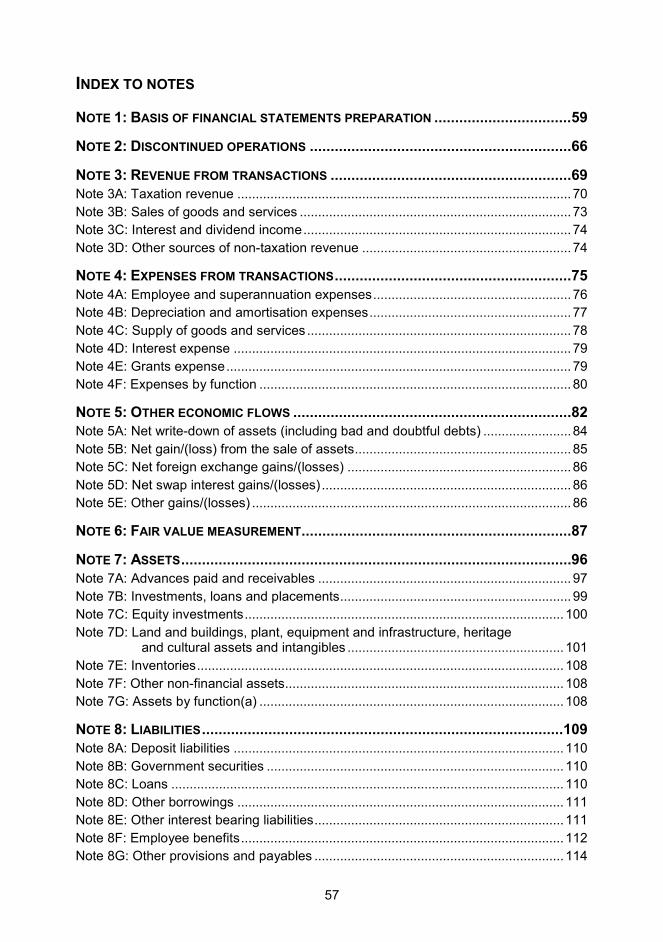
INDEX TO NOTES
NOTE 1: BASIS OF FINANCIAL STATEMENTS PREPARATION ................................. 59
NOTE 2: DISCONTINUED OPERATIONS ............................................................... 66
NOTE 3: REVENUE FROM TRANSACTIONS .......................................................... 69 Note 3A: Taxation revenue ........................................................................................... 70 Note 3B: Sales of goods and services .......................................................................... 73 Note 3C: Interest and dividend income ......................................................................... 74 Note 3D: Other sources of non-taxation revenue ......................................................... 74
NOTE 4: EXPENSES FROM TRANSACTIONS ......................................................... 75 Note 4A: Employee and superannuation expenses ...................................................... 76 Note 4B: Depreciation and amortisation expenses ....................................................... 77 Note 4C: Supply of goods and services ........................................................................ 78 Note 4D: Interest expense ............................................................................................ 79 Note 4E: Grants expense .............................................................................................. 79 Note 4F: Expenses by function ..................................................................................... 80
NOTE 5: OTHER ECONOMIC FLOWS ................................................................... 82 Note 5A: Net write-down of assets (including bad and doubtful debts) ........................ 84 Note 5B: Net gain/(loss) from the sale of assets ........................................................... 85 Note 5C: Net foreign exchange gains/(losses) ............................................................. 86 Note 5D: Net swap interest gains/(losses) .................................................................... 86 Note 5E: Other gains/(losses) ....................................................................................... 86
NOTE 6: FAIR VALUE MEASUREMENT ................................................................. 87
NOTE 7: ASSETS .............................................................................................. 96 Note 7A: Advances paid and receivables ..................................................................... 97 Note 7B: Investments, loans and placements ............................................................... 99 Note 7C: Equity investments ....................................................................................... 100 Note 7D: Land and buildings, plant, equipment and infrastructure, heritage
and cultural assets and intangibles ........................................................... 101 Note 7E: Inventories .................................................................................................... 108 Note 7F: Other non-financial assets............................................................................ 108 Note 7G: Assets by function(a) ................................................................................... 108
NOTE 8: LIABILITIES ....................................................................................... 109 Note 8A: Deposit liabilities .......................................................................................... 110 Note 8B: Government securities ................................................................................. 110 Note 8C: Loans ........................................................................................................... 110 Note 8D: Other borrowings ......................................................................................... 111 Note 8E: Other interest bearing liabilities .................................................................... 111 Note 8F: Employee benefits ........................................................................................ 112 Note 8G: Other provisions and payables .................................................................... 114
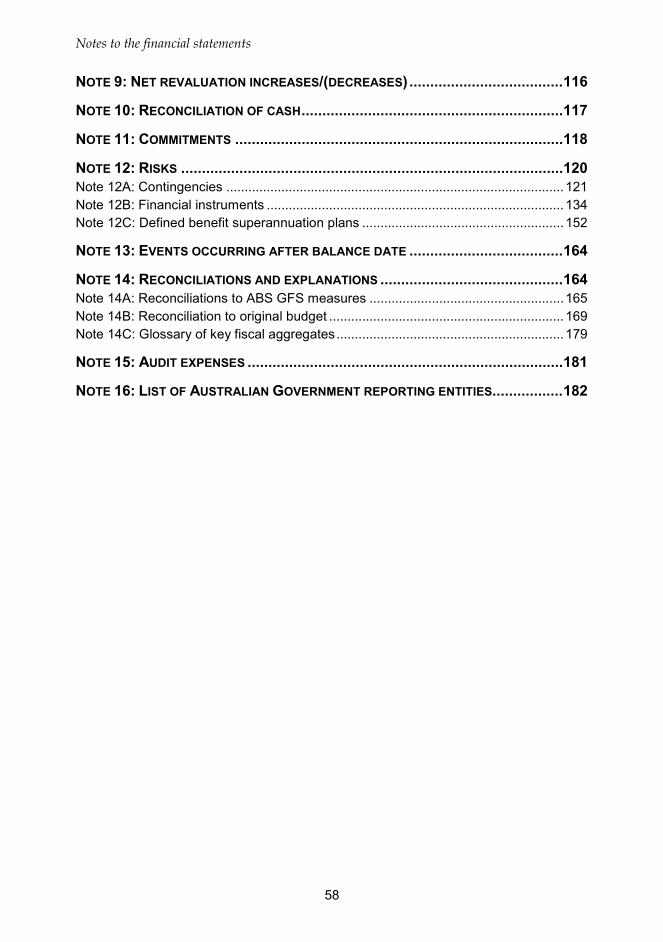
Notes to the financial statements
58
NOTE 9: NET REVALUATION INCREASES/(DECREASES) ..................................... 116
NOTE 10: RECONCILIATION OF CASH ............................................................... 117
NOTE 11: COMMITMENTS ............................................................................... 118
NOTE 12: RISKS ............................................................................................ 120 Note 12A: Contingencies ............................................................................................ 121 Note 12B: Financial instruments ................................................................................. 134 Note 12C: Defined benefit superannuation plans ....................................................... 152
NOTE 13: EVENTS OCCURRING AFTER BALANCE DATE ..................................... 164
NOTE 14: RECONCILIATIONS AND EXPLANATIONS ............................................ 164 Note 14A: Reconciliations to ABS GFS measures ..................................................... 165 Note 14B: Reconciliation to original budget ................................................................ 169 Note 14C: Glossary of key fiscal aggregates .............................................................. 179
NOTE 15: AUDIT EXPENSES ............................................................................ 181
NOTE 16: LIST OF AUSTRALIAN GOVERNMENT REPORTING ENTITIES................. 182
Notes to the financial statements
59
Note 1: Basis of financial statements preparation
1.1 Purpose
The purpose of this note is to outline the basis on which the financial statements for the Australian Government (whole of government) and the general government sector (GGS) have been prepared.
Significant accounting policies that are relevant to understanding the financial statements are provided throughout the notes to the financial statements.
Except as otherwise noted, the accounting policies detailed in this note and throughout the notes to the financial statements are applicable at both the whole of government level and for the GGS.
1.2 Statement of compliance
The Australian Government Consolidated Financial Statements (CFS) are required by section 48 of the Public Governance, Performance and Accountability Act 2013.
The CFS are general purpose financial statements that have been prepared for the whole of government and the GGS in accordance with Australian Accounting Standards (AAS), including AASB 1049 Whole of Government and General Government Sector Financial Reporting (AASB 1049).
The GGS financial statements are included in the CFS and can be found in the Sector statements and the Notes to the financial statements.
1.3 Basis of accounting
The purpose of the CFS is to provide users with information about the stewardship by the Australian Government and accountability for the resources entrusted to it; information about the financial position, performance and cash flows of the Australian Government; and information that facilitates assessment of the macro-economic impact of the Australian Government.
The principles and rules in the Australian Bureau of Statistics Australian System of Government Finance Statistics: Concepts, Sources and Methods 2005 — ABS Catalogue No. 5514.0 (ABS GFS manual) have been applied in the production of these financial statements, except in instances in which the application would conflict with AAS.
The 2014-15 financial statements for the whole of government and the GGS have been prepared on the basis of the ABS GFS manual effective as at 1 July 2014.
Where the key fiscal aggregates presented on the face of the financial statements are materially different to that measured in accordance with the applied ABS GFS manual, a reconciliation between the two measures has been provided (refer Note 14A).
Notes to the financial statements
60
The CFS has been prepared on an accrual basis and is presented in Australian dollars.
With the exception of advances paid to the International Development Association (IDA) and the Asian Development Fund (ADF) the key fiscal aggregates reported in the CFS GGS financial statements materially align to the GGS financial statements included in the 2014-15 Final Budget Outcome (FBO). As detailed in Part 2, Note 2 of the 2014-15 FBO, AASB 1049 requires the advances paid to the IDA and ADF to be recognised at fair value. Under the ABS GFS manual, these advances are recorded at nominal value. The ABS GFS treatment is adopted in the FBO while the AAS treatment is adopted in the CFS.
1.4 New Australian Accounting Standards
Adoption of New Australian Accounting Standard Requirements
During 2014-15, the Australian Government adopted all applicable AAS that became effective during 2014-15. Other than noted below, the application of new accounting standards did not materially impact the operations of the Australian Government.
The Australian Government has early adopted AASB 2015-7 Amendments to Australian Accounting Standards — Fair Value Disclosures of Not-for-Profit Public Sector Entities (AASB 2015-7). AASB 2015-7 amends AASB 13 Fair Value Measurement to provide disclosure relief to not-for-profit public sector entities from certain disclosures about the fair value measurements of property, plant and equipment held for their current service potential rather than to generate net cash inflows. This includes relief from disclosures of quantitative information about the significant unobservable inputs used in fair value measurements and of the sensitivity of certain fair value measurements to changes in unobservable inputs.
Future Australian Accounting Standards Requirements
The Australian Accounting Standards Board (AASB) has issued a number of new standards, amendments to standards and interpretations that are effective for future reporting periods:
• AASB 15 Revenue from Contracts with Customers (AASB 15) replaces components of AASB 111 Construction Contracts, AASB 118 Revenue and AASB 1004 Contributions. AASB 15 could significantly change the pattern of revenue and profit recognition and internal budgeting processes. The new standard is effective from 1 January 2018.
• AASB 9 Financial Instruments represents the finalisation of the three phase project to replace AASB 139 Financial Instruments: Recognition and Measurement. It incorporates new principles for the requirements for recognition and measurement of financial assets and liabilities and their derecognition and general hedge accounting. This is likely to impact on the categorisation, recognition and measurement of financial instruments particularly those currently held at fair value through profit or loss. The new standard is effective from 1 January 2018.
Notes to the financial statements
61
• AASB 124 Related Party Disclosures removes the current exemption for not-for-profit public sector entities such as government departments, and adds implementation guidance with examples specifically tailored to the Australian environment. Related party transactions will be required to be disclosed to the extent necessary for users to understand the potential effect of the relationship on the financial statements. The new standard is effective from 1 July 2016.
Other than the above, current pronouncements related to future reporting periods are not expected to materially impact on future reporting periods or will not apply to the operations of the Australian Government.
1.5 Prior year adjustments and changes in accounting policy
For the 2013-14 comparatives, adjustments were made to tax related items as a result of amending the classification of provisions from bad and doubtful tax debts and credit amendments to dual tax debts. In the operating statement, this resulted in a reduction in taxation revenue from individuals of $684 million and an offsetting reduction in bad and doubtful debts of $684 million, reducing the net operating balance but with no impact on the operating result. In the balance sheet, there was a reduction to gross taxation receivables of $1,007 million with a corresponding reduction in the provisions for doubtful debts and credit amendments, resulting in no change to net receivables. The comparatives have been adjusted to eliminate Future Fund imputation credits receivable from, and payable to, the Australian Taxation Office. These were previously recognised on a gross basis. The comparative imputation credit receivable at 30 June 2014 was $764 million (1 July 2013: $489 million) while the payable was $343 million (1 July 2013: $220 million). The net movement of $153 million has been eliminated against income tax revenue in 2013-14. The 2013-14 comparatives were also restated to reclassify work in progress from ‘other non-financial assets’ to the respective classes of buildings, infrastructure, plant and equipment and intangibles. Other reclassifications have been disclosed in the relevant notes. 1.6 The reporting entity and basis of consolidation
For the purposes of these financial statements, the Australian Government means the executive (consisting principally of Ministers and their departments), the legislature (that is, the Parliament) and the judiciary (that is, the courts). Where the ‘Australian Government’ is referred to throughout these statements it is intended to also mean the ‘Commonwealth of Australia’. The Australian Government reporting entity (referred to as the reporting entity) includes Australian Government Departments of State, Parliamentary Departments, other non-corporate Commonwealth entities, corporate Commonwealth entities and Commonwealth companies in which the Australian Government holds a controlling interest.
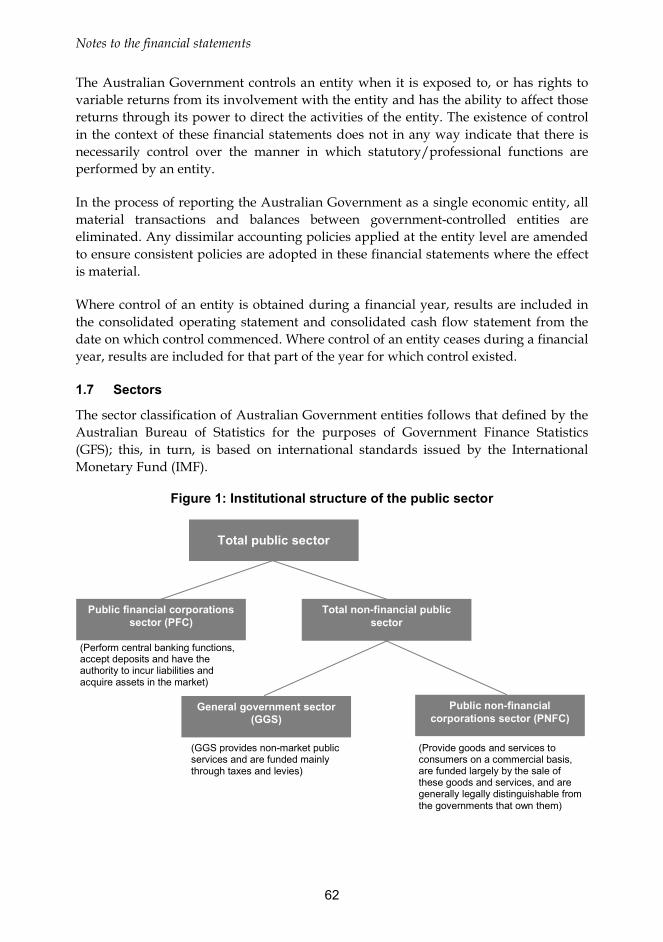
Notes to the financial statements
62
The Australian Government controls an entity when it is exposed to, or has rights to variable returns from its involvement with the entity and has the ability to affect those returns through its power to direct the activities of the entity. The existence of control in the context of these financial statements does not in any way indicate that there is necessarily control over the manner in which statutory/professional functions are performed by an entity.
In the process of reporting the Australian Government as a single economic entity, all material transactions and balances between government-controlled entities are eliminated. Any dissimilar accounting policies applied at the entity level are amended to ensure consistent policies are adopted in these financial statements where the effect is material.
Where control of an entity is obtained during a financial year, results are included in the consolidated operating statement and consolidated cash flow statement from the date on which control commenced. Where control of an entity ceases during a financial year, results are included for that part of the year for which control existed.
1.7 Sectors
The sector classification of Australian Government entities follows that defined by the Australian Bureau of Statistics for the purposes of Government Finance Statistics (GFS); this, in turn, is based on international standards issued by the International Monetary Fund (IMF).
Figure 1: Institutional structure of the public sector
Total public sector
Total non-financial public sector
Public non-financial corporations sector (PNFC)
Public financial corporations sector (PFC)
General government sector (GGS)
(Provide goods and services to consumers on a commercial basis, are funded largely by the sale of these goods and services, and are generally legally distinguishable from the governments that own them)
(Perform central banking functions, accept deposits and have the authority to incur liabilities and acquire assets in the market)
(GGS provides non-market public services and are funded mainly through taxes and levies)
Notes to the financial statements
63
1.8 Significant accounting judgements and estimates
In preparing financial statements, Australian Government entities are required to make judgements and estimates that impact:
• income and expenses for the year;
• the reported amounts of assets and liabilities; and
• the disclosure of off-balance sheet arrangements, including contingent assets and contingent liabilities.
Judgements and estimates are subject to periodic review, including through the receipt of actuarial advice. Judgements and estimates are based on historical experience, various other assumptions believed to be reasonable under the circumstances and, where appropriate, practices adopted by other entities.
Specialist military equipment
Prior to 2014-15, AASB 1049 permitted defence weapons platforms (DWPs) to be measured in the CFS at the historic cost basis of measurement. From 2014-15, this standard requires specialist military equipment (SME), which includes DWPs, to be measured at fair value, if fair value can be reliably measured.
The requirement to recognise almost all property, plant and equipment assets at fair value is unique to government. This requirement has arisen from the multi-year project to reduce complexity through the harmonisation of the two reporting frameworks applicable to government — AAS and GFS. The accounting standard AASB 1049 is the result of this harmonisation project and has been in place since 2008-09. As part of the harmonisation process, the option available to reporting entities under the accounting standards to recognise property, plant and equipment either at cost, or at fair value, was removed for consolidated government reporting. The removal of this option was to provide consistency with the broad GFS requirement that all assets be recorded at market or fair value.
AASB 1049 does provide one exception to this requirement, and that is where fair value cannot be reliably measured. Given the difficulties in measuring DWPs1, AASB 1049 also provided extended transitional relief until 2014-15 from the requirement to measure these assets at fair value. This relief, which only applied to
1 The basis of conclusion to the amending standard AASB 2012-8 Amendments to AASB 1049 — Extension of Transitional Relief for the Adoption of Amendments to the ABS GFS Manual relating to Defence Weapons Platforms, stated the “Board considered a submission arguing that more time was needed to measure assets classified as defence weapons platforms at fair value, for the purposes of financial reporting under AASB 1049, due to the magnitude and complexity of the valuation exercise for such assets. Constituents familiar with the nature and quantity of the assets involved advised the Board that an extension of transitional relief for two years would be required to comply. The Board agreed that the extension is warranted, and considered that such an extension should be sufficient and therefore would not expect to provide further relief for such assets in the future”.
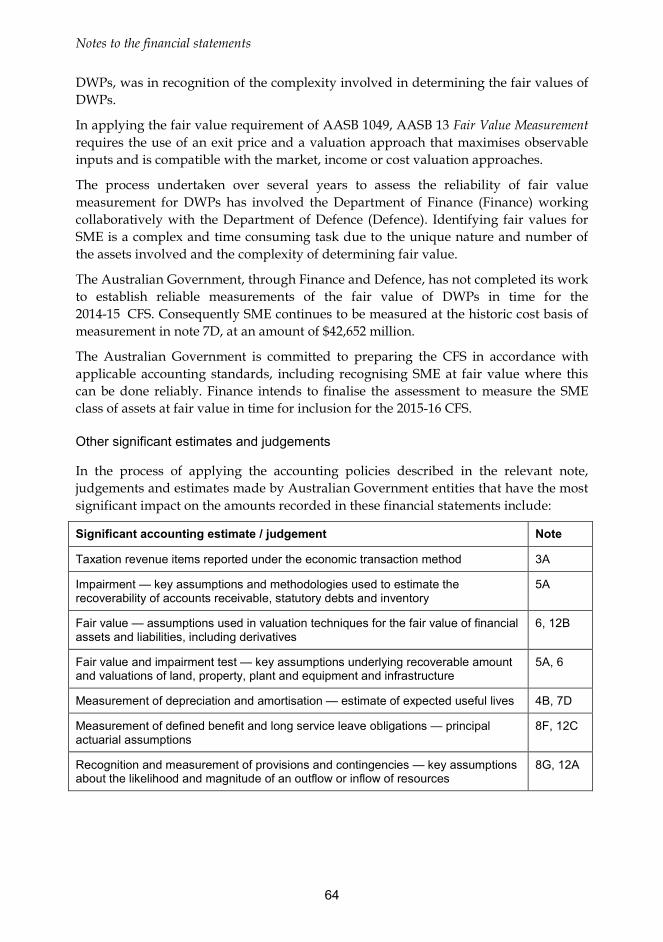
Notes to the financial statements
64
DWPs, was in recognition of the complexity involved in determining the fair values of DWPs.
In applying the fair value requirement of AASB 1049, AASB 13 Fair Value Measurement requires the use of an exit price and a valuation approach that maximises observable inputs and is compatible with the market, income or cost valuation approaches.
The process undertaken over several years to assess the reliability of fair value measurement for DWPs has involved the Department of Finance (Finance) working collaboratively with the Department of Defence (Defence). Identifying fair values for SME is a complex and time consuming task due to the unique nature and number of the assets involved and the complexity of determining fair value.
The Australian Government, through Finance and Defence, has not completed its work to establish reliable measurements of the fair value of DWPs in time for the 2014-15 CFS. Consequently SME continues to be measured at the historic cost basis of measurement in note 7D, at an amount of $42,652 million.
The Australian Government is committed to preparing the CFS in accordance with applicable accounting standards, including recognising SME at fair value where this can be done reliably. Finance intends to finalise the assessment to measure the SME class of assets at fair value in time for inclusion for the 2015-16 CFS.
Other significant estimates and judgements
In the process of applying the accounting policies described in the relevant note, judgements and estimates made by Australian Government entities that have the most significant impact on the amounts recorded in these financial statements include:
Significant accounting estimate / judgement Note
Taxation revenue items reported under the economic transaction method 3A
Impairment — key assumptions and methodologies used to estimate the recoverability of accounts receivable, statutory debts and inventory
5A
Fair value — assumptions used in valuation techniques for the fair value of financial assets and liabilities, including derivatives
6, 12B
Fair value and impairment test — key assumptions underlying recoverable amount and valuations of land, property, plant and equipment and infrastructure
5A, 6
Measurement of depreciation and amortisation — estimate of expected useful lives 4B, 7D
Measurement of defined benefit and long service leave obligations — principal actuarial assumptions
8F, 12C
Recognition and measurement of provisions and contingencies — key assumptions about the likelihood and magnitude of an outflow or inflow of resources
8G, 12A
Notes to the financial statements
65
1.9 Insurance
Australian Government entities operating in the GGS are members of the Australian Government’s self managed fund for insurable risks, Comcover. This excludes workers compensation where the risk continues to be managed by Comcare. Australian Government entities operating outside the GGS adopt their own insurance strategies, which includes both self-insurance and commercial insurance coverage.
1.10 Rounding
All amounts have been rounded to the nearest million dollars, unless otherwise noted.
1.11 Audit of Australian Government controlled entities
These financial statements are consolidated from the 2014-15 financial statements of Australian Government entities that were all audit signed.
1.12 Compliance with the Constitution
Section 83 of the Constitution provides that no amount may be paid out of the Consolidated Revenue Fund except under an appropriation made by law. Australian Government entities continue to monitor their level of compliance with section 83 of the Constitution across all legislation for which they have legislative responsibility.
It is important to note that it is not possible in all instances to fully remove the potential for section 83 breaches under existing legislation. In many cases the Australian Government relies on information provided by payment recipients to calculate and pay appropriate entitlements, and this information is not always timely or accurate. The following table shows the number and value of actual and potential breaches identified in 2014-15, and amounts recovered to date, for those entities that have reported actual or potential non-compliance with section 83 of the Constitution:
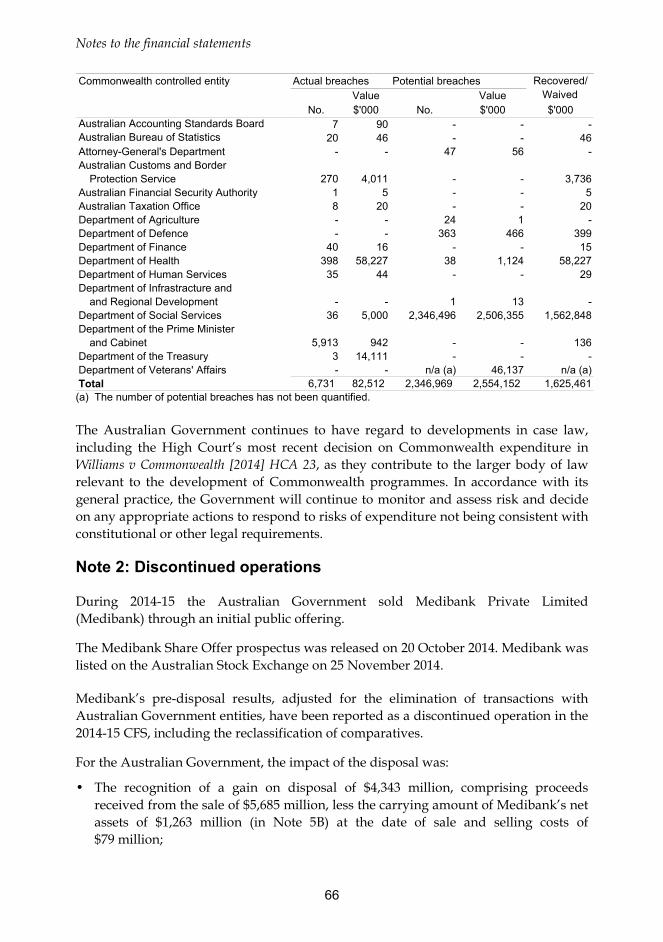
Notes to the financial statements
66
Commonwealth controlled entity Actual breaches Potential breaches Recovered/Value Value Waived
No. $'000 No. $'000 $'000Australian Accounting Standards Board 7 90 - - -Australian Bureau of Statistics 20 46 - - 46Attorney-General's Department - - 47 56 -Australian Customs and Border
Protection Service 270 4,011 - - 3,736Australian Financial Security Authority 1 5 - - 5Australian Taxation Office 8 20 - - 20Department of Agriculture - - 24 1 -Department of Defence - - 363 466 399Department of Finance 40 16 - - 15Department of Health 398 58,227 38 1,124 58,227Department of Human Services 35 44 - - 29Department of Infrastracture and
and Regional Development - - 1 13 -Department of Social Services 36 5,000 2,346,496 2,506,355 1,562,848Department of the Prime Minister
and Cabinet 5,913 942 - - 136Department of the Treasury 3 14,111 - - -Department of Veterans' Affairs - - n/a (a) 46,137 n/a (a)Total 6,731 82,512 2,346,969 2,554,152 1,625,461 (a) The number of potential breaches has not been quantified. The Australian Government continues to have regard to developments in case law, including the High Court’s most recent decision on Commonwealth expenditure in Williams v Commonwealth [2014] HCA 23, as they contribute to the larger body of law relevant to the development of Commonwealth programmes. In accordance with its general practice, the Government will continue to monitor and assess risk and decide on any appropriate actions to respond to risks of expenditure not being consistent with constitutional or other legal requirements.
Note 2: Discontinued operations
During 2014-15 the Australian Government sold Medibank Private Limited (Medibank) through an initial public offering.
The Medibank Share Offer prospectus was released on 20 October 2014. Medibank was listed on the Australian Stock Exchange on 25 November 2014.
Medibank’s pre-disposal results, adjusted for the elimination of transactions with Australian Government entities, have been reported as a discontinued operation in the 2014-15 CFS, including the reclassification of comparatives.
For the Australian Government, the impact of the disposal was:
• The recognition of a gain on disposal of $4,343 million, comprising proceeds received from the sale of $5,685 million, less the carrying amount of Medibank’s net assets of $1,263 million (in Note 5B) at the date of sale and selling costs of $79 million;
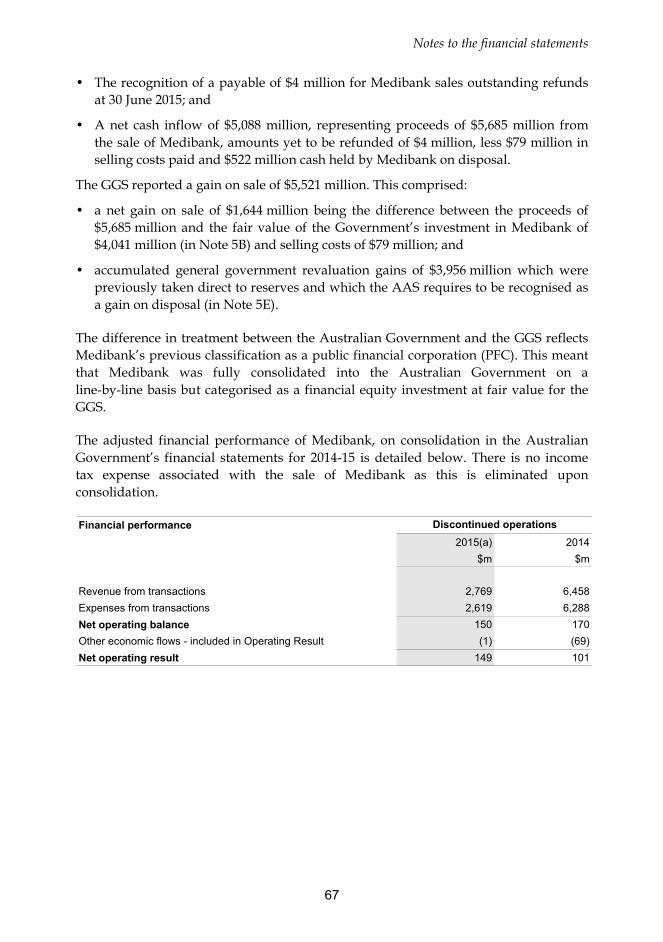
Notes to the financial statements
67
• The recognition of a payable of $4 million for Medibank sales outstanding refunds at 30 June 2015; and
• A net cash inflow of $5,088 million, representing proceeds of $5,685 million from the sale of Medibank, amounts yet to be refunded of $4 million, less $79 million in selling costs paid and $522 million cash held by Medibank on disposal.
The GGS reported a gain on sale of $5,521 million. This comprised:
• a net gain on sale of $1,644 million being the difference between the proceeds of $5,685 million and the fair value of the Government’s investment in Medibank of $4,041 million (in Note 5B) and selling costs of $79 million; and
• accumulated general government revaluation gains of $3,956 million which were previously taken direct to reserves and which the AAS requires to be recognised as a gain on disposal (in Note 5E).
The difference in treatment between the Australian Government and the GGS reflects Medibank’s previous classification as a public financial corporation (PFC). This meant that Medibank was fully consolidated into the Australian Government on a line-by-line basis but categorised as a financial equity investment at fair value for the GGS.
The adjusted financial performance of Medibank, on consolidation in the Australian Government’s financial statements for 2014-15 is detailed below. There is no income tax expense associated with the sale of Medibank as this is eliminated upon consolidation.
Financial performance2015(a) 2014
$m $m
Revenue from transactions 2,769 6,458Expenses from transactions 2,619 6,288Net operating balance 150 170Other economic flows - included in Operating Result (1) (69)Net operating result 149 101
Discontinued operations
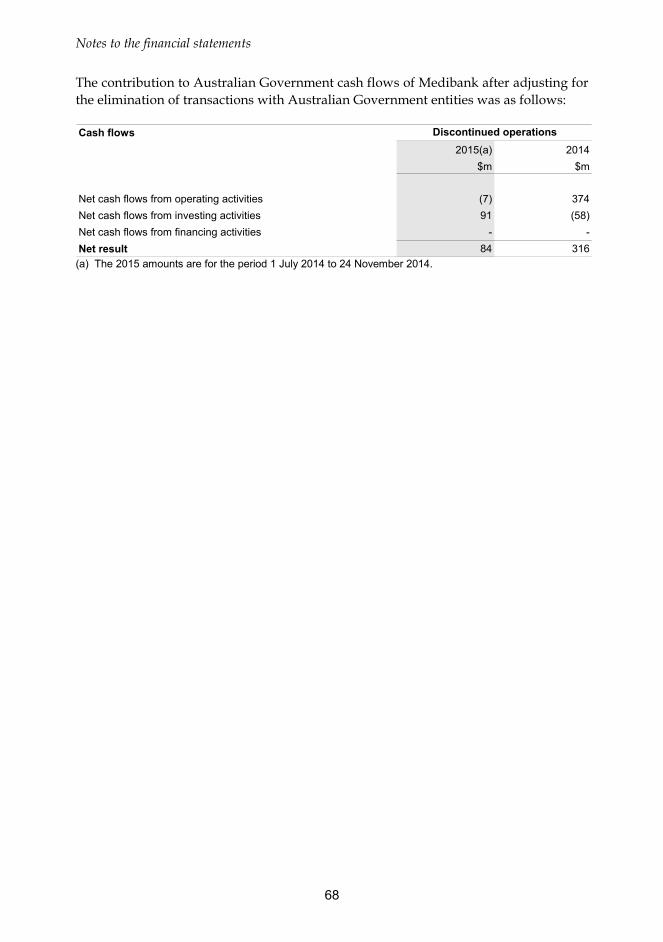
Notes to the financial statements
68
The contribution to Australian Government cash flows of Medibank after adjusting for the elimination of transactions with Australian Government entities was as follows:
Cash flows2015(a) 2014
$m $m
Net cash flows from operating activities (7) 374Net cash flows from investing activities 91 (58)Net cash flows from financing activities - -Net result 84 316
Discontinued operations
(a) The 2015 amounts are for the period 1 July 2014 to 24 November 2014.
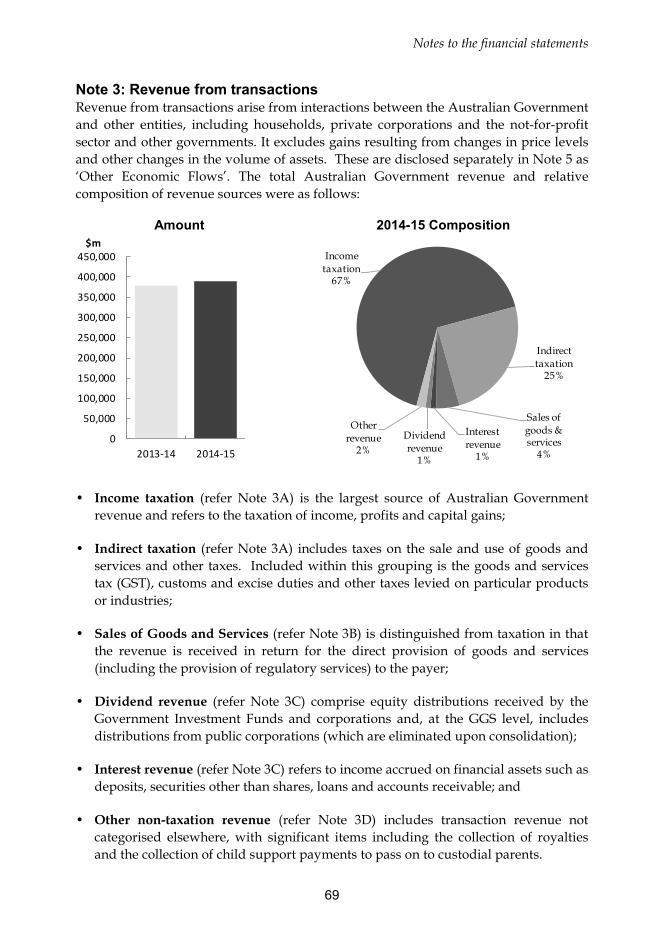
Notes to the financial statements
69
Note 3: Revenue from transactions Revenue from transactions arise from interactions between the Australian Government and other entities, including households, private corporations and the not-for-profit sector and other governments. It excludes gains resulting from changes in price levels and other changes in the volume of assets. These are disclosed separately in Note 5 as ‘Other Economic Flows’. The total Australian Government revenue and relative composition of revenue sources were as follows:
Amount 2014-15 Composition
0
50,000
100,000
150,000
200,000
250,000
300,000
350,000
400,000
450,000
2013-14 2014-15
$m
Income taxation
67%
Indirect taxation
25%
Sales of goods & services
4%
Interest revenue
1%
Dividend revenue
1%
Other revenue
2%
• Income taxation (refer Note 3A) is the largest source of Australian Government
revenue and refers to the taxation of income, profits and capital gains;
• Indirect taxation (refer Note 3A) includes taxes on the sale and use of goods and services and other taxes. Included within this grouping is the goods and services tax (GST), customs and excise duties and other taxes levied on particular products or industries;
• Sales of Goods and Services (refer Note 3B) is distinguished from taxation in that the revenue is received in return for the direct provision of goods and services (including the provision of regulatory services) to the payer;
• Dividend revenue (refer Note 3C) comprise equity distributions received by the Government Investment Funds and corporations and, at the GGS level, includes distributions from public corporations (which are eliminated upon consolidation);
• Interest revenue (refer Note 3C) refers to income accrued on financial assets such as deposits, securities other than shares, loans and accounts receivable; and
• Other non-taxation revenue (refer Note 3D) includes transaction revenue not categorised elsewhere, with significant items including the collection of royalties and the collection of child support payments to pass on to custodial parents.
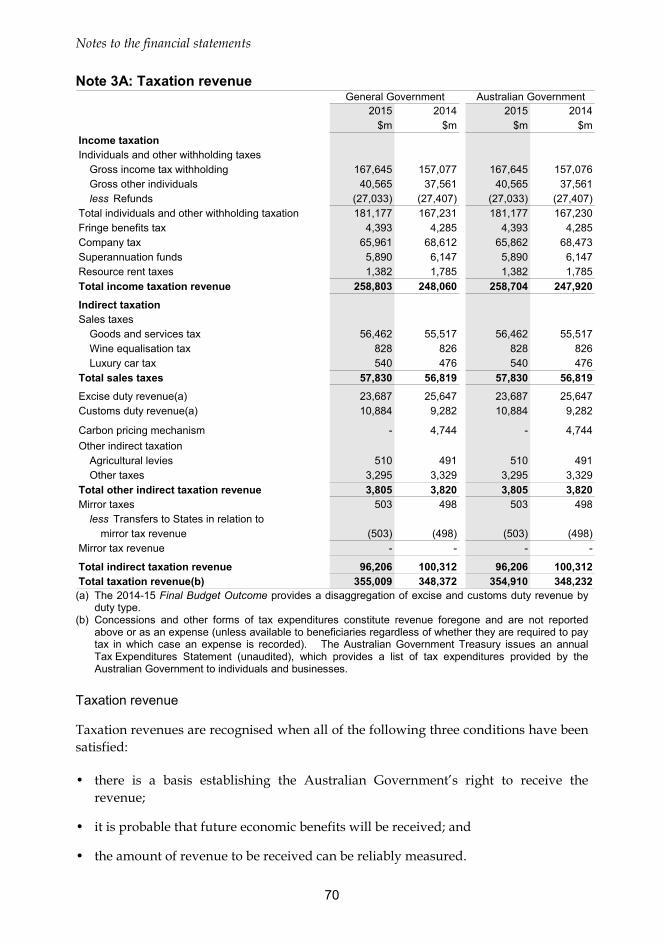
Notes to the financial statements
70
Note 3A: Taxation revenue
2015 2014 2015 2014$m $m $m $m
Income taxationIndividuals and other withholding taxes
Gross income tax withholding 167,645 157,077 167,645 157,076Gross other individuals 40,565 37,561 40,565 37,561less Refunds (27,033) (27,407) (27,033) (27,407)
Total individuals and other withholding taxation 181,177 167,231 181,177 167,230Fringe benefits tax 4,393 4,285 4,393 4,285Company tax 65,961 68,612 65,862 68,473Superannuation funds 5,890 6,147 5,890 6,147Resource rent taxes 1,382 1,785 1,382 1,785Total income taxation revenue 258,803 248,060 258,704 247,920
Indirect taxationSales taxes
Goods and services tax 56,462 55,517 56,462 55,517Wine equalisation tax 828 826 828 826Luxury car tax 540 476 540 476
Total sales taxes 57,830 56,819 57,830 56,819Excise duty revenue(a) 23,687 25,647 23,687 25,647Customs duty revenue(a) 10,884 9,282 10,884 9,282
Carbon pricing mechanism - 4,744 - 4,744Other indirect taxation
Agricultural levies 510 491 510 491Other taxes 3,295 3,329 3,295 3,329
Total other indirect taxation revenue 3,805 3,820 3,805 3,820Mirror taxes 503 498 503 498
less Transfers to States in relation tomirror tax revenue (503) (498) (503) (498)
Mirror tax revenue - - - -
Total indirect taxation revenue 96,206 100,312 96,206 100,312Total taxation revenue(b) 355,009 348,372 354,910 348,232
General Government Australian Government
(a) The 2014-15 Final Budget Outcome provides a disaggregation of excise and customs duty revenue by
duty type. (b) Concessions and other forms of tax expenditures constitute revenue foregone and are not reported
above or as an expense (unless available to beneficiaries regardless of whether they are required to pay tax in which case an expense is recorded). The Australian Government Treasury issues an annual Tax Expenditures Statement (unaudited), which provides a list of tax expenditures provided by the Australian Government to individuals and businesses.
Taxation revenue
Taxation revenues are recognised when all of the following three conditions have been satisfied:
• there is a basis establishing the Australian Government’s right to receive the revenue;
• it is probable that future economic benefits will be received; and
• the amount of revenue to be received can be reliably measured.
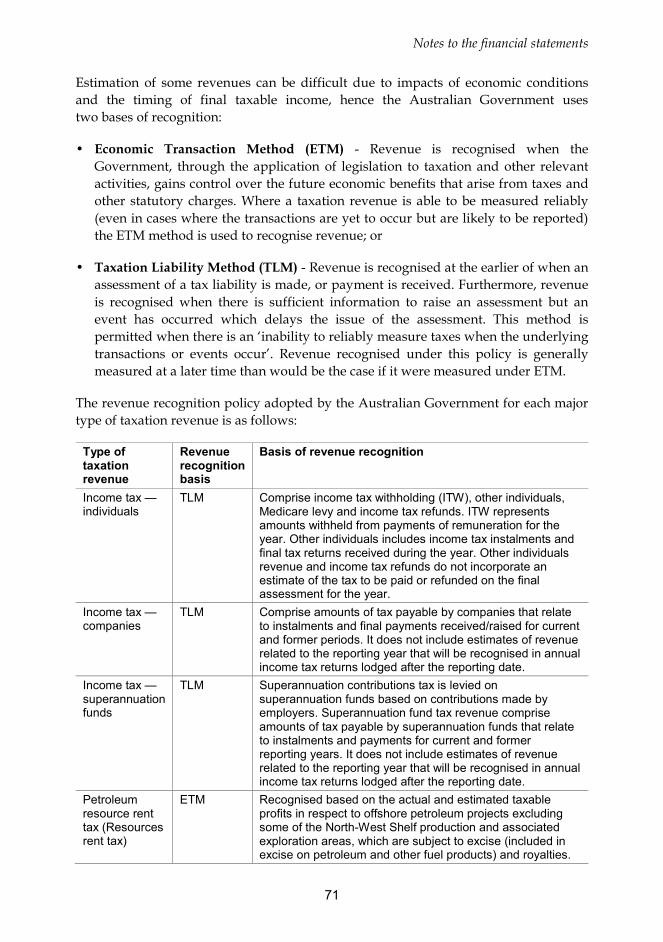
Notes to the financial statements
71
Estimation of some revenues can be difficult due to impacts of economic conditions and the timing of final taxable income, hence the Australian Government uses two bases of recognition:
• Economic Transaction Method (ETM) - Revenue is recognised when the Government, through the application of legislation to taxation and other relevant activities, gains control over the future economic benefits that arise from taxes and other statutory charges. Where a taxation revenue is able to be measured reliably (even in cases where the transactions are yet to occur but are likely to be reported) the ETM method is used to recognise revenue; or
• Taxation Liability Method (TLM) - Revenue is recognised at the earlier of when an assessment of a tax liability is made, or payment is received. Furthermore, revenue is recognised when there is sufficient information to raise an assessment but an event has occurred which delays the issue of the assessment. This method is permitted when there is an ‘inability to reliably measure taxes when the underlying transactions or events occur’. Revenue recognised under this policy is generally measured at a later time than would be the case if it were measured under ETM.
The revenue recognition policy adopted by the Australian Government for each major type of taxation revenue is as follows:
Type of taxation revenue
Revenue recognition basis
Basis of revenue recognition
Income tax — individuals
TLM Comprise income tax withholding (ITW), other individuals, Medicare levy and income tax refunds. ITW represents amounts withheld from payments of remuneration for the year. Other individuals includes income tax instalments and final tax returns received during the year. Other individuals revenue and income tax refunds do not incorporate an estimate of the tax to be paid or refunded on the final assessment for the year.
Income tax — companies
TLM Comprise amounts of tax payable by companies that relate to instalments and final payments received/raised for current and former periods. It does not include estimates of revenue related to the reporting year that will be recognised in annual income tax returns lodged after the reporting date.
Income tax — superannuation funds
TLM Superannuation contributions tax is levied on superannuation funds based on contributions made by employers. Superannuation fund tax revenue comprise amounts of tax payable by superannuation funds that relate to instalments and payments for current and former reporting years. It does not include estimates of revenue related to the reporting year that will be recognised in annual income tax returns lodged after the reporting date.
Petroleum resource rent tax (Resources rent tax)
ETM Recognised based on the actual and estimated taxable profits in respect to offshore petroleum projects excluding some of the North-West Shelf production and associated exploration areas, which are subject to excise (included in excise on petroleum and other fuel products) and royalties.
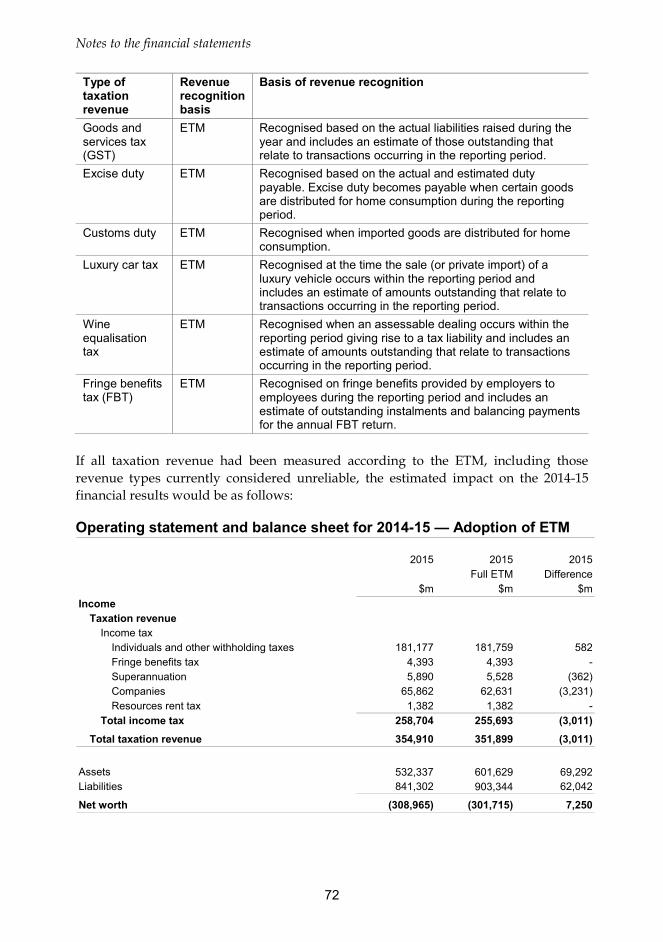
Notes to the financial statements
72
Type of taxation revenue
Revenue recognition basis
Basis of revenue recognition
Goods and services tax (GST)
ETM Recognised based on the actual liabilities raised during the year and includes an estimate of those outstanding that relate to transactions occurring in the reporting period.
Excise duty ETM Recognised based on the actual and estimated duty payable. Excise duty becomes payable when certain goods are distributed for home consumption during the reporting period.
Customs duty ETM Recognised when imported goods are distributed for home consumption.
Luxury car tax ETM Recognised at the time the sale (or private import) of a luxury vehicle occurs within the reporting period and includes an estimate of amounts outstanding that relate to transactions occurring in the reporting period.
Wine equalisation tax
ETM Recognised when an assessable dealing occurs within the reporting period giving rise to a tax liability and includes an estimate of amounts outstanding that relate to transactions occurring in the reporting period.
Fringe benefits tax (FBT)
ETM Recognised on fringe benefits provided by employers to employees during the reporting period and includes an estimate of outstanding instalments and balancing payments for the annual FBT return.
If all taxation revenue had been measured according to the ETM, including those revenue types currently considered unreliable, the estimated impact on the 2014-15 financial results would be as follows:
Operating statement and balance sheet for 2014-15 — Adoption of ETM
2015 2015 2015Full ETM Difference
$m $m $mIncome
Taxation revenueIncome tax
Individuals and other withholding taxes 181,177 181,759 582Fringe benefits tax 4,393 4,393 -Superannuation 5,890 5,528 (362)Companies 65,862 62,631 (3,231)Resources rent tax 1,382 1,382 -
Total income tax 258,704 255,693 (3,011)
Total taxation revenue 354,910 351,899 (3,011)
Assets 532,337 601,629 69,292Liabilities 841,302 903,344 62,042
Net worth (308,965) (301,715) 7,250
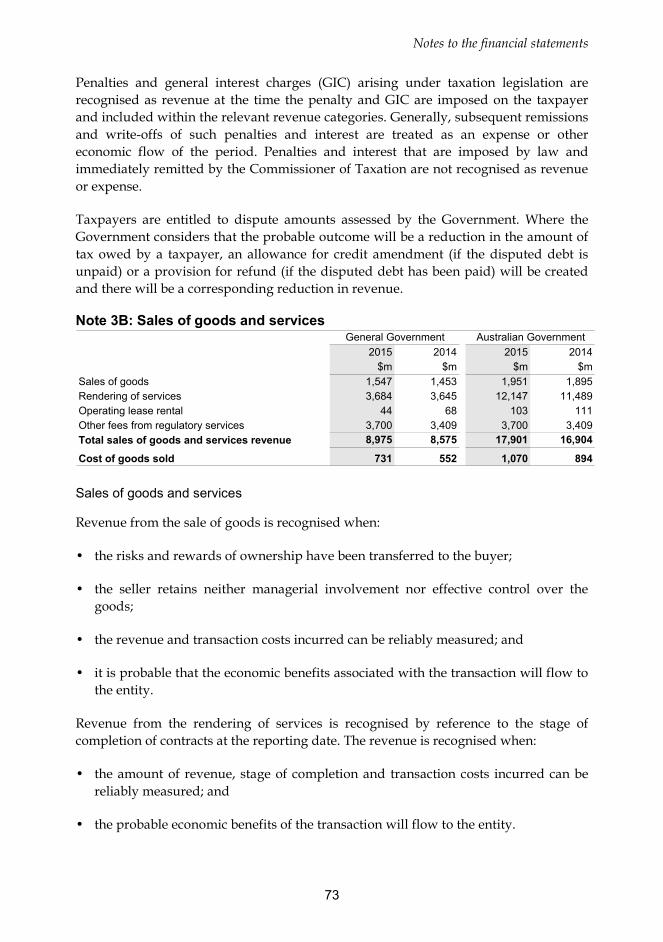
Notes to the financial statements
73
Penalties and general interest charges (GIC) arising under taxation legislation are recognised as revenue at the time the penalty and GIC are imposed on the taxpayer and included within the relevant revenue categories. Generally, subsequent remissions and write-offs of such penalties and interest are treated as an expense or other economic flow of the period. Penalties and interest that are imposed by law and immediately remitted by the Commissioner of Taxation are not recognised as revenue or expense.
Taxpayers are entitled to dispute amounts assessed by the Government. Where the Government considers that the probable outcome will be a reduction in the amount of tax owed by a taxpayer, an allowance for credit amendment (if the disputed debt is unpaid) or a provision for refund (if the disputed debt has been paid) will be created and there will be a corresponding reduction in revenue.
Note 3B: Sales of goods and services
2015 2014 2015 2014$m $m $m $m
Sales of goods 1,547 1,453 1,951 1,895Rendering of services 3,684 3,645 12,147 11,489Operating lease rental 44 68 103 111Other fees from regulatory services 3,700 3,409 3,700 3,409Total sales of goods and services revenue 8,975 8,575 17,901 16,904
Cost of goods sold 731 552 1,070 894
General Government Australian Government
Sales of goods and services
Revenue from the sale of goods is recognised when:
• the risks and rewards of ownership have been transferred to the buyer;
• the seller retains neither managerial involvement nor effective control over the goods;
• the revenue and transaction costs incurred can be reliably measured; and
• it is probable that the economic benefits associated with the transaction will flow to the entity.
Revenue from the rendering of services is recognised by reference to the stage of completion of contracts at the reporting date. The revenue is recognised when:
• the amount of revenue, stage of completion and transaction costs incurred can be reliably measured; and
• the probable economic benefits of the transaction will flow to the entity.
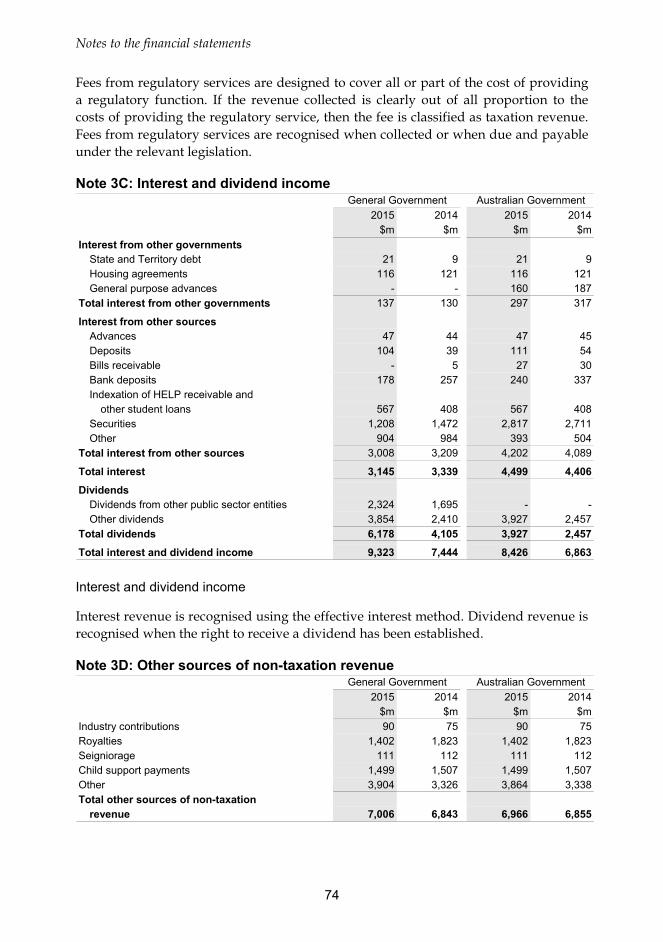
Notes to the financial statements
74
Fees from regulatory services are designed to cover all or part of the cost of providing a regulatory function. If the revenue collected is clearly out of all proportion to the costs of providing the regulatory service, then the fee is classified as taxation revenue. Fees from regulatory services are recognised when collected or when due and payable under the relevant legislation.
Note 3C: Interest and dividend income
2015 2014 2015 2014$m $m $m $m
Interest from other governmentsState and Territory debt 21 9 21 9Housing agreements 116 121 116 121General purpose advances - - 160 187
Total interest from other governments 137 130 297 317
Interest from other sourcesAdvances 47 44 47 45Deposits 104 39 111 54Bills receivable - 5 27 30Bank deposits 178 257 240 337Indexation of HELP receivable and
other student loans 567 408 567 408Securities 1,208 1,472 2,817 2,711Other 904 984 393 504
Total interest from other sources 3,008 3,209 4,202 4,089
Total interest 3,145 3,339 4,499 4,406
DividendsDividends from other public sector entities 2,324 1,695 - -Other dividends 3,854 2,410 3,927 2,457
Total dividends 6,178 4,105 3,927 2,457
Total interest and dividend income 9,323 7,444 8,426 6,863
General Government Australian Government
Interest and dividend income
Interest revenue is recognised using the effective interest method. Dividend revenue is recognised when the right to receive a dividend has been established.
Note 3D: Other sources of non-taxation revenue
2015 2014 2015 2014$m $m $m $m
Industry contributions 90 75 90 75Royalties 1,402 1,823 1,402 1,823Seigniorage 111 112 111 112Child support payments 1,499 1,507 1,499 1,507Other 3,904 3,326 3,864 3,338Total other sources of non-taxation
revenue 7,006 6,843 6,966 6,855
General Government Australian Government
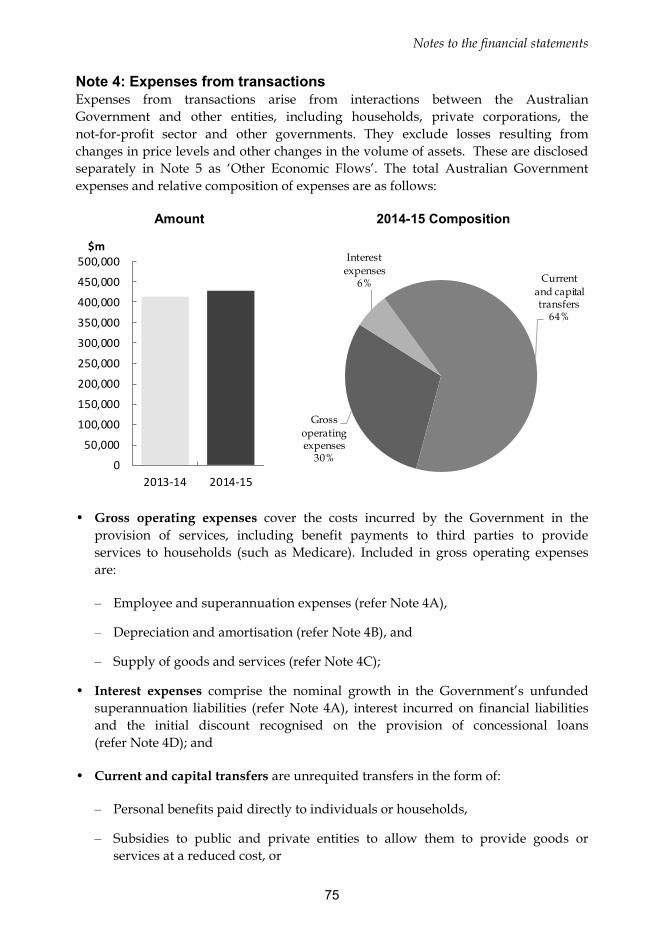
Notes to the financial statements
75
Note 4: Expenses from transactions Expenses from transactions arise from interactions between the Australian Government and other entities, including households, private corporations, the not-for-profit sector and other governments. They exclude losses resulting from changes in price levels and other changes in the volume of assets. These are disclosed separately in Note 5 as ‘Other Economic Flows’. The total Australian Government expenses and relative composition of expenses are as follows:
Amount 2014-15 Composition
0
50,000
100,000
150,000
200,000
250,000
300,000
350,000
400,000
450,000
500,000
2013-14 2014-15
$m
Gross operating expenses
30%
Interest expenses
6% Current and capital transfers
64%
• Gross operating expenses cover the costs incurred by the Government in the
provision of services, including benefit payments to third parties to provide services to households (such as Medicare). Included in gross operating expenses are:
– Employee and superannuation expenses (refer Note 4A),
– Depreciation and amortisation (refer Note 4B), and
– Supply of goods and services (refer Note 4C);
• Interest expenses comprise the nominal growth in the Government’s unfunded superannuation liabilities (refer Note 4A), interest incurred on financial liabilities and the initial discount recognised on the provision of concessional loans (refer Note 4D); and
• Current and capital transfers are unrequited transfers in the form of:
– Personal benefits paid directly to individuals or households,
– Subsidies to public and private entities to allow them to provide goods or services at a reduced cost, or
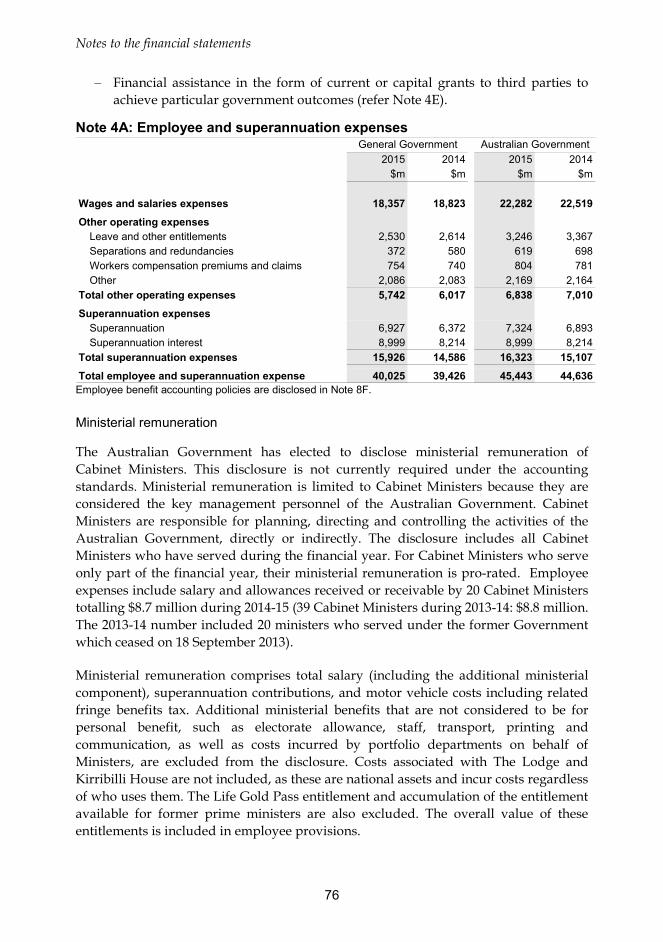
Notes to the financial statements
76
– Financial assistance in the form of current or capital grants to third parties to achieve particular government outcomes (refer Note 4E).
Note 4A: Employee and superannuation expenses
2015 2014 2015 2014$m $m $m $m
Wages and salaries expenses 18,357 18,823 22,282 22,519
Other operating expensesLeave and other entitlements 2,530 2,614 3,246 3,367Separations and redundancies 372 580 619 698Workers compensation premiums and claims 754 740 804 781Other 2,086 2,083 2,169 2,164
Total other operating expenses 5,742 6,017 6,838 7,010
Superannuation expensesSuperannuation 6,927 6,372 7,324 6,893Superannuation interest 8,999 8,214 8,999 8,214
Total superannuation expenses 15,926 14,586 16,323 15,107
Total employee and superannuation expense 40,025 39,426 45,443 44,636
General Government Australian Government
Employee benefit accounting policies are disclosed in Note 8F. Ministerial remuneration
The Australian Government has elected to disclose ministerial remuneration of Cabinet Ministers. This disclosure is not currently required under the accounting standards. Ministerial remuneration is limited to Cabinet Ministers because they are considered the key management personnel of the Australian Government. Cabinet Ministers are responsible for planning, directing and controlling the activities of the Australian Government, directly or indirectly. The disclosure includes all Cabinet Ministers who have served during the financial year. For Cabinet Ministers who serve only part of the financial year, their ministerial remuneration is pro-rated. Employee expenses include salary and allowances received or receivable by 20 Cabinet Ministers totalling $8.7 million during 2014-15 (39 Cabinet Ministers during 2013-14: $8.8 million. The 2013-14 number included 20 ministers who served under the former Government which ceased on 18 September 2013).
Ministerial remuneration comprises total salary (including the additional ministerial component), superannuation contributions, and motor vehicle costs including related fringe benefits tax. Additional ministerial benefits that are not considered to be for personal benefit, such as electorate allowance, staff, transport, printing and communication, as well as costs incurred by portfolio departments on behalf of Ministers, are excluded from the disclosure. Costs associated with The Lodge and Kirribilli House are not included, as these are national assets and incur costs regardless of who uses them. The Life Gold Pass entitlement and accumulation of the entitlement available for former prime ministers are also excluded. The overall value of these entitlements is included in employee provisions.
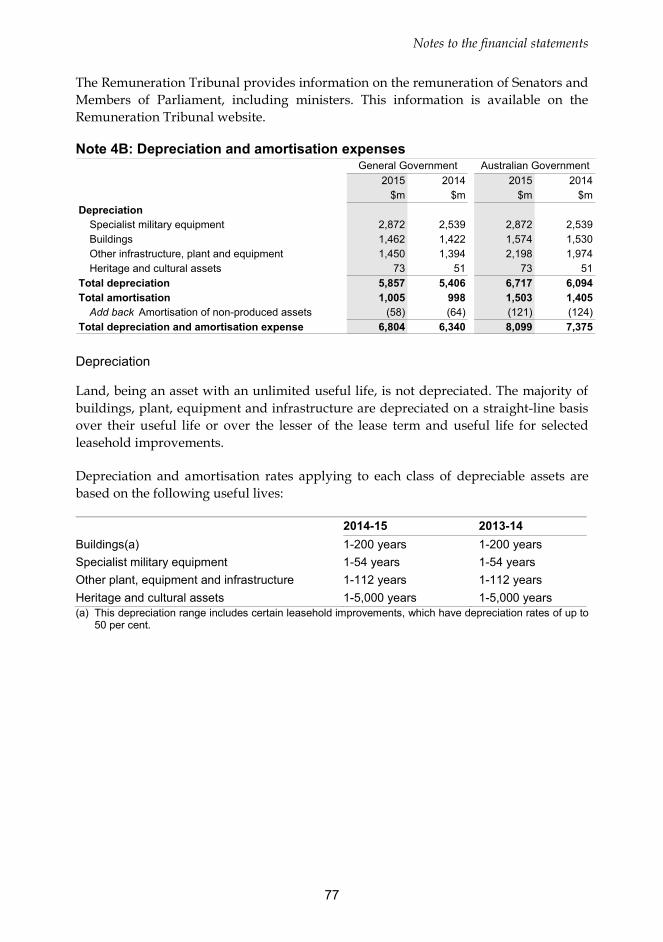
Notes to the financial statements
77
The Remuneration Tribunal provides information on the remuneration of Senators and Members of Parliament, including ministers. This information is available on the Remuneration Tribunal website.
Note 4B: Depreciation and amortisation expenses
2015 2014 2015 2014$m $m $m $m
DepreciationSpecialist military equipment 2,872 2,539 2,872 2,539Buildings 1,462 1,422 1,574 1,530Other infrastructure, plant and equipment 1,450 1,394 2,198 1,974Heritage and cultural assets 73 51 73 51
Total depreciation 5,857 5,406 6,717 6,094Total amortisation 1,005 998 1,503 1,405
Add back Amortisation of non-produced assets (58) (64) (121) (124)Total depreciation and amortisation expense 6,804 6,340 8,099 7,375
General Government Australian Government
Depreciation
Land, being an asset with an unlimited useful life, is not depreciated. The majority of buildings, plant, equipment and infrastructure are depreciated on a straight-line basis over their useful life or over the lesser of the lease term and useful life for selected leasehold improvements.
Depreciation and amortisation rates applying to each class of depreciable assets are based on the following useful lives:
2014-15 2013-14 Buildings(a) 1-200 years 1-200 years Specialist military equipment 1-54 years 1-54 years Other plant, equipment and infrastructure 1-112 years 1-112 years Heritage and cultural assets 1-5,000 years 1-5,000 years (a) This depreciation range includes certain leasehold improvements, which have depreciation rates of up to
50 per cent.
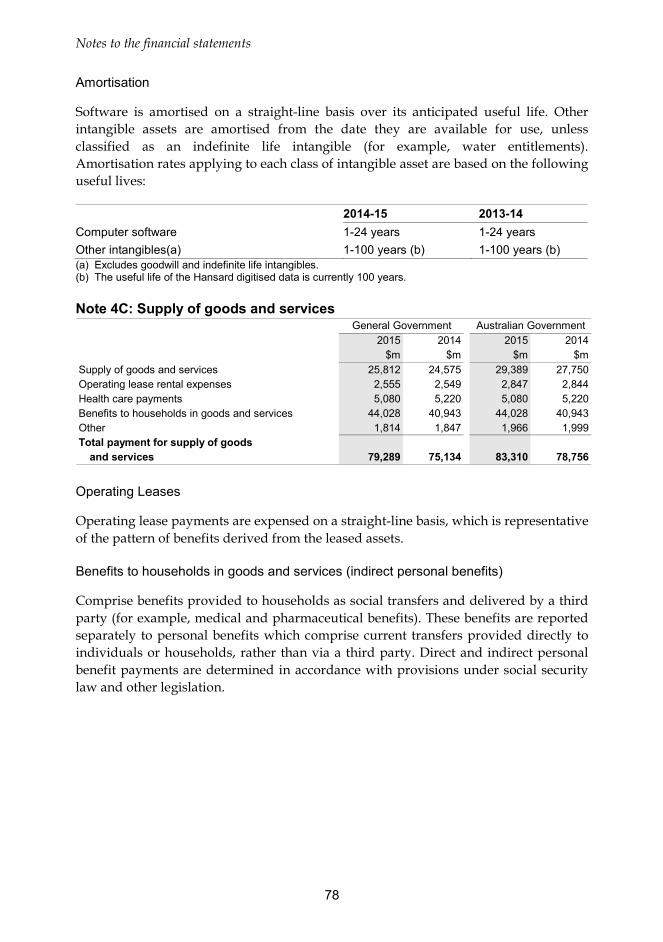
Notes to the financial statements
78
Amortisation
Software is amortised on a straight-line basis over its anticipated useful life. Other intangible assets are amortised from the date they are available for use, unless classified as an indefinite life intangible (for example, water entitlements). Amortisation rates applying to each class of intangible asset are based on the following useful lives:
2014-15 2013-14 Computer software 1-24 years 1-24 years Other intangibles(a) 1-100 years (b) 1-100 years (b) (a) Excludes goodwill and indefinite life intangibles. (b) The useful life of the Hansard digitised data is currently 100 years. Note 4C: Supply of goods and services
2015 2014 2015 2014$m $m $m $m
Supply of goods and services 25,812 24,575 29,389 27,750Operating lease rental expenses 2,555 2,549 2,847 2,844Health care payments 5,080 5,220 5,080 5,220Benefits to households in goods and services 44,028 40,943 44,028 40,943Other 1,814 1,847 1,966 1,999Total payment for supply of goods
and services 79,289 75,134 83,310 78,756
General Government Australian Government
Operating Leases
Operating lease payments are expensed on a straight-line basis, which is representative of the pattern of benefits derived from the leased assets.
Benefits to households in goods and services (indirect personal benefits)
Comprise benefits provided to households as social transfers and delivered by a third party (for example, medical and pharmaceutical benefits). These benefits are reported separately to personal benefits which comprise current transfers provided directly to individuals or households, rather than via a third party. Direct and indirect personal benefit payments are determined in accordance with provisions under social security law and other legislation.
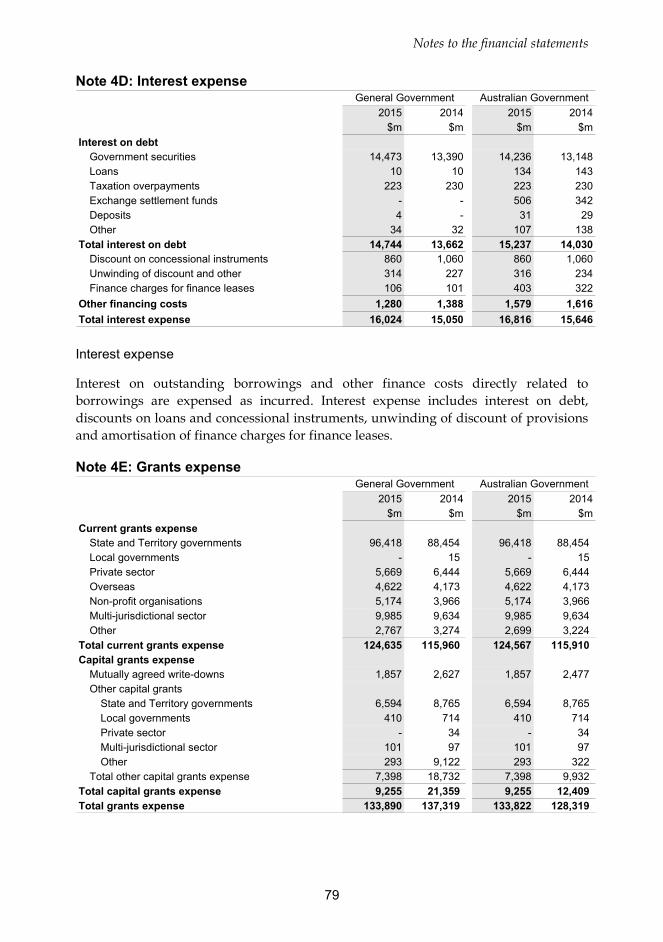
Notes to the financial statements
79
Note 4D: Interest expense
2015 2014 2015 2014$m $m $m $m
Interest on debtGovernment securities 14,473 13,390 14,236 13,148Loans 10 10 134 143Taxation overpayments 223 230 223 230Exchange settlement funds - - 506 342Deposits 4 - 31 29Other 34 32 107 138
Total interest on debt 14,744 13,662 15,237 14,030Discount on concessional instruments 860 1,060 860 1,060Unwinding of discount and other 314 227 316 234Finance charges for finance leases 106 101 403 322
Other financing costs 1,280 1,388 1,579 1,616Total interest expense 16,024 15,050 16,816 15,646
General Government Australian Government
Interest expense
Interest on outstanding borrowings and other finance costs directly related to borrowings are expensed as incurred. Interest expense includes interest on debt, discounts on loans and concessional instruments, unwinding of discount of provisions and amortisation of finance charges for finance leases.
Note 4E: Grants expense
2015 2014 2015 2014$m $m $m $m
Current grants expenseState and Territory governments 96,418 88,454 96,418 88,454Local governments - 15 - 15Private sector 5,669 6,444 5,669 6,444Overseas 4,622 4,173 4,622 4,173Non-profit organisations 5,174 3,966 5,174 3,966Multi-jurisdictional sector 9,985 9,634 9,985 9,634Other 2,767 3,274 2,699 3,224
Total current grants expense 124,635 115,960 124,567 115,910Capital grants expense
Mutually agreed write-downs 1,857 2,627 1,857 2,477Other capital grants
State and Territory governments 6,594 8,765 6,594 8,765Local governments 410 714 410 714Private sector - 34 - 34Multi-jurisdictional sector 101 97 101 97Other 293 9,122 293 322
Total other capital grants expense 7,398 18,732 7,398 9,932Total capital grants expense 9,255 21,359 9,255 12,409Total grants expense 133,890 137,319 133,822 128,319
General Government Australian Government
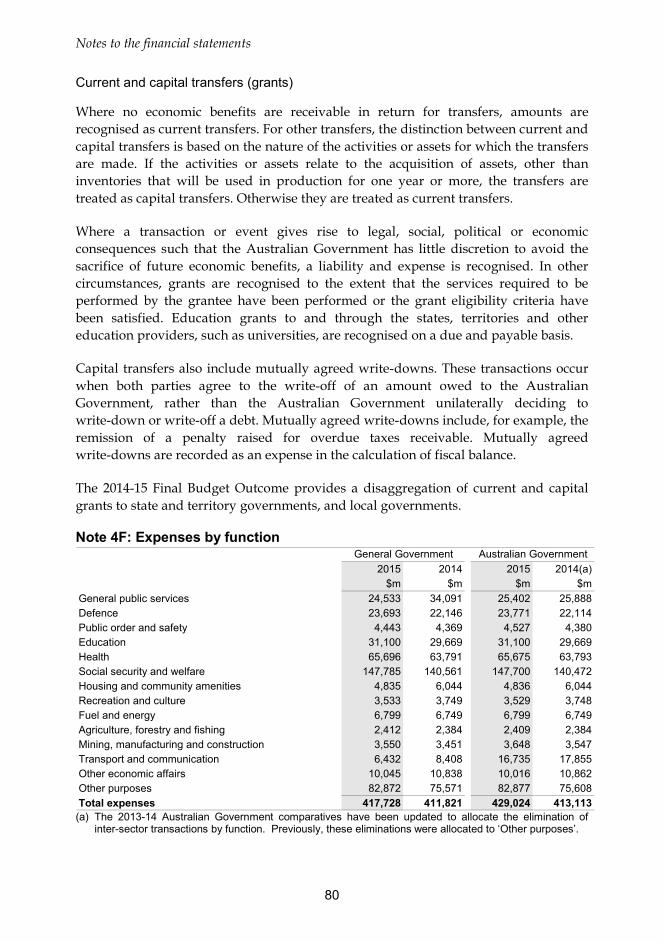
Notes to the financial statements
80
Current and capital transfers (grants)
Where no economic benefits are receivable in return for transfers, amounts are recognised as current transfers. For other transfers, the distinction between current and capital transfers is based on the nature of the activities or assets for which the transfers are made. If the activities or assets relate to the acquisition of assets, other than inventories that will be used in production for one year or more, the transfers are treated as capital transfers. Otherwise they are treated as current transfers.
Where a transaction or event gives rise to legal, social, political or economic consequences such that the Australian Government has little discretion to avoid the sacrifice of future economic benefits, a liability and expense is recognised. In other circumstances, grants are recognised to the extent that the services required to be performed by the grantee have been performed or the grant eligibility criteria have been satisfied. Education grants to and through the states, territories and other education providers, such as universities, are recognised on a due and payable basis.
Capital transfers also include mutually agreed write-downs. These transactions occur when both parties agree to the write-off of an amount owed to the Australian Government, rather than the Australian Government unilaterally deciding to write-down or write-off a debt. Mutually agreed write-downs include, for example, the remission of a penalty raised for overdue taxes receivable. Mutually agreed write-downs are recorded as an expense in the calculation of fiscal balance.
The 2014-15 Final Budget Outcome provides a disaggregation of current and capital grants to state and territory governments, and local governments.
Note 4F: Expenses by function
2015 2014 2015 2014(a)$m $m $m $m
General public services 24,533 34,091 25,402 25,888Defence 23,693 22,146 23,771 22,114Public order and safety 4,443 4,369 4,527 4,380Education 31,100 29,669 31,100 29,669Health 65,696 63,791 65,675 63,793Social security and welfare 147,785 140,561 147,700 140,472Housing and community amenities 4,835 6,044 4,836 6,044Recreation and culture 3,533 3,749 3,529 3,748Fuel and energy 6,799 6,749 6,799 6,749Agriculture, forestry and fishing 2,412 2,384 2,409 2,384Mining, manufacturing and construction 3,550 3,451 3,648 3,547Transport and communication 6,432 8,408 16,735 17,855Other economic affairs 10,045 10,838 10,016 10,862Other purposes 82,872 75,571 82,877 75,608Total expenses 417,728 411,821 429,024 413,113
General Government Australian Government
(a) The 2013-14 Australian Government comparatives have been updated to allocate the elimination of
inter-sector transactions by function. Previously, these eliminations were allocated to ‘Other purposes’.
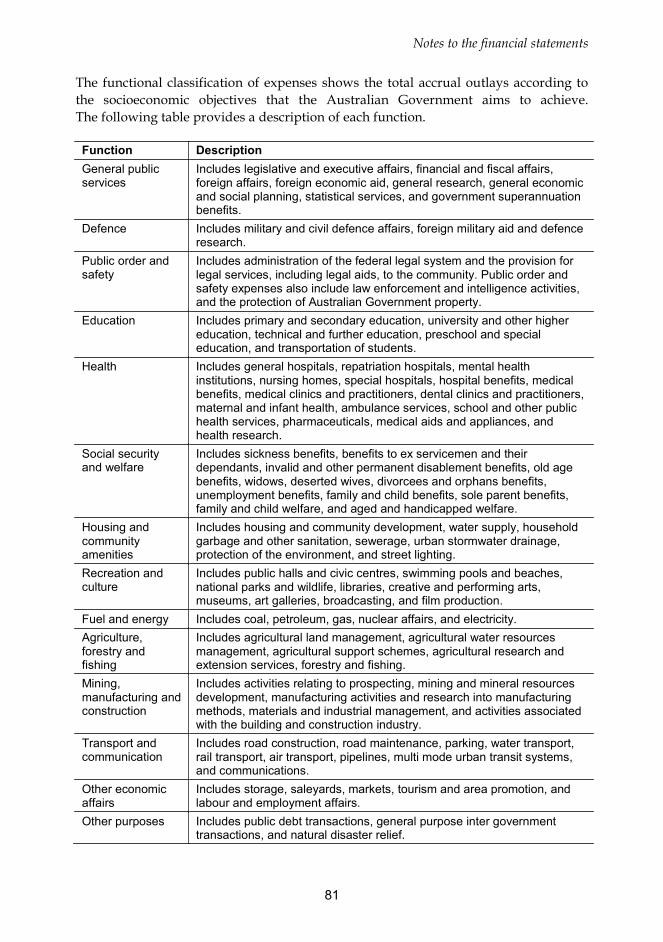
Notes to the financial statements
81
The functional classification of expenses shows the total accrual outlays according to the socioeconomic objectives that the Australian Government aims to achieve. The following table provides a description of each function.
Function Description General public services
Includes legislative and executive affairs, financial and fiscal affairs, foreign affairs, foreign economic aid, general research, general economic and social planning, statistical services, and government superannuation benefits.
Defence Includes military and civil defence affairs, foreign military aid and defence research.
Public order and safety
Includes administration of the federal legal system and the provision for legal services, including legal aids, to the community. Public order and safety expenses also include law enforcement and intelligence activities, and the protection of Australian Government property.
Education Includes primary and secondary education, university and other higher education, technical and further education, preschool and special education, and transportation of students.
Health Includes general hospitals, repatriation hospitals, mental health institutions, nursing homes, special hospitals, hospital benefits, medical benefits, medical clinics and practitioners, dental clinics and practitioners, maternal and infant health, ambulance services, school and other public health services, pharmaceuticals, medical aids and appliances, and health research.
Social security and welfare
Includes sickness benefits, benefits to ex servicemen and their dependants, invalid and other permanent disablement benefits, old age benefits, widows, deserted wives, divorcees and orphans benefits, unemployment benefits, family and child benefits, sole parent benefits, family and child welfare, and aged and handicapped welfare.
Housing and community amenities
Includes housing and community development, water supply, household garbage and other sanitation, sewerage, urban stormwater drainage, protection of the environment, and street lighting.
Recreation and culture
Includes public halls and civic centres, swimming pools and beaches, national parks and wildlife, libraries, creative and performing arts, museums, art galleries, broadcasting, and film production.
Fuel and energy Includes coal, petroleum, gas, nuclear affairs, and electricity. Agriculture, forestry and fishing
Includes agricultural land management, agricultural water resources management, agricultural support schemes, agricultural research and extension services, forestry and fishing.
Mining, manufacturing and construction
Includes activities relating to prospecting, mining and mineral resources development, manufacturing activities and research into manufacturing methods, materials and industrial management, and activities associated with the building and construction industry.
Transport and communication
Includes road construction, road maintenance, parking, water transport, rail transport, air transport, pipelines, multi mode urban transit systems, and communications.
Other economic affairs
Includes storage, saleyards, markets, tourism and area promotion, and labour and employment affairs.
Other purposes Includes public debt transactions, general purpose inter government transactions, and natural disaster relief.
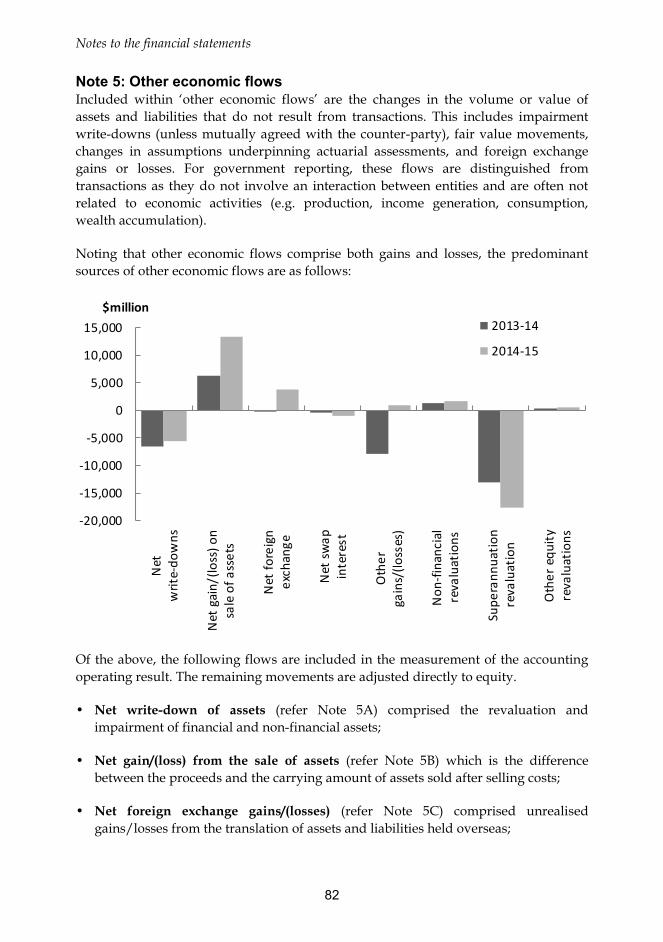
Notes to the financial statements
82
Note 5: Other economic flows Included within ‘other economic flows’ are the changes in the volume or value of assets and liabilities that do not result from transactions. This includes impairment write-downs (unless mutually agreed with the counter-party), fair value movements, changes in assumptions underpinning actuarial assessments, and foreign exchange gains or losses. For government reporting, these flows are distinguished from transactions as they do not involve an interaction between entities and are often not related to economic activities (e.g. production, income generation, consumption, wealth accumulation).
Noting that other economic flows comprise both gains and losses, the predominant sources of other economic flows are as follows:
-20,000
-15,000
-10,000
-5,000
0
5,000
10,000
15,000
Net
writ
e-do
wns
Net
gai
n/(lo
ss) o
nsa
le o
f ass
ets
Net
fore
ign
exch
ange
Net
swap
inte
rest
Oth
erga
ins/
(loss
es)
Non
-fina
ncia
lre
valu
atio
ns
Supe
rann
uatio
nre
valu
atio
n
Oth
er e
quity
reva
luat
ions
$million2013-14
2014-15
Of the above, the following flows are included in the measurement of the accounting operating result. The remaining movements are adjusted directly to equity.
• Net write-down of assets (refer Note 5A) comprised the revaluation and impairment of financial and non-financial assets;
• Net gain/(loss) from the sale of assets (refer Note 5B) which is the difference between the proceeds and the carrying amount of assets sold after selling costs;
• Net foreign exchange gains/(losses) (refer Note 5C) comprised unrealised gains/losses from the translation of assets and liabilities held overseas;

Notes to the financial statements
83
• Net swap interest gains/(losses) (refer Note 5D) comprised interest accrued or incurred on swaps and other derivatives (a form of financing transaction); and
• Other gains/(losses) (refer Note 5E) which are other gains/losses not classified elsewhere but which are included in the calculation of the operating result for accounting purposes.
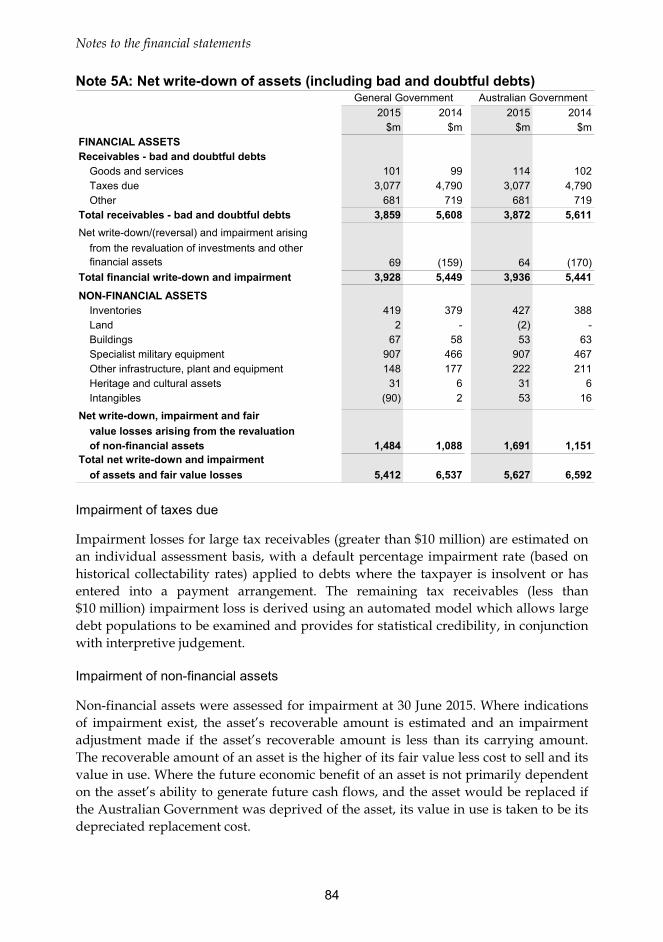
Notes to the financial statements
84
Note 5A: Net write-down of assets (including bad and doubtful debts)
2015 2014 2015 2014$m $m $m $m
FINANCIAL ASSETSReceivables - bad and doubtful debts
Goods and services 101 99 114 102Taxes due 3,077 4,790 3,077 4,790Other 681 719 681 719
Total receivables - bad and doubtful debts 3,859 5,608 3,872 5,611Net write-down/(reversal) and impairment arising
from the revaluation of investments and otherfinancial assets 69 (159) 64 (170)
Total financial write-down and impairment 3,928 5,449 3,936 5,441
NON-FINANCIAL ASSETSInventories 419 379 427 388Land 2 - (2) -Buildings 67 58 53 63Specialist military equipment 907 466 907 467Other infrastructure, plant and equipment 148 177 222 211Heritage and cultural assets 31 6 31 6Intangibles (90) 2 53 16
Net write-down, impairment and fairvalue losses arising from the revaluation of non-financial assets 1,484 1,088 1,691 1,151
Total net write-down and impairmentof assets and fair value losses 5,412 6,537 5,627 6,592
General Government Australian Government
Impairment of taxes due
Impairment losses for large tax receivables (greater than $10 million) are estimated on an individual assessment basis, with a default percentage impairment rate (based on historical collectability rates) applied to debts where the taxpayer is insolvent or has entered into a payment arrangement. The remaining tax receivables (less than $10 million) impairment loss is derived using an automated model which allows large debt populations to be examined and provides for statistical credibility, in conjunction with interpretive judgement.
Impairment of non-financial assets
Non-financial assets were assessed for impairment at 30 June 2015. Where indications of impairment exist, the asset’s recoverable amount is estimated and an impairment adjustment made if the asset’s recoverable amount is less than its carrying amount. The recoverable amount of an asset is the higher of its fair value less cost to sell and its value in use. Where the future economic benefit of an asset is not primarily dependent on the asset’s ability to generate future cash flows, and the asset would be replaced if the Australian Government was deprived of the asset, its value in use is taken to be its depreciated replacement cost.
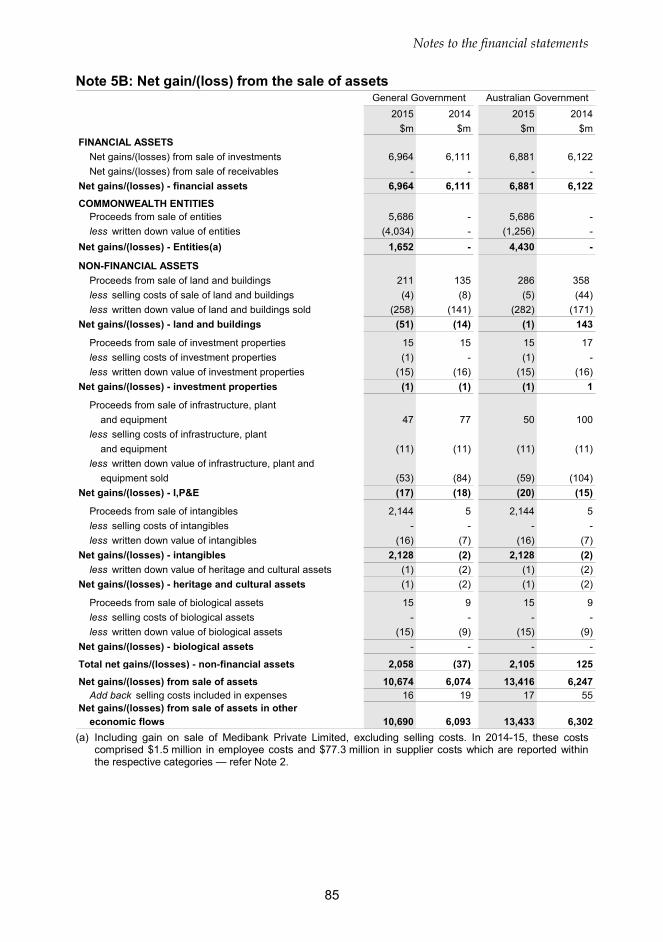
Notes to the financial statements
85
Note 5B: Net gain/(loss) from the sale of assets
2015 2014 2015 2014$m $m $m $m
FINANCIAL ASSETSNet gains/(losses) from sale of investments 6,964 6,111 6,881 6,122Net gains/(losses) from sale of receivables - - - -
Net gains/(losses) - financial assets 6,964 6,111 6,881 6,122
COMMONWEALTH ENTITIESProceeds from sale of entities 5,686 - 5,686 -less written down value of entities (4,034) - (1,256) -
Net gains/(losses) - Entities(a) 1,652 - 4,430 -
NON-FINANCIAL ASSETSProceeds from sale of land and buildings 211 135 286 358 less selling costs of sale of land and buildings (4) (8) (5) (44) less written down value of land and buildings sold (258) (141) (282) (171)
Net gains/(losses) - land and buildings (51) (14) (1) 143
Proceeds from sale of investment properties 15 15 15 17less selling costs of investment properties (1) - (1) -less written down value of investment properties (15) (16) (15) (16)
Net gains/(losses) - investment properties (1) (1) (1) 1
Proceeds from sale of infrastructure, plantand equipment 47 77 50 100
less selling costs of infrastructure, plantand equipment (11) (11) (11) (11)
less written down value of infrastructure, plant and equipment sold (53) (84) (59) (104)
Net gains/(losses) - I,P&E (17) (18) (20) (15)
Proceeds from sale of intangibles 2,144 5 2,144 5less selling costs of intangibles - - - -less written down value of intangibles (16) (7) (16) (7)
Net gains/(losses) - intangibles 2,128 (2) 2,128 (2)less written down value of heritage and cultural assets (1) (2) (1) (2)
Net gains/(losses) - heritage and cultural assets (1) (2) (1) (2)
Proceeds from sale of biological assets 15 9 15 9less selling costs of biological assets - - - -less written down value of biological assets (15) (9) (15) (9)
Net gains/(losses) - biological assets - - - -
Total net gains/(losses) - non-financial assets 2,058 (37) 2,105 125
Net gains/(losses) from sale of assets 10,674 6,074 13,416 6,247Add back selling costs included in expenses 16 19 17 55
Net gains/(losses) from sale of assets in othereconomic flows 10,690 6,093 13,433 6,302
General Government Australian Government
(a) Including gain on sale of Medibank Private Limited, excluding selling costs. In 2014-15, these costs
comprised $1.5 million in employee costs and $77.3 million in supplier costs which are reported within the respective categories — refer Note 2.
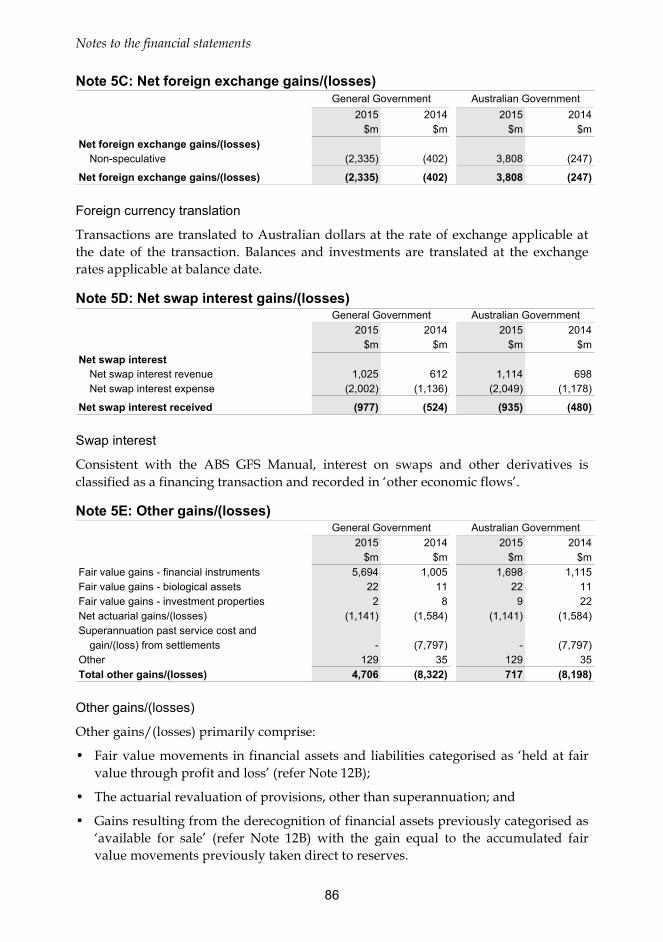
Notes to the financial statements
86
Note 5C: Net foreign exchange gains/(losses)
2015 2014 2015 2014$m $m $m $m
Net foreign exchange gains/(losses)Non-speculative (2,335) (402) 3,808 (247)
Net foreign exchange gains/(losses) (2,335) (402) 3,808 (247)
General Government Australian Government
Foreign currency translation
Transactions are translated to Australian dollars at the rate of exchange applicable at the date of the transaction. Balances and investments are translated at the exchange rates applicable at balance date.
Note 5D: Net swap interest gains/(losses)
2015 2014 2015 2014$m $m $m $m
Net swap interestNet swap interest revenue 1,025 612 1,114 698Net swap interest expense (2,002) (1,136) (2,049) (1,178)
Net swap interest received (977) (524) (935) (480)
General Government Australian Government
Swap interest
Consistent with the ABS GFS Manual, interest on swaps and other derivatives is classified as a financing transaction and recorded in ‘other economic flows’.
Note 5E: Other gains/(losses)
2015 2014 2015 2014$m $m $m $m
Fair value gains - financial instruments 5,694 1,005 1,698 1,115Fair value gains - biological assets 22 11 22 11Fair value gains - investment properties 2 8 9 22Net actuarial gains/(losses) (1,141) (1,584) (1,141) (1,584)Superannuation past service cost and
gain/(loss) from settlements - (7,797) - (7,797)Other 129 35 129 35Total other gains/(losses) 4,706 (8,322) 717 (8,198)
General Government Australian Government
Other gains/(losses)
Other gains/(losses) primarily comprise:
• Fair value movements in financial assets and liabilities categorised as ‘held at fair value through profit and loss’ (refer Note 12B);
• The actuarial revaluation of provisions, other than superannuation; and
• Gains resulting from the derecognition of financial assets previously categorised as ‘available for sale’ (refer Note 12B) with the gain equal to the accumulated fair value movements previously taken direct to reserves.
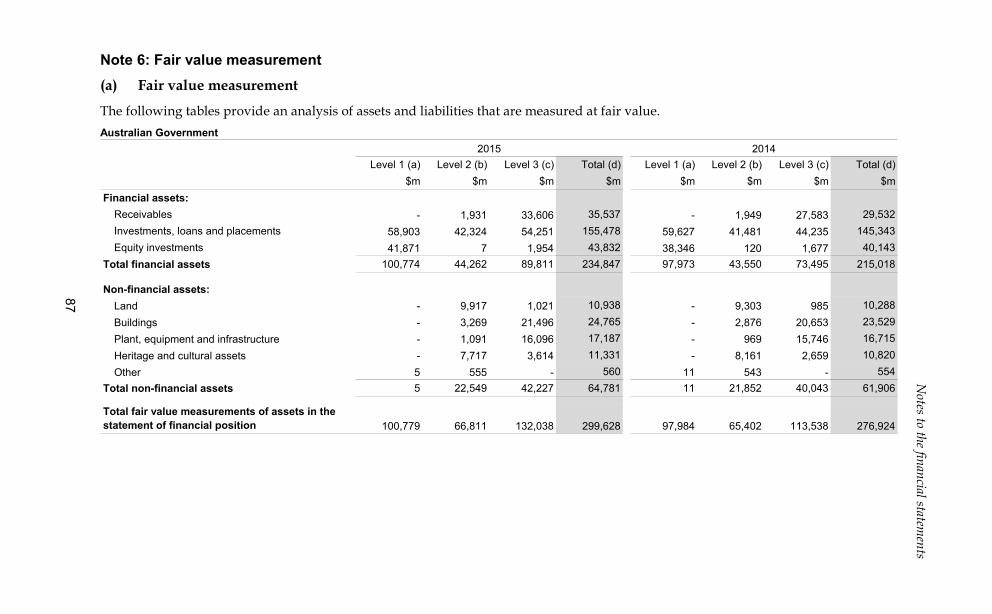
87
Notes to the financial statem
ents Note 6: Fair value measurement (a) Fair value measurement
The following tables provide an analysis of assets and liabilities that are measured at fair value. Australian Government
Level 1 (a) Level 2 (b) Level 3 (c) Total (d) Level 1 (a) Level 2 (b) Level 3 (c) Total (d)$m $m $m $m $m $m $m $m
Financial assets:Receivables - 1,931 33,606 35,537 - 1,949 27,583 29,532Investments, loans and placements 58,903 42,324 54,251 155,478 59,627 41,481 44,235 145,343Equity investments 41,871 7 1,954 43,832 38,346 120 1,677 40,143
Total financial assets 100,774 44,262 89,811 234,847 97,973 43,550 73,495 215,018
Non-financial assets:Land - 9,917 1,021 10,938 - 9,303 985 10,288Buildings - 3,269 21,496 24,765 - 2,876 20,653 23,529Plant, equipment and infrastructure - 1,091 16,096 17,187 - 969 15,746 16,715Heritage and cultural assets - 7,717 3,614 11,331 - 8,161 2,659 10,820Other 5 555 - 560 11 543 - 554
Total non-financial assets 5 22,549 42,227 64,781 11 21,852 40,043 61,906
Total fair value measurements of assets in the statement of financial position 100,779 66,811 132,038 299,628 97,984 65,402 113,538 276,924
2014 2015
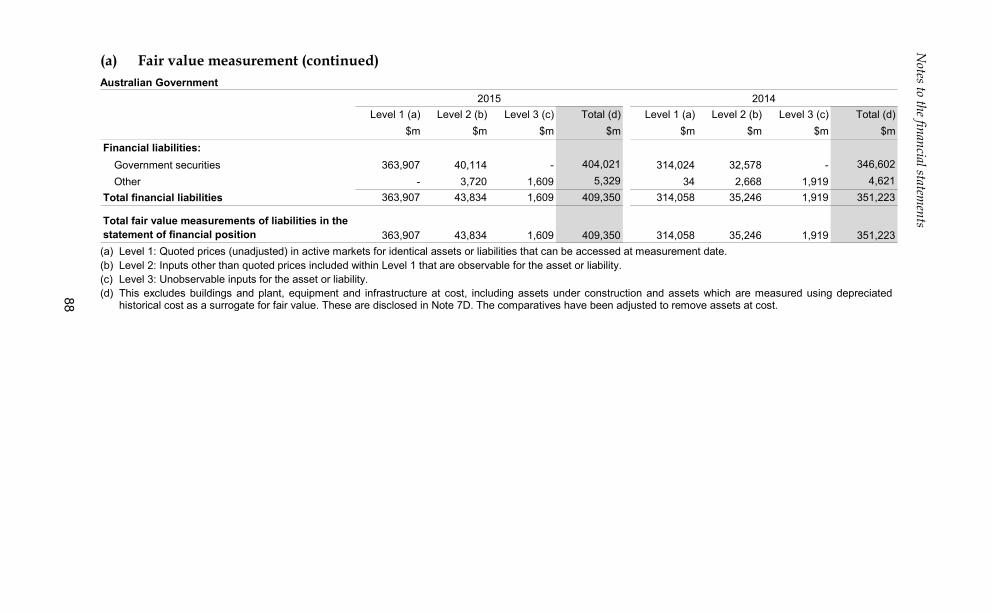
88
Notes to the financial statem
ents (a) Fair value measurement (continued) Australian Government
Level 1 (a) Level 2 (b) Level 3 (c) Total (d) Level 1 (a) Level 2 (b) Level 3 (c) Total (d)$m $m $m $m $m $m $m $m
Financial liabilities:Government securities 363,907 40,114 - 404,021 314,024 32,578 - 346,602Other - 3,720 1,609 5,329 34 2,668 1,919 4,621
Total financial liabilities 363,907 43,834 1,609 409,350 314,058 35,246 1,919 351,223
Total fair value measurements of liabilities in the statement of financial position 363,907 43,834 1,609 409,350 314,058 35,246 1,919 351,223
2015 2014
(a) Level 1: Quoted prices (unadjusted) in active markets for identical assets or liabilities that can be accessed at measurement date. (b) Level 2: Inputs other than quoted prices included within Level 1 that are observable for the asset or liability. (c) Level 3: Unobservable inputs for the asset or liability. (d) This excludes buildings and plant, equipment and infrastructure at cost, including assets under construction and assets which are measured using depreciated
historical cost as a surrogate for fair value. These are disclosed in Note 7D. The comparatives have been adjusted to remove assets at cost.
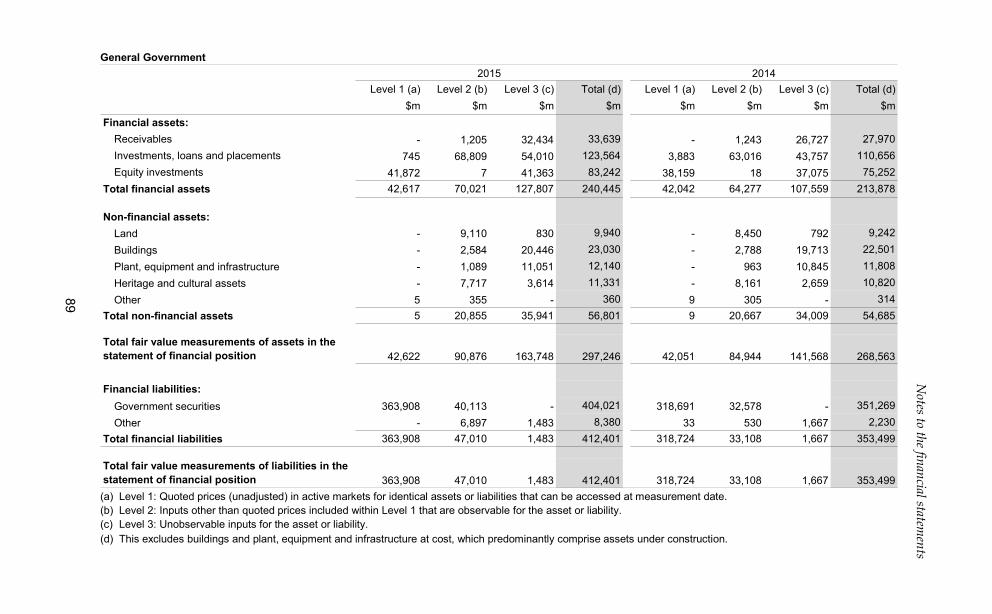
89
Notes to the financial statem
ents General Government
Level 1 (a) Level 2 (b) Level 3 (c) Total (d) Level 1 (a) Level 2 (b) Level 3 (c) Total (d)$m $m $m $m $m $m $m $m
Financial assets:Receivables - 1,205 32,434 33,639 - 1,243 26,727 27,970Investments, loans and placements 745 68,809 54,010 123,564 3,883 63,016 43,757 110,656Equity investments 41,872 7 41,363 83,242 38,159 18 37,075 75,252
Total financial assets 42,617 70,021 127,807 240,445 42,042 64,277 107,559 213,878
Non-financial assets:Land - 9,110 830 9,940 - 8,450 792 9,242Buildings - 2,584 20,446 23,030 - 2,788 19,713 22,501Plant, equipment and infrastructure - 1,089 11,051 12,140 - 963 10,845 11,808Heritage and cultural assets - 7,717 3,614 11,331 - 8,161 2,659 10,820Other 5 355 - 360 9 305 - 314
Total non-financial assets 5 20,855 35,941 56,801 9 20,667 34,009 54,685
Total fair value measurements of assets in the statement of financial position 42,622 90,876 163,748 297,246 42,051 84,944 141,568 268,563
Financial liabilities:Government securities 363,908 40,113 - 404,021 318,691 32,578 - 351,269Other - 6,897 1,483 8,380 33 530 1,667 2,230
Total financial liabilities 363,908 47,010 1,483 412,401 318,724 33,108 1,667 353,499
Total fair value measurements of liabilities in the statement of financial position 363,908 47,010 1,483 412,401 318,724 33,108 1,667 353,499
2015 2014
(a) Level 1: Quoted prices (unadjusted) in active markets for identical assets or liabilities that can be accessed at measurement date. (b) Level 2: Inputs other than quoted prices included within Level 1 that are observable for the asset or liability. (c) Level 3: Unobservable inputs for the asset or liability. (d) This excludes buildings and plant, equipment and infrastructure at cost, which predominantly comprise assets under construction.
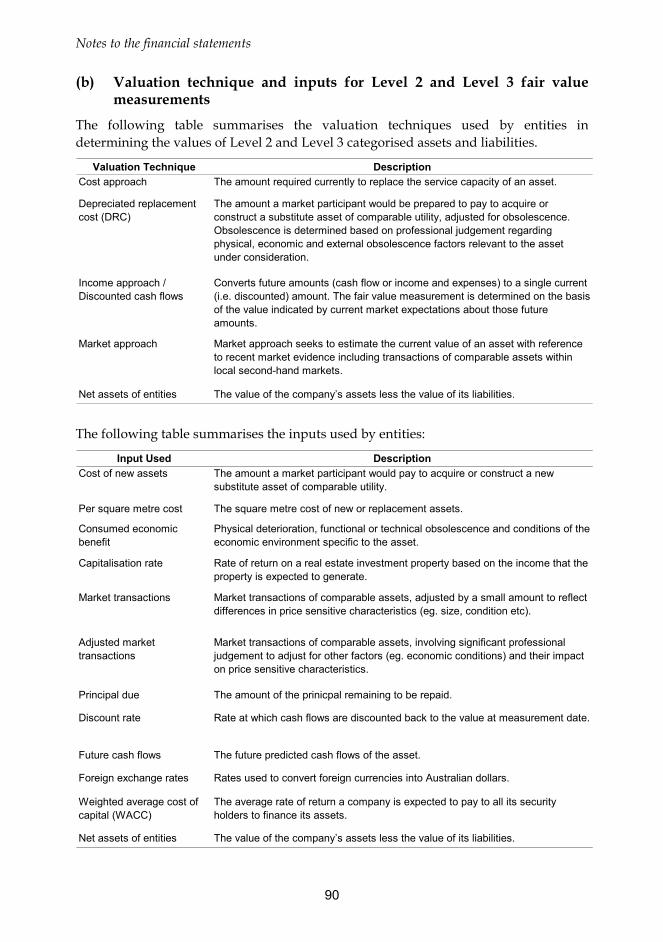
Notes to the financial statements
90
(b) Valuation technique and inputs for Level 2 and Level 3 fair value measurements
The following table summarises the valuation techniques used by entities in determining the values of Level 2 and Level 3 categorised assets and liabilities.
Valuation Technique DescriptionCost approach The amount required currently to replace the service capacity of an asset.
Depreciated replacement cost (DRC)
The amount a market participant would be prepared to pay to acquire or construct a substitute asset of comparable utility, adjusted for obsolescence. Obsolescence is determined based on professional judgement regarding physical, economic and external obsolescence factors relevant to the asset under consideration.
Income approach / Discounted cash flows
Converts future amounts (cash flow or income and expenses) to a single current (i.e. discounted) amount. The fair value measurement is determined on the basis of the value indicated by current market expectations about those future amounts.
Market approach Market approach seeks to estimate the current value of an asset with reference to recent market evidence including transactions of comparable assets within local second-hand markets.
Net assets of entities The value of the company’s assets less the value of its liabilities. The following table summarises the inputs used by entities:
Input Used DescriptionCost of new assets The amount a market participant would pay to acquire or construct a new
substitute asset of comparable utility.
Per square metre cost The square metre cost of new or replacement assets.
Consumed economic benefit
Physical deterioration, functional or technical obsolescence and conditions of the economic environment specific to the asset.
Capitalisation rate Rate of return on a real estate investment property based on the income that the property is expected to generate.
Market transactions Market transactions of comparable assets, adjusted by a small amount to reflect differences in price sensitive characteristics (eg. size, condition etc).
Adjusted market transactions
Market transactions of comparable assets, involving significant professional judgement to adjust for other factors (eg. economic conditions) and their impact on price sensitive characteristics.
Principal due The amount of the prinicpal remaining to be repaid.
Discount rate Rate at which cash flows are discounted back to the value at measurement date.
Future cash flows The future predicted cash flows of the asset.
Foreign exchange rates Rates used to convert foreign currencies into Australian dollars.
Weighted average cost of capital (WACC)
The average rate of return a company is expected to pay to all its security holders to finance its assets.
Net assets of entities The value of the company’s assets less the value of its liabilities.
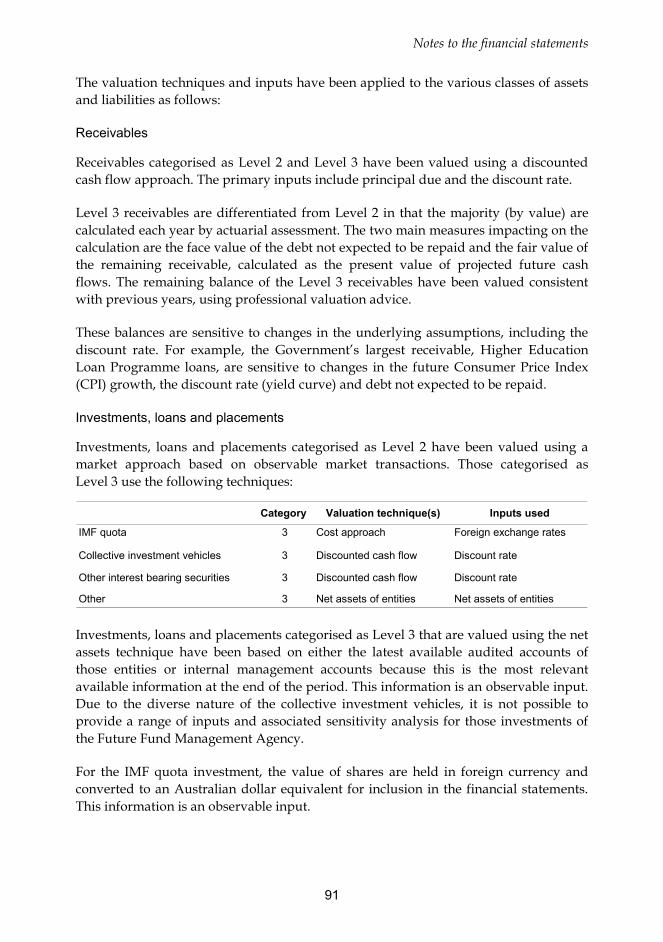
Notes to the financial statements
91
The valuation techniques and inputs have been applied to the various classes of assets and liabilities as follows:
Receivables
Receivables categorised as Level 2 and Level 3 have been valued using a discounted cash flow approach. The primary inputs include principal due and the discount rate.
Level 3 receivables are differentiated from Level 2 in that the majority (by value) are calculated each year by actuarial assessment. The two main measures impacting on the calculation are the face value of the debt not expected to be repaid and the fair value of the remaining receivable, calculated as the present value of projected future cash flows. The remaining balance of the Level 3 receivables have been valued consistent with previous years, using professional valuation advice.
These balances are sensitive to changes in the underlying assumptions, including the discount rate. For example, the Government’s largest receivable, Higher Education Loan Programme loans, are sensitive to changes in the future Consumer Price Index (CPI) growth, the discount rate (yield curve) and debt not expected to be repaid.
Investments, loans and placements
Investments, loans and placements categorised as Level 2 have been valued using a market approach based on observable market transactions. Those categorised as Level 3 use the following techniques:
Category Valuation technique(s) Inputs used
IMF quota 3 Cost approach Foreign exchange rates
Collective investment vehicles 3 Discounted cash flow Discount rate
Other interest bearing securities 3 Discounted cash flow Discount rate
Other 3 Net assets of entities Net assets of entities Investments, loans and placements categorised as Level 3 that are valued using the net assets technique have been based on either the latest available audited accounts of those entities or internal management accounts because this is the most relevant available information at the end of the period. This information is an observable input. Due to the diverse nature of the collective investment vehicles, it is not possible to provide a range of inputs and associated sensitivity analysis for those investments of the Future Fund Management Agency.
For the IMF quota investment, the value of shares are held in foreign currency and converted to an Australian dollar equivalent for inclusion in the financial statements. This information is an observable input.
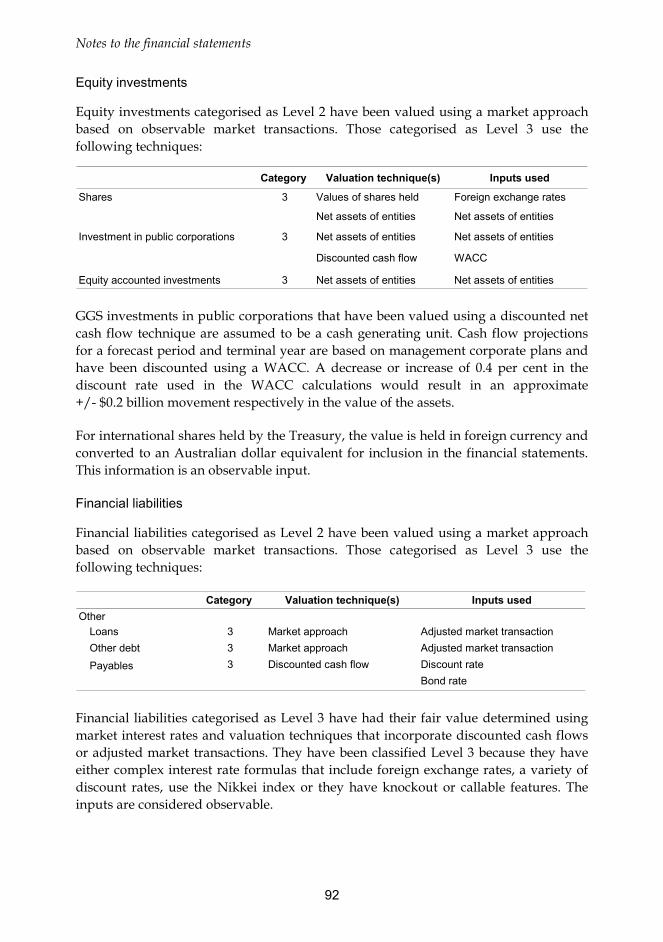
Notes to the financial statements
92
Equity investments
Equity investments categorised as Level 2 have been valued using a market approach based on observable market transactions. Those categorised as Level 3 use the following techniques:
Category Valuation technique(s) Inputs used
Shares 3 Values of shares held Foreign exchange rates
Net assets of entities Net assets of entities
Investment in public corporations 3 Net assets of entities Net assets of entities
Discounted cash flow WACC
Equity accounted investments 3 Net assets of entities Net assets of entities GGS investments in public corporations that have been valued using a discounted net cash flow technique are assumed to be a cash generating unit. Cash flow projections for a forecast period and terminal year are based on management corporate plans and have been discounted using a WACC. A decrease or increase of 0.4 per cent in the discount rate used in the WACC calculations would result in an approximate +/- $0.2 billion movement respectively in the value of the assets.
For international shares held by the Treasury, the value is held in foreign currency and converted to an Australian dollar equivalent for inclusion in the financial statements. This information is an observable input.
Financial liabilities
Financial liabilities categorised as Level 2 have been valued using a market approach based on observable market transactions. Those categorised as Level 3 use the following techniques:
Category Valuation technique(s) Inputs usedOther
Loans 3 Market approach Adjusted market transactionOther debt 3 Market approach Adjusted market transactionPayables 3 Discounted cash flow Discount rate
Bond rate Financial liabilities categorised as Level 3 have had their fair value determined using market interest rates and valuation techniques that incorporate discounted cash flows or adjusted market transactions. They have been classified Level 3 because they have either complex interest rate formulas that include foreign exchange rates, a variety of discount rates, use the Nikkei index or they have knockout or callable features. The inputs are considered observable.
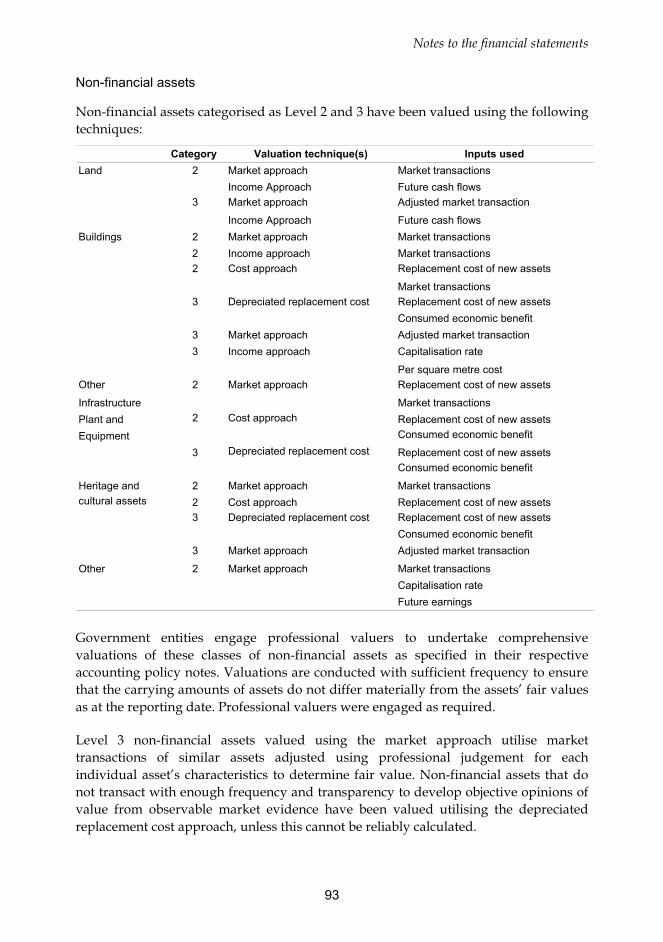
Notes to the financial statements
93
Non-financial assets
Non-financial assets categorised as Level 2 and 3 have been valued using the following techniques:
Category Valuation technique(s) Inputs usedLand 2 Market approach Market transactions
Income Approach Future cash flows 3 Market approach Adjusted market transaction
Income Approach Future cash flowsBuildings 2 Market approach Market transactions
2 Income approach Market transactions 2 Cost approach Replacement cost of new assets
Market transactions 3 Depreciated replacement cost Replacement cost of new assets
Consumed economic benefit 3 Market approach Adjusted market transaction 3 Income approach Capitalisation rate
Per square metre costOther 2 Market approach Replacement cost of new assets
Infrastructure Market transactionsPlant and 2 Cost approach Replacement cost of new assetsEquipment Consumed economic benefit
3 Depreciated replacement cost Replacement cost of new assetsConsumed economic benefit
Heritage and 2 Market approach Market transactionscultural assets 2 Cost approach Replacement cost of new assets
3 Depreciated replacement cost Replacement cost of new assetsConsumed economic benefit
3 Market approach Adjusted market transaction
Other 2 Market approach Market transactionsCapitalisation rateFuture earnings
Government entities engage professional valuers to undertake comprehensive valuations of these classes of non-financial assets as specified in their respective accounting policy notes. Valuations are conducted with sufficient frequency to ensure that the carrying amounts of assets do not differ materially from the assets’ fair values as at the reporting date. Professional valuers were engaged as required.
Level 3 non-financial assets valued using the market approach utilise market transactions of similar assets adjusted using professional judgement for each individual asset’s characteristics to determine fair value. Non-financial assets that do not transact with enough frequency and transparency to develop objective opinions of value from observable market evidence have been valued utilising the depreciated replacement cost approach, unless this cannot be reliably calculated.
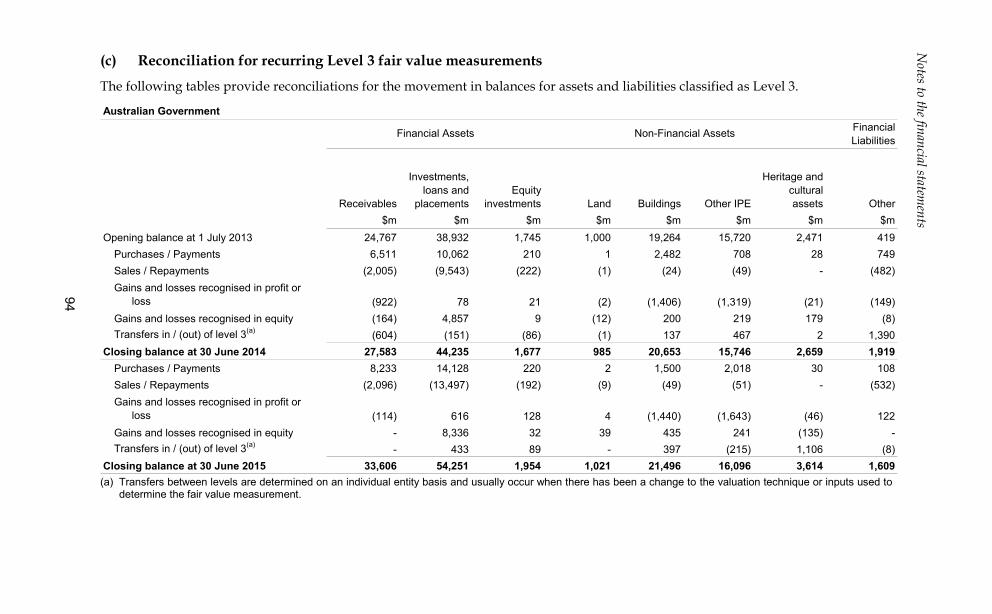
Notes to the financial statem
ents
94
(c) Reconciliation for recurring Level 3 fair value measurements
The following tables provide reconciliations for the movement in balances for assets and liabilities classified as Level 3.
Australian GovernmentFinancial Liabilities
Receivables
Investments, loans and
placementsEquity
investments Land Buildings Other IPE
Heritage and cultural assets Other
$m $m $m $m $m $m $m $mOpening balance at 1 July 2013 24,767 38,932 1,745 1,000 19,264 15,720 2,471 419
Purchases / Payments 6,511 10,062 210 1 2,482 708 28 749Sales / Repayments (2,005) (9,543) (222) (1) (24) (49) - (482)Gains and losses recognised in profit or loss (922) 78 21 (2) (1,406) (1,319) (21) (149)Gains and losses recognised in equity (164) 4,857 9 (12) 200 219 179 (8)Transfers in / (out) of level 3(a) (604) (151) (86) (1) 137 467 2 1,390
Closing balance at 30 June 2014 27,583 44,235 1,677 985 20,653 15,746 2,659 1,919Purchases / Payments 8,233 14,128 220 2 1,500 2,018 30 108Sales / Repayments (2,096) (13,497) (192) (9) (49) (51) - (532)Gains and losses recognised in profit or loss (114) 616 128 4 (1,440) (1,643) (46) 122Gains and losses recognised in equity - 8,336 32 39 435 241 (135) -Transfers in / (out) of level 3(a) - 433 89 - 397 (215) 1,106 (8)
Closing balance at 30 June 2015 33,606 54,251 1,954 1,021 21,496 16,096 3,614 1,609
Financial Assets Non-Financial Assets
(a) Transfers between levels are determined on an individual entity basis and usually occur when there has been a change to the valuation technique or inputs used to
determine the fair value measurement.
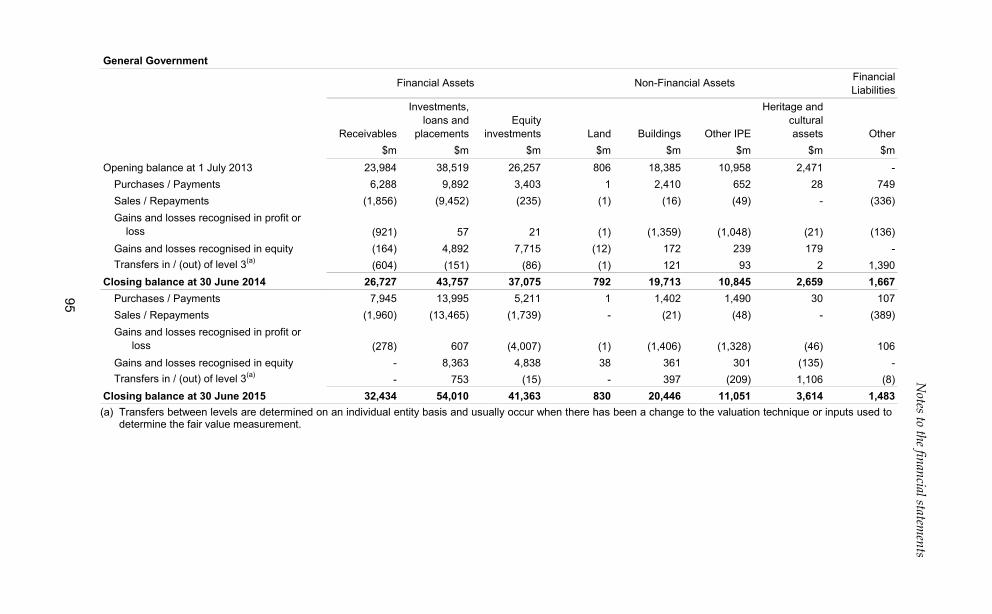
Notes to the financial statem
ents
95
General GovernmentFinancial Liabilities
Receivables
Investments, loans and
placementsEquity
investments Land Buildings Other IPE
Heritage and cultural assets Other
$m $m $m $m $m $m $m $mOpening balance at 1 July 2013 23,984 38,519 26,257 806 18,385 10,958 2,471 -
Purchases / Payments 6,288 9,892 3,403 1 2,410 652 28 749Sales / Repayments (1,856) (9,452) (235) (1) (16) (49) - (336)Gains and losses recognised in profit or loss (921) 57 21 (1) (1,359) (1,048) (21) (136)Gains and losses recognised in equity (164) 4,892 7,715 (12) 172 239 179 -Transfers in / (out) of level 3(a) (604) (151) (86) (1) 121 93 2 1,390
Closing balance at 30 June 2014 26,727 43,757 37,075 792 19,713 10,845 2,659 1,667Purchases / Payments 7,945 13,995 5,211 1 1,402 1,490 30 107Sales / Repayments (1,960) (13,465) (1,739) - (21) (48) - (389)Gains and losses recognised in profit or loss (278) 607 (4,007) (1) (1,406) (1,328) (46) 106Gains and losses recognised in equity - 8,363 4,838 38 361 301 (135) -Transfers in / (out) of level 3(a) - 753 (15) - 397 (209) 1,106 (8)
Closing balance at 30 June 2015 32,434 54,010 41,363 830 20,446 11,051 3,614 1,483
Financial Assets Non-Financial Assets
(a) Transfers between levels are determined on an individual entity basis and usually occur when there has been a change to the valuation technique or inputs used to
determine the fair value measurement.
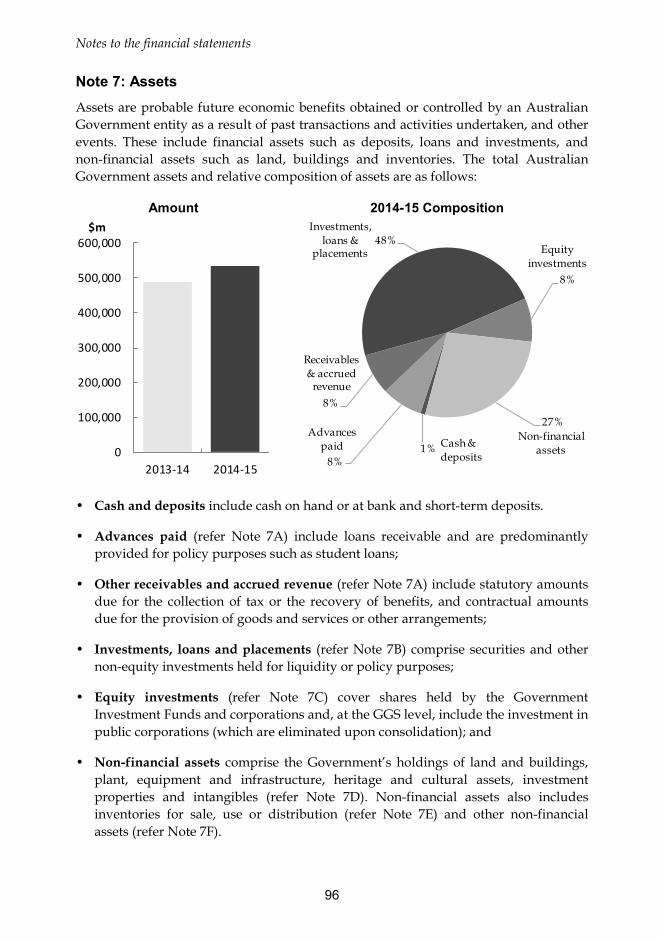
Notes to the financial statements
96
Note 7: Assets Assets are probable future economic benefits obtained or controlled by an Australian Government entity as a result of past transactions and activities undertaken, and other events. These include financial assets such as deposits, loans and investments, and non-financial assets such as land, buildings and inventories. The total Australian Government assets and relative composition of assets are as follows:
Amount 2014-15 Composition
0
100,000
200,000
300,000
400,000
500,000
600,000
2013-14 2014-15
$m
1%
8%
8%
48%
8%
27%
Cash & deposits
Equity investments
Non-financial assets
Investments, loans &
placements
Receivables & accrued
revenue
Advances paid
• Cash and deposits include cash on hand or at bank and short-term deposits.
• Advances paid (refer Note 7A) include loans receivable and are predominantly provided for policy purposes such as student loans;
• Other receivables and accrued revenue (refer Note 7A) include statutory amounts due for the collection of tax or the recovery of benefits, and contractual amounts due for the provision of goods and services or other arrangements;
• Investments, loans and placements (refer Note 7B) comprise securities and other non-equity investments held for liquidity or policy purposes;
• Equity investments (refer Note 7C) cover shares held by the Government Investment Funds and corporations and, at the GGS level, include the investment in public corporations (which are eliminated upon consolidation); and
• Non-financial assets comprise the Government’s holdings of land and buildings, plant, equipment and infrastructure, heritage and cultural assets, investment properties and intangibles (refer Note 7D). Non-financial assets also includes inventories for sale, use or distribution (refer Note 7E) and other non-financial assets (refer Note 7F).
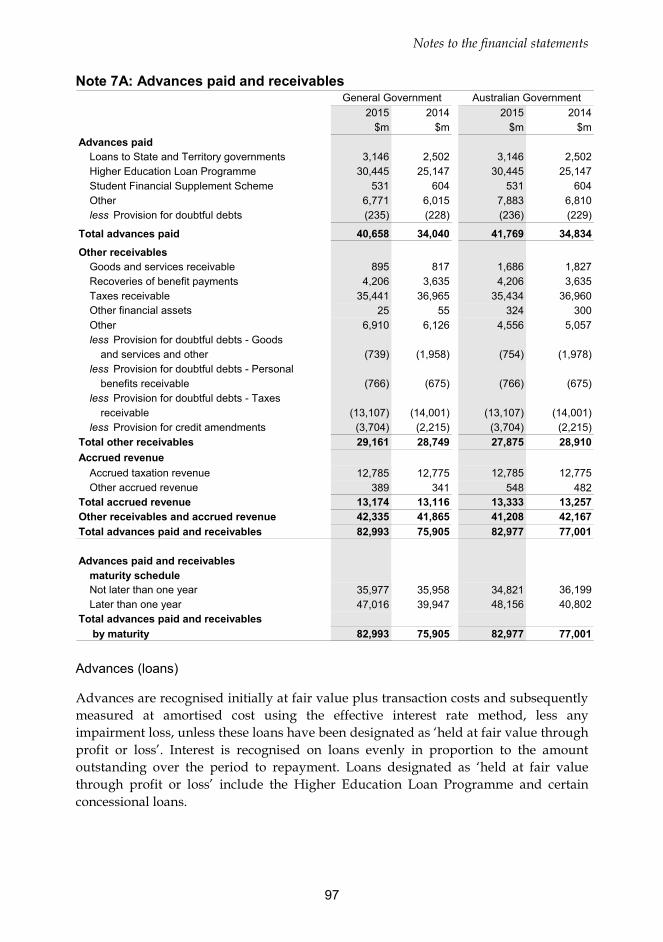
Notes to the financial statements
97
Note 7A: Advances paid and receivables
2015 2014 2015 2014$m $m $m $m
Advances paidLoans to State and Territory governments 3,146 2,502 3,146 2,502Higher Education Loan Programme 30,445 25,147 30,445 25,147Student Financial Supplement Scheme 531 604 531 604Other 6,771 6,015 7,883 6,810less Provision for doubtful debts (235) (228) (236) (229)
Total advances paid 40,658 34,040 41,769 34,834
Other receivablesGoods and services receivable 895 817 1,686 1,827Recoveries of benefit payments 4,206 3,635 4,206 3,635Taxes receivable 35,441 36,965 35,434 36,960Other financial assets 25 55 324 300Other 6,910 6,126 4,556 5,057less Provision for doubtful debts - Goods
and services and other (739) (1,958) (754) (1,978)less Provision for doubtful debts - Personal
benefits receivable (766) (675) (766) (675)less Provision for doubtful debts - Taxes
receivable (13,107) (14,001) (13,107) (14,001)less Provision for credit amendments (3,704) (2,215) (3,704) (2,215)
Total other receivables 29,161 28,749 27,875 28,910Accrued revenue
Accrued taxation revenue 12,785 12,775 12,785 12,775Other accrued revenue 389 341 548 482
Total accrued revenue 13,174 13,116 13,333 13,257Other receivables and accrued revenue 42,335 41,865 41,208 42,167Total advances paid and receivables 82,993 75,905 82,977 77,001
Advances paid and receivablesmaturity scheduleNot later than one year 35,977 35,958 34,821 36,199Later than one year 47,016 39,947 48,156 40,802
Total advances paid and receivables by maturity 82,993 75,905 82,977 77,001
General Government Australian Government
Advances (loans)
Advances are recognised initially at fair value plus transaction costs and subsequently measured at amortised cost using the effective interest rate method, less any impairment loss, unless these loans have been designated as ‘held at fair value through profit or loss’. Interest is recognised on loans evenly in proportion to the amount outstanding over the period to repayment. Loans designated as ‘held at fair value through profit or loss’ include the Higher Education Loan Programme and certain concessional loans.
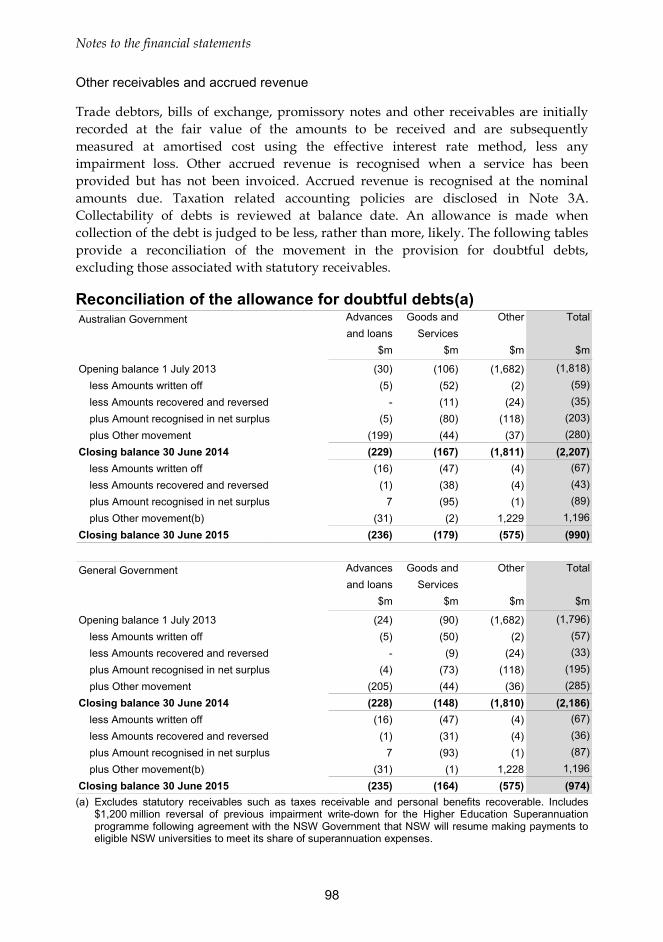
Notes to the financial statements
98
Other receivables and accrued revenue
Trade debtors, bills of exchange, promissory notes and other receivables are initially recorded at the fair value of the amounts to be received and are subsequently measured at amortised cost using the effective interest rate method, less any impairment loss. Other accrued revenue is recognised when a service has been provided but has not been invoiced. Accrued revenue is recognised at the nominal amounts due. Taxation related accounting policies are disclosed in Note 3A. Collectability of debts is reviewed at balance date. An allowance is made when collection of the debt is judged to be less, rather than more, likely. The following tables provide a reconciliation of the movement in the provision for doubtful debts, excluding those associated with statutory receivables.
Reconciliation of the allowance for doubtful debts(a) Australian Government Advances Goods and Other Total
and loans Services$m $m $m $m
Opening balance 1 July 2013 (30) (106) (1,682) (1,818)less Amounts written off (5) (52) (2) (59)less Amounts recovered and reversed - (11) (24) (35)plus Amount recognised in net surplus (5) (80) (118) (203)plus Other movement (199) (44) (37) (280)
Closing balance 30 June 2014 (229) (167) (1,811) (2,207)less Amounts written off (16) (47) (4) (67)less Amounts recovered and reversed (1) (38) (4) (43)plus Amount recognised in net surplus 7 (95) (1) (89)plus Other movement(b) (31) (2) 1,229 1,196
Closing balance 30 June 2015 (236) (179) (575) (990) General Government Advances Goods and Other Total
and loans Services$m $m $m $m
Opening balance 1 July 2013 (24) (90) (1,682) (1,796)less Amounts written off (5) (50) (2) (57)less Amounts recovered and reversed - (9) (24) (33)plus Amount recognised in net surplus (4) (73) (118) (195)plus Other movement (205) (44) (36) (285)
Closing balance 30 June 2014 (228) (148) (1,810) (2,186)less Amounts written off (16) (47) (4) (67)less Amounts recovered and reversed (1) (31) (4) (36)plus Amount recognised in net surplus 7 (93) (1) (87)plus Other movement(b) (31) (1) 1,228 1,196
Closing balance 30 June 2015 (235) (164) (575) (974) (a) Excludes statutory receivables such as taxes receivable and personal benefits recoverable. Includes
$1,200 million reversal of previous impairment write-down for the Higher Education Superannuation programme following agreement with the NSW Government that NSW will resume making payments to eligible NSW universities to meet its share of superannuation expenses.
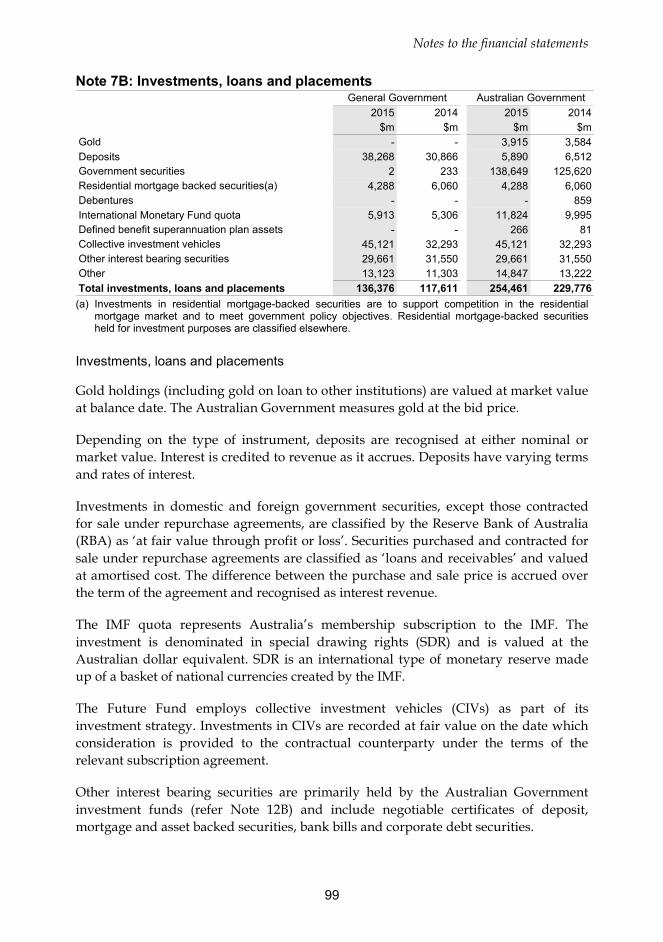
Notes to the financial statements
99
Note 7B: Investments, loans and placements
2015 2014 2015 2014$m $m $m $m
Gold - - 3,915 3,584Deposits 38,268 30,866 5,890 6,512Government securities 2 233 138,649 125,620Residential mortgage backed securities(a) 4,288 6,060 4,288 6,060Debentures - - - 859International Monetary Fund quota 5,913 5,306 11,824 9,995Defined benefit superannuation plan assets - - 266 81Collective investment vehicles 45,121 32,293 45,121 32,293Other interest bearing securities 29,661 31,550 29,661 31,550Other 13,123 11,303 14,847 13,222Total investments, loans and placements 136,376 117,611 254,461 229,776
General Government Australian Government
(a) Investments in residential mortgage-backed securities are to support competition in the residential
mortgage market and to meet government policy objectives. Residential mortgage-backed securities held for investment purposes are classified elsewhere.
Investments, loans and placements
Gold holdings (including gold on loan to other institutions) are valued at market value at balance date. The Australian Government measures gold at the bid price.
Depending on the type of instrument, deposits are recognised at either nominal or market value. Interest is credited to revenue as it accrues. Deposits have varying terms and rates of interest.
Investments in domestic and foreign government securities, except those contracted for sale under repurchase agreements, are classified by the Reserve Bank of Australia (RBA) as ‘at fair value through profit or loss’. Securities purchased and contracted for sale under repurchase agreements are classified as ‘loans and receivables’ and valued at amortised cost. The difference between the purchase and sale price is accrued over the term of the agreement and recognised as interest revenue.
The IMF quota represents Australia’s membership subscription to the IMF. The investment is denominated in special drawing rights (SDR) and is valued at the Australian dollar equivalent. SDR is an international type of monetary reserve made up of a basket of national currencies created by the IMF.
The Future Fund employs collective investment vehicles (CIVs) as part of its investment strategy. Investments in CIVs are recorded at fair value on the date which consideration is provided to the contractual counterparty under the terms of the relevant subscription agreement.
Other interest bearing securities are primarily held by the Australian Government investment funds (refer Note 12B) and include negotiable certificates of deposit, mortgage and asset backed securities, bank bills and corporate debt securities.
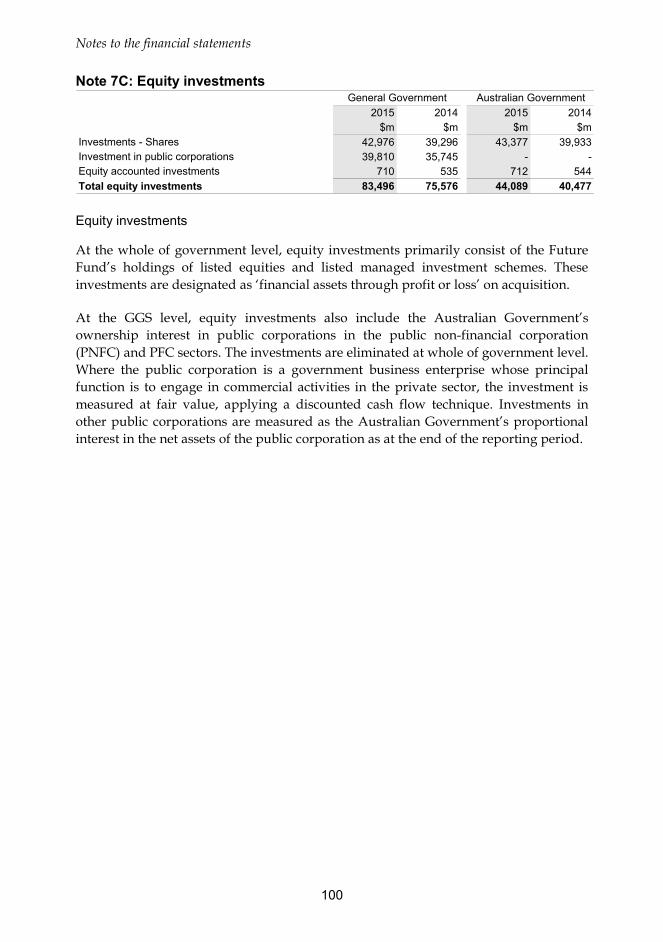
Notes to the financial statements
100
Note 7C: Equity investments
2015 2014 2015 2014$m $m $m $m
Investments - Shares 42,976 39,296 43,377 39,933Investment in public corporations 39,810 35,745 - -Equity accounted investments 710 535 712 544Total equity investments 83,496 75,576 44,089 40,477
General Government Australian Government
Equity investments
At the whole of government level, equity investments primarily consist of the Future Fund’s holdings of listed equities and listed managed investment schemes. These investments are designated as ‘financial assets through profit or loss’ on acquisition.
At the GGS level, equity investments also include the Australian Government’s ownership interest in public corporations in the public non-financial corporation (PNFC) and PFC sectors. The investments are eliminated at whole of government level. Where the public corporation is a government business enterprise whose principal function is to engage in commercial activities in the private sector, the investment is measured at fair value, applying a discounted cash flow technique. Investments in other public corporations are measured as the Australian Government’s proportional interest in the net assets of the public corporation as at the end of the reporting period.

Notes to the financial statem
ents
101
Note 7D: Land and buildings, plant, equipment and infrastructure, heritage and cultural assets and intangibles Australian Government Heritage
Specialist Other plant, and military equipment and cultural Investment Computer Other
Land Buildings equipment infrastructure assets property software intangibles TotalItem $m $m $m $m $m $m $m $m $m
Gross book value 109 3,540 77,387 12,091 5 - 10,748 4,674 108,554Accumulated depreciation/amortisation - (66) (36,144) (1,816) - - (5,671) (1,215) (44,912)
At Cost 109 3,474 41,243 10,275 5 - 5,077 3,459 63,642
Gross book value 10,287 26,999 - 20,051 10,876 375 - - 68,588Accumulated depreciation/amortisation - (3,470) - (3,336) (56) - - - (6,862)
At Fair Value 10,287 23,529 - 16,715 10,820 375 - - 61,726
Net book value at 30 June 2014 10,396 27,003 41,243 26,990 10,825 375 5,077 3,459 125,368
Gross book value 15 3,224 81,186 15,359 1 - 11,081 4,601 115,467Accumulated depreciation/amortisation - (111) (38,534) (2,031) - - (6,002) (1,002) (47,680)
At Cost 15 3,113 42,652 13,328 1 - 5,079 3,599 67,787
Gross book value 10,938 27,833 - 20,797 11,445 387 - - 71,400Accumulated depreciation/amortisation - (3,068) - (3,610) (114) - - - (6,792)
At Fair Value 10,938 24,765 - 17,187 11,331 387 - - 64,608
Net book value at 30 June 2015 10,953 27,878 42,652 30,515 11,332 387 5,079 3,599 132,395 Australian Government assets at fair value — Revaluation period
Assets held at fair value as at 30 June 2015 were based on valuations conducted in the following periods:
2013-14 or earlier 283 1,386 - 3,114 1 - - - 4,7842014-15 10,655 23,379 - 14,073 11,330 387 - - 59,824
Assets at fair value at 30 June 2015 10,938 24,765 - 17,187 11,331 387 - - 64,608
Notes to the financial statements
102
Australian Government assets at fair value — Valuation details
Details pertaining to valuations can be found in the audited financial statements of individual Australian Government controlled entities. During 2014-15, material revaluations occurred within the following Australian Government controlled entities:
• Australian Customs and Border Protection Service;
• Australian Postal Corporation;
• Australian Rail Track Corporation Limited;
• Australian Submarine Corporation Pty Limited;
• Commonwealth Scientific and Industrial Research Organisation;
• Defence Housing Australia;
• Department of Defence;
• Department of Finance;
• Department of Foreign Affairs and Trade;
• Department of Immigration and Border Protection;
• Department of Infrastructure and Regional Development;
• Department of Veteran Affairs;
• Indigenous Land Corporation;
• National Archives of Australia;
• National Gallery of Australia;
• National Library of Australia; and
• Sydney Harbour Federation Trust.
Australian Government leased assets
Australian Government entities lease assets under a number of finance leases. As at 30 June 2015, the carrying value of leased assets included $1,400 million in land and buildings (2014: $1,499 million) and $252 million in plant and equipment (2014: $237 million). These entities were within the GGS. Refer Note 8D for accounting policy disclosure on finance leases.
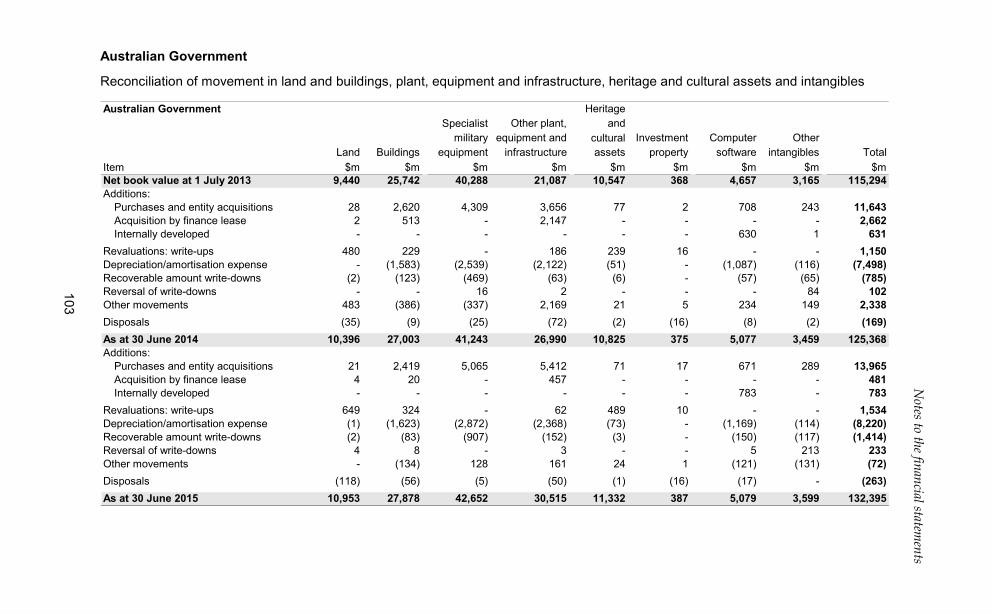
Notes to the financial statem
ents
103
Australian Government
Reconciliation of movement in land and buildings, plant, equipment and infrastructure, heritage and cultural assets and intangibles
Australian Government HeritageSpecialist Other plant, and
military equipment and cultural Investment Computer OtherLand Buildings equipment infrastructure assets property software intangibles Total
Item $m $m $m $m $m $m $m $m $mNet book value at 1 July 2013 9,440 25,742 40,288 21,087 10,547 368 4,657 3,165 115,294Additions:
Purchases and entity acquisitions 28 2,620 4,309 3,656 77 2 708 243 11,643Acquisition by finance lease 2 513 - 2,147 - - - - 2,662Internally developed - - - - - - 630 1 631
Revaluations: write-ups 480 229 - 186 239 16 - - 1,150Depreciation/amortisation expense - (1,583) (2,539) (2,122) (51) - (1,087) (116) (7,498)Recoverable amount write-downs (2) (123) (469) (63) (6) - (57) (65) (785)Reversal of write-downs - - 16 2 - - - 84 102Other movements 483 (386) (337) 2,169 21 5 234 149 2,338Disposals (35) (9) (25) (72) (2) (16) (8) (2) (169)As at 30 June 2014 10,396 27,003 41,243 26,990 10,825 375 5,077 3,459 125,368Additions:
Purchases and entity acquisitions 21 2,419 5,065 5,412 71 17 671 289 13,965Acquisition by finance lease 4 20 - 457 - - - - 481Internally developed - - - - - - 783 - 783
Revaluations: write-ups 649 324 - 62 489 10 - - 1,534Depreciation/amortisation expense (1) (1,623) (2,872) (2,368) (73) - (1,169) (114) (8,220)Recoverable amount write-downs (2) (83) (907) (152) (3) - (150) (117) (1,414)Reversal of write-downs 4 8 - 3 - - 5 213 233Other movements - (134) 128 161 24 1 (121) (131) (72)Disposals (118) (56) (5) (50) (1) (16) (17) - (263)As at 30 June 2015 10,953 27,878 42,652 30,515 11,332 387 5,079 3,599 132,395
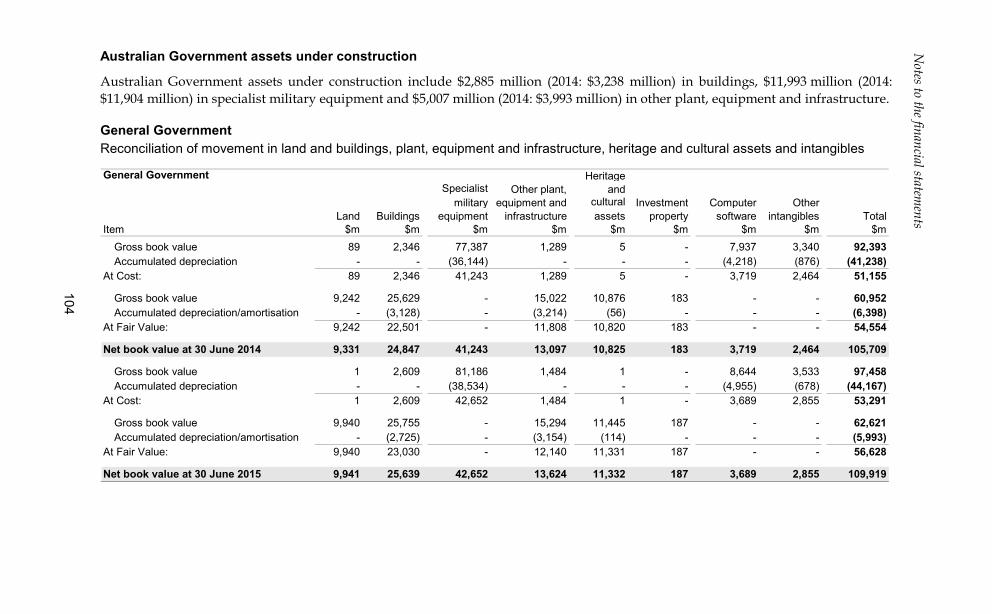
Notes to the financial statem
ents
104
Australian Government assets under construction
Australian Government assets under construction include $2,885 million (2014: $3,238 million) in buildings, $11,993 million (2014: $11,904 million) in specialist military equipment and $5,007 million (2014: $3,993 million) in other plant, equipment and infrastructure.
General Government Reconciliation of movement in land and buildings, plant, equipment and infrastructure, heritage and cultural assets and intangibles
General Government HeritageSpecialist Other plant, and
military equipment and cultural Investment Computer OtherLand Buildings equipment infrastructure assets property software intangibles Total
Item $m $m $m $m $m $m $m $m $mGross book value 89 2,346 77,387 1,289 5 - 7,937 3,340 92,393Accumulated depreciation - - (36,144) - - - (4,218) (876) (41,238)
At Cost: 89 2,346 41,243 1,289 5 - 3,719 2,464 51,155
Gross book value 9,242 25,629 - 15,022 10,876 183 - - 60,952Accumulated depreciation/amortisation - (3,128) - (3,214) (56) - - - (6,398)
At Fair Value: 9,242 22,501 - 11,808 10,820 183 - - 54,554
Net book value at 30 June 2014 9,331 24,847 41,243 13,097 10,825 183 3,719 2,464 105,709
Gross book value 1 2,609 81,186 1,484 1 - 8,644 3,533 97,458Accumulated depreciation - - (38,534) - - - (4,955) (678) (44,167)
At Cost: 1 2,609 42,652 1,484 1 - 3,689 2,855 53,291
Gross book value 9,940 25,755 - 15,294 11,445 187 - - 62,621Accumulated depreciation/amortisation - (2,725) - (3,154) (114) - - - (5,993)
At Fair Value: 9,940 23,030 - 12,140 11,331 187 - - 56,628
Net book value at 30 June 2015 9,941 25,639 42,652 13,624 11,332 187 3,689 2,855 109,919
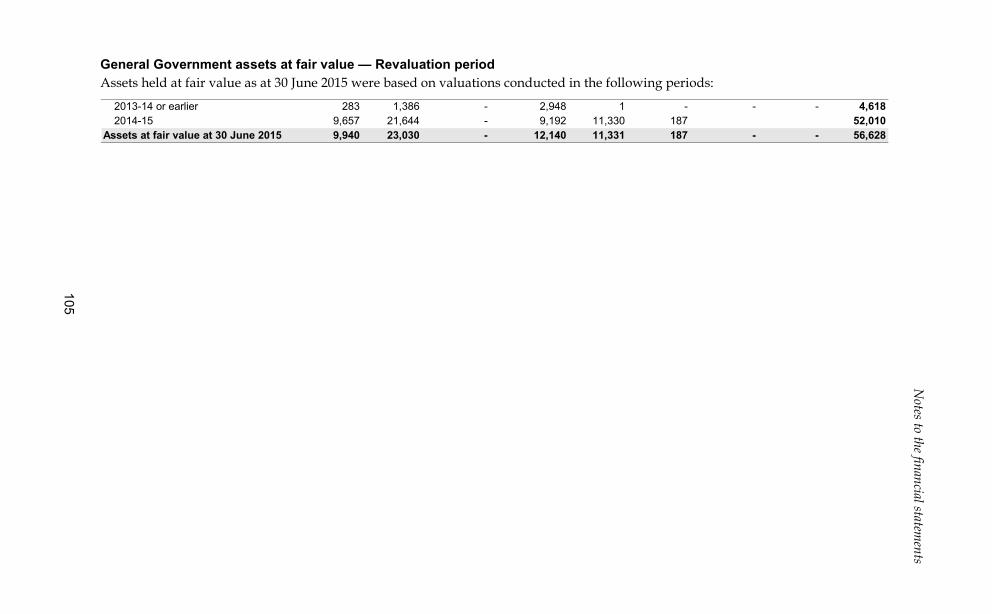
Notes to the financial statem
ents
105
General Government assets at fair value — Revaluation period Assets held at fair value as at 30 June 2015 were based on valuations conducted in the following periods:
2013-14 or earlier 283 1,386 - 2,948 1 - - - 4,6182014-15 9,657 21,644 - 9,192 11,330 187 52,010
Assets at fair value at 30 June 2015 9,940 23,030 - 12,140 11,331 187 - - 56,628
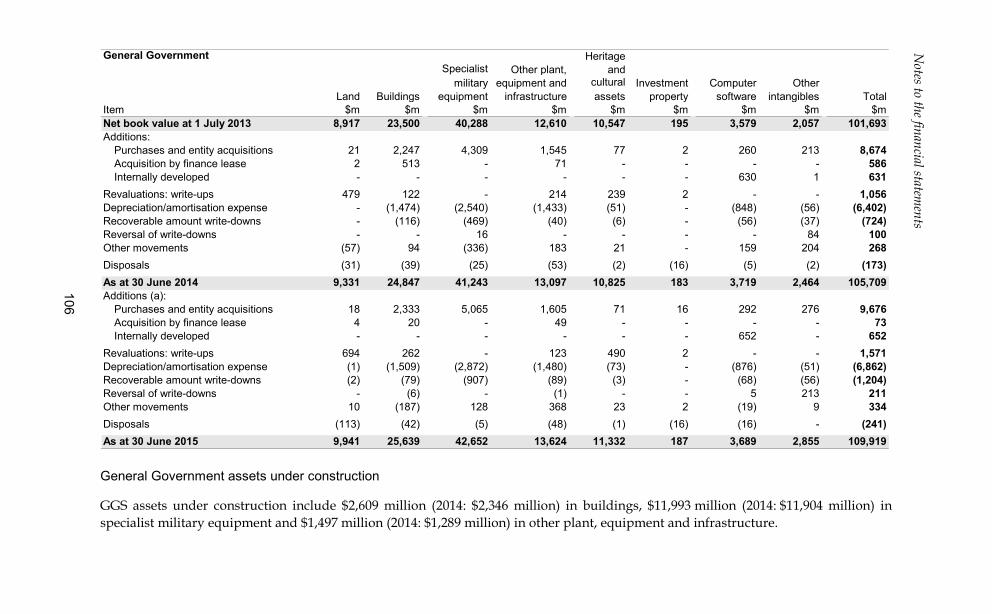
Notes to the financial statem
ents
106
General Government HeritageSpecialist Other plant, and
military equipment and cultural Investment Computer OtherLand Buildings equipment infrastructure assets property software intangibles Total
Item $m $m $m $m $m $m $m $m $mNet book value at 1 July 2013 8,917 23,500 40,288 12,610 10,547 195 3,579 2,057 101,693Additions:
Purchases and entity acquisitions 21 2,247 4,309 1,545 77 2 260 213 8,674Acquisition by finance lease 2 513 - 71 - - - - 586Internally developed - - - - - - 630 1 631
Revaluations: write-ups 479 122 - 214 239 2 - - 1,056Depreciation/amortisation expense - (1,474) (2,540) (1,433) (51) - (848) (56) (6,402)Recoverable amount write-downs - (116) (469) (40) (6) - (56) (37) (724)Reversal of write-downs - - 16 - - - - 84 100Other movements (57) 94 (336) 183 21 - 159 204 268Disposals (31) (39) (25) (53) (2) (16) (5) (2) (173)As at 30 June 2014 9,331 24,847 41,243 13,097 10,825 183 3,719 2,464 105,709Additions (a):
Purchases and entity acquisitions 18 2,333 5,065 1,605 71 16 292 276 9,676Acquisition by finance lease 4 20 - 49 - - - - 73Internally developed - - - - - - 652 - 652
Revaluations: write-ups 694 262 - 123 490 2 - - 1,571Depreciation/amortisation expense (1) (1,509) (2,872) (1,480) (73) - (876) (51) (6,862)Recoverable amount write-downs (2) (79) (907) (89) (3) - (68) (56) (1,204)Reversal of write-downs - (6) - (1) - - 5 213 211Other movements 10 (187) 128 368 23 2 (19) 9 334Disposals (113) (42) (5) (48) (1) (16) (16) - (241)As at 30 June 2015 9,941 25,639 42,652 13,624 11,332 187 3,689 2,855 109,919 General Government assets under construction
GGS assets under construction include $2,609 million (2014: $2,346 million) in buildings, $11,993 million (2014: $11,904 million) in specialist military equipment and $1,497 million (2014: $1,289 million) in other plant, equipment and infrastructure.
Notes to the financial statements
107
Land, buildings, plant, equipment and infrastructure
Property, plant and equipment are stated at historical cost or valuation, except as otherwise indicated. Property, plant and equipment are stated at fair value, except assets under construction and specialist military equipment (refer Note 1.8), which is valued at cost. Certain small entities and public corporations may adopt a cost basis in their own financial statements. Where the difference is material to the CFS, an adjustment is made on consolidation.
Where available, the fair value of property, plant and equipment is determined by reference to market-based evidence, for example, the market value of similar properties. If there is no market-based evidence of fair value because of the specialised nature of the item of property, plant or equipment and the item is rarely sold, fair value is estimated using an income (net present value/discounted cash flows) or a depreciated replacement cost approach. The valuation techniques used for each class of depreciable assets are disclosed in Note 6.
The cost of restoration or removal is provided for in the measurement of property, plant and equipment when a legal or constructive obligation exists. These costs include obligations relating to the dismantling, removal, remediation, restoration and other expenditure associated with the Australian Government’s fixed assets or site fit-outs. Restoration provisions are initially recorded when a reliable estimate of the costs to be incurred can be determined and are discounted to present value. Estimates are based upon a review of lease contracts, legal requirements, historical information, and expected future costs. Any changes to these estimates are adjusted on a progressive basis as required.
Intangibles
The Australian Government’s intangibles comprise internally developed software for internal use, water entitlements and intangible assets acquired by public corporations (PNFCs and PFCs). When public corporations acquire investments in controlled, jointly controlled or associated entities, and pay an amount greater than the fair value of the net identifiable assets of the entity, this excess is recognised as goodwill.
Intangibles are carried at cost. Water entitlements are classified as indefinite life intangibles and are therefore subject to annual impairment testing. Goodwill and other indefinite life intangibles are not amortised but tested for impairment on an annual basis.
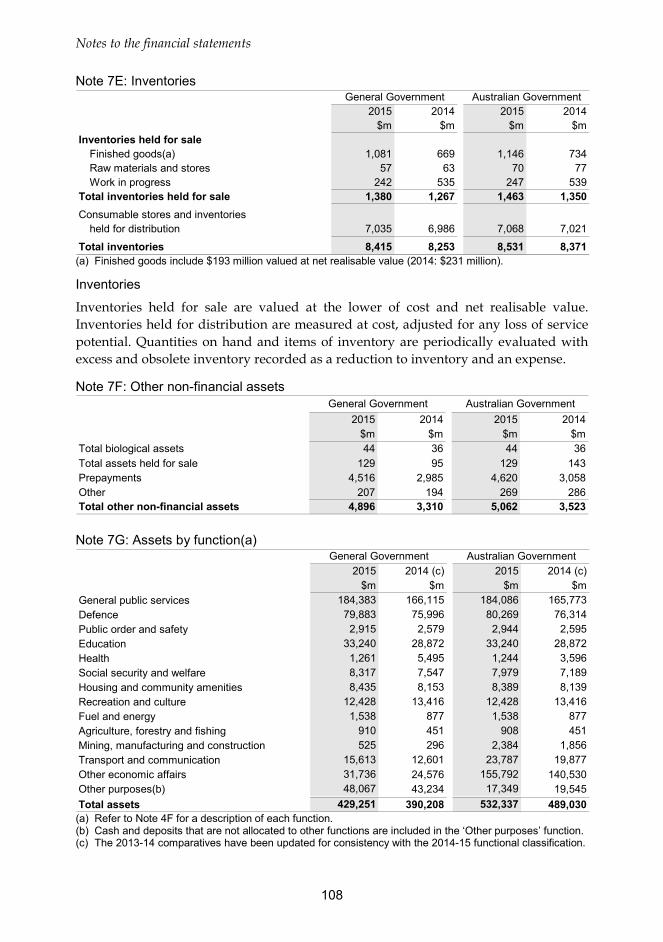
Notes to the financial statements
108
Note 7E: Inventories
2015 2014 2015 2014$m $m $m $m
Inventories held for saleFinished goods(a) 1,081 669 1,146 734Raw materials and stores 57 63 70 77Work in progress 242 535 247 539
Total inventories held for sale 1,380 1,267 1,463 1,350Consumable stores and inventories
held for distribution 7,035 6,986 7,068 7,021
Total inventories 8,415 8,253 8,531 8,371
General Government Australian Government
(a) Finished goods include $193 million valued at net realisable value (2014: $231 million).
Inventories
Inventories held for sale are valued at the lower of cost and net realisable value. Inventories held for distribution are measured at cost, adjusted for any loss of service potential. Quantities on hand and items of inventory are periodically evaluated with excess and obsolete inventory recorded as a reduction to inventory and an expense.
Note 7F: Other non-financial assets
2015 2014 2015 2014$m $m $m $m
Total biological assets 44 36 44 36Total assets held for sale 129 95 129 143Prepayments 4,516 2,985 4,620 3,058Other 207 194 269 286Total other non-financial assets 4,896 3,310 5,062 3,523
General Government Australian Government
Note 7G: Assets by function(a)
2015 2014 (c) 2015 2014 (c)$m $m $m $m
General public services 184,383 166,115 184,086 165,773Defence 79,883 75,996 80,269 76,314Public order and safety 2,915 2,579 2,944 2,595Education 33,240 28,872 33,240 28,872Health 1,261 5,495 1,244 3,596Social security and welfare 8,317 7,547 7,979 7,189Housing and community amenities 8,435 8,153 8,389 8,139Recreation and culture 12,428 13,416 12,428 13,416Fuel and energy 1,538 877 1,538 877Agriculture, forestry and fishing 910 451 908 451Mining, manufacturing and construction 525 296 2,384 1,856Transport and communication 15,613 12,601 23,787 19,877Other economic affairs 31,736 24,576 155,792 140,530Other purposes(b) 48,067 43,234 17,349 19,545Total assets 429,251 390,208 532,337 489,030
General Government Australian Government
(a) Refer to Note 4F for a description of each function. (b) Cash and deposits that are not allocated to other functions are included in the ‘Other purposes’ function. (c) The 2013-14 comparatives have been updated for consistency with the 2014-15 functional classification.
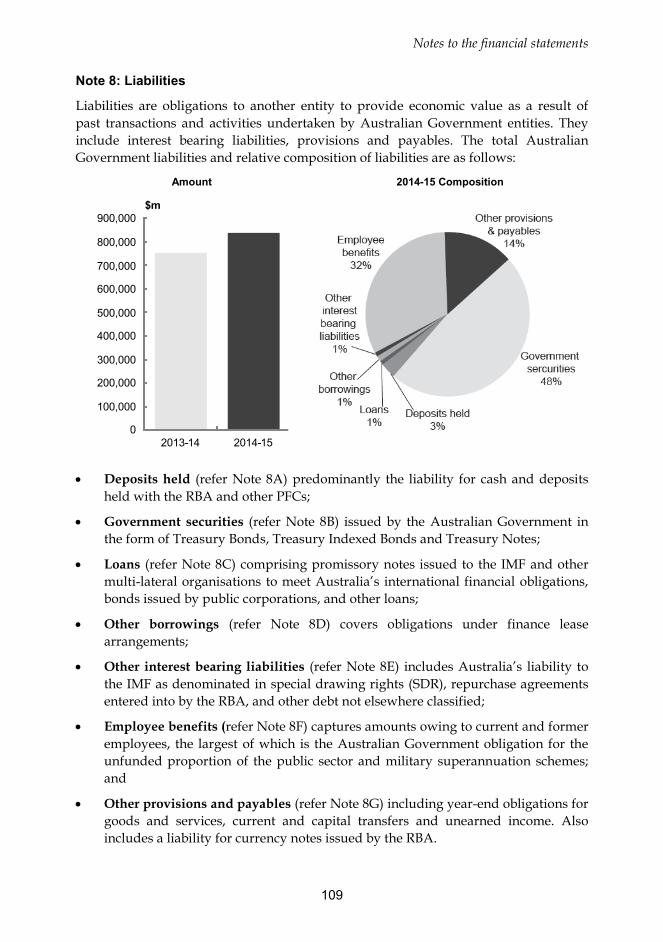
Notes to the financial statements
109
Note 8: Liabilities
Liabilities are obligations to another entity to provide economic value as a result of past transactions and activities undertaken by Australian Government entities. They include interest bearing liabilities, provisions and payables. The total Australian Government liabilities and relative composition of liabilities are as follows:
Amount 2014-15 Composition
0
100,000
200,000
300,000
400,000
500,000
600,000
700,000
800,000
900,000
2013-14 2014-15
$m
• Deposits held (refer Note 8A) predominantly the liability for cash and deposits
held with the RBA and other PFCs;
• Government securities (refer Note 8B) issued by the Australian Government in the form of Treasury Bonds, Treasury Indexed Bonds and Treasury Notes;
• Loans (refer Note 8C) comprising promissory notes issued to the IMF and other multi-lateral organisations to meet Australia’s international financial obligations, bonds issued by public corporations, and other loans;
• Other borrowings (refer Note 8D) covers obligations under finance lease arrangements;
• Other interest bearing liabilities (refer Note 8E) includes Australia’s liability to the IMF as denominated in special drawing rights (SDR), repurchase agreements entered into by the RBA, and other debt not elsewhere classified;
• Employee benefits (refer Note 8F) captures amounts owing to current and former employees, the largest of which is the Australian Government obligation for the unfunded proportion of the public sector and military superannuation schemes; and
• Other provisions and payables (refer Note 8G) including year-end obligations for goods and services, current and capital transfers and unearned income. Also includes a liability for currency notes issued by the RBA.
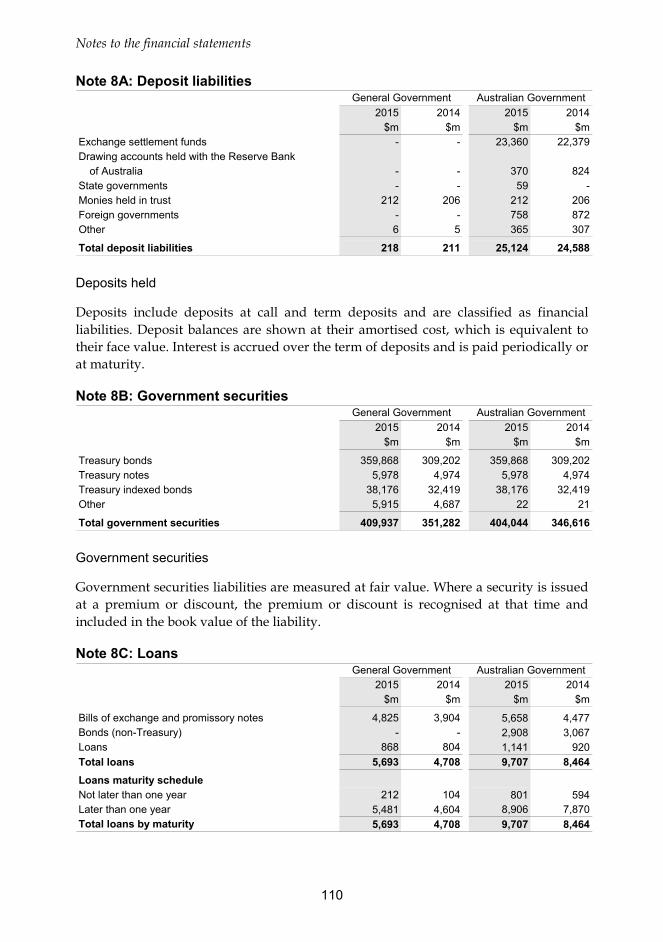
Notes to the financial statements
110
Note 8A: Deposit liabilities
2015 2014 2015 2014$m $m $m $m
Exchange settlement funds - - 23,360 22,379Drawing accounts held with the Reserve Bank
of Australia - - 370 824State governments - - 59 -Monies held in trust 212 206 212 206Foreign governments - - 758 872Other 6 5 365 307
Total deposit liabilities 218 211 25,124 24,588
General Government Australian Government
Deposits held
Deposits include deposits at call and term deposits and are classified as financial liabilities. Deposit balances are shown at their amortised cost, which is equivalent to their face value. Interest is accrued over the term of deposits and is paid periodically or at maturity.
Note 8B: Government securities
2015 2014 2015 2014$m $m $m $m
Treasury bonds 359,868 309,202 359,868 309,202Treasury notes 5,978 4,974 5,978 4,974Treasury indexed bonds 38,176 32,419 38,176 32,419Other 5,915 4,687 22 21
Total government securities 409,937 351,282 404,044 346,616
General Government Australian Government
Government securities
Government securities liabilities are measured at fair value. Where a security is issued at a premium or discount, the premium or discount is recognised at that time and included in the book value of the liability.
Note 8C: Loans
2015 2014 2015 2014$m $m $m $m
Bills of exchange and promissory notes 4,825 3,904 5,658 4,477Bonds (non-Treasury) - - 2,908 3,067Loans 868 804 1,141 920Total loans 5,693 4,708 9,707 8,464Loans maturity scheduleNot later than one year 212 104 801 594Later than one year 5,481 4,604 8,906 7,870Total loans by maturity 5,693 4,708 9,707 8,464
General Government Australian Government
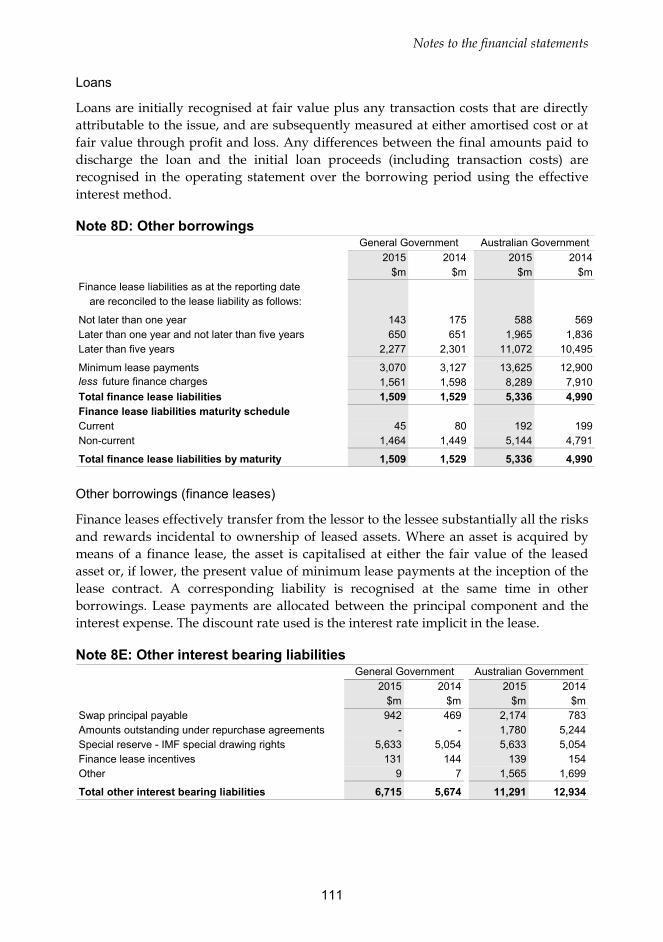
Notes to the financial statements
111
Loans
Loans are initially recognised at fair value plus any transaction costs that are directly attributable to the issue, and are subsequently measured at either amortised cost or at fair value through profit and loss. Any differences between the final amounts paid to discharge the loan and the initial loan proceeds (including transaction costs) are recognised in the operating statement over the borrowing period using the effective interest method.
Note 8D: Other borrowings
2015 2014 2015 2014$m $m $m $m
Finance lease liabilities as at the reporting dateare reconciled to the lease liability as follows:
Not later than one year 143 175 588 569Later than one year and not later than five years 650 651 1,965 1,836Later than five years 2,277 2,301 11,072 10,495
Minimum lease payments 3,070 3,127 13,625 12,900less future finance charges 1,561 1,598 8,289 7,910Total finance lease liabilities 1,509 1,529 5,336 4,990Finance lease liabilities maturity scheduleCurrent 45 80 192 199Non-current 1,464 1,449 5,144 4,791
Total finance lease liabilities by maturity 1,509 1,529 5,336 4,990
General Government Australian Government
Other borrowings (finance leases)
Finance leases effectively transfer from the lessor to the lessee substantially all the risks and rewards incidental to ownership of leased assets. Where an asset is acquired by means of a finance lease, the asset is capitalised at either the fair value of the leased asset or, if lower, the present value of minimum lease payments at the inception of the lease contract. A corresponding liability is recognised at the same time in other borrowings. Lease payments are allocated between the principal component and the interest expense. The discount rate used is the interest rate implicit in the lease.
Note 8E: Other interest bearing liabilities
2015 2014 2015 2014$m $m $m $m
Swap principal payable 942 469 2,174 783Amounts outstanding under repurchase agreements - - 1,780 5,244Special reserve - IMF special drawing rights 5,633 5,054 5,633 5,054Finance lease incentives 131 144 139 154Other 9 7 1,565 1,699
Total other interest bearing liabilities 6,715 5,674 11,291 12,934
General Government Australian Government
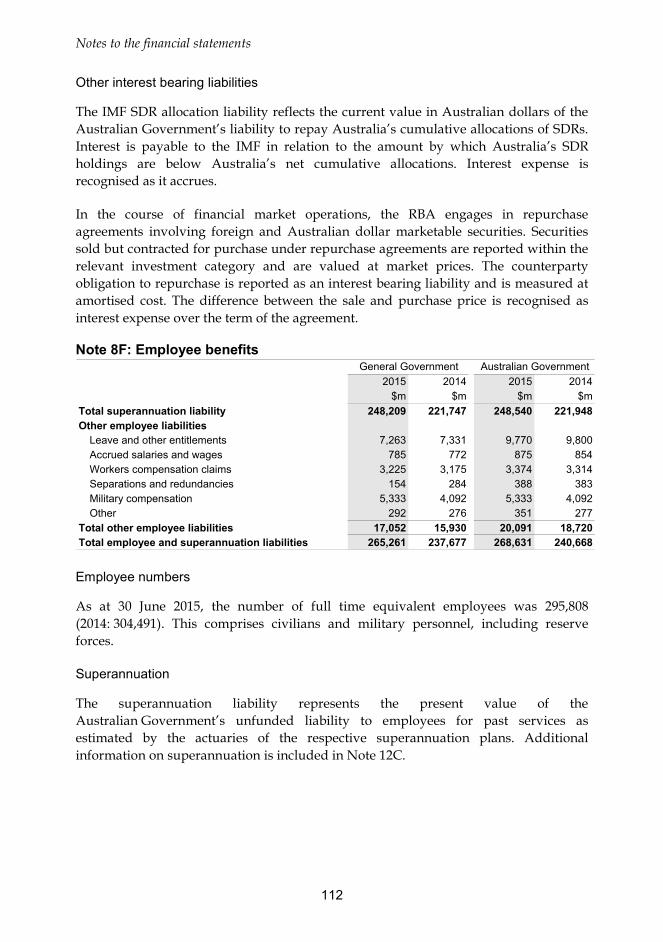
Notes to the financial statements
112
Other interest bearing liabilities
The IMF SDR allocation liability reflects the current value in Australian dollars of the Australian Government’s liability to repay Australia’s cumulative allocations of SDRs. Interest is payable to the IMF in relation to the amount by which Australia’s SDR holdings are below Australia’s net cumulative allocations. Interest expense is recognised as it accrues.
In the course of financial market operations, the RBA engages in repurchase agreements involving foreign and Australian dollar marketable securities. Securities sold but contracted for purchase under repurchase agreements are reported within the relevant investment category and are valued at market prices. The counterparty obligation to repurchase is reported as an interest bearing liability and is measured at amortised cost. The difference between the sale and purchase price is recognised as interest expense over the term of the agreement.
Note 8F: Employee benefits
2015 2014 2015 2014$m $m $m $m
Total superannuation liability 248,209 221,747 248,540 221,948Other employee liabilities
Leave and other entitlements 7,263 7,331 9,770 9,800Accrued salaries and wages 785 772 875 854Workers compensation claims 3,225 3,175 3,374 3,314Separations and redundancies 154 284 388 383Military compensation 5,333 4,092 5,333 4,092Other 292 276 351 277
Total other employee liabilities 17,052 15,930 20,091 18,720Total employee and superannuation liabilities 265,261 237,677 268,631 240,668
General Government Australian Government
Employee numbers
As at 30 June 2015, the number of full time equivalent employees was 295,808 (2014: 304,491). This comprises civilians and military personnel, including reserve forces.
Superannuation
The superannuation liability represents the present value of the Australian Government’s unfunded liability to employees for past services as estimated by the actuaries of the respective superannuation plans. Additional information on superannuation is included in Note 12C.
Notes to the financial statements
113
Other employee liabilities
Liabilities for ‘short-term employee benefits’ (as defined in AASB 119 Employee Benefits) and termination benefits due within 12 months of balance date are measured at their nominal amounts. The nominal amount is calculated with regard to the rates expected to be paid on settlement of the liability. The liability for leave and other entitlements includes provision for annual leave and long service leave.
Liabilities for services rendered by employees are recognised at the reporting date to the extent that they have not been settled. All other employee benefit liabilities are measured at the present value of the estimated future cash outflows to be made in respect of services provided by employees up to the reporting date.
The liability for long service leave is calculated using expected future increases in wages and salary rates including related on-costs and is discounted using applicable government bond rates. In determining the present value of the liability, attrition rates, pay increases through promotion and inflation are taken into account. The liability for long service leave has been determined by reference to the work of actuaries.
Workers’ compensation claims
The provision represents an estimate of the present value of future payments in respect of claims for events occurring before 30 June 2015 with a 75 per cent probability of sufficiency. The expected future payments are discounted to present value using a risk free rate. The expected future payments include claims reported but not yet paid, claims incurred but not yet reported, and anticipated claims handling costs.
Military compensation
The military compensation provision represents an estimate of the present value of future payments in respect of claims under the Military Rehabilitation and Compensation Act 2004 and the Safety, Rehabilitation and Compensation Act 1988 arising from service rendered before 30 June 2015. The provision is calculated by discounting future payments using a yield curve derived from the yields on Commonwealth bonds of various durations as at 30 June 2015.
The military compensation provision is subject to inherent sources of uncertainty arising from a range of factors, including that claims may not be received until many years after the event and subsequent payments for income support, health and rehabilitation services can extend over a long period of time. The Annual Report for the Department of Veterans’ Affairs details the assumptions and areas of uncertainty underpinning the actuarial estimation of the military provision.
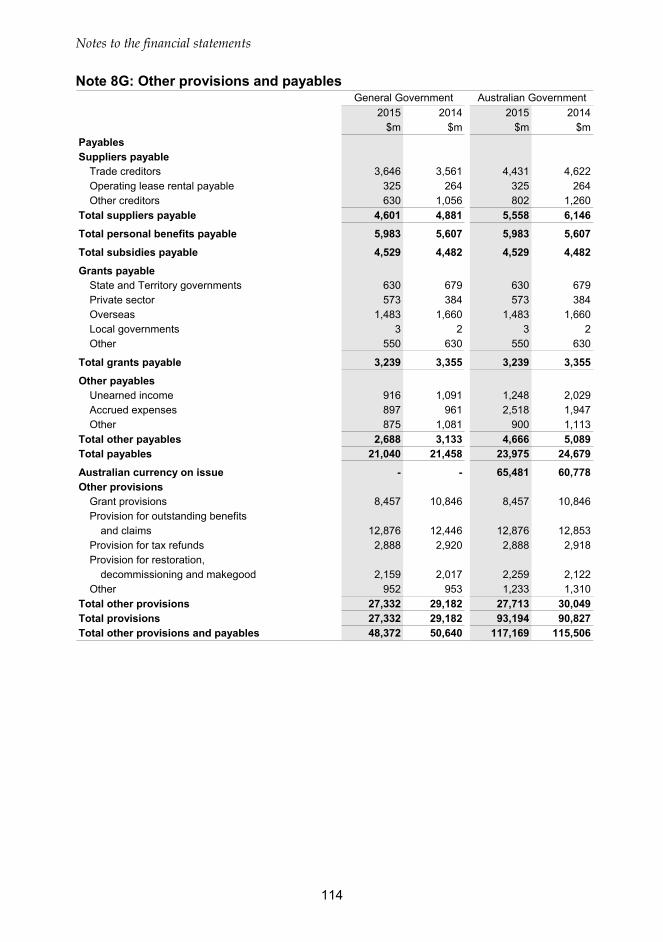
Notes to the financial statements
114
Note 8G: Other provisions and payables
2015 2014 2015 2014$m $m $m $m
PayablesSuppliers payable
Trade creditors 3,646 3,561 4,431 4,622Operating lease rental payable 325 264 325 264Other creditors 630 1,056 802 1,260
Total suppliers payable 4,601 4,881 5,558 6,146
Total personal benefits payable 5,983 5,607 5,983 5,607
Total subsidies payable 4,529 4,482 4,529 4,482
Grants payableState and Territory governments 630 679 630 679Private sector 573 384 573 384Overseas 1,483 1,660 1,483 1,660Local governments 3 2 3 2Other 550 630 550 630
Total grants payable 3,239 3,355 3,239 3,355
Other payablesUnearned income 916 1,091 1,248 2,029Accrued expenses 897 961 2,518 1,947Other 875 1,081 900 1,113
Total other payables 2,688 3,133 4,666 5,089Total payables 21,040 21,458 23,975 24,679
Australian currency on issue - - 65,481 60,778Other provisions
Grant provisions 8,457 10,846 8,457 10,846Provision for outstanding benefits
and claims 12,876 12,446 12,876 12,853Provision for tax refunds 2,888 2,920 2,888 2,918Provision for restoration,
decommissioning and makegood 2,159 2,017 2,259 2,122Other 952 953 1,233 1,310
Total other provisions 27,332 29,182 27,713 30,049Total provisions 27,332 29,182 93,194 90,827Total other provisions and payables 48,372 50,640 117,169 115,506
General Government Australian Government

Notes to the financial statements
115
A: Reconciliation of movement in provisions
2015 2014 2015 2014$m $m $m $m
Movement table:Balance of provisions at 1 July 29,182 32,222 90,827 90,025Provisions made during the year 8,458 19,704 13,166 28,064Provisions used during the year (9,188) (14,569) (9,764) (19,131)Provisions remeasured, reversed or
unwound during the year (1,120) (8,175) (1,035) (8,131)Balance of provisions at 30 June 27,332 29,182 93,194 90,827
General Government Australian Government
Other provisions and payables Payables
Trade and other payables, including accruals, are recorded when Australian Government entities are required to make future payments as a result of a purchase of assets or services. Payables are initially recognised at fair value and are subsequently measured at amortised cost.
Provisions
Non-employee provisions are recognised at the best estimate of the expenditure required to settle the present obligation at the reporting date. If the effect is material, provisions are determined by discounting the expected future cash flows (adjusted for expected future risks) required to settle the obligation at a rate that reflects current market assessments of the time value of money and the risks specific to the liability.
The calculation of provisions is subject to the volatility of economic assumptions used, in particular, the discount rate and the effects of inflation as well as the impact of variations in payment patterns. In calculating the estimated cost of future payments for each provision, actuarial advice is generally obtained. Given the uniqueness of a number of the Australian Government provisions and the use of actuarial assumptions, there can be an element of uncertainty in the estimate.
Australian currency on issue
Australian currency issued represents a liability of the RBA in favour of the holder. Currency issued for circulation, including demonetised currency, is measured at face value. When the RBA issues currency notes to the commercial banks it receives, in exchange, funds equal to the full face value of the notes issued.
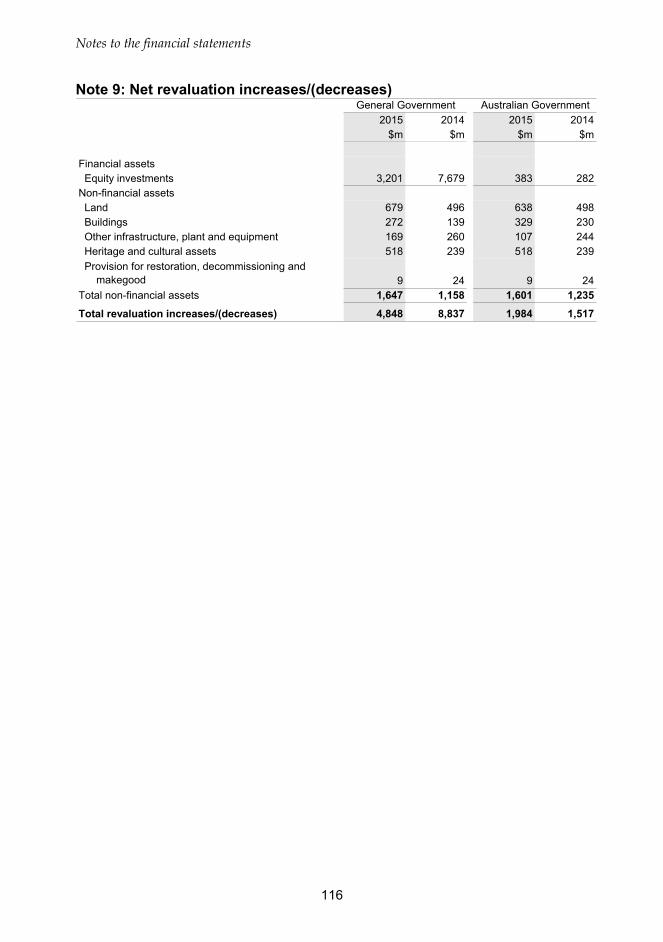
Notes to the financial statements
116
Note 9: Net revaluation increases/(decreases)
2015 2014 2015 2014$m $m $m $m
Financial assets Equity investments 3,201 7,679 383 282Non-financial assets Land 679 496 638 498 Buildings 272 139 329 230 Other infrastructure, plant and equipment 169 260 107 244 Heritage and cultural assets 518 239 518 239 Provision for restoration, decommissioning and makegood 9 24 9 24Total non-financial assets 1,647 1,158 1,601 1,235
Total revaluation increases/(decreases) 4,848 8,837 1,984 1,517
General Government Australian Government
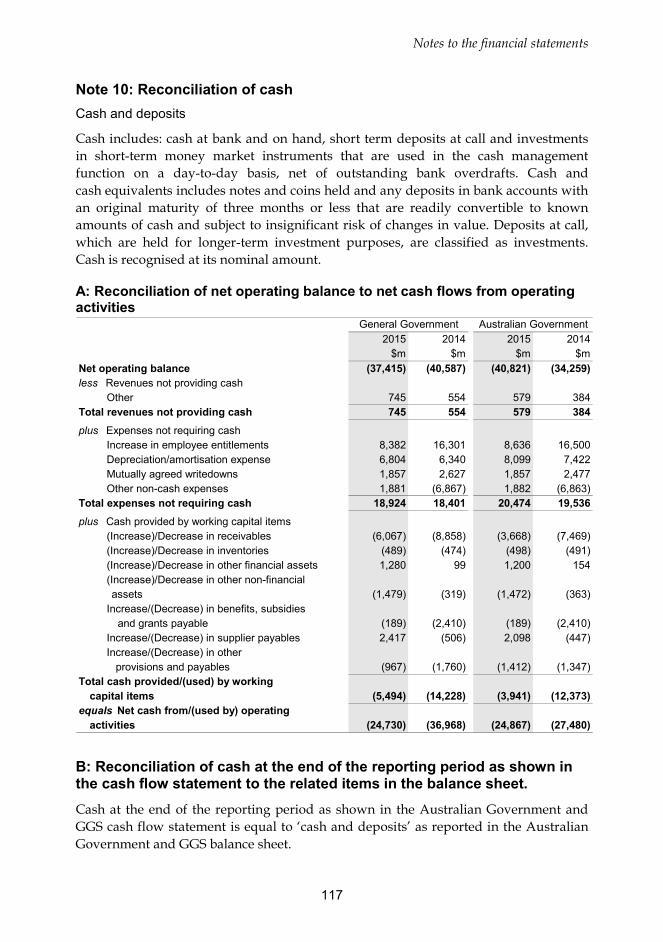
Notes to the financial statements
117
Note 10: Reconciliation of cash Cash and deposits
Cash includes: cash at bank and on hand, short term deposits at call and investments in short-term money market instruments that are used in the cash management function on a day-to-day basis, net of outstanding bank overdrafts. Cash and cash equivalents includes notes and coins held and any deposits in bank accounts with an original maturity of three months or less that are readily convertible to known amounts of cash and subject to insignificant risk of changes in value. Deposits at call, which are held for longer-term investment purposes, are classified as investments. Cash is recognised at its nominal amount.
A: Reconciliation of net operating balance to net cash flows from operating activities
2015 2014 2015 2014$m $m $m $m
Net operating balance (37,415) (40,587) (40,821) (34,259)less Revenues not providing cash
Other 745 554 579 384Total revenues not providing cash 745 554 579 384plus Expenses not requiring cash
Increase in employee entitlements 8,382 16,301 8,636 16,500 Depreciation/amortisation expense 6,804 6,340 8,099 7,422 Mutually agreed writedowns 1,857 2,627 1,857 2,477 Other non-cash expenses 1,881 (6,867) 1,882 (6,863)
Total expenses not requiring cash 18,924 18,401 20,474 19,536plus Cash provided by working capital items
(Increase)/Decrease in receivables (6,067) (8,858) (3,668) (7,469) (Increase)/Decrease in inventories (489) (474) (498) (491) (Increase)/Decrease in other financial assets 1,280 99 1,200 154 (Increase)/Decrease in other non-financial
assets (1,479) (319) (1,472) (363) Increase/(Decrease) in benefits, subsidies
and grants payable (189) (2,410) (189) (2,410) Increase/(Decrease) in supplier payables 2,417 (506) 2,098 (447) Increase/(Decrease) in other provisions and payables (967) (1,760) (1,412) (1,347)
Total cash provided/(used) by workingcapital items (5,494) (14,228) (3,941) (12,373)
equals Net cash from/(used by) operatingactivities (24,730) (36,968) (24,867) (27,480)
General Government Australian Government
B: Reconciliation of cash at the end of the reporting period as shown in the cash flow statement to the related items in the balance sheet. Cash at the end of the reporting period as shown in the Australian Government and GGS cash flow statement is equal to ‘cash and deposits’ as reported in the Australian Government and GGS balance sheet.
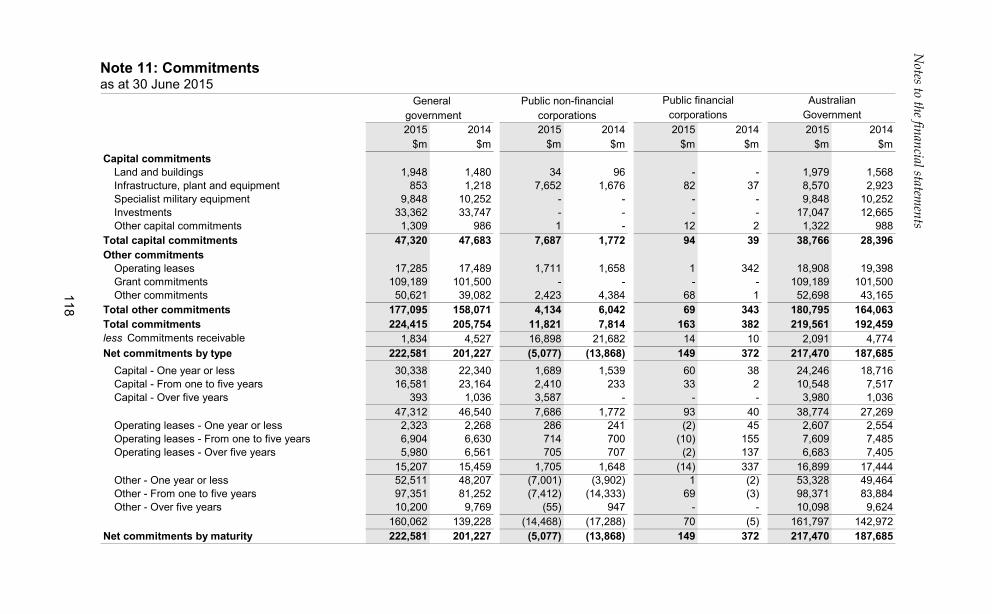
Notes to the financial statem
ents
118
Note 11: Commitments as at 30 June 2015
General Public non-financialgovernment corporations2015 2014 2015 2014 2015 2014 2015 2014
$m $m $m $m $m $m $m $mCapital commitments
Land and buildings 1,948 1,480 34 96 - - 1,979 1,568Infrastructure, plant and equipment 853 1,218 7,652 1,676 82 37 8,570 2,923Specialist military equipment 9,848 10,252 - - - - 9,848 10,252Investments 33,362 33,747 - - - - 17,047 12,665Other capital commitments 1,309 986 1 - 12 2 1,322 988
Total capital commitments 47,320 47,683 7,687 1,772 94 39 38,766 28,396Other commitments
Operating leases 17,285 17,489 1,711 1,658 1 342 18,908 19,398Grant commitments 109,189 101,500 - - - - 109,189 101,500Other commitments 50,621 39,082 2,423 4,384 68 1 52,698 43,165
Total other commitments 177,095 158,071 4,134 6,042 69 343 180,795 164,063Total commitments 224,415 205,754 11,821 7,814 163 382 219,561 192,459less Commitments receivable 1,834 4,527 16,898 21,682 14 10 2,091 4,774Net commitments by type 222,581 201,227 (5,077) (13,868) 149 372 217,470 187,685
Capital - One year or less 30,338 22,340 1,689 1,539 60 38 24,246 18,716Capital - From one to five years 16,581 23,164 2,410 233 33 2 10,548 7,517Capital - Over five years 393 1,036 3,587 - - - 3,980 1,036
47,312 46,540 7,686 1,772 93 40 38,774 27,269Operating leases - One year or less 2,323 2,268 286 241 (2) 45 2,607 2,554Operating leases - From one to five years 6,904 6,630 714 700 (10) 155 7,609 7,485Operating leases - Over five years 5,980 6,561 705 707 (2) 137 6,683 7,405
15,207 15,459 1,705 1,648 (14) 337 16,899 17,444Other - One year or less 52,511 48,207 (7,001) (3,902) 1 (2) 53,328 49,464Other - From one to five years 97,351 81,252 (7,412) (14,333) 69 (3) 98,371 83,884Other - Over five years 10,200 9,769 (55) 947 - - 10,098 9,624
160,062 139,228 (14,468) (17,288) 70 (5) 161,797 142,972Net commitments by maturity 222,581 201,227 (5,077) (13,868) 149 372 217,470 187,685
Public financialcorporations
AustralianGovernment
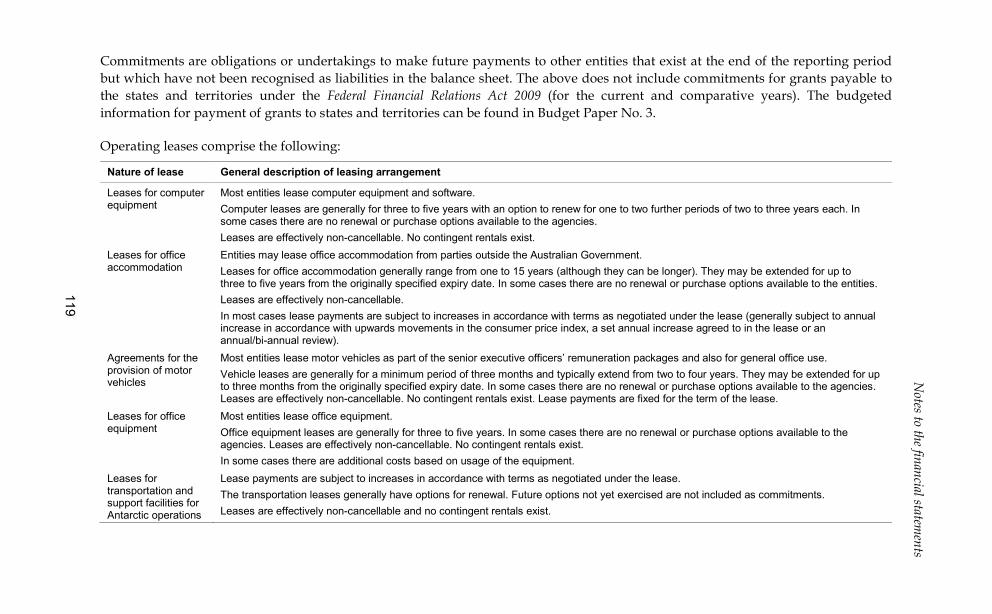
Notes to the financial statem
ents
119
Commitments are obligations or undertakings to make future payments to other entities that exist at the end of the reporting period but which have not been recognised as liabilities in the balance sheet. The above does not include commitments for grants payable to the states and territories under the Federal Financial Relations Act 2009 (for the current and comparative years). The budgeted information for payment of grants to states and territories can be found in Budget Paper No. 3.
Operating leases comprise the following:
Nature of lease General description of leasing arrangement
Leases for computer equipment
Most entities lease computer equipment and software. Computer leases are generally for three to five years with an option to renew for one to two further periods of two to three years each. In some cases there are no renewal or purchase options available to the agencies. Leases are effectively non-cancellable. No contingent rentals exist.
Leases for office accommodation
Entities may lease office accommodation from parties outside the Australian Government. Leases for office accommodation generally range from one to 15 years (although they can be longer). They may be extended for up to three to five years from the originally specified expiry date. In some cases there are no renewal or purchase options available to the entities. Leases are effectively non-cancellable. In most cases lease payments are subject to increases in accordance with terms as negotiated under the lease (generally subject to annual increase in accordance with upwards movements in the consumer price index, a set annual increase agreed to in the lease or an annual/bi-annual review).
Agreements for the provision of motor vehicles
Most entities lease motor vehicles as part of the senior executive officers’ remuneration packages and also for general office use. Vehicle leases are generally for a minimum period of three months and typically extend from two to four years. They may be extended for up to three months from the originally specified expiry date. In some cases there are no renewal or purchase options available to the agencies. Leases are effectively non-cancellable. No contingent rentals exist. Lease payments are fixed for the term of the lease.
Leases for office equipment
Most entities lease office equipment. Office equipment leases are generally for three to five years. In some cases there are no renewal or purchase options available to the agencies. Leases are effectively non-cancellable. No contingent rentals exist. In some cases there are additional costs based on usage of the equipment.
Leases for transportation and support facilities for Antarctic operations
Lease payments are subject to increases in accordance with terms as negotiated under the lease. The transportation leases generally have options for renewal. Future options not yet exercised are not included as commitments. Leases are effectively non-cancellable and no contingent rentals exist.
Notes to the financial statements
120
Note 12: Risks The assets and liabilities in the 2014-15 CFS incorporate assumptions and judgements based on the best information available at the date of signing. The judgements and estimates made by Australian Government entities that have the most significant impact on the amounts recorded in the financial statements are disclosed in Note 1. In addition to these, there are a range of factors that may influence the amounts ultimately realised or settled in future years that relate to past events. The disclosure of these factors increases the transparency of the risks to the Government’s financial position. These risks have been grouped into the following disclosures:
• Contingencies (refer Note 12A) comprising possible obligations or assets arising from past events and whose existence will be confirmed only by the occurrence or non-occurrence of one or more uncertain future events. The Australian Government has issued a number of guarantees, such as those relating to guarantee schemes for the banking and financial sector, while other significant contingent liabilities relate to uncalled capital subscriptions and credit facilities to international financial institutions and legal cases concerning the Australian Government. The Government has robust and conservative strategies in place to reduce its potential exposure to these contingent liabilities.
• Financial Instrument disclosures (refer Note 12B) concerning the contractual arrangements that the Australian Government has entered into for policy, liquidity or financing purposes. To varying degrees, Australian Government entities are exposed to the following risks arising from financial instruments: – Market risk – Credit risk; and – Liquidity risk.
• Defined benefit superannuation plans (refer Note 12C) comprise the Government’s largest liability after public debt. Under these schemes, the Australian Government’s obligation is to provide the agreed benefits to current and former employees, for which it bears actuarial risk (the risk that benefits will cost more than expected). Given the significance of these obligations, Note 12C explains the characteristics of the major defined benefit plans and risks associated with them, and describes how the plans may affect the amount, timing and uncertainty of the Australian Government’s future cash flows. The Future Fund is a long-term investment fund that is designed to enhance the ability of the Australian Government to discharge unfunded superannuation liabilities expected after 2020, when an ageing population is likely to place significant pressures on the Government’s finances.
Consistent with the amounts recognised in the financial statements, the disclosures are based on the policies, events and arrangements up to the reporting date and do not include policy decisions announced in the 2015-16 Budget Papers which have not yet been enacted or implemented.
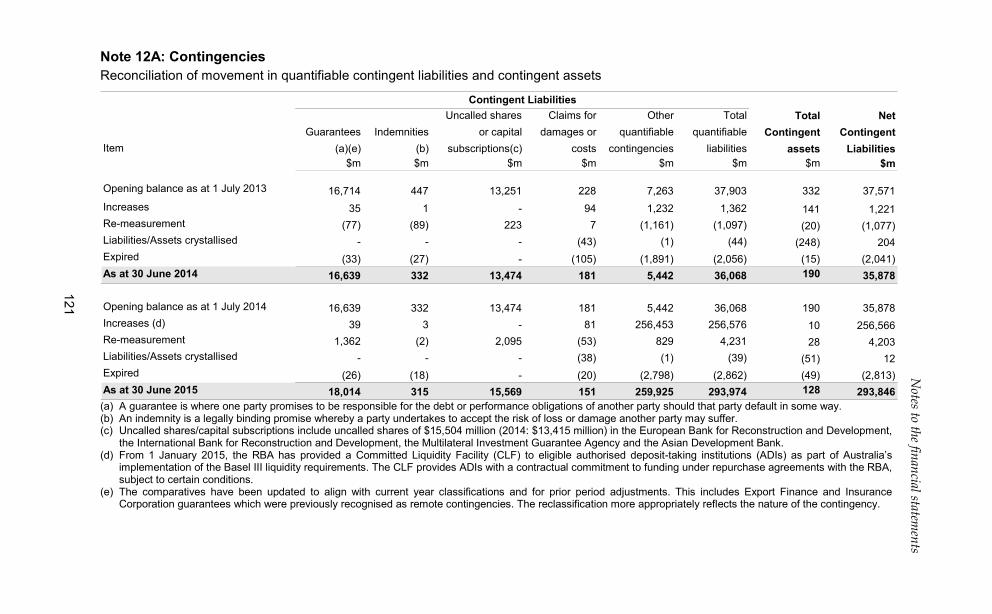
Notes to the financial statem
ents
121
Note 12A: Contingencies Reconciliation of movement in quantifiable contingent liabilities and contingent assets
Uncalled shares Claims for Other Total Total NetGuarantees Indemnities or capital damages or quantifiable quantifiable Contingent Contingent
Item (a)(e) (b) subscriptions(c) costs contingencies liabilities assets Liabilities$m $m $m $m $m $m $m $m
Opening balance as at 1 July 2013 16,714 447 13,251 228 7,263 37,903 332 37,571Increases 35 1 - 94 1,232 1,362 141 1,221Re-measurement (77) (89) 223 7 (1,161) (1,097) (20) (1,077)Liabilities/Assets crystallised - - - (43) (1) (44) (248) 204Expired (33) (27) - (105) (1,891) (2,056) (15) (2,041)As at 30 June 2014 16,639 332 13,474 181 5,442 36,068 190 35,878
Opening balance as at 1 July 2014 16,639 332 13,474 181 5,442 36,068 190 35,878Increases (d) 39 3 - 81 256,453 256,576 10 256,566Re-measurement 1,362 (2) 2,095 (53) 829 4,231 28 4,203Liabilities/Assets crystallised - - - (38) (1) (39) (51) 12Expired (26) (18) - (20) (2,798) (2,862) (49) (2,813)As at 30 June 2015 18,014 315 15,569 151 259,925 293,974 128 293,846
Contingent Liabilities
(a) A guarantee is where one party promises to be responsible for the debt or performance obligations of another party should that party default in some way. (b) An indemnity is a legally binding promise whereby a party undertakes to accept the risk of loss or damage another party may suffer. (c) Uncalled shares/capital subscriptions include uncalled shares of $15,504 million (2014: $13,415 million) in the European Bank for Reconstruction and Development,
the International Bank for Reconstruction and Development, the Multilateral Investment Guarantee Agency and the Asian Development Bank. (d) From 1 January 2015, the RBA has provided a Committed Liquidity Facility (CLF) to eligible authorised deposit-taking institutions (ADIs) as part of Australia’s
implementation of the Basel III liquidity requirements. The CLF provides ADIs with a contractual commitment to funding under repurchase agreements with the RBA, subject to certain conditions.
(e) The comparatives have been updated to align with current year classifications and for prior period adjustments. This includes Export Finance and Insurance Corporation guarantees which were previously recognised as remote contingencies. The reclassification more appropriately reflects the nature of the contingency.
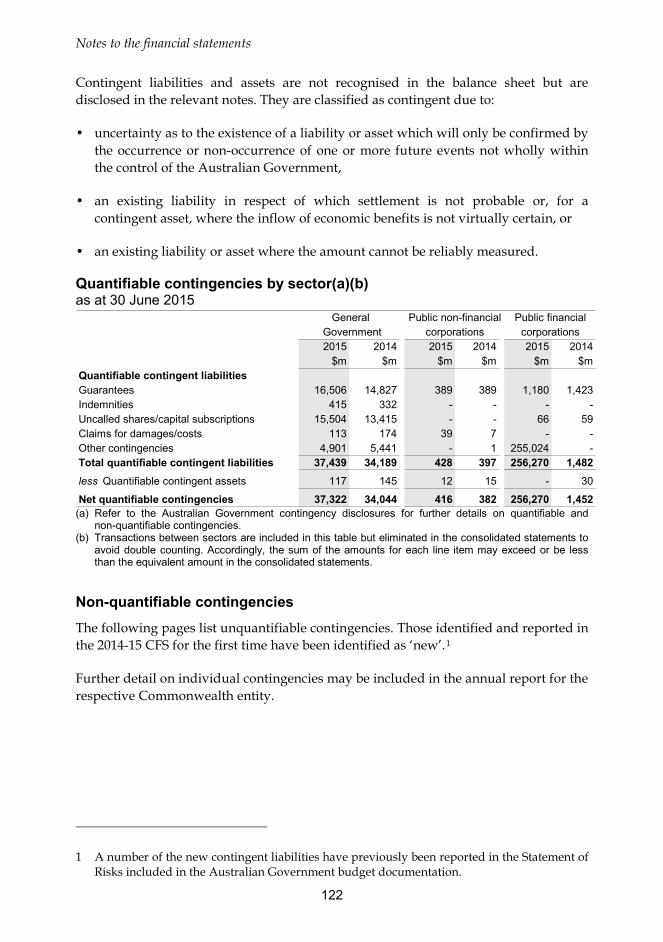
Notes to the financial statements
122
Contingent liabilities and assets are not recognised in the balance sheet but are disclosed in the relevant notes. They are classified as contingent due to:
• uncertainty as to the existence of a liability or asset which will only be confirmed by the occurrence or non-occurrence of one or more future events not wholly within the control of the Australian Government,
• an existing liability in respect of which settlement is not probable or, for a contingent asset, where the inflow of economic benefits is not virtually certain, or
• an existing liability or asset where the amount cannot be reliably measured.
Quantifiable contingencies by sector(a)(b)
as at 30 June 2015 General Public non-financial Public financial
Government corporations corporations2015 2014 2015 2014 2015 2014
$m $m $m $m $m $mQuantifiable contingent liabilitiesGuarantees 16,506 14,827 389 389 1,180 1,423Indemnities 415 332 - - - -Uncalled shares/capital subscriptions 15,504 13,415 - - 66 59Claims for damages/costs 113 174 39 7 - -Other contingencies 4,901 5,441 - 1 255,024 -Total quantifiable contingent liabilities 37,439 34,189 428 397 256,270 1,482less Quantifiable contingent assets 117 145 12 15 - 30
Net quantifiable contingencies 37,322 34,044 416 382 256,270 1,452 (a) Refer to the Australian Government contingency disclosures for further details on quantifiable and
non-quantifiable contingencies. (b) Transactions between sectors are included in this table but eliminated in the consolidated statements to
avoid double counting. Accordingly, the sum of the amounts for each line item may exceed or be less than the equivalent amount in the consolidated statements.
Non-quantifiable contingencies The following pages list unquantifiable contingencies. Those identified and reported in the 2014-15 CFS for the first time have been identified as ‘new’.1
Further detail on individual contingencies may be included in the annual report for the respective Commonwealth entity.
1 A number of the new contingent liabilities have previously been reported in the Statement of Risks included in the Australian Government budget documentation.
Notes to the financial statements
123
Guarantees, indemnities and undertakings
A range of guarantees, indemnities and undertakings have been provided by Australian Government entities in relation to various agreements, deeds and other matters and some of these guarantees, indemnities and undertakings are unlimited. Guarantees, indemnities and undertakings include, but are not limited to:
• Emergency pest and disease response arrangements (administered by the Department of Agriculture). The Australian Government is typically liable for 50 per cent of total government funding to respond to a disease or pest outbreak. The Australian Government may be expected to contribute bilaterally in situations where an incursion is not covered by a cost sharing agreement or where the relevant industry body is not party to an agreement. The Australian Government may also provide financial assistance to an industry party by funding its initial share of the response. These contributions may subsequently be recovered from the industry over a period of up to ten years, usually by a levy;
• Native title agreements — access to geospatial data (administered by the Attorney-General’s Department) whereby indemnities have been provided against third-party claims arising from errors in the data. Under the Native Title Act 1993, the Australian Government will be liable for any compensation found to be payable in respect of compensable acts for which the Commonwealth is responsible;
• Australian Victims of Terrorism Overseas Payment (administered by the Attorney-General’s Department). The Australian Government manages a scheme for providing financial assistance to Australians who are victims of an overseas terrorist act that has been declared by the Prime Minister. Under the scheme, Australians harmed (primary victims) and Australians who are close family members of a person who dies as a direct result of a declared terrorist act (secondary victims) will be able to claim payments of up to $75,000. As acts of terrorism are unpredictable, the cost of the scheme is unquantifiable.
• Additionally the Terrorism Insurance Scheme is managed by the Australian Reinsurance Pool Corporation (ARPC) for replacement terrorism insurance covering damage to commercial property including associated business interruption and public liability under the Terrorism Insurance Act 2003. The Australian Government guarantees to pay any liabilities of the ARPC, but the Treasurer must declare a reduced payout rate to insured parties if the Australian Government’s liability would otherwise exceed $10 billion. A declared terrorist incident was announced by the Treasurer on 15 January 2015 relating to the incident at the Lindt Café in Martin Place on 15 and 16 December 2014. Claims have been submitted by affected reinsurers, however, the quantum of claims have not exceeded their individual retentions;
Notes to the financial statements
124
• Australian Red Cross Society — blood and blood products (administered by the Department of Health). The Australian Government, states and territories jointly provide indemnity for the Australian Red Cross Blood Service regarding personal injury and loss or damages suffered by a recipient of certain blood and blood products where other available mitigation or cover is not available;
• CSL Ltd (administered by the Department of Health). The Australian Government has indemnified CSL Ltd for a specific range of events that occurred during the Plasma Fractionation Agreement from 1 January 1994 to 31 December 2004, where alternative cover was not arranged by CSL Ltd. Indemnities relate to certain existing and potential claims made for personal injury, loss or damage suffered through therapeutic and diagnostic use of certain products manufactured by CSL Ltd;
• Vaccines (administered by the Department of Health). Indemnities have been provided to the manufacturers of smallpox and influenza vaccines held by the Australian Government, covering possible adverse events that could result from the use of the vaccines in an emergency situation;
• The Australian Medical Association Ltd (AMA) (administered by the Department of Health). The AMA, the Commonwealth, Australian Private Hospitals Association Ltd, Australian Health Insurance Association and Beyond Blue Ltd have agreed to indemnify each other in respect of any loss, liability, cost, claim or expense due to misuse of confidential information or breach of the Privacy Act 1988 in relation to participation in and support of the Private Mental Health Alliance;
• New South Wales Health Administration Council (NSW HAC) (administered by the National Health Funding Body (NHFB)). An indemnity has been provided to the New South Wales Government through the NSW HAC, in relation to a state funding pool account with the RBA. The indemnity includes liabilities or claims arising from acts or omissions of NHFB staff as users of pool account information, liabilities or claims arising from unauthorised access to the banking services or system from NHFB premises. NSW HAC has provided a reciprocal indemnity for the actions of staff of the NHFB to the RBA;
• Medical Indemnity (administered by the Department of Health). The Incurred But Not Reported Scheme is designed to fund the incurred but not reported liabilities of Medical Defence Organisations where they do not have adequate reserves to cover their liabilities. Eligibility for claim payments under this scheme is dependent on whether the Medical Indemnity Insurer is deemed to be a participating Medical Defence Organisation under the Medical Indemnity Act 2002 and the Midwife Professional Indemnity (Commonwealth Contribution) Scheme Act 2010;
• Medical Indemnity Exceptional Claims Scheme (MIECS) (administered by the Department of Health). The MIECS assumes liability for 100 per cent of any damages payable against a doctor that exceeds a specified level of cover provided by that doctor’s medical indemnity insurer (currently $20 million);
Notes to the financial statements
125
• Asian Football Confederation Cup (new) (administered by the Department of Health). The Australian Government has agreed to pay a percentage of any amount payable by a state beyond an agreed threshold for hosting the Asian Football Confederation Cup 2015, given by that state under or in connection with the Competition Agreement;
• Northern Maritime Patrol and Response — Triton (administered by the Department of Immigration and Border Protection). The Government has entered into a contractual arrangement with Gardline Australia Pty Ltd for the provision of a vessel to strengthen enforcement activities in Australia’s northern waters. The contract with Gardline Australia Pty Ltd contains unquantifiable indemnities relating to the use, or other operations, of armaments and the presence of armaments on the vessel. It also contains unquantifiable indemnities relating to damage to any property or injury to any person caused by apprehended or escorted persons or their vessel;
• Immigration detention services — Serco (new) (administered by the Department of Immigration and Border Protection). On 11 December 2014, the Australian Government entered into a contract with Serco Australia Pty Ltd (Serco) to deliver immigration detention services in Australia on behalf of the Australian Government at immigration detention facilities. The contract terms limit Serco’s liability to the Australian Government to a maximum of any insurance proceeds recovered by Serco up to a value of $330 million. Serco’s liability is unlimited for specific events defined under the contract;
• Immigration detention services — state and territory governments (administered by the Department of Immigration and Border Protection). The Australian Government has negotiated arrangements with a number of state and territory governments for the provision of health, education, corrections and policing services to immigration detention facilities and people in immigration detention. Some jurisdictions are seeking indemnification by the Australian Government for the provision of those services;
• Snowy Hydro Limited water releases (administered by the Department of Industry and Science). The Australian, New South Wales and Victorian governments have indemnified Snowy Hydro Limited for liabilities arising from water releases in the Snowy River below Jindabyne Dam, where these releases are in accordance with the water licence and related regulatory arrangements agreed between the three governments. The indemnity applies to liabilities for which a claim is notified within 20 years from 28 June 2002;
• Maralinga clean-up (administered by the Department of Industry and Science). Fourteen unlimited indemnities have been given in relation to the clean-up of the former British atomic test site at Maralinga;

Notes to the financial statements
126
• Gorgon liquefied natural gas and carbon dioxide storage project (new) (administered by the Department of Industry and Science). On 13 February 2015, the Australian and Western Australian governments signed an agreement to provide an indemnity to the Gorgon Joint Venture Partners (GJV) to indemnify the GJV against independent third-party claims (relating to stored carbon dioxide) following closure of the carbon dioxide sequestration project. The Western Australian Government will indemnify the GJV, and the Australian Government will indemnify the Western Australian Government for 80 per cent of any amount determined to be payable;
• Liquid Fuel Emergency Act 1984 (administered by the Department of Industry and Science). The Australian Government and state and territory governments have entered into an inter-governmental agreement in relation to a national liquid fuel emergency. Under the agreement, the Australian Government may incur the direct costs of managing a liquid fuel emergency and includes the possibility of the Australian Government reimbursing the state and territory governments for costs arising from their responses, and potential compensation for industry arising from Australian Government directions under the Act;
• Maritime incident clean-up (administered by the Department of Infrastructure and Regional Development). The Australian Maritime Safety Authority is responsible for the provision of funds necessary to meet the clean-up costs arising from ship-sourced marine pollution and, in all circumstances, is responsible for making appropriate efforts to recover the costs of any such incidents. The Australian Government meets costs that cannot be recovered from such incidents;
• Accommodation Payment Guarantee Scheme (administered by the Department of Social Services). The Australian Government guarantees the repayment of aged care residents’ accommodation bonds, entry contribution balances and, from 1 July 2014, refundable accommodation deposits and contributions if the approved provider becomes insolvent or bankrupt and defaults on its refund obligations. From the latest available information, the maximum contingent liability, in the highly unlikely event that all providers defaulted, is $15.6 billion. For the 2014-15 financial year, the scheme was activated twice with total payments of $8.6 million. Since the scheme was introduced it has been activated a total of eight times requiring payment of $42.7 million;
• National Disability Insurance Scheme (NDIS) (new) (administered by the Department of Social Services). The Australian Government has committed to provide temporary, untied financial assistance to some jurisdictions that expect to have their GST entitlements adversely affected during the transition to the NDIS. Any impact on the Australian Government is not expected to occur before 2016-17;
• IMF New Arrangements to Borrow (NAB) (administered by the Department of the Treasury). Australia has made a line of credit available to the IMF under its NAB since 1998. During 2014-15, Australia met three calls under the NAB totalling A$40.8 million (special drawing rights 23 million);
Notes to the financial statements
127
• Loan to New South Wales for James Hardie Asbestos Injuries Compensation Fund (administered by the Department of the Treasury). The Australian Government has agreed to lend up to $160 million to the New South Wales Government to support the loan facility to top up the James Hardie Asbestos Injuries Compensation Fund. The loan agreement is subject to a number of conditions; and
• Officers and Directors assisting the Commonwealth in relation to asset sales, reviews and other arrangements (administered by various entities). From time to time, the Australian Government has provided warranties, undertakings and indemnities (indemnities) to directors, committee members, advisers, officers and/or staff of organisations for activities undertaken in good faith in assisting the Commonwealth in relation to asset sales, reviews and other arrangements.
This includes indemnities in relation to the: Directors of NBN Co Ltd (NBN Co); Export Finance Insurance Corporation board members and senior management; former Directors of the Australian Submarine Corporation Pty Ltd; directors and delegates of the board of the Commonwealth Superannuation Corporation, Future Fund Board of Guardians (Board members); officers and employees of ADI Limited; Maritime Industry Finance Company Ltd board members; Moorebank Intermodal Company Limited board members; Directors of National Rail Corporation; certain specified members of the review into the Australian Human Pituitary Hormone Programme; and certain specified members of the review into the Diagnostics Products Agreement. The Australian Government has also indemnified the boards and/or acquirers of certain entities against certain claims and costs arising from the sales of the Government entities. The probability of these indemnities being called upon is generally considered remote but is included for completeness.
Claims and proceedings
At any time various Australian Government entities are subject to claims and legal actions that are pending court or other processes. These include, but are not limited to:
• Suspension of livestock exports to Indonesia (administered by the Department of Agriculture). Proceedings have commenced against the Australian Government for losses due to the temporary suspension of exports of live animals to Indonesia that was put in place on 7 June 2011. Currently the amount of the claims remains unquantified;
• Equine influenza outbreak (administered by the Department of Agriculture). Proceedings have commenced against the Australian Government in relation to the outbreak of equine influenza in 2007. The final quantum of damages sought cannot be calculated;
Notes to the financial statements
128
• Termination of the funding agreement with OPEL Network Pty Ltd (administered by the Department of Communications). As at 30 June 2015, the Australian Government is a party to legal action brought against it in relation to an agreement under the Broadband Connect Infrastructure Programme. The outcome of that litigation cannot be predicted;
• Australian Government general insurance fund — Comcover (administered by the Department of Finance). Comcover’s liability for outstanding claims, which includes the expected future cost of claims notified and claims incurred but not reported, is subject to inherent uncertainty in the estimation process. The Australian Government’s potential liability cannot be quantified at this time;
• Tobacco Plain Packaging (administered by the Department of Health) The Government will continue to fund the defence of legal challenges to the tobacco plain packaging legislation in international forums;
• Medicare Locals (administered by the Department of Health). Due to the Government’s commitment to cease all Commonwealth funding to Medicare Locals from 30 June 2015, the Commonwealth is terminating the Medicare Locals Deed for Funding and Program Schedules under clause 22.1(i). The Commonwealth is therefore liable for any reasonable costs incurred by Medicare Locals which are directly attributable to the termination. Some funds are also expected to be recovered from a number of sites as a result of the termination, which would partially offset the liability. Neither costs nor potential recoveries can be estimated at present; and
• Business Services Wage Assessment Tool (BSWAT) (administered by the Department of Social Services). The Australian Government may potentially become liable for a significant range of costs following the full Federal Court ruling (21 December 2012) that the use of the BSWAT to assess the wages of two intellectually disabled employees constituted unlawful discrimination under the Disability Discrimination Act 1992. The Australian Government’s potential liability cannot be quantified at this time.
Property remediation — Defence and other sites
From time to time, the Australian Government may have ownership of properties that have a potential or possible environmental and associated concern. Where this is the case, further reviews may be undertaken to determine the extent, nature and estimated costs of remediation, if required. Specifically:
• Defence has made financial provision for the estimated costs involved in restoring, decontaminating and decommissioning property where a legal or constructive obligation has arisen. For cases where there is a legal or constructive obligation, but the potential cost could not be quantified, the obligations have been assessed as unquantifiable contingencies; and
Notes to the financial statements
129
• Under the Googong Dam lease agreement with the Australian Capital Territory Government, the Australian Government is required to undertake rectification of easements or any defects in title, and remediation of any contamination it may have caused to the site. It also gives an indemnity in relation to acts or omissions by the Australian Government.
Non-quantifiable contingent assets Contingent assets include but are not limited to:
• HIH Claims Support Scheme (HCSS) (administered by the Department of the Treasury). As an insured creditor in the liquidation of the HIH Group, the Australian Government is entitled to payments arising from the HCSS’s position in the Proof of Debt of respective HIH companies. The Australian Government has received payments from the HIH Estate during 2014-15, however, the timing and amount of future payments are unknown and will depend on the outcome of the estimation process and the completion of the liquidation of the HIH Group;
• International Monetary Fund (IMF) (administered by the Department of the Treasury). Since 1986, the IMF has used its burden sharing mechanism to make up for the loss of income from unpaid interest charges on the loans of debtor members and to accumulate precautionary balances in a Special Contingent Account to protect the IMF against losses arising from the failure of a member to repay its overdue principal obligations. As there is considerable and inherent uncertainty around the timing and amounts of burden sharing to be refunded to Australia this contingent asset cannot be reliably measured and as such is recorded as an unquantifiable contingent asset;
• Wireless local area network. The Commonwealth Scientific and Industrial Research Organisation (CSIRO) has ongoing patent infringement proceedings in the United States of America in relation to CSIRO’s invention of a wireless local area network. The final amount of the damages awarded is presently unknown; and
• Coal Mining Industry (Long Service Leave) Legislation Amendment Act 2011. The Coal Mining Industry (Long Service Leave Funding) Corporation (Corporation) is currently undertaking a Transitional Service Review. The provision in the Act provides that ‘Eligible Employees’ and ‘Former Employees’ can make application to the Corporation for recognition of period or periods of employment service between 1 January 2000 and December 2011 in the Black Coal Mining Industry that may not be presently recognised and recorded by the Corporation. The Corporation has not recognised levies attributable to those employers of ‘Eligible Employees’ and ‘Former Employees’ that previously did not contribute to the Corporation. At balance date, the amounts that would be receivable are not reliably measurable.
Additionally, at any time various Australian Government entities are pursuing various other claims and legal actions that are pending court or other processes.
Notes to the financial statements
130
Contingent liabilities excluded on the basis of remoteness A significant remote contingent liability is a possible obligation that would be material to the CFS, but where the probability of settlement is considered very low (less than five per cent).
The disclosure of remote contingencies is not required under AAS but is listed below for transparency. Further detail on individual remote contingencies may be included in the annual report for the respective Commonwealth entity:
• Research and Development (administered by the Department of Agriculture). Under several Acts, the Commonwealth provides contributions to a number of nominated entities responsible for undertaking research and development activities in respect of portfolio industries. These contributions are typically made on a matching basis. At 30 June 2015, the Commonwealth had a maximum potential liability in respect of matching payments of approximately $444 million (30 June 2014: $401 million). The likelihood of meeting the eligibility requirements and the amount of future payments is uncertain. Hence, the total liability is considered unquantifiable.
• Foreign currency denominated loans (administered by the Australian Office of Financial Management). Indemnifies agents of foreign currency denominated loans issued by the Australian Government outside Australia against any loss, liability, costs, claims, charges, expenses, actions, or demands due to any misrepresentation by the Australian Government and any breach of warranties. The Australian Government is not aware of any event that has occurred that may trigger action under the indemnities.
• Financial Claims Scheme — Deposits (administered by the Australian Prudential Regulation Authority (APRA)). Provides depositors of authorised deposit-taking institutions and general insurance policyholders with timely access to their funds in the event of a financial institution failure. Authorised under the Banking Act 1959 and available from 1 February 2012, deposits up to $250,000 at eligible authorised deposit-taking institutions are covered under the Financial Claims Scheme. This $250,000 cap has no expiry date. When last estimated as at 31 December 2014, deposits eligible for coverage under the Financial Claims Scheme were approximately $766 billion (2014: $722.8 billion);
• Financial Claims Scheme — Insurance (administered by APRA). The Policyholder Compensation Facility established under the Insurance Act 1973 provides a mechanism for making payments to eligible beneficiaries with a valid claim against a failed general insurer. Amounts available to meet payments and administer both facilities, in the event of activation, are capped at $20.1 billion under the legislation. Any payments made under the Financial Claims Scheme would be recovered through the liquidation of the failed institution. If there were a shortfall, a levy would be applied to industry to recover the difference between the amount expended and the amount recovered in the liquidation;
Notes to the financial statements
131
• Telstra Financial Guarantee (administered by the Department of Communications). Provides a guarantee to Telstra in respect of NBN Co’s financial obligations to Telstra under the Definitive Agreements (as amended on 14 December 2014). The liabilities under the agreements between Telstra and NBN Co arise progressively during the roll out of the National Broadband Network as Telstra’s infrastructure is accessed and Telstra’s customers are disconnected from its copper and hybrid-fibre coaxial cable networks. The Australian Government is only liable in the event NBN Co does not pay an amount under the Definitive Agreements when due. As at 30 June 2015, NBN Co had generated liabilities which it had not paid and that were covered by the guarantee estimated at $3.9 billion. The guarantee will terminate when NBN Co achieves specified credit ratings for a period of two continuous years and either: the company is capitalised by the Commonwealth to the agreed amount; or the Communications Minister declares that the National Broadband Network should be treated as built and fully operational. The Australian Government also provides a guarantee to Optus of NBN Co’s financial obligations to Optus under the Optus HFC Subscriber. As at 30 June 2015, the liabilities covered by the guarantee were not material to the CFS;
• Equity Funding Agreement with NBN Co (administered by the Department of Communications). The Australian Government (GGS) has an Equity Funding Agreement with NBN Co (which is consolidated into the PNFC sector). Under the agreement, the Australian Government is committed, in the event of a termination of the national broadband network roll out, to provide sufficient funds to NBN Co to meet its direct costs arising from that termination. As at 30 June 2015, NBN Co’s termination liabilities were estimated at $8.5 billion (2014: $6.7 billion). This cross-sector guarantee is internal to the Australian Government;
• Space Activities Act 1998 (administered by the Department of Industry and Science). The Australian Government is liable under the UN Convention on International Liability for Damage Caused by Space Objects for damage caused to third party States, including persons and property of that State, by space objects launched from, or by, Australia or Australian nationals. The Space Activities Act 1998 requires the launch operator to insure against liability up to a prescribed amount, with the Australian Government bearing any liability above this amount. The Australian Government also accepts liability for damage suffered by Australian nationals, to a maximum value of $3 billion above the insured level;
• Tripartite deeds relating to the sale of core regulated airports (administered by the Department of Infrastructure and Regional Development). The tripartite deeds between the Australian Government, the airport lessee companies and financiers amend the airport (head) leases to provide for limited step-in-rights for financiers in circumstances where the Australian Government terminates the head lease to enable the financiers to correct the circumstances that triggered such a termination event. The tripartite deeds may require the Australian Government to pay financiers compensation as a result of its termination of the (head) lease;
Notes to the financial statements
132
• New South Wales Rural Fire Fighting Service (NSW RFS) in relation to the Jervis Bay Territory (new) (administered by the Department of Infrastructure and Regional Development). An uncapped indemnity has been provided for any damage caused as a result of the actions of the NSW RFS in the Jervis Bay Territory while fighting a fire. The likelihood of an event occurring has been assessed as very remote and the risks are currently mitigated through the training and professional qualifications of the NSW RFS staff;
• Indian Ocean Territories Service Delivery Arrangement (administered by the Department of Infrastructure and Regional Development). Indemnities have been provided to the Western Australian Government, their respective officers, agents, contractors and employees against civil claims relating to their employment and conduct as officers as part of the Service Delivery Arrangement in the Indian Ocean Territories. The likelihood has been assessed as remote and the risks are currently mitigated through the training and professional qualifications of the staff of these agencies;
• Defence-related remote contingencies. At 30 June 2015, Defence had 1,437 (2013-14: 1,597) instances of quantifiable remote contingent liabilities valued at $3.8 billion (2013-14: $3.7 billion) and another nine unquantifiable remote contingent liabilities. A significant remote contingency includes proceedings in relation to Cockatoo Island Dockyard (CODOCK). Following a final court decision in 2006, CODOCK was awarded a complete indemnity from the Australian Government for its uninsured exposure to asbestos damages claims (plus 7.5 per cent profit);
• Export Finance Insurance Corporation (EFIC) Commercial Account (administered by the Department of Foreign Affairs and Trade). Under the Export Finance and Insurance Corporation Act 1991, the Australian Government (GGS) guarantees EFIC’s (which is consolidated into the PFC sector) creditors. The guarantee covers the EFIC Commercial Account and has a $200 million callable capital facility available for this purpose. This guarantee has never been utilised. As at 30 June 2015, the guarantee covered estimated liabilities of $3.5 billion (2014: $3.3 billion). This cross-sector guarantee is internal to the Australian Government;
• Commonwealth Bank of Australia and Commonwealth Bank of Australia Officers’ Super Fund (administered by the Department of the Treasury). Under the terms of the Commonwealth Bank Sale Act 1995, the Australian Government has guaranteed various liabilities of the Commonwealth Bank of Australia (CBA), and the Commonwealth Bank Officers’ Superannuation Corporation (CBOSC). The guarantee of the covered CBA liabilities was estimated at $4.4 billion at 30 June 2015 (2014: $4.4 billion) and the covered CBOSC liabilities were estimated at $0.5 billion at 30 June 2015 (2014: $0.7 billion);
Notes to the financial statements
133
• Guarantee of large deposits in authorised deposit taking institutions (administered by the Department of the Treasury). Available to eligible deposits above $1 million issued between 12 October 2008 and 31 March 2010. Eligible term deposits were guaranteed for up to five years and at-call deposits until October 2015. As at 30 June 2015, total liabilities covered by the Scheme were estimated at $1.45 billion. The guarantee also operated for wholesale funding issued between the above dates. This funding has all since matured;
• Guarantee of state and territory borrowing (administered by the Department of the Treasury). Available to state and territory governments on a voluntary basis for borrowings issued between 24 July 2009 and 31 December 2010. Australian Government expenditure would arise under the guarantee only in the unlikely event that a state or territory failed to meet its obligations with respect to a commitment that was subject to the guarantee and the guarantee was called upon. The Government would likely be able to recover any such expenditure through a claim on the relevant state or territory at a future date. As at 30 June 2015, the face value of borrowings covered by the guarantee was $11.7 billion (2014: $15.7 billion); and
• Reserve Bank of Australia (RBA) liabilities (administered by the Department of the Treasury). Under the Reserve Bank of Australia Act 1959, the Australian Government (GGS) guarantees the RBA’s (which is consolidated into the PFC sector) liabilities. As at 30 June 2015, the guarantee was valued at $65.5 billion (2014: $60.8 billion). This cross-sector guarantee is internal to the Australian Government.
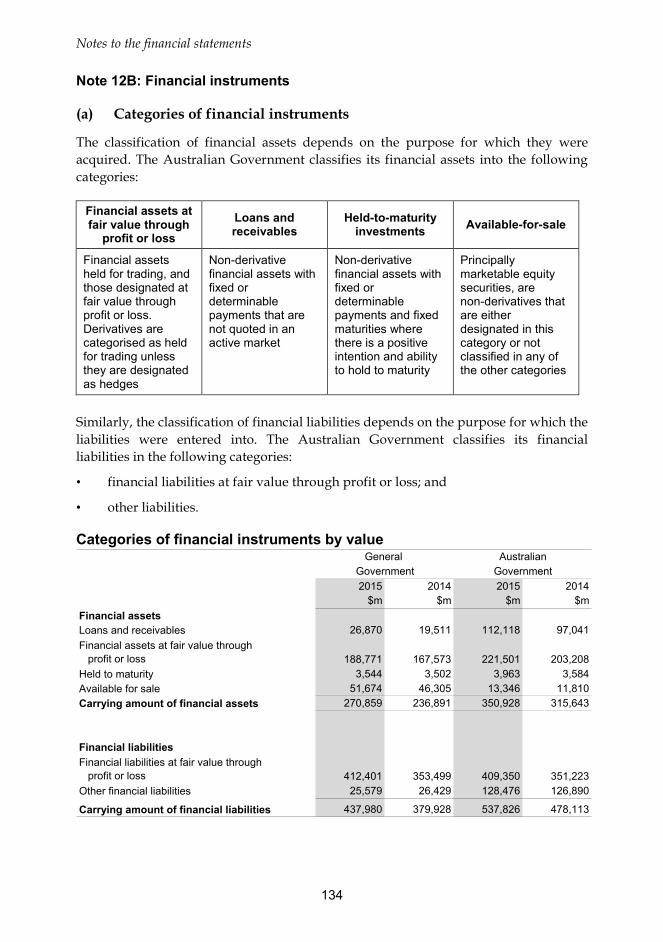
Notes to the financial statements
134
Note 12B: Financial instruments
(a) Categories of financial instruments
The classification of financial assets depends on the purpose for which they were acquired. The Australian Government classifies its financial assets into the following categories:
Financial assets at fair value through
profit or loss Loans and receivables
Held-to-maturity investments Available-for-sale
Financial assets held for trading, and those designated at fair value through profit or loss. Derivatives are categorised as held for trading unless they are designated as hedges
Non-derivative financial assets with fixed or determinable payments that are not quoted in an active market
Non-derivative financial assets with fixed or determinable payments and fixed maturities where there is a positive intention and ability to hold to maturity
Principally marketable equity securities, are non-derivatives that are either designated in this category or not classified in any of the other categories
Similarly, the classification of financial liabilities depends on the purpose for which the liabilities were entered into. The Australian Government classifies its financial liabilities in the following categories:
• financial liabilities at fair value through profit or loss; and
• other liabilities.
Categories of financial instruments by value
2015 2014 2015 2014$m $m $m $m
Financial assetsLoans and receivables 26,870 19,511 112,118 97,041Financial assets at fair value through profit or loss 188,771 167,573 221,501 203,208Held to maturity 3,544 3,502 3,963 3,584Available for sale 51,674 46,305 13,346 11,810Carrying amount of financial assets 270,859 236,891 350,928 315,643
Financial liabilitiesFinancial liabilities at fair value through profit or loss 412,401 353,499 409,350 351,223Other financial liabilities 25,579 26,429 128,476 126,890
Carrying amount of financial liabilities 437,980 379,928 537,826 478,113
General AustralianGovernment Government

Notes to the financial statements
135
Available-for-sale financial assets and financial assets at fair value through profit or loss are subsequently carried at fair value. Loans and receivables and held-to-maturity investments are subsequently carried at amortised cost using the effective interest method less impairment. For ‘financial assets at fair value through profit or loss’, gains and losses arising from changes in the fair value are included as other economic flows in the operating statement in the period in which they arise.
Certain financial assets categorised as ‘loans and receivables’ and measured at amortised cost are initially measured at fair value using a valuation method as a quoted price was not observable. In addition, the investment in the IMF quota is classified as ‘available for sale’ but is measured at cost as fair value cannot be reliably measured due to its unique nature.
Impairment of financial assets
Financial assets are assessed for impairment at each balance date. If there is objective evidence that an impairment loss has been incurred it is recognised as follows:
Financial asset category Measurement of impairment loss Recognition of impairment
loss Financial assets held at amortised cost: loans and receivables or held to maturity investments held at amortised cost
Difference between the carrying amount and the present value of estimated future cash flows discounted at the asset’s original effective interest rate
• carrying amount is reduced by way of an allowance account
• loss is recognised in the operating statement as an ‘other economic flow’.
Financial assets held at cost: unquoted equity instrument held at cost (because fair value cannot be reliably measured) or a linked derivative asset
Difference between the carrying amount of the asset and the present value of the estimated future cash flows discounted at the current market rate for similar assets
• loss is recognised in the operating statement as an ‘other economic flow’.
Available for sale financial assets
Difference between its cost, less principal repayments and amortisation, and its fair value, less any impairment loss previously recognised in the operating statement
• transferred from equity (net worth) to the operating statement as an ‘other economic flow’.
Derecognition of financial assets and liabilities
Financial assets are derecognised when the contractual rights to the cash flows from the financial asset expire or the asset is transferred to another entity. In the case of a transfer to another entity, it is necessary that the risks and rewards of ownership are also transferred. Financial liabilities are derecognised when the obligation under the contract is discharged, cancelled or expired.
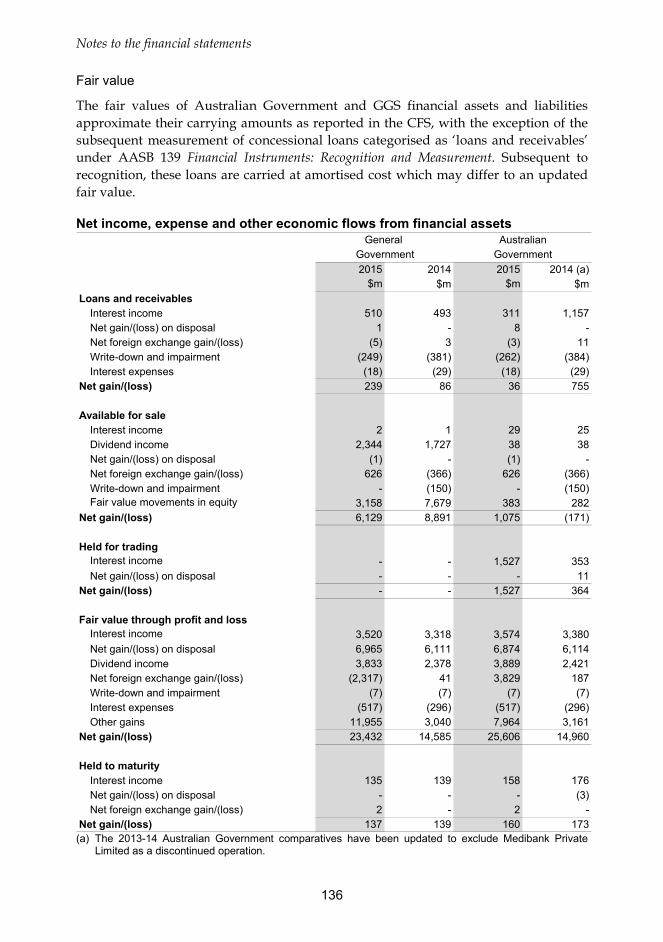
Notes to the financial statements
136
Fair value
The fair values of Australian Government and GGS financial assets and liabilities approximate their carrying amounts as reported in the CFS, with the exception of the subsequent measurement of concessional loans categorised as ‘loans and receivables’ under AASB 139 Financial Instruments: Recognition and Measurement. Subsequent to recognition, these loans are carried at amortised cost which may differ to an updated fair value.
Net income, expense and other economic flows from financial assets
2015 2014 2015 2014 (a)$m $m $m $m
Loans and receivablesInterest income 510 493 311 1,157Net gain/(loss) on disposal 1 - 8 -Net foreign exchange gain/(loss) (5) 3 (3) 11Write-down and impairment (249) (381) (262) (384)Interest expenses (18) (29) (18) (29)
Net gain/(loss) 239 86 36 755
Available for saleInterest income 2 1 29 25Dividend income 2,344 1,727 38 38Net gain/(loss) on disposal (1) - (1) -Net foreign exchange gain/(loss) 626 (366) 626 (366)Write-down and impairment - (150) - (150)Fair value movements in equity 3,158 7,679 383 282
Net gain/(loss) 6,129 8,891 1,075 (171)
Held for tradingInterest income - - 1,527 353Net gain/(loss) on disposal - - - 11
Net gain/(loss) - - 1,527 364
Fair value through profit and lossInterest income 3,520 3,318 3,574 3,380Net gain/(loss) on disposal 6,965 6,111 6,874 6,114Dividend income 3,833 2,378 3,889 2,421Net foreign exchange gain/(loss) (2,317) 41 3,829 187Write-down and impairment (7) (7) (7) (7)Interest expenses (517) (296) (517) (296)Other gains 11,955 3,040 7,964 3,161
Net gain/(loss) 23,432 14,585 25,606 14,960
Held to maturityInterest income 135 139 158 176Net gain/(loss) on disposal - - - (3)Net foreign exchange gain/(loss) 2 - 2 -
Net gain/(loss) 137 139 160 173
Government GovernmentGeneral Australian
(a) The 2013-14 Australian Government comparatives have been updated to exclude Medibank Private
Limited as a discontinued operation.
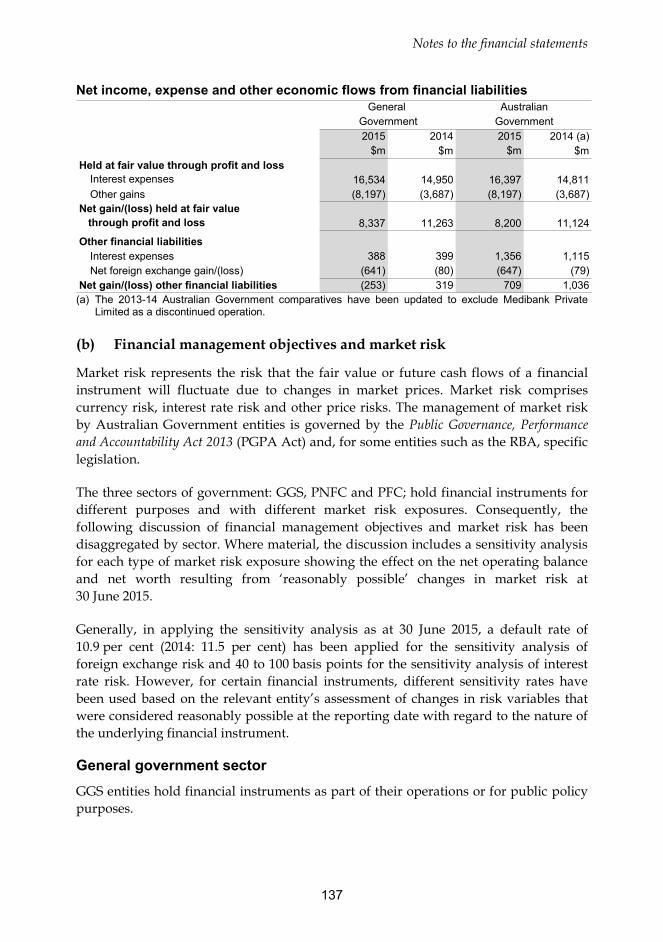
Notes to the financial statements
137
Net income, expense and other economic flows from financial liabilities
2015 2014 2015 2014 (a)$m $m $m $m
Held at fair value through profit and lossInterest expenses 16,534 14,950 16,397 14,811Other gains (8,197) (3,687) (8,197) (3,687)
Net gain/(loss) held at fair value through profit and loss 8,337 11,263 8,200 11,124
Other financial liabilitiesInterest expenses 388 399 1,356 1,115Net foreign exchange gain/(loss) (641) (80) (647) (79)
Net gain/(loss) other financial liabilities (253) 319 709 1,036
General AustralianGovernment Government
(a) The 2013-14 Australian Government comparatives have been updated to exclude Medibank Private
Limited as a discontinued operation. (b) Financial management objectives and market risk
Market risk represents the risk that the fair value or future cash flows of a financial instrument will fluctuate due to changes in market prices. Market risk comprises currency risk, interest rate risk and other price risks. The management of market risk by Australian Government entities is governed by the Public Governance, Performance and Accountability Act 2013 (PGPA Act) and, for some entities such as the RBA, specific legislation.
The three sectors of government: GGS, PNFC and PFC; hold financial instruments for different purposes and with different market risk exposures. Consequently, the following discussion of financial management objectives and market risk has been disaggregated by sector. Where material, the discussion includes a sensitivity analysis for each type of market risk exposure showing the effect on the net operating balance and net worth resulting from ‘reasonably possible’ changes in market risk at 30 June 2015.
Generally, in applying the sensitivity analysis as at 30 June 2015, a default rate of 10.9 per cent (2014: 11.5 per cent) has been applied for the sensitivity analysis of foreign exchange risk and 40 to 100 basis points for the sensitivity analysis of interest rate risk. However, for certain financial instruments, different sensitivity rates have been used based on the relevant entity’s assessment of changes in risk variables that were considered reasonably possible at the reporting date with regard to the nature of the underlying financial instrument.
General government sector GGS entities hold financial instruments as part of their operations or for public policy purposes.
Notes to the financial statements
138
Management of interest rate risk in the general government sector
Commonwealth entities subject to the PGPA Act are required to draw down administered and departmental monies on an ‘as-needed’ basis. As a general principle, Commonwealth general government entities cannot invest public monies except as delegated under section 58 of the PGPA Act or authorised by legislation. Corporate Commonwealth entities subject to the PGPA Act are also restricted in how they can invest monies that are surplus to operational requirements. As a general principle, surplus money may only be placed on deposit with a bank or invested directly in securities issued or guaranteed by the Australian Government, a state or a territory, unless an exemption is approved by the Finance Minister. Financial assets held by the majority of GGS entities are non-interest bearing, including trade receivables, or have fixed interest and do not fluctuate due to changes in the market interest rate.
The Treasurer has delegated investment powers to the Australian Office of Financial Management (AOFM). The AOFM’s functions give it primary responsibility for ensuring that the Australian Government has sufficient cash to meet its needs. As at 30 June 2015, AOFM had deposited $34.3 billion in term deposits with the RBA on behalf of the Australian Government (2014: $27.1 billion). As these investments are internal to the Australian Government reporting entity, they are not reported in the CFS, except at the general government level.
Investment funds
The Australian Government Investment Funds currently comprise:
• Future Fund;
• DisabilityCare Australia Fund (DCAF);
• Building Australia Fund (BAF);
• Education Investment Fund (EIF); and
• Health and Hospitals Fund (HHF).
The Future Fund was established by the Future Fund Act 2006 to finance the Australian Government’s unfunded public sector superannuation liability. The Future Fund Board of Guardians is responsible for the investment decisions of the Fund under an Investment Mandate issued by the Australian Government. The Investment Mandate requires the Board to maximise returns above a benchmark rate whilst taking acceptable but not excessive risk. The benchmark rate has been set at the Consumer Price Index (CPI) plus 4.5 per cent to 5.5 per cent per annum over the long term. Section 58 of the PGPA Act does not apply to investments of the fund.
The DCAF is an investment fund which will reimburse Commonwealth and state and territory governments for the costs relating to the National Disability Insurance Scheme.
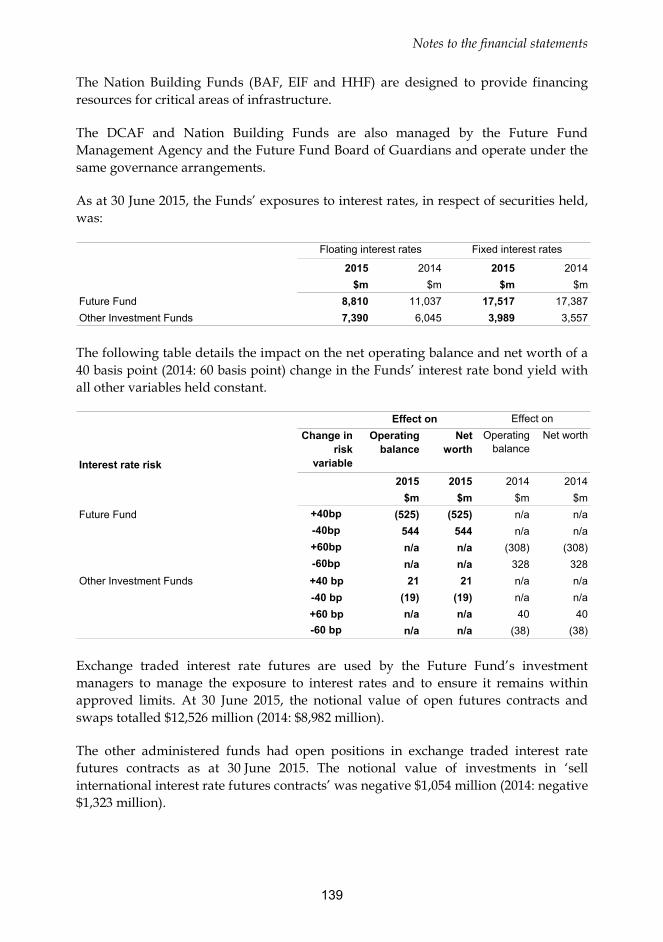
Notes to the financial statements
139
The Nation Building Funds (BAF, EIF and HHF) are designed to provide financing resources for critical areas of infrastructure.
The DCAF and Nation Building Funds are also managed by the Future Fund Management Agency and the Future Fund Board of Guardians and operate under the same governance arrangements.
As at 30 June 2015, the Funds’ exposures to interest rates, in respect of securities held, was:
2015 2014 2015 2014$m $m $m $m
Future Fund 8,810 11,037 17,517 17,387Other Investment Funds 7,390 6,045 3,989 3,557
Floating interest rates Fixed interest rates
The following table details the impact on the net operating balance and net worth of a 40 basis point (2014: 60 basis point) change in the Funds’ interest rate bond yield with all other variables held constant.
Interest rate risk
Change in risk
variable
Operating balance
Net worth
Operating balance
Net worth
2015 2015 2014 2014$m $m $m $m
Future Fund +40bp (525) (525) n/a n/a-40bp 544 544 n/a n/a+60bp n/a n/a (308) (308)-60bp n/a n/a 328 328
Other Investment Funds +40 bp 21 21 n/a n/a-40 bp (19) (19) n/a n/a+60 bp n/a n/a 40 40-60 bp n/a n/a (38) (38)
Effect on Effect on
Exchange traded interest rate futures are used by the Future Fund’s investment managers to manage the exposure to interest rates and to ensure it remains within approved limits. At 30 June 2015, the notional value of open futures contracts and swaps totalled $12,526 million (2014: $8,982 million).
The other administered funds had open positions in exchange traded interest rate futures contracts as at 30 June 2015. The notional value of investments in ‘sell international interest rate futures contracts’ was negative $1,054 million (2014: negative $1,323 million).
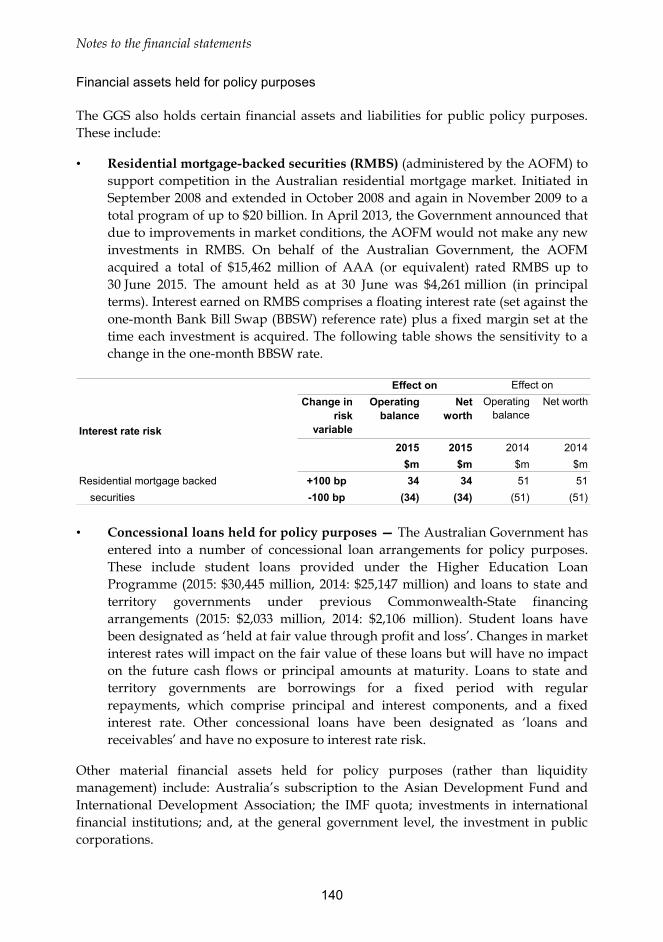
Notes to the financial statements
140
Financial assets held for policy purposes
The GGS also holds certain financial assets and liabilities for public policy purposes. These include:
• Residential mortgage-backed securities (RMBS) (administered by the AOFM) to support competition in the Australian residential mortgage market. Initiated in September 2008 and extended in October 2008 and again in November 2009 to a total program of up to $20 billion. In April 2013, the Government announced that due to improvements in market conditions, the AOFM would not make any new investments in RMBS. On behalf of the Australian Government, the AOFM acquired a total of $15,462 million of AAA (or equivalent) rated RMBS up to 30 June 2015. The amount held as at 30 June was $4,261 million (in principal terms). Interest earned on RMBS comprises a floating interest rate (set against the one-month Bank Bill Swap (BBSW) reference rate) plus a fixed margin set at the time each investment is acquired. The following table shows the sensitivity to a change in the one-month BBSW rate.
Interest rate risk
Change in risk
variable
Operating balance
Net worth
Operating balance
Net worth
2015 2015 2014 2014$m $m $m $m
Residential mortgage backed +100 bp 34 34 51 51securities -100 bp (34) (34) (51) (51)
Effect on Effect on
• Concessional loans held for policy purposes — The Australian Government has
entered into a number of concessional loan arrangements for policy purposes. These include student loans provided under the Higher Education Loan Programme (2015: $30,445 million, 2014: $25,147 million) and loans to state and territory governments under previous Commonwealth-State financing arrangements (2015: $2,033 million, 2014: $2,106 million). Student loans have been designated as ‘held at fair value through profit and loss’. Changes in market interest rates will impact on the fair value of these loans but will have no impact on the future cash flows or principal amounts at maturity. Loans to state and territory governments are borrowings for a fixed period with regular repayments, which comprise principal and interest components, and a fixed interest rate. Other concessional loans have been designated as ‘loans and receivables’ and have no exposure to interest rate risk.
Other material financial assets held for policy purposes (rather than liquidity management) include: Australia’s subscription to the Asian Development Fund and International Development Association; the IMF quota; investments in international financial institutions; and, at the general government level, the investment in public corporations.
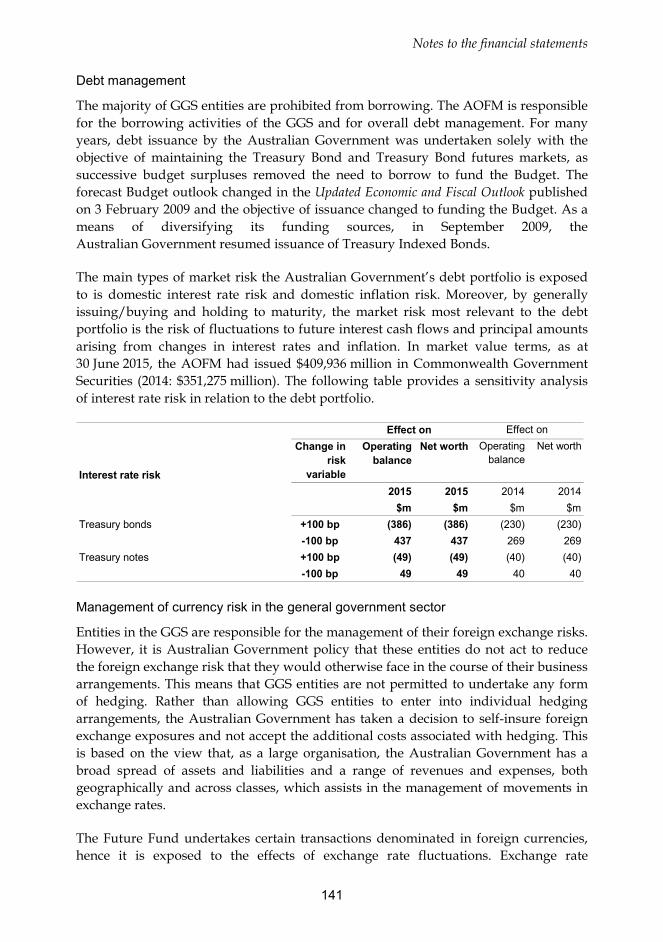
Notes to the financial statements
141
Debt management
The majority of GGS entities are prohibited from borrowing. The AOFM is responsible for the borrowing activities of the GGS and for overall debt management. For many years, debt issuance by the Australian Government was undertaken solely with the objective of maintaining the Treasury Bond and Treasury Bond futures markets, as successive budget surpluses removed the need to borrow to fund the Budget. The forecast Budget outlook changed in the Updated Economic and Fiscal Outlook published on 3 February 2009 and the objective of issuance changed to funding the Budget. As a means of diversifying its funding sources, in September 2009, the Australian Government resumed issuance of Treasury Indexed Bonds.
The main types of market risk the Australian Government’s debt portfolio is exposed to is domestic interest rate risk and domestic inflation risk. Moreover, by generally issuing/buying and holding to maturity, the market risk most relevant to the debt portfolio is the risk of fluctuations to future interest cash flows and principal amounts arising from changes in interest rates and inflation. In market value terms, as at 30 June 2015, the AOFM had issued $409,936 million in Commonwealth Government Securities (2014: $351,275 million). The following table provides a sensitivity analysis of interest rate risk in relation to the debt portfolio.
Interest rate risk
Change in risk
variable
Operating balance
Net worth Operating balance
Net worth
2015 2015 2014 2014$m $m $m $m
Treasury bonds +100 bp (386) (386) (230) (230)-100 bp 437 437 269 269
Treasury notes +100 bp (49) (49) (40) (40)-100 bp 49 49 40 40
Effect on Effect on
Management of currency risk in the general government sector
Entities in the GGS are responsible for the management of their foreign exchange risks. However, it is Australian Government policy that these entities do not act to reduce the foreign exchange risk that they would otherwise face in the course of their business arrangements. This means that GGS entities are not permitted to undertake any form of hedging. Rather than allowing GGS entities to enter into individual hedging arrangements, the Australian Government has taken a decision to self-insure foreign exchange exposures and not accept the additional costs associated with hedging. This is based on the view that, as a large organisation, the Australian Government has a broad spread of assets and liabilities and a range of revenues and expenses, both geographically and across classes, which assists in the management of movements in exchange rates.
The Future Fund undertakes certain transactions denominated in foreign currencies, hence it is exposed to the effects of exchange rate fluctuations. Exchange rate
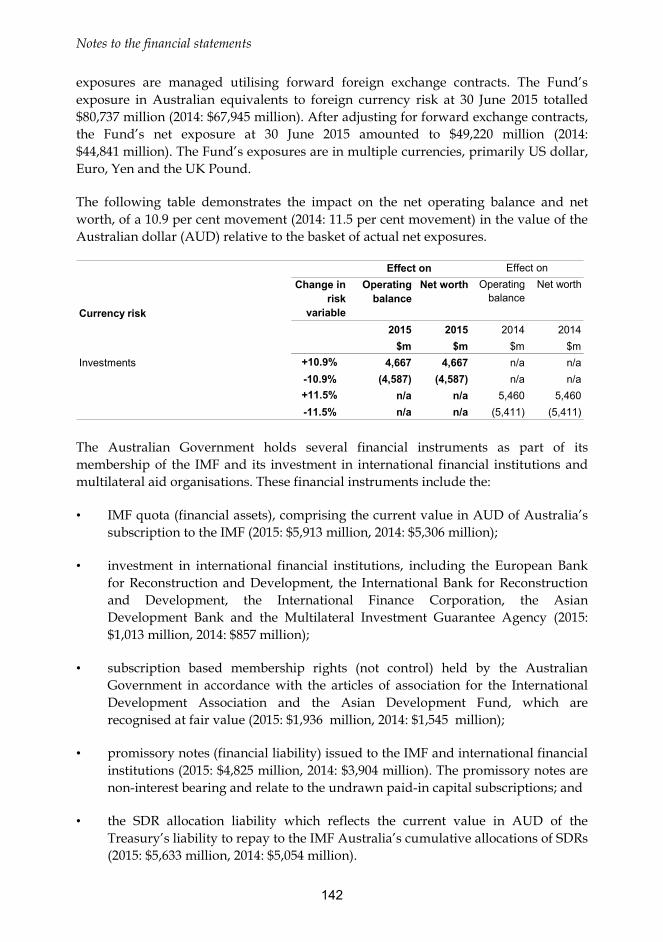
Notes to the financial statements
142
exposures are managed utilising forward foreign exchange contracts. The Fund’s exposure in Australian equivalents to foreign currency risk at 30 June 2015 totalled $80,737 million (2014: $67,945 million). After adjusting for forward exchange contracts, the Fund’s net exposure at 30 June 2015 amounted to $49,220 million (2014: $44,841 million). The Fund’s exposures are in multiple currencies, primarily US dollar, Euro, Yen and the UK Pound.
The following table demonstrates the impact on the net operating balance and net worth, of a 10.9 per cent movement (2014: 11.5 per cent movement) in the value of the Australian dollar (AUD) relative to the basket of actual net exposures.
Currency risk
Change in risk
variable
Operating balance
Net worth Operating balance
Net worth
2015 2015 2014 2014$m $m $m $m
Investments +10.9% 4,667 4,667 n/a n/a-10.9% (4,587) (4,587) n/a n/a+11.5% n/a n/a 5,460 5,460-11.5% n/a n/a (5,411) (5,411)
Effect on Effect on
The Australian Government holds several financial instruments as part of its membership of the IMF and its investment in international financial institutions and multilateral aid organisations. These financial instruments include the:
• IMF quota (financial assets), comprising the current value in AUD of Australia’s subscription to the IMF (2015: $5,913 million, 2014: $5,306 million);
• investment in international financial institutions, including the European Bank for Reconstruction and Development, the International Bank for Reconstruction and Development, the International Finance Corporation, the Asian Development Bank and the Multilateral Investment Guarantee Agency (2015: $1,013 million, 2014: $857 million);
• subscription based membership rights (not control) held by the Australian Government in accordance with the articles of association for the International Development Association and the Asian Development Fund, which are recognised at fair value (2015: $1,936 million, 2014: $1,545 million);
• promissory notes (financial liability) issued to the IMF and international financial institutions (2015: $4,825 million, 2014: $3,904 million). The promissory notes are non-interest bearing and relate to the undrawn paid-in capital subscriptions; and
• the SDR allocation liability which reflects the current value in AUD of the Treasury’s liability to repay to the IMF Australia’s cumulative allocations of SDRs (2015: $5,633 million, 2014: $5,054 million).

Notes to the financial statements
143
The Australian Government is exposed to foreign currency denominated in US dollars, Euro and SDR on the above financial instruments. The following table details the impact on the net operating balance and net worth of an 11 per cent (2014: 12 per cent) movement in the value of the AUD relative to financial instruments associated with the IMF and international financial institutions, and a 10.9 per cent (2014: 11.5 per cent) movement for financial instruments associated with multi-lateral aid organisations.
Currency risk
Change in risk
variable
Operating balance
Net worth
Operating balance
Net worth
2015 2015 2014 2014$m $m $m $m
Loans + 10.9% (191) (191) n/a n/a- 10.9% 238 238 n/a n/a+ 11.5% n/a n/a (159) (159)- 11.5% n/a n/a 201 201
International Monetary Fund + 11.0% (581) (581) n/a n/a+ 11.0% 723 723 n/a n/a+ 12.0% n/a n/a (547) (547)- 12.0% n/a n/a 689 689
Effect on Effect on
Management of other price risk in the general government sector
The Australian Government is exposed to equity price risks arising from equity investments, primarily through Future Fund investments. The equity price risk is the risk that the value of the equity portfolio will decrease as a result of changes in the levels of equity indices and the price of individual stocks. The Future Fund holds all of its equities at fair value through profit or loss.
As at 30 June 2015, the Future Fund’s exposure to equity price risk consisted of $11,001 million in domestic listed equities and listed managed investment schemes (2014: $11,190 million) and $30,883 million in international listed equities and listed management schemes (2014: $27,225 million).
The following table demonstrates the impact on the net operating balance and net worth of a +/- 20 per cent change in domestic equities and a +/- 15 per cent change in international equities held by the Future Fund.
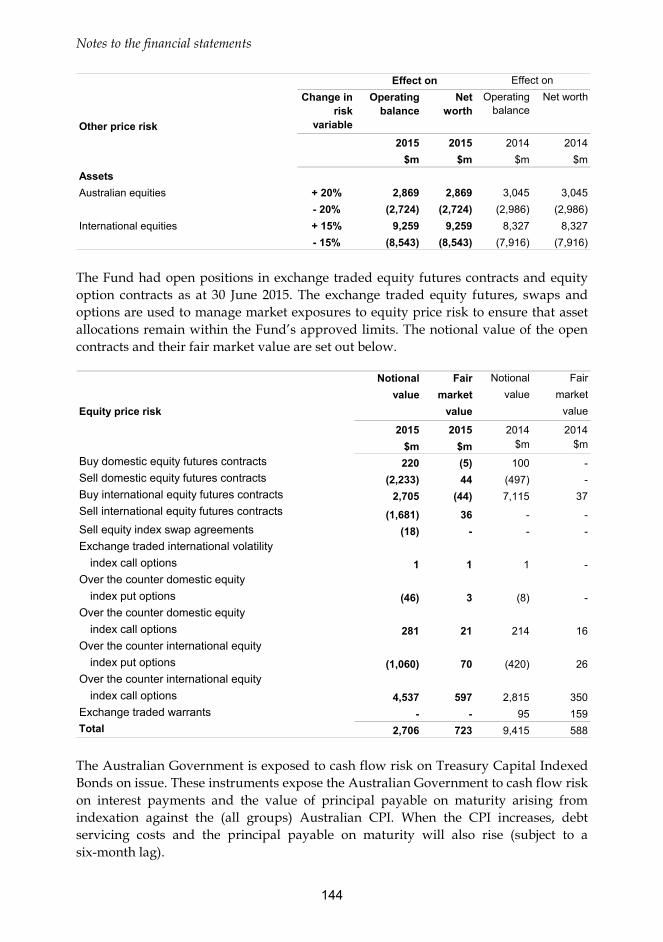
Notes to the financial statements
144
Other price risk
Change in risk
variable
Operating balance
Net worth
Operating balance
Net worth
2015 2015 2014 2014$m $m $m $m
AssetsAustralian equities + 20% 2,869 2,869 3,045 3,045
- 20% (2,724) (2,724) (2,986) (2,986)International equities + 15% 9,259 9,259 8,327 8,327
- 15% (8,543) (8,543) (7,916) (7,916)
Effect on Effect on
The Fund had open positions in exchange traded equity futures contracts and equity option contracts as at 30 June 2015. The exchange traded equity futures, swaps and options are used to manage market exposures to equity price risk to ensure that asset allocations remain within the Fund’s approved limits. The notional value of the open contracts and their fair market value are set out below.
Notional Fair Notional Fairvalue market value market
value value
2015 2015 2014 2014$m $m $m $m
Buy domestic equity futures contracts 220 (5) 100 -Sell domestic equity futures contracts (2,233) 44 (497) -Buy international equity futures contracts 2,705 (44) 7,115 37Sell international equity futures contracts (1,681) 36 - -Sell equity index swap agreements (18) - - -Exchange traded international volatility
index call options 1 1 1 -Over the counter domestic equity
index put options (46) 3 (8) -Over the counter domestic equity
index call options 281 21 214 16Over the counter international equity
index put options (1,060) 70 (420) 26Over the counter international equity
index call options 4,537 597 2,815 350Exchange traded warrants - - 95 159
2,706 723 9,415 588
Equity price risk
Total The Australian Government is exposed to cash flow risk on Treasury Capital Indexed Bonds on issue. These instruments expose the Australian Government to cash flow risk on interest payments and the value of principal payable on maturity arising from indexation against the (all groups) Australian CPI. When the CPI increases, debt servicing costs and the principal payable on maturity will also rise (subject to a six-month lag).
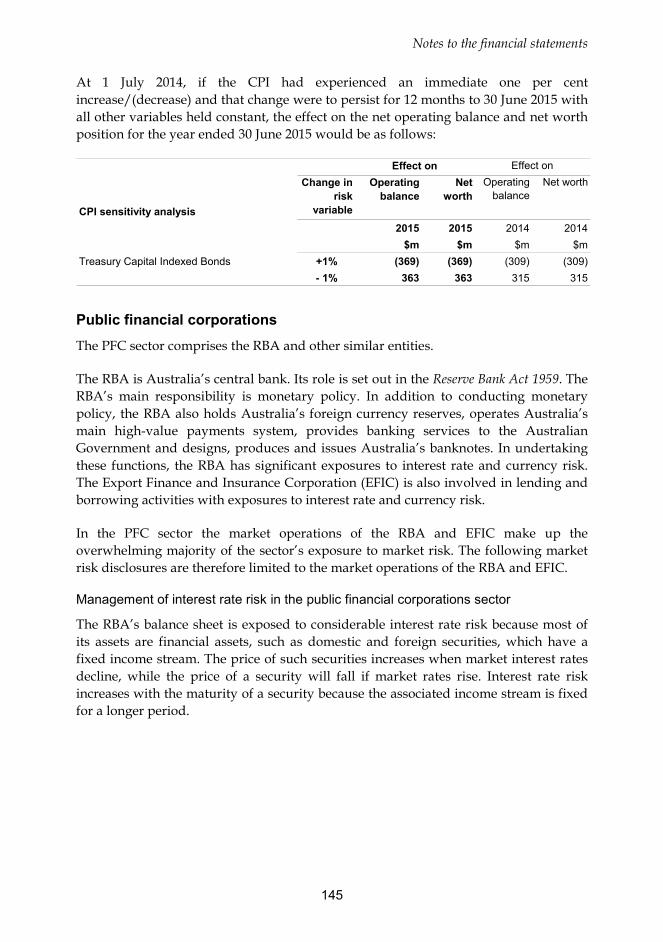
Notes to the financial statements
145
At 1 July 2014, if the CPI had experienced an immediate one per cent increase/(decrease) and that change were to persist for 12 months to 30 June 2015 with all other variables held constant, the effect on the net operating balance and net worth position for the year ended 30 June 2015 would be as follows:
CPI sensitivity analysis
Change in risk
variable
Operating balance
Net worth
Operating balance
Net worth
2015 2015 2014 2014$m $m $m $m
Treasury Capital Indexed Bonds +1% (369) (369) (309) (309)- 1% 363 363 315 315
Effect on Effect on
Public financial corporations The PFC sector comprises the RBA and other similar entities.
The RBA is Australia’s central bank. Its role is set out in the Reserve Bank Act 1959. The RBA’s main responsibility is monetary policy. In addition to conducting monetary policy, the RBA also holds Australia’s foreign currency reserves, operates Australia’s main high-value payments system, provides banking services to the Australian Government and designs, produces and issues Australia’s banknotes. In undertaking these functions, the RBA has significant exposures to interest rate and currency risk. The Export Finance and Insurance Corporation (EFIC) is also involved in lending and borrowing activities with exposures to interest rate and currency risk.
In the PFC sector the market operations of the RBA and EFIC make up the overwhelming majority of the sector’s exposure to market risk. The following market risk disclosures are therefore limited to the market operations of the RBA and EFIC.
Management of interest rate risk in the public financial corporations sector
The RBA’s balance sheet is exposed to considerable interest rate risk because most of its assets are financial assets, such as domestic and foreign securities, which have a fixed income stream. The price of such securities increases when market interest rates decline, while the price of a security will fall if market rates rise. Interest rate risk increases with the maturity of a security because the associated income stream is fixed for a longer period.

Notes to the financial statements
146
The following table shows the sensitivity to a change in interest rate variables.
Interest rate risk
Change in risk
variable
Operating balance
Net worth Operating balance
Net worth
2015 2015 2014 2014$m $m $m $m
Foreign currency securities +100 bp 300 300 365 365-100 bp (300) (300) (365) (365)
Australian dollar securities +100 bp 156 156 131 131-100 bp (156) (156) (131) (131)
Effect onEffect on
As EFIC is also involved in lending and borrowing activities, interest rate risks arise. EFIC uses interest rate swaps, forward rate agreements, cross-currency swaps and futures as the primary methods of reducing exposure to interest rate movements.
Management of currency risk in the public financial corporations sector
Foreign exchange risk arises from the RBA’s foreign currency assets, which are held to support the RBA’s operations in the foreign exchange market. The overall level of foreign currency exposure is determined by policy considerations and cannot otherwise be managed to reduce foreign exchange risk. The RBA’s net foreign currency exposure as at 30 June 2015 was $50 billion (2014: $42 billion). Within the overall exposure and to a limited extent, foreign currency risk can be reduced by holding assets across a diversified portfolio of currencies.
The RBA holds foreign reserves in several currencies — the US dollar (55 per cent of net foreign currency holdings), the Euro (25 per cent), the Canadian dollar (5 per cent), the Yen (5 per cent), the Chinese renminbi (5 per cent) and the UK pound sterling (5 per cent) — because the markets for these currencies are typically liquid and suitable for investing foreign exchange reserves. The RBA also operates in foreign exchange markets on behalf of its clients, including to assist the Australian Government in meeting foreign currency obligations. The following table demonstrates the RBA’s sensitivity to a movement of +/-10 per cent in the value of the AUD exchange rate as at 30 June 2015.
Currency risk
Change in risk
variable
Operating balance
Net worth Operating balance
Net worth
2015 2015 2014 2014$m $m $m $m
Australian dollar exchange rate + 10% (4,547) (4,547) (3,849) (3,849)- 10% 5,557 5,557 4,704 4,704
Effect onEffect on

Notes to the financial statements
147
The RBA undertakes foreign currency swaps to assist its daily domestic market operations. These instruments carry no foreign exchange risk since the exchange rates at which both legs of the transaction are settled are agreed at the time the swap is undertaken.
EFIC extends facilities in various currencies, principally in US dollars and Euros. Where the borrowing currency is different from the currency of the assets being funded, cross-currency swaps, or the foreign exchange markets are used to offset the exposure (before provisions). EFIC’s exposure in AUD to foreign currency risk at 30 June 2015 totalled $3,013 million on financial assets and $3,044 million on financial liabilities giving a net exposure of negative $31 million (2014: negative $22 million).
Public non-financial corporations The PNFC entities primarily hold financial instruments as a direct result of operations, including trade receivables and payables, or to finance operations. Certain entities in the PNFC sector also enter into derivative transactions, including interest rate swaps, forward currency contracts and commodity swap contracts. The purpose is to manage the interest rate, currency and commodity risks arising from the entity’s operations and sources of finance.
(c) Credit risk
Credit risk in relation to financial assets, is the risk that a third party will not meet its obligations in accordance with agreed terms. Generally, the Australian Government’s maximum exposure to credit risk in relation to each class of recognised financial asset is the carrying amount of those assets as indicated in the consolidated balance sheet. The following table shows the credit quality of financial receivables reported in the CFS that are not past due or individually determined as impaired.
2015 2014 2015 2014Not Past Not Past Past PastDue Nor Due Nor Due or Due orImpaired Impaired Impaired Impaired
$m $m $m $m
Australian GovernmentAdvances and loans 41,682 34,752 88 82Goods and services receivable 1,262 1,301 245 359Other receivables 3,488 3,593 817 720
Total 46,432 39,646 1,150 1,161
General GovernmentAdvances and loans 40,570 33,958 88 82Goods and services receivable 609 476 122 193Other receivables 5,584 4,416 776 720
Total 46,763 38,850 986 995
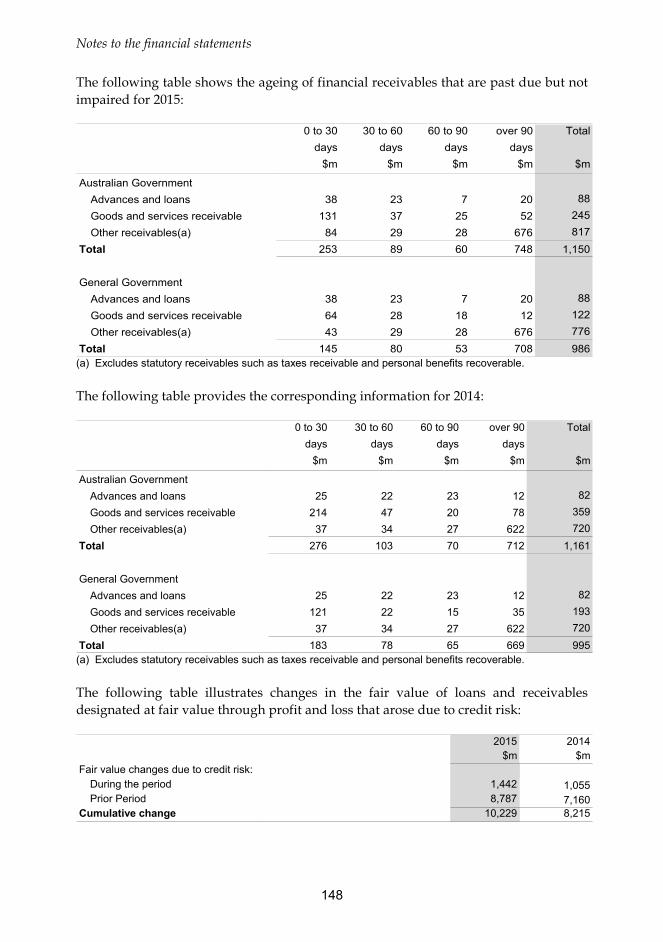
Notes to the financial statements
148
The following table shows the ageing of financial receivables that are past due but not impaired for 2015:
0 to 30 30 to 60 60 to 90 over 90 Totaldays days days days
$m $m $m $m $m
Australian GovernmentAdvances and loans 38 23 7 20 88Goods and services receivable 131 37 25 52 245Other receivables(a) 84 29 28 676 817
Total 253 89 60 748 1,150
General GovernmentAdvances and loans 38 23 7 20 88Goods and services receivable 64 28 18 12 122Other receivables(a) 43 29 28 676 776
Total 145 80 53 708 986 (a) Excludes statutory receivables such as taxes receivable and personal benefits recoverable. The following table provides the corresponding information for 2014:
0 to 30 30 to 60 60 to 90 over 90 Totaldays days days days
$m $m $m $m $m
Australian GovernmentAdvances and loans 25 22 23 12 82Goods and services receivable 214 47 20 78 359Other receivables(a) 37 34 27 622 720
Total 276 103 70 712 1,161
General GovernmentAdvances and loans 25 22 23 12 82Goods and services receivable 121 22 15 35 193Other receivables(a) 37 34 27 622 720
Total 183 78 65 669 995 (a) Excludes statutory receivables such as taxes receivable and personal benefits recoverable. The following table illustrates changes in the fair value of loans and receivables designated at fair value through profit and loss that arose due to credit risk:
2015 2014$m $m
Fair value changes due to credit risk:During the period 1,442 1,055Prior Period 8,787 7,160
Cumulative change 10,229 8,215
Notes to the financial statements
149
Australian Government entities have assessed the risk of default on payment and have allocated $236 million to the impairment allowance for advances and loans at 30 June 2015 (2014: $229 million) and $754 million to the impairment allowance for goods and services and other receivables at 30 June 2015 (2014: $1,978 million).
The majority of Australian Government entities do not have significant exposures to any concentrations of credit risk. Generally, Australian Government entities’ exposures are to a large number of customers or highly rated counterparties and their credit risks are very low. Australian Government entities that do have material concentrations of credit risk include:
• the Future Fund has a significant exposure to interest bearing securities issued by domestic banks (including domestic subsidiaries of foreign banks);
• EFIC’s principal exposure to credit risk arises from the financing and credit facilities extended to clients. Exposures on the commercial account amounted to $2,042 million at 30 June 2015 (2014: $1,871 million) and on the national interest account amounted to $915 million (2014: $867 million);
• the AOFM’s financial investments include loans to state and territory governments, deposits, discount securities and RMBS. The credit quality of the RMBS derives from the underlying quality of the mortgage assets and structural enhancements such as lenders mortgage insurance, liquidity facilities, and the issue of different classes of securities. At the time of acquisition, each RMBS issue must meet a range of eligibility criteria set by the AOFM;
• for the RBA, credit risk arises from exposure to the issuers of securities that it holds; banks with which the RBA deposits funds and counterparties that are yet to settle transactions. The RBA’s credit exposure is low compared with that of most commercial financial institutions because it manages such risks within a highly risk-averse framework; and
• from time to time the Australian Government may have significant exposures to credit risk in relation to major asset sales.
Collateral
With the exception of the following, the majority of Australian Government entities do not hold collateral to manage credit risk. Cash invested by the RBA under repurchase agreements is secured by collateral to a value of between 101 and 127 per cent of the amount invested. In relation to Indigenous Business Australia’s gross credit risk, collateral valued at $1,403 million is held against home and business loans (2014: $1,370 million). For EFIC, collateral held may include first ranking mortgages over assets financed by EFIC, standby documentary credits, third-party guarantees and recourse to companies and company directors. No collateral has currently been called and held at year end.

Notes to the financial statements
150
(d) Liquidity risk
Liquidity risk is the risk that the Australian Government will not be able to meet its obligations as they fall due. The following tables disclose the undiscounted value of the contractual maturities of financial liabilities as at the end of the financial year, including estimated future interest payments.
The Australian Government has sufficient access to funds to meet its liabilities as they fall due. The Australian Government is positioned to address liquidity risk through existing revenue sources, including the power to tax, and its capacity to roll over existing debt:
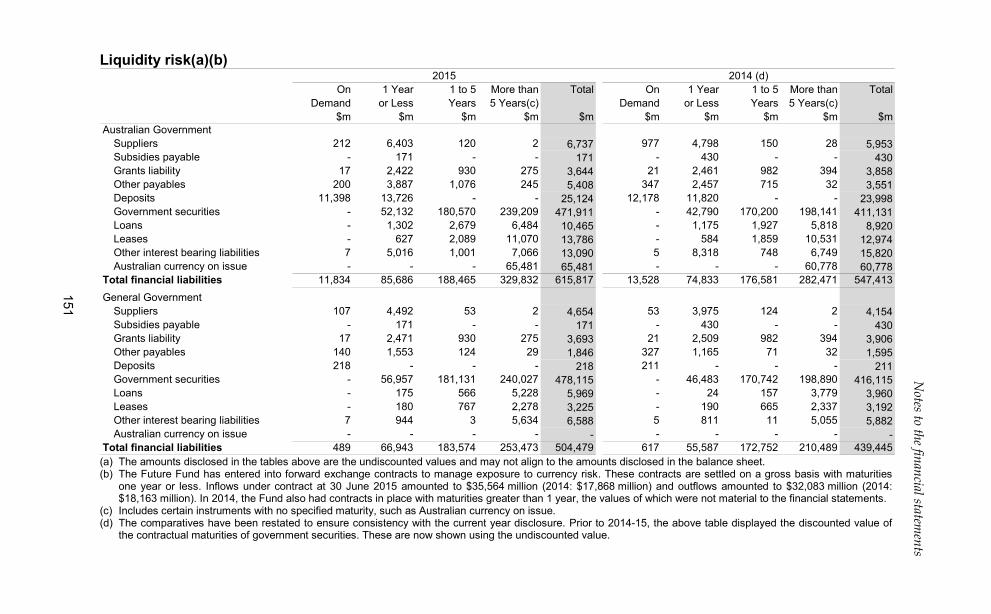
151
Notes to the financial statem
ents Liquidity risk(a)(b)
On 1 Year 1 to 5 More than Total On 1 Year 1 to 5 More than TotalDemand or Less Years 5 Years(c) Demand or Less Years 5 Years(c)
$m $m $m $m $m $m $m $m $m $mAustralian Government
Suppliers 212 6,403 120 2 6,737 977 4,798 150 28 5,953Subsidies payable - 171 - - 171 - 430 - - 430Grants liability 17 2,422 930 275 3,644 21 2,461 982 394 3,858Other payables 200 3,887 1,076 245 5,408 347 2,457 715 32 3,551Deposits 11,398 13,726 - - 25,124 12,178 11,820 - - 23,998Government securities - 52,132 180,570 239,209 471,911 - 42,790 170,200 198,141 411,131Loans - 1,302 2,679 6,484 10,465 - 1,175 1,927 5,818 8,920Leases - 627 2,089 11,070 13,786 - 584 1,859 10,531 12,974Other interest bearing liabilities 7 5,016 1,001 7,066 13,090 5 8,318 748 6,749 15,820Australian currency on issue - - - 65,481 65,481 - - - 60,778 60,778
Total financial liabilities 11,834 85,686 188,465 329,832 615,817 13,528 74,833 176,581 282,471 547,413General Government
Suppliers 107 4,492 53 2 4,654 53 3,975 124 2 4,154Subsidies payable - 171 - - 171 - 430 - - 430Grants liability 17 2,471 930 275 3,693 21 2,509 982 394 3,906Other payables 140 1,553 124 29 1,846 327 1,165 71 32 1,595Deposits 218 - - - 218 211 - - - 211Government securities - 56,957 181,131 240,027 478,115 - 46,483 170,742 198,890 416,115Loans - 175 566 5,228 5,969 - 24 157 3,779 3,960Leases - 180 767 2,278 3,225 - 190 665 2,337 3,192Other interest bearing liabilities 7 944 3 5,634 6,588 5 811 11 5,055 5,882Australian currency on issue - - - - - - - - - -
Total financial liabilities 489 66,943 183,574 253,473 504,479 617 55,587 172,752 210,489 439,445
2015 2014 (d)
(a) The amounts disclosed in the tables above are the undiscounted values and may not align to the amounts disclosed in the balance sheet. (b) The Future Fund has entered into forward exchange contracts to manage exposure to currency risk. These contracts are settled on a gross basis with maturities
one year or less. Inflows under contract at 30 June 2015 amounted to $35,564 million (2014: $17,868 million) and outflows amounted to $32,083 million (2014: $18,163 million). In 2014, the Fund also had contracts in place with maturities greater than 1 year, the values of which were not material to the financial statements.
(c) Includes certain instruments with no specified maturity, such as Australian currency on issue. (d) The comparatives have been restated to ensure consistency with the current year disclosure. Prior to 2014-15, the above table displayed the discounted value of
the contractual maturities of government securities. These are now shown using the undiscounted value.
Notes to the financial statements
152
Note 12C: Defined benefit superannuation plans
Accounting policy
The Australian Government recognises actuarial gains or losses immediately in Other Comprehensive Income in the year in which they occur. Interest on the net defined benefit liability is recognised in profit and loss; the return on plan assets excluding the amount included in interest income is recognised in Other Comprehensive Income.
Overview of schemes
GGS employees will usually be members of the Commonwealth Superannuation Scheme (CSS), Public Sector Superannuation Scheme (PSS) or the Public Sector Superannuation Accumulation Plan (PSSAP). The PSS and the CSS are closed to new members, with the PSSAP available to most new employees who commenced employment on or after 1 July 2005. The CSS and PSS provide defined benefits. The PSSAP provides fully funded accumulation benefits to members, with no ongoing liability to the Australian Government.
Australian Government military personnel are members of the Defence Force Retirement and Death Benefits Scheme (DFRDB) or the Military Superannuation Benefits Scheme (MSBS). Both schemes are defined benefit schemes. The DFRDB closed to new members in 1991. The MSBS will close to new members from 1 July 2016. A new accumulation scheme, ADF Super, will commence for new military personnel that enter on or after this date.
The Parliamentary Contributory Superannuation Scheme (PCSS) was closed to new members from 9 October 2004 and superannuation accumulation arrangements were established for parliamentarians joining Parliament on or after that date. The accumulation arrangements were established under the Parliamentary Superannuation Act 2004 and involve a Government contribution of 15.4 per cent which is calculated on total parliamentary salaries. The Government contribution is payable into a superannuation fund chosen by the parliamentarian.
In addition to the above, several schemes have been established under legislation for specified personnel, including the Judges’ Pension Scheme (JPS), Governor General Pension Scheme, Federal Circuit Court Judges Death and Disability Scheme (FCCJDDS) and the North American and London, Dublin and New Delhi pension schemes.
Notes to the financial statements
153
Several Public Corporations are responsible for defined benefit schemes for their employees, including:
Scheme title Responsible entities AvSuper(a) Airservices Australia Australia Post Superannuation Scheme (APSS)(a) Australia Post Corporation State Authorities Superannuation Scheme (SASS), State Superannuation Scheme (SSS), State Authorities Non-contributory Superannuation Scheme (SASCS)(a)
Australian Rail Track Corporation
Australian Submarine Corporation Superannuation Fund (ASCSF) Australian Submarine Corporation Reserve Bank of Australia Officers’ Superannuation Fund (OSF) and UK Pension Scheme (UKPS)(a)
RBA
(a) As required under AASB 119, Employee Benefits, the rate used to discount the superannuation liability is determined by reference to market yields on government bonds. Certain for-profit public corporations have applied the market yield on high quality corporate bonds in discounting their long-term employee benefits. On consolidation into these statements, the discount rate and associated disclosures have been adjusted back to apply government bond rates.
For the purposes of this whole of government disclosure, these ‘less material’ schemes have been grouped under ‘other’.
Composition
As at 30 June 2015, the composition of the Australian Government’s net liability for the defined benefit schemes (as reported in Note 8F) was as follows:
Scheme2015 2014 2015 2014
$m $m $m $mCommonwealth Superannuation Scheme (CSS) 76,798 71,556 76,798 71,556 Public Sector Superannuation Scheme (PSS) 74,800 64,862 74,800 64,862 Parliamentary Contributory Superannuation
Scheme (PCSS) 1,057 1,076 1,057 1,076 Defence Force Retirement and Death Benefits
Scheme (DFRDB) 42,945 41,279 42,945 41,279 Military Superannuation Benefits Scheme (MSBS) 51,156 41,598 51,156 41,598 Other schemes 1,298 1,227 1,326 1,351 Other superannuation liabilities 155 149 457 226
248,209 221,747 248,540 221,948
General Government Australian Government
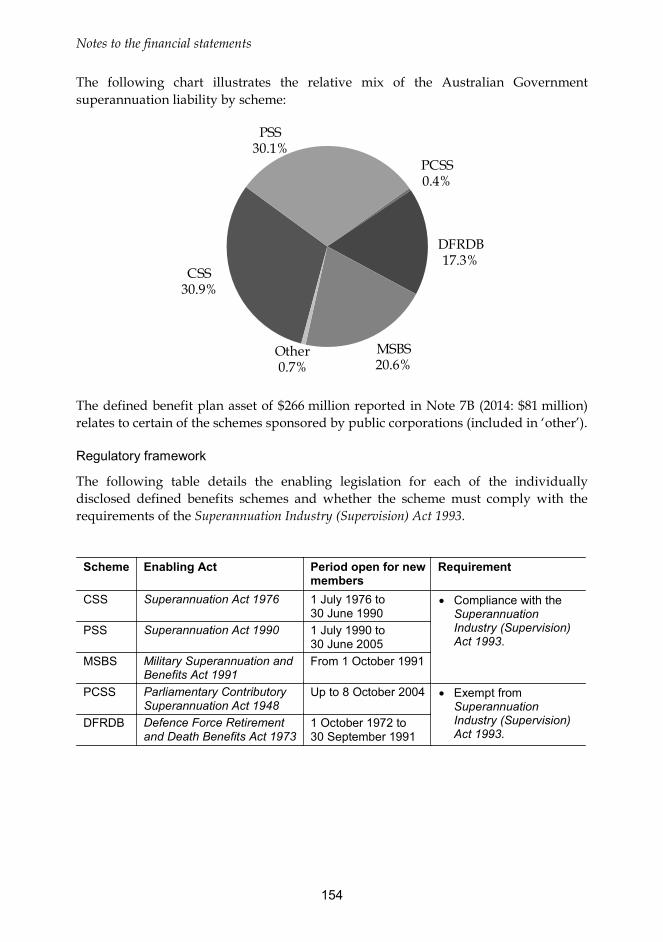
Notes to the financial statements
154
The following chart illustrates the relative mix of the Australian Government superannuation liability by scheme:
CSS30.9%
PSS30.1%
PCSS0.4%
DFRDB17.3%
MSBS20.6%
Other0.7%
The defined benefit plan asset of $266 million reported in Note 7B (2014: $81 million) relates to certain of the schemes sponsored by public corporations (included in ‘other’).
Regulatory framework
The following table details the enabling legislation for each of the individually disclosed defined benefits schemes and whether the scheme must comply with the requirements of the Superannuation Industry (Supervision) Act 1993.
Scheme Enabling Act Period open for new members
Requirement
CSS Superannuation Act 1976 1 July 1976 to 30 June 1990
• Compliance with the Superannuation Industry (Supervision) Act 1993.
PSS Superannuation Act 1990 1 July 1990 to 30 June 2005
MSBS Military Superannuation and Benefits Act 1991
From 1 October 1991
PCSS Parliamentary Contributory Superannuation Act 1948
Up to 8 October 2004 • Exempt from Superannuation Industry (Supervision) Act 1993.
DFRDB Defence Force Retirement and Death Benefits Act 1973
1 October 1972 to 30 September 1991
Notes to the financial statements
155
Funding arrangements
The funding arrangements for the various schemes are as follows:
Scheme Funding CSS Partially funded. Contributions generally comprise basic member contributions
and employer productivity (up to three per cent) contributions. Benefits are funded on an emerging cost basis.
PSS MSBS PCSS Unfunded. Member’s contributions are a fixed percentage of: parliamentary
allowance; salary for Ministers of State; and allowance by way of salary for office holders, which is paid into consolidated revenue. Benefits are funded on an emerging cost basis.
DFRDB Unfunded. DFRDB’s member’s contribution rate is 5.5% of the highest incremental salary for rank plus Service Allowance, which is paid into consolidated revenue. Benefits are funded on an emerging cost basis.
The remaining schemes are a combination of unfunded, partially funded and funded defined benefit schemes.
Entitlements
The nature of the benefits provided under the schemes are as follows:
Scheme Benefits paid CSS • Employer financed indexed pension defined by a set formula based on the
member’s age at retirement, years of contributory service and final superannuation salary. Indexation occurs twice yearly (January and July) in line with changes in the CPI.
• Member’s basic contributions, employer productivity contributions and interest can be taken as a lump sum or an additional non-indexed lifetime pension. This benefit is determined by the value of contributions and investment returns.
• Members who resign before age 55 can claim a preserved resignation benefit on or after reaching that age. In this case, the indexed pension is calculated by applying age-based factors to the amount of two and a half times the member’s accumulated basic member contributions and interest.
PSS • On retirement a lump sum benefit is payable based on the member’s length of contributory membership, their rate of member contributions and final average salary (average of a member’s superannuation salary on their last three birthdays).
• Members can convert 50 per cent or more of their lump sum to a lifetime indexed pension based on the member’s age, indexed twice yearly (January and July) in line with changes in the CPI.
• Where a member resigns before age 55, generally the member’s lump sum benefit at that time is crystallised with the funded component of the benefit accumulating with interest and the unfunded component accumulating with changes in the CPI, until the benefit becomes payable.
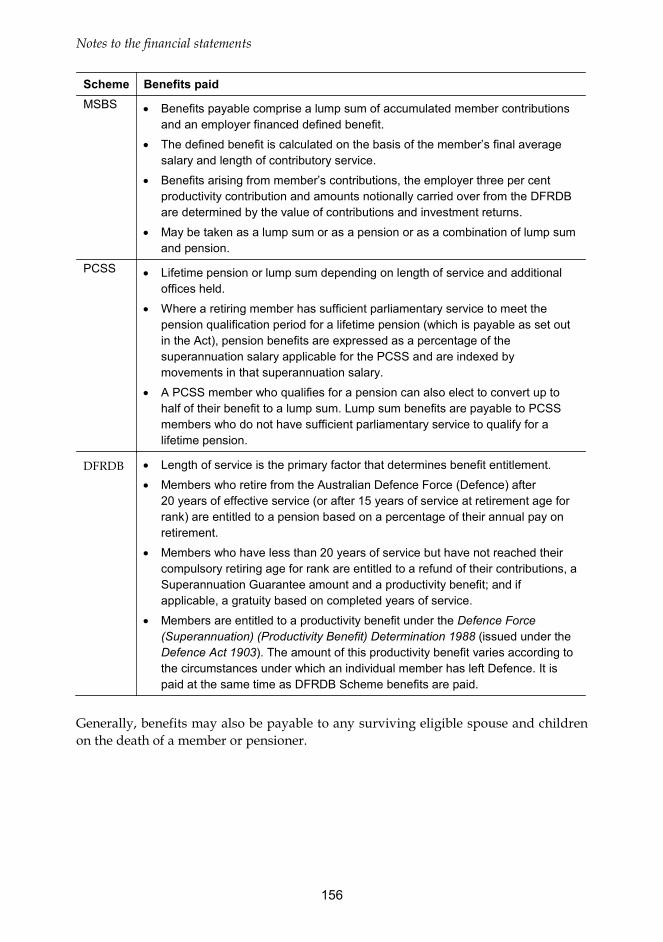
Notes to the financial statements
156
Scheme Benefits paid MSBS • Benefits payable comprise a lump sum of accumulated member contributions
and an employer financed defined benefit.
• The defined benefit is calculated on the basis of the member’s final average salary and length of contributory service.
• Benefits arising from member’s contributions, the employer three per cent productivity contribution and amounts notionally carried over from the DFRDB are determined by the value of contributions and investment returns.
• May be taken as a lump sum or as a pension or as a combination of lump sum and pension.
PCSS • Lifetime pension or lump sum depending on length of service and additional offices held.
• Where a retiring member has sufficient parliamentary service to meet the pension qualification period for a lifetime pension (which is payable as set out in the Act), pension benefits are expressed as a percentage of the superannuation salary applicable for the PCSS and are indexed by movements in that superannuation salary.
• A PCSS member who qualifies for a pension can also elect to convert up to half of their benefit to a lump sum. Lump sum benefits are payable to PCSS members who do not have sufficient parliamentary service to qualify for a lifetime pension.
DFRDB • Length of service is the primary factor that determines benefit entitlement.
• Members who retire from the Australian Defence Force (Defence) after 20 years of effective service (or after 15 years of service at retirement age for rank) are entitled to a pension based on a percentage of their annual pay on retirement.
• Members who have less than 20 years of service but have not reached their compulsory retiring age for rank are entitled to a refund of their contributions, a Superannuation Guarantee amount and a productivity benefit; and if applicable, a gratuity based on completed years of service.
• Members are entitled to a productivity benefit under the Defence Force (Superannuation) (Productivity Benefit) Determination 1988 (issued under the Defence Act 1903). The amount of this productivity benefit varies according to the circumstances under which an individual member has left Defence. It is paid at the same time as DFRDB Scheme benefits are paid.
Generally, benefits may also be payable to any surviving eligible spouse and children on the death of a member or pensioner.
Notes to the financial statements
157
Governance
Commonwealth Superannuation Corporation (CSC), was established under the Governance of Australian Government Superannuation Schemes Act 2011 and is the trustee for nine schemes, including the CSS, PSS, DFRDB and MSBS. CSC is responsible for:
• administration of each Scheme;
• management and investment of Scheme assets;
• compliance with superannuation and taxation laws and other applicable laws; and
• compliance with relevant legislation including the Governance of Australian Government Schemes Act 2011.
CSC is supported by an administrator, a custodian and other specialist providers.
The trustee for the PCSS is established by the enabling Act and comprises five trustees, being two Senators, two members of the House of Representatives and the Finance Minister. The Department of Finance acts as adviser to the Trust. The Finance Secretary also has certain powers under the Act in relation to administration of the PCSS.
The governance arrangements for the ‘other’ defined benefit superannuation schemes are detailed in the annual reports of the respective employing entities.
Risks
The Australian Government is exposed to risks such as interest rate risk, investment risk, longevity risk and salary risk. The following pages identify and explain the amounts reported in these financial statements and detail the principal actuarial assumptions underpinning each of the major schemes, including an analysis of the sensitivity of changes in these assumptions to the amounts reported in the financial statements.
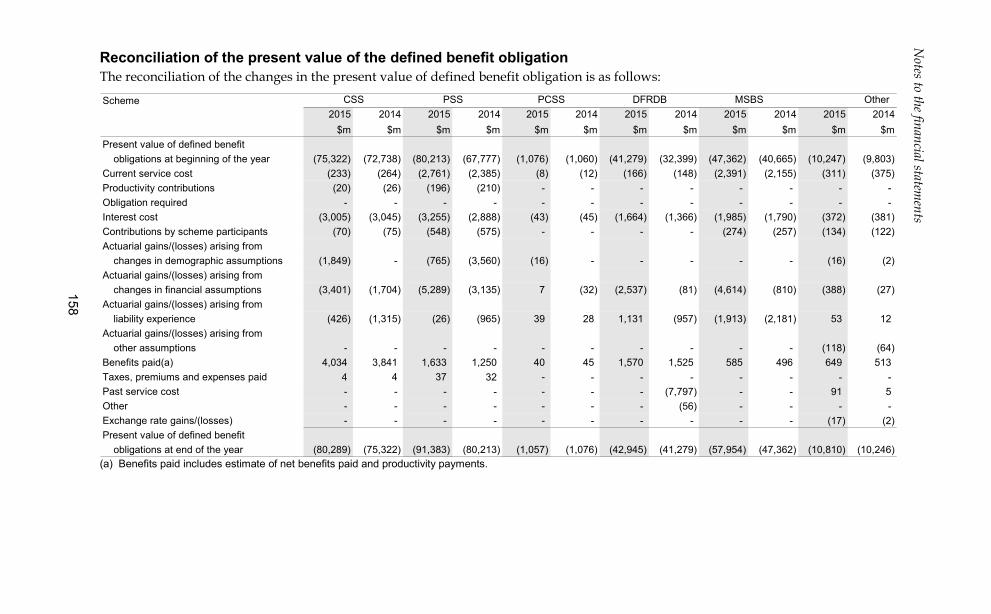
Notes to the financial statem
ents
158
Reconciliation of the present value of the defined benefit obligation The reconciliation of the changes in the present value of defined benefit obligation is as follows:
Scheme CSS PSS PCSS DFRDB MSBS Other2015 2014 2015 2014 2015 2014 2015 2014 2015 2014 2015 2014 $m $m $m $m $m $m $m $m $m $m $m $m
Present value of defined benefit obligations at beginning of the year (75,322) (72,738) (80,213) (67,777) (1,076) (1,060) (41,279) (32,399) (47,362) (40,665) (10,247) (9,803)
Current service cost (233) (264) (2,761) (2,385) (8) (12) (166) (148) (2,391) (2,155) (311) (375) Productivity contributions (20) (26) (196) (210) - - - - - - - - Obligation required - - - - - - - - - - - - Interest cost (3,005) (3,045) (3,255) (2,888) (43) (45) (1,664) (1,366) (1,985) (1,790) (372) (381) Contributions by scheme participants (70) (75) (548) (575) - - - - (274) (257) (134) (122) Actuarial gains/(losses) arising from
changes in demographic assumptions (1,849) - (765) (3,560) (16) - - - - - (16) (2) Actuarial gains/(losses) arising from
changes in financial assumptions (3,401) (1,704) (5,289) (3,135) 7 (32) (2,537) (81) (4,614) (810) (388) (27) Actuarial gains/(losses) arising from
liability experience (426) (1,315) (26) (965) 39 28 1,131 (957) (1,913) (2,181) 53 12 Actuarial gains/(losses) arising from
other assumptions - - - - - - - - - - (118) (64) Benefits paid(a) 4,034 3,841 1,633 1,250 40 45 1,570 1,525 585 496 649 513 Taxes, premiums and expenses paid 4 4 37 32 - - - - - - - - Past service cost - - - - - - - (7,797) - - 91 5 Other - - - - - - - (56) - - - - Exchange rate gains/(losses) - - - - - - - - - - (17) (2) Present value of defined benefit
obligations at end of the year (80,289) (75,322) (91,383) (80,213) (1,057) (1,076) (42,945) (41,279) (57,954) (47,362) (10,810) (10,246) (a) Benefits paid includes estimate of net benefits paid and productivity payments.
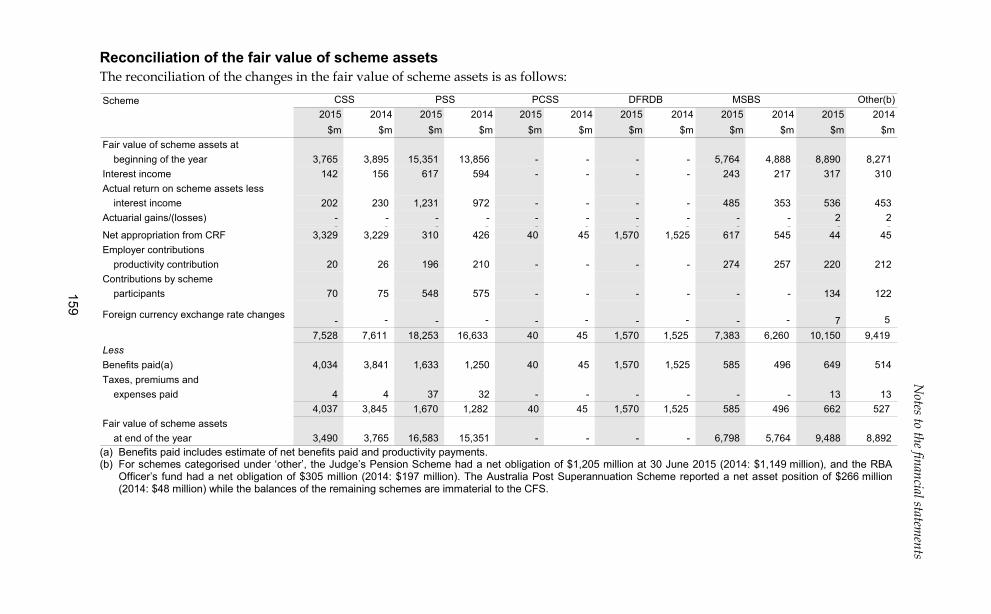
Notes to the financial statem
ents
159
Reconciliation of the fair value of scheme assets The reconciliation of the changes in the fair value of scheme assets is as follows:
Scheme CSS PSS PCSS DFRDB MSBS Other(b)2015 2014 2015 2014 2015 2014 2015 2014 2015 2014 2015 2014
$m $m $m $m $m $m $m $m $m $m $m $mFair value of scheme assets at
beginning of the year 3,765 3,895 15,351 13,856 - - - - 5,764 4,888 8,890 8,271 Interest income 142 156 617 594 - - - - 243 217 317 310 Actual return on scheme assets less
interest income 202 230 1,231 972 - - - - 485 353 536 453 Actuarial gains/(losses) - - - - - - - - - - 2 2
- - - - - - - - - - - - Net appropriation from CRF 3,329 3,229 310 426 40 45 1,570 1,525 617 545 44 45 Employer contributions
productivity contribution 20 26 196 210 - - - - 274 257 220 212 Contributions by scheme
participants 70 75 548 575 - - - - - - 134 122
Foreign currency exchange rate changes - - - - - - - - - - 7 5 7,528 7,611 18,253 16,633 40 45 1,570 1,525 7,383 6,260 10,150 9,419
LessBenefits paid(a) 4,034 3,841 1,633 1,250 40 45 1,570 1,525 585 496 649 514 Taxes, premiums and
expenses paid 4 4 37 32 - - - - - - 13 13 4,037 3,845 1,670 1,282 40 45 1,570 1,525 585 496 662 527
Fair value of scheme assetsat end of the year 3,490 3,765 16,583 15,351 - - - - 6,798 5,764 9,488 8,892
(a) Benefits paid includes estimate of net benefits paid and productivity payments. (b) For schemes categorised under ‘other’, the Judge’s Pension Scheme had a net obligation of $1,205 million at 30 June 2015 (2014: $1,149 million), and the RBA
Officer’s fund had a net obligation of $305 million (2014: $197 million). The Australia Post Superannuation Scheme reported a net asset position of $266 million (2014: $48 million) while the balances of the remaining schemes are immaterial to the CFS.
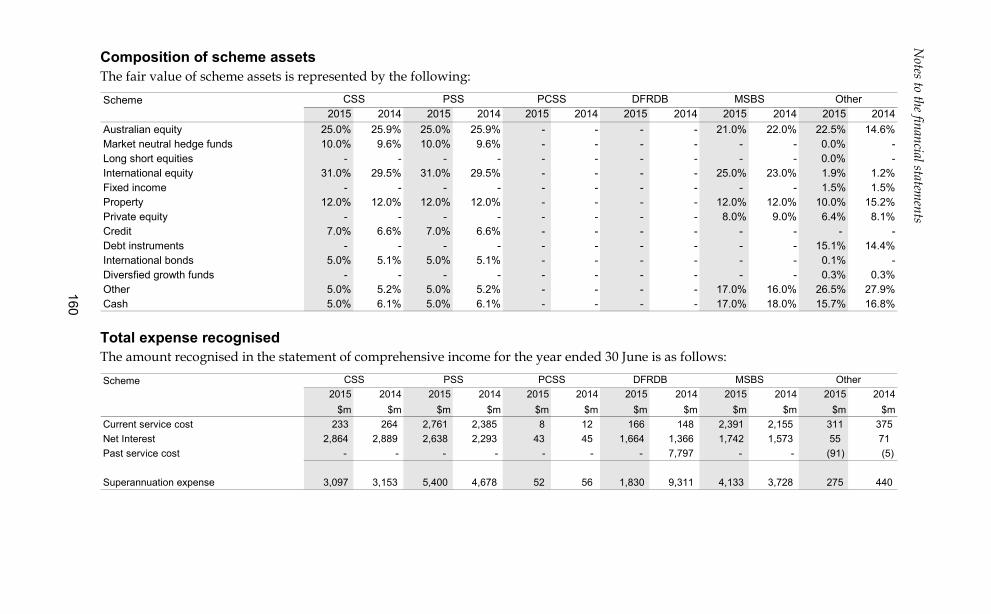
Notes to the financial statem
ents
160
Composition of scheme assets The fair value of scheme assets is represented by the following:
Scheme CSS PSS PCSS DFRDB MSBS Other2015 2014 2015 2014 2015 2014 2015 2014 2015 2014 2015 2014
Australian equity 25.0% 25.9% 25.0% 25.9% - - - - 21.0% 22.0% 22.5% 14.6%Market neutral hedge funds 10.0% 9.6% 10.0% 9.6% - - - - - - 0.0% - Long short equities - - - - - - - - - - 0.0% - International equity 31.0% 29.5% 31.0% 29.5% - - - - 25.0% 23.0% 1.9% 1.2%Fixed income - - - - - - - - - - 1.5% 1.5%Property 12.0% 12.0% 12.0% 12.0% - - - - 12.0% 12.0% 10.0% 15.2%Private equity - - - - - - - - 8.0% 9.0% 6.4% 8.1%Credit 7.0% 6.6% 7.0% 6.6% - - - - - - - - Debt instruments - - - - - - - - - - 15.1% 14.4%International bonds 5.0% 5.1% 5.0% 5.1% - - - - - - 0.1% - Diversfied growth funds - - - - - - - - - - 0.3% 0.3%Other 5.0% 5.2% 5.0% 5.2% - - - - 17.0% 16.0% 26.5% 27.9%Cash 5.0% 6.1% 5.0% 6.1% - - - - 17.0% 18.0% 15.7% 16.8% Total expense recognised The amount recognised in the statement of comprehensive income for the year ended 30 June is as follows:
Scheme CSS PSS PCSS DFRDB MSBS Other2015 2014 2015 2014 2015 2014 2015 2014 2015 2014 2015 2014 $m $m $m $m $m $m $m $m $m $m $m $m
Current service cost 233 264 2,761 2,385 8 12 166 148 2,391 2,155 311 375 Net Interest 2,864 2,889 2,638 2,293 43 45 1,664 1,366 1,742 1,573 55 71 Past service cost - - - - - - - 7,797 - - (91) (5)
Superannuation expense 3,097 3,153 5,400 4,678 52 56 1,830 9,311 4,133 3,728 275 440
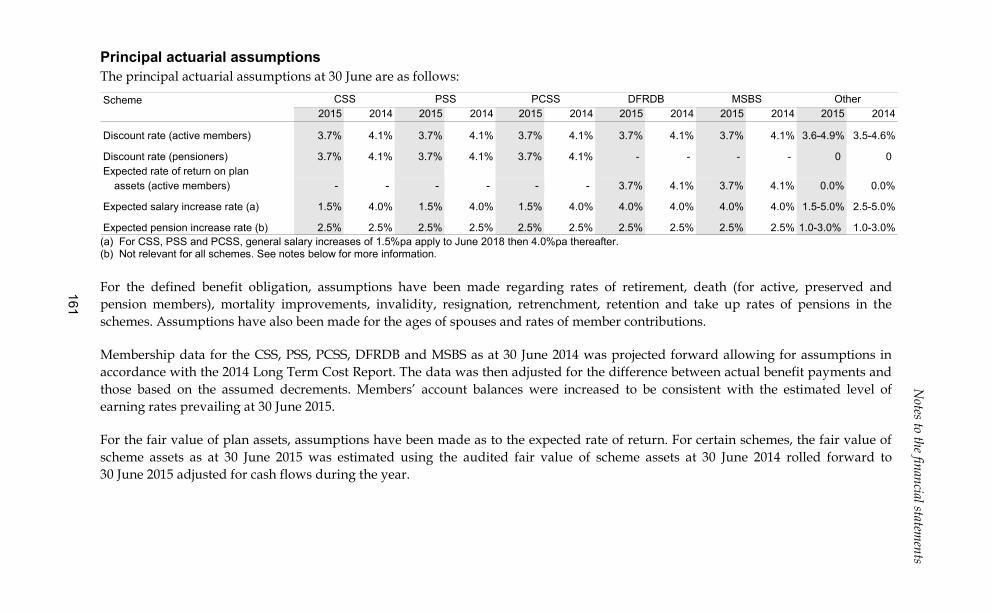
Notes to the financial statem
ents
161
Principal actuarial assumptions The principal actuarial assumptions at 30 June are as follows:
Scheme CSS PSS PCSS DFRDB MSBS Other2015 2014 2015 2014 2015 2014 2015 2014 2015 2014 2015 2014
Discount rate (active members) 3.7% 4.1% 3.7% 4.1% 3.7% 4.1% 3.7% 4.1% 3.7% 4.1% 3.6-4.9% 3.5-4.6%
Discount rate (pensioners) 3.7% 4.1% 3.7% 4.1% 3.7% 4.1% - - - - 0 0 Expected rate of return on plan
assets (active members) - - - - - - 3.7% 4.1% 3.7% 4.1% 0.0% 0.0%
Expected salary increase rate (a) 1.5% 4.0% 1.5% 4.0% 1.5% 4.0% 4.0% 4.0% 4.0% 4.0% 1.5-5.0% 2.5-5.0%
Expected pension increase rate (b) 2.5% 2.5% 2.5% 2.5% 2.5% 2.5% 2.5% 2.5% 2.5% 2.5% 1.0-3.0% 1.0-3.0% (a) For CSS, PSS and PCSS, general salary increases of 1.5%pa apply to June 2018 then 4.0%pa thereafter. (b) Not relevant for all schemes. See notes below for more information. For the defined benefit obligation, assumptions have been made regarding rates of retirement, death (for active, preserved and pension members), mortality improvements, invalidity, resignation, retrenchment, retention and take up rates of pensions in the schemes. Assumptions have also been made for the ages of spouses and rates of member contributions.
Membership data for the CSS, PSS, PCSS, DFRDB and MSBS as at 30 June 2014 was projected forward allowing for assumptions in accordance with the 2014 Long Term Cost Report. The data was then adjusted for the difference between actual benefit payments and those based on the assumed decrements. Members’ account balances were increased to be consistent with the estimated level of earning rates prevailing at 30 June 2015.
For the fair value of plan assets, assumptions have been made as to the expected rate of return. For certain schemes, the fair value of scheme assets as at 30 June 2015 was estimated using the audited fair value of scheme assets at 30 June 2014 rolled forward to 30 June 2015 adjusted for cash flows during the year.
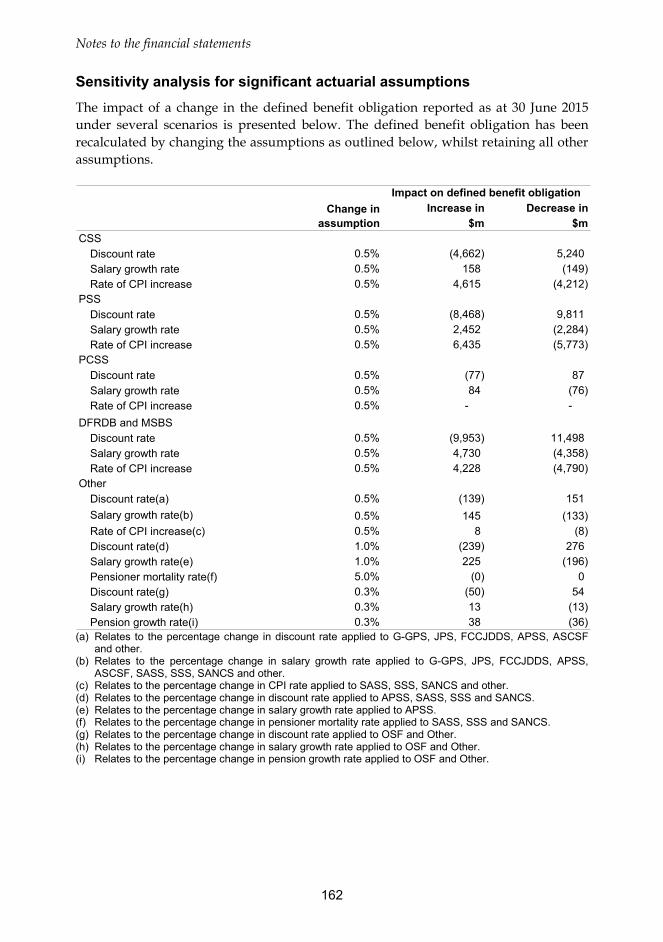
Notes to the financial statements
162
Sensitivity analysis for significant actuarial assumptions The impact of a change in the defined benefit obligation reported as at 30 June 2015 under several scenarios is presented below. The defined benefit obligation has been recalculated by changing the assumptions as outlined below, whilst retaining all other assumptions.
CSSDiscount rateSalary growth rateRate of CPI increase
PSSDiscount rateSalary growth rateRate of CPI increase
PCSSDiscount rateSalary growth rateRate of CPI increase
DFRDB and MSBSDiscount rateSalary growth rateRate of CPI increase
OtherDiscount rate(a)Salary growth rate(b)Rate of CPI increase(c)Discount rate(d)Salary growth rate(e)Pensioner mortality rate(f)Discount rate(g)Salary growth rate(h)Pension growth rate(i)
0.5% 158 (149) 0.5% 4,615 (4,212)
0.5% (9,953) 11,498
0.5% (8,468) 9,811
$m $mChange in
assumption
(77) 87
8
(4,358) 4,228 (4,790)
Impact on defined benefit obligationIncrease in Decrease in
4,730
0.5% (4,662) 5,240
(133)
0.5%
0.5%
0.5% 2,452 (2,284) 0.5% 6,435 (5,773)
84 (76) - -
0.5%0.5%
0.5%
0.3% 38 (36)
0.3% (50) 54 0.3% 13 (13)
151
(8) 0.5%
5.0% (0) 0
1.0% (239) 276
0.5% (139)
1.0% 225 (196)
0.5% 145
(a) Relates to the percentage change in discount rate applied to G-GPS, JPS, FCCJDDS, APSS, ASCSF
and other. (b) Relates to the percentage change in salary growth rate applied to G-GPS, JPS, FCCJDDS, APSS,
ASCSF, SASS, SSS, SANCS and other. (c) Relates to the percentage change in CPI rate applied to SASS, SSS, SANCS and other. (d) Relates to the percentage change in discount rate applied to APSS, SASS, SSS and SANCS. (e) Relates to the percentage change in salary growth rate applied to APSS. (f) Relates to the percentage change in pensioner mortality rate applied to SASS, SSS and SANCS. (g) Relates to the percentage change in discount rate applied to OSF and Other. (h) Relates to the percentage change in salary growth rate applied to OSF and Other. (i) Relates to the percentage change in pension growth rate applied to OSF and Other.
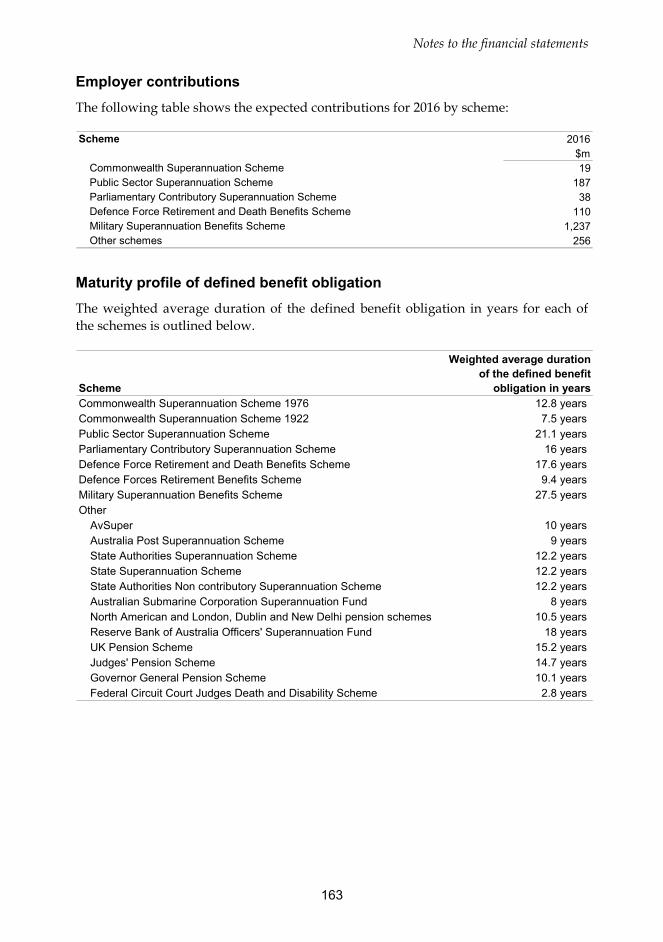
Notes to the financial statements
163
Employer contributions The following table shows the expected contributions for 2016 by scheme:
Scheme 2016$m
Commonwealth Superannuation Scheme 19 Public Sector Superannuation Scheme 187 Parliamentary Contributory Superannuation Scheme 38 Defence Force Retirement and Death Benefits Scheme 110 Military Superannuation Benefits Scheme 1,237 Other schemes 256
Maturity profile of defined benefit obligation The weighted average duration of the defined benefit obligation in years for each of the schemes is outlined below.
SchemeCommonwealth Superannuation Scheme 1976 12.8 yearsCommonwealth Superannuation Scheme 1922 7.5 yearsPublic Sector Superannuation Scheme 21.1 yearsParliamentary Contributory Superannuation Scheme 16 yearsDefence Force Retirement and Death Benefits Scheme 17.6 yearsDefence Forces Retirement Benefits Scheme 9.4 yearsMilitary Superannuation Benefits Scheme 27.5 yearsOther
AvSuper 10 yearsAustralia Post Superannuation Scheme 9 yearsState Authorities Superannuation Scheme 12.2 yearsState Superannuation Scheme 12.2 yearsState Authorities Non contributory Superannuation Scheme 12.2 yearsAustralian Submarine Corporation Superannuation Fund 8 yearsNorth American and London, Dublin and New Delhi pension schemes 10.5 yearsReserve Bank of Australia Officers' Superannuation Fund 18 yearsUK Pension Scheme 15.2 yearsJudges' Pension Scheme 14.7 yearsGovernor General Pension Scheme 10.1 yearsFederal Circuit Court Judges Death and Disability Scheme 2.8 years
Weighted average duration of the defined benefit
obligation in years
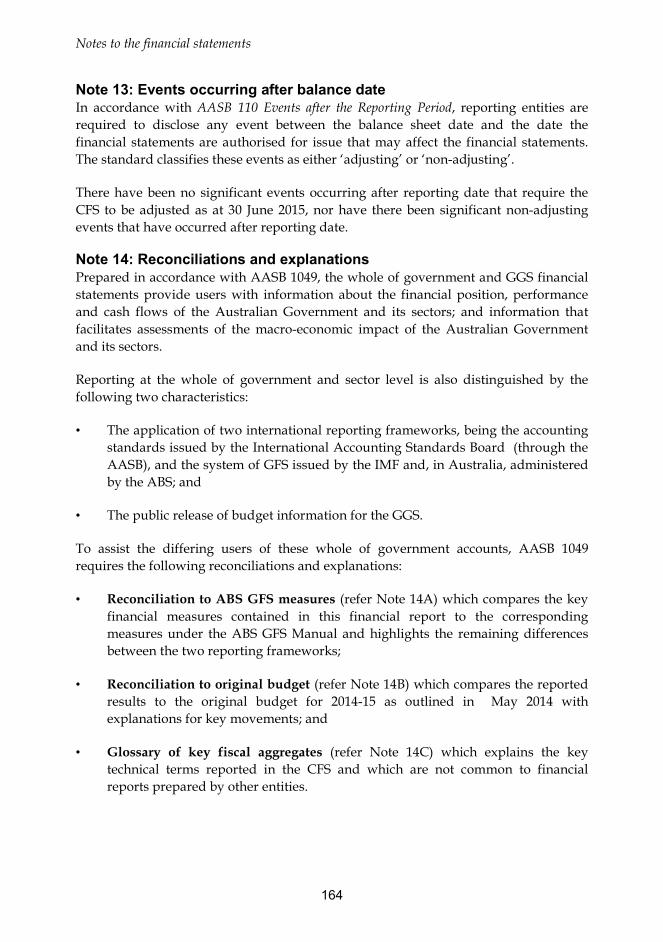
Notes to the financial statements
164
Note 13: Events occurring after balance date In accordance with AASB 110 Events after the Reporting Period, reporting entities are required to disclose any event between the balance sheet date and the date the financial statements are authorised for issue that may affect the financial statements. The standard classifies these events as either ‘adjusting’ or ‘non-adjusting’.
There have been no significant events occurring after reporting date that require the CFS to be adjusted as at 30 June 2015, nor have there been significant non-adjusting events that have occurred after reporting date.
Note 14: Reconciliations and explanations Prepared in accordance with AASB 1049, the whole of government and GGS financial statements provide users with information about the financial position, performance and cash flows of the Australian Government and its sectors; and information that facilitates assessments of the macro-economic impact of the Australian Government and its sectors.
Reporting at the whole of government and sector level is also distinguished by the following two characteristics:
• The application of two international reporting frameworks, being the accounting standards issued by the International Accounting Standards Board (through the AASB), and the system of GFS issued by the IMF and, in Australia, administered by the ABS; and
• The public release of budget information for the GGS.
To assist the differing users of these whole of government accounts, AASB 1049 requires the following reconciliations and explanations:
• Reconciliation to ABS GFS measures (refer Note 14A) which compares the key financial measures contained in this financial report to the corresponding measures under the ABS GFS Manual and highlights the remaining differences between the two reporting frameworks;
• Reconciliation to original budget (refer Note 14B) which compares the reported results to the original budget for 2014-15 as outlined in May 2014 with explanations for key movements; and
• Glossary of key fiscal aggregates (refer Note 14C) which explains the key technical terms reported in the CFS and which are not common to financial reports prepared by other entities.
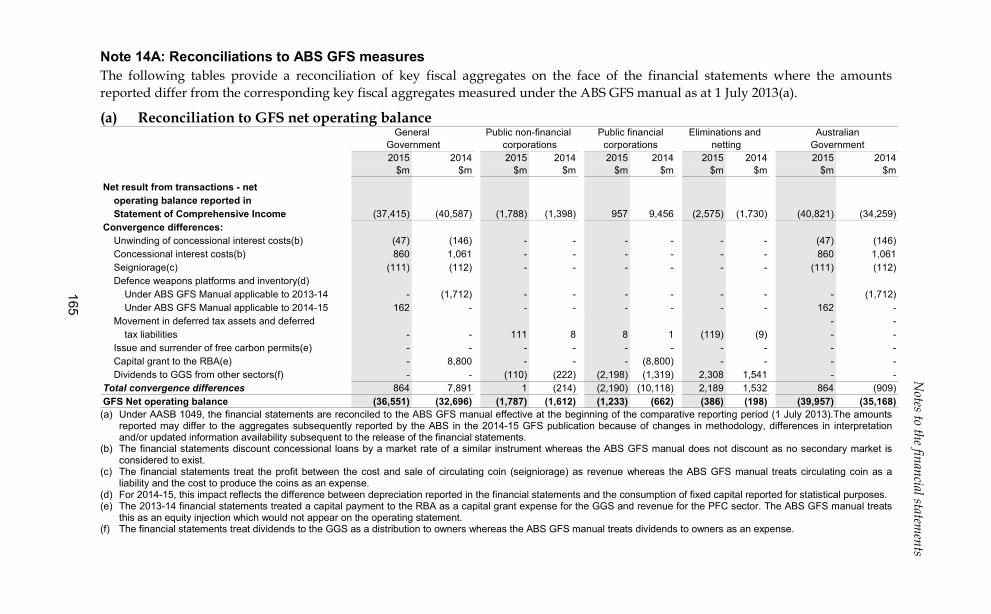
Notes to the financial statem
ents
165
Note 14A: Reconciliations to ABS GFS measures The following tables provide a reconciliation of key fiscal aggregates on the face of the financial statements where the amounts reported differ from the corresponding key fiscal aggregates measured under the ABS GFS manual as at 1 July 2013(a).
(a) Reconciliation to GFS net operating balance
2015 2014 2015 2014 2015 2014 2015 2014 2015 2014$m $m $m $m $m $m $m $m $m $m
Net result from transactions - netoperating balance reported in Statement of Comprehensive Income (37,415) (40,587) (1,788) (1,398) 957 9,456 (2,575) (1,730) (40,821) (34,259)
Convergence differences:Unwinding of concessional interest costs(b) (47) (146) - - - - - - (47) (146)Concessional interest costs(b) 860 1,061 - - - - - - 860 1,061Seigniorage(c) (111) (112) - - - - - - (111) (112)Defence weapons platforms and inventory(d)
Under ABS GFS Manual applicable to 2013-14 - (1,712) - - - - - - - (1,712)Under ABS GFS Manual applicable to 2014-15 162 - - - - - - - 162 -
Movement in deferred tax assets and deferred - -tax liabilities - - 111 8 8 1 (119) (9) - -
Issue and surrender of free carbon permits(e) - - - - - - - - - -Capital grant to the RBA(e) - 8,800 - - - (8,800) - - - -Dividends to GGS from other sectors(f) - - (110) (222) (2,198) (1,319) 2,308 1,541 - -
Total convergence differences 864 7,891 1 (214) (2,190) (10,118) 2,189 1,532 864 (909)GFS Net operating balance (36,551) (32,696) (1,787) (1,612) (1,233) (662) (386) (198) (39,957) (35,168)
Government corporations corporations netting GovernmentGeneral Public non-financial Public financial Eliminations and Australian
(a) Under AASB 1049, the financial statements are reconciled to the ABS GFS manual effective at the beginning of the comparative reporting period (1 July 2013).The amounts
reported may differ to the aggregates subsequently reported by the ABS in the 2014-15 GFS publication because of changes in methodology, differences in interpretation and/or updated information availability subsequent to the release of the financial statements.
(b) The financial statements discount concessional loans by a market rate of a similar instrument whereas the ABS GFS manual does not discount as no secondary market is considered to exist.
(c) The financial statements treat the profit between the cost and sale of circulating coin (seigniorage) as revenue whereas the ABS GFS manual treats circulating coin as a liability and the cost to produce the coins as an expense.
(d) For 2014-15, this impact reflects the difference between depreciation reported in the financial statements and the consumption of fixed capital reported for statistical purposes. (e) The 2013-14 financial statements treated a capital payment to the RBA as a capital grant expense for the GGS and revenue for the PFC sector. The ABS GFS manual treats
this as an equity injection which would not appear on the operating statement. (f) The financial statements treat dividends to the GGS as a distribution to owners whereas the ABS GFS manual treats dividends to owners as an expense.
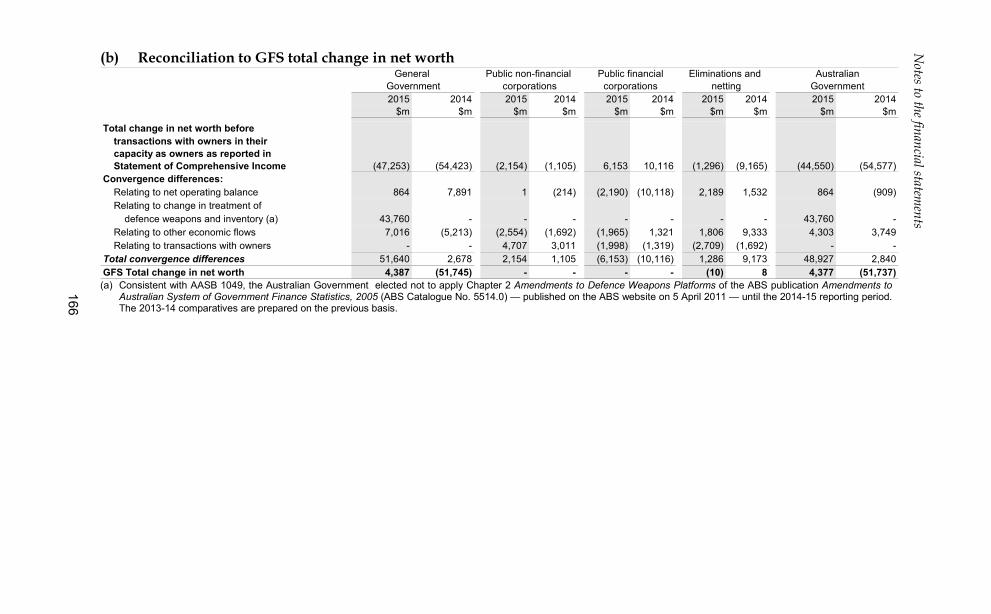
Notes to the financial statem
ents
166
(b) Reconciliation to GFS total change in net worth
2015 2014 2015 2014 2015 2014 2015 2014 2015 2014$m $m $m $m $m $m $m $m $m $m
Total change in net worth before transactions with owners in their capacity as owners as reported in Statement of Comprehensive Income (47,253) (54,423) (2,154) (1,105) 6,153 10,116 (1,296) (9,165) (44,550) (54,577)
Convergence differences:Relating to net operating balance 864 7,891 1 (214) (2,190) (10,118) 2,189 1,532 864 (909)Relating to change in treatment of
defence weapons and inventory (a) 43,760 - - - - - - - 43,760 -Relating to other economic flows 7,016 (5,213) (2,554) (1,692) (1,965) 1,321 1,806 9,333 4,303 3,749Relating to transactions with owners - - 4,707 3,011 (1,998) (1,319) (2,709) (1,692) - -
Total convergence differences 51,640 2,678 2,154 1,105 (6,153) (10,116) 1,286 9,173 48,927 2,840GFS Total change in net worth 4,387 (51,745) - - - - (10) 8 4,377 (51,737)
General Public non-financial Public financial Eliminations and AustralianGovernment corporations corporations netting Government
(a) Consistent with AASB 1049, the Australian Government elected not to apply Chapter 2 Amendments to Defence Weapons Platforms of the ABS publication Amendments to
Australian System of Government Finance Statistics, 2005 (ABS Catalogue No. 5514.0) — published on the ABS website on 5 April 2011 — until the 2014-15 reporting period. The 2013-14 comparatives are prepared on the previous basis.
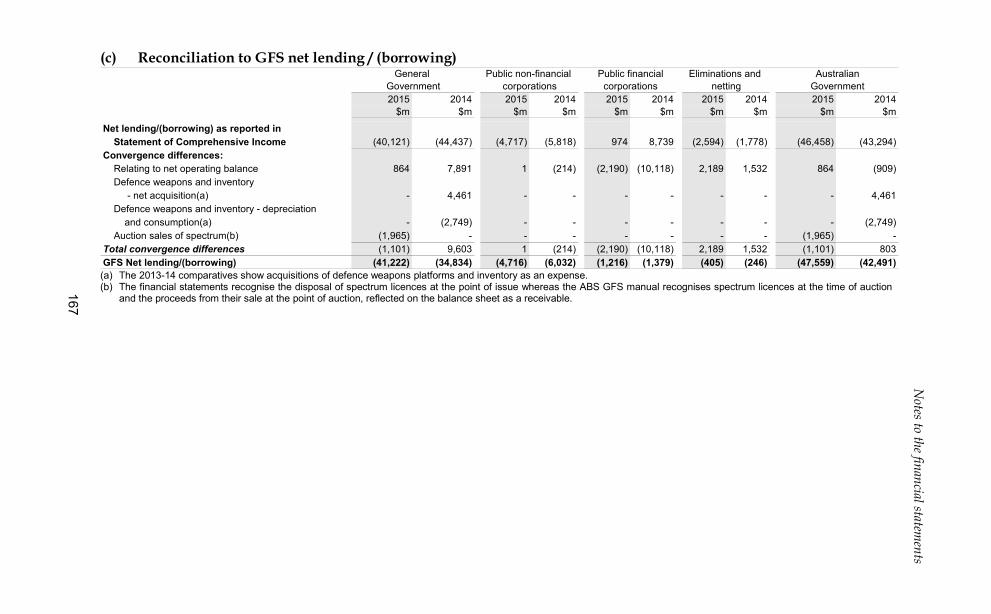
Notes to the financial statem
ents
167
(c) Reconciliation to GFS net lending / (borrowing)
2015 2014 2015 2014 2015 2014 2015 2014 2015 2014$m $m $m $m $m $m $m $m $m $m
Net lending/(borrowing) as reported in Statement of Comprehensive Income (40,121) (44,437) (4,717) (5,818) 974 8,739 (2,594) (1,778) (46,458) (43,294)
Convergence differences:Relating to net operating balance 864 7,891 1 (214) (2,190) (10,118) 2,189 1,532 864 (909)Defence weapons and inventory
- net acquisition(a) - 4,461 - - - - - - - 4,461Defence weapons and inventory - depreciation
and consumption(a) - (2,749) - - - - - - - (2,749)Auction sales of spectrum(b) (1,965) - - - - - - - (1,965) -
Total convergence differences (1,101) 9,603 1 (214) (2,190) (10,118) 2,189 1,532 (1,101) 803GFS Net lending/(borrowing) (41,222) (34,834) (4,716) (6,032) (1,216) (1,379) (405) (246) (47,559) (42,491)
General Public non-financial Public financial Eliminations and AustralianGovernment corporations corporations netting Government
(a) The 2013-14 comparatives show acquisitions of defence weapons platforms and inventory as an expense. (b) The financial statements recognise the disposal of spectrum licences at the point of issue whereas the ABS GFS manual recognises spectrum licences at the time of auction
and the proceeds from their sale at the point of auction, reflected on the balance sheet as a receivable.
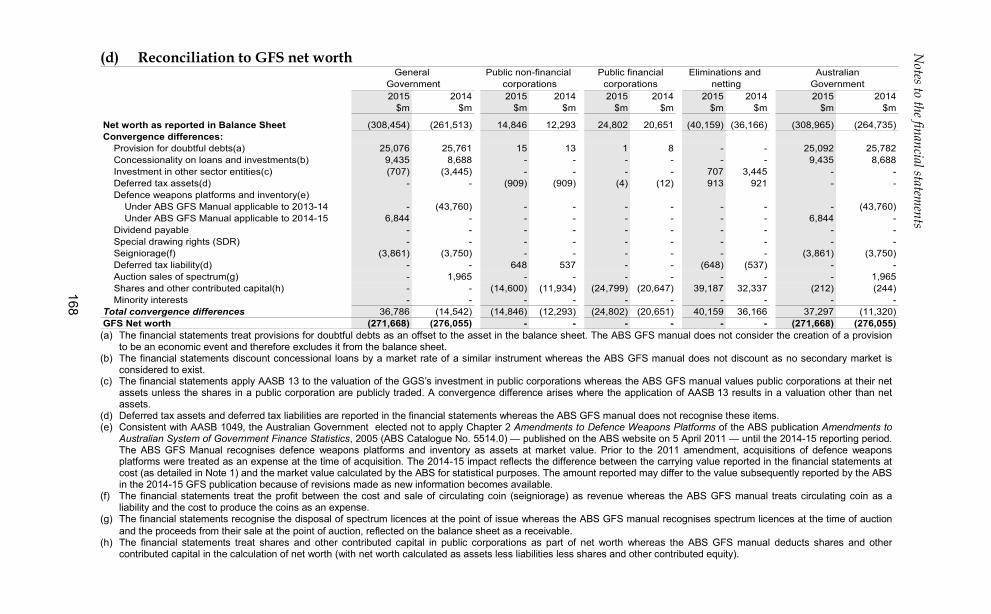
Notes to the financial statem
ents
168
(d) Reconciliation to GFS net worth
2015 2014 2015 2014 2015 2014 2015 2014 2015 2014$m $m $m $m $m $m $m $m $m $m
Net worth as reported in Balance Sheet (308,454) (261,513) 14,846 12,293 24,802 20,651 (40,159) (36,166) (308,965) (264,735)Convergence differences:
Provision for doubtful debts(a) 25,076 25,761 15 13 1 8 - - 25,092 25,782Concessionality on loans and investments(b) 9,435 8,688 - - - - - - 9,435 8,688Investment in other sector entities(c) (707) (3,445) - - - - 707 3,445 - -Deferred tax assets(d) - - (909) (909) (4) (12) 913 921 - -Defence weapons platforms and inventory(e)
Under ABS GFS Manual applicable to 2013-14 - (43,760) - - - - - - - (43,760)Under ABS GFS Manual applicable to 2014-15 6,844 - - - - - - - 6,844 -
Dividend payable - - - - - - - - - -Special drawing rights (SDR) - - - - - - - - - -Seigniorage(f) (3,861) (3,750) - - - - - - (3,861) (3,750)Deferred tax liability(d) - - 648 537 - - (648) (537) - -Auction sales of spectrum(g) - 1,965 - - - - - - - 1,965Shares and other contributed capital(h) - - (14,600) (11,934) (24,799) (20,647) 39,187 32,337 (212) (244)Minority interests - - - - - - - - - -
Total convergence differences 36,786 (14,542) (14,846) (12,293) (24,802) (20,651) 40,159 36,166 37,297 (11,320)GFS Net worth (271,668) (276,055) - - - - - - (271,668) (276,055)
General Public non-financial Public financial Eliminations and AustralianGovernment corporations corporations netting Government
(a) The financial statements treat provisions for doubtful debts as an offset to the asset in the balance sheet. The ABS GFS manual does not consider the creation of a provision
to be an economic event and therefore excludes it from the balance sheet. (b) The financial statements discount concessional loans by a market rate of a similar instrument whereas the ABS GFS manual does not discount as no secondary market is
considered to exist. (c) The financial statements apply AASB 13 to the valuation of the GGS’s investment in public corporations whereas the ABS GFS manual values public corporations at their net
assets unless the shares in a public corporation are publicly traded. A convergence difference arises where the application of AASB 13 results in a valuation other than net assets.
(d) Deferred tax assets and deferred tax liabilities are reported in the financial statements whereas the ABS GFS manual does not recognise these items. (e) Consistent with AASB 1049, the Australian Government elected not to apply Chapter 2 Amendments to Defence Weapons Platforms of the ABS publication Amendments to
Australian System of Government Finance Statistics, 2005 (ABS Catalogue No. 5514.0) — published on the ABS website on 5 April 2011 — until the 2014-15 reporting period. The ABS GFS Manual recognises defence weapons platforms and inventory as assets at market value. Prior to the 2011 amendment, acquisitions of defence weapons platforms were treated as an expense at the time of acquisition. The 2014-15 impact reflects the difference between the carrying value reported in the financial statements at cost (as detailed in Note 1) and the market value calculated by the ABS for statistical purposes. The amount reported may differ to the value subsequently reported by the ABS in the 2014-15 GFS publication because of revisions made as new information becomes available.
(f) The financial statements treat the profit between the cost and sale of circulating coin (seigniorage) as revenue whereas the ABS GFS manual treats circulating coin as a liability and the cost to produce the coins as an expense.
(g) The financial statements recognise the disposal of spectrum licences at the point of issue whereas the ABS GFS manual recognises spectrum licences at the time of auction and the proceeds from their sale at the point of auction, reflected on the balance sheet as a receivable.
(h) The financial statements treat shares and other contributed capital in public corporations as part of net worth whereas the ABS GFS manual deducts shares and other contributed capital in the calculation of net worth (with net worth calculated as assets less liabilities less shares and other contributed equity).
Notes to the financial statements
169
The ABS GFS manual measures inventory at market value (rather than the lower of cost and net realisable value). It also does not recognise the provision for decommissioning/restoration costs. The above reconciliation has not been adjusted for these items on the basis of materiality and information availability.
Reconciliation to GFS cash surplus/(deficit) is disclosed on the face of the cash flow statement.
Note 14B: Reconciliation to original budget
The following tables provide a comparison of the original 2014-15 Budget to the final actual results for the GGS. Explanations are provided for major variances, which are typically those amounts greater than $1 billion.
The Australian Government does not present budgets at the whole of government level, and therefore, only the GGS is presented in this note. The Budget is not audited.
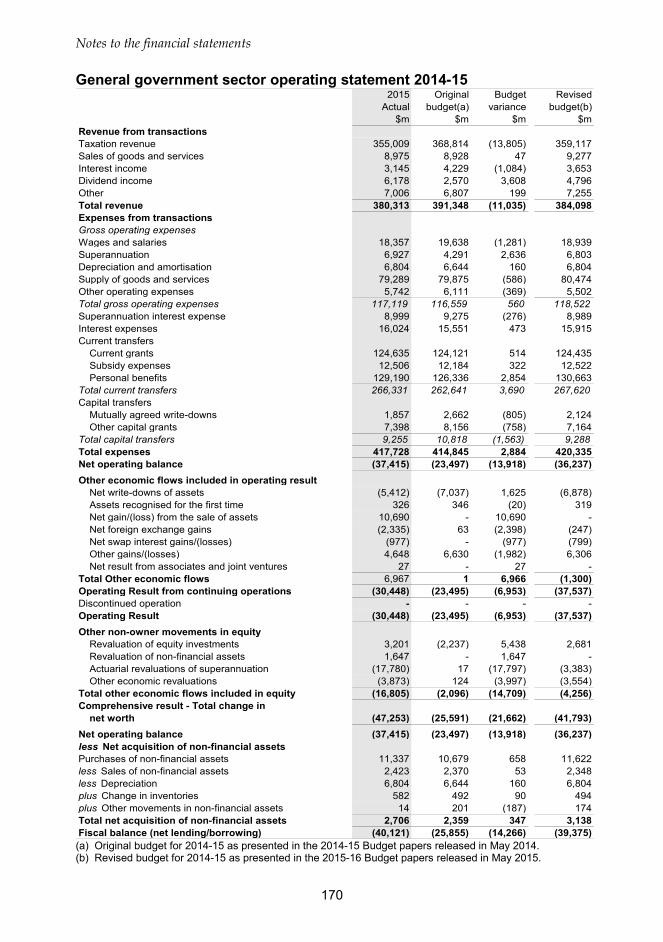
Notes to the financial statements
170
General government sector operating statement 2014-15 2015 Original Budget Revised
Actual budget(a) variance budget(b)$m $m $m $m
Revenue from transactionsTaxation revenue 355,009 368,814 (13,805) 359,117Sales of goods and services 8,975 8,928 47 9,277Interest income 3,145 4,229 (1,084) 3,653Dividend income 6,178 2,570 3,608 4,796Other 7,006 6,807 199 7,255Total revenue 380,313 391,348 (11,035) 384,098Expenses from transactionsGross operating expensesWages and salaries 18,357 19,638 (1,281) 18,939Superannuation 6,927 4,291 2,636 6,803Depreciation and amortisation 6,804 6,644 160 6,804Supply of goods and services 79,289 79,875 (586) 80,474Other operating expenses 5,742 6,111 (369) 5,502Total gross operating expenses 117,119 116,559 560 118,522Superannuation interest expense 8,999 9,275 (276) 8,989Interest expenses 16,024 15,551 473 15,915Current transfers
Current grants 124,635 124,121 514 124,435Subsidy expenses 12,506 12,184 322 12,522Personal benefits 129,190 126,336 2,854 130,663
Total current transfers 266,331 262,641 3,690 267,620Capital transfers
Mutually agreed write-downs 1,857 2,662 (805) 2,124Other capital grants 7,398 8,156 (758) 7,164
Total capital transfers 9,255 10,818 (1,563) 9,288Total expenses 417,728 414,845 2,884 420,335Net operating balance (37,415) (23,497) (13,918) (36,237)Other economic flows included in operating result
Net write-downs of assets (5,412) (7,037) 1,625 (6,878)Assets recognised for the first time 326 346 (20) 319Net gain/(loss) from the sale of assets 10,690 - 10,690 -Net foreign exchange gains (2,335) 63 (2,398) (247)Net swap interest gains/(losses) (977) - (977) (799)Other gains/(losses) 4,648 6,630 (1,982) 6,306Net result from associates and joint ventures 27 - 27 -
Total Other economic flows 6,967 1 6,966 (1,300)Operating Result from continuing operations (30,448) (23,495) (6,953) (37,537)Discontinued operation - - - -Operating Result (30,448) (23,495) (6,953) (37,537)Other non-owner movements in equity
Revaluation of equity investments 3,201 (2,237) 5,438 2,681Revaluation of non-financial assets 1,647 - 1,647 -Actuarial revaluations of superannuation (17,780) 17 (17,797) (3,383)Other economic revaluations (3,873) 124 (3,997) (3,554)
Total other economic flows included in equity (16,805) (2,096) (14,709) (4,256)Comprehensive result - Total change in
net worth (47,253) (25,591) (21,662) (41,793)Net operating balance (37,415) (23,497) (13,918) (36,237)less Net acquisition of non-financial assetsPurchases of non-financial assets 11,337 10,679 658 11,622less Sales of non-financial assets 2,423 2,370 53 2,348less Depreciation 6,804 6,644 160 6,804plus Change in inventories 582 492 90 494plus Other movements in non-financial assets 14 201 (187) 174Total net acquisition of non-financial assets 2,706 2,359 347 3,138Fiscal balance (net lending/borrowing) (40,121) (25,855) (14,266) (39,375) (a) Original budget for 2014-15 as presented in the 2014-15 Budget papers released in May 2014. (b) Revised budget for 2014-15 as presented in the 2015-16 Budget papers released in May 2015.
Notes to the financial statements
171
Fiscal balance
The fiscal balance for the 2014-15 financial year was a deficit of $40.1 billion, representing a movement of $14.3 billion on the original budget deficit of $25.9 billion.
Revenue
Total revenue for 2014-15 was $380.3 billion, $11.0 billion (2.8 per cent) lower than the original budget of $391.3 billion.
Total taxation revenue was $355.0 billion, $13.8 billion lower than the original budget of $368.8 billion. Key drivers included:
• lower company tax of $7.3 billion, reflecting weaker than expected growth in corporate profitability and commodity prices;
• lower excise duty of $2.8 billion, partially offset by higher customs duty of $1.6 billion due to:
– faster than expected movement of tobacco products offshore, primarily as a result of a major tobacco manufacturer shifting production overseas;
– lower petrol prices and weaker than expected demand for diesel; and
– an increase in import volumes for textiles, clothing and footwear and higher demand for imported building related materials impacting customs duty only.
• lower individuals and other withholding taxes of $2.4 billion, consistent with weaker than expected growth in wages and salaries; and
• lower superannuation fund tax of $2.0 billion, consistent with lower than expected taxable contributions and earnings.
Total non-taxation revenue was $25.3 billion, $2.8 billion higher than the original budget of $22.5 billion. Higher dividend income ($3.6 billion) was the key driver for this movement, primarily due to the higher than expected RBA dividend accrued in 2014-15. This was attributable to changes in exchange rates for the year, which resulted in higher earnings for the RBA. The investment portfolio held by the Future Fund1 for 2014-15 returned higher dividends of $1.7 billion and lower interest income of $0.7 billion compared to the Budget.
Expenses
Total expenses for 2014-15 were $417.7 billion, $2.9 billion (0.7 per cent) higher than the original budget of $414.8 billion.
1 It is difficult to accurately predict the financial outcome of the investment activities undertaken by the Future Fund due to the volatile nature of investment markets. Further information on variances relating to Future Fund activities can be found in the Future Fund’s 2014-15 financial statements available at: www.futurefund.gov.au/annual_reports.
Notes to the financial statements
172
Total gross operating expenses were $117.1 billion, $0.5 billion higher than the original budget of $116.6 billion. Key drivers included:
• higher superannuation expense of $2.6 billion, mainly due to the different interest rates used in calculating the budget and actuals figures for civilian schemes and an actuarial change to the pension indexation rate from 2.5 per cent to 4 per cent in 2013-14 for military schemes; and
• lower wages and salaries expense of $1.3 billion, in relation to a number of entities, with the largest movements relating to Defence due to lower staff numbers and the Australian Taxation Office (ATO) staffing reductions.
Total current and capital transfers were $275.6 billion, $2.1 billion higher than the original budget of $273.5 billion. Key drivers included:
• higher personal benefit expenses of $2.9 billion, mainly relating to:
– higher childcare benefit and rebate expenditure ($1.7 billion), reflecting a greater than expected number of people utilising child care services, both in terms of children in childcare and hours claimed, as well as higher than expected fees;
– higher Family Tax Benefit expenditure ($1.6 billion), as a result of lower than expected wage growth, which drove up average payment rates and recipient numbers, and delays in the passage of legislation for the A New Tax System (Family Assistance)(Administration) Act 1999; and
– lower paid parental leave expenditure ($1.2 billion), as a result of the Government’s decision in the 2015-16 budget not to proceed with the scheme.
• lower mutually agreed write-downs of $0.8 billion, primarily as a result of a number of corporate groups entering into settlement agreements with the ATO, reducing the bad and doubtful debt provision.
Other economic flows
Net losses from other economic flows included in operating result and equity were $9.8 billion, $7.7 billion higher than the original budget net loss of $2.1 billion. Key drivers included:
• lower revaluation of superannuation liabilities of $17.8 billion, primarily as a result of the change in the discount rate which is tied to the government bond rate (the budget does not estimate changes in discount rates in the estimation of the superannuation liability);
• net gains from the sale of assets of $10.7 billion, primarily attributable to the Future Fund gain on the sale of investments ($6.9 billion) and the gain from the sale of Medibank ($1.6 billion) not included in the original budget;
• higher net market revaluation losses of debt of $7.9 billion, primarily due to much lower interest rates at the end of the year than at original budget;
Notes to the financial statements
173
• higher revaluation of equity of $5.4 billion relating to investments in controlled entities and companies such as the RBA, Clean Energy Finance Corporation and Australian Reinsurance Pool Corporation for which revaluations are not included in the original budget;
• lower other economic revaluations of $4.0 billion relating to forecasts included in the original budget that did not occur;
• net foreign exchange losses of $2.4 billion primarily relating to the investment portfolio held by the Future Fund for which gains/(losses) are not included in the original budget; and
• other gains/losses of $2.0 billion, primarily attributable to the $1.2 billion write-back to the Higher Education Superannuation programme liability following agreement with the NSW Government that NSW will resume making payments to NSW universities’ superannuation expenses to meet its share.
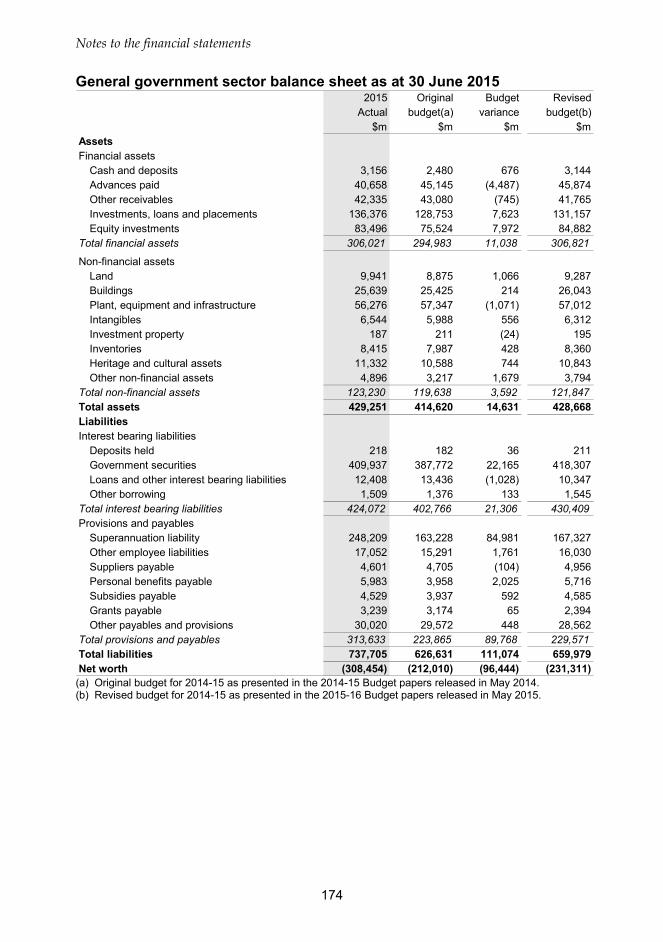
Notes to the financial statements
174
General government sector balance sheet as at 30 June 2015 2015 Original Budget Revised
Actual budget(a) variance budget(b)$m $m $m $m
AssetsFinancial assets
Cash and deposits 3,156 2,480 676 3,144Advances paid 40,658 45,145 (4,487) 45,874Other receivables 42,335 43,080 (745) 41,765Investments, loans and placements 136,376 128,753 7,623 131,157Equity investments 83,496 75,524 7,972 84,882
Total financial assets 306,021 294,983 11,038 306,821
Non-financial assetsLand 9,941 8,875 1,066 9,287Buildings 25,639 25,425 214 26,043Plant, equipment and infrastructure 56,276 57,347 (1,071) 57,012Intangibles 6,544 5,988 556 6,312Investment property 187 211 (24) 195Inventories 8,415 7,987 428 8,360Heritage and cultural assets 11,332 10,588 744 10,843Other non-financial assets 4,896 3,217 1,679 3,794
Total non-financial assets 123,230 119,638 3,592 121,847Total assets 429,251 414,620 14,631 428,668LiabilitiesInterest bearing liabilities
Deposits held 218 182 36 211Government securities 409,937 387,772 22,165 418,307Loans and other interest bearing liabilities 12,408 13,436 (1,028) 10,347Other borrowing 1,509 1,376 133 1,545
Total interest bearing liabilities 424,072 402,766 21,306 430,409Provisions and payables
Superannuation liability 248,209 163,228 84,981 167,327Other employee liabilities 17,052 15,291 1,761 16,030Suppliers payable 4,601 4,705 (104) 4,956Personal benefits payable 5,983 3,958 2,025 5,716Subsidies payable 4,529 3,937 592 4,585Grants payable 3,239 3,174 65 2,394Other payables and provisions 30,020 29,572 448 28,562
Total provisions and payables 313,633 223,865 89,768 229,571Total liabilities 737,705 626,631 111,074 659,979Net worth (308,454) (212,010) (96,444) (231,311)
(a) Original budget for 2014-15 as presented in the 2014-15 Budget papers released in May 2014. (b) Revised budget for 2014-15 as presented in the 2015-16 Budget papers released in May 2015.
Notes to the financial statements
175
Net worth
Net worth at 30 June 2015 was negative $308.5 billion, $96.4 billion higher than the original budget net worth of negative $212.0 billion.
Assets
Total assets at 30 June 2015 were $429.3 billion, $14.6 billion (3.5 per cent) higher than the original budget of $414.6 billion.
Total financial assets were $306.0 billion, $11.0 billion higher than the original budget of $295.0 billion. Key drivers included:
• higher equity investments of $8.0 billion, due to:
– an increase of $6.4 billion in the Treasury’s investment in the RBA, the Australian Reinsurance Pool Corporation and the Clean Energy Finance Corporation which increased during 2014-15; and
– a higher value of equity investments managed by the Future Fund of $3.3 billion.
• higher investments, loans and placements of $7.6 billion, due to:
– a higher value of deposits and securities held by the AOFM of $9.2 billion, primarily due to a more conservative cash management approach in estimating government expenditures and due to the imprecision in forecasting the highly volatile daily flows of revenue, expenditure and financing items across the GGS;
– a higher value of investments managed by the Future Fund of $6.3 billion;
– a lower value of the IMF quota payments of $5.1 billion, relating to the shift of the IMF quota increase under the 2010 reform from 2014-15 to 2015-16 as a result of the delay by the United States in implementing these reforms (refer below for related decrease in liabilities); and
– lower ‘other’ investments of $1.8 billion primarily relating to the sale of Medibank which was not disclosed in the original budget due to commercial confidentiality reasons.
• lower advances paid of $4.5 billion. This was mainly due to the different measurement techniques used in the Budget and the CFS for the value of the advances paid to the International Development Association (IDA) and Asian Development Fund (ADF). In the budget, IDA/ADF was recorded at nominal value whilst fair value was used for the CFS (see Note 1.3 and Statement 9 in the 2014-15 Budget Paper No. 1 for more detail).
Total non-financial assets were $123.2 billion, $3.6 billion higher than the original budget of $119.6 billion. Key drivers included:
• revaluation of non-financial assets ($1.6 billion), as the budget does not include estimates for these revaluations; and
Notes to the financial statements
176
• higher ‘other’ non-financial assets ($1.6 billion), primarily attributable to defence prepayments for foreign military sales.
Liabilities
Total liabilities at 30 June 2015 were $737.7 billion, $111.1 billion (17.7 per cent) higher than the original budget of $626.6 billion.
Total provisions and payables were $313.6 billion, $89.8 billion higher than the original budget of $223.9 billion. Key drivers included:
• higher Australian Government’s superannuation liabilities of $85.0 billion, primarily due to different discount rates used to value the liability. In the original budget, a discount rate applied by the actuaries in preparing the Long-term Cost Report was used to allow comparability between years for budget estimates. Consistent with the AAS, the long-term government bond rate as at 30 June 2015 was used for the CFS. Additional information on the measurement is provided in Note 12C and the Statement 7 in the 2014-15 Budget Paper No. 1.
• higher personal benefits payable of $2.0 billion. Contributing factors included:
– Low Income Earner Superannuation Contribution ($0.9 billion), not being budgeted for at the beginning of the year (as per the Government’s policy decision at the time); and
– Family Tax Benefit ($0.6 billion), which was higher as a result of lower than expected wage growth, which drove up average payment rates and recipient numbers.
• higher other employee liabilities of $1.8 billion, primarily due to the provision for military compensation claims. This provision is difficult to estimate due to the uncertainty surrounding the inputs that determine this long-term liability.
• lower other payables and provisions of $0.4 billion, primarily due to two major offsetting variances:
– an increase of $1.2 billion to the provision for the Natural Disaster Relief and Recovery Arrangements to reflect actual reconstruction costs in Queensland; and
– a decrease of $1.0 billion for a write-back to the Higher Education Superannuation programme liability (refer Other Economic Flows above).
Notes to the financial statements
177
Total interest bearing liabilities were $424.1 billion, $21.3 billion higher than the original budget of $402.8 billion. Key drivers included:
• higher Australian Government Securities (AGS) of $22.2 billion managed by the AOFM. This was due to a larger financing task as well as lower interest rates and lower nominal and real issuance yields for the year.2
• lower loans and other interest bearing liabilities of $1.0 billion, mainly due to:
– lower Treasury Promissory Notes of $2.8 billion, relating to the shift of the IMF quota increase under the 2010 reform from 2014-15 to 2015-16 as a result of the delay by the United States in implementing these reforms (refer above for related decrease in assets);
– higher swap principal payables of $0.9 billion held by the Future Fund; and
– higher Treasury Special Drawing Rights of $0.5 billion relating to changes in exchange rates.
2 The AOFM’s projections of AGS are a consequence of the expenditure, investment and revenue decisions and assumptions made by the Government in producing its original budget. The debt issuance program was set at $67 billion for the original budget and as at 30 June 2015 the AGS on issue was $7.6 billion higher than this forecast. Further information can be found in the AOFM’s 2014-15 financial statements available at: http://aofm.gov.au/publications/annual-reports/.
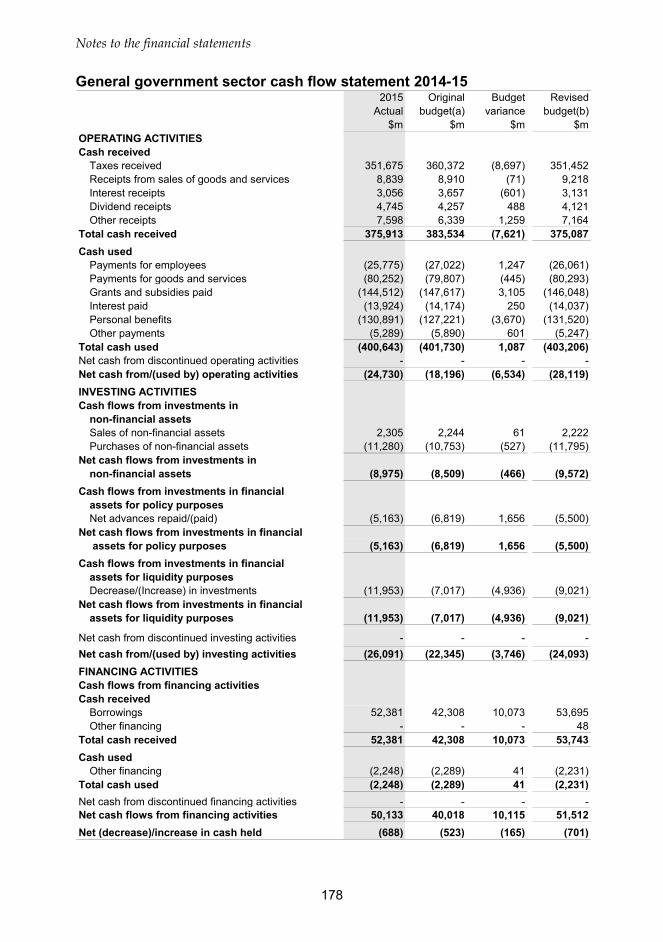
Notes to the financial statements
178
General government sector cash flow statement 2014-15 2015 Original Budget Revised
Actual budget(a) variance budget(b)$m $m $m $m
OPERATING ACTIVITIESCash received
Taxes received 351,675 360,372 (8,697) 351,452Receipts from sales of goods and services 8,839 8,910 (71) 9,218Interest receipts 3,056 3,657 (601) 3,131Dividend receipts 4,745 4,257 488 4,121Other receipts 7,598 6,339 1,259 7,164
Total cash received 375,913 383,534 (7,621) 375,087Cash used
Payments for employees (25,775) (27,022) 1,247 (26,061)Payments for goods and services (80,252) (79,807) (445) (80,293)Grants and subsidies paid (144,512) (147,617) 3,105 (146,048)Interest paid (13,924) (14,174) 250 (14,037)Personal benefits (130,891) (127,221) (3,670) (131,520)Other payments (5,289) (5,890) 601 (5,247)
Total cash used (400,643) (401,730) 1,087 (403,206)Net cash from discontinued operating activities - - - -Net cash from/(used by) operating activities (24,730) (18,196) (6,534) (28,119)INVESTING ACTIVITIESCash flows from investments in
non-financial assetsSales of non-financial assets 2,305 2,244 61 2,222Purchases of non-financial assets (11,280) (10,753) (527) (11,795)
Net cash flows from investments innon-financial assets (8,975) (8,509) (466) (9,572)
Cash flows from investments in financial assets for policy purposesNet advances repaid/(paid) (5,163) (6,819) 1,656 (5,500)
Net cash flows from investments in financial assets for policy purposes (5,163) (6,819) 1,656 (5,500)
Cash flows from investments in financial assets for liquidity purposesDecrease/(Increase) in investments (11,953) (7,017) (4,936) (9,021)
Net cash flows from investments in financial assets for liquidity purposes (11,953) (7,017) (4,936) (9,021)
Net cash from discontinued investing activities - - - -Net cash from/(used by) investing activities (26,091) (22,345) (3,746) (24,093)FINANCING ACTIVITIESCash flows from financing activitiesCash received
Borrowings 52,381 42,308 10,073 53,695Other financing - - - 48
Total cash received 52,381 42,308 10,073 53,743Cash used
Other financing (2,248) (2,289) 41 (2,231)Total cash used (2,248) (2,289) 41 (2,231)Net cash from discontinued financing activities - - - -Net cash flows from financing activities 50,133 40,018 10,115 51,512Net (decrease)/increase in cash held (688) (523) (165) (701)
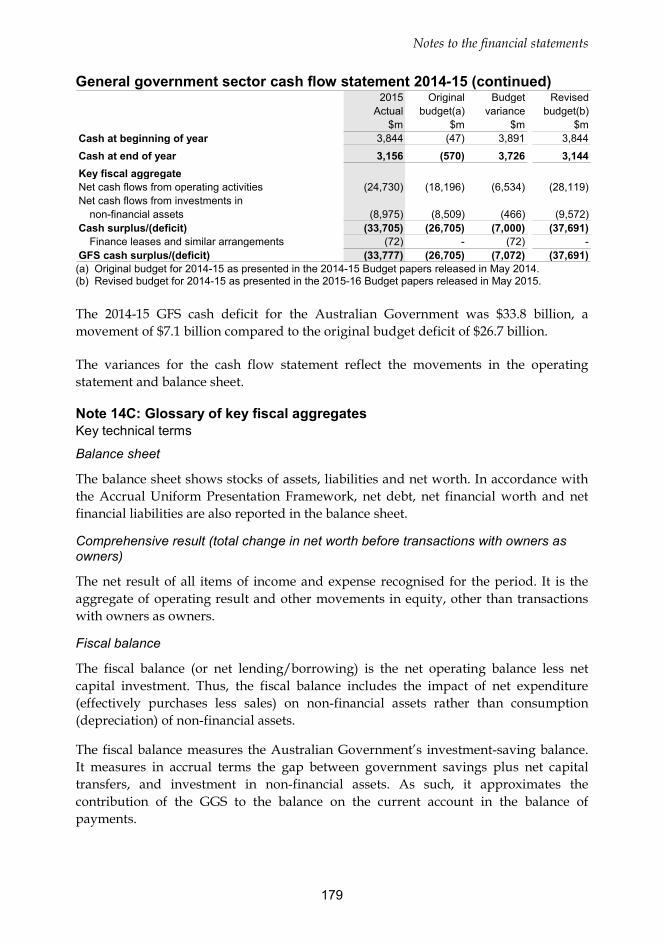
Notes to the financial statements
179
General government sector cash flow statement 2014-15 (continued) 2015 Original Budget Revised
Actual budget(a) variance budget(b)$m $m $m $m
Cash at beginning of year 3,844 (47) 3,891 3,844
Cash at end of year 3,156 (570) 3,726 3,144Key fiscal aggregateNet cash flows from operating activities (24,730) (18,196) (6,534) (28,119)Net cash flows from investments in
non-financial assets (8,975) (8,509) (466) (9,572)Cash surplus/(deficit) (33,705) (26,705) (7,000) (37,691)
Finance leases and similar arrangements (72) - (72) -GFS cash surplus/(deficit) (33,777) (26,705) (7,072) (37,691) (a) Original budget for 2014-15 as presented in the 2014-15 Budget papers released in May 2014. (b) Revised budget for 2014-15 as presented in the 2015-16 Budget papers released in May 2015. The 2014-15 GFS cash deficit for the Australian Government was $33.8 billion, a movement of $7.1 billion compared to the original budget deficit of $26.7 billion.
The variances for the cash flow statement reflect the movements in the operating statement and balance sheet.
Note 14C: Glossary of key fiscal aggregates Key technical terms
Balance sheet
The balance sheet shows stocks of assets, liabilities and net worth. In accordance with the Accrual Uniform Presentation Framework, net debt, net financial worth and net financial liabilities are also reported in the balance sheet.
Comprehensive result (total change in net worth before transactions with owners as owners)
The net result of all items of income and expense recognised for the period. It is the aggregate of operating result and other movements in equity, other than transactions with owners as owners.
Fiscal balance
The fiscal balance (or net lending/borrowing) is the net operating balance less net capital investment. Thus, the fiscal balance includes the impact of net expenditure (effectively purchases less sales) on non-financial assets rather than consumption (depreciation) of non-financial assets.
The fiscal balance measures the Australian Government’s investment-saving balance. It measures in accrual terms the gap between government savings plus net capital transfers, and investment in non-financial assets. As such, it approximates the contribution of the GGS to the balance on the current account in the balance of payments.
Notes to the financial statements
180
Mutually agreed bad debts
Financial assets written off where there was prior knowledge and consent by the counterparties.
Net actuarial gains
Includes actuarial gains and losses on defined benefits superannuation plans.
Net financial liabilities
Total liabilities less financial assets, other than equity in PNFCs and PFCs. This measure is broader than net debt as it includes significant liabilities, other than borrowings (for example accrued employee liabilities such as superannuation and long service leave entitlements). For the PNFC and PFC sectors, it is equal to negative net financial worth.
Net financial worth
Net financial worth is equal to financial assets minus liabilities. It is a broader measure than net debt in that it incorporates provisions made (such as superannuation, but excluding depreciation and bad debts) as well as holdings of equity. Net financial worth includes all classes of financial assets and liabilities, only some of which are included in net debt.
Net lending/borrowing
This is the net operating balance minus the net acquisition/(disposal) of non-financial assets. It is also equal to transactions in the net acquisition/(disposal) of financial assets minus the net incurrence of liabilities. It indicates the extent to which financial resources are placed at the disposal of the rest of the economy or the utilisation of financial resources generated by the rest of the economy. It is an indicator of the financial impact on the rest of the economy.
Net other economic flows
The net change in the volume or value of assets and liabilities that does not result from transactions.
Net operating balance
This is calculated as income from transactions minus expenses from transactions.
Net result from transactions — net operating balance
The revenue from transactions minus expenses from transactions. It is a summary measure of the ongoing sustainability of operations. It excludes gains and losses resulting from changes in price levels and other changes in the volume of assets. It is the component of the change in net worth that is due to transactions and can be attributed directly to government policies.
Notes to the financial statements
181
Net worth
The net worth of the GGS, PNFC and PFC sectors are defined as assets less liabilities. This differs from the ABS GFS definition for the PNFC and PFC sectors where net worth is defined as assets less liabilities less shares and other contributed capital. Net worth is an economic measure of wealth, reflecting the Australian Government’s contribution to the wealth of Australia.
Operating result
A measure of financial performance of the operations for the period. It is the net result of items of revenue, gains and expenses (including losses) recognised for the period, excluding those that are classified as ‘other non-owner movements in equity’.
Operating statement
The operating statement presents details of transactions in revenues, expenses, the net acquisition of non-financial assets (net capital investment) and other economic flows for an accounting period.
Transactions
Interactions between two units by mutual agreement or an action within a unit that is analytically useful to treat as a transaction.
Unilaterally determined bad debts
Financial assets written off without an agreement with the debtor in cases such as bankruptcy of the debtor.
Note 15: Audit expenses With the exception of a small number of entities, audit services within the reporting entity are provided by the Auditor–General. The cost of these services which include performance and financial statement audits, totalled $76.6 million (2014: $75.2 million). The audit of the CFS cost $1.1 million (2014: $0.7 million).
Notes to the financial statements
182
Note 16: List of Australian Government reporting entities The following is a list of Australian Government reporting entities which have been consolidated for the purposes of the financial report. Unless otherwise noted, all such entities are wholly owned. The list is based on the Australian Government Administrative Arrangement Orders in place at 30 June 2015.
Agriculture Portfolio
General Government: Australian Fisheries Management Authority Australian Grape and Wine Authority Australian Pesticides and Veterinary Medicines Authority Cotton Research and Development Corporation
Department of Agriculture Fisheries Research and Development Corporation Grains Research and Development Corporation Rural Industries Research and Development Corporation
Attorney-General’s Portfolio
General Government: Administrative Appeals Tribunal Attorney-General’s Department Australian Business Arts Foundation Ltd (Creative Partnerships Australia) (company limited by guarantee) Australian Commission for Law Enforcement Integrity Australia Council Australian Crime Commission Australian Federal Police Australian Film, Television and Radio School Australian Financial Security Authority Australian Human Rights Commission Australian Institute of Criminology Australian Law Reform Commission Australian National Maritime Museum Australian Security Intelligence Organisation Australian Transaction Reports and Analysis Centre
Bundanon Trust (company limited by guarantee) CrimTrac Agency Family Court and Federal Circuit Court Federal Court of Australia High Court of Australia National Archives of Australia National Film and Sound Archive Australia National Gallery of Australia National Library of Australia National Museum of Australia National Portrait Gallery of Australia Office of the Australian Information Commissioner Office of Parliamentary Counsel Office of the Director of Public Prosecutions Old Parliament House Screen Australia
Public non-financial corporations: Australian Government Solicitor
Communications Portfolio
General Government: Australian Broadcasting Corporation Australian Communications and Media Authority Department of Communications
Special Broadcasting Service Corporation Telecommunications Universal Service Management Agency
Public non-financial corporations: Australian Postal Corporation NBN Co Ltd
Notes to the financial statements
183
Defence Portfolio
General Government: AAF Company (company limited by guarantee) Army and Air Force Canteen Service Australian Military Forces Relief Trust Fund Australian Strategic Policy Institute Ltd (company limited by guarantee) Australian War Memorial Department of Defence Department of Veterans’ Affairs Defence Housing Australia
Defence Materiel Organisation Royal Australian Air Force Veterans’ Residences Trust Fund Royal Australian Air Force Welfare Recreational Company (company limited by guarantee) Royal Australian Air Force Welfare Trust Fund Royal Australian Navy Central Canteens Board Royal Australian Navy Relief Trust Fund
Education and Training Portfolio
General Government: Australian Curriculum, Assessment and Reporting Authority Australian Institute of Aboriginal and Torres Strait Islander Studies Australian Institute for Teaching and School Leadership Ltd (company limited by guarantee)
Australian Research Council Australian Skills Quality Authority (National Vocational Education and Training Regulator) Department of Education and Training Tertiary Education Quality and Standards Agency
Employment Portfolio
General Government: Asbestos Safety and Eradication Agency Comcare Department of Employment Fair Work Commission Office of the Fair Work Building Industry Inspectorate Office of the Fair Work Ombudsman
Safe Work Australia Seafarers Safety, Rehabilitation and Compensation Authority (Seacare Authority) Workplace Gender Equality Agency
Public financial corporations: Coal Mining Industry (Long Service Leave Funding) Corporation
Environment Portfolio
General Government: Bureau of Meteorology Clean Energy Regulator Climate Change Authority Department of the Environment
Director of National Parks Great Barrier Reef Marine Park Authority Murray-Darling Basin Authority Sydney Harbour Federation Trust
Finance Portfolio
General Government: Australian Electoral Commission Commonwealth Superannuation Corporation
ComSuper Department of Finance Future Fund Management Agency
Public non-financial corporations: ASC Pty Ltd
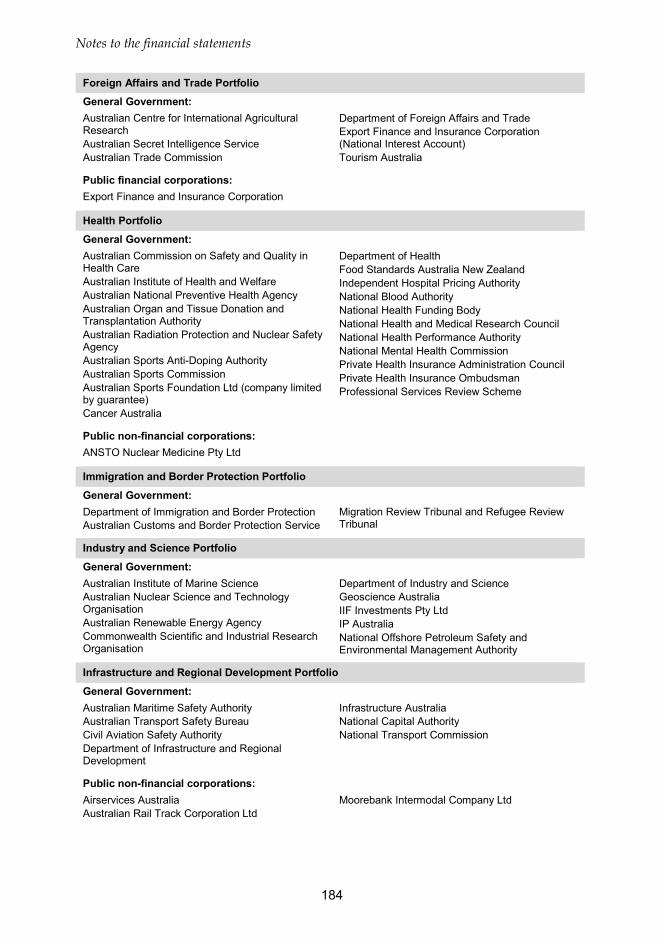
Notes to the financial statements
184
Foreign Affairs and Trade Portfolio
General Government: Australian Centre for International Agricultural Research Australian Secret Intelligence Service Australian Trade Commission
Department of Foreign Affairs and Trade Export Finance and Insurance Corporation (National Interest Account) Tourism Australia
Public financial corporations: Export Finance and Insurance Corporation
Health Portfolio
General Government: Australian Commission on Safety and Quality in Health Care Australian Institute of Health and Welfare Australian National Preventive Health Agency Australian Organ and Tissue Donation and Transplantation Authority Australian Radiation Protection and Nuclear Safety Agency Australian Sports Anti-Doping Authority Australian Sports Commission Australian Sports Foundation Ltd (company limited by guarantee) Cancer Australia
Department of Health Food Standards Australia New Zealand Independent Hospital Pricing Authority National Blood Authority National Health Funding Body National Health and Medical Research Council National Health Performance Authority National Mental Health Commission Private Health Insurance Administration Council Private Health Insurance Ombudsman Professional Services Review Scheme
Public non-financial corporations: ANSTO Nuclear Medicine Pty Ltd
Immigration and Border Protection Portfolio
General Government: Department of Immigration and Border Protection Australian Customs and Border Protection Service
Migration Review Tribunal and Refugee Review Tribunal
Industry and Science Portfolio
General Government: Australian Institute of Marine Science Australian Nuclear Science and Technology Organisation Australian Renewable Energy Agency Commonwealth Scientific and Industrial Research Organisation
Department of Industry and Science Geoscience Australia IIF Investments Pty Ltd IP Australia National Offshore Petroleum Safety and Environmental Management Authority
Infrastructure and Regional Development Portfolio
General Government: Australian Maritime Safety Authority Australian Transport Safety Bureau Civil Aviation Safety Authority Department of Infrastructure and Regional Development
Infrastructure Australia National Capital Authority National Transport Commission
Public non-financial corporations: Airservices Australia Australian Rail Track Corporation Ltd
Moorebank Intermodal Company Ltd
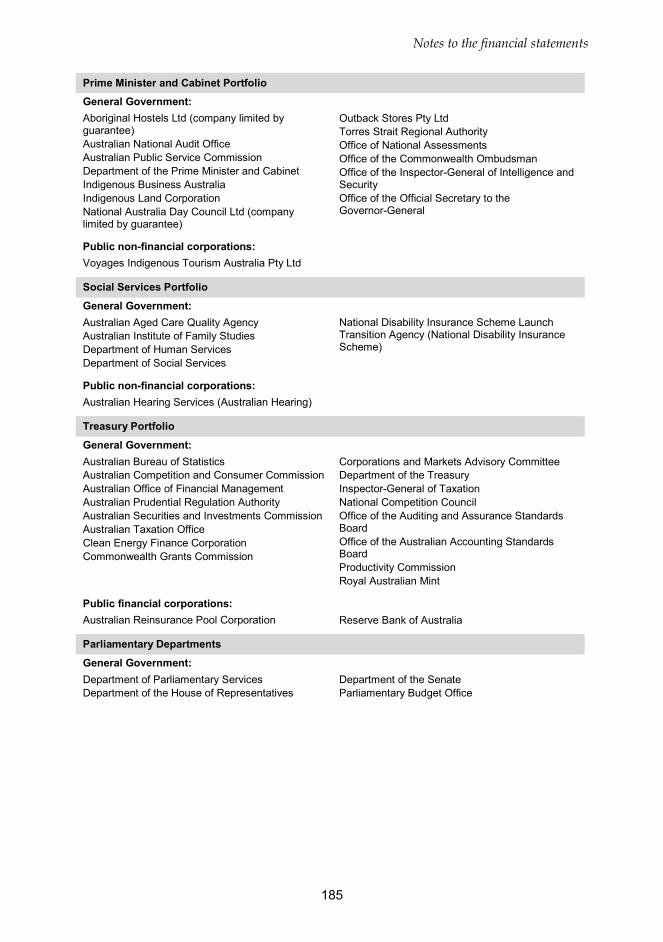
Notes to the financial statements
185
Prime Minister and Cabinet Portfolio
General Government: Aboriginal Hostels Ltd (company limited by guarantee) Australian National Audit Office Australian Public Service Commission Department of the Prime Minister and Cabinet Indigenous Business Australia Indigenous Land Corporation National Australia Day Council Ltd (company limited by guarantee)
Outback Stores Pty Ltd Torres Strait Regional Authority Office of National Assessments Office of the Commonwealth Ombudsman Office of the Inspector-General of Intelligence and Security Office of the Official Secretary to the Governor-General
Public non-financial corporations: Voyages Indigenous Tourism Australia Pty Ltd
Social Services Portfolio
General Government: Australian Aged Care Quality Agency Australian Institute of Family Studies Department of Human Services Department of Social Services
National Disability Insurance Scheme Launch Transition Agency (National Disability Insurance Scheme)
Public non-financial corporations: Australian Hearing Services (Australian Hearing)
Treasury Portfolio
General Government: Australian Bureau of Statistics Australian Competition and Consumer Commission Australian Office of Financial Management Australian Prudential Regulation Authority Australian Securities and Investments Commission Australian Taxation Office Clean Energy Finance Corporation Commonwealth Grants Commission
Corporations and Markets Advisory Committee Department of the Treasury Inspector-General of Taxation National Competition Council Office of the Auditing and Assurance Standards Board Office of the Australian Accounting Standards Board Productivity Commission Royal Australian Mint
Public financial corporations: Australian Reinsurance Pool Corporation Reserve Bank of Australia
Parliamentary Departments
General Government: Department of Parliamentary Services Department of the House of Representatives
Department of the Senate Parliamentary Budget Office
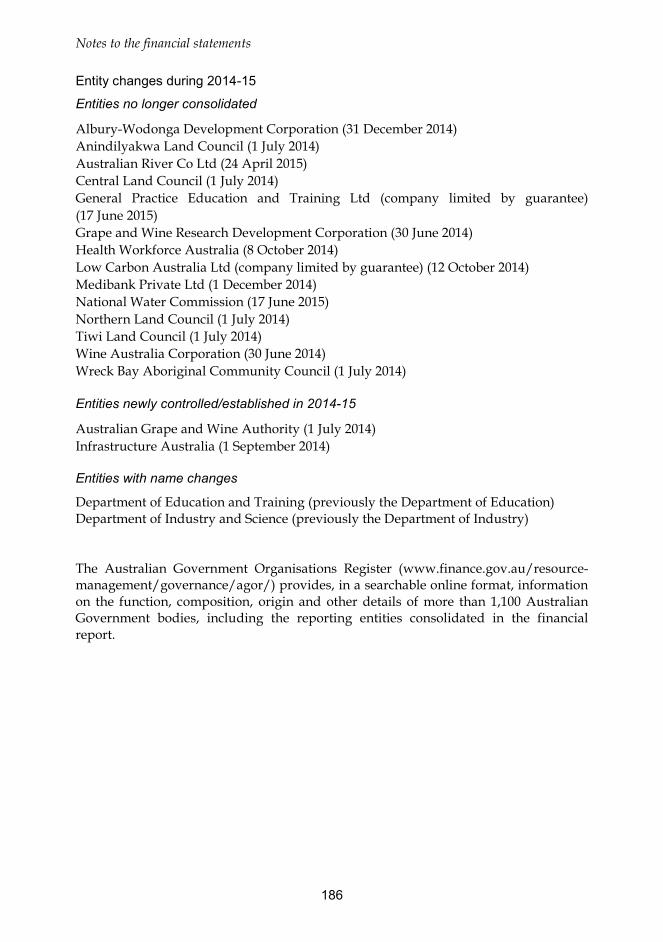
Notes to the financial statements
186
Entity changes during 2014-15
Entities no longer consolidated
Albury-Wodonga Development Corporation (31 December 2014) Anindilyakwa Land Council (1 July 2014) Australian River Co Ltd (24 April 2015) Central Land Council (1 July 2014) General Practice Education and Training Ltd (company limited by guarantee) (17 June 2015) Grape and Wine Research Development Corporation (30 June 2014) Health Workforce Australia (8 October 2014) Low Carbon Australia Ltd (company limited by guarantee) (12 October 2014) Medibank Private Ltd (1 December 2014) National Water Commission (17 June 2015) Northern Land Council (1 July 2014) Tiwi Land Council (1 July 2014) Wine Australia Corporation (30 June 2014) Wreck Bay Aboriginal Community Council (1 July 2014) Entities newly controlled/established in 2014-15
Australian Grape and Wine Authority (1 July 2014) Infrastructure Australia (1 September 2014) Entities with name changes
Department of Education and Training (previously the Department of Education) Department of Industry and Science (previously the Department of Industry)
The Australian Government Organisations Register (www.finance.gov.au/resource- management/governance/agor/) provides, in a searchable online format, information on the function, composition, origin and other details of more than 1,100 Australian Government bodies, including the reporting entities consolidated in the financial report.