Embed Size (px)
Citation preview

Consolidated financial statements December 31, 2017
SCHNEIDER ELECTRIC – 2017 1
Table of contents
1.Consolidated statement of income ........................................................................................................ 2 Other comprehensive income .............................................................................................................................. 3
2. Consolidated statement of cash flows ................................................................................................. 4 3. Consolidated balance sheet .................................................................................................................. 5 4. Consolidated statement of changes in equity ..................................................................................... 7 5. Notes to the consolidated financial statements .................................................................................. 8
Note 1 Accounting Policies .............................................................................................................................. 8 Note 2 Changes in the scope of consolidation ............................................................................................... 19 Note 3 Segment information .......................................................................................................................... 20 Note 4 Research and development ................................................................................................................ 21 Note 5 Depreciation and amortization expenses ............................................................................................ 22 Note 6 Other operating income and expenses ............................................................................................... 22 Note 7 Restructuring costs ............................................................................................................................. 22 Note 8 Amortization and impairment of purchase accounting intangibles ....................................................... 22 Note 9 Other financial income and expense ................................................................................................... 23 Note 10 Income tax expense ........................................................................................................................... 23 Note 11 Goodwill ............................................................................................................................................. 24 Note 12 Intangible assets ................................................................................................................................ 25 Note 13 Property, plant and equipment ............................................................................................................ 26 Note 14 Investments in associates................................................................................................................... 28 Note 15 Total current and non-current financial assets .................................................................................... 29 Note 16 Deferred taxes by type ....................................................................................................................... 30 Note 17 Inventories and work in progress ........................................................................................................ 30 Note 18 Trade accounts receivable.................................................................................................................. 31 Note 19 Other receivables and prepaid expenses ............................................................................................ 31 Note 20 Cash and cash equivalents................................................................................................................. 31 Note 21 Equity ................................................................................................................................................. 32 Note 22 Pensions and other post-employment benefit obligations ................................................................... 38 Note 23 Provisions for contingencies and charges ........................................................................................... 43 Note 24 Total current and non-current financial liabilities ................................................................................. 44 Note 25 Other non-current liabilities ................................................................................................................. 46 Note 26 Financial instruments.......................................................................................................................... 47 Note 27 Employees ......................................................................................................................................... 51 Note 28 Related party transactions .................................................................................................................. 52 Note 29 Commitments and contingent liabilities ............................................................................................... 52 Note 30 Subsequent events ............................................................................................................................. 53 Note 31 Statutory auditors’ fees ....................................................................................................................... 54 Note 32 Consolidated companies .................................................................................................................... 55
Review of the consolidated financial statements .................................................................................. 64 Review of business and consolidated statement of income ............................................................................... 64 Changes in revenue by operating segment ....................................................................................................... 64 Gross profit ....................................................................................................................................................... 65 Support Function Costs: research and development and selling, general and administrative expenses ............. 65 Other operating income and expenses .............................................................................................................. 66 EBITA and Adjusted EBITA ............................................................................................................................... 66 Adjusted EBITA by business segment ............................................................................................................... 66 Operating income (EBIT) ................................................................................................................................... 67 Net financial income/loss ................................................................................................................................... 67 Tax 67 Share of profit/(losses) of associates ................................................................................................................. 67 Non-controlling interests .................................................................................................................................... 68 Profit for the period ............................................................................................................................................ 68 Earnings per share ............................................................................................................................................ 68 Consolidated cash-flow ..................................................................................................................................... 68
Review of the parent company financial statements ............................................................................ 69 Review of subsidiaries ............................................................................................................................. 69 Outlook ...................................................................................................................................................... 69
SCHNEIDER ELECTRIC – 2017 2
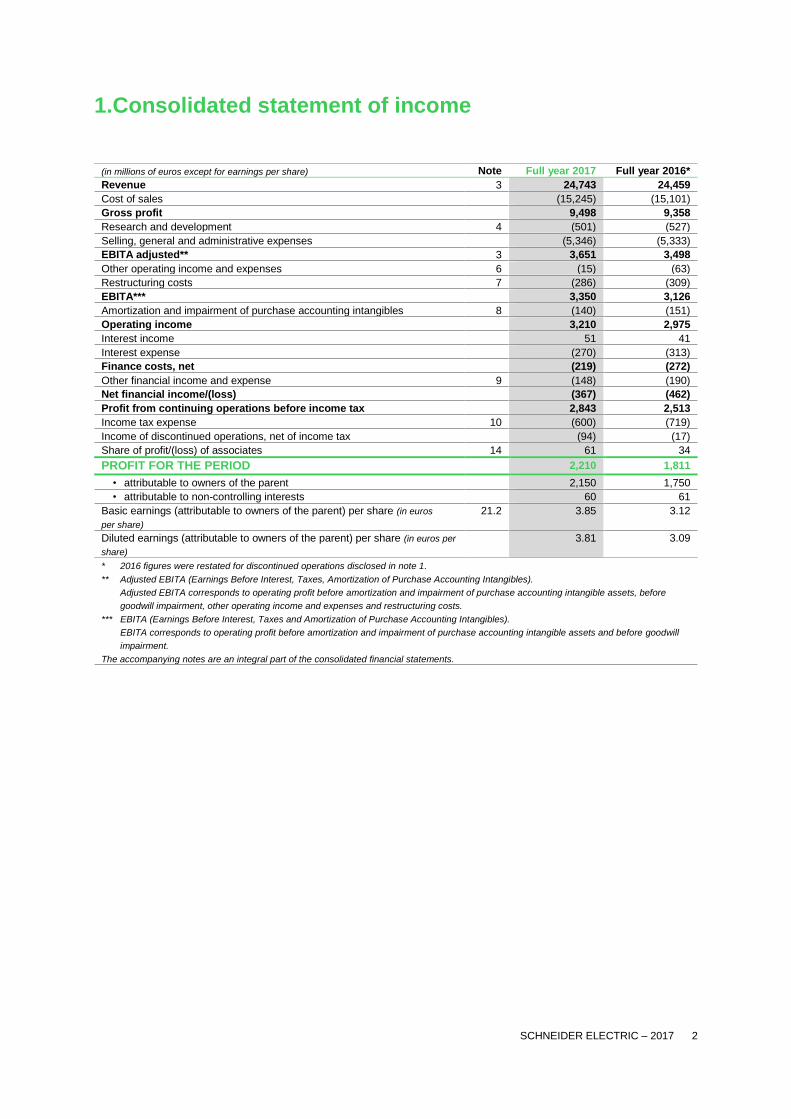
1.Consolidated statement of income
(in millions of euros except for earnings per share) Note Full year 2017 Full year 2016*
Revenue 3 24,743 24,459
Cost of sales (15,245) (15,101)
Gross profit 9,498 9,358
Research and development 4 (501) (527)
Selling, general and administrative expenses (5,346) (5,333)
EBITA adjusted** 3 3,651 3,498
Other operating income and expenses 6 (15) (63)
Restructuring costs 7 (286) (309)
EBITA*** 3,350 3,126
Amortization and impairment of purchase accounting intangibles 8 (140) (151)
Operating income 3,210 2,975
Interest income 51 41
Interest expense (270) (313)
Finance costs, net (219) (272)
Other financial income and expense 9 (148) (190)
Net financial income/(loss) (367) (462)
Profit from continuing operations before income tax 2,843 2,513
Income tax expense 10 (600) (719)
Income of discontinued operations, net of income tax (94) (17)
Share of profit/(loss) of associates 14 61 34
PROFIT FOR THE PERIOD 2,210 1,811
• attributable to owners of the parent 2,150 1,750
• attributable to non-controlling interests 60 61
Basic earnings (attributable to owners of the parent) per share (in euros
per share)
21.2 3.85 3.12
Diluted earnings (attributable to owners of the parent) per share (in euros per
share)
3.81 3.09
* 2016 figures were restated for discontinued operations disclosed in note 1.
** Adjusted EBITA (Earnings Before Interest, Taxes, Amortization of Purchase Accounting Intangibles).
Adjusted EBITA corresponds to operating profit before amortization and impairment of purchase accounting intangible assets, before
goodwill impairment, other operating income and expenses and restructuring costs.
*** EBITA (Earnings Before Interest, Taxes and Amortization of Purchase Accounting Intangibles).
EBITA corresponds to operating profit before amortization and impairment of purchase accounting intangible assets and before goodwill
impairment.
The accompanying notes are an integral part of the consolidated financial statements.
SCHNEIDER ELECTRIC – 2017 3
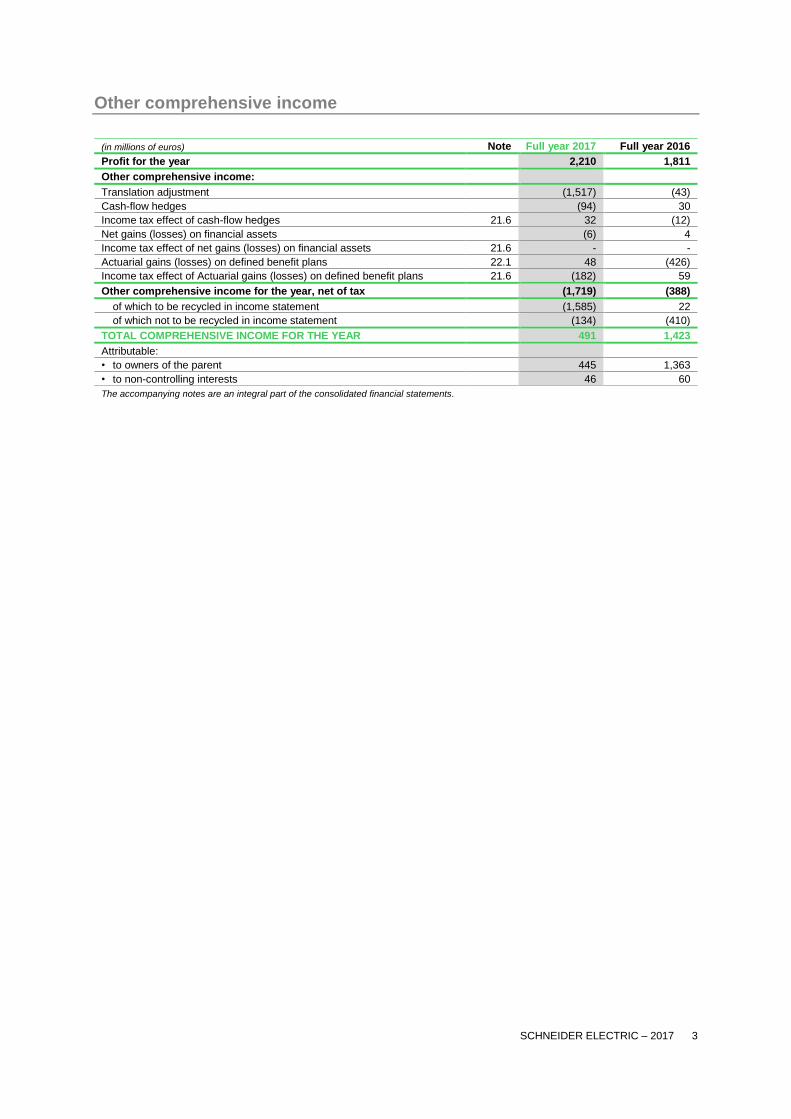
Other comprehensive income
(in millions of euros) Note Full year 2017 Full year 2016
Profit for the year 2,210 1,811
Other comprehensive income:
Translation adjustment (1,517) (43)
Cash-flow hedges (94) 30
Income tax effect of cash-flow hedges 21.6 32 (12)
Net gains (losses) on financial assets (6) 4
Income tax effect of net gains (losses) on financial assets 21.6 - -
Actuarial gains (losses) on defined benefit plans 22.1 48 (426)
Income tax effect of Actuarial gains (losses) on defined benefit plans 21.6 (182) 59
Other comprehensive income for the year, net of tax (1,719) (388)
of which to be recycled in income statement (1,585) 22
of which not to be recycled in income statement (134) (410)
TOTAL COMPREHENSIVE INCOME FOR THE YEAR 491 1,423
Attributable:
• to owners of the parent 445 1,363
• to non-controlling interests 46 60
The accompanying notes are an integral part of the consolidated financial statements.

SCHNEIDER ELECTRIC – 2017 4
2. Consolidated statement of cash flows
(in millions of euros) Note Full year 2017 Full year 2016*
Profit for the year 2,210 1,811
Losses/(gains) from discontinued operations 94 17
Share of (profit)/losses of associates, net of dividends received (61) (34)
Income and expenses with no effect on cash flow
Depreciation of property, plant and equipment 13 387 386
Amortization of intangible assets other than goodwill 12 399 447
Impairment losses on non-current assets 68 106
Increase/(decrease) in provisions 23 (69) (112)
Losses/(gains) on disposals of assets (93) 17
Difference between tax paid and tax expense 48 188
Other non-cash adjustments 37 130
Net cash provided by operating activities 3,020 2,956
Decrease/(increase) in accounts receivable (257) (17)
Decrease/(increase) in inventories and work in progress (173) 93
(Decrease)/increase in accounts payable 304 (21)
Other current assets and liabilities 47 (54)
Change in working capital requirement (79) 1
Total I – Cash flows from operating activities 2,941 2,957
Purchases of property, plant and equipment 13 (434) (476)
Proceeds from disposals of property, plant and equipment 61 81
Purchases of intangible assets 12 (315) (360)
Proceeds from disposals of intangible assets - 14
Net cash used by investment in operating assets (688) (741)
Net financial investments 2.2 (416) 47
Other long-term investments 26 44
Increase in long-term pension assets (160) (111)
Sub-total (550) (20)
Total II – Cash flows from/(used in) investing activities (1,238) (761)
Issuance of bonds 24 740 800
Repayment of bonds 24 (1,025) (672)
Sale/(purchase) of own shares (171) (853)
Increase/(decrease) in other financial debt 111 (794)
Increase/(decrease) of shares capital 161 164
Dividends paid by Schneider Electric SE 21 (1,133) (1,127)
Dividends paid to non-controlling interests (64) (100)
Purchases of minority interests 2.2 (141) -
Total III – Cash flows from/(used in) financing activities (1,522) (2,582)
Total IV – Net foreign exchange difference (33) 77
Total V – Effect of discontinued operations 89 (10)
Increase/(decrease) in net cash and cash equivalents: I +II +III +IV +V 237 (319)
Net cash and cash equivalents at January 1 2,530 2,849
Increase/(decrease) in cash and cash equivalents 237 (319)
NET CASH AND CASH EQUIVALENTS AT DECEMBER 31 20 2,767 2,530
* 2016 figures were restated for discontinued operations disclosed in note 1.
The accompanying notes are an integral part of the consolidated financial statements.

SCHNEIDER ELECTRIC – 2017 5
3. Consolidated balance sheet
Assets
(in millions of euros) Note Dec. 31, 2017 Dec. 31, 2016
NON-CURRENT ASSETS
Goodwill, net 11 16,423 17,785
Intangible assets, net 12 4,335 4,574
Property, plant and equipment, net 13 2,490 2,642
Total tangible and intangible assets 6,825 7,216
Investments in associates 14 547 601
Non-current financial assets 15 436 539
Deferred tax assets 16 2,097 2,573
Total non-current assets 26,328 28,714
CURRENT ASSETS
Inventories and work in progress 17 2,844 2,876
Trade and other operating receivables 18 5,763 5,929
Other receivables and prepaid expenses 19 1,693 1,507
Current financial assets 15 32 30
Cash and cash equivalents 20 3,045 2,795
Total current assets 13,377 13,137
Assets of discontinued operations 144 -
TOTAL ASSETS 39,849 41,851
The accompanying notes are an integral part of the consolidated financial statements.
SCHNEIDER ELECTRIC – 2017 6
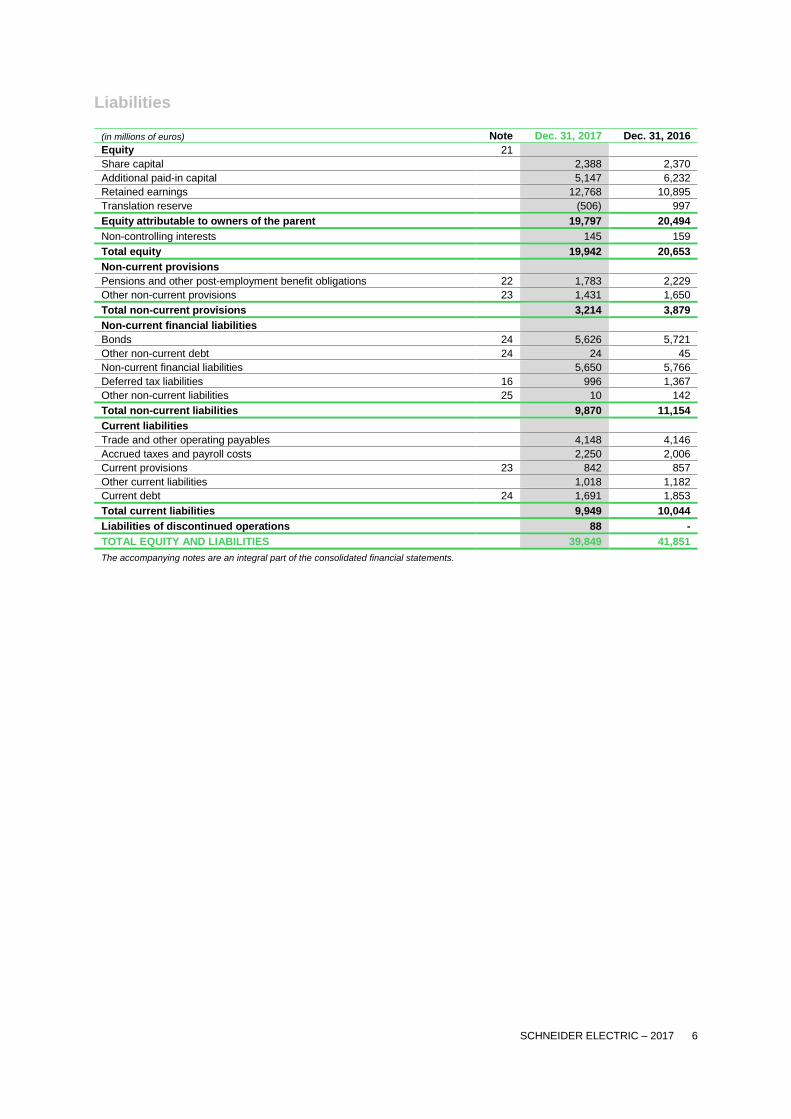
Liabilities
(in millions of euros) Note Dec. 31, 2017 Dec. 31, 2016
Equity 21
Share capital 2,388 2,370
Additional paid-in capital 5,147 6,232
Retained earnings 12,768 10,895
Translation reserve (506) 997
Equity attributable to owners of the parent 19,797 20,494
Non-controlling interests 145 159
Total equity 19,942 20,653
Non-current provisions
Pensions and other post-employment benefit obligations 22 1,783 2,229
Other non-current provisions 23 1,431 1,650
Total non-current provisions 3,214 3,879
Non-current financial liabilities
Bonds 24 5,626 5,721
Other non-current debt 24 24 45
Non-current financial liabilities 5,650 5,766
Deferred tax liabilities 16 996 1,367
Other non-current liabilities 25 10 142
Total non-current liabilities 9,870 11,154
Current liabilities
Trade and other operating payables 4,148 4,146
Accrued taxes and payroll costs 2,250 2,006
Current provisions 23 842 857
Other current liabilities 1,018 1,182
Current debt 24 1,691 1,853
Total current liabilities 9,949 10,044
Liabilities of discontinued operations 88 -
TOTAL EQUITY AND LIABILITIES 39,849 41,851
The accompanying notes are an integral part of the consolidated financial statements.

SCHNEIDER ELECTRIC – 2017 7
4. Consolidated statement of changes in equity
(in millions of euros except
for number of shares)
Number of
shares
(thousands) Capital
Additional
paid-in
capital
Treasury
shares
Retained
earnings
Translation
reserve
Equity
attributable
to owners
of the
parent
Non-
controlling
interests Total
Jan. 1, 2016 588,734 2,355 7,267 (1,027) 11,214 1,039 20,848 441 21,289
Profit for the year 1,750 1,750 61 1,811
Other comprehensive
income
(345) (42) (387) (1) (388)
Comprehensive income
for the year
1,405 (42) 1,363 60 1,423
Capital increase 2,843 11 119 130 130
Exercise of stock option
plans and performance
shares
922 4 30 34 34
Dividends (1,127) (1,127) (100) (1,227)
Change in treasury shares (853) (853) (853)
Share-based
compensation expense
118 118 118
Other (57) 38 (19) (242)* (261)
Dec. 31, 2016 published 592,499 2,370 6,232 (1,880) 12,775 997 20,494 159 20,653
IFRS 9 restatement** (100) (100) (100)
Jan. 1, 2017 restated 592,499 2,370 6,232 (1,880) 12,675 997 20,394 159 20,553
Profit for the year 2,150 2,150 60 2,210
Other comprehensive
income
(202) (1,503) (1,705) (14) (1,719)
Comprehensive income
for the year
1,948 (1,503) 445 46 491
Capital increase 2,413 10 132 142 142
Exercise of stock option
plans and performance
shares
2,004 8 16 (6) 18 18
Dividends (1,133) (1,133) (64) (1,197)
Change in treasury shares (154) (17) (171) (171)
Share-based
compensation expense
102 102 102
Other (100) (119) 219 - 4 4
DEC. 31, 2017 596,916 2,388 5,147 (2,153) 14,921 (506) 19,797 145 19,942
* The EUR242 million decrease in non-controlling interests mainly results from the deconsolidation of Delixi.
** 2017 opening retained earnings were restated from IFRS9 adoption impacts disclosed in note 1.
The accompanying notes are an integral part of the consolidated financial statements.

SCHNEIDER ELECTRIC – 2017 8
5. Notes to the consolidated financial statements
All amounts in millions of euros unless otherwise indicated.
The following notes are an integral part of the consolidated financial statements.
The Schneider Electric Group’s consolidated financial statements for the financial year ended December 31, 2017 were drawn up by the board of directors on February 14, 2018. They will be submitted to shareholders for approval at the Annual General Meeting of April 24, 2018.
The Group’s main businesses are described in chapter 1 of the registration document.
Note 1 Accounting Policies
1.1 – Accounting standards
The consolidated financial statements have been prepared in compliance with the international accounting standards (IFRS) as
adopted by the European Union as of December 31, 2017. The same accounting methods were used as for the consolidated
financial statements for the year ended December 31, 2016, except for the partial early adoption of the new standard IFRS 9 –
Financial instruments.
The following standards and interpretations that were applicable during the period did not have a material impact on the
consolidated financial statements as of December 31, 2017:
• amendments to IAS 7 – Statement of Cash Flows – Disclosure initiative;
• amendments to IAS 12 – Recognition of Deferred Tax Assets for Unrealized Losses;
The Group did not apply the following standards and interpretations for which mandatory application is subsequent to
December 31, 2017:
• standards adopted by the European Union:
– amendments to IFRS 4: Apply IFRS 9 Financial instruments with IFRS 4 Insurance contracts;
– IFRS 16 – Leases;
– IFRS 15 – Clarifications;
– IFRS 15 – Revenue from Contracts with Customers;
• standards not yet adopted by the European Union:
– IFRS 17 – Insurance Contracts;
– annual Improvements to IFRSs 2014-2016 Cycle (December 2016);
– amendments to IAS 40 – Transfers of Investment Property;
– IFRIC 23 – Uncertainty over Income Tax Treatments;
– IFRIC 22 – Foreign Currency Transactions and Advance Consideration;
– amendments to IFRS 2 – Share-based payment – Classification and Measurement;
– amendments to IFRS 9 – Prepayment Features with Negative Compensation;
– amendments to IAS 28 – Long-term Interests in Associates and Joint Ventures;
– annual Improvements to IFRSs 2015-2017 Cycle (December 2017);
– amendments to IFRS 10 and IAS 28 – Sale or Contribution of Assets between an Investor and its Associate or Joint
Venture;
There are no differences in practice between the standards applied by Schneider Electric as of December 31, 2017 and the
IFRS issued by the International Accounting Standards board (IASB).
The Group is currently assessing the potential effect on the Group’s consolidated financial statements of the standards not yet
applicable (see below).

SCHNEIDER ELECTRIC – 2017 9
Early application of IFRS 9 – Financial Instruments
IFRS 9, “Financial Instruments”, released by the IASB in July 2014 and adopted by the European Union on November 29, 2016,
replaces IAS 39 “Financial Instruments: Recognition and Measurement” with mandatory application from January 1, 2018. The
new standard introduces new principles for classification and measurement of financial instruments, impairment for credit risk on
financial assets, and hedge accounting.
The new standard is comprised of several phases (see below). Phase 1 and 2 have been applied retrospectively as of January 1,
2017. The 2016 comparative figures have not been restated as permitted by the IFRS 9 standard.
Phase 1 - Classification and measurement of financial assets and liabilities
The impact of IFRS 9 for the Group is mainly related to the removal of the category financial assets available for sale, which
allowed under IAS 39 to record instruments at fair value through Other Comprehensive Income with recycling in income statement
upon sale. Under IFRS 9, all financial instruments whose cash-flows do not represent solely payment of principal and interests
(SPPI), shall be recorded at fair value through income statement. However, IFRS 9 allows an irrevocable option to be made at
inception to record equity instruments at fair value through Other Comprehensive Income with no subsequent recycling in income
statement even upon sale (only dividends are recorded in income statement).
The following financial assets are impacted by the removal of the available for sale category:
- Portfolio of equity investments: The Group elected to record those investments at fair value through Other
Comprehensive Income with no subsequent recycling in income statement.
- Venture capital (FCPR) / Mutual funds (SICAV): The only accounting treatment allowed by IFRS 9 is to record them at
fair value through income statement.
The application of this phase had no significant impact on the Group financial statements (note 1.12 and note 15).
Phase 2 - Impairment of financial assets
IFRS 9 introduces a prospective model based on expected losses (i.e. the probability that the counterparty will default in a given
time horizon) to be applied on financial assets, whereas the previous IAS 39 model required recognition of a provision only when
a loss has incurred (non-payment or late payments).
The risk analysis and assessment carried out by the Group on the financial assets (especially trade receivables, notes receivables,
and loans) has demonstrated that it would be more accurate and appropriate to use IFRS 9 expected losses model rather than
IAS 39 incurred losses model. Therefore, the Group has decided to early apply IFRS 9 in 2017.
The credit risk of trade receivables was assessed on a collective basis country by country, as the geographical origin of receivables
is considered representative of their risk profile. Countries were classified by risk profile using the assessment provided by an
external agency. The provision for expected credit losses was evaluated using (i) the probabilities of default communicated by a
credit agency, (ii) historical default rates, (iii) ageing balance, (iv) as well as the Group’s assessment of the credit risk taking into
account guarantees and credit insurance. For the loans, the IFRS 9 provision has been determined on a case by case basis.
The resulting additional bad debt allowance impact on the balance sheet is EUR100 million net of deferred tax (recorded against
the opening equity).
Phase 3 - Hedge accounting
In accordance with IFRS 9 (paragraph 6.1.3), the Group decided to keep applying IAS 39 hedge accounting requirements.
Application of IFRS 15 – Revenue from contracts with customers in 2018
On October 29, 2016, the European Union adopted IFRS 15 “Revenue from Contracts with Customers”, which must be applied
from January 1, 2018 at the latest. The Group has not opted for early adoption of this standard.
The Group has performed analysis on each of the revenue streams described in note 1.24: transactional sales, service revenue
and long-term contracts.
For transactional and services revenue, no significant impact is expected with regards to current practices, as revenue is
recognised when or as performances obligations are satisfied.
Regarding long-term contracts, IFRS 15 requires that both the existence of enforceable right to payment and the absence of
alternative use are demonstrated, to be able to recognise revenue over time using the percentage of completion method. The
Group has analysed a representative sample of current contracts. This analysis has proven that the application of IFRS 15
requirements would have no significant impact in comparison with the current accounting practices. However, the Group has
adjusted its long-term contracts internal processes to comply fully with all IFRS 15 requirements.
In conclusion, based on the global analysis performed by the Group, there is no significant deviation from IFRS 15 new
requirements regarding revenue recognition. Therefore, the Group does not expect any significant impacts from the application
of IFRS 15 in 2018.
SCHNEIDER ELECTRIC – 2017 10
Application of IFRS 16 - Leases in 2019
IFRS 16 “Leases” will be mandatory for financial years beginning on or after January 1, 2019. This standard requires all leases
other than short-term leases and leases of low-value assets to be recognised in the lessee’s balance sheet in the form of a right-
of-use asset, with a corresponding financial liability. Currently, leases classified as “operating leases” are reported as off-balance
sheet items (see note 13.3).
The Group is currently analysing further the impacts on the financial statements.
1.2 – Application of IFRS 5 - Non-current assets held for sale and discontinued operations
On April 20, 2017, the Group announced the disposal of its Solar activity. At the end of this ongoing process, the Group will have
a minority representation on Solar’s board. This activity used to be reported within the Low Voltage (Building) business segment
of Schneider Electric. Solar activity net income (EUR(25) million) and the estimated loss incurred from the disposal of the business
(EUR(69) million) have been reclassified to discontinued operations in the Group consolidated financial statements. The
comparative information has been restated.
1.3 – Basis of presentation
The financial statements have been prepared on a historical cost basis, except for derivative instruments and certain financial
assets, which are measured at fair value. Financial liabilities are measured using the amortized cost model. The book value of
hedged assets and liabilities, under fair-value hedge, corresponds to their fair value, for the part corresponding to the hedged risk.
1.4 – Use of estimates and assumptions
The preparation of financial statements requires Group and subsidiary management to make estimates and assumptions that are
reflected in the amounts of assets and liabilities reported in the consolidated balance sheet, the revenues and expenses in the
statement of income and the obligations created during the reporting period. Actual results may differ.
These assumptions mainly concern:
• the measurement of the recoverable amount of goodwill, property, plant and equipment and intangible assets (note 1.09) and
the measurement of the goodwill impairment (note 1.11);
• the measurement of the recoverable amount of non-current financial assets (note 1.12 and note 15);
• the realizable value of inventories and work in progress (note 1.13);
• the recoverable amount of accounts receivable (note 1.14);
• the valuation of share-based payments (note 1.20);
• the calculation of provisions for contingencies and charges, in particular for warranties (note 1.21);
• the measurement of pension and other post-employment benefit obligations (note 1.19 and note 22);
• the measurement of deferred tax assets related to carry-forward losses (note 16).
1.5 – Consolidation principles
Significant subsidiaries, over which the Group exercises exclusive control, either directly or indirectly, are fully consolidated.
Exclusive control is control by all means including ownership of a majority voting interest, significant minority ownership, and
contracts or agreements with other shareholders.
Group investments in entities controlled jointly with a limited number of partners, such as joint ventures and companies over which
the Group has significant influence (« associates ») are accounted for by the equity consolidation method. Significant influence is
presumed to exist when more than 20% of voting rights are held by the Group.
Companies acquired or sold during the year are included in or removed from the consolidated financial statements as of the date
when effective control is acquired or relinquished.
Intra-group balances and transactions are eliminated.
The list of consolidated main subsidiaries and associates can be found in note 32.
The reporting date for all companies included in the scope of consolidation is December 31, with the exception of certain
associates accounted for by the equity method. For the latter however, financial statements up to September 30 of the financial
year have been used (maximum difference of three months in line with the standards).
SCHNEIDER ELECTRIC – 2017 11
1.6 – Business combinations
Business combinations are accounted for using the acquisition method, in accordance with IFRS 3 – Business Combinations.
Material acquisition costs are presented under « Other operating income and expenses » in the statement of income.
All acquired assets, liabilities and contingent liabilities of the buyer are recognized at their fair value at the acquisition date, the
fair value can be adjusted during a measurement period that can last for up to 12 months from the date of acquisition.
The excess of the cost of acquisition over the Group’s share in the fair value of assets and liabilities at the date of acquisition is
recognized in goodwill. Where the cost of acquisition is lower than the fair value of the identified assets and liabilities acquired,
the negative goodwill is immediately recognized in the statement of income.
Goodwill is not amortized, but tested for impairment at least annually and whenever there is an indication that it may be impaired
(see note 1.11 below). Any impairment losses are recognized under « Amortization and impairment of purchase accounting
intangibles ».
1.7 – Translation of the financial statements of foreign subsidiaries
The consolidated financial statements are prepared in euros.
The financial statements of subsidiaries that use another functional currency are translated into euros as follows:
• assets and liabilities are translated at the official closing rates;
• income statement and cash flow items are translated at average annual exchange rates.
Gains or losses on translation are recorded in consolidated equity under « Cumulative translation reserve ».
1.8 – Foreign currency transactions
Foreign currency transactions are recorded using the official exchange rate in effect at the date the transaction is recorded or the
hedging rate. At the balance sheet date, foreign currency payables and receivables are translated into the functional currency at
the closing rates or the hedging rate. Gains or losses on translation of foreign currency transactions are recorded under « Net
financial income/(loss) ». Foreign currency hedging is described below, in note 1.23.
1.9 – Intangible assets
Intangible assets acquired separately or as part of a business combination
Intangible assets acquired separately are initially recognized in the balance sheet at historical cost. They are subsequently
measured using the cost model, in accordance with IAS 38 – Intangible Assets.
Intangible assets (mainly trademarks and customer lists) acquired as part of business combinations are recognized in the balance
sheet at fair value at the combination date, appraised externally for the most significant assets and internally for the rest, and that
represents its historical cost in consolidation. The valuations are performed using generally accepted methods, based on future
inflows. The assets are regularly tested for impairment.
Intangible assets are generally amortized on a straight-line basis over their useful life or, alternatively, over the period of legal
protection. Amortized intangible assets are tested for impairment when there is any indication that their recoverable amount may
be less than their carrying amount.
Amortization and impairment losses on intangible assets acquired in a business combination are presented on a separate
statement of income line item, « Amortization and impairment of purchase accounting intangibles ».
Trademarks
Trademarks acquired as part of a business combination are not amortized when they are considered to have an indefinite life.
The criteria used to determine whether or not such trademarks have indefinite lives and, as the case may be, their lifespan, are
as follows:
• brand awareness;
• outlook for the brand in light of the Group’s strategy for integrating the trademark into its existing portfolio.
Non-amortized trademarks are tested for impairment at least annually and whenever there is an indication they may be impaired.
When necessary, an impairment loss is recorded.

SCHNEIDER ELECTRIC – 2017 12
Internally-generated intangible assets
Research and development costs
Research costs are expensed in the statement of income when incurred.
Development costs for new projects are capitalized if, and only if:
• the project is clearly identified and the related costs are separately identified and reliably monitored;
• the project’s technical feasibility has been demonstrated and the Group has the intention and financial resources to complete
the project and to use or sell the resulting products;
• the Group has allocated the necessary technical, financial and other resources to complete the development;
• it is probable that the future economic benefits attributable to the project will flow to the Group.
Development costs that do not meet these criteria are expensed in the financial year in which they are incurred.
Capitalized development projects are amortized over the lifespan of the underlying technology, which generally ranges from three
to ten years, from the date of the commercial launch. The amortization of such capitalized projects is included in the cost of the
related products and classified into « Cost of sales » when the products are sold.
Software implementation
External and internal costs relating to the implementation of Enterprise Resource Planning (ERP) applications are capitalized
when they relate to the programming, coding and testing phase. They are amortized over the applications’ useful lives. In
accordance with paragraph 98 of IAS 38, the SAP bridge application currently being rolled out within the Group is amortized using
the production unit method to reflect the pattern in which the asset’s future economic benefits are expected to be consumed. Said
units of production correspond to the number of users of the rolled-out solution divided by the number of target users at the end
of the roll-out.
1.10 – Property, plant and equipment
Property, plant and equipment is primarily comprised of land, buildings and production equipment and is carried at cost, less
accumulated depreciation and any accumulated impairment losses, in accordance with the recommended treatment in IAS 16 –
Property, plant and equipment.
Each component of an item of property, plant and equipment with a useful life that differs from that of the item as a whole is
depreciated separately on a straight-line basis. The main useful lives are as follows:
• buildings: ......................................................................................................................................................... 20 to 40 years;
• machinery and equipment: ................................................................................................................................. 3 to 10 years;
• other: ................................................................................................................................................................. 3 to 12 years.
The useful life of property, plant and equipment used in operating activities, such as production lines, reflects the related products’
estimated life cycles.
Useful lives of items of property, plant and equipment are reviewed periodically and may be adjusted prospectively if appropriate.
The depreciable amount of an asset is determined after deducting its residual value, when the residual value is material.
Depreciation is expensed in the period or included in the production cost of inventory or the cost of internally-generated intangible
assets. It is recognized in the statement of income under « Cost of sales », « Research and development costs » or « Selling,
general and administrative expenses », as the case may be.
Items of property, plant and equipment are tested for impairment whenever there is an indication they may have been impaired.
Impairment losses are charged to the statement of income under « Other operating income and expenses ».
Leases
The assets used under leases are recognized in the balance sheet, offset by a financial debt, where the leases transfer
substantially all the risks and rewards of ownership to the Group.
Leases that do not transfer substantially all the risks and rewards of ownership are classified as operating leases. The related
payments are recognized as an expense on a straight-line basis over the lease term.
Borrowing costs
In accordance with IAS 23 R – Borrowing costs (applied as of January 1, 2009), borrowing costs that are directly attributable to
the acquisition, construction or production of a qualifying asset are capitalized as part of the cost of the asset when it is probable
that they will result in future economic benefits to the entity and the costs can be measured reliably. Other borrowing costs are
recognized as an expense for the period. Until 2008, borrowing costs were systematically expensed when incurred.

SCHNEIDER ELECTRIC – 2017 13
1.11 – Impairment of assets
In accordance with IAS 36 – Impairment of Assets – the Group assesses the recoverable amount of its long-lived assets as
follows:
• for all property, plant and equipment subject to depreciation and intangible assets subject to amortization, the Group carries
out a review at each balance sheet date to assess whether there is any indication that they may be impaired. Indications of
impairment are identified on the basis of external or internal information. If such an indication exists, the Group tests the asset
for impairment by comparing its carrying amount to the higher of fair value minus costs to sell and value in use;
• non-amortizable intangible assets and goodwill are tested for impairment at least annually and whenever there is an indication
that the asset may be impaired.
Value in use is determined by discounting future cash flows that will be generated by the tested assets. These future cash flows
are based on Group management’s economic assumptions and operating forecasts presented in forecasts over a period generally
not exceeding five years, and then extrapolated based on a perpetuity growth rate. The discount rate corresponds to the Group’s
Weighted Average Cost of Capital (WACC) at the measurement date plus a risk premium depending on the region in question.
The WACC stood at 7.1% at December 31, 2017 (7.3% at December 31, 2016). This rate is based on (i) a long-term interest rate
of 1.21%, corresponding to the average interest rate for 10-year OAT treasury bonds over the past few years, (ii) the average
premium applied to financing obtained by the Group in 2017, and (iii) the weighted country risk premium for the Group’s businesses
in the countries in question (for CGUs WACC only).
The perpetuity growth rate was 2%, unchanged from the previous financial year.
Impairment tests are performed at the level of the Cash-Generating Unit (CGU) to which the asset belongs. A cash-generating
unit is the smallest group of assets that generates cash inflows that are largely independent of the cash flows from other assets
or groups of assets. The cash-generating units are Low Voltage (Building), Medium Voltage (Infrastructure), Industrial Automation
(Industry) and Secure Power (IT). CGUs Net assets were allocated to the CGUs at the lowest possible level on the basis of the
CGU activities to which they belong; the assets belonging to several activities were allocated to each CGU (Low Voltage (Building),
Medium Voltage (Infrastructure) and Industrial Automation (Industry) mainly) pro-rata to their revenue in that CGU.
The WACC used to determine the value in use of each CGU was 7.8% for Low Voltage (Building), 7.9% for Industrial Automation
(Industry), 8.0% for Secure Power (IT), or and 8.2% for Medium Voltage (Infrastructure).
Goodwill is allocated when initially recognized. The CGU allocation is done on the same basis as used by Group management to
monitor operations and assess synergies deriving from acquisitions.
Where the recoverable amount of an asset or CGU is lower than its book value, an impairment loss is recognized for the excess
of the book value over the recoverable value. The recoverable value is defined as the highest value between the value in use and
the realizable value net of costs. Where the tested CGU comprises goodwill, any impairment losses are firstly deducted there
from.
1.12 – Non-current financial assets
Investments in non-consolidated companies are initially recorded at their cost of acquisition and subsequently measured at fair
value. The fair value of investments listed in an active market may be determined reliably and corresponds to the listed price at
balance sheet date (Level 1 from the fair value hierarchy as per IFRS 7).
IFRS 9 standard allows two accounting treatments for equity instruments:
- Fair value is recognised through Other Comprehensive Income, in the comprehensive Income statement, and, in
balance sheet, in equity under « Other reserves », with no subsequent recycling in the income statement even upon
sale.
- Fair value, as well as gain or loss in case of sale, are recognised in the income statement.
The election between those two methods is to be made from inception for each equity investment and is irrevocable.
Venture capital (FCPR) / Mutual funds (SICAV) are recognised at fair value through income statement, in accordance with IFRS
9.
Loans, recorded under « Other non-current financial assets », are carried at amortized cost. In accordance with IFRS 9, a
depreciation is booked from inception to reflect the expected credit risk losses within 12 months. In case of significant degradation
of the credit quality, the initial level of depreciation is modified to cover the entire expected losses over the remaining maturity of
the loan.
SCHNEIDER ELECTRIC – 2017 14
1.13 – Inventories and work in progress
Inventories and work in progress are measured at the lower of their initial recognition cost (acquisition cost or production cost
generally determined by the weighted average price method) or of their estimated net realizable value.
Net realizable value corresponds to the estimated selling price net of remaining expenses to complete and/or sell the products.
Inventory impairment losses are recognized in « Cost of sales ».
The cost of work in progress, semi-finished and finished products, includes the cost of materials and direct labor, subcontracting
costs, all production overheads based on normal manufacturing capacity and the portion of research and development costs that
are directly related to the manufacturing process (corresponding to the amortization of capitalized projects in production and
product and range of products maintenance costs).
1.14 – Trade and other operating receivables
Trade and other operating receivables are depreciated according to the simplified IFRS 9 model. From inception, trade receivables
are depreciated to the extent of the expected losses over their remaining maturity.
The credit risk of trade receivables is assessed on a collective basis country by country, as the geographical origin of receivables
is considered representative of their risk profile. Countries are classified by risk profile using the assessment provided by an
external agency. The provision for expected credit losses is evaluated using (i) the probabilities of default communicated by a
credit agency, (ii) historical default rates, (iii) ageing balance, (iv) as well as the Group’s assessment of the credit risk taking into
account guarantees and credit insurance
Once it is known with certainty that a doubtful account will not be collected, the doubtful account and its related depreciation are
written off through the Income Statement.
Accounts receivable are discounted in cases where they are due in over one year and the impact of adjustment is significant.
1.15 – Assets held for sale
Assets held for sale are no longer amortized or depreciated and are recorded separately in the balance sheet under « Assets held
for sale » at the lower of its amortized cost or net realizable value.
1.16 – Deferred taxes
Deferred taxes, related to temporary differences between the tax basis and accounting basis of consolidated assets and liabilities,
are recorded using the balance sheet liability method. Deferred tax assets are recognized when it is probable that they will be
recovered at a reasonably determinable date.
Future tax benefits arising from the utilization of tax loss carry forwards (including amounts available for carry forward without time
limit) are recognized only when they can reasonably be expected to be realized.
Deferred tax assets and liabilities are not discounted. Deferred tax assets and liabilities related to the same unit and which are
expected to reverse in the same period of time are netted off.
1.17 – Cash and cash equivalents
Cash and cash equivalents presented in the balance sheet consist of cash, bank accounts, term deposits of three months or less
and marketable securities traded on organized markets. Marketable securities are short-term, highly-liquid investments that are
readily convertible to known amounts of cash at maturity. They notably consist of commercial paper, mutual funds and equivalents.
In light of their nature and maturities, these instruments represent insignificant risk of changes in value and are treated as cash
equivalents.
1.18 – Schneider Electric SE shares
Schneider Electric SE shares held by the parent company or by fully consolidated companies are measured at acquisition cost
and deducted from equity. They are held at their acquisition cost until sold.
Gains (losses) on the sale of own shares are added (deducted) from consolidated reserves, net of tax.
SCHNEIDER ELECTRIC – 2017 15
1.19 – Pensions and other employee benefit obligations
Depending on local practices and laws, the Group’s subsidiaries participate in pension, termination benefit and other long-term
benefit plans. Benefits paid under these plans depend on factors such as seniority, compensation levels and payments into
mandatory retirement programs.
Defined contribution plans
Payments made under defined contribution plans are recorded in the income statement, in the year of payment, and are in full
settlement of the Group’s liability. As the Group is not committed beyond these contributions, no provision related to these plans
has been booked.
In most countries, the Group participates in mandatory general plans, which are accounted for as defined contribution plans.
Defined benefit plans
Defined benefit plans are measured using the projected unit credit method.
Expenses recognized in the statement of income are split between operating income (for service costs rendered during the period)
and net financial income/(loss) (for financial costs and expected return on plan assets).
The amount recognized in the balance sheet corresponds to the present value of the obligation, and net of plan assets.
When this is an asset, the recognized asset is limited to the present value of any economic benefit due in the form of plan refunds
or reductions in future plan contributions.
Changes resulting from periodic adjustments to actuarial assumptions regarding general financial and business conditions or
demographics (i.e., changes in the discount rate, annual salary increases, return on plan assets, years of service, etc.) as well as
experience adjustments are immediately recognized in the balance sheet as a separate component of equity in « Other
reserves » and in comprehensive income as other comprehensive income/loss.
Other commitments
Provisions are funded and expenses recognized to cover the cost of providing health-care benefits for certain Group retirees in
Europe and the United States. The accounting policies applied to these plans are similar to those used to account for defined
benefit pension plans.
The Group also funds provisions for all its subsidiaries to cover seniority-related benefits (primarily long service awards for its
French subsidiaries). Actuarial gains and losses on these benefit obligations are fully recognized in profit or loss.
1.20 – Share-based payments
The Group grants different types of share-based payments to senior executives and certain employees. These include:
• performance shares;
• Schneider Electric SE stock options (until 2009);
• Stock Appreciation Rights, based on the Schneider Electric SE stock price (until 2013).
Pursuant to the application of IFRS 2 – Share-based payments, these plans are measured on the date of grant and an employee
benefits expense is recognized on a straight-line basis over the vesting period, in general three or four years depending on the
country in which it is granted.
The Group uses the Cox, Ross, Rubinstein binomial model to measure these plans.
For performance shares and stock options, this expense is offset in the own share reserve. In the case of stock appreciation
rights, a liability is recorded corresponding to the amount of the benefit granted, re-measured at each balance sheet date.
As part of its commitment to employee share ownership, Schneider Electric gave its employees the opportunity to purchase shares
at a discount (note 21.4).

SCHNEIDER ELECTRIC – 2017 16
1.21 – Provisions for contingencies and charges
A provision is recorded when the Group has an obligation to a third party prior to the balance sheet date, and where the loss or
liability is likely and can be reliably measured. If the loss or liability is not likely and cannot be reliably estimated, but remains
possible, the Group discloses it as a contingent liability. Provisions are calculated on a case-by-case or statistical basis and
discounted when due in over a year. The discount rate used for long-term provisions was 1.4% at December 31, 2017, unchanged
from December 31, 2016.
Provisions are primarily set aside to cover:
• economic risks:
these provisions cover tax risks arising from tax audits performed by local tax authorities and financial risks arising primarily
on guarantees given to third parties in relation to certain assets and liabilities;
• customer risks:
these provisions are primarily established to cover risks arising from products sold to third parties. This risk mainly consists of
claims based on alleged product defects and product liability;
• product risks:
these provisions comprise:
– statistical provisions for warranties: The Group funds provisions on a statistical basis for the residual cost of Schneider
Electric product warranties not covered by insurance,
– provisions to cover disputes concerning defective products and recalls of clearly identified products;
• environmental risks:
these provisions are primarily funded to cover clean-up costs;
• restructuring costs, when the Group has prepared a detailed plan for the restructuring and has either announced or started to
implement the plan before the end of the year.
1.22 – Financial liabilities
Financial liabilities primarily comprise bonds and short and long-term bank borrowings. These liabilities are initially recorded at
fair value, from which any direct transaction costs are deducted. Subsequently, they are measured at amortized cost based on
their effective interest rate.
1.23 – Financial instruments and derivatives
Risk hedging management is centralized. The Group’s policy is to use derivative financial instruments exclusively to manage and
hedge changes in exchange rates, interest rates or prices of certain raw materials. The Group accordingly uses instruments such
as swaps, options and futures, depending on the nature of the exposure to be hedged.
In accordance with the IFRS 9 (paragraph 6.1.3), the Group decided to continue applying IAS39 hedge accounting requirements.
Foreign currency hedges
The Group periodically buys foreign currency derivatives to hedge the currency risk associated with foreign currency transactions.
Some of these instruments hedge operating receivables and payables carried in the balance sheets of Group companies. The
Group does not apply hedge accounting to these instruments because gains and losses on this hedging is immediately recognized.
At year-end, the hedging derivatives are mark to market and gains or losses are recognized in « Net financial income/(loss) »,
offsetting the gains or losses resulting from the translation at end-of-year rates of foreign currency payables and receivables, in
accordance with IAS 21 – The Effects of Changes in Foreign Exchange Rates.
The Group also hedges future cash flows, including recurring future transactions, intra-group foreign currency loans or planned
acquisitions or disposals of investments. In accordance with IAS 39, these are treated as cash flow hedges. These hedging
instruments are recognized in the balance sheet and are measured at fair value at the end of the year. The portion of the gain or
loss on the hedging instrument that is determined to be an effective hedge is accumulated in equity, under « Other reserves »,
and then recognized in the income statement when the hedged item affects profit or loss. The ineffective portion of the gain or
loss on the hedging instrument is recognized in « Net financial income/(loss) ».
In addition, certain long-term receivables and loans to subsidiaries are considered to be part of a net investment in a foreign
operation, as defined by IAS 21 – The Effects of Changes in Foreign Exchange Rates. In accordance with the rules governing
hedges of net investments, the impact of exchange rate fluctuations is recorded in equity and recognized in the statement of
income when the investment is sold.

SCHNEIDER ELECTRIC – 2017 17
Interest rate swaps
Interest rate swaps allow the Group to manage its exposure to interest rate risk. The derivative instruments used are financially
adjusted to the schedules, rates and currencies of the borrowings they cover. They involve the exchange of fixed and floating-rate
interest payments. The differential to be paid (or received) is accrued (or deferred) as an adjustment to interest income or expense
over the life of the agreement. The Group applies hedge accounting as described in IAS 39 for interest rate swaps. Gains and
losses on re-measurement of interest rate swaps at fair value are recognized in equity (for cash flow hedges) or in profit or loss
(for fair value hedges).
Commodity contracts
The Group also purchases commodity derivatives including forward purchase contracts, swaps and options to hedge price risks
on all or part of its forecast future purchases. Under IAS 39, these qualify as cash flow hedges. These instruments are recognized
in the balance sheet at fair value at the period-end (mark to market). The effective portion of the hedge is recognized separately
in equity (under « Other reserves ») and then recognized in income (gross margin) when the underlying hedge affects consolidated
income. The effect of this hedging is then incorporated in the cost price of the products sold. The ineffective portion of the gain or
loss on the hedging instrument is recognized in « Net financial income/(loss) ».
Cash flows from financial instruments are recognized in the consolidated statement of cash flows in a manner consistent with the
underlying transactions.
Put options granted to minority shareholders
In line with the AMF’s recommendation of November 2009 and in the absence of a specific IFRS rule, the Group elected to retain
the accounting treatment for minority put options applied up to December 31, 2009, involving puts granted to minority shareholders
prior to this date. In this case, the Group elected to recognize the difference between the purchase price of the minority interests
and the share of the net assets acquired as goodwill, without re-measuring the assets and liabilities acquired. Subsequent changes
in the fair value of the liability are recognized by adjusting goodwill.
The Group opted for accounting subsequent fair value changes of put options granted to minority shareholders with counterpart
in equity.
1.24 – Revenue recognition
The Group’s revenues primarily include transactional sales and revenues from services and contracts.
Transactional sales
Revenue from sales is recognized when the product is shipped and risks and benefits are transferred (standard shipping terms
are FOB).
Provisions for the discounts offered to distributors are set aside when the products are sold to the distributor and recognized as a
deduction from revenue.
Certain Group subsidiaries also offer cash discounts to distributors. These discounts and rebates are deducted from sales.
Consolidated revenue is presented net of these discounts and rebates.
Service contracts
Revenue from service contracts is recorded over the contractual period of service. It is recognized when the result of the
transaction can be reliably determined, by the percentage of completion method.
Long-term contracts
Income from long-term contracts is recognized using the percentage-of-completion method, based either on the percentage of
costs incurred in relation to total estimated costs of the entire contract, or on the contract’s technical milestones, notably proof of
installation or delivery of equipment. When a contract includes performance clauses in the Group’s favor, the related revenue is
recognized at each project milestone and a provision is set aside if targets are not met.
Losses at completion for a given contract are provided for in full as soon as they become probable. The cost of work-in-process
includes direct and indirect costs relating to the contracts.
1.25 – Earnings per share
Earnings per share are calculated in accordance with IAS 33 – Earnings Per Share.
Diluted earnings per share are calculated by adjusting profit attributable to equity holders of the parent and the weighted average
number of shares outstanding for the dilutive effect of the exercise of stock options outstanding at the balance sheet date. The
dilutive effect of stock options is determined by applying the « treasury stock » method, which consists of taking into account the
number of shares that could be purchased, based on the average share price for the year, using the proceeds from the exercise
of the rights attached to the options.
SCHNEIDER ELECTRIC – 2017 18
1.26 – Statement of cash flows
The consolidated statement of cash flows has been prepared using the indirect method, which consists of reconciling net profit to
net cash provided by operations. The opening and closing cash positions include cash and cash equivalents, comprised of
marketable securities, net of bank overdrafts and facilities.

SCHNEIDER ELECTRIC – 2017 19
Note 2 Changes in the scope of consolidation
The Group’s consolidated financial statements for the year ended December 31, 2017 enclose the financial statements of 561
companies. The principal companies are listed in the note 32. The scope of consolidation for the year ended December 31, 2017
can be summarized as follows:
Number of active companies Dec. 31, 2017 Dec. 31, 2016
Parent company and fully consolidated subsidiaries 546 547
Companies accounted for by the equity method 15 13
TOTAL 561 560
2.1 – Follow-up on acquisitions and divestments occurred in 2016 with significant effect in 2017
Acquisitions
No acquisition occurred in 2016 that had a significant impact on 2017 financial statements.
Disposals
On December 14, 2015, Schneider Electric announced that it has signed an agreement to sell its Transportation Business, to
Kapsch TrafficCom AG. On March 31, 2016, the transaction was finalized with a final sale price established at EUR31 million.
2.2 – Acquisitions and divestments occurred during the year
Acquisitions
On July 27th 2017, Schneider Electric announced that it has signed an agreement to acquire Asco Power Technologies (“ASCO”),
a leader in the Automatic Transfer Switch (“ATS”) market for a consideration of circa USD1,250 million in an all cash transaction.
The transaction was finalized on October 31st, 2017. ASCO is fully consolidated in the Low Voltage (Building) business since
November 1st, 2017. The purchase accounting resulting from the acquisition of ASCO is not completed at the closing date. As at
December 31st, 2017, the Group recognized intangible assets for a preliminary amount of EUR 506 million (trademark, patents
and customer relationship), based on the most recent valuation available before the acquisition. The goodwill is not tax deductible.
Besides, the Group also acquired the minority interest of Luminous.
Disposals
On April 3rd, 2017, the Group announced that it has signed an agreement to sell its Telvent DTN business, to TBG AG. On May 31st, 2017, the transaction was finalized with a final base sale price established at USD900 million.
Cash-flows impacts
The effect of acquisitions and divestments during the year is a net cash outflow amounting to EUR557 million in 2017:
Dec. 31, 2017 Dec. 31, 2016
Acquisitions (1,165) (64)
Purchase of minority interests (141) -
Disposals 749 111
NET FINANCIAL INVESTMENT (557) 47
In 2017, the cash inflow from disposals is mainly related to the price received for the Telvent DTN divestment. The cash outflow
from acquisition is mainly related to the price paid for ASCO.
In 2016, the cash inflow from disposals is mainly related to the price received for the Telvent Transportation divestment.

SCHNEIDER ELECTRIC – 2017 20
Note 3 Segment information
The Group is organized in four businesses: Low Voltage (Building), Medium Voltage (Infrastructure), Industrial Automation
(Industry) and Secure Power (IT):
• Low Voltage (Building) provides low voltage power and building automation products and solutions that address the needs
of all end markets from buildings to industries and infrastructure to data centers to help customers improve the energy
efficiency of the buildings;
• Medium Voltage (Infrastructure), combines all Medium Voltage activities; the business is in charge of the end-customer
segments Oil and Gas, Electric Utilities and Transportation when it relates to solutions integrating the offers of several activities
from the Group;
• Industrial Automation (Industry), which includes Automation & Control and four end-customer segments: OEMs, Water,
Mining Minerals & Metals and Food & Beverages when it relates to solutions integrating the offers of several activities from
the Group;
• Secure Power (IT), which covers Critical Power & Cooling Services and three end-customer segments (Bank & Insurance,
IT industry and Cloud & Telecom) when it relates to solutions integrating the offers of several activities from the Group.
Expenses concerning General Management that cannot be allocated to a particular segment are presented under « Corporate
costs ».
Operating segment data is identical to that presented to the board of directors, which has been identified as the main decision-
making body for allocating resources and evaluating segment performance. Performance assessments used by the board of
directors are notably based on Adjusted EBITA. Share-based payment is presented under « Corporate costs ». The board of
directors does not review assets and liabilities by Business.
The same accounting principles governing the consolidated financial statements apply to segment data.
Details are provided in Chapter 4 of the registration document (Business Review).
3.1 – Information by operating segment
Full year 2017
(in millions of euros) Low Voltage
(Building)
Industrial
Automation
(Industry)
Medium
Voltage
(Infrastructure)
Secure
Power (IT)
Corporate
costs
Total
Revenue 10,812 5,816 4,500 3,615 - 24,743
Adjusted EBITA* 2,232 1,021 449 600 (651) 3,651
Adjusted EBITA % 20.6% 17.6% 10.0% 16.6% - 14.8%
* Adjusted EBITA: EBITA before restructuring costs and before other operating income and expenses (including acquisition, integration and
separation costs).
Full year 2016*
(in millions of euros) Low Voltage
(Building)
Industrial
Automation
(Industry)
Medium
Voltage
(Infrastructure)
Secure
Power (IT)
Corporate
costs
Total
Revenue 10,466 5,485 4,919 3,589 - 24,459
Adjusted EBITA** 2,117 918 477 604 (618) 3,498
Adjusted EBITA % 20.2% 16.7% 9.7% 16.8% - 14.3%
* 2016 figures were restated for discontinued operations disclosed in note 1.
** Adjusted EBITA: EBITA before restructuring costs and before other operating income and expenses (including acquisition, integration and
separation costs).
SCHNEIDER ELECTRIC – 2017 21
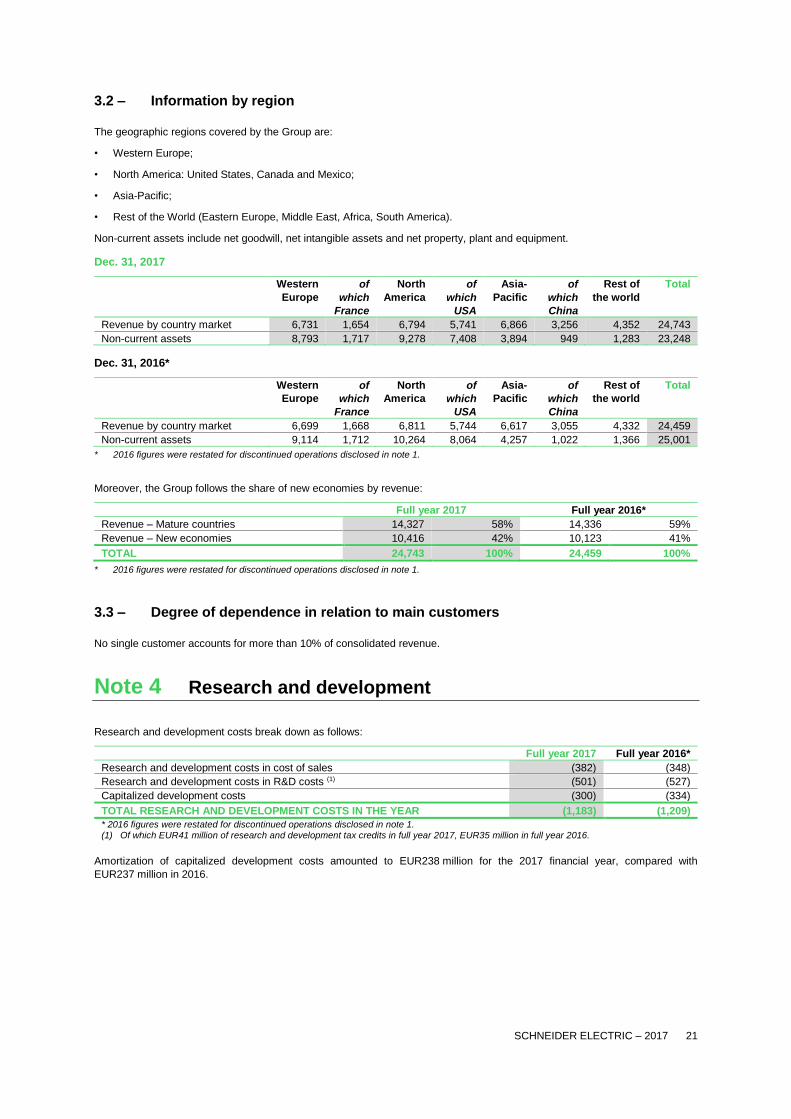
3.2 – Information by region
The geographic regions covered by the Group are:
• Western Europe;
• North America: United States, Canada and Mexico;
• Asia-Pacific;
• Rest of the World (Eastern Europe, Middle East, Africa, South America).
Non-current assets include net goodwill, net intangible assets and net property, plant and equipment.
Dec. 31, 2017
Western
Europe
of
which
France
North
America
of
which
USA
Asia-
Pacific
of
which
China
Rest of
the world
Total
Revenue by country market 6,731 1,654 6,794 5,741 6,866 3,256 4,352 24,743
Non-current assets 8,793 1,717 9,278 7,408 3,894 949 1,283 23,248
Dec. 31, 2016*
Western
Europe
of
which
France
North
America
of
which
USA
Asia-
Pacific
of
which
China
Rest of
the world
Total
Revenue by country market 6,699 1,668 6,811 5,744 6,617 3,055 4,332 24,459
Non-current assets 9,114 1,712 10,264 8,064 4,257 1,022 1,366 25,001
* 2016 figures were restated for discontinued operations disclosed in note 1.
Moreover, the Group follows the share of new economies by revenue:
Full year 2017 Full year 2016*
Revenue – Mature countries 14,327 58% 14,336 59%
Revenue – New economies 10,416 42% 10,123 41%
TOTAL 24,743 100% 24,459 100%
* 2016 figures were restated for discontinued operations disclosed in note 1.
3.3 – Degree of dependence in relation to main customers
No single customer accounts for more than 10% of consolidated revenue.
Note 4 Research and development
Research and development costs break down as follows:
Full year 2017 Full year 2016*
Research and development costs in cost of sales (382) (348)
Research and development costs in R&D costs (1) (501) (527)
Capitalized development costs (300) (334)
TOTAL RESEARCH AND DEVELOPMENT COSTS IN THE YEAR (1,183) (1,209)
* 2016 figures were restated for discontinued operations disclosed in note 1.
(1) Of which EUR41 million of research and development tax credits in full year 2017, EUR35 million in full year 2016.
Amortization of capitalized development costs amounted to EUR238 million for the 2017 financial year, compared with
EUR237 million in 2016.

SCHNEIDER ELECTRIC – 2017 22
Note 5 Depreciation and amortization expenses
Depreciation and amortization expenses recognized in operating expenses were as follows:
Full year 2017 Full year 2016*
Included in cost of sales:
Depreciation and amortization (518) (525)
Included in selling, general and administrative expenses:
Depreciation and amortization (151) (117)
DEPRECIATION AND AMORTIZATION EXPENSES (669) (642)
* 2016 figures were restated for discontinued operations disclosed in note 1.
Note 6 Other operating income and expenses
Other operating income and expenses break down as follows:
Full year 2017 Full year 2016
Impairment losses on assets (92) (87)
Gains on asset disposals 108 8
Losses on asset disposals (8) (42)
Costs of acquisitions (75) (36)
Pension plan curtailments and settlements 103 31
Others (51) 63
OTHER OPERATING INCOME AND EXPENSES (15) (63)
In 2017, gains on asset disposals mostly include the impact of the disposal of Telvent DTN business.
The line « Pension plan curtailments and settlements » includes mainly provision releases in the USA and France in 2017; and in
2016 in the USA and Switzerland.
The costs of acquisitions are the costs of acquisition, integration and separation related to major acquisitions and disposals from
2016 to 2017.
Others in 2017 includes mainly provisions for litigation on non-operating expenses. Others in 2016 includes mainly the release of
a provision against a legal claim which was settled in the first half of 2016.
Note 7 Restructuring costs
Restructuring costs totalled EUR286 million over the period. They mainly relate to industrial and support function reorganizations
in all geographies.
Note 8 Amortization and impairment of purchase accounting
intangibles
Full year 2017 Full year 2016*
Amortization of purchase accounting intangibles (117) (151)
Impairment of purchase accounting intangibles (23) -
AMORTIZATION AND IMPAIRMENT OF PURCHASE ACCOUNTING
INTANGIBLES
(140) (151)
* 2016 figures were restated for discontinued operations disclosed in note 1.
Impairment tests performed in 2017 have not led to impairment losses being recognized on the CGUs’ other assets. The sensitivity
analysis on the test hypothesis shows that no impairment losses would be recognized in the following scenarios:
• a 0.5 point increase of the discount rate;
• a 1.0 point decrease in the growth rate;
• a 0.5 point decrease in the margin rate.

SCHNEIDER ELECTRIC – 2017 23
Note 9 Other financial income and expense
Full year 2017 Full year 2016
Exchange gains and losses, net (24) (59)
Financial component of defined benefit plan costs (69) (74)
Dividends received 2 5
Fair value adjustment of financial assets (2) (2)
Other financial expense, net (55) (60)
OTHER FINANCIAL INCOME AND EXPENSE (148) (190)
Note 10 Income tax expense
Whenever possible, Group entities file consolidated tax returns. Schneider Electric SE has chosen this option for the French
subsidiaries it controls directly or indirectly through Schneider Electric Industries SAS.
10.1 – Analysis of income tax expense
Full year 2017 Full year 2016*
Current taxes
France (26) (205)
International (655) (387)
Total (681) (592)
Deferred taxes
France 10 30
International 71 (157)
Total 81 (127)
INCOME TAX (EXPENSE)/BENEFIT (600) (719)
* 2016 figures were restated for discontinued operations disclosed in note 1.
In 2017, the tax reforms in the USA and in Belgium, as well as the additional reform in France, led together to a positive
adjustment in the P&L for EUR12 million. This impact represents the Group’s best estimate of those reforms on the deferred tax
positions as at December 31,2017.
In 2016, the planned reduction of the Corporate Income Tax rate in France from 34.43% to 28.92% following the passing of the
Finance Bill 2017 (“Loi de finances 2017”) leads to a negative adjustment of the P&L at the end of 2016 for EUR(119) million.
This is to account for the adjustment downward of the net deferred tax assets corresponding mainly to past tax losses in France.
SCHNEIDER ELECTRIC – 2017 24
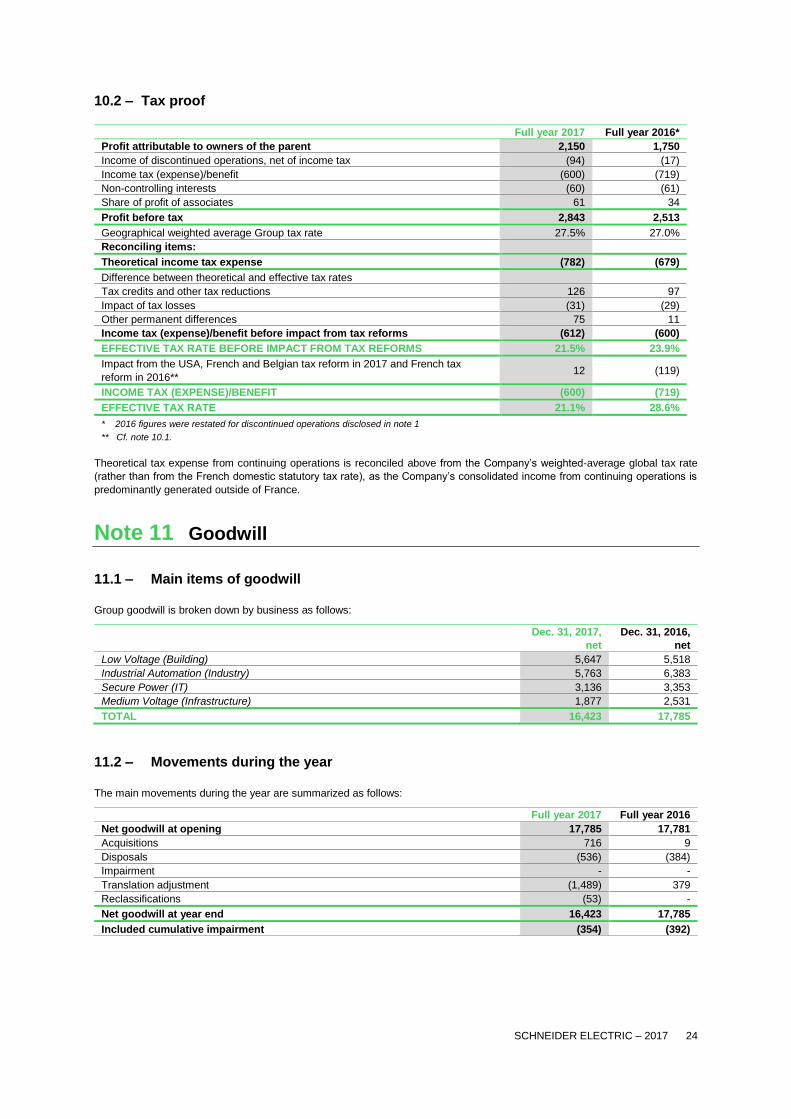
10.2 – Tax proof
Full year 2017 Full year 2016*
Profit attributable to owners of the parent 2,150 1,750
Income of discontinued operations, net of income tax (94) (17)
Income tax (expense)/benefit (600) (719)
Non-controlling interests (60) (61)
Share of profit of associates 61 34
Profit before tax 2,843 2,513
Geographical weighted average Group tax rate 27.5% 27.0%
Reconciling items:
Theoretical income tax expense (782) (679)
Difference between theoretical and effective tax rates
Tax credits and other tax reductions 126 97
Impact of tax losses (31) (29)
Other permanent differences 75 11
Income tax (expense)/benefit before impact from tax reforms (612) (600)
EFFECTIVE TAX RATE BEFORE IMPACT FROM TAX REFORMS 21.5% 23.9%
Impact from the USA, French and Belgian tax reform in 2017 and French tax
reform in 2016** 12 (119)
INCOME TAX (EXPENSE)/BENEFIT (600) (719)
EFFECTIVE TAX RATE 21.1% 28.6%
* 2016 figures were restated for discontinued operations disclosed in note 1
** Cf. note 10.1.
Theoretical tax expense from continuing operations is reconciled above from the Company’s weighted-average global tax rate
(rather than from the French domestic statutory tax rate), as the Company’s consolidated income from continuing operations is
predominantly generated outside of France.
Note 11 Goodwill
11.1 – Main items of goodwill
Group goodwill is broken down by business as follows:
Dec. 31, 2017,
net
Dec. 31, 2016,
net
Low Voltage (Building) 5,647 5,518
Industrial Automation (Industry) 5,763 6,383
Secure Power (IT) 3,136 3,353
Medium Voltage (Infrastructure) 1,877 2,531
TOTAL 16,423 17,785
11.2 – Movements during the year
The main movements during the year are summarized as follows:
Full year 2017 Full year 2016
Net goodwill at opening 17,785 17,781
Acquisitions 716 9
Disposals (536) (384)
Impairment - -
Translation adjustment (1,489) 379
Reclassifications (53) -
Net goodwill at year end 16,423 17,785
Included cumulative impairment (354) (392)
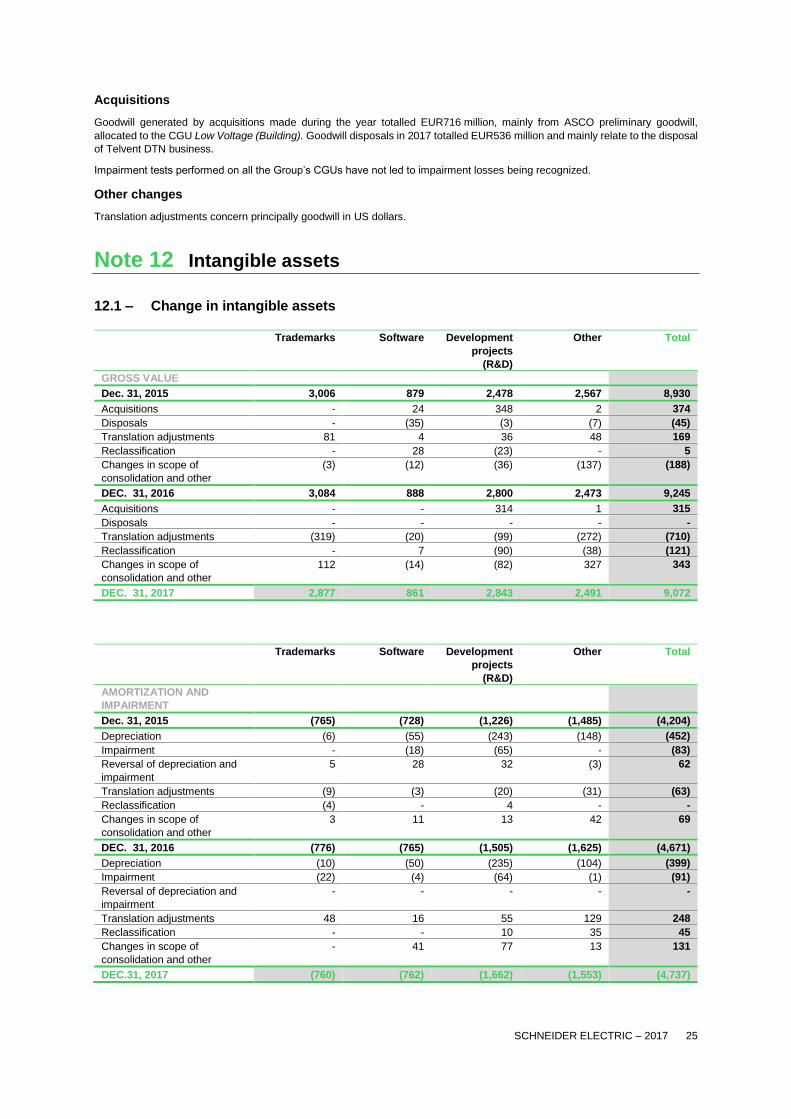
SCHNEIDER ELECTRIC – 2017 25
Acquisitions
Goodwill generated by acquisitions made during the year totalled EUR716 million, mainly from ASCO preliminary goodwill,
allocated to the CGU Low Voltage (Building). Goodwill disposals in 2017 totalled EUR536 million and mainly relate to the disposal
of Telvent DTN business.
Impairment tests performed on all the Group’s CGUs have not led to impairment losses being recognized.
Other changes
Translation adjustments concern principally goodwill in US dollars.
Note 12 Intangible assets
12.1 – Change in intangible assets
Trademarks Software Development
projects
(R&D)
Other Total
GROSS VALUE
Dec. 31, 2015 3,006 879 2,478 2,567 8,930
Acquisitions - 24 348 2 374
Disposals - (35) (3) (7) (45)
Translation adjustments 81 4 36 48 169
Reclassification - 28 (23) - 5
Changes in scope of
consolidation and other
(3) (12) (36) (137) (188)
DEC. 31, 2016 3,084 888 2,800 2,473 9,245
Acquisitions - - 314 1 315
Disposals - - - - -
Translation adjustments (319) (20) (99) (272) (710)
Reclassification - 7 (90) (38) (121)
Changes in scope of
consolidation and other
112 (14) (82) 327 343
DEC. 31, 2017 2,877 861 2,843 2,491 9,072
Trademarks Software Development
projects
(R&D)
Other Total
AMORTIZATION AND
IMPAIRMENT
Dec. 31, 2015 (765) (728) (1,226) (1,485) (4,204)
Depreciation (6) (55) (243) (148) (452)
Impairment - (18) (65) - (83)
Reversal of depreciation and
impairment
5 28 32 (3) 62
Translation adjustments (9) (3) (20) (31) (63)
Reclassification (4) - 4 - -
Changes in scope of
consolidation and other
3 11 13 42 69
DEC. 31, 2016 (776) (765) (1,505) (1,625) (4,671)
Depreciation (10) (50) (235) (104) (399)
Impairment (22) (4) (64) (1) (91)
Reversal of depreciation and
impairment
- - - - -
Translation adjustments 48 16 55 129 248
Reclassification - - 10 35 45
Changes in scope of
consolidation and other
- 41 77 13 131
DEC.31, 2017 (760) (762) (1,662) (1,553) (4,737)
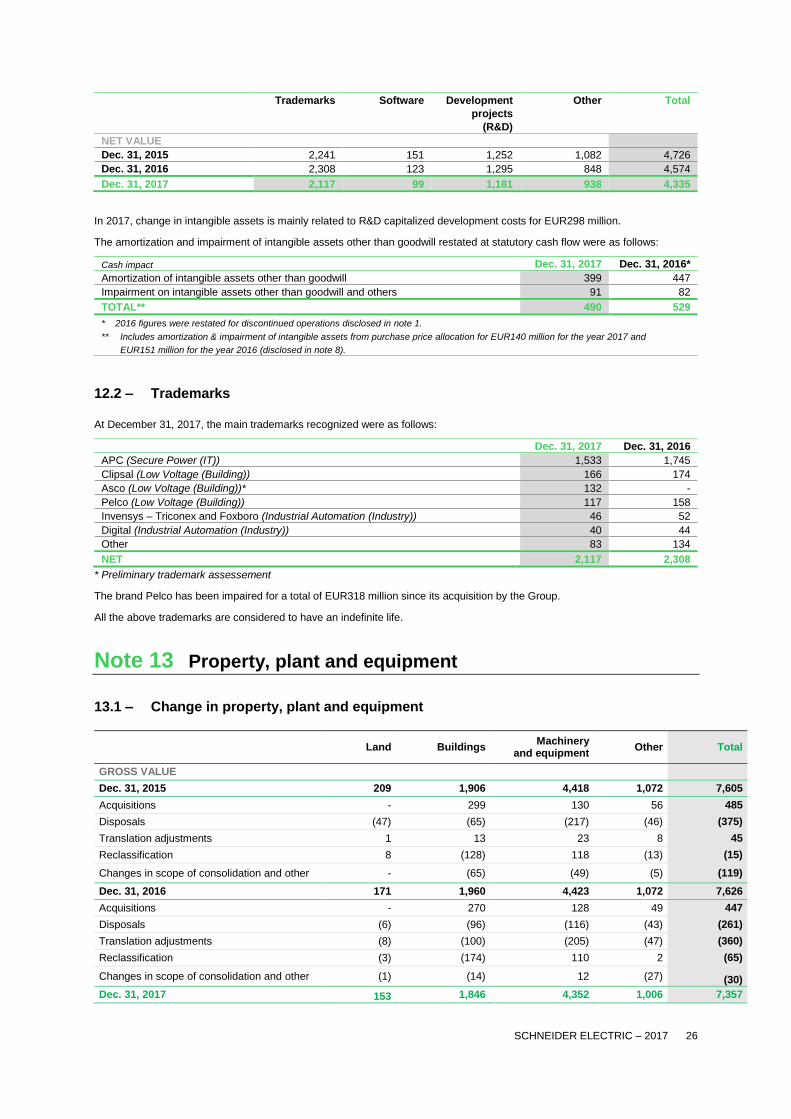
SCHNEIDER ELECTRIC – 2017 26
Trademarks Software Development
projects
(R&D)
Other Total
NET VALUE
Dec. 31, 2015 2,241 151 1,252 1,082 4,726
Dec. 31, 2016 2,308 123 1,295 848 4,574
Dec. 31, 2017 2,117 99 1,181 938 4,335
In 2017, change in intangible assets is mainly related to R&D capitalized development costs for EUR298 million.
The amortization and impairment of intangible assets other than goodwill restated at statutory cash flow were as follows:
Cash impact Dec. 31, 2017 Dec. 31, 2016*
Amortization of intangible assets other than goodwill 399 447
Impairment on intangible assets other than goodwill and others 91 82
TOTAL** 490 529
* 2016 figures were restated for discontinued operations disclosed in note 1.
** Includes amortization & impairment of intangible assets from purchase price allocation for EUR140 million for the year 2017 and
EUR151 million for the year 2016 (disclosed in note 8).
12.2 – Trademarks
At December 31, 2017, the main trademarks recognized were as follows:
Dec. 31, 2017 Dec. 31, 2016
APC (Secure Power (IT)) 1,533 1,745
Clipsal (Low Voltage (Building)) 166 174
Asco (Low Voltage (Building))* 132 -
Pelco (Low Voltage (Building)) 117 158
Invensys – Triconex and Foxboro (Industrial Automation (Industry)) 46 52
Digital (Industrial Automation (Industry)) 40 44
Other 83 134
NET 2,117 2,308
* Preliminary trademark assessement
The brand Pelco has been impaired for a total of EUR318 million since its acquisition by the Group.
All the above trademarks are considered to have an indefinite life.
Note 13 Property, plant and equipment
13.1 – Change in property, plant and equipment
Land Buildings Machinery
and equipment Other Total
GROSS VALUE
Dec. 31, 2015 209 1,906 4,418 1,072 7,605
Acquisitions - 299 130 56 485
Disposals (47) (65) (217) (46) (375)
Translation adjustments 1 13 23 8 45
Reclassification 8 (128) 118 (13) (15)
Changes in scope of consolidation and other - (65) (49) (5) (119)
Dec. 31, 2016 171 1,960 4,423 1,072 7,626
Acquisitions - 270 128 49 447
Disposals (6) (96) (116) (43) (261)
Translation adjustments (8) (100) (205) (47) (360)
Reclassification (3) (174) 110 2 (65)
Changes in scope of consolidation and other (1) (14) 12 (27) (30)
Dec. 31, 2017 153 1,846 4,352 1,006 7,357
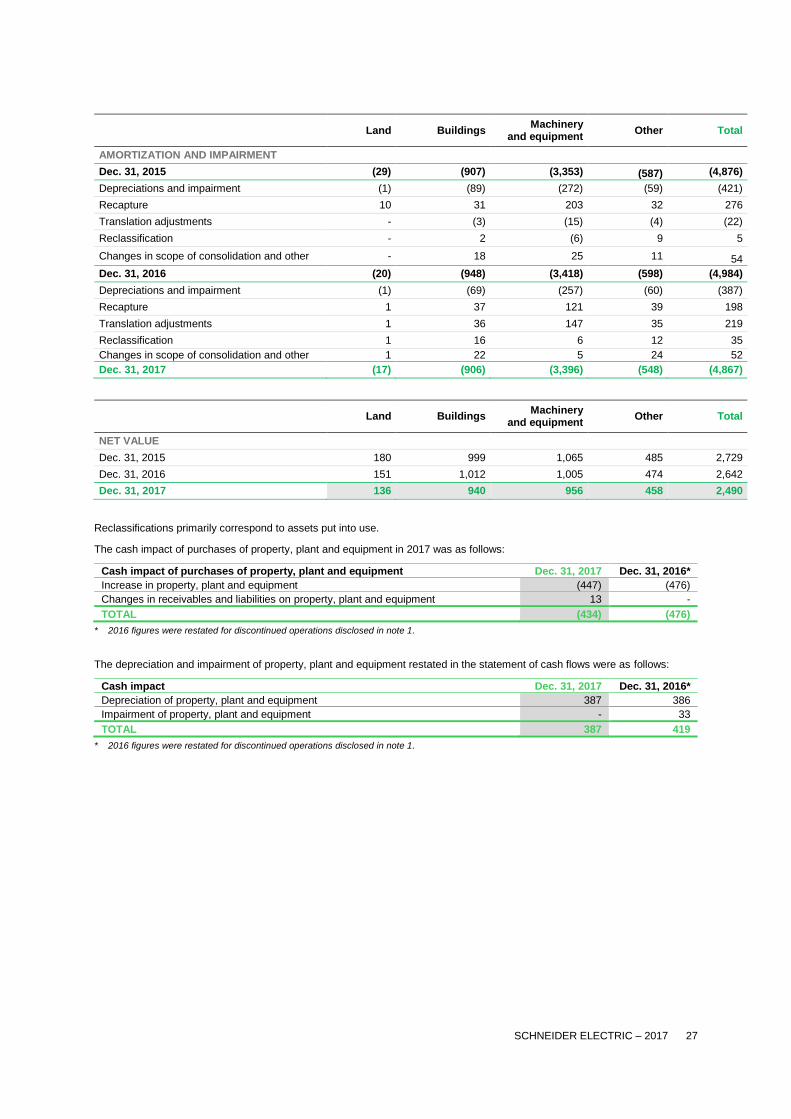
SCHNEIDER ELECTRIC – 2017 27
Land Buildings Machinery
and equipment Other Total
AMORTIZATION AND IMPAIRMENT
Dec. 31, 2015 (29) (907) (3,353) (587) (4,876)
Depreciations and impairment (1) (89) (272) (59) (421)
Recapture 10 31 203 32 276
Translation adjustments - (3) (15) (4) (22)
Reclassification - 2 (6) 9 5
Changes in scope of consolidation and other - 18 25 11 54
Dec. 31, 2016 (20) (948) (3,418) (598) (4,984)
Depreciations and impairment (1) (69) (257) (60) (387)
Recapture 1 37 121 39 198
Translation adjustments 1 36 147 35 219
Reclassification 1 16 6 12 35
Changes in scope of consolidation and other 1 22 5 24 52
Dec. 31, 2017 (17) (906) (3,396) (548) (4,867)
Land Buildings Machinery
and equipment Other Total
NET VALUE
Dec. 31, 2015 180 999 1,065 485 2,729
Dec. 31, 2016 151 1,012 1,005 474 2,642
Dec. 31, 2017 136 940 956 458 2,490
Reclassifications primarily correspond to assets put into use.
The cash impact of purchases of property, plant and equipment in 2017 was as follows:
Cash impact of purchases of property, plant and equipment Dec. 31, 2017 Dec. 31, 2016*
Increase in property, plant and equipment (447) (476)
Changes in receivables and liabilities on property, plant and equipment 13 -
TOTAL (434) (476)
* 2016 figures were restated for discontinued operations disclosed in note 1.
The depreciation and impairment of property, plant and equipment restated in the statement of cash flows were as follows:
Cash impact Dec. 31, 2017 Dec. 31, 2016*
Depreciation of property, plant and equipment 387 386
Impairment of property, plant and equipment - 33
TOTAL 387 419
* 2016 figures were restated for discontinued operations disclosed in note 1.
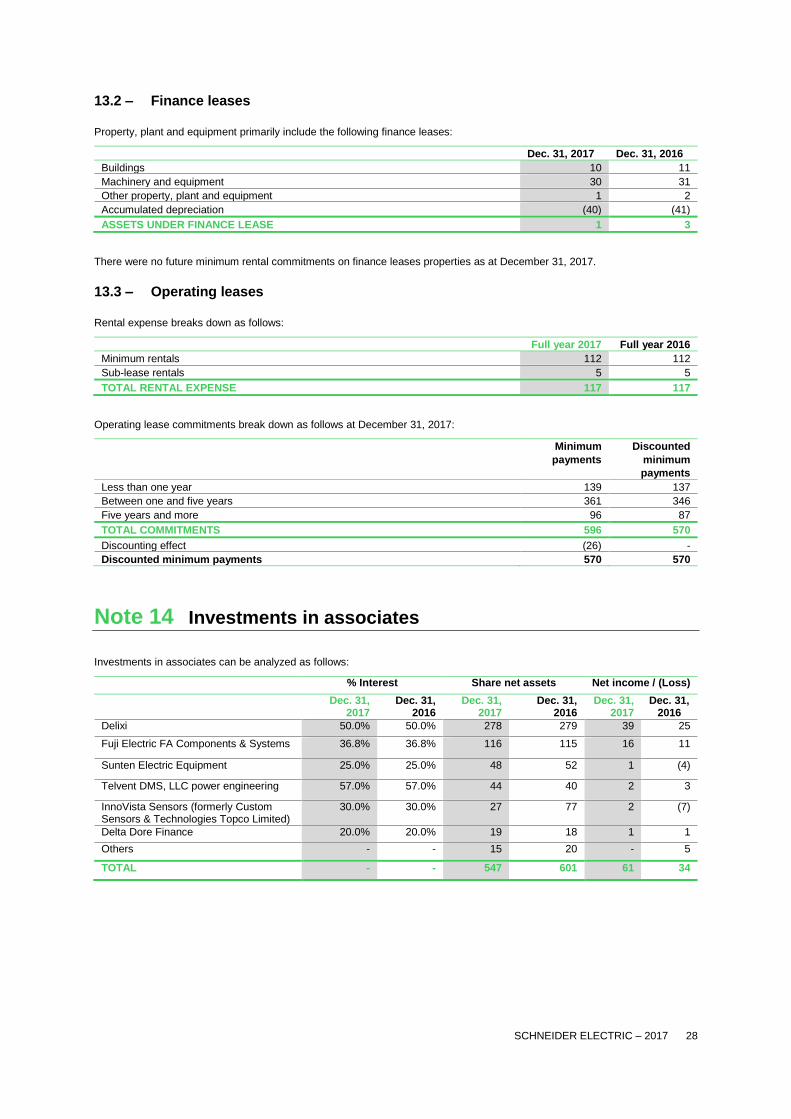
SCHNEIDER ELECTRIC – 2017 28
13.2 – Finance leases
Property, plant and equipment primarily include the following finance leases:
Dec. 31, 2017 Dec. 31, 2016
Buildings 10 11
Machinery and equipment 30 31
Other property, plant and equipment 1 2
Accumulated depreciation (40) (41)
ASSETS UNDER FINANCE LEASE 1 3
There were no future minimum rental commitments on finance leases properties as at December 31, 2017.
13.3 – Operating leases
Rental expense breaks down as follows:
Full year 2017 Full year 2016
Minimum rentals 112 112
Sub-lease rentals 5 5
TOTAL RENTAL EXPENSE 117 117
Operating lease commitments break down as follows at December 31, 2017:
Minimum
payments
Discounted
minimum
payments
Less than one year 139 137
Between one and five years 361 346
Five years and more 96 87
TOTAL COMMITMENTS 596 570
Discounting effect (26) -
Discounted minimum payments 570 570
Note 14 Investments in associates
Investments in associates can be analyzed as follows:
% Interest Share net assets Net income / (Loss)
Dec. 31, 2017
Dec. 31, 2016
Dec. 31, 2017
Dec. 31, 2016
Dec. 31, 2017
Dec. 31, 2016
Delixi 50.0% 50.0% 278 279 39 25
Fuji Electric FA Components & Systems 36.8% 36.8% 116 115 16 11
Sunten Electric Equipment 25.0% 25.0% 48 52 1 (4)
Telvent DMS, LLC power engineering 57.0% 57.0% 44 40 2 3
InnoVista Sensors (formerly Custom Sensors & Technologies Topco Limited)
30.0% 30.0% 27 77 2 (7)
Delta Dore Finance 20.0% 20.0% 19 18 1 1
Others - - 15 20 - 5
TOTAL - - 547 601 61 34
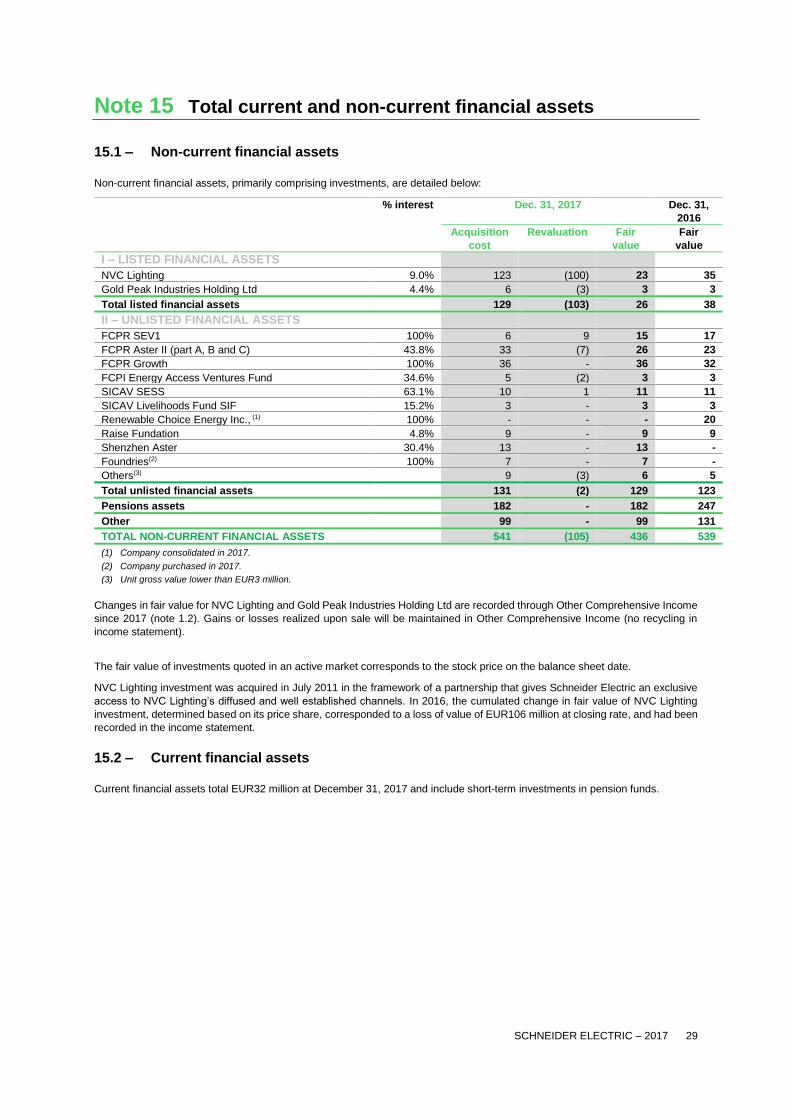
SCHNEIDER ELECTRIC – 2017 29
Note 15 Total current and non-current financial assets
15.1 – Non-current financial assets
Non-current financial assets, primarily comprising investments, are detailed below:
% interest Dec. 31, 2017 Dec. 31,
2016
Acquisition
cost
Revaluation Fair
value
Fair
value
I – LISTED FINANCIAL ASSETS
NVC Lighting 9.0% 123 (100) 23 35
Gold Peak Industries Holding Ltd 4.4% 6 (3) 3 3
Total listed financial assets 129 (103) 26 38
II – UNLISTED FINANCIAL ASSETS
FCPR SEV1 100% 6 9 15 17
FCPR Aster II (part A, B and C) 43.8% 33 (7) 26 23
FCPR Growth 100% 36 - 36 32
FCPI Energy Access Ventures Fund 34.6% 5 (2) 3 3
SICAV SESS 63.1% 10 1 11 11
SICAV Livelihoods Fund SIF 15.2% 3 - 3 3
Renewable Choice Energy Inc., (1) 100% - - - 20
Raise Fundation 4.8% 9 - 9 9
Shenzhen Aster 30.4% 13 - 13 -
Foundries(2) 100% 7 - 7 -
Others(3) 9 (3) 6 5
Total unlisted financial assets 131 (2) 129 123
Pensions assets 182 - 182 247
Other 99 - 99 131
TOTAL NON-CURRENT FINANCIAL ASSETS 541 (105) 436 539
(1) Company consolidated in 2017.
(2) Company purchased in 2017.
(3) Unit gross value lower than EUR3 million.
Changes in fair value for NVC Lighting and Gold Peak Industries Holding Ltd are recorded through Other Comprehensive Income
since 2017 (note 1.2). Gains or losses realized upon sale will be maintained in Other Comprehensive Income (no recycling in
income statement).
The fair value of investments quoted in an active market corresponds to the stock price on the balance sheet date.
NVC Lighting investment was acquired in July 2011 in the framework of a partnership that gives Schneider Electric an exclusive
access to NVC Lighting’s diffused and well established channels. In 2016, the cumulated change in fair value of NVC Lighting
investment, determined based on its price share, corresponded to a loss of value of EUR106 million at closing rate, and had been
recorded in the income statement.
15.2 – Current financial assets
Current financial assets total EUR32 million at December 31, 2017 and include short-term investments in pension funds.

SCHNEIDER ELECTRIC – 2017 30
Note 16 Deferred taxes by type
Deferred taxes by type can be analyzed as follows:
Dec. 31, 2017 Dec. 31, 2016
Tax credits and tax loss carryforwards (net) 683 947
Provisions for pensions and other post-retirement benefit obligations (net) 332 444
Non-deductible provisions for contingencies and accruals (net) 273 296
Differences between tax and accounting depreciation on tangible assets (net) (45) (116)
Differences between tax and accounting amortization on intangible assets (net) (625) (749)
Differences on working capital (net) 277 271
Deferred tax at other/reduced tax rates 63 123
Other deferred tax assets/(liabilities) (net) 143 (10)
TOTAL NET DEFERRED TAX ASSETS/(LIABILITIES) 1,101 1,206
Of which :
Total deferred tax assets 2,097 2,573
Total deferred tax liabilities (996) (1,367)
Deferred tax assets recorded in respect of tax loss carried forward at December 31, 2017 essentially concern France
(EUR531 million).
Note 17 Inventories and work in progress
Inventories and work in progress changed as follows:
Dec. 31, 2017 Dec. 31, 2016
COST:
Raw materials 1,218 1,247
Production work in progress 263 277
Semi-finished and finished products 1,142 1,146
Goods 407 416
Solution work in progress 135 154
INVENTORIES AND WORK IN PROGRESS AT COST 3,165 3,240
IMPAIRMENT:
Raw materials (154) (162)
Production work in progress (5) (7)
Semi-finished and finished products (150) (176)
Goods (7) (11)
Solution work in progress (5) (8)
IMPAIRMENT LOSS (321) (364)
NET:
Raw materials 1,064 1,085
Production work in progress 258 270
Semi-finished and finished products 992 970
Goods 400 405
Solution work in progress 130 146
INVENTORIES AND WORK IN PROGRESS, NET 2,844 2,876
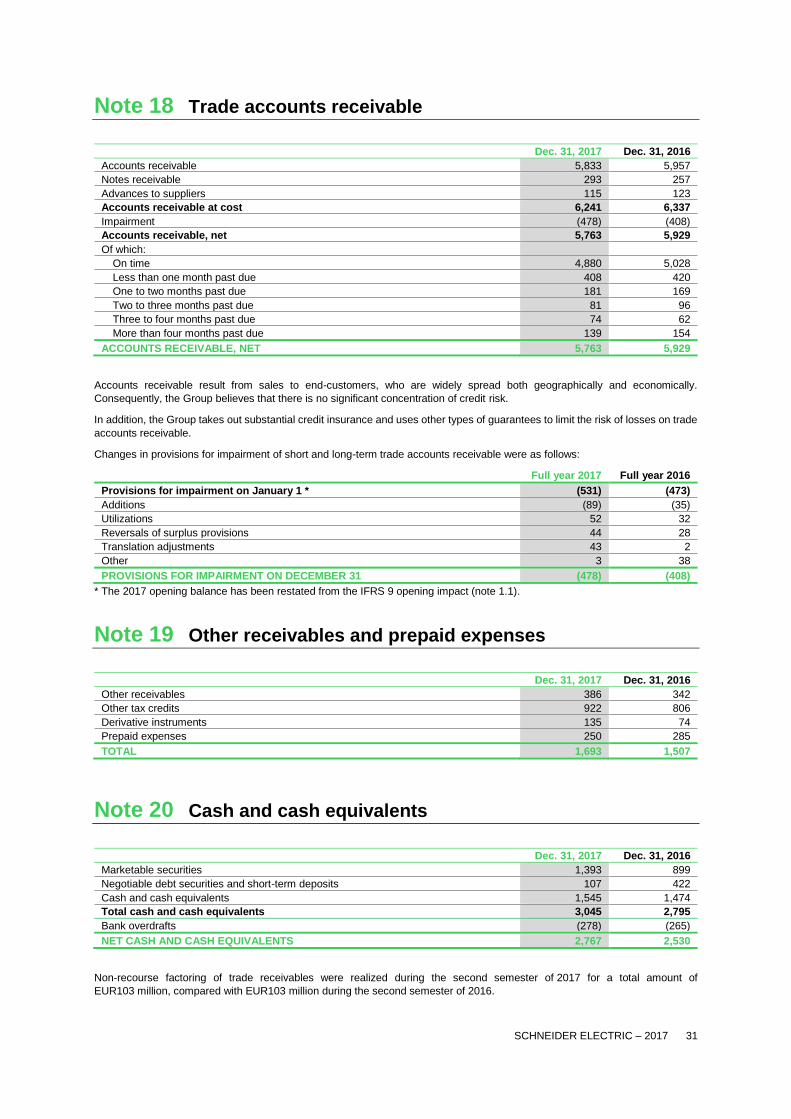
SCHNEIDER ELECTRIC – 2017 31
Note 18 Trade accounts receivable
Dec. 31, 2017 Dec. 31, 2016
Accounts receivable 5,833 5,957
Notes receivable 293 257
Advances to suppliers 115 123
Accounts receivable at cost 6,241 6,337
Impairment (478) (408)
Accounts receivable, net 5,763 5,929
Of which:
On time 4,880 5,028
Less than one month past due 408 420
One to two months past due 181 169
Two to three months past due 81 96
Three to four months past due 74 62
More than four months past due 139 154
ACCOUNTS RECEIVABLE, NET 5,763 5,929
Accounts receivable result from sales to end-customers, who are widely spread both geographically and economically.
Consequently, the Group believes that there is no significant concentration of credit risk.
In addition, the Group takes out substantial credit insurance and uses other types of guarantees to limit the risk of losses on trade
accounts receivable.
Changes in provisions for impairment of short and long-term trade accounts receivable were as follows:
Full year 2017 Full year 2016
Provisions for impairment on January 1 * (531) (473)
Additions (89) (35)
Utilizations 52 32
Reversals of surplus provisions 44 28
Translation adjustments 43 2
Other 3 38
PROVISIONS FOR IMPAIRMENT ON DECEMBER 31 (478) (408)
* The 2017 opening balance has been restated from the IFRS 9 opening impact (note 1.1).
Note 19 Other receivables and prepaid expenses
Dec. 31, 2017 Dec. 31, 2016
Other receivables 386 342
Other tax credits 922 806
Derivative instruments 135 74
Prepaid expenses 250 285
TOTAL 1,693 1,507
Note 20 Cash and cash equivalents
Dec. 31, 2017 Dec. 31, 2016
Marketable securities 1,393 899
Negotiable debt securities and short-term deposits 107 422
Cash and cash equivalents 1,545 1,474
Total cash and cash equivalents 3,045 2,795
Bank overdrafts (278) (265)
NET CASH AND CASH EQUIVALENTS 2,767 2,530
Non-recourse factoring of trade receivables were realized during the second semester of 2017 for a total amount of
EUR103 million, compared with EUR103 million during the second semester of 2016.

SCHNEIDER ELECTRIC – 2017 32
Note 21 Equity
21.1 – Capital
Share capital
The company’s share capital at December 31, 2017 amounted to EUR2,387,664,968 represented by 596,916,242 shares with a
par value of EUR4, all fully paid up.
At December 31, 2017, a total of 626,070,223 voting rights were attached to the 596,916,242 shares outstanding.
Schneider Electric’s capital management strategy is designed to:
• ensure Group liquidity;
• optimize its financial structure;
• optimize the weighted average cost of capital.
The strategy must also ensure the Group has access to different capital markets under the best possible conditions. Factors taken
into account for decision-making purposes include objectives expressed in terms of earnings per share, ratings or balance sheet
stability. Finally, decisions may be implemented depending on specific market conditions.
Changes in share capital
Changes in share capital since December 31, 2015 were as follows:
Cumulative number of
shares
Total (in euros)
Capital at Dec. 31, 2015 588,734,472 2,354,937,888
Exercise of stock options 921,535 3,686,140
Employee share issue 2,842,752 11,371,008
Capital at Dec. 31, 2016 592,498,759 2,369,995,036
Exercise of stock options 2,004,115 8,016,460
Employee share issue 2,413,368 9,653,472
CAPITAL AT DEC. 31, 2017 596,916,242 2,387,664,968
The share premium account increased by EUR148,868,602 following the exercise of options and the increases in capital.
21.2 – Earnings per share
Determination of the share base used in calculation
(in thousands of shares) Full year 2017 Full year 2016
Basic Diluted Basic Diluted
Common shares* 557,731 557,731 561,222 561,222
Performance shares - 6,337 - 5,503
Stock options - 303 - 421
Average weighted number of shares 557,731 564,371 561,222 566,946
* Net of treasury shares and own shares.
Earnings per share
(in euros) Full year 2017 Full year 2016 *
Basic Diluted Basic Diluted
Profit before tax 5.10 5.04 4.48 4.43
EARNINGS PER SHARE 3.85 3.81 3.12 3.09
* 2016 figures were restated for discontinued operations disclosed in note 1
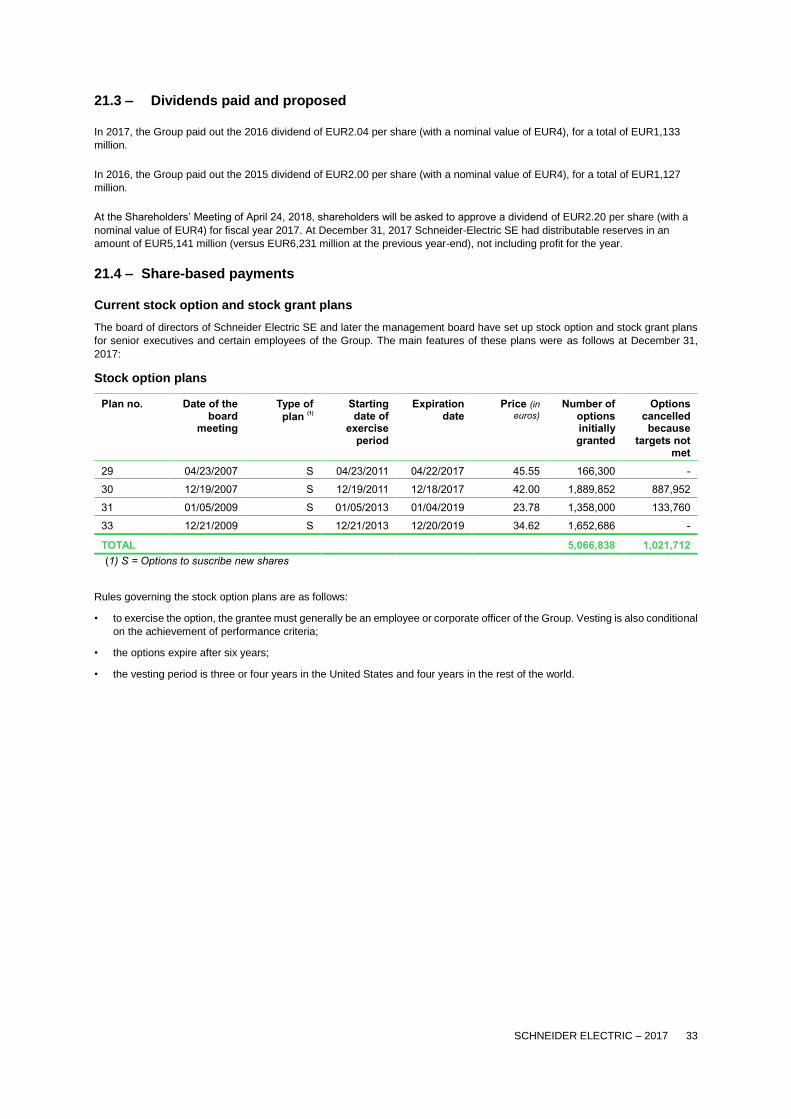
SCHNEIDER ELECTRIC – 2017 33
21.3 – Dividends paid and proposed
In 2017, the Group paid out the 2016 dividend of EUR2.04 per share (with a nominal value of EUR4), for a total of EUR1,133
million.
In 2016, the Group paid out the 2015 dividend of EUR2.00 per share (with a nominal value of EUR4), for a total of EUR1,127
million.
At the Shareholders’ Meeting of April 24, 2018, shareholders will be asked to approve a dividend of EUR2.20 per share (with a
nominal value of EUR4) for fiscal year 2017. At December 31, 2017 Schneider-Electric SE had distributable reserves in an
amount of EUR5,141 million (versus EUR6,231 million at the previous year-end), not including profit for the year.
21.4 – Share-based payments
Current stock option and stock grant plans
The board of directors of Schneider Electric SE and later the management board have set up stock option and stock grant plans
for senior executives and certain employees of the Group. The main features of these plans were as follows at December 31,
2017:
Stock option plans
Plan no. Date of the board
meeting
Type of
plan (1)
Starting date of
exercise period
Expiration date
Price (in
euros) Number of
options initially granted
Options cancelled because
targets not met
29 04/23/2007 S 04/23/2011 04/22/2017 45.55 166,300 -
30 12/19/2007 S 12/19/2011 12/18/2017 42.00 1,889,852 887,952
31 01/05/2009 S 01/05/2013 01/04/2019 23.78 1,358,000 133,760
33 12/21/2009 S 12/21/2013 12/20/2019 34.62 1,652,686 -
TOTAL 5,066,838 1,021,712
(1) S = Options to suscribe new shares
Rules governing the stock option plans are as follows:
• to exercise the option, the grantee must generally be an employee or corporate officer of the Group. Vesting is also conditional
on the achievement of performance criteria;
• the options expire after six years;
• the vesting period is three or four years in the United States and four years in the rest of the world.
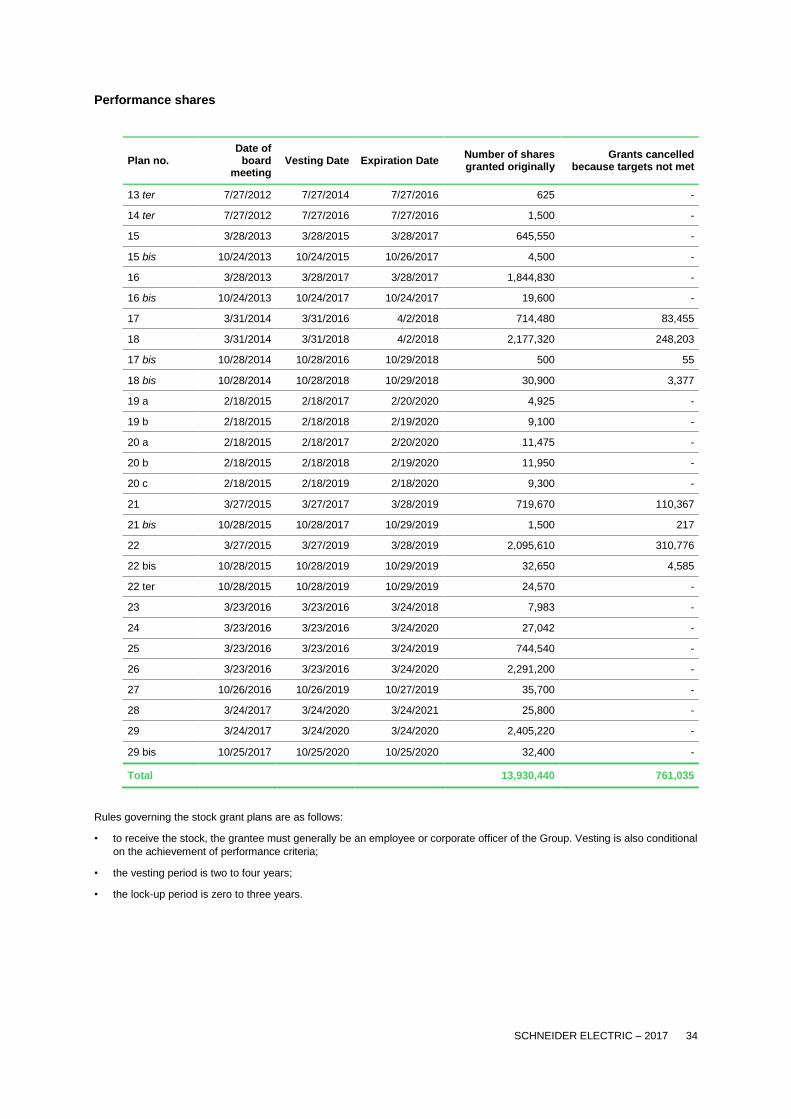
SCHNEIDER ELECTRIC – 2017 34
Performance shares
Plan no. Date of
board meeting
Vesting Date Expiration Date Number of shares granted originally
Grants cancelled because targets not met
13 ter 7/27/2012 7/27/2014 7/27/2016 625 -
14 ter 7/27/2012 7/27/2016 7/27/2016 1,500 -
15 3/28/2013 3/28/2015 3/28/2017 645,550 -
15 bis 10/24/2013 10/24/2015 10/26/2017 4,500 -
16 3/28/2013 3/28/2017 3/28/2017 1,844,830 -
16 bis 10/24/2013 10/24/2017 10/24/2017 19,600 -
17 3/31/2014 3/31/2016 4/2/2018 714,480 83,455
18 3/31/2014 3/31/2018 4/2/2018 2,177,320 248,203
17 bis 10/28/2014 10/28/2016 10/29/2018 500 55
18 bis 10/28/2014 10/28/2018 10/29/2018 30,900 3,377
19 a 2/18/2015 2/18/2017 2/20/2020 4,925 -
19 b 2/18/2015 2/18/2018 2/19/2020 9,100 -
20 a 2/18/2015 2/18/2017 2/20/2020 11,475 -
20 b 2/18/2015 2/18/2018 2/19/2020 11,950 -
20 c 2/18/2015 2/18/2019 2/18/2020 9,300 -
21 3/27/2015 3/27/2017 3/28/2019 719,670 110,367
21 bis 10/28/2015 10/28/2017 10/29/2019 1,500 217
22 3/27/2015 3/27/2019 3/28/2019 2,095,610 310,776
22 bis 10/28/2015 10/28/2019 10/29/2019 32,650 4,585
22 ter 10/28/2015 10/28/2019 10/29/2019 24,570 -
23 3/23/2016 3/23/2016 3/24/2018 7,983 -
24 3/23/2016 3/23/2016 3/24/2020 27,042 -
25 3/23/2016 3/23/2016 3/24/2019 744,540 -
26 3/23/2016 3/23/2016 3/24/2020 2,291,200 -
27 10/26/2016 10/26/2019 10/27/2019 35,700 -
28 3/24/2017 3/24/2020 3/24/2021 25,800 -
29 3/24/2017 3/24/2020 3/24/2020 2,405,220 -
29 bis 10/25/2017 10/25/2020 10/25/2020 32,400 -
Total 13,930,440 761,035
Rules governing the stock grant plans are as follows:
• to receive the stock, the grantee must generally be an employee or corporate officer of the Group. Vesting is also conditional
on the achievement of performance criteria;
• the vesting period is two to four years;
• the lock-up period is zero to three years.
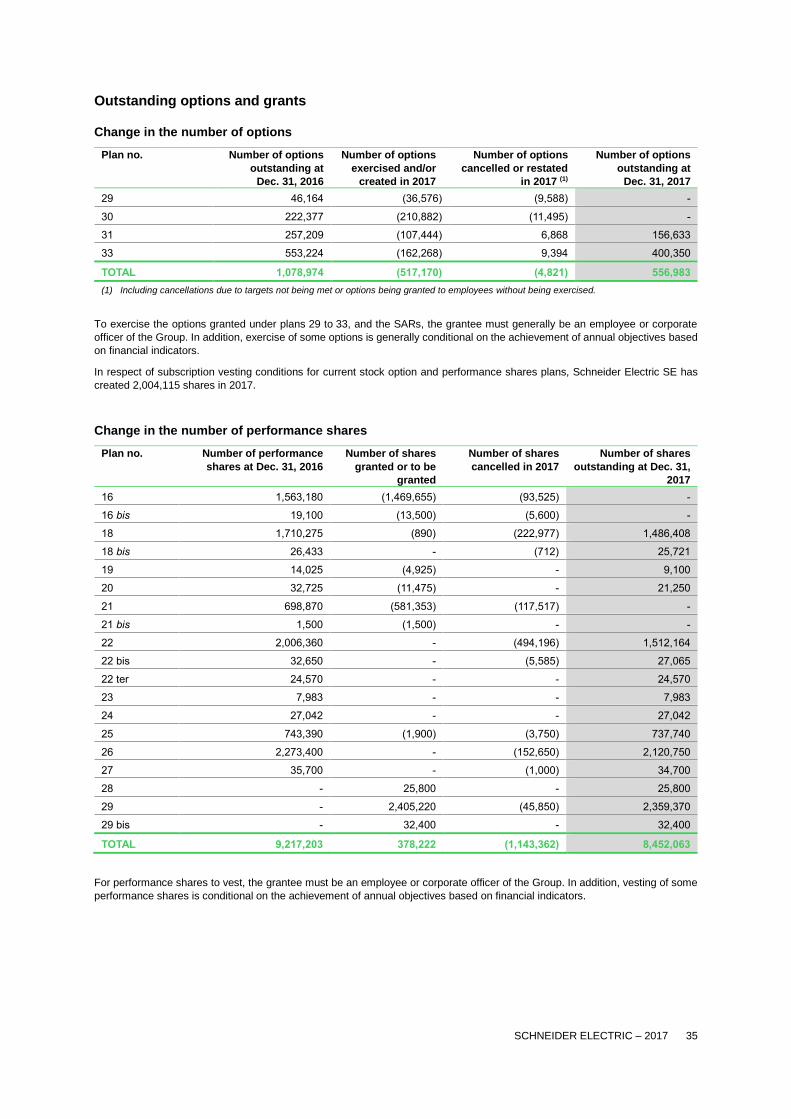
SCHNEIDER ELECTRIC – 2017 35
Outstanding options and grants
Change in the number of options
Plan no. Number of options
outstanding at
Dec. 31, 2016
Number of options
exercised and/or
created in 2017
Number of options
cancelled or restated
in 2017 (1)
Number of options
outstanding at
Dec. 31, 2017
29 46,164 (36,576) (9,588) -
30 222,377 (210,882) (11,495) -
31 257,209 (107,444) 6,868 156,633
33 553,224 (162,268) 9,394 400,350
TOTAL 1,078,974 (517,170) (4,821) 556,983
(1) Including cancellations due to targets not being met or options being granted to employees without being exercised.
To exercise the options granted under plans 29 to 33, and the SARs, the grantee must generally be an employee or corporate
officer of the Group. In addition, exercise of some options is generally conditional on the achievement of annual objectives based
on financial indicators.
In respect of subscription vesting conditions for current stock option and performance shares plans, Schneider Electric SE has
created 2,004,115 shares in 2017.
Change in the number of performance shares
Plan no. Number of performance
shares at Dec. 31, 2016
Number of shares
granted or to be
granted
Number of shares
cancelled in 2017
Number of shares
outstanding at Dec. 31,
2017
16 1,563,180 (1,469,655) (93,525) -
16 bis 19,100 (13,500) (5,600) -
18 1,710,275 (890) (222,977) 1,486,408
18 bis 26,433 - (712) 25,721
19 14,025 (4,925) - 9,100
20 32,725 (11,475) - 21,250
21 698,870 (581,353) (117,517) -
21 bis 1,500 (1,500) - -
22 2,006,360 - (494,196) 1,512,164
22 bis 32,650 - (5,585) 27,065
22 ter 24,570 - - 24,570
23 7,983 - - 7,983
24 27,042 - - 27,042
25 743,390 (1,900) (3,750) 737,740
26 2,273,400 - (152,650) 2,120,750
27 35,700 - (1,000) 34,700
28 - 25,800 - 25,800
29 - 2,405,220 (45,850) 2,359,370
29 bis - 32,400 - 32,400
TOTAL 9,217,203 378,222 (1,143,362) 8,452,063
For performance shares to vest, the grantee must be an employee or corporate officer of the Group. In addition, vesting of some
performance shares is conditional on the achievement of annual objectives based on financial indicators.

SCHNEIDER ELECTRIC – 2017 36
21.4.1 Valuation of performance shares
In accordance with the accounting policies described in note 1.20, the stock grant plans have been valued on the basis of an
average estimated life of between four and five years using the following assumptions:
• a payout rate of between 3.0% and 3.5%;
• a discount rate of between 0% and 1.0%, corresponding to a risk-free rate over the life of the plans (source: Bloomberg).
Based on these assumptions, the expense recorded under « Selling, general and administrative expenses » breaks down as
follows:
Full year 2017 Full year 2016
Plan 16 and 16 bis (1) 16
*Plan 17 and 17 bis - 4
Plan 18 and 18 bis 12 21
Plan 20 - 1
Plan 21 and 21 bis 4 19
Plan 22, 22 bis and 22 ter 20 28
Plan 23 and 24 - 2
Plan 25 11 8
Plan 26 23 19
Plan 27 1 -
Plan 29 and 29 bis 32 -
TOTAL 102 118
21.4.2 Worldwide Employee Stock Purchase Plan
Schneider Electric gives its employees the opportunity to become group shareholders thanks to employee share issues.
Employees in countries that meet legal and fiscal requirements have been proposed the classic plan.
Under the classic plan, employees may purchase Schneider Electric shares at a 15% discount to the price quoted for the shares
on the stock market. Employees must then hold their shares for five years, except in certain cases provided for by law. The share-
based payment expense recorded in accordance with IFRS 2 is measured by reference to the fair value of the discount on the
locked-up shares. The lock-up cost is determined on the basis of a two-step strategy that involves first selling the locked-up shares
on the forward market and then purchasing the same number of shares on the spot market (i.e., shares that may be sold at any
time) using a bullet loan.
This strategy is designed to reflect the cost the employee would incur during the lock-up period to avoid the risk of carrying the
shares subscribed under the classic plan. The borrowing cost corresponds to the cost of borrowing for the employees concerned,
as they are the sole potential buyers in this market. It is based on the average interest rate charged by banks for an ordinary, non-
revolving personal loan with a maximum maturity of five years granted to an individual with an average credit rating.
As regards the first semester 2017, Schneider Electric gave its employees the opportunity to purchase shares at a price of EUR
59.11 per share, as part of its commitment to employee share ownership, on April 3rd, 2017. This represented a 15% discount to
the reference price of EUR 69.23 calculated as the average opening price quoted for the share during the 20 days preceding the
Management Board’s decision to launch the employee share issue.
Altogether, 2.4 million shares were subscribed, increasing the Company’s capital by EUR 143 million as of July 11, 2017. Due to
significant changes in valuation assumptions, specifically the interest rate available to market participant, the value of the lock-up
period is higher than the discount cost since 2012. Therefore, the Group did not recognize any cost related to the transaction.
The tables below summarize the main characteristics of the plans, the amounts subscribed, the valuation assumptions and the
plans’ cost for 2017 and 2016.
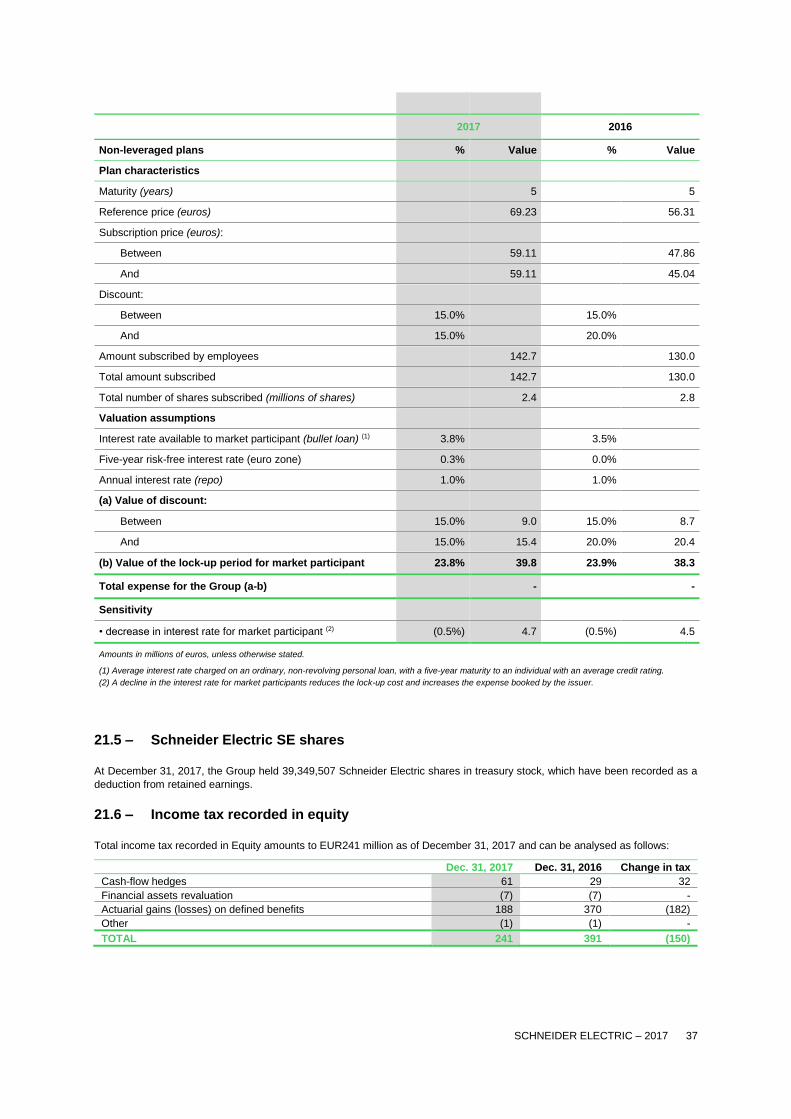
SCHNEIDER ELECTRIC – 2017 37
2017 2016
Non-leveraged plans % Value % Value
Plan characteristics
Maturity (years) 5 5
Reference price (euros) 69.23 56.31
Subscription price (euros):
Between 59.11 47.86
And 59.11 45.04
Discount:
Between 15.0% 15.0%
And 15.0% 20.0%
Amount subscribed by employees 142.7 130.0
Total amount subscribed 142.7 130.0
Total number of shares subscribed (millions of shares) 2.4 2.8
Valuation assumptions
Interest rate available to market participant (bullet loan) (1) 3.8% 3.5%
Five-year risk-free interest rate (euro zone) 0.3% 0.0%
Annual interest rate (repo) 1.0% 1.0%
(a) Value of discount:
Between 15.0% 9.0 15.0% 8.7
And 15.0% 15.4 20.0% 20.4
(b) Value of the lock-up period for market participant 23.8% 39.8 23.9% 38.3
Total expense for the Group (a-b) - -
Sensitivity
• decrease in interest rate for market participant (2) (0.5%) 4.7 (0.5%) 4.5
Amounts in millions of euros, unless otherwise stated.
(1) Average interest rate charged on an ordinary, non-revolving personal loan, with a five-year maturity to an individual with an average credit rating.
(2) A decline in the interest rate for market participants reduces the lock-up cost and increases the expense booked by the issuer.
21.5 – Schneider Electric SE shares
At December 31, 2017, the Group held 39,349,507 Schneider Electric shares in treasury stock, which have been recorded as a
deduction from retained earnings.
21.6 – Income tax recorded in equity
Total income tax recorded in Equity amounts to EUR241 million as of December 31, 2017 and can be analysed as follows:
Dec. 31, 2017 Dec. 31, 2016 Change in tax
Cash-flow hedges 61 29 32
Financial assets revaluation (7) (7) -
Actuarial gains (losses) on defined benefits 188 370 (182)
Other (1) (1) -
TOTAL 241 391 (150)
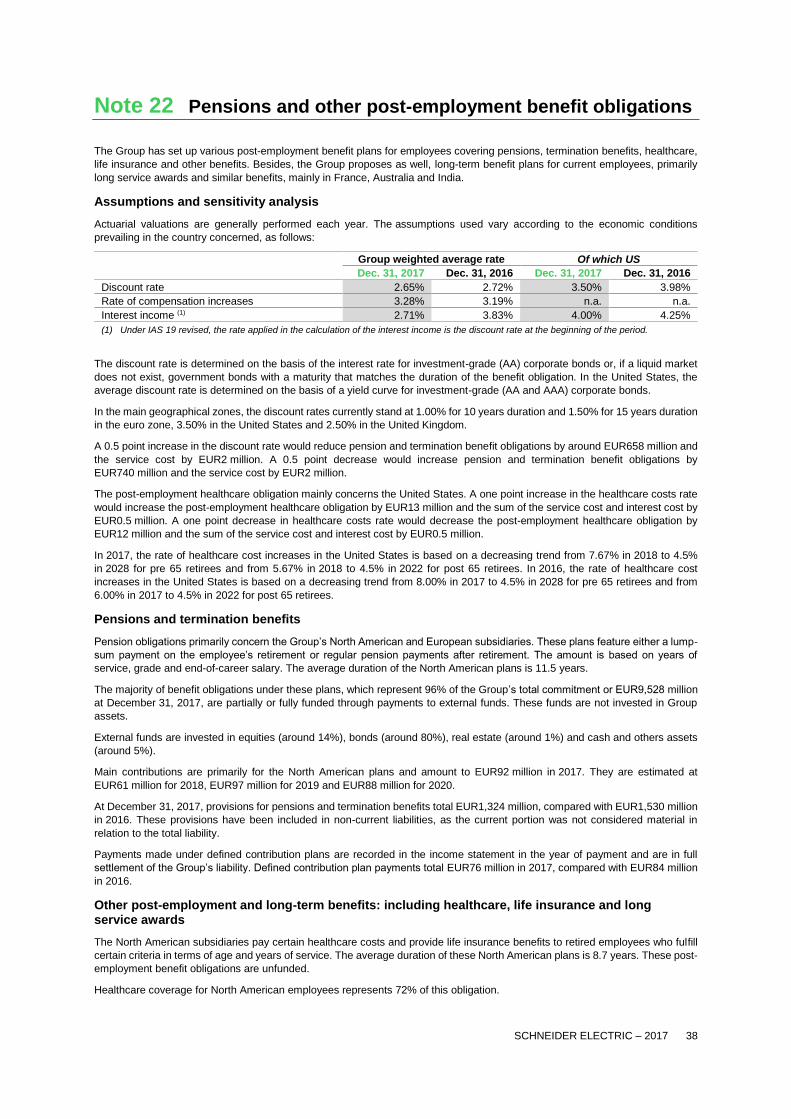
SCHNEIDER ELECTRIC – 2017 38
Note 22 Pensions and other post-employment benefit obligations
The Group has set up various post-employment benefit plans for employees covering pensions, termination benefits, healthcare,
life insurance and other benefits. Besides, the Group proposes as well, long-term benefit plans for current employees, primarily
long service awards and similar benefits, mainly in France, Australia and India.
Assumptions and sensitivity analysis
Actuarial valuations are generally performed each year. The assumptions used vary according to the economic conditions
prevailing in the country concerned, as follows:
Group weighted average rate Of which US
Dec. 31, 2017 Dec. 31, 2016 Dec. 31, 2017 Dec. 31, 2016
Discount rate 2.65% 2.72% 3.50% 3.98%
Rate of compensation increases 3.28% 3.19% n.a. n.a.
Interest income (1) 2.71% 3.83% 4.00% 4.25%
(1) Under IAS 19 revised, the rate applied in the calculation of the interest income is the discount rate at the beginning of the period.
The discount rate is determined on the basis of the interest rate for investment-grade (AA) corporate bonds or, if a liquid market
does not exist, government bonds with a maturity that matches the duration of the benefit obligation. In the United States, the
average discount rate is determined on the basis of a yield curve for investment-grade (AA and AAA) corporate bonds.
In the main geographical zones, the discount rates currently stand at 1.00% for 10 years duration and 1.50% for 15 years duration
in the euro zone, 3.50% in the United States and 2.50% in the United Kingdom.
A 0.5 point increase in the discount rate would reduce pension and termination benefit obligations by around EUR658 million and
the service cost by EUR2 million. A 0.5 point decrease would increase pension and termination benefit obligations by
EUR740 million and the service cost by EUR2 million.
The post-employment healthcare obligation mainly concerns the United States. A one point increase in the healthcare costs rate
would increase the post-employment healthcare obligation by EUR13 million and the sum of the service cost and interest cost by
EUR0.5 million. A one point decrease in healthcare costs rate would decrease the post-employment healthcare obligation by
EUR12 million and the sum of the service cost and interest cost by EUR0.5 million.
In 2017, the rate of healthcare cost increases in the United States is based on a decreasing trend from 7.67% in 2018 to 4.5%
in 2028 for pre 65 retirees and from 5.67% in 2018 to 4.5% in 2022 for post 65 retirees. In 2016, the rate of healthcare cost
increases in the United States is based on a decreasing trend from 8.00% in 2017 to 4.5% in 2028 for pre 65 retirees and from
6.00% in 2017 to 4.5% in 2022 for post 65 retirees.
Pensions and termination benefits
Pension obligations primarily concern the Group’s North American and European subsidiaries. These plans feature either a lump-
sum payment on the employee’s retirement or regular pension payments after retirement. The amount is based on years of
service, grade and end-of-career salary. The average duration of the North American plans is 11.5 years.
The majority of benefit obligations under these plans, which represent 96% of the Group’s total commitment or EUR9,528 million
at December 31, 2017, are partially or fully funded through payments to external funds. These funds are not invested in Group
assets.
External funds are invested in equities (around 14%), bonds (around 80%), real estate (around 1%) and cash and others assets
(around 5%).
Main contributions are primarily for the North American plans and amount to EUR92 million in 2017. They are estimated at
EUR61 million for 2018, EUR97 million for 2019 and EUR88 million for 2020.
At December 31, 2017, provisions for pensions and termination benefits total EUR1,324 million, compared with EUR1,530 million
in 2016. These provisions have been included in non-current liabilities, as the current portion was not considered material in
relation to the total liability.
Payments made under defined contribution plans are recorded in the income statement in the year of payment and are in full
settlement of the Group’s liability. Defined contribution plan payments total EUR76 million in 2017, compared with EUR84 million
in 2016.
Other post-employment and long-term benefits: including healthcare, life insurance and long service awards
The North American subsidiaries pay certain healthcare costs and provide life insurance benefits to retired employees who fulfill
certain criteria in terms of age and years of service. The average duration of these North American plans is 8.7 years. These post-
employment benefit obligations are unfunded.
Healthcare coverage for North American employees represents 72% of this obligation.
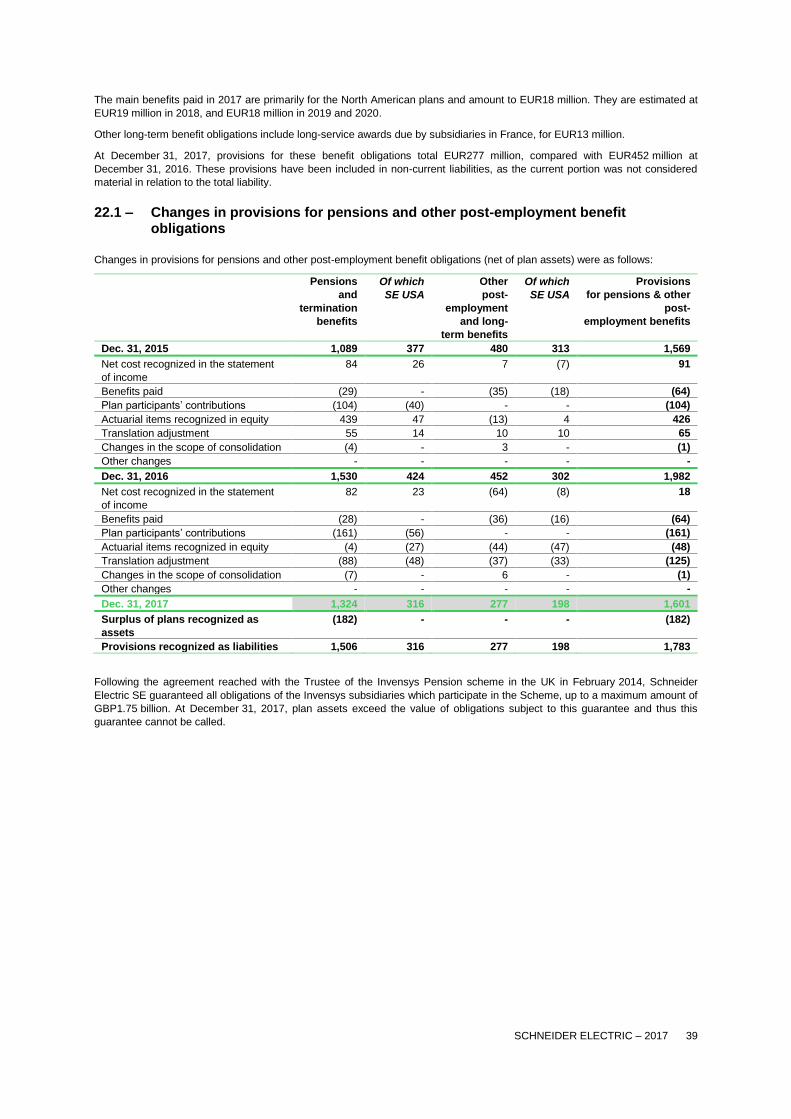
SCHNEIDER ELECTRIC – 2017 39
The main benefits paid in 2017 are primarily for the North American plans and amount to EUR18 million. They are estimated at
EUR19 million in 2018, and EUR18 million in 2019 and 2020.
Other long-term benefit obligations include long-service awards due by subsidiaries in France, for EUR13 million.
At December 31, 2017, provisions for these benefit obligations total EUR277 million, compared with EUR452 million at
December 31, 2016. These provisions have been included in non-current liabilities, as the current portion was not considered
material in relation to the total liability.
22.1 – Changes in provisions for pensions and other post-employment benefit obligations
Changes in provisions for pensions and other post-employment benefit obligations (net of plan assets) were as follows:
Pensions
and
termination
benefits
Of which
SE USA
Other
post-
employment
and long-
term benefits
Of which
SE USA
Provisions
for pensions & other
post-
employment benefits
Dec. 31, 2015 1,089 377 480 313 1,569
Net cost recognized in the statement
of income
84 26 7 (7) 91
Benefits paid (29) - (35) (18) (64)
Plan participants’ contributions (104) (40) - - (104)
Actuarial items recognized in equity 439 47 (13) 4 426
Translation adjustment 55 14 10 10 65
Changes in the scope of consolidation (4) - 3 - (1)
Other changes - - - - -
Dec. 31, 2016 1,530 424 452 302 1,982
Net cost recognized in the statement
of income
82 23 (64) (8) 18
Benefits paid (28) - (36) (16) (64)
Plan participants’ contributions (161) (56) - - (161)
Actuarial items recognized in equity (4) (27) (44) (47) (48)
Translation adjustment (88) (48) (37) (33) (125)
Changes in the scope of consolidation (7) - 6 - (1)
Other changes - - - - -
Dec. 31, 2017 1,324 316 277 198 1,601
Surplus of plans recognized as
assets
(182) - - - (182)
Provisions recognized as liabilities 1,506 316 277 198 1,783
Following the agreement reached with the Trustee of the Invensys Pension scheme in the UK in February 2014, Schneider
Electric SE guaranteed all obligations of the Invensys subsidiaries which participate in the Scheme, up to a maximum amount of
GBP1.75 billion. At December 31, 2017, plan assets exceed the value of obligations subject to this guarantee and thus this
guarantee cannot be called.
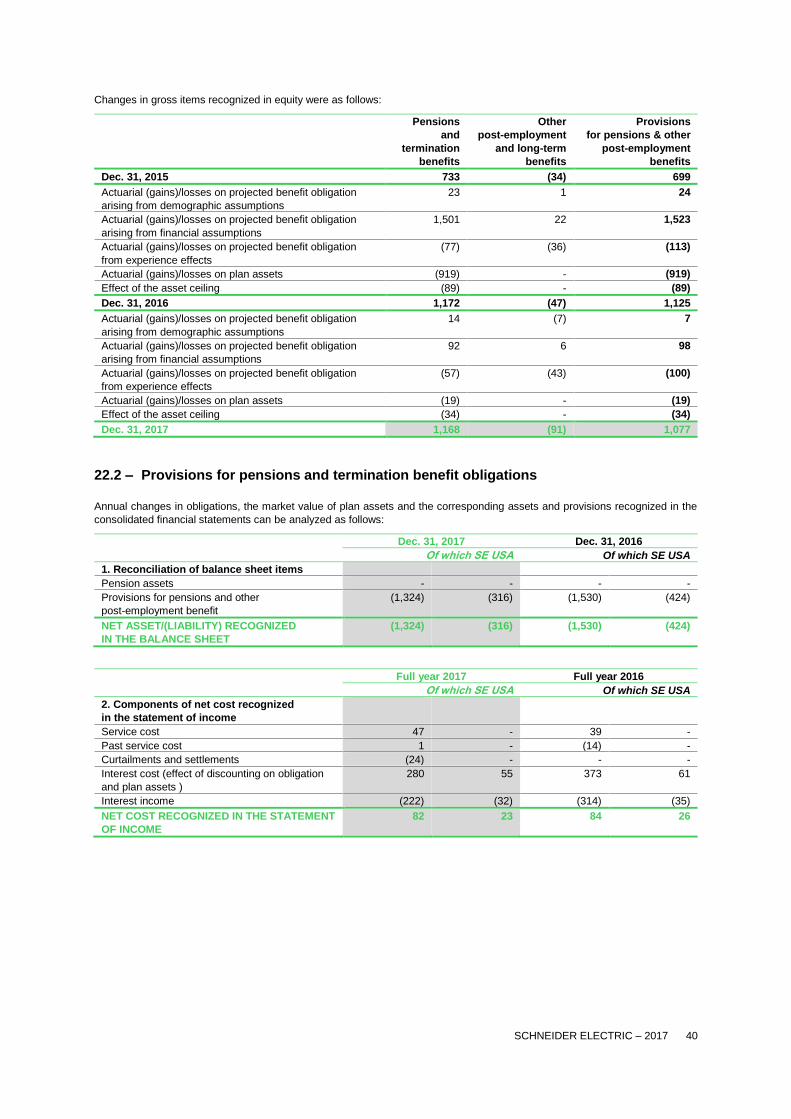
SCHNEIDER ELECTRIC – 2017 40
Changes in gross items recognized in equity were as follows:
Pensions
and
termination
benefits
Other
post-employment
and long-term
benefits
Provisions
for pensions & other
post-employment
benefits
Dec. 31, 2015 733 (34) 699
Actuarial (gains)/losses on projected benefit obligation
arising from demographic assumptions
23 1 24
Actuarial (gains)/losses on projected benefit obligation
arising from financial assumptions
1,501 22 1,523
Actuarial (gains)/losses on projected benefit obligation
from experience effects
(77) (36) (113)
Actuarial (gains)/losses on plan assets (919) - (919)
Effect of the asset ceiling (89) - (89)
Dec. 31, 2016 1,172 (47) 1,125
Actuarial (gains)/losses on projected benefit obligation
arising from demographic assumptions
14 (7) 7
Actuarial (gains)/losses on projected benefit obligation
arising from financial assumptions
92 6 98
Actuarial (gains)/losses on projected benefit obligation
from experience effects
(57) (43) (100)
Actuarial (gains)/losses on plan assets (19) - (19)
Effect of the asset ceiling (34) - (34)
Dec. 31, 2017 1,168 (91) 1,077
22.2 – Provisions for pensions and termination benefit obligations
Annual changes in obligations, the market value of plan assets and the corresponding assets and provisions recognized in the
consolidated financial statements can be analyzed as follows:
Dec. 31, 2017 Dec. 31, 2016
Of which SE USA Of which SE USA
1. Reconciliation of balance sheet items
Pension assets - - - -
Provisions for pensions and other
post-employment benefit
(1,324) (316) (1,530) (424)
NET ASSET/(LIABILITY) RECOGNIZED
IN THE BALANCE SHEET
(1,324) (316) (1,530) (424)
Full year 2017 Full year 2016
Of which SE USA Of which SE USA
2. Components of net cost recognized
in the statement of income
Service cost 47 - 39 -
Past service cost 1 - (14) -
Curtailments and settlements (24) - - -
Interest cost (effect of discounting on obligation
and plan assets )
280 55 373 61
Interest income (222) (32) (314) (35)
NET COST RECOGNIZED IN THE STATEMENT
OF INCOME
82 23 84 26

SCHNEIDER ELECTRIC – 2017 41
Full year 2017 Full year 2016
Of which SE USA Of which SE USA
3. Change in projected benefit obligation
Projected benefit obligation at beginning of year 11,085 1,508 10,785 1,492
Service cost 47 - 39 -
Past service cost/Curtailments and Settlements (341) - (101) (87)
Interest cost (effect of discounting) 277 55 365 61
Plan participants’ contributions 5 - 5 -
Benefits paid (584) (74) (562) (70)
Changes in the scope of consolidation (7) - (4) -
Actuarial (gains)/losses recognized in equity 49 63 1,447 64
Translation adjustments (619) (186) (889) 48
Other - - - -
PROJECTED BENEFIT OBLIGATION
AT END OF YEAR
9,912 1,366 11,085 1,508
Plans changes occurred in United States.
Actuarial gains and losses have been fully recognized in other reserves. They stem mainly from changes in financial actuarial
assumptions (primarily discount rates) used to measure obligations in the United States, the United Kingdom and the euro zone.
At December 31, 2017, actuarial losses resulting from changes in financial assumptions on pension and termination benefit
obligations total EUR92 million for the Group compared to EUR1,501 million of losses at December 31, 2016. At December 31,
2017, the losses resulting from changes in demographic assumptions on pension and termination benefit obligations total
EUR14 million for the Group compared to EUR23 million of losses at December 31, 2016.
At December 31, 2017, actuarial gains relative to the effects of experience on pension and termination benefit obligations total
EUR57 million for the Group compared to EUR77 million of gains at December 31, 2016.
Full year 2017 Full year 2016
Of which SE USA Of which SE USA
4. Change in fair value of plan assets
Fair value of plan assets at beginning of year 9,688 1,084 9,941 1,115
Interest income 222 32 314 35
Plan participants’ contribution 5 - 5 -
Employer contributions 161 56 104 40
Benefits paid (556) (74) (533) (70)
Actuarial gains/(losses) recognized in equity 19 90 919 17
Changes in the scope of consolidation - - - -
Translation adjustments (535) (138) (975) 34
Curtailments and settlements (318) - (87) (87)
Other - - - -
FAIR VALUE OF PLAN ASSETS AT END OF
YEAR
8,686 1,050 9,688 1,084
At December 31, 2017, the actual return on plan assets is EUR241 million compared with EUR1,233 million at December 31,
2016.
Actuarial gains and losses have been fully recognized in other reserves.
Full year 2017 Full year 2016
Of which SE USA Of which SE USA
5. Funded status
Projected benefit obligation (9,912) (1,366) (11,085) (1,508)
Fair value of plan assets 8,686 1,050 9,688 1,084
Surplus/(Deficit) (1,226) (316) (1,397) (424)
Effect of the asset ceiling (98) - (133) -
Deferred items:
Unrecognized past service cost - - - -
(LIABILITIES)/NET ASSETS RECOGNIZED
IN THE BALANCE SHEET
(1,324) (316) (1,530) (424)
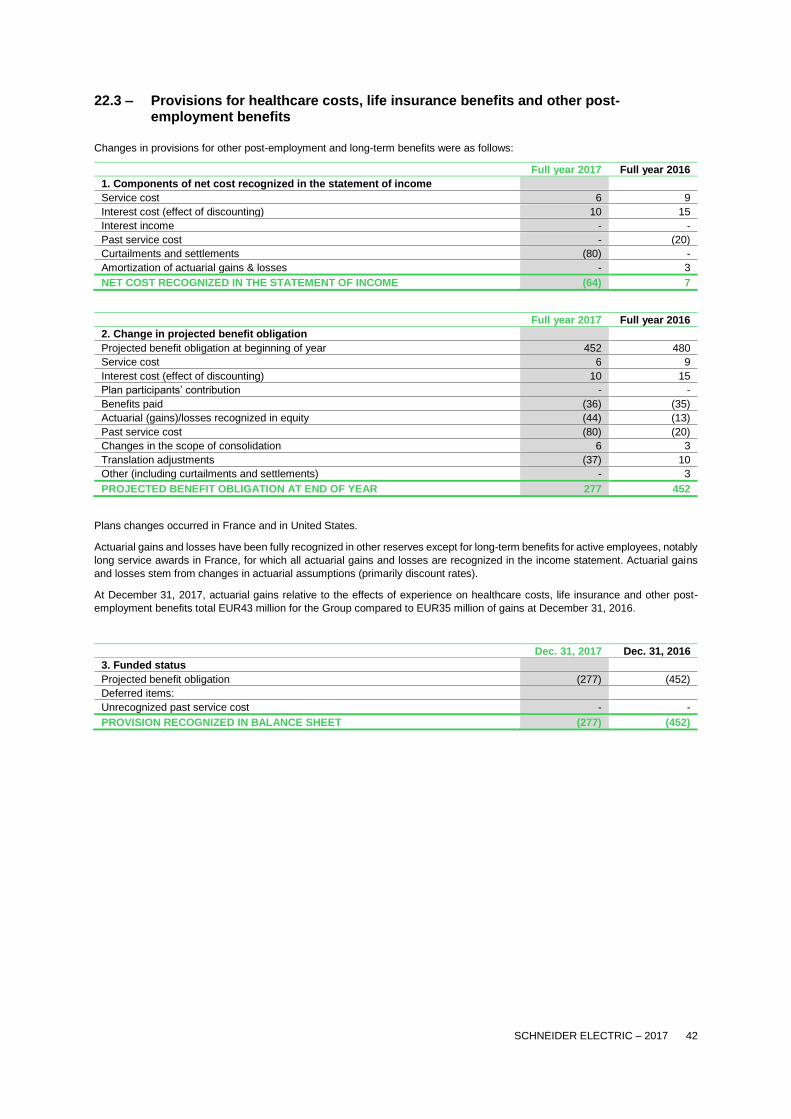
SCHNEIDER ELECTRIC – 2017 42
22.3 – Provisions for healthcare costs, life insurance benefits and other post-employment benefits
Changes in provisions for other post-employment and long-term benefits were as follows:
Full year 2017 Full year 2016
1. Components of net cost recognized in the statement of income
Service cost 6 9
Interest cost (effect of discounting) 10 15
Interest income - -
Past service cost - (20)
Curtailments and settlements (80) -
Amortization of actuarial gains & losses - 3
NET COST RECOGNIZED IN THE STATEMENT OF INCOME (64) 7
Full year 2017 Full year 2016
2. Change in projected benefit obligation
Projected benefit obligation at beginning of year 452 480
Service cost 6 9
Interest cost (effect of discounting) 10 15
Plan participants’ contribution - -
Benefits paid (36) (35)
Actuarial (gains)/losses recognized in equity (44) (13)
Past service cost (80) (20)
Changes in the scope of consolidation 6 3
Translation adjustments (37) 10
Other (including curtailments and settlements) - 3
PROJECTED BENEFIT OBLIGATION AT END OF YEAR 277 452
Plans changes occurred in France and in United States.
Actuarial gains and losses have been fully recognized in other reserves except for long-term benefits for active employees, notably
long service awards in France, for which all actuarial gains and losses are recognized in the income statement. Actuarial gains
and losses stem from changes in actuarial assumptions (primarily discount rates).
At December 31, 2017, actuarial gains relative to the effects of experience on healthcare costs, life insurance and other post-
employment benefits total EUR43 million for the Group compared to EUR35 million of gains at December 31, 2016.
Dec. 31, 2017 Dec. 31, 2016
3. Funded status
Projected benefit obligation (277) (452)
Deferred items:
Unrecognized past service cost - -
PROVISION RECOGNIZED IN BALANCE SHEET (277) (452)
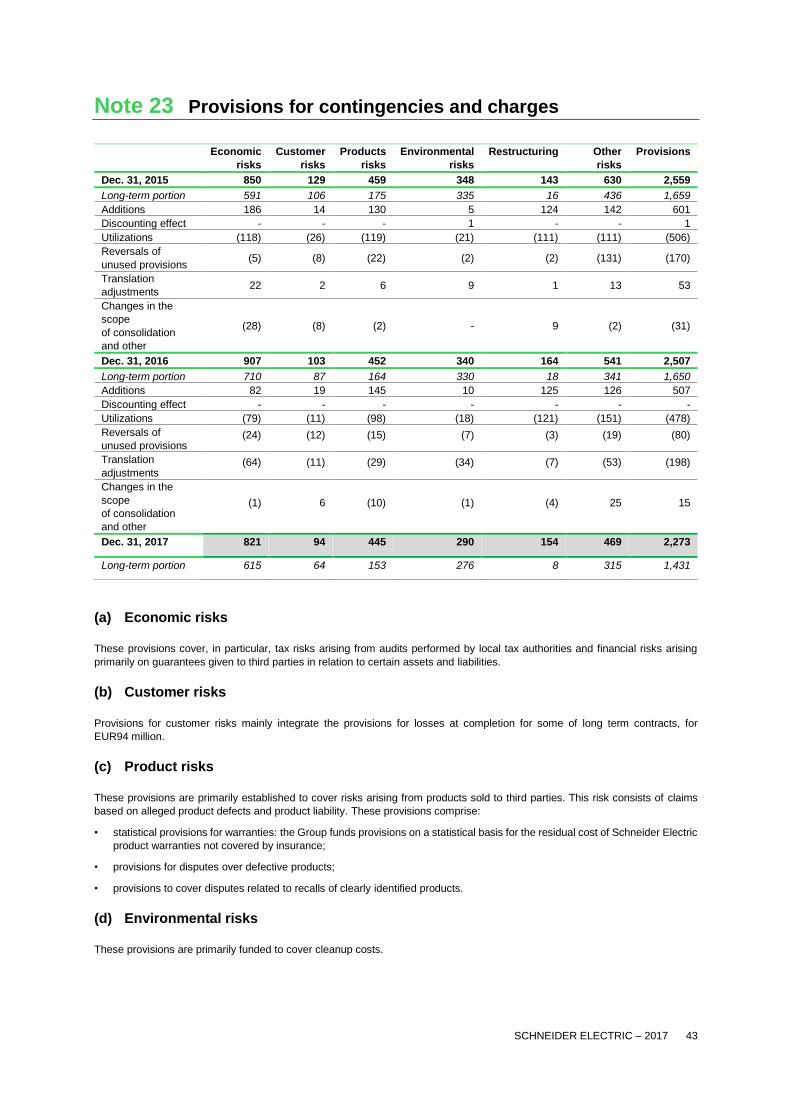
SCHNEIDER ELECTRIC – 2017 43
Note 23 Provisions for contingencies and charges
Economic
risks
Customer
risks
Products
risks
Environmental
risks
Restructuring Other
risks
Provisions
Dec. 31, 2015 850 129 459 348 143 630 2,559
Long-term portion 591 106 175 335 16 436 1,659
Additions 186 14 130 5 124 142 601
Discounting effect - - - 1 - - 1
Utilizations (118) (26) (119) (21) (111) (111) (506)
Reversals of
unused provisions (5) (8) (22) (2) (2) (131) (170)
Translation
adjustments 22 2 6 9 1 13 53
Changes in the
scope
of consolidation
and other
(28) (8) (2) - 9 (2) (31)
Dec. 31, 2016 907 103 452 340 164 541 2,507
Long-term portion 710 87 164 330 18 341 1,650
Additions 82 19 145 10 125 126 507
Discounting effect - - - - - - -
Utilizations (79) (11) (98) (18) (121) (151) (478)
Reversals of
unused provisions (24) (12) (15) (7) (3) (19) (80)
Translation
adjustments (64) (11) (29) (34) (7) (53) (198)
Changes in the
scope
of consolidation
and other
(1) 6 (10) (1) (4) 25 15
Dec. 31, 2017 821 94 445 290 154 469 2,273
Long-term portion 615 64 153 276 8 315 1,431
(a) Economic risks
These provisions cover, in particular, tax risks arising from audits performed by local tax authorities and financial risks arising
primarily on guarantees given to third parties in relation to certain assets and liabilities.
(b) Customer risks
Provisions for customer risks mainly integrate the provisions for losses at completion for some of long term contracts, for
EUR94 million.
(c) Product risks
These provisions are primarily established to cover risks arising from products sold to third parties. This risk consists of claims
based on alleged product defects and product liability. These provisions comprise:
• statistical provisions for warranties: the Group funds provisions on a statistical basis for the residual cost of Schneider Electric
product warranties not covered by insurance;
• provisions for disputes over defective products;
• provisions to cover disputes related to recalls of clearly identified products.
(d) Environmental risks
These provisions are primarily funded to cover cleanup costs.
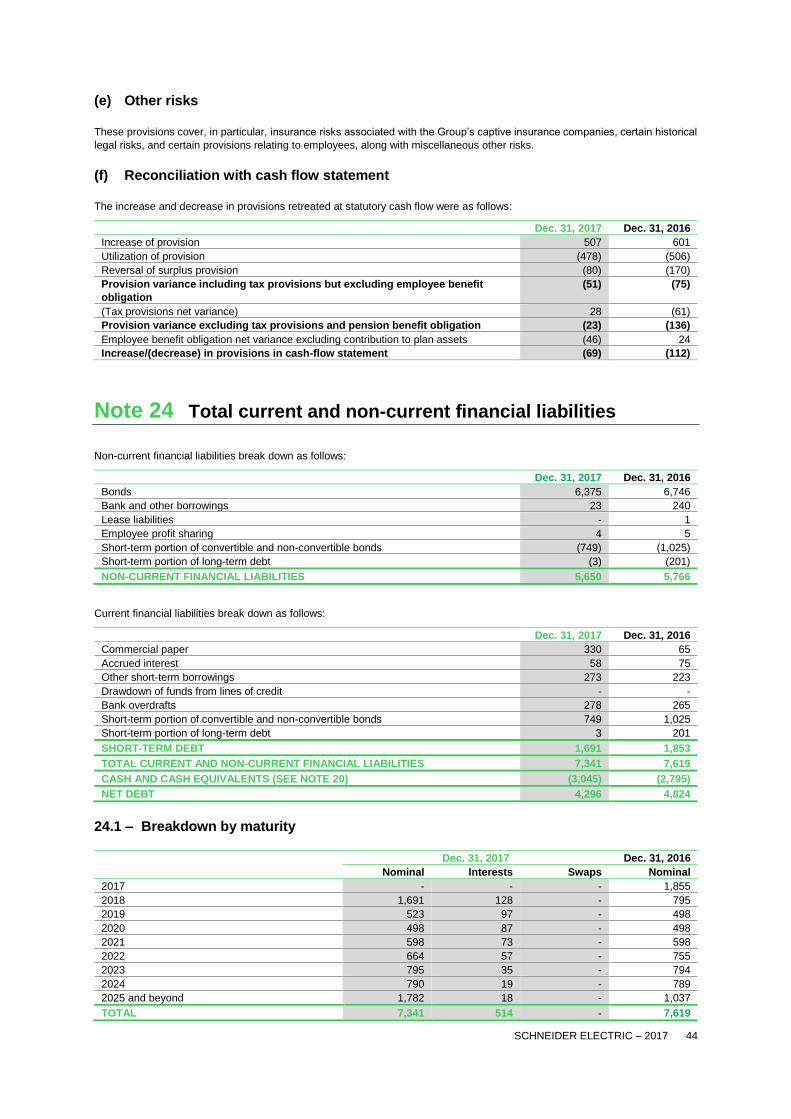
SCHNEIDER ELECTRIC – 2017 44
(e) Other risks
These provisions cover, in particular, insurance risks associated with the Group’s captive insurance companies, certain historical
legal risks, and certain provisions relating to employees, along with miscellaneous other risks.
(f) Reconciliation with cash flow statement
The increase and decrease in provisions retreated at statutory cash flow were as follows:
Dec. 31, 2017 Dec. 31, 2016
Increase of provision 507 601
Utilization of provision (478) (506)
Reversal of surplus provision (80) (170)
Provision variance including tax provisions but excluding employee benefit
obligation
(51) (75)
(Tax provisions net variance) 28 (61)
Provision variance excluding tax provisions and pension benefit obligation (23) (136)
Employee benefit obligation net variance excluding contribution to plan assets (46) 24
Increase/(decrease) in provisions in cash-flow statement (69) (112)
Note 24 Total current and non-current financial liabilities
Non-current financial liabilities break down as follows:
Dec. 31, 2017 Dec. 31, 2016
Bonds 6,375 6,746
Bank and other borrowings 23 240
Lease liabilities - 1
Employee profit sharing 4 5
Short-term portion of convertible and non-convertible bonds (749) (1,025)
Short-term portion of long-term debt (3) (201)
NON-CURRENT FINANCIAL LIABILITIES 5,650 5,766
Current financial liabilities break down as follows:
Dec. 31, 2017 Dec. 31, 2016
Commercial paper 330 65
Accrued interest 58 75
Other short-term borrowings 273 223
Drawdown of funds from lines of credit - -
Bank overdrafts 278 265
Short-term portion of convertible and non-convertible bonds 749 1,025
Short-term portion of long-term debt 3 201
SHORT-TERM DEBT 1,691 1,853
TOTAL CURRENT AND NON-CURRENT FINANCIAL LIABILITIES 7,341 7,619
CASH AND CASH EQUIVALENTS (SEE NOTE 20) (3,045) (2,795)
NET DEBT 4,296 4,824
24.1 – Breakdown by maturity
Dec. 31, 2017 Dec. 31, 2016
Nominal Interests Swaps Nominal
2017 - - - 1,855
2018 1,691 128 - 795
2019 523 97 - 498
2020 498 87 - 498
2021 598 73 - 598
2022 664 57 - 755
2023 795 35 - 794
2024 790 19 - 789
2025 and beyond 1,782 18 - 1,037
TOTAL 7,341 514 - 7,619
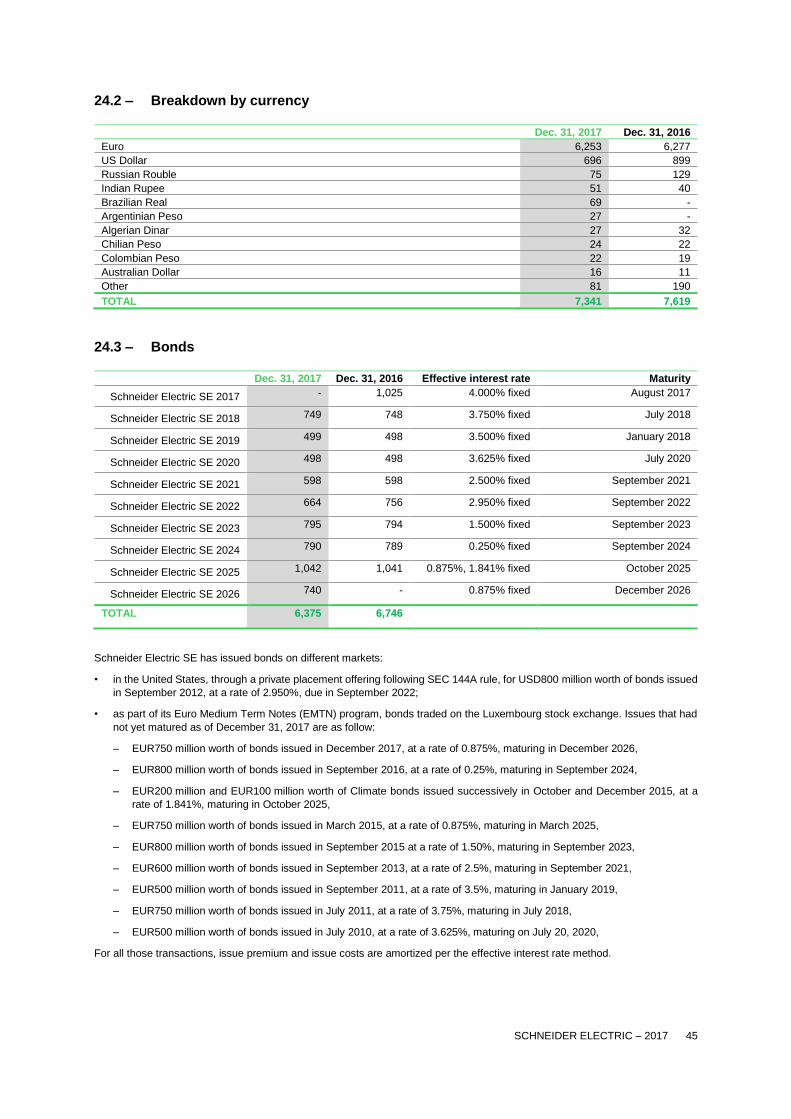
SCHNEIDER ELECTRIC – 2017 45
24.2 – Breakdown by currency
Dec. 31, 2017 Dec. 31, 2016
Euro 6,253 6,277
US Dollar 696 899
Russian Rouble 75 129
Indian Rupee 51 40
Brazilian Real 69 -
Argentinian Peso 27 -
Algerian Dinar 27 32
Chilian Peso 24 22
Colombian Peso 22 19
Australian Dollar 16 11
Other 81 190
TOTAL 7,341 7,619
24.3 – Bonds
Dec. 31, 2017 Dec. 31, 2016 Effective interest rate Maturity
Schneider Electric SE 2017 - 1,025 4.000% fixed August 2017
Schneider Electric SE 2018 749 748 3.750% fixed July 2018
Schneider Electric SE 2019 499 498 3.500% fixed January 2018
Schneider Electric SE 2020 498 498 3.625% fixed July 2020
Schneider Electric SE 2021 598 598 2.500% fixed September 2021
Schneider Electric SE 2022 664 756 2.950% fixed September 2022
Schneider Electric SE 2023 795 794 1.500% fixed September 2023
Schneider Electric SE 2024 790 789 0.250% fixed September 2024
Schneider Electric SE 2025 1,042 1,041 0.875%, 1.841% fixed October 2025
Schneider Electric SE 2026 740 - 0.875% fixed December 2026
TOTAL 6,375 6,746
Schneider Electric SE has issued bonds on different markets:
• in the United States, through a private placement offering following SEC 144A rule, for USD800 million worth of bonds issued
in September 2012, at a rate of 2.950%, due in September 2022;
• as part of its Euro Medium Term Notes (EMTN) program, bonds traded on the Luxembourg stock exchange. Issues that had
not yet matured as of December 31, 2017 are as follow:
– EUR750 million worth of bonds issued in December 2017, at a rate of 0.875%, maturing in December 2026,
– EUR800 million worth of bonds issued in September 2016, at a rate of 0.25%, maturing in September 2024,
– EUR200 million and EUR100 million worth of Climate bonds issued successively in October and December 2015, at a
rate of 1.841%, maturing in October 2025,
– EUR750 million worth of bonds issued in March 2015, at a rate of 0.875%, maturing in March 2025,
– EUR800 million worth of bonds issued in September 2015 at a rate of 1.50%, maturing in September 2023,
– EUR600 million worth of bonds issued in September 2013, at a rate of 2.5%, maturing in September 2021,
– EUR500 million worth of bonds issued in September 2011, at a rate of 3.5%, maturing in January 2019,
– EUR750 million worth of bonds issued in July 2011, at a rate of 3.75%, maturing in July 2018,
– EUR500 million worth of bonds issued in July 2010, at a rate of 3.625%, maturing on July 20, 2020,
For all those transactions, issue premium and issue costs are amortized per the effective interest rate method.
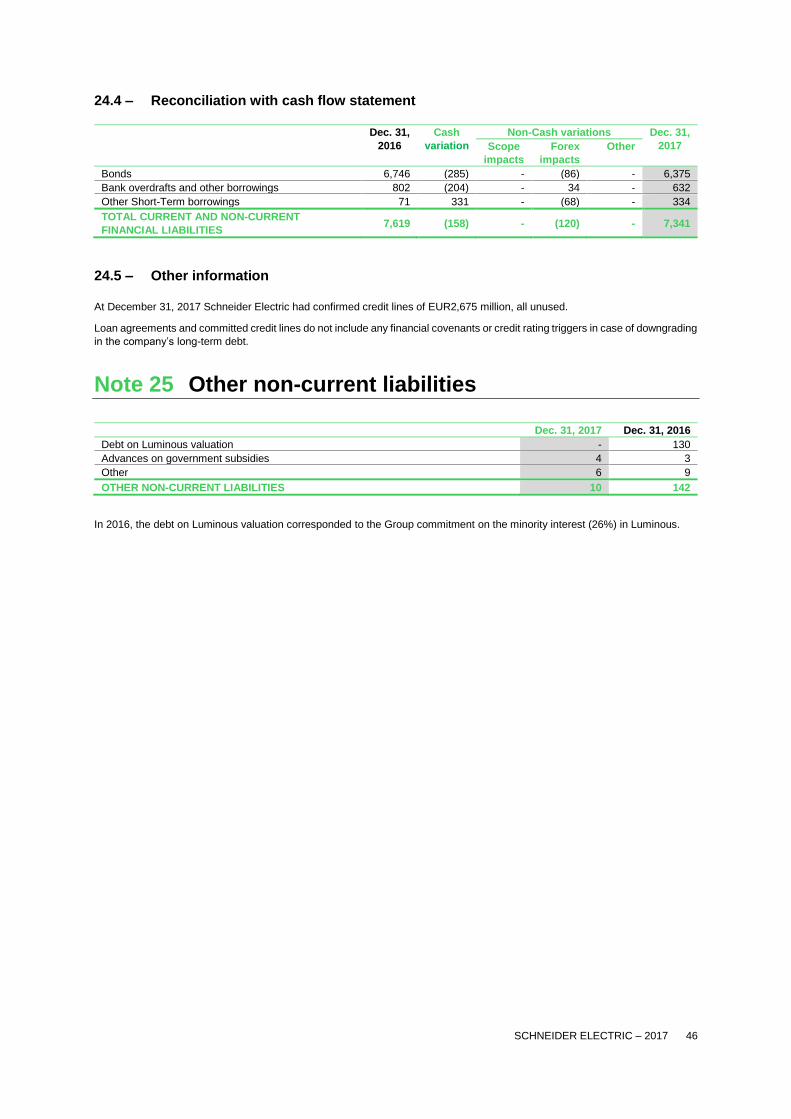
SCHNEIDER ELECTRIC – 2017 46
24.4 – Reconciliation with cash flow statement
Dec. 31,
2016
Cash
variation
Non-Cash variations Dec. 31,
2017 Scope
impacts
Forex
impacts
Other
Bonds 6,746 (285) - (86) - 6,375
Bank overdrafts and other borrowings 802 (204) - 34 - 632
Other Short-Term borrowings 71 331 - (68) - 334
TOTAL CURRENT AND NON-CURRENT
FINANCIAL LIABILITIES 7,619 (158) - (120) - 7,341
24.5 – Other information
At December 31, 2017 Schneider Electric had confirmed credit lines of EUR2,675 million, all unused.
Loan agreements and committed credit lines do not include any financial covenants or credit rating triggers in case of downgrading
in the company’s long-term debt.
Note 25 Other non-current liabilities
Dec. 31, 2017 Dec. 31, 2016
Debt on Luminous valuation - 130
Advances on government subsidies 4 3
Other 6 9
OTHER NON-CURRENT LIABILITIES 10 142
In 2016, the debt on Luminous valuation corresponded to the Group commitment on the minority interest (26%) in Luminous.
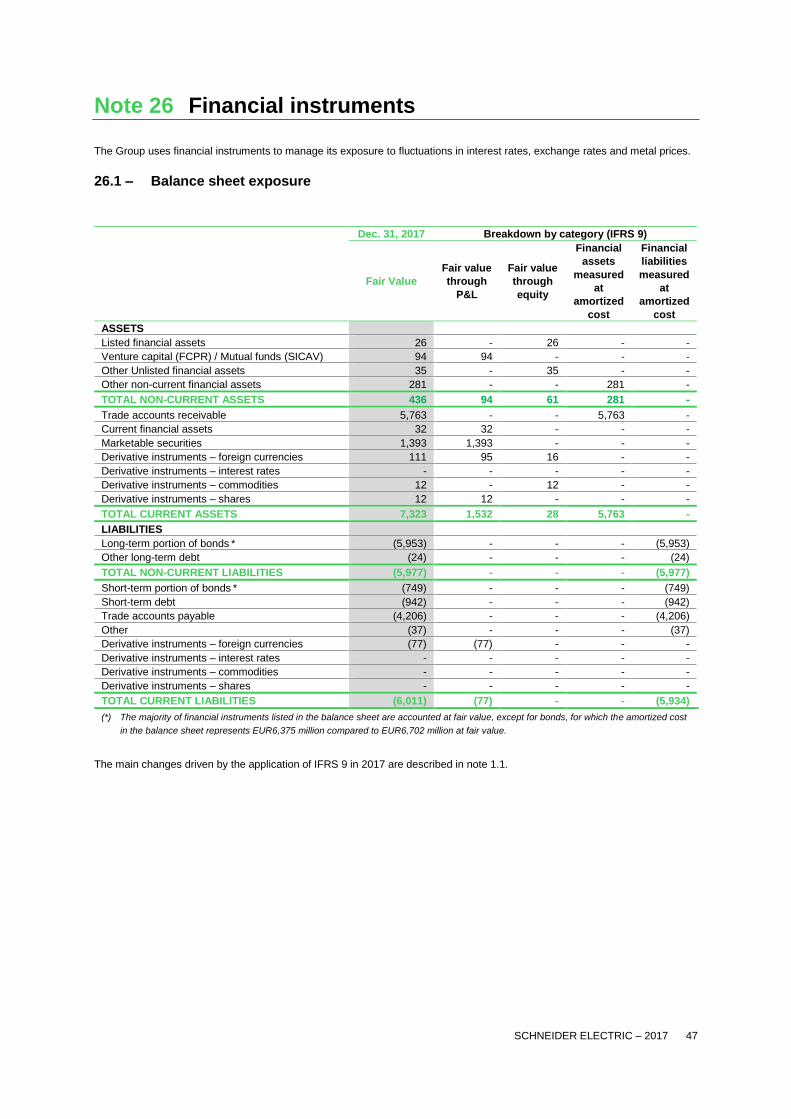
SCHNEIDER ELECTRIC – 2017 47
Note 26 Financial instruments
The Group uses financial instruments to manage its exposure to fluctuations in interest rates, exchange rates and metal prices.
26.1 – Balance sheet exposure
Dec. 31, 2017 Breakdown by category (IFRS 9)
Fair Value
Fair value
through
P&L
Fair value
through
equity
Financial
assets
measured
at
amortized
cost
Financial
liabilities
measured
at
amortized
cost
ASSETS
Listed financial assets 26 - 26 - -
Venture capital (FCPR) / Mutual funds (SICAV) 94 94 - - -
Other Unlisted financial assets 35 - 35 - -
Other non-current financial assets 281 - - 281 -
TOTAL NON-CURRENT ASSETS 436 94 61 281 -
Trade accounts receivable 5,763 - - 5,763 -
Current financial assets 32 32 - - -
Marketable securities 1,393 1,393 - - -
Derivative instruments – foreign currencies 111 95 16 - -
Derivative instruments – interest rates - - - - -
Derivative instruments – commodities 12 - 12 - -
Derivative instruments – shares 12 12 - - -
TOTAL CURRENT ASSETS 7,323 1,532 28 5,763 -
LIABILITIES
Long-term portion of bonds * (5,953) - - - (5,953)
Other long-term debt (24) - - - (24)
TOTAL NON-CURRENT LIABILITIES (5,977) - - - (5,977)
Short-term portion of bonds * (749) - - - (749)
Short-term debt (942) - - - (942)
Trade accounts payable (4,206) - - - (4,206)
Other (37) - - - (37)
Derivative instruments – foreign currencies (77) (77) - - -
Derivative instruments – interest rates - - - - -
Derivative instruments – commodities - - - - -
Derivative instruments – shares - - - - -
TOTAL CURRENT LIABILITIES (6,011) (77) - - (5,934)
(*) The majority of financial instruments listed in the balance sheet are accounted at fair value, except for bonds, for which the amortized cost
in the balance sheet represents EUR6,375 million compared to EUR6,702 million at fair value.
The main changes driven by the application of IFRS 9 in 2017 are described in note 1.1.

SCHNEIDER ELECTRIC – 2017 48
Dec. 31, 2016 Breakdown by category (IAS 39)
Fair
Value
Fair value
through
P&L
Fair value
through
equity
Available-for-
sale financial
assets
Loans and
account
receivables
Financial
liabilities
measured
at
amortized
cost
ASSETS
Available-for-sale financial assets 161 - - 161 - -
Other non-current financial assets 378 - - - 378 -
TOTAL NON-CURRENT ASSETS 539 - - 161 378 -
Trade accounts receivable 5,929 - - - 5,929 -
Current financial assets 36 36 - - - -
Marketable securities 899 899 - - - -
Derivative instruments – foreign
currencies
49 36 13 - - -
Derivative instruments – interest
rates
- - - - - -
Derivative instruments –
commodities
9 - 9 - - -
Derivative instruments – shares 16 16 - - - -
TOTAL CURRENT ASSETS 6,938 987 22 - 5,929 -
LIABILITIES
Long-term portion of bonds * (6,019) - - - - (6,019)
Other long-term debt (46) - - - - (46)
TOTAL NON-CURRENT
LIABILITIES
(6,065) - - - - (6,065)
Short-term portion of bonds * (1,057) - - - - (1,057)
Short-term debt (828) - - - - (828)
Trade accounts payable (4,146) - - - - (4,146)
Other (27) - - - - (27)
Derivative instruments – foreign
currencies
(197) (192) 5 - - -
Derivative instruments – interest
rates
- - - - - -
Derivative instruments –
commodities
- - - - - -
Derivative instruments – shares - - - - - -
TOTAL CURRENT LIABILITIES (6,255) (192) 5 - - (6,058)
(*) The majority of financial instruments listed in the balance sheet are accounted at fair value, except for bonds, for which the amortized cost
in the balance sheet represents EUR6,746 million compared to EUR7,076 million at fair value.
26.2 – Fair value hierarchy
Financial assets and liabilities can be classified at the fair value following the hierarchy levels below:
1. market value (non-adjusted) on active markets, for similar assets and liabilities, which the company can obtain on a given
valuation date;
2. data other than the market rate available for level 1, which are directly or indirectly observable on the market;
3. data on the asset or liability that are not observable on the market.

SCHNEIDER ELECTRIC – 2017 49
Dec. 31, 2017
Carrying
Amount Fair value Level 1 Level 2 Level 3
ASSETS
Financial assets 155 155 26 129(1)
Marketable securities 1,393 1,393 1,393
Derivative instruments 135 135 135
LIABILITIES
Bonds (6,375) (6,702) (6,702)
Other long-term debt (24) (24) (24)
Other current liabilities (5,185) (5,185) (5,185)
Derivative instruments (77) (77) (77)
(1) Unlisted available-for-sale financial assets are tested once a year and impaired when necessary.
Dec. 31, 2016
Carrying
Amount Fair value Level 1 Level 2 Level 3
ASSETS
Available-for-sale financial assets 161 161 36 - 125(1)
Marketable securities 899 899 899 - -
Derivative instruments 74 74 - 74 -
LIABILITIES
Bonds (6,746) (7,076) (7,076) - -
Other long-term debt (46) (46) - - (46)
Other current liabilities (5,001) (5,001) - - (5,001)
Derivative instruments (197) (197) - (197) -
(1) Unlisted available-for-sale financial assets are tested once a year and impaired when necessary.
26.3 – Derivative instruments
26.3.1 Foreign currency
Due to the fact that a significant proportion of affiliates’ transactions are denominated in currencies other than their functional
currencies, the Group is exposed to currency risks. If the Group is not able to hedge these risks, fluctuations in exchange rates
between the functional currencies and other currencies can have a significant impact on its results and distort year-on-year
performance comparisons. As a result, the Group uses derivative instruments to hedge its exposure to exchange rates mainly
through futures and natural hedges. Furthermore, some long term loans and borrowings granted to the affiliates are considered
as net investment according to IAS 21.
Dec. 31, 2017
Carrying
amount
Nominal amount
Sale Purchase
Cash flow hedges (20) 149 872
Net investment hedges 12 1,105 -
Trading 41 5,213 3,704
TOTAL 33 6,467 4,576
Dec. 31, 2016
Carrying
amount
Nominal amount
Sale Purchase
Cash flow hedges (74) 411 867
Net investment hedges 12 1,257 -
Trading (86) 4,780 3,209
TOTAL 148 6,348 4,076
We manage our exposure to currency risk to reduce the sensitivity of earnings to changes in exchange rates through hedging
programs relating to receivables, payables and cash flows, which are primarily hedged by means of forward purchases and sales.
Depending on market conditions, risks in the main currencies may be hedged based on cash flow forecasting using contracts that
expire in 12 months or less. Schneider Electric’s currency hedging policy is to protect its subsidiaries against risks on all
transactions denominated in a currency other than their functional currency.

SCHNEIDER ELECTRIC – 2017 50
Positions of futures hedges of balance sheet items and net investment by currency:
Dec. 31, 2017
Sales Purchases Net
USD 4,279 (1,281) 2,998
GBP 381 (632) (251)
SGD 364 (161) 203
BRL 5 (206) (201)
CNY 200 (656) (456)
HKD 187 (41) 146
AED 62 (2) 60
HUF 38 (98) (60)
IDR 32 (61) (29)
SEK 78 (190) (112)
CAD 140 (143) (3)
NOK 78 (4) 74
DKK 15 (170) (155)
AUD 165 (620) (455)
RUB 82 - 82
CHF 23 (130) (107)
SAR 28 (1) 27
ZAR 53 (3) 50
Others 257 (177) 80
TOTAL 6,467 (4,576) 1,891
These forward currency hedging positions include EUR952 million in hedges of loans and borrowings of a financial nature (net
sales) and EUR939 million in hedges of operating cash flows (net sales).
26.3.2 Interest rate
Interest rate risk on borrowings is managed at the Group level, based on consolidated debt and taking into consideration market
conditions to optimize overall borrowing costs. The Group uses derivative instruments to hedge its exposure to interest rates
through swaps.
The Group didn’t use any derivative instrument to hedge its exposure to interest rates during the fiscal year 2017.
26.3.3 Raw material hedges
The Group is exposed to fluctuations in energy and raw material prices, in particular steel, copper, aluminium, silver, lead, nickel,
zinc and plastics. If we are not able to hedge, compensate for or pass on to customers any such increased costs, this could have
an adverse impact on our financial results. The Group has, however, implemented certain procedures to limit exposure to rising
non-ferrous and precious raw material prices. The purchasing departments of the operating units report their purchasing forecasts
to the Corporate Finance and Treasury Department. Purchase commitments are hedged using forward contracts, swaps and, to
a lesser extent, options.
All commodities instruments are futures and options designated as cash flow hedge under IFRS standards, of which:
Dec. 31, 2017 Dec. 31, 2016
Carrying amount 12 9
Nominal amount (153) (159)
26.3.4 Share-based payment
Schneider Electric shares are hedged (cash flow hedges) in relation to the Stock Appreciation Rights granted to US employees.
Details are as follow:
Dec. 31, 2017 Dec. 31, 2016
Outstanding shares 400,146 629,447
Carrying amount 12 16
Nominal amount (17) (27)
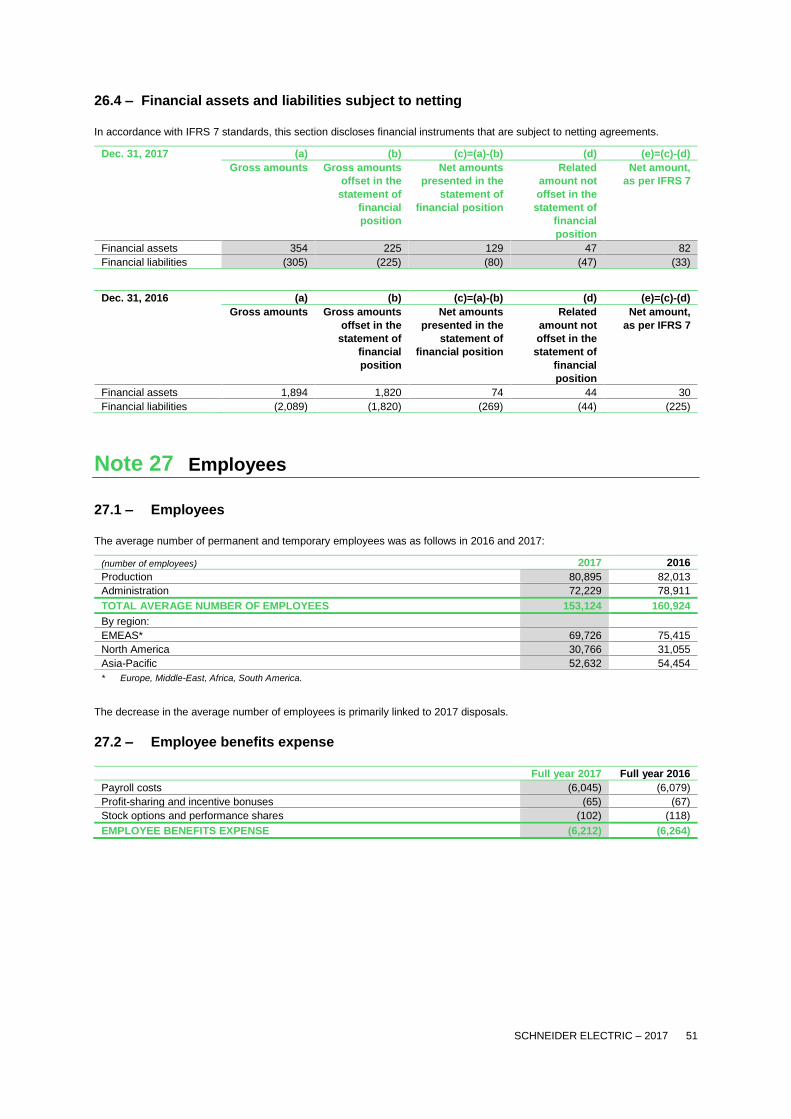
SCHNEIDER ELECTRIC – 2017 51
26.4 – Financial assets and liabilities subject to netting
In accordance with IFRS 7 standards, this section discloses financial instruments that are subject to netting agreements.
Dec. 31, 2017 (a) (b) (c)=(a)-(b) (d) (e)=(c)-(d)
Gross amounts Gross amounts
offset in the
statement of
financial
position
Net amounts
presented in the
statement of
financial position
Related
amount not
offset in the
statement of
financial
position
Net amount,
as per IFRS 7
Financial assets 354 225 129 47 82
Financial liabilities (305) (225) (80) (47) (33)
Dec. 31, 2016 (a) (b) (c)=(a)-(b) (d) (e)=(c)-(d)
Gross amounts Gross amounts
offset in the
statement of
financial
position
Net amounts
presented in the
statement of
financial position
Related
amount not
offset in the
statement of
financial
position
Net amount,
as per IFRS 7
Financial assets 1,894 1,820 74 44 30
Financial liabilities (2,089) (1,820) (269) (44) (225)
Note 27 Employees
27.1 – Employees
The average number of permanent and temporary employees was as follows in 2016 and 2017:
(number of employees) 2017 2016
Production 80,895 82,013
Administration 72,229 78,911
TOTAL AVERAGE NUMBER OF EMPLOYEES 153,124 160,924
By region:
EMEAS* 69,726 75,415
North America 30,766 31,055
Asia-Pacific 52,632 54,454
* Europe, Middle-East, Africa, South America.
The decrease in the average number of employees is primarily linked to 2017 disposals.
27.2 – Employee benefits expense
Full year 2017 Full year 2016
Payroll costs (6,045) (6,079)
Profit-sharing and incentive bonuses (65) (67)
Stock options and performance shares (102) (118)
EMPLOYEE BENEFITS EXPENSE (6,212) (6,264)
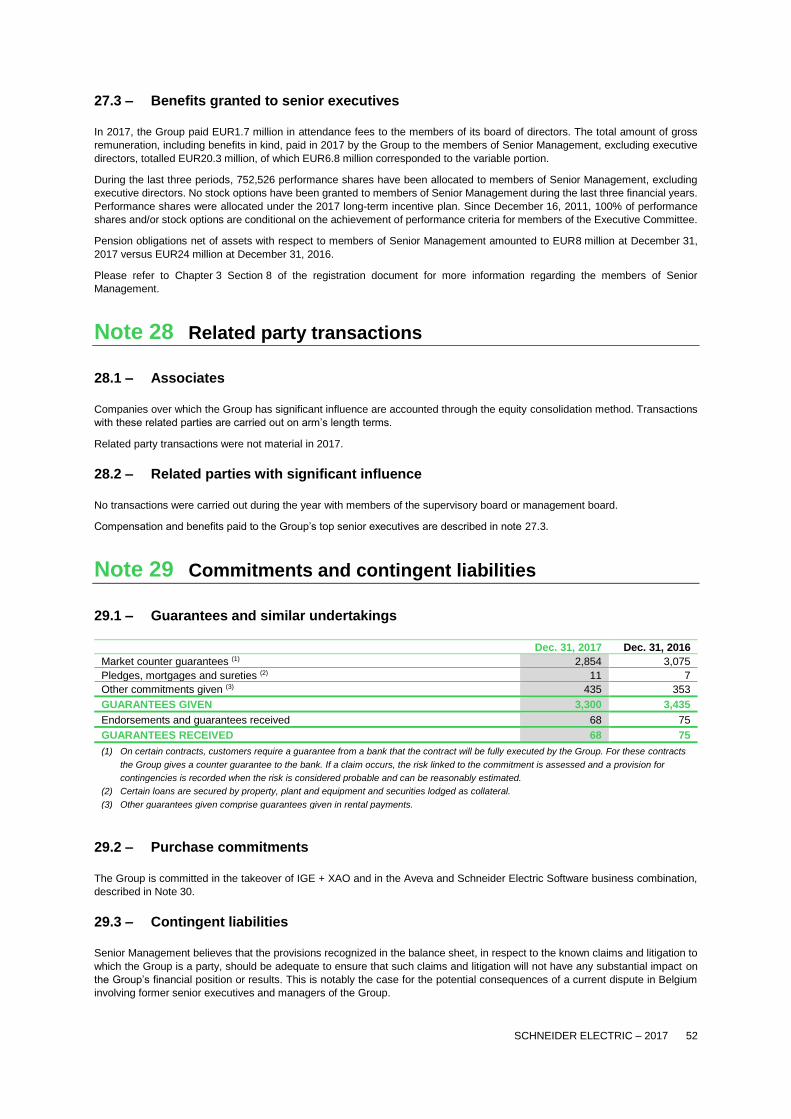
SCHNEIDER ELECTRIC – 2017 52
27.3 – Benefits granted to senior executives
In 2017, the Group paid EUR1.7 million in attendance fees to the members of its board of directors. The total amount of gross
remuneration, including benefits in kind, paid in 2017 by the Group to the members of Senior Management, excluding executive
directors, totalled EUR20.3 million, of which EUR6.8 million corresponded to the variable portion.
During the last three periods, 752,526 performance shares have been allocated to members of Senior Management, excluding
executive directors. No stock options have been granted to members of Senior Management during the last three financial years.
Performance shares were allocated under the 2017 long-term incentive plan. Since December 16, 2011, 100% of performance
shares and/or stock options are conditional on the achievement of performance criteria for members of the Executive Committee.
Pension obligations net of assets with respect to members of Senior Management amounted to EUR8 million at December 31,
2017 versus EUR24 million at December 31, 2016.
Please refer to Chapter 3 Section 8 of the registration document for more information regarding the members of Senior
Management.
Note 28 Related party transactions
28.1 – Associates
Companies over which the Group has significant influence are accounted through the equity consolidation method. Transactions
with these related parties are carried out on arm’s length terms.
Related party transactions were not material in 2017.
28.2 – Related parties with significant influence
No transactions were carried out during the year with members of the supervisory board or management board.
Compensation and benefits paid to the Group’s top senior executives are described in note 27.3.
Note 29 Commitments and contingent liabilities
29.1 – Guarantees and similar undertakings
Dec. 31, 2017 Dec. 31, 2016
Market counter guarantees (1) 2,854 3,075
Pledges, mortgages and sureties (2) 11 7
Other commitments given (3) 435 353
GUARANTEES GIVEN 3,300 3,435
Endorsements and guarantees received 68 75
GUARANTEES RECEIVED 68 75
(1) On certain contracts, customers require a guarantee from a bank that the contract will be fully executed by the Group. For these contracts
the Group gives a counter guarantee to the bank. If a claim occurs, the risk linked to the commitment is assessed and a provision for
contingencies is recorded when the risk is considered probable and can be reasonably estimated.
(2) Certain loans are secured by property, plant and equipment and securities lodged as collateral.
(3) Other guarantees given comprise guarantees given in rental payments.
29.2 – Purchase commitments
The Group is committed in the takeover of IGE + XAO and in the Aveva and Schneider Electric Software business combination,
described in Note 30.
29.3 – Contingent liabilities
Senior Management believes that the provisions recognized in the balance sheet, in respect to the known claims and litigation to
which the Group is a party, should be adequate to ensure that such claims and litigation will not have any substantial impact on
the Group’s financial position or results. This is notably the case for the potential consequences of a current dispute in Belgium
involving former senior executives and managers of the Group.
SCHNEIDER ELECTRIC – 2017 53
Note 30 Subsequent events
30.1 – IGE + XAO takeover
On November 8, 2017, the Group announced the signing of a memorandum of understanding, pursuant to which SEI SAS have
filed with the Autorité des Marchés Financiers (AMF) a voluntary public tender offer for the shares of IGE+XAO, at the price of
132 Euros per share (coupon attached).
With more than 80,000 licences globally, IGE+XAO is a leader in design software for electrical installations through its CAD
(Computer Aided Design), PLM (Product Life cycle Management) and simulation software. The company had consolidated
revenues of 29.4 million Euros for the financial year 2016-2017 and an operational margin of 27%.
On January 25, 2018, after the successful public tender offer and following the delivery of the shares tendered to the offer, the
Group announced that SEI SAS will own directly and indirectly 70.57% of the share capital of IGE+XAO, and therefore has taken
the control of the Company. The public tender offer initiated by Schneider Electric has been re-opened from February 1st to
February 14th, 2018, in order to allow shareholders who have not yet disposed of their shares to do so under the same terms.
30.2 – Aveva & Schneider Electric Software Business combination
On September 5th, 2017, the Group announced that it had reached agreement with AVEVA Group plc on the terms and conditions
of a Combination of AVEVA and Schneider Electric industrial software business, to create a global leader in engineering and
industrial software. On completion, following the issue of ordinary shares in the capital of AVEVA to Schneider Electric, the Group
will own 60% of the enlarged AVEVA Group, on a fully diluted basis. Completion is subject to the satisfaction of a number of
conditions including, amongst other things, AVEVA shareholder approval of the combination and applicable regulatory and anti-
trust approvals having been obtained.
Subsequent to the announcement of September 5th, AVEVA shareholder approval was given at a General Meeting on September
29th, 2017. All outstanding regulatory clearances required ahead of completion of the Combination have now been received,
including the approval of the Committee on Foreign Investments in the United States ("CFIUS"), which gave its approval on
February 9, 2018. Therefore, it is expected that completion of the Combination will occur in March 1, 2018.

SCHNEIDER ELECTRIC – 2017 54
Note 31 Statutory auditors’ fees
Fees paid by the Group to the statutory auditors and their networks:
(in thousands of euros) Full year 2017
EY % Mazars % TOTAL
Audit
Statutory auditing 11,152 85% 7,776 89% 18,928
o/w Schneider Electric SE 102 102
o/w subsidiaries 11,050 7,674
Related services 1,152 9% 908 11% 2,060
o/w Schneider Electric SE 752 37
o/w subsidiaries 400 871
Audit sub-total 12,304 94% 8,684 100% 20,988
Other legal, tax services 742 6% 10 - 752
TOTAL FEES 13,046 100% 8,694 100% 21,740
(in thousands of euros) Full year 2016
EY % Mazars % TOTAL
Audit
Statutory auditing 8,354 76% 7,863 89% 16,217
o/w Schneider Electric SE 100 100
o/w subsidiaries 8,254 7,763
Related services 1,861 17% 984 11% 2,845
o/w Schneider Electric SE 23 41
o/w subsidiaries 1,838 943
Audit sub-total 10,215 93% 8,847 100% 19,062
Other legal, tax services 733 7% 10 - 743
TOTAL FEES 10,948 100% 8,857 100% 19,805
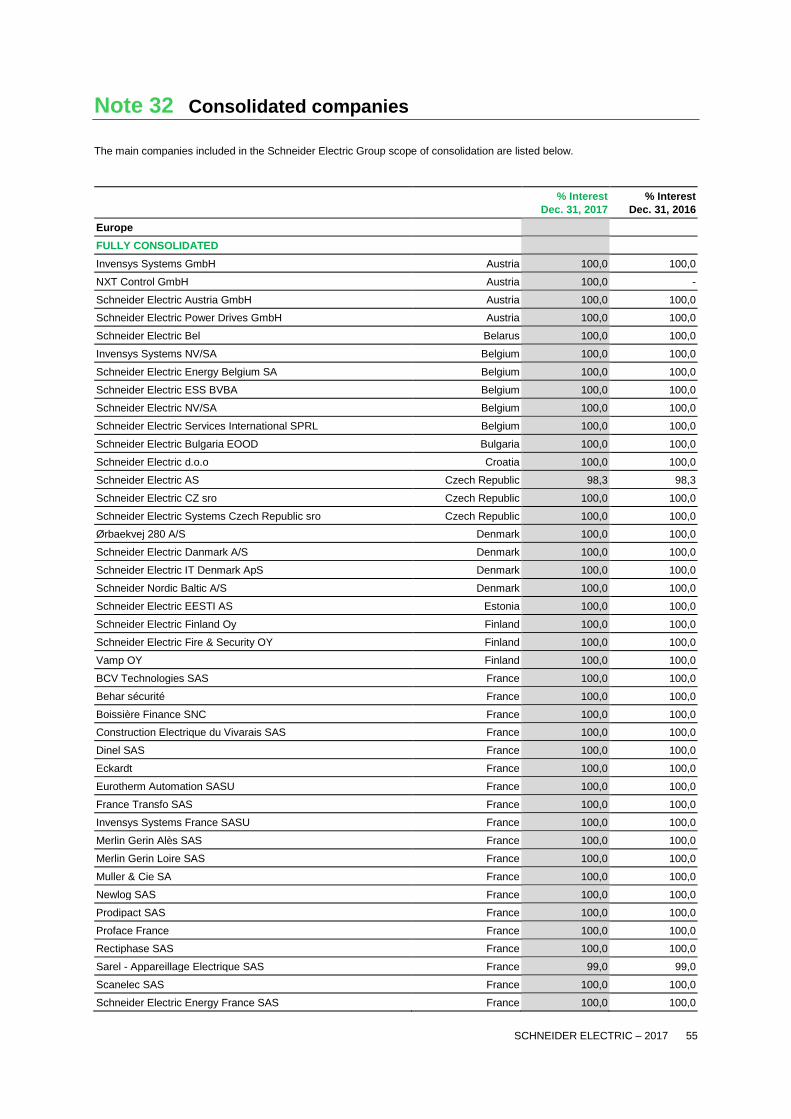
SCHNEIDER ELECTRIC – 2017 55
Note 32 Consolidated companies
The main companies included in the Schneider Electric Group scope of consolidation are listed below.
% Interest
Dec. 31, 2017
% Interest
Dec. 31, 2016
Europe
FULLY CONSOLIDATED
Invensys Systems GmbH Austria 100,0 100,0
NXT Control GmbH Austria 100,0 -
Schneider Electric Austria GmbH Austria 100,0 100,0
Schneider Electric Power Drives GmbH Austria 100,0 100,0
Schneider Electric Bel Belarus 100,0 100,0
Invensys Systems NV/SA Belgium 100,0 100,0
Schneider Electric Energy Belgium SA Belgium 100,0 100,0
Schneider Electric ESS BVBA Belgium 100,0 100,0
Schneider Electric NV/SA Belgium 100,0 100,0
Schneider Electric Services International SPRL Belgium 100,0 100,0
Schneider Electric Bulgaria EOOD Bulgaria 100,0 100,0
Schneider Electric d.o.o Croatia 100,0 100,0
Schneider Electric AS Czech Republic 98,3 98,3
Schneider Electric CZ sro Czech Republic 100,0 100,0
Schneider Electric Systems Czech Republic sro Czech Republic 100,0 100,0
Ørbaekvej 280 A/S Denmark 100,0 100,0
Schneider Electric Danmark A/S Denmark 100,0 100,0
Schneider Electric IT Denmark ApS Denmark 100,0 100,0
Schneider Nordic Baltic A/S Denmark 100,0 100,0
Schneider Electric EESTI AS Estonia 100,0 100,0
Schneider Electric Finland Oy Finland 100,0 100,0
Schneider Electric Fire & Security OY Finland 100,0 100,0
Vamp OY Finland 100,0 100,0
BCV Technologies SAS France 100,0 100,0
Behar sécurité France 100,0 100,0
Boissière Finance SNC France 100,0 100,0
Construction Electrique du Vivarais SAS France 100,0 100,0
Dinel SAS France 100,0 100,0
Eckardt France 100,0 100,0
Eurotherm Automation SASU France 100,0 100,0
France Transfo SAS France 100,0 100,0
Invensys Systems France SASU France 100,0 100,0
Merlin Gerin Alès SAS France 100,0 100,0
Merlin Gerin Loire SAS France 100,0 100,0
Muller & Cie SA France 100,0 100,0
Newlog SAS France 100,0 100,0
Prodipact SAS France 100,0 100,0
Proface France France 100,0 100,0
Rectiphase SAS France 100,0 100,0
Sarel - Appareillage Electrique SAS France 99,0 99,0
Scanelec SAS France 100,0 100,0
Schneider Electric Energy France SAS France 100,0 100,0
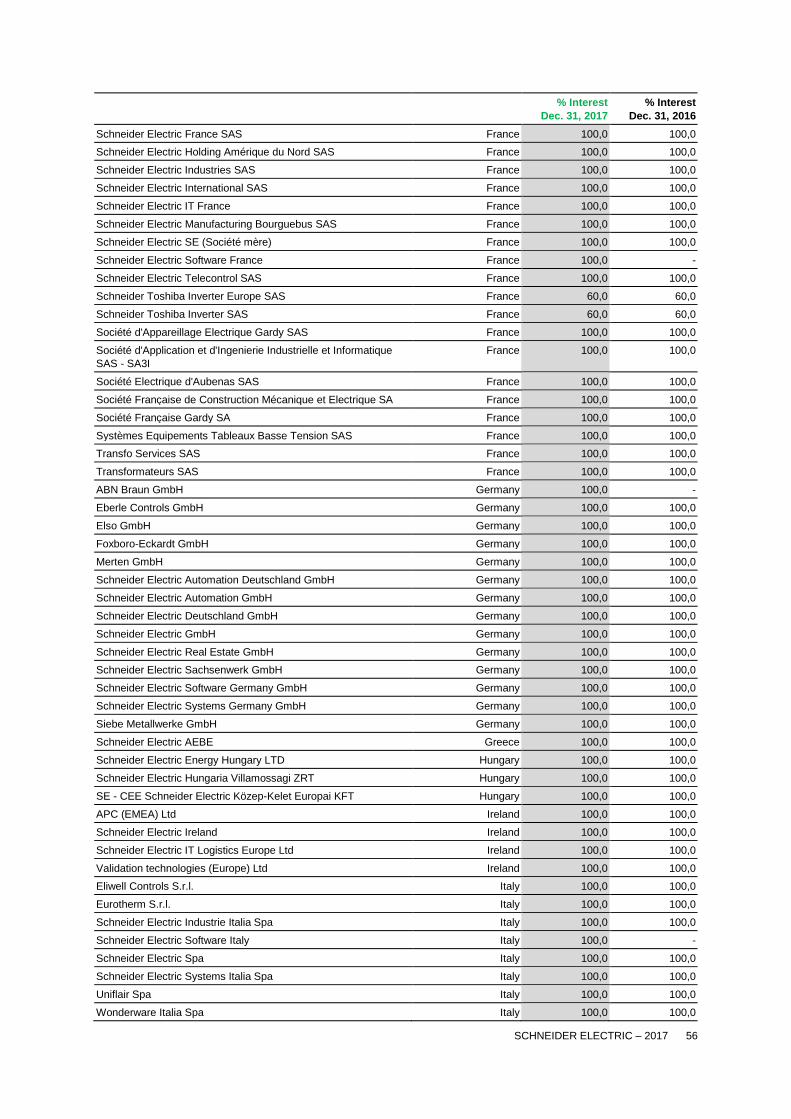
SCHNEIDER ELECTRIC – 2017 56
% Interest
Dec. 31, 2017
% Interest
Dec. 31, 2016
Schneider Electric France SAS France 100,0 100,0
Schneider Electric Holding Amérique du Nord SAS France 100,0 100,0
Schneider Electric Industries SAS France 100,0 100,0
Schneider Electric International SAS France 100,0 100,0
Schneider Electric IT France France 100,0 100,0
Schneider Electric Manufacturing Bourguebus SAS France 100,0 100,0
Schneider Electric SE (Société mère) France 100,0 100,0
Schneider Electric Software France France 100,0 -
Schneider Electric Telecontrol SAS France 100,0 100,0
Schneider Toshiba Inverter Europe SAS France 60,0 60,0
Schneider Toshiba Inverter SAS France 60,0 60,0
Société d'Appareillage Electrique Gardy SAS France 100,0 100,0
Société d'Application et d'Ingenierie Industrielle et Informatique
SAS - SA3I
France 100,0 100,0
Société Electrique d'Aubenas SAS France 100,0 100,0
Société Française de Construction Mécanique et Electrique SA France 100,0 100,0
Société Française Gardy SA France 100,0 100,0
Systèmes Equipements Tableaux Basse Tension SAS France 100,0 100,0
Transfo Services SAS France 100,0 100,0
Transformateurs SAS France 100,0 100,0
ABN Braun GmbH Germany 100,0 -
Eberle Controls GmbH Germany 100,0 100,0
Elso GmbH Germany 100,0 100,0
Foxboro-Eckardt GmbH Germany 100,0 100,0
Merten GmbH Germany 100,0 100,0
Schneider Electric Automation Deutschland GmbH Germany 100,0 100,0
Schneider Electric Automation GmbH Germany 100,0 100,0
Schneider Electric Deutschland GmbH Germany 100,0 100,0
Schneider Electric GmbH Germany 100,0 100,0
Schneider Electric Real Estate GmbH Germany 100,0 100,0
Schneider Electric Sachsenwerk GmbH Germany 100,0 100,0
Schneider Electric Software Germany GmbH Germany 100,0 100,0
Schneider Electric Systems Germany GmbH Germany 100,0 100,0
Siebe Metallwerke GmbH Germany 100,0 100,0
Schneider Electric AEBE Greece 100,0 100,0
Schneider Electric Energy Hungary LTD Hungary 100,0 100,0
Schneider Electric Hungaria Villamossagi ZRT Hungary 100,0 100,0
SE - CEE Schneider Electric Közep-Kelet Europai KFT Hungary 100,0 100,0
APC (EMEA) Ltd Ireland 100,0 100,0
Schneider Electric Ireland Ireland 100,0 100,0
Schneider Electric IT Logistics Europe Ltd Ireland 100,0 100,0
Validation technologies (Europe) Ltd Ireland 100,0 100,0
Eliwell Controls S.r.l. Italy 100,0 100,0
Eurotherm S.r.l. Italy 100,0 100,0
Schneider Electric Industrie Italia Spa Italy 100,0 100,0
Schneider Electric Software Italy Italy 100,0 -
Schneider Electric Spa Italy 100,0 100,0
Schneider Electric Systems Italia Spa Italy 100,0 100,0
Uniflair Spa Italy 100,0 100,0
Wonderware Italia Spa Italy 100,0 100,0
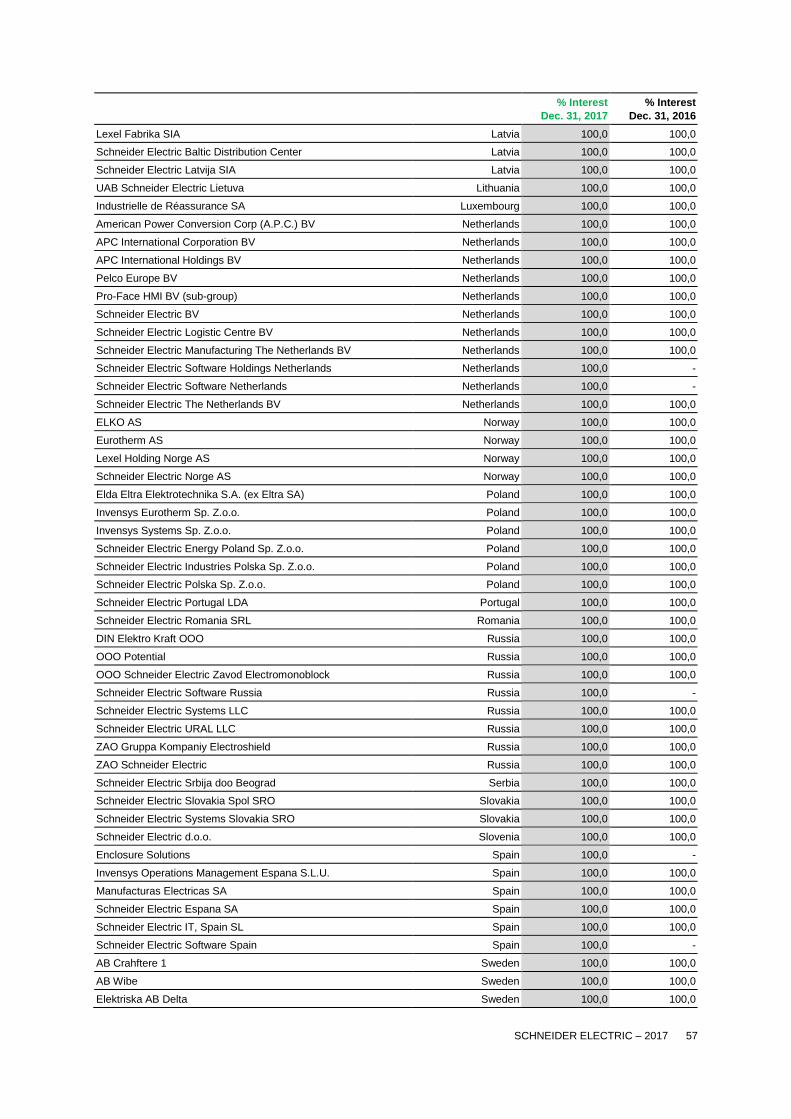
SCHNEIDER ELECTRIC – 2017 57
% Interest
Dec. 31, 2017
% Interest
Dec. 31, 2016
Lexel Fabrika SIA Latvia 100,0 100,0
Schneider Electric Baltic Distribution Center Latvia 100,0 100,0
Schneider Electric Latvija SIA Latvia 100,0 100,0
UAB Schneider Electric Lietuva Lithuania 100,0 100,0
Industrielle de Réassurance SA Luxembourg 100,0 100,0
American Power Conversion Corp (A.P.C.) BV Netherlands 100,0 100,0
APC International Corporation BV Netherlands 100,0 100,0
APC International Holdings BV Netherlands 100,0 100,0
Pelco Europe BV Netherlands 100,0 100,0
Pro-Face HMI BV (sub-group) Netherlands 100,0 100,0
Schneider Electric BV Netherlands 100,0 100,0
Schneider Electric Logistic Centre BV Netherlands 100,0 100,0
Schneider Electric Manufacturing The Netherlands BV Netherlands 100,0 100,0
Schneider Electric Software Holdings Netherlands Netherlands 100,0 -
Schneider Electric Software Netherlands Netherlands 100,0 -
Schneider Electric The Netherlands BV Netherlands 100,0 100,0
ELKO AS Norway 100,0 100,0
Eurotherm AS Norway 100,0 100,0
Lexel Holding Norge AS Norway 100,0 100,0
Schneider Electric Norge AS Norway 100,0 100,0
Elda Eltra Elektrotechnika S.A. (ex Eltra SA) Poland 100,0 100,0
Invensys Eurotherm Sp. Z.o.o. Poland 100,0 100,0
Invensys Systems Sp. Z.o.o. Poland 100,0 100,0
Schneider Electric Energy Poland Sp. Z.o.o. Poland 100,0 100,0
Schneider Electric Industries Polska Sp. Z.o.o. Poland 100,0 100,0
Schneider Electric Polska Sp. Z.o.o. Poland 100,0 100,0
Schneider Electric Portugal LDA Portugal 100,0 100,0
Schneider Electric Romania SRL Romania 100,0 100,0
DIN Elektro Kraft OOO Russia 100,0 100,0
OOO Potential Russia 100,0 100,0
OOO Schneider Electric Zavod Electromonoblock Russia 100,0 100,0
Schneider Electric Software Russia Russia 100,0 -
Schneider Electric Systems LLC Russia 100,0 100,0
Schneider Electric URAL LLC Russia 100,0 100,0
ZAO Gruppa Kompaniy Electroshield Russia 100,0 100,0
ZAO Schneider Electric Russia 100,0 100,0
Schneider Electric Srbija doo Beograd Serbia 100,0 100,0
Schneider Electric Slovakia Spol SRO Slovakia 100,0 100,0
Schneider Electric Systems Slovakia SRO Slovakia 100,0 100,0
Schneider Electric d.o.o. Slovenia 100,0 100,0
Enclosure Solutions Spain 100,0 -
Invensys Operations Management Espana S.L.U. Spain 100,0 100,0
Manufacturas Electricas SA Spain 100,0 100,0
Schneider Electric Espana SA Spain 100,0 100,0
Schneider Electric IT, Spain SL Spain 100,0 100,0
Schneider Electric Software Spain Spain 100,0 -
AB Crahftere 1 Sweden 100,0 100,0
AB Wibe Sweden 100,0 100,0
Elektriska AB Delta Sweden 100,0 100,0
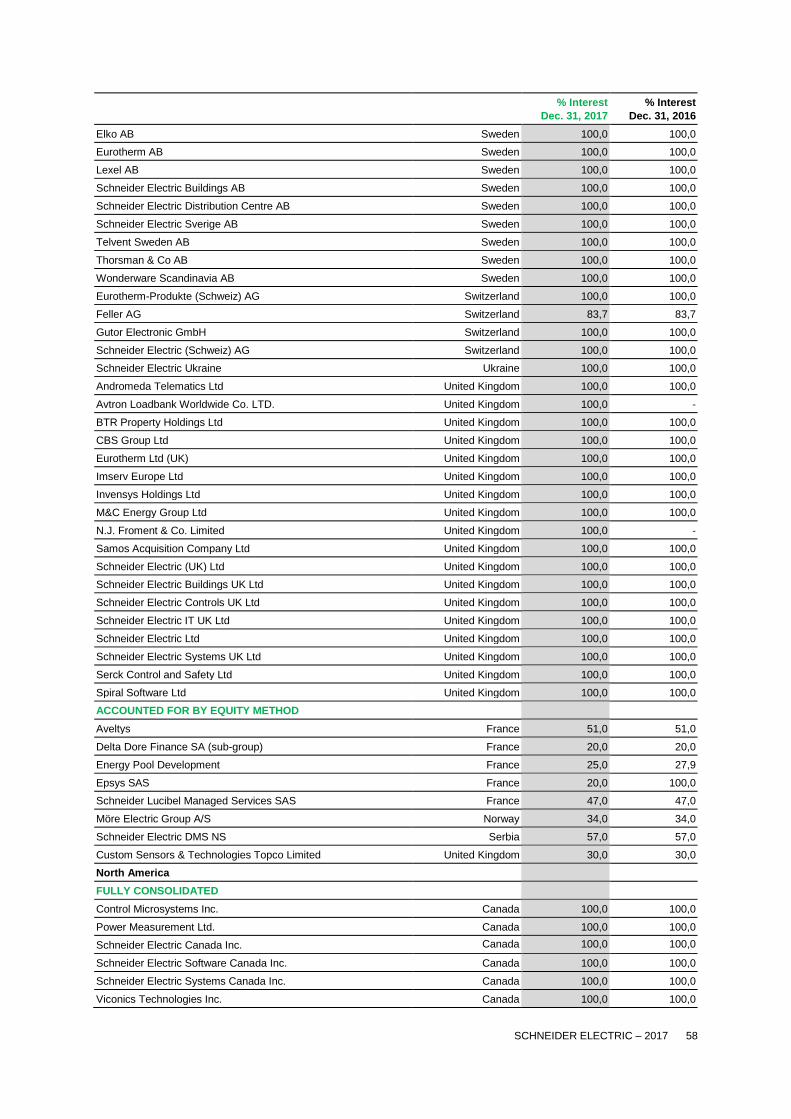
SCHNEIDER ELECTRIC – 2017 58
% Interest
Dec. 31, 2017
% Interest
Dec. 31, 2016
Elko AB Sweden 100,0 100,0
Eurotherm AB Sweden 100,0 100,0
Lexel AB Sweden 100,0 100,0
Schneider Electric Buildings AB Sweden 100,0 100,0
Schneider Electric Distribution Centre AB Sweden 100,0 100,0
Schneider Electric Sverige AB Sweden 100,0 100,0
Telvent Sweden AB Sweden 100,0 100,0
Thorsman & Co AB Sweden 100,0 100,0
Wonderware Scandinavia AB Sweden 100,0 100,0
Eurotherm-Produkte (Schweiz) AG Switzerland 100,0 100,0
Feller AG Switzerland 83,7 83,7
Gutor Electronic GmbH Switzerland 100,0 100,0
Schneider Electric (Schweiz) AG Switzerland 100,0 100,0
Schneider Electric Ukraine Ukraine 100,0 100,0
Andromeda Telematics Ltd United Kingdom 100,0 100,0
Avtron Loadbank Worldwide Co. LTD. United Kingdom 100,0 -
BTR Property Holdings Ltd United Kingdom 100,0 100,0
CBS Group Ltd United Kingdom 100,0 100,0
Eurotherm Ltd (UK) United Kingdom 100,0 100,0
Imserv Europe Ltd United Kingdom 100,0 100,0
Invensys Holdings Ltd United Kingdom 100,0 100,0
M&C Energy Group Ltd United Kingdom 100,0 100,0
N.J. Froment & Co. Limited United Kingdom 100,0 -
Samos Acquisition Company Ltd United Kingdom 100,0 100,0
Schneider Electric (UK) Ltd United Kingdom 100,0 100,0
Schneider Electric Buildings UK Ltd United Kingdom 100,0 100,0
Schneider Electric Controls UK Ltd United Kingdom 100,0 100,0
Schneider Electric IT UK Ltd United Kingdom 100,0 100,0
Schneider Electric Ltd United Kingdom 100,0 100,0
Schneider Electric Systems UK Ltd United Kingdom 100,0 100,0
Serck Control and Safety Ltd United Kingdom 100,0 100,0
Spiral Software Ltd United Kingdom 100,0 100,0
ACCOUNTED FOR BY EQUITY METHOD
Aveltys France 51,0 51,0
Delta Dore Finance SA (sub-group) France 20,0 20,0
Energy Pool Development France 25,0 27,9
Epsys SAS France 20,0 100,0
Schneider Lucibel Managed Services SAS France 47,0 47,0
Möre Electric Group A/S Norway 34,0 34,0
Schneider Electric DMS NS Serbia 57,0 57,0
Custom Sensors & Technologies Topco Limited United Kingdom 30,0 30,0
North America
FULLY CONSOLIDATED
Control Microsystems Inc. Canada 100,0 100,0
Power Measurement Ltd. Canada 100,0 100,0
Schneider Electric Canada Inc. Canada 100,0 100,0
Schneider Electric Software Canada Inc. Canada 100,0 100,0
Schneider Electric Systems Canada Inc. Canada 100,0 100,0
Viconics Technologies Inc. Canada 100,0 100,0
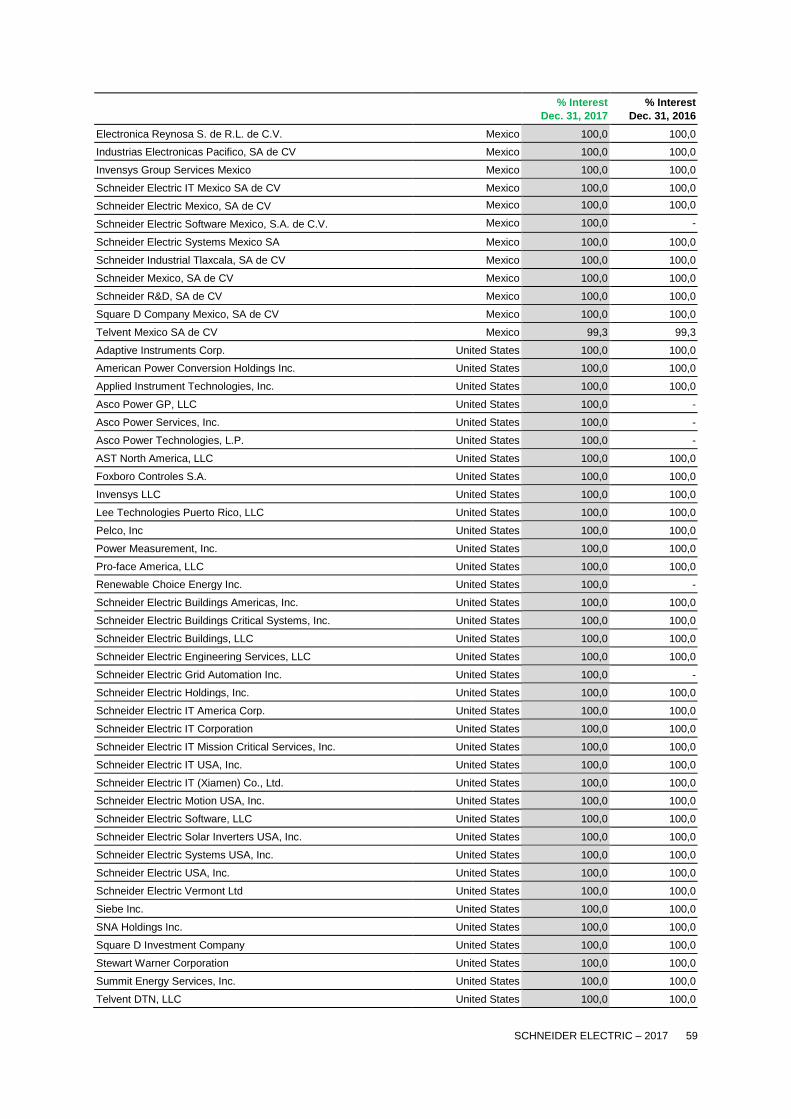
SCHNEIDER ELECTRIC – 2017 59
% Interest
Dec. 31, 2017
% Interest
Dec. 31, 2016
Electronica Reynosa S. de R.L. de C.V. Mexico 100,0 100,0
Industrias Electronicas Pacifico, SA de CV Mexico 100,0 100,0
Invensys Group Services Mexico Mexico 100,0 100,0
Schneider Electric IT Mexico SA de CV Mexico 100,0 100,0
Schneider Electric Mexico, SA de CV Mexico 100,0 100,0
Schneider Electric Software Mexico, S.A. de C.V. Mexico 100,0 -
Schneider Electric Systems Mexico SA Mexico 100,0 100,0
Schneider Industrial Tlaxcala, SA de CV Mexico 100,0 100,0
Schneider Mexico, SA de CV Mexico 100,0 100,0
Schneider R&D, SA de CV Mexico 100,0 100,0
Square D Company Mexico, SA de CV Mexico 100,0 100,0
Telvent Mexico SA de CV Mexico 99,3 99,3
Adaptive Instruments Corp. United States 100,0 100,0
American Power Conversion Holdings Inc. United States 100,0 100,0
Applied Instrument Technologies, Inc. United States 100,0 100,0
Asco Power GP, LLC United States 100,0 -
Asco Power Services, Inc. United States 100,0 -
Asco Power Technologies, L.P. United States 100,0 -
AST North America, LLC United States 100,0 100,0
Foxboro Controles S.A. United States 100,0 100,0
Invensys LLC United States 100,0 100,0
Lee Technologies Puerto Rico, LLC United States 100,0 100,0
Pelco, Inc United States 100,0 100,0
Power Measurement, Inc. United States 100,0 100,0
Pro-face America, LLC United States 100,0 100,0
Renewable Choice Energy Inc. United States 100,0 -
Schneider Electric Buildings Americas, Inc. United States 100,0 100,0
Schneider Electric Buildings Critical Systems, Inc. United States 100,0 100,0
Schneider Electric Buildings, LLC United States 100,0 100,0
Schneider Electric Engineering Services, LLC United States 100,0 100,0
Schneider Electric Grid Automation Inc. United States 100,0 -
Schneider Electric Holdings, Inc. United States 100,0 100,0
Schneider Electric IT America Corp. United States 100,0 100,0
Schneider Electric IT Corporation United States 100,0 100,0
Schneider Electric IT Mission Critical Services, Inc. United States 100,0 100,0
Schneider Electric IT USA, Inc. United States 100,0 100,0
Schneider Electric IT (Xiamen) Co., Ltd. United States 100,0 100,0
Schneider Electric Motion USA, Inc. United States 100,0 100,0
Schneider Electric Software, LLC United States 100,0 100,0
Schneider Electric Solar Inverters USA, Inc. United States 100,0 100,0
Schneider Electric Systems USA, Inc. United States 100,0 100,0
Schneider Electric USA, Inc. United States 100,0 100,0
Schneider Electric Vermont Ltd United States 100,0 100,0
Siebe Inc. United States 100,0 100,0
SNA Holdings Inc. United States 100,0 100,0
Square D Investment Company United States 100,0 100,0
Stewart Warner Corporation United States 100,0 100,0
Summit Energy Services, Inc. United States 100,0 100,0
Telvent DTN, LLC United States 100,0 100,0

SCHNEIDER ELECTRIC – 2017 60
% Interest
Dec. 31, 2017
% Interest
Dec. 31, 2016
Telvent USA, LLC United States 100,0 100,0
Veris Industries LLC United States 100,0 100,0
Asia-Pacific
FULLY CONSOLIDATED
Clipsal Australia Pty Ltd Australia 100,0 100,0
Clipsal Technologies Australia Pty Limited Australia 100,0 100,0
Nu-lec Industries Pty. Ltd Australia 100,0 100,0
Pelco Australia Pty.Limited Australia 100,0 100,0
Scadagroup Pty Ltd Australia 100,0 100,0
Schneider Electric (Australia) Pty Limited Australia 100,0 100,0
Schneider Electric Australia Holdings Pty Ltd Australia 100,0 100,0
Schneider Electric Buildings Australia Pty Ltd Australia 100,0 100,0
Schneider Electric IT Australia Pty Ltd Australia 100,0 100,0
Schneider Electric Software Australia Holdings Pty Ltd Australia 100,0 -
Schneider Electric Software Australia Pty Ltd Australia 100,0 100,0
Schneider Electric Systems Australia Pty Ltd Australia 100,0 100,0
Serck Controls Pty Limited Australia 100,0 100,0
Beijing Leader & Harvest Electric Technologies Co. Ltd China 100,0 100,0
Clipsal Manufacturing (Huizhou) Ltd China 100,0 100,0
Delixi Electric Investment (shanghai) Co., LTD China 74,5 -
FSL China China 54,0 54,0
Invensys Automation & Controls Systems (Shanghai) Co., Ltd China 100,0 100,0
Pelco (Shanghai) Trading Co. Ltd. China 100,0 100,0
Proface China International Trading (Shanghai) Co. Ltd China 100,0 100,0
RAM Electronic Technology and Control (Wuxi) Co., Ltd China 100,0 100,0
Schneider (Beijing) Medium & Low Voltage Co., Ltd China 95,0 95,0
Schneider (Beijing) Medium Voltage Co. Ltd China 95,0 95,0
Schneider (Shaanxi) Baoguang Electrical Apparatus Co. Ltd China 70,0 70,0
Schneider (Suzhou) Drives Company Ltd China 90,0 90,0
Schneider (Suzhou) Enclosure Systems Co Ltd China 100,0 100,0
Schneider (Suzhou) Transformers Co. Ltd China 100,0 100,0
Schneider Automation Solutions (Shanghai) Co., Ltd. China 100,0 100,0
Schneider Busway (Guangzhou) Ltd China 95,0 95,0
Schneider Electric (China) Co. Ltd China 100,0 100,0
Schneider Electric (Xiamen) Switchgear Co. Ltd China 100,0 100,0
Schneider Electric (Xiamen) Switchgear Equipment Co., Ltd. China 100,0 100,0
Schneider Electric Equipment an Engineering (X'ian) Co., Ltd China 100,0 100,0
Schneider Electric IT (China) Co., Ltd China 100,0 100,0
Schneider Electric Low Voltage (Tianjin) Co. Ltd China 75,0 75,0
Schneider Electric Manufacturing (Chongqing) Co. Ltd China 100,0 100,0
Schneider Electric Manufacturing (Wuhan) Co. Ltd China 100,0 100,0
Schneider Great Wall Engineering (Beijing) Co. Ltd China 100,0 100,0
Schneider Shanghai Apparatus Parts Manufacturing Co. Ltd China 100,0 100,0
Schneider Shanghai Industrial Control Co. Ltd China 80,0 80,0
Schneider Shanghai Low Voltage Term. Apparatus Co. Ltd China 75,0 75,0
Schneider Shanghai Power Distribution Electric Apparatus Co. Ltd China 80,0 80,0
Schneider Switchgear (Suzhou) Co, Ltd China 58,0 58,0
Schneider Wingoal (Tianjin) Electric Equipment Co. Ltd China 100,0 100,0
Shanghai Foxboro Co., Ltd China 100,0 100,0
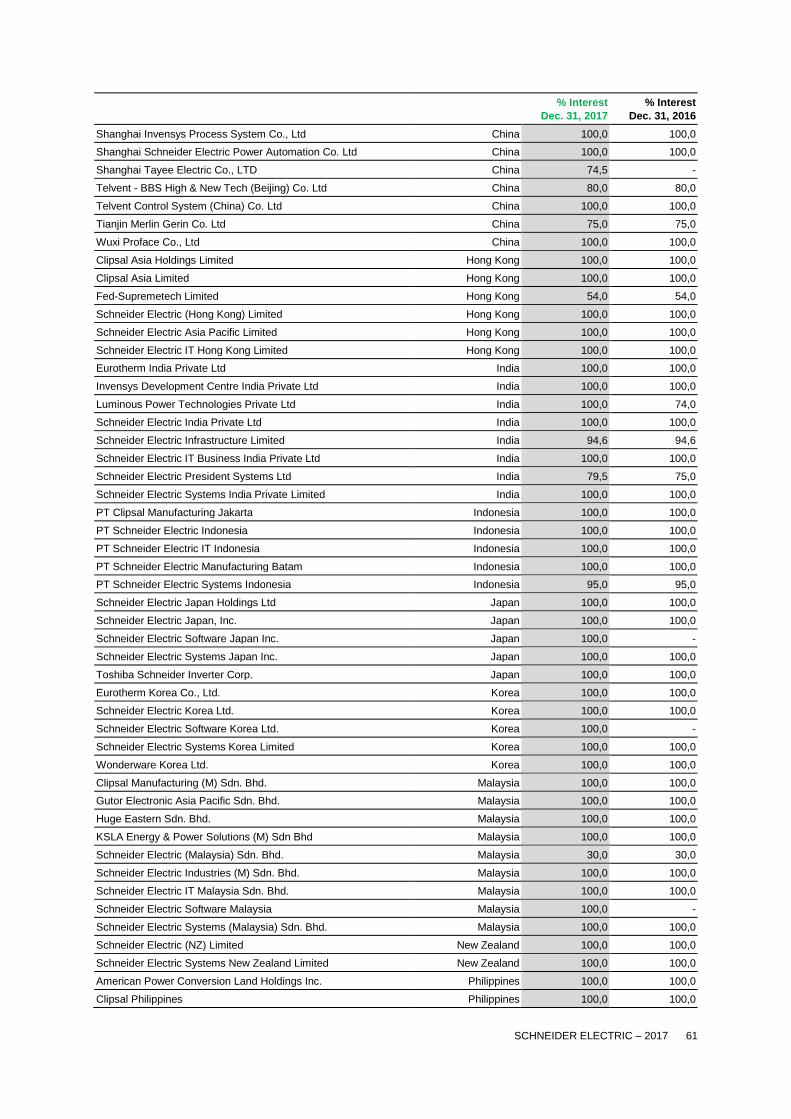
SCHNEIDER ELECTRIC – 2017 61
% Interest
Dec. 31, 2017
% Interest
Dec. 31, 2016
Shanghai Invensys Process System Co., Ltd China 100,0 100,0
Shanghai Schneider Electric Power Automation Co. Ltd China 100,0 100,0
Shanghai Tayee Electric Co., LTD China 74,5 -
Telvent - BBS High & New Tech (Beijing) Co. Ltd China 80,0 80,0
Telvent Control System (China) Co. Ltd China 100,0 100,0
Tianjin Merlin Gerin Co. Ltd China 75,0 75,0
Wuxi Proface Co., Ltd China 100,0 100,0
Clipsal Asia Holdings Limited Hong Kong 100,0 100,0
Clipsal Asia Limited Hong Kong 100,0 100,0
Fed-Supremetech Limited Hong Kong 54,0 54,0
Schneider Electric (Hong Kong) Limited Hong Kong 100,0 100,0
Schneider Electric Asia Pacific Limited Hong Kong 100,0 100,0
Schneider Electric IT Hong Kong Limited Hong Kong 100,0 100,0
Eurotherm India Private Ltd India 100,0 100,0
Invensys Development Centre India Private Ltd India 100,0 100,0
Luminous Power Technologies Private Ltd India 100,0 74,0
Schneider Electric India Private Ltd India 100,0 100,0
Schneider Electric Infrastructure Limited India 94,6 94,6
Schneider Electric IT Business India Private Ltd India 100,0 100,0
Schneider Electric President Systems Ltd India 79,5 75,0
Schneider Electric Systems India Private Limited India 100,0 100,0
PT Clipsal Manufacturing Jakarta Indonesia 100,0 100,0
PT Schneider Electric Indonesia Indonesia 100,0 100,0
PT Schneider Electric IT Indonesia Indonesia 100,0 100,0
PT Schneider Electric Manufacturing Batam Indonesia 100,0 100,0
PT Schneider Electric Systems Indonesia Indonesia 95,0 95,0
Schneider Electric Japan Holdings Ltd Japan 100,0 100,0
Schneider Electric Japan, Inc. Japan 100,0 100,0
Schneider Electric Software Japan Inc. Japan 100,0 -
Schneider Electric Systems Japan Inc. Japan 100,0 100,0
Toshiba Schneider Inverter Corp. Japan 100,0 100,0
Eurotherm Korea Co., Ltd. Korea 100,0 100,0
Schneider Electric Korea Ltd. Korea 100,0 100,0
Schneider Electric Software Korea Ltd. Korea 100,0 -
Schneider Electric Systems Korea Limited Korea 100,0 100,0
Wonderware Korea Ltd. Korea 100,0 100,0
Clipsal Manufacturing (M) Sdn. Bhd. Malaysia 100,0 100,0
Gutor Electronic Asia Pacific Sdn. Bhd. Malaysia 100,0 100,0
Huge Eastern Sdn. Bhd. Malaysia 100,0 100,0
KSLA Energy & Power Solutions (M) Sdn Bhd Malaysia 100,0 100,0
Schneider Electric (Malaysia) Sdn. Bhd. Malaysia 30,0 30,0
Schneider Electric Industries (M) Sdn. Bhd. Malaysia 100,0 100,0
Schneider Electric IT Malaysia Sdn. Bhd. Malaysia 100,0 100,0
Schneider Electric Software Malaysia Malaysia 100,0 -
Schneider Electric Systems (Malaysia) Sdn. Bhd. Malaysia 100,0 100,0
Schneider Electric (NZ) Limited New Zealand 100,0 100,0
Schneider Electric Systems New Zealand Limited New Zealand 100,0 100,0
American Power Conversion Land Holdings Inc. Philippines 100,0 100,0
Clipsal Philippines Philippines 100,0 100,0

SCHNEIDER ELECTRIC – 2017 62
% Interest
Dec. 31, 2017
% Interest
Dec. 31, 2016
Pelco Asia Pacific Pte. Ltd Philippines 100,0 100,0
Schneider Electric (Philippines) Inc. Philippines 100,0 100,0
Schneider Electric IT Philippines Inc. Philippines 100,0 100,0
Schneider Electric Asia Pte. Ltd. Singapore 100,0 100,0
Schneider Electric Export Services Pte Ltd Singapore 100,0 100,0
Schneider Electric IT Logistics Asia Pacific Pte. Ltd. Singapore 100,0 100,0
Schneider Electric IT Singapore Pte. Ltd. Singapore 100,0 100,0
Schneider Electric Overseas Asia Pte Ltd Singapore 100,0 100,0
Schneider Electric Singapore Pte. Ltd. Singapore 100,0 100,0
Schneider Electric Software Holdings Singapore Pte Ltd. Singapore 100,0 100,0
Schneider Electric South East Asia (HQ) Pte. Ltd. Singapore 100,0 100,0
Schneider Electric Systems Singapore Pte. Ltd. Singapore 100,0 100,0
Schneider Electric Lanka (Private) Limited Sri Lanka 100,0 100,0
Schneider Electric Systems Taiwan Corp. Taiwan 100,0 100,0
Schneider Electric Taiwan Co., Ltd. Taiwan 100,0 100,0
Pro-Face South-East Asia Pacific Co., Ltd. Thailand 100,0 100,0
Schneider (Thailand) Limited Thailand 100,0 100,0
Schneider Electric CPCS (Thailand) Co., Ltd. Thailand 100,0 100,0
Schneider Electric Software (Thailand) Co. LTD Thailand 100,0 -
Schneider Electric Systems (Thailand) Co. Ltd. Thailand 100,0 100,0
Clipsal Vietnam Co. Ltd VietNam 100,0 100,0
Invensys Vietnam Ltd VietNam 100,0 100,0
Schneider Electric IT Vietnam Ltd VietNam 100,0 100,0
Schneider Electric Manufacturing Vietnam Co., Ltd VietNam 100,0 100,0
Schneider Electric Vietnam Co. Ltd VietNam 100,0 100,0
ACCOUNTED FOR BY EQUITY METHOD
Delixi Electric LTD (sub-group) China 50,0 50,0
Ennovation System Control Co., LTD China 40,0 40,0
Sunten Electric Equipment Co., Ltd China 25,0 25,0
Fuji Electric FA Components & Systems Co., Ltd (sub-group) Japan 36,8 36,8
Foxboro (Malaysia) Sdn Bhd Malaysia 49,0 49,0
Rest of the World
FULLY CONSOLIDATED
Himel Algerie Algeria 100,0 100,0
Invensys Systems Algérie EURL Algeria 100,0 100,0
Schneider Electric Algerie Algeria 100,0 100,0
Schneider Electric Argentina S.A. Argentina 100,0 100,0
Schneider Electric Software Argentina S.A. Argentina 100,0 -
Schneider Electric Systems Argentina S.A. Argentina 100,0 100,0
American Power Conversion Brasil Ltda Brazil 100,0 100,0
CP Eletronica Ltda Brazil 100,0 100,0
Eurotherm LTDA Brazil 100,0 100,0
Schneider Electric Brasil Automação de Processos Ltda Brazil 100,0 100,0
Schneider Electric Brasil Ltda Brazil 100,0 100,0
Schneider Electric IT Brasil Industria e Comercio de
Equipamentos Eletronicos Ltda
Brazil 100,0 100,0
Schneider Electric Software Brasil Ltda. Brazil 100,0 100,0
Steck da Amazonia Industria Electrica Ltda Brazil 100,0 100,0
Steck Industria Electrica Ltda Brazil 100,0 100,0

SCHNEIDER ELECTRIC – 2017 63
% Interest
Dec. 31, 2017
% Interest
Dec. 31, 2016
Telseb Serviços de Engenharia e Comércio de Equipamentos
Eletrônicos e Telecomunicações Ltda
Brazil 100,0 -
Inversiones Schneider Electric Uno Limitada Chile 100,0 100,0
Marisio SA Chile 100,0 100,0
Schneider Electric Chile S.A. Chile 100,0 100,0
Schneider Electric Software Chile SpA Chile 100,0 -
Schneider Electric Systems Chile Limitada Chile 100,0 100,0
Dexson Electric S.A.S. Colombia 100,0 100,0
Schneider Electric de Colombia S.A. Colombia 100,0 80,0
Schneider Electric Software Colombia S.A.S. Colombia 100,0 -
Schneider Electric Systems Colombia Ltda Colombia 100,0 100,0
Schneider Electric Centroamerica Ltda Costa Rica 100,0 100,0
Invensys Engineering & Service S.A.E. Egypt 51,0 51,0
Invensys Process Systems Egypt Co., Ltd Egypt 60,0 60,0
Schneider Electric Distribution Company Egypt 87,4 87,4
Schneider Electric Egypt SAE Egypt 91,0 91,0
Invensys Middle East FZE Emirates 100,0 100,0
Schneider Electric DC MEA FZCO Emirates 100,0 100,0
Schneider Electric FZE Emirates 100,0 100,0
Schneider Electric Software UAE Emirates 100,0 -
C-Schneider Electric Kenya Kenya 85,0 85,0
Schneider Electric Services Kuweit Koweit 49,0 49,0
Schneider Electric East Mediterranean SAL Lebanon 96,0 96,0
Delixi Electric Maroc SARL AU Morocco 100,0 100,0
Schneider Electric Maroc Morocco 100,0 100,0
Invensys Systems Nigeria Ltd Nigeria 100,0 100,0
Schneider Electric Nigeria Ltd Nigeria 100,0 100,0
Schneider Electric Oman LLC Oman 100,0 100,0
Schneider Electric Pakistan (Private) Limited Pakistan 80,0 80,0
Schneider Electric Peru S.A. Peru 100,0 100,0
Schneider Electric Systems del Peru S.A. Peru 100,0 100,0
AMPS Saoudi Arabia 100,0 100,0
EPS Electrical Power Distribution Boards & Switchgear Ltd Saoudi Arabia 100,0 100,0
Invensys Saudi Arabia Co., Ltd Saoudi Arabia 100,0 100,0
Schneider Electric Software Saudi Arabia Saoudi Arabia 100,0 -
Schneider Electric Software South Africa Pty Ltd. South Africa 100,0 -
Schneider Electric South Africa (Pty) Ltd South Africa 74,9 74,9
Uniflair South Africa (Pty) Ltd South Africa 100,0 100,0
Gunsan Elektrik Turkey 100,0 100,0
Himel Elektric Malzemeleri Ticaret A.S Turkey 100,0 100,0
Schneider Elektrik Sanayi Ve Ticaret A.S. Turkey 100,0 100,0
Schneider Enerji Endustrisi Sanayi Ve Ticaret A.S Turkey 100,0 100,0
Schneider Electric Uganda Ltd Uganda 100,0 100,0
Schneider Electric Systems de Venezuela, C.A. Venezuela 100,0 100,0
Schneider Electric Venezuela, S.A. Venezuela 93,6 93,6
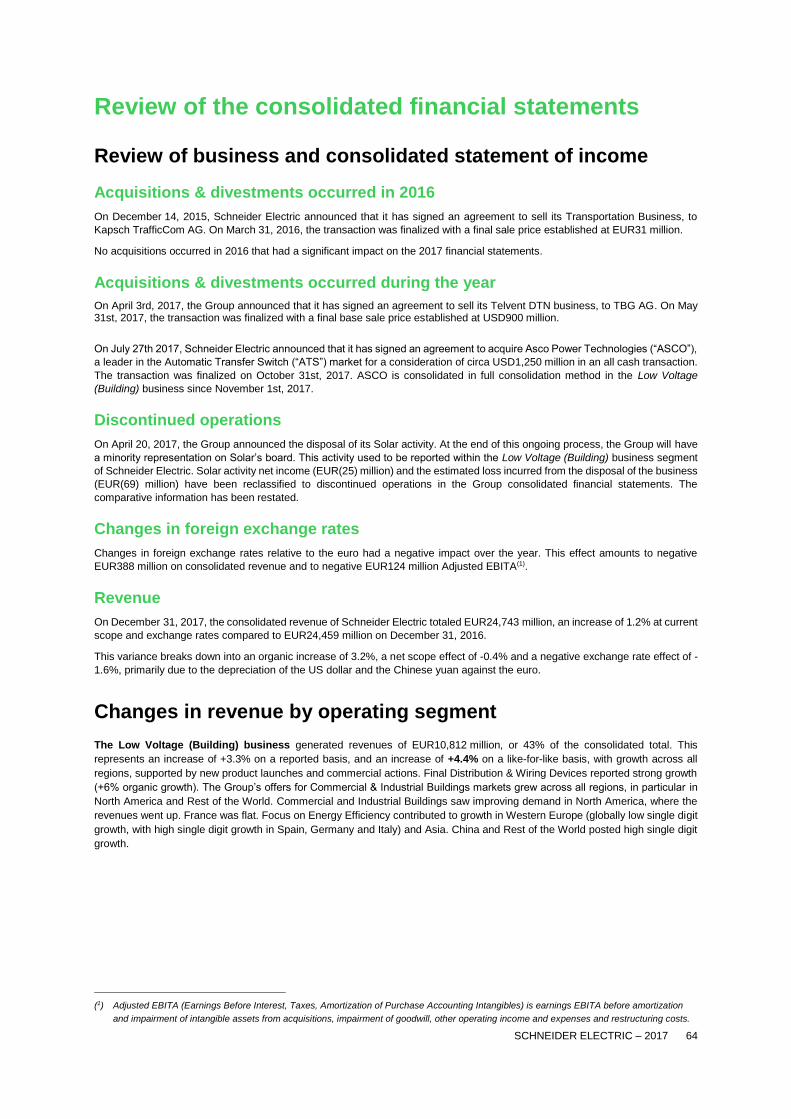
SCHNEIDER ELECTRIC – 2017 64
Review of the consolidated financial statements
Review of business and consolidated statement of income
Acquisitions & divestments occurred in 2016
On December 14, 2015, Schneider Electric announced that it has signed an agreement to sell its Transportation Business, to
Kapsch TrafficCom AG. On March 31, 2016, the transaction was finalized with a final sale price established at EUR31 million.
No acquisitions occurred in 2016 that had a significant impact on the 2017 financial statements.
Acquisitions & divestments occurred during the year
On April 3rd, 2017, the Group announced that it has signed an agreement to sell its Telvent DTN business, to TBG AG. On May 31st, 2017, the transaction was finalized with a final base sale price established at USD900 million.
On July 27th 2017, Schneider Electric announced that it has signed an agreement to acquire Asco Power Technologies (“ASCO”),
a leader in the Automatic Transfer Switch (“ATS”) market for a consideration of circa USD1,250 million in an all cash transaction.
The transaction was finalized on October 31st, 2017. ASCO is consolidated in full consolidation method in the Low Voltage
(Building) business since November 1st, 2017.
Discontinued operations
On April 20, 2017, the Group announced the disposal of its Solar activity. At the end of this ongoing process, the Group will have
a minority representation on Solar’s board. This activity used to be reported within the Low Voltage (Building) business segment
of Schneider Electric. Solar activity net income (EUR(25) million) and the estimated loss incurred from the disposal of the business
(EUR(69) million) have been reclassified to discontinued operations in the Group consolidated financial statements. The
comparative information has been restated.
Changes in foreign exchange rates
Changes in foreign exchange rates relative to the euro had a negative impact over the year. This effect amounts to negative
EUR388 million on consolidated revenue and to negative EUR124 million Adjusted EBITA(1).
Revenue
On December 31, 2017, the consolidated revenue of Schneider Electric totaled EUR24,743 million, an increase of 1.2% at current
scope and exchange rates compared to EUR24,459 million on December 31, 2016.
This variance breaks down into an organic increase of 3.2%, a net scope effect of -0.4% and a negative exchange rate effect of -
1.6%, primarily due to the depreciation of the US dollar and the Chinese yuan against the euro.
Changes in revenue by operating segment
The Low Voltage (Building) business generated revenues of EUR10,812 million, or 43% of the consolidated total. This
represents an increase of +3.3% on a reported basis, and an increase of +4.4% on a like-for-like basis, with growth across all
regions, supported by new product launches and commercial actions. Final Distribution & Wiring Devices reported strong growth
(+6% organic growth). The Group’s offers for Commercial & Industrial Buildings markets grew across all regions, in particular in
North America and Rest of the World. Commercial and Industrial Buildings saw improving demand in North America, where the
revenues went up. France was flat. Focus on Energy Efficiency contributed to growth in Western Europe (globally low single digit
growth, with high single digit growth in Spain, Germany and Italy) and Asia. China and Rest of the World posted high single digit
growth.
(1) Adjusted EBITA (Earnings Before Interest, Taxes, Amortization of Purchase Accounting Intangibles) is earnings EBITA before amortization
and impairment of intangible assets from acquisitions, impairment of goodwill, other operating income and expenses and restructuring costs.
SCHNEIDER ELECTRIC – 2017 65
The Industrial Automation (Industry) business generated revenues of EUR5,816 million, or 24% of the consolidated total. This
represents an increase of +6.0% on a reported basis and an increase of +5.9% on a like-for-like basis. Industrial Automation
reported growth in all the regions, with a strong performance in products and OEM, driven by channel initiatives. Process
Automation grew low single digit as O&G stabilized. Western Europe grew across the region as OEM demand remain favorable.
In Germany, Industrial automation posted strong growth thanks to product sales through partners and good project execution.
France grew slightly. In Asia-Pacific, Industrial Automation was up due to continued strength in industrial demand from machine
manufacturers and end-users and growth in targeted segments. China performed strongly on continued growth in OEM demand
and good performance on targeted segments such as transportation. India was up. North America posted mid-single digit growth
in Industrial Automation. Industrial Automation benefitted from its strategy to develop its OEM offers and targeted end-users
segments in favorable markets. The U.S. and Canada were up while Mexico declined. Rest of the World was up with mid-single
digit growth.
The Medium Voltage (Infrastructure) business generated revenues of EUR4,500 million, or 18% of the consolidated total. This
represents a decrease of -8.5% on a reported basis, mainly due to the disposal of DTN, and a decrease of -2.2% on a like-for-like
basis. North America decreased, while China grew high single digit. Services revenues were stable but orders up mid-single digit.
Excluding the impact of selectivity initiatives, the business was slightly up for the year. Western Europe was flat, with growth in
France, Spain and Central Europe, but declined low single digit in Germany.
The Secure Power (IT) business generated revenues of EUR3,615 million, or 15% of the consolidated total. This represents an
increase of +0.7% in a reported basis and an increase of +2.1% on a like-for-like basis. New Economies reported strong growth
up to 7%, while Mature declined slightly. Services went up mid-single digit.
Gross profit
Gross profit increased from EUR9,358 million for the year ended December 31, 2016 to EUR9,498 million for the year ended
December 31, 2017, or +1.5%, mainly due to an increase in productivity and actions on prices. As a percentage of revenues, the
gross margin remained stable at 38.4% in 2017 (versus 38.3% in 2016).
Support Function Costs: research and development and selling, general and administrative expenses
Research and development expenses, excluding capitalized development costs and development costs reported as cost of sales,
decreased by 4.9% from EUR527 million for the year ended December 31, 2016 to EUR501 million for the year ended
December 31, 2017. As a percentage of revenues, the net cost of research and development decreased at 2.0% of revenues for
the year ended December 31, 2017 (2.2% for the year ended December 31, 2016).
Total research and development expenses, including capitalized development costs and development costs reported as cost of
sales (see note 4 to the Consolidated Financial Statements) decreased by 2.2% from EUR1,209 million for the year ended
December 31, 2016 to EUR1,183 million for the year ended December 31, 2017. As a percentage of revenues, total research and
development expenses remained stable at 4.8% for the year ended December 31, 2017 (4.9% for the year ended December 31,
2016).
In 2017, the net effect of capitalized development costs and amortization of capitalized development costs amounted to
EUR62 million on operating income versus EUR97 million in 2016.
Selling, general and administrative expenses increased by 0.2% from EUR5,333 million for the year ended December 31, 2016
to EUR5,346 million for the year ended December 31, 2017. As a percentage of revenues, selling, general and administrative
expenses decreased from 21.8% in 2016 to 21.6% in 2017.
Combined total support function costs, that is, research and development expenses together with selling, general and
administrative costs, totaled EUR5,847 million for the year ended December 31, 2017 compared to EUR5,860 million for the year
ended December 31, 2016, a decrease of 0.2%. The support function costs to sales ratio decreased from 24.0% for the year
ended December 31, 2016 to 23.6% for the year ended December 31, 2017.
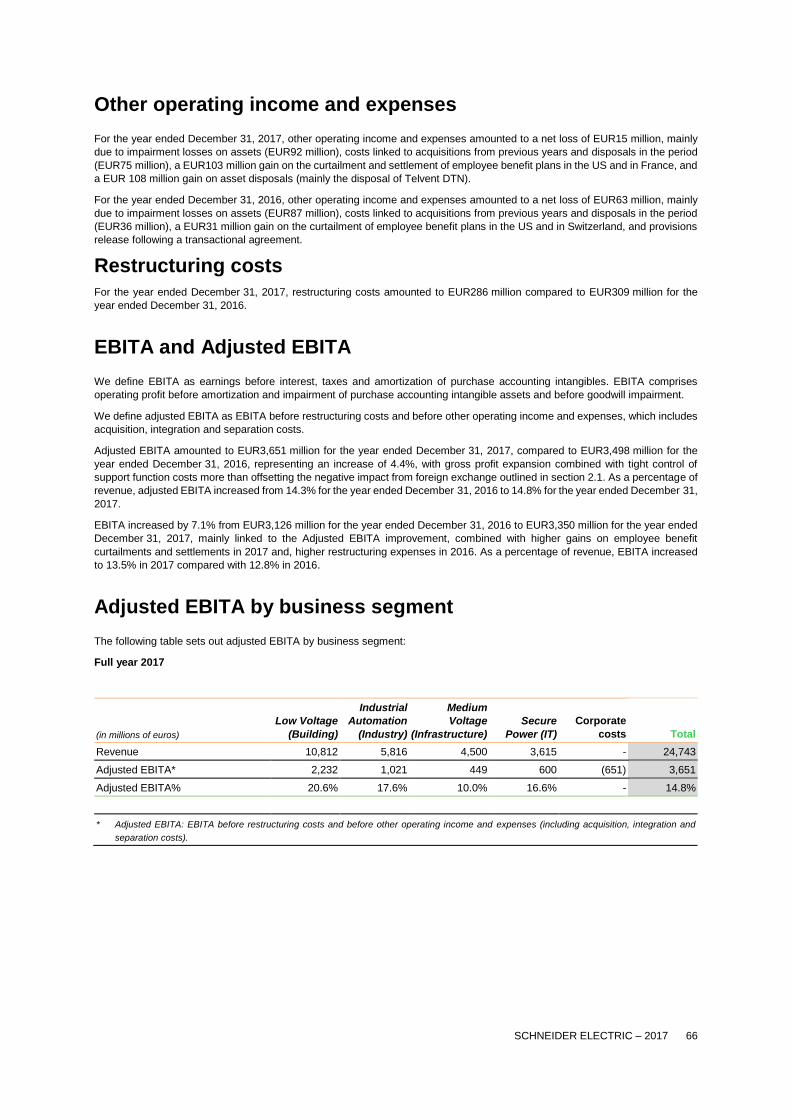
SCHNEIDER ELECTRIC – 2017 66
Other operating income and expenses
For the year ended December 31, 2017, other operating income and expenses amounted to a net loss of EUR15 million, mainly
due to impairment losses on assets (EUR92 million), costs linked to acquisitions from previous years and disposals in the period
(EUR75 million), a EUR103 million gain on the curtailment and settlement of employee benefit plans in the US and in France, and
a EUR 108 million gain on asset disposals (mainly the disposal of Telvent DTN).
For the year ended December 31, 2016, other operating income and expenses amounted to a net loss of EUR63 million, mainly
due to impairment losses on assets (EUR87 million), costs linked to acquisitions from previous years and disposals in the period
(EUR36 million), a EUR31 million gain on the curtailment of employee benefit plans in the US and in Switzerland, and provisions
release following a transactional agreement.
Restructuring costs
For the year ended December 31, 2017, restructuring costs amounted to EUR286 million compared to EUR309 million for the
year ended December 31, 2016.
EBITA and Adjusted EBITA
We define EBITA as earnings before interest, taxes and amortization of purchase accounting intangibles. EBITA comprises
operating profit before amortization and impairment of purchase accounting intangible assets and before goodwill impairment.
We define adjusted EBITA as EBITA before restructuring costs and before other operating income and expenses, which includes
acquisition, integration and separation costs.
Adjusted EBITA amounted to EUR3,651 million for the year ended December 31, 2017, compared to EUR3,498 million for the
year ended December 31, 2016, representing an increase of 4.4%, with gross profit expansion combined with tight control of
support function costs more than offsetting the negative impact from foreign exchange outlined in section 2.1. As a percentage of
revenue, adjusted EBITA increased from 14.3% for the year ended December 31, 2016 to 14.8% for the year ended December 31,
2017.
EBITA increased by 7.1% from EUR3,126 million for the year ended December 31, 2016 to EUR3,350 million for the year ended
December 31, 2017, mainly linked to the Adjusted EBITA improvement, combined with higher gains on employee benefit
curtailments and settlements in 2017 and, higher restructuring expenses in 2016. As a percentage of revenue, EBITA increased
to 13.5% in 2017 compared with 12.8% in 2016.
Adjusted EBITA by business segment
The following table sets out adjusted EBITA by business segment:
Full year 2017
(in millions of euros)
Low Voltage
(Building)
Industrial
Automation
(Industry)
Medium
Voltage
(Infrastructure)
Secure
Power (IT)
Corporate
costs Total
Revenue 10,812 5,816 4,500 3,615 - 24,743
Adjusted EBITA* 2,232 1,021 449 600 (651) 3,651
Adjusted EBITA% 20.6% 17.6% 10.0% 16.6% - 14.8%
* Adjusted EBITA: EBITA before restructuring costs and before other operating income and expenses (including acquisition, integration and
separation costs).

SCHNEIDER ELECTRIC – 2017 67
Full year 2016*
(in millions of euros)
Low Voltage
(Buildings)
Industrial
Automation
(Industry)
Medium
Voltage
(Infrastructure)
Secure
Power
(IT)
Corporate
costs Total
Revenue 10,466 5,485 4,919 3,589 - 24,459
Adjusted EBITA* 2,117 918 477 604 (618) 3,498
Adjusted EBITA% 20.2% 16.7% 9.7% 16.8% - 14.3%
* 2016 figures were restated for discontinued operations, as noted in section 2.1.
** Adjusted EBITA: EBITA before restructuring costs and before other operating income and expenses (including acquisition, integration and
separation costs).
Low Voltage (Building) business recorded an adjusted EBITA margin of 20.6% for the year ended December 31, 2017, up 0.4
pts compared to 20.2% for the year ended December 31, 2016, thanks to sales organic growth.
Industrial Automation (Industry) business recorded an adjusted EBITA margin of 17.6% for the year ended December 31,
2017, up 0.9 pts compared to 16.7% for the year ended December 31, 2016, benefiting from improved volumes.
Medium Voltage (Infrastructure) business recorded an adjusted EBITA margin of 10.0% for the year ended December 31,
2017, up 0.3 pts compared to 9.7% for the year ended December 31, 2016, thanks to higher system gross margin and strong cost
control.
Secure Power (IT) business reported an adjusted EBITA margin of 16.6% for the year ended December 31, 2017, down 0.2 pts
compared with 16.8% margin for the year ended December 31, 2016, resilient at high level.
Corporate costs amounted to EUR651 million for the year ended December 31, 2017 or 2.6% of Group revenues, a slight increase
compared to the year ended December 31, 2016 (2.5% of Group revenues or EUR618 million).
Operating income (EBIT)
Operating income (EBIT) increased from EUR2,975 million for the year ended December 31, 2016 to EUR3,210 million for the
year ended December 31, 2017. This 7.9% increase is explained mainly by the EBITA improvement.
Net financial income/loss
Net financial loss amounted to EUR367 million for the year ended December 31, 2017, compared to EUR462 million for the year
ended December 31, 2016. The decrease in the net financial loss is mainly explained by the losses generated by the foreign
exchange decreasing by EUR35 million, supplemented by a decrease in the cost of net financial debt from EUR272 million for
year ended December 31, 2016 to EUR219 million for the year ended December 31, 2017.
Tax
The effective tax rate was 21.1% for the year ended December 31, 2017, a decrease compared to 28.6% for the year ended
December 31, 2016. The corresponding tax expense decreased from EUR719 million for the year ended December 31, 2016 to
EUR600 million for the year ended December 31, 2017.
In 2017, the tax reforms in the USA and in Belgium, as well as the additional reform in France, led together to a positive
adjustment in the P&L for EUR12 million. This adjustment represents the Group’s best estimate of the impact of those reforms.
In 2016, the planned reduction of the Corporate Income Tax rate in France from 34.43% to 28.92% following the passing of the
Finance Bill 2017 (“Loi de finances 2017”) leads to a negative adjustment of the P&L at the end of 2016 for EUR(119) million.
Share of profit/(losses) of associates
The share of profit of associates increased from EUR34 million for the year ended December 31, 2016 to EUR61 million for the
year ended December 31, 2017 mainly due to an increase in net income attributable to Delixi.

SCHNEIDER ELECTRIC – 2017 68
Non-controlling interests
Non-controlling interests in net income for the year ended December 31, 2017 totaled EUR60 million, compared to EUR61 million
for the year ended December 31, 2016. This represented the share in net income attributable, in large part, to the non-controlling
interests of certain Chinese companies.
Profit for the period
Profit for the period attributable to the equity holders of the parent company amounted to EUR2,150 million for the year ended
December 31, 2017, that is, a 22.9% increase over the EUR1,750 million profit for the year ended December 31, 2016, mainly
due to the improvement in EBITA described in note 2.9.
Earnings per share
Earnings per share increased from EUR3.12 for the year ended December 31, 2016 to EUR3.85 for the year ended December 31,
2017.
Consolidated cash-flow
Operating Activities
Net cash provided by operating activities before changes in operating assets and liabilities amounted to EUR3,020 million for the
year ended December 31, 2017, up 2.2% compared to EUR2,956 million for the year ended December 31, 2016, and represented
12.2% of revenue in 2017 compared with 12.1% in 2016.
The change in working capital used EUR79 million in cash in the year ended December 31, 2017, compared to EUR1 million
generated in the year ended December 31, 2016.
In all, net cash provided by operating activities decreased by 0.5% from EUR2,957 million in the year ended December 31, 2016
to EUR2,941 million in the year ended December 31, 2017.
Investing Activities
Net capital expenditure, which included capitalized development projects, decreased by 7.2% to EUR688 million for the year
ended December 31, 2017, compared to EUR741 million for the year ended December 31, 2016, and represented 2.8% of
revenues in 2017 (3.0% in 2016).
Free cash-flow (cash provided by operating activities net of net capital expenditure) amounted to EUR2,253 million in 2017 versus
EUR2,216 million in 2016.
Cash conversion rate (free cash-flow over net income attributable to the equity holders of the parent company on continuing
operations) was 105% in 2017 versus 118% in 2016 (adjusted for the impact of tax adjustments described in note 2.11).
The effect of acquisitions and divestments during the year was a net cash outflow amounting to EUR416 million in 2017. Our
acquisitions and divestments represented a net cash inflow of EUR47 million for the year ended December 31, 2016,
corresponding mainly to the disposals described in note 2.1.
Financing Activities
In 2017, the Group reimbursed bonds for EUR1,025 million and issued a bond in euros for EUR740 million.
The net increase in other financial debts amounted to EUR111 million during the year ended December 31, 2017, compared to a
net decrease in other financial debts amounting to EUR794 million during the year ended December 31, 2016. The dividend paid
by Schneider Electric was EUR1,133 million in the year ended December 31, 2017, compared with EUR1,127 million in the year
ended December 31, 2016.
The Group purchased minority interests for EUR 141 million in 2017.

SCHNEIDER ELECTRIC – 2017 69
Review of the parent company financial statements
Schneider Electric SE posted an operating loss of EUR14 million in 2017 compared with EUR16 million the previous year.
Interest expense net of interest income amounted to EUR106 million versus EUR128 million the previous year.
Current loss amounted to EUR28 million in 2017 compared to a current loss of EUR162 million in 2016.
The net loss stood at EUR121 million in 2017 compared with a net loss of EUR100 million in 2016.
Equity before appropriation of net profit amounted to EUR7,893 million at December 31, 2017 versus EUR8,745 million at the
previous year-end, after taking into account 2017 loss, dividend payments of EUR1,133 million and share issues in an amount of
EUR155 million.
Review of subsidiaries
Schneider Electric Industries SAS
Revenue totalled EUR3.5 billion in 2017 (EUR3.2 billion in 2016).
The subsidiary posted an operating gain of EUR94 million in 2017 compared with an operating gain of EUR115 million in 2016.
Net profit amounted to EUR1.2 billion in 2017 compared with EUR264 million of net profit in 2016.
Outlook
In a positive environment, the Group targets to deliver strong organic growth of adjusted EBITA in 2018, around the high-end of
the +4% to +7% bracket earlier communicated as the average yearly objective for 2017-2019.
To deliver this strong performance the Group will balance both levers of organic top line growth and adj. EBITA margin expansion.
Therefore, for 2018, the Group will target:
An organic top line growth between +3% to +5%; and
An organic adj. EBITA margin expansion towards the upper end of the +20bps to +50bps range targeted as yearly average improvement for 2017-2019.