Embed Size (px)
Citation preview

Consolidated Fire Incident in Metro Manila
By: FO1 Maylyn France N Bautista

Introduction
• Fire can be made by human or nature. It is created through the process of combustion which happens when fuel (that is heated to its ignition temperature) is touched by oxygen in the atmosphere.
• Fire is very useful to human, but it can be very destructive also. • Fire destruction is commonly happening during summer season,
due to higher ambient temperature, and some festive events, due to availability of fire crackers.

Introduction (Top 3 worst Fire Incidents in NCR)
• In the history of fire incidents in the Philippines, the three worst are: The Kentex Manufacturing Fire in Valenzuela, on May 13, 2015, killed 74 people and is declared as the 3rd.

KENTEX FIRE

Introduction (Top 3 worst Fire Incidents in NCR)
• Manor Hotel Fire in Quezon City, on August 18, 2001, killed 75 guests and is declared 2nd.

Manor Hotel Fire

Introduction (Top 3 worst Fire Incidents in NCR)
• Ozone Disco Fire in Quezon City, on March 18, 1996, claimed 162 lives and is declared not only the 1st in the Philippines but also 7th in the world.
Ozone Disco Fire

Fire Statistics
• March is fire prevention month where the government is taking initiatives to inform the public of the real dangers from possible fire incidents looming every summer season. With information dissemination campaigns, public fire drills and talks, raising public awareness on the issue of fire prevention is a good way to keep everyone vigilant.

Fire Statistics
For this year, the Bureau of Fire Protection or BFP started promoting fire safety among school children and is now conducting house-to-house campaign to teach household members how to use a fire extinguisher and shares safety tips information. The Fire Prevention Month is a yearly activity observed for over 5 decades now under the Presidential Proclamation 115-A which was declared by Pres. Marcos.

Fire Statistics Nationwide
• The number of fire incidents last 2017 reached a record high of 14,197 fire incidents in the Philippines. With about 12.3 % of these fire incidents took placed in the month of March according to Bureau of Fire Protection.
2016 2017 %
Fire Incidents
19,292 14,197 -26.41
Structural 8,884 7,886 -11.23
Non-Structural
9,387 5,313 -43.40
Vehicular 1,021 998 -2.25
Damages Php3,079,545,138.0
4 Php7,861,505,751.0
4 155.28
Civ Dead 285 304 6.67
Civ Injured 894 835 -6.60
BFP Dead 0 0 0.00
BFP Injured 93 54 -41.94

Fire Statistics Nationwide
Top 3 Causes 2016 2017
1 Electrical Connections Electrical Connections
2 Lighted Cigarette Butt Lighted Cigarette Butt
3 Open Flame Due to
Torch or Sulo Open Flame Due to
Unattended Cooking / Stove
Top 3 Occupancy 2016 2017 %
1 Residential 6305 Residential 5541 -12.12
2 Mercantile 591 Mercantile 612 3.55
3 Industrial 394 Storage 323 -x-x-
Fire Statistics NCR
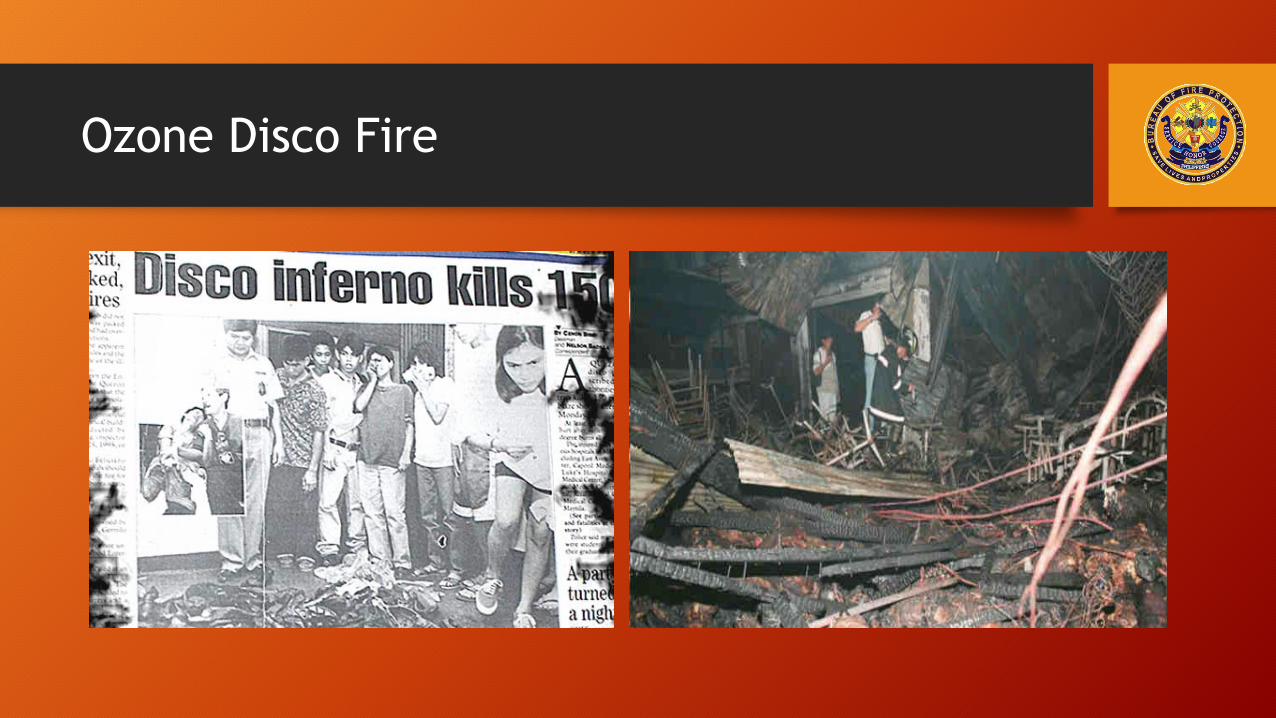
Top 3 Causes 2016 2017
1 Electrical
Connections Electrical
Connections
2 Lighted Cigarette
Butt Lighted Cigarette
Butt
3 Open Flame Due to
Torch or Sulo Open Flame Due to
Torch or Sulo
Top 3 Occupancy 2016 2017 %
1 Residential 1,456 Residential 1,319 -9.41
2 Mercantile 143 Mercantile 171 19.58
3 Business 62 Industrial 42 -x-x-

Fire Statistics NCR
• Based on our Consolidated Report, National Capital Region has the most number of fire incidents in the Philippines.
• Last years’ Fire Incidents in NCR reached a total number of 4,645 with 219 Civilian Injured and 105 Civilian Fatalities.
2016 2017 %
Fire Incidents
5,121 4,645 -9.30
Structural 1,978 1,813 -8.34
Non-Structural
2,856 2,603 -8.86
Vehicular 287 229 -20.21
Damages Php601,125,171.44 Php462,146,600.00 -23.12
Civ Dead 67 105 56.72
Civ Injured 305 219 -28.20
BFP Dead 0 0 0.00
BFP Injured 41 17 -58.54
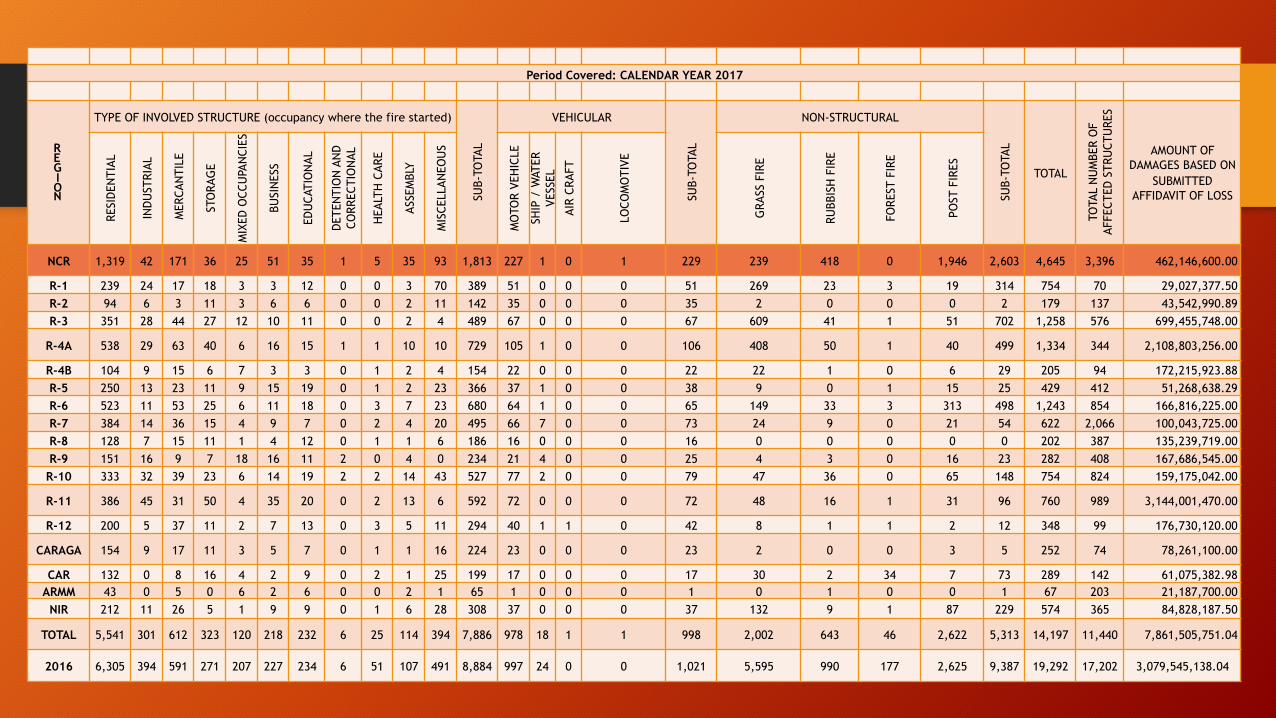
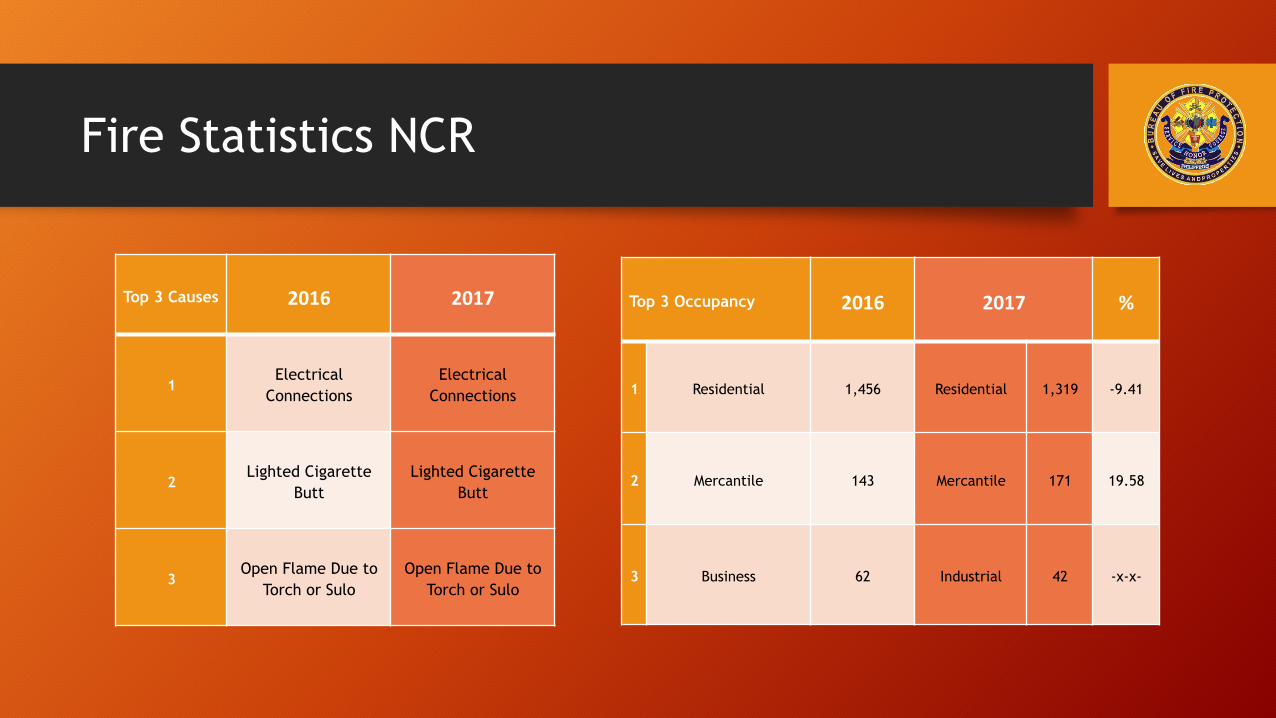
Period Covered: CALENDAR YEAR 2017
REGION
TYPE OF INVOLVED STRUCTURE (occupancy where the fire started)
SUB-
TOTA
L
VEHICULAR
SUB-
TOTA
L
NON-STRUCTURAL
SUB-
TOTA
L
TOTAL
TOTA
L N
UM
BER
OF
AFFE
CTED
STR
UCT
URE
S
AMOUNT OF DAMAGES BASED ON
SUBMITTED AFFIDAVIT OF LOSS
RESI
DEN
TIAL
IND
UST
RIAL
MER
CAN
TILE
STO
RAG
E
MIX
ED O
CCU
PAN
CIES
BUSI
NES
S
EDU
CATI
ON
AL
DET
ENTI
ON
AN
D
CORR
ECTI
ON
AL
HEA
LTH
CAR
E
ASSE
MBL
Y
MIS
CELL
ANEO
US
MO
TOR
VEH
ICLE
SHIP
/ W
ATER
VE
SSEL
AIR
CRAF
T
LOCO
MO
TIVE
GRA
SS F
IRE
RUBB
ISH
FIR
E
FORE
ST F
IRE
POST
FIR
ES
NCR 1,319 42 171 36 25 51 35 1 5 35 93 1,813 227 1 0 1 229 239 418 0 1,946 2,603 4,645 3,396 462,146,600.00
R-1 239 24 17 18 3 3 12 0 0 3 70 389 51 0 0 0 51 269 23 3 19 314 754 70 29,027,377.50 R-2 94 6 3 11 3 6 6 0 0 2 11 142 35 0 0 0 35 2 0 0 0 2 179 137 43,542,990.89 R-3 351 28 44 27 12 10 11 0 0 2 4 489 67 0 0 0 67 609 41 1 51 702 1,258 576 699,455,748.00
R-4A 538 29 63 40 6 16 15 1 1 10 10 729 105 1 0 0 106 408 50 1 40 499 1,334 344 2,108,803,256.00
R-4B 104 9 15 6 7 3 3 0 1 2 4 154 22 0 0 0 22 22 1 0 6 29 205 94 172,215,923.88 R-5 250 13 23 11 9 15 19 0 1 2 23 366 37 1 0 0 38 9 0 1 15 25 429 412 51,268,638.29 R-6 523 11 53 25 6 11 18 0 3 7 23 680 64 1 0 0 65 149 33 3 313 498 1,243 854 166,816,225.00 R-7 384 14 36 15 4 9 7 0 2 4 20 495 66 7 0 0 73 24 9 0 21 54 622 2,066 100,043,725.00 R-8 128 7 15 11 1 4 12 0 1 1 6 186 16 0 0 0 16 0 0 0 0 0 202 387 135,239,719.00 R-9 151 16 9 7 18 16 11 2 0 4 0 234 21 4 0 0 25 4 3 0 16 23 282 408 167,686,545.00 R-10 333 32 39 23 6 14 19 2 2 14 43 527 77 2 0 0 79 47 36 0 65 148 754 824 159,175,042.00
R-11 386 45 31 50 4 35 20 0 2 13 6 592 72 0 0 0 72 48 16 1 31 96 760 989 3,144,001,470.00
R-12 200 5 37 11 2 7 13 0 3 5 11 294 40 1 1 0 42 8 1 1 2 12 348 99 176,730,120.00
CARAGA 154 9 17 11 3 5 7 0 1 1 16 224 23 0 0 0 23 2 0 0 3 5 252 74 78,261,100.00
CAR 132 0 8 16 4 2 9 0 2 1 25 199 17 0 0 0 17 30 2 34 7 73 289 142 61,075,382.98 ARMM 43 0 5 0 6 2 6 0 0 2 1 65 1 0 0 0 1 0 1 0 0 1 67 203 21,187,700.00 NIR 212 11 26 5 1 9 9 0 1 6 28 308 37 0 0 0 37 132 9 1 87 229 574 365 84,828,187.50
TOTAL 5,541 301 612 323 120 218 232 6 25 114 394 7,886 978 18 1 1 998 2,002 643 46 2,622 5,313 14,197 11,440 7,861,505,751.04
2016 6,305 394 591 271 207 227 234 6 51 107 491 8,884 997 24 0 0 1,021 5,595 990 177 2,625 9,387 19,292 17,202 3,079,545,138.04

REGION
CAUSES OF FIRE INCIDENTS
T O T A L
ELEC
TRIC
AL
CON
NEC
TIO
NS
ELEC
TRIC
AL A
PPLI
ANCE
S
ELEC
TRIC
AL M
ACH
INER
IES
SPO
NTA
NEO
US
COM
BUST
ION
OPE
N F
LAM
E D
UE
TO
UN
ATTE
ND
ED C
OO
KIN
G /
ST
OVE
OPE
N F
LAM
E D
UE
TO
TORC
H O
R SU
LO
OPE
N F
LAM
E D
UE
TO
UN
ATTE
ND
ED L
IGH
TED
CA
ND
LE O
R G
ASER
A
OPE
N F
LAM
E D
UE
TO
DIR
ECT
FLAM
E CO
NTA
CT
OR
STAT
IC E
LECT
RICI
TY
LPG
EXP
LOSI
ON
DU
E TO
D
IREC
T FL
AME
CON
TACT
O
R ST
ATIC
ELE
CTRI
CITY
LIG
HTE
D C
IGAR
ETTE
BU
TT
CHEM
ICAL
S
PYRO
TECH
NIC
S
LIG
HTE
D M
ATCH
STIC
K O
R LI
GH
TER
INCE
ND
IARY
DEV
ICE
/ M
ECH
ANIS
M O
R IG
NIT
ED
FLAM
MAB
LE L
IQU
IDS
LIG
HTN
ING
BOM
B EX
PLO
SIO
N
UN
DER
INVE
STIG
ATIO
N
OTH
ERS
NCR 2,656 129 9 33 166 101 107 4 27 500 131 12 64 13 1 0 554 138 4,645 R-1 107 17 3 25 27 3 19 0 8 30 1 0 23 2 1 0 175 313 754 R-2 40 22 1 3 12 0 13 0 1 8 2 0 4 5 1 0 50 17 179 R-3 215 39 2 16 34 6 32 0 7 178 1 0 14 19 1 0 194 500 1,258 R-4A 250 43 7 97 35 229 55 25 20 38 0 2 21 11 0 0 324 177 1,334 R-4B 7 0 0 0 1 1 1 0 0 1 0 0 2 0 0 0 190 2 205 R-5 109 22 3 6 64 5 32 0 10 6 0 4 9 2 0 0 124 33 429 R-6 444 25 10 1 78 7 31 0 6 59 0 2 22 1 1 0 435 121 1,243 R-7 236 25 0 9 44 1 38 5 6 49 2 1 69 12 0 0 96 29 622 R-8 14 9 3 0 18 3 12 0 1 1 0 0 2 3 0 0 135 1 202 R-9 94 9 1 3 33 6 18 0 2 10 0 0 8 6 0 0 74 18 282 R-10 209 11 4 9 58 14 33 0 4 19 0 0 13 11 0 0 184 185 754 R-11 220 37 34 13 51 41 36 9 11 44 0 0 32 31 1 1 92 107 760 R-12 10 2 1 2 1 0 5 0 2 1 0 1 9 7 0 0 307 0 348
CARAGA 43 6 1 0 29 3 5 0 4 3 0 1 3 0 0 0 136 18 252 CAR 38 5 3 0 24 2 10 0 8 14 0 0 13 4 1 0 106 61 289
ARMM 9 1 0 0 1 2 2 0 1 0 0 0 1 1 0 0 48 1 67 NIR 171 10 0 11 35 3 14 2 6 41 0 2 11 11 0 0 177 80 574
TOTAL 4,872 412 82 228 711 427 463 45 124 1,002 137 25 320 139 7 1 3,401 1,801 14,197 2016 4,947 461 66 603 838 1,119 648 32 130 1,571 135 30 581 138 14 3 4,102 3,874 19,292

CONSOLIDATED CLASSIFICATION OF FIRE CASES and NUMBER OF CASUALTIES NATIONWIDE Period Covered: CALENDAR YEAR 2017
REGION
CLASSIFICATION OF FIRE CASE
ARSO
N C
ASES
FIL
ED IN
CO
URT
TOTAL NUMBER OF CASUALTIES
INTE
NTI
ON
AL F
IRE
ACCI
DEN
TAL
FIRE
UN
DET
ERM
INED
FIRE
CAS
ES U
ND
ER
INVE
STIG
ATIO
N
TOTAL
FATALITIES
TOTAL
INJURED
TOTAL
FIRE
FIG
HTE
R
CIVI
LIAN
FIR
EFIG
HTE
R
CIVI
LIAN
NCR 20 4,070 0 555 4,645 14 0 105 105 17 219 236 R-1 6 561 1 186 754 1 0 6 6 1 4 5 R-2 10 125 1 43 179 1 0 3 3 0 13 13 R-3 19 1,027 18 194 1,258 0 0 15 15 4 68 72
R-4A 13 988 26 307 1,334 0 0 20 20 0 185 185 R-4B 1 3 0 201 205 0 0 8 8 0 9 9 R-5 16 296 2 115 429 0 0 3 3 0 3 3 R-6 8 796 3 436 1,243 5 0 4 4 14 78 92 R-7 11 514 2 95 622 1 0 15 15 3 49 52 R-8 3 64 0 135 202 1 0 4 4 1 1 2 R-9 9 199 0 74 282 0 0 11 11 3 20 23 R-10 18 536 7 193 754 0 0 13 13 2 46 48 R-11 36 679 5 40 760 1 0 62 62 4 61 65 R-12 16 26 0 306 348 0 0 13 13 0 20 20
CARAGA 2 118 0 132 252 0 0 3 3 0 6 6 CAR 4 177 4 104 289 0 0 5 5 1 19 20
ARMM 0 13 0 54 67 0 0 8 8 1 5 6 NIR 10 384 0 180 574 0 1 6 7 3 29 32
TOTAL 202 10,576 69 3,350 14,197 24 1 304 305 54 835 889 2016 271 14,725 116 4180 19,292 59 0 285 285 93 894 987

Fire Statistics Nationwide
• As of the moment, there were already 3,632 fire incidents in the Philippines as of 01 January- 26 March 2018 with 1053 fires in the National Capital Region.
Jan 01 to 26 Mar
2017 Jan 01 to 26 Mar
2018 %
Fire Incidents
3,869 3,632 -6.12
Structural 2,079 1,936 -6.88
Non-Structural
1,551 1,469 -5.27
Vehicular 239 227 -4.97
Damages Php15,588,639,199.46 Php1,714,765,335.12 -89.00
Civ Dead 77 68 -11.61
Civ Injured 262 177 -32.37
BFP Dead 1 0 -100.00
BFP Injured 76 15 -80.35

Fire Statistics NCR
Jan 01 to 26 Mar 2017 Jan 01 to 26 Mar 2018 %
Fire Incidents 1,140 1,053 -7.60
Structural 529 460 -12.97
Non-Structural 554 530 -4.38
Vehicular 57 63 10.97
Damages Php146,955,611.29 Php241,488,210.00 64.33
Civ Dead 29 14 -51.72
Civ Injured 79 80 1.14
BFP Dead 0 0 0.00
BFP Injured 8 5 -36.21
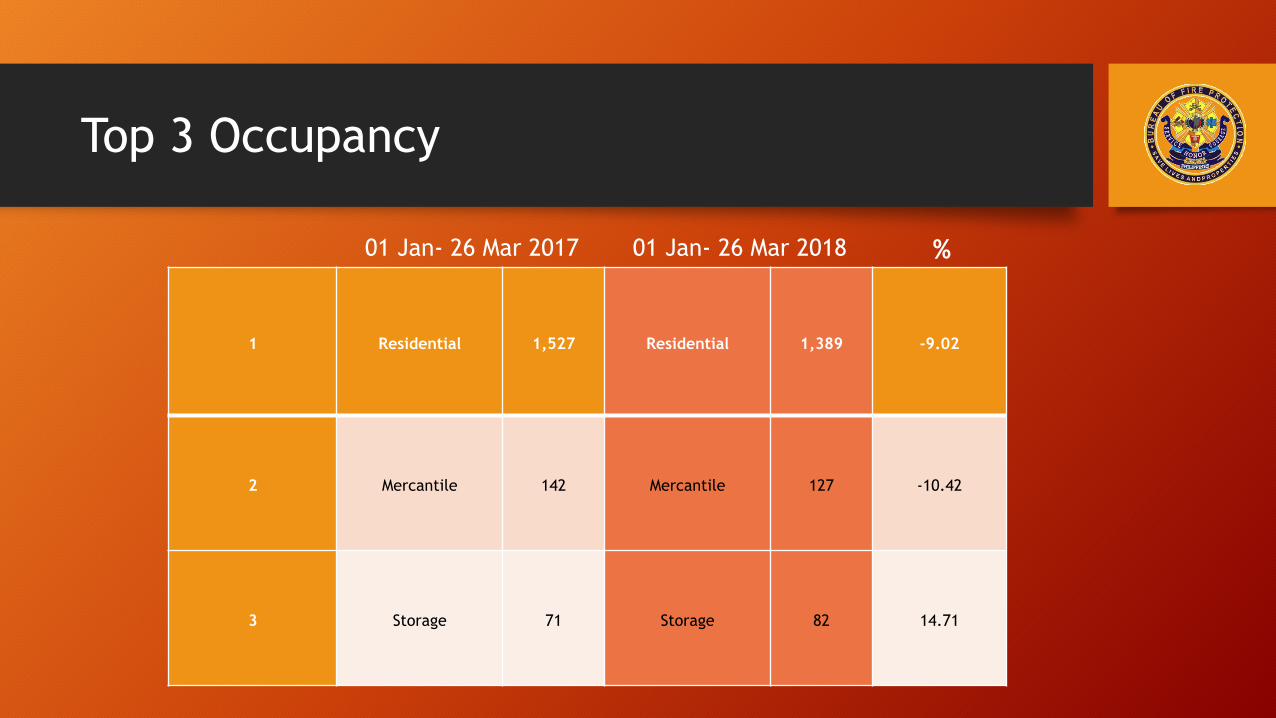
Top 3 Occupancy
1 Residential 1,527 Residential 1,389 -9.02
2 Mercantile 142 Mercantile 127 -10.42
3 Storage 71 Storage 82 14.71
01 Jan- 26 Mar 2017 01 Jan- 26 Mar 2018 %

Fire Statistics NCR Salubong 2018
• Meanwhile during New Year’s Eve celebration, more than 1,000 homes blazed into flames. On 31 Dec 2017- 2018 were 3,000 families was displaced by fire incidents in Metro Manila alone with firecrackers as the major culprit.
Last Salubong 2018, the total fire Incidents caused by Firecrackers in NCR is 15 out of 55 Fire Incidents Nationwide and 1 fatality.

Casualties in Fire Incidents Occupancies Male Female
1 Residential 98 60
2 Mercantile 17 5
3 Storage 5 2
4 Motor Vehicle
7 0
5 Mixed Occupancies 1 3
6 Industrial 13 0
7 Health Care 2 0
8 Business 3 0
9 Educational 1 0

Thank You and God Bless!