Embed Size (px)
Citation preview

CONSOLIDATED RESULTS 1st QUARTER 2008 January – March

Table of Contents
1. Message from Ângelo Paupério, CEO of Sonaecom............................................... 2 2. Quarter highlights........................................................................................ 4 3. Consolidated Results.................................................................................... 5
3.1. Consolidated Income Statement .................................................................. 5 3.2. Consolidated Balance Sheet ...................................................................... 7
4. Telecommunications .................................................................................... 9 4.1. Mobile Business ..................................................................................... 9 4.1.1. Operational data............................................................................ 9 4.1.2. Financial data ..............................................................................11 4.2. Wireline Business ..................................................................................11 4.2.1. Operational data...........................................................................11 4.2.2. Financial data ..............................................................................13
5. Software and Systems Information (SSI)............................................................13 5.1. Operational data....................................................................................14 5.2. Financial data .......................................................................................14
6. Público ...................................................................................................15 6.1. Operational data....................................................................................15 6.2. Financial data .......................................................................................16
7. Main Regulatory Developments ......................................................................16 8. Main Corporate Developments .......................................................................17 9. Shareholders General Meeting held on 16 April 2008 ............................................17
10. Consolidated Financial Statements ………………………………………………………………18
11. Individual Financial Statements …………….................……………………………………….. 77 Notes: (i) The Consolidated Financial Information contained in this report is unaudited and is based on Financial Statements that have been prepared in accordance with International Financial Reporting Standards (“IAS/IFRS”) issued by the International Accounting Standards Board (“IASB”), as adopted by the European Union.

FIRST QUARTER 2008 RESULTS
1. Message from Ângelo Paupério, CEO of Sonaecom This quarter was a very active one for Sonaecom during which we implemented a number of important initiatives, in particular the Optimus rebranding, the fibre deployment announcement, our announced reorganisation and several commercial initiatives including the preparation for the launch of “TAG”, our innovative mobile offer aimed at the youth market. Notwithstanding the challenging competitive environment, our operating and financial results were also positive and broadly in line with our expectations with significant growth in customers and customer revenues, higher costs but generating an EBITDA result equal to that of last year in absolute terms. The first quarter has highlighted the significant competitive pressures that the Portuguese telecoms market is under, with all of the main operators already active in, or planning to enter, all key segments of the market. The quarter saw new and aggressive offers and promotions across fixed voice, wireline broadband, mobile broadband and TV services including the announcement of the launch of a third satellite TV platform. These developments have gone some way to accelerate the move towards integration and convergence, a trend that Sonaecom has anticipated for some time and is well positioned to take advantage of. Notwithstanding this competitive market environment, we have been able to achieve our objectives to accelerate growth and strengthen market shares during 2008. Accordingly, I am pleased to be able to report 1Q08 results that broadly reflect our expectations and guidance given to the market with continued growth in our telecoms and SSI businesses:
Material growth in mobile active customers (+8.2%); Significant growth of our direct wireline accesses (+68.2%), reflecting both the organic growth
and the acquisitions carried out in 2007. Excluding the impact of these acquisitions, wireline direct accesses would have increase by 27.3%;
Increased rate of growth of customer revenues, with a higher year-on-year growth rate than in 4Q07; up 25.4% or 11.2% excluding recent acquisitions;
Significant growth in our mobile data revenues, that grew by more than 78% (excluding SMSs) against 1Q07;
Consolidated EBITDA result was maintained at the same level of last year due principally to the performance of our wireline business and notwithstanding the deterioration in EBITDA and EBITDA margin in our mobile business;
Substantial growth of EBITDA at our Wireline Business, reflecting mainly the benefits of the continued organic growth in its direct access business.
All our businesses had an active quarter in terms of commercial activities with the following initiatives worth highlighting:
Optimus rebranding, with the launch of a totally new brand and corporate image; preparation for the launch of an innovative offer aimed at the youth market (“TAG”), which
introduces, for the first time, unlimited communications among user groups at a attractive flat fees;
introduction of BlackBerry solutions in our offers to the Corporate and SME market; launch of a new entry level broadband ADSL offer at 4Mbs and upgrade of the customers with
the previous 2Mbs offer to 6Mbs speeds, with no additional charge; reinforcement of our IPTV offer by adding new broadcast channels and new functionalities; replacement of our wireline customers’ set-top boxes, for free, offering one of the most advanced
equipments available in the market, which will allow for the improvement of image and sound quality, as well as the rendering of HDTV;
Mainroad becoming the first SAP Hosting Partner in Portugal; change of corporate identity and image of WeDo to “WeDo Technologies”, a reflection of its
expansion and the consolidation of the acquired companies, bringing all assets under one single brand; and
campaigns implemented by Público, associated with its 18th anniversary, including special editions, the recirculation of the first edition and the launch of a new Saturday supplement.
2

FIRST QUARTER 2008 RESULTS
During the quarter, our Telco business and SSI have also focused on the integration of the businesses acquired during 2007. In the wireline arena, efforts have been made to accelerate the full migration of customers to our systems, which we expect to be completed by the end of 2Q08 in the case of Oni customers and, in the case of Tele2, at the beginning of the 3Q08. In addition, focus has been on the migration and up-selling of indirect customers to our direct voice and broadband services. These efforts are expected to have a positive impact during 2H08 with the implementation of measures aimed at achieving the expected synergies and improved profitability. We began to implement our investment plans for this year to extend our 3G network coverage and increase its capacity and to enlarge our ULL network coverage. In addition, we announced a three year investment plan of 240 million euros for the deployment of a Next Generation Fibre Network, with a targeted coverage of over 1 million homes and approximately 25% of the Portuguese population. Our fibre plan is aimed at building the most advanced telecommunications network in Portugal. As part of this plan, we have proposed an ‘open access’ policy for the fibre access network aimed at all interested national operators, aligning with regulatory recommendations and best practices in Europe. After tests performed during 2007, we are now implementing the initial phase of the plan, targeting new office and residential developments and priority areas in Lisbon and Porto. I would like to highlight that, contrary to all expectations, the final decision by Anacom in relation to changes in MTRs for 2008, was not taken during 1Q08. Had Anacom’s draft decision been implemented during 1Q08, our mobile business would have achieved an EBITDA margin close to that generated last year. It is of public knowledge that approximately 6 months ago, Anacom released a draft decision for the new MTRs programme for 2008 that envisaged further cuts in these rates and the introduction of asymmetry in favour of Optimus. This draft decision was taken with the purpose of fostering competition in the Portuguese mobile sector, which will ultimately benefit consumers. As the final decision is still to be implemented, our mobile business continued during 1Q08 to have significant imbalances of mobile termination charges in favour of its larger competitors. Recent decisions in relation to MTRs in other EU countries, such as Belgium, have reinforced our belief that the key elements of the draft decision released in October 2007 will be upheld. Going forward, it is clear that the current competitive market dynamics are likely to be sustained for a few more quarters and that this will lead to more pressure on short term profitability for the sector as a whole. We expect the final decision by Anacom on the 2008 MTRs in the short term. I am pleased with the progress achieved during 1Q08 in terms of customer and top-line growth in all our businesses and believe that the ambitious investment plan announced for the current year will prove to be the right strategy in order to enhance our competitive market position and provide for sustained future growth. Based on the regulatory framework presented by Anacom in its draft decision and given our 1Q08 results, we are confident that notwithstanding the current competitive environment, we should be able to achieve our full year 2008 targets.
3

FIRST QUARTER 2008 RESULTS
2. Quarter highlights
During 1Q08, Sonaecom was able to maintain the high level of growth in customers and customer revenues achieved in 4Q07 in its telecoms businesses, while maintaining a focus on cost control, despite the continuous investment in our brands, in new products and services and the increased commercial activities implemented in the quarter.
Operational Highlights
OPERATING KPI's 1Q07 1Q08 y.o.y 4Q07 q.o.qMobile BusinessCustomers (EOP) ('000) 2,629.2 2,926.9 11.3% 2,893.5 1.2%Active Customers (1) 2,117.1 2,290.2 8.2% 2,276.9 0.6%Data as % Service Revenues 16.0% 20.6% 4,6pp 19.4% 1,2ppMOU (2) (min.) 116.4 117.9 1.3% 120.6 -2.2%Wireline BusinessTotal Acesses (EOP) 393,483 775,163 97.0% 815,623 -5.0%
Direct 309,461 520,649 68.2% 510,673 2.0%Indirect 84,022 254,514 - 304,950 -16.5%
Direct access as % Customer Revenues 75.7% 65.8% -9,9pp 60.1% 5,8ppSonaecom Employees 1,847 1,943 5.2% 1,961 -0.9%(1) Active Customers w ith Revenues generated during the last 90 days; (2) Minutes of Use per Customer per month. Consolidated Financial Highlights
CONSOLIDATED FINANCIAL KPI's 1Q07 1Q08 y.o.y 4Q07 q.o.qTurnover 198.9 237.7 19.5% 248.4 -4.3%
Service Revenues 183.2 217.1 18.5% 224.3 -3.2%Customer Revenues 137.1 171.9 25.4% 175.9 -2.2%Operator Revenues 46.2 45.1 -2.2% 48.4 -6.8%
EBITDA 34.0 34.1 0.2% 41.4 -17.8%EBITDA Margin (%) 17.1% 14.3% -2.8pp 16.7% -2.3ppEBT -6.8 -7.4 -8.5% -0.9 -Net Results - Group Share (1) -6.0 -5.5 8.0% 33.8 -Operating CAPEX (2) 28.7 32.7 13.8% 52.3 -37.5%Operating CAPEX as % of Turnover 14.5% 13.8% -0.7pp 21.1% -7.3ppEBITDA - Operating CAPEX 5.2 1.3 -74.3% -10.9 -Total CAPEX 29.6 35.4 19.3% 76.5 -53.8%FCF (3) 63.2 -32.7 - 3.9 -
Million euros
(1) Net Results after Minority Interests; (2) Operating CAPEX excludes Financial Investments, Provisions for sites dismantling and other non operational investments; (3)FCF Levered after Financial Expenses but before Capital Flow s and Financing related up-front Costs. Customers: (i) Mobile customers increased by 11.3% to 2.927 million at the end of 1Q08; net additions in the quarter were 33.3 thousand, up by 22.0% when compared to 1Q07. Data revenues represented 20.6% of service revenues in the quarter, up 4.6 pp from 1Q07 and 1.2pp from 4Q07; (ii) Wireline accesses totalled 775 thousand at 1Q08 against 393 thousand in 1Q07. Direct accesses increased to 520.6 thousand, 68.2% above 1Q07, with significant underlying like-for-like growth of 27.3%. Wireline customer revenues (o.w. 65.8% are related to direct access) represented, in 1Q08, 65.1% of service revenues.
Personnel: total employees increased by 5.2% compared to 1Q07 but have decreased by 0.9% compared to the previous quarter. The y.o.y. increase is mostly due to the integration of personnel from the acquisitions carried out during 2007 (mainly Cape and Tele2 Portugal). The evolution of the headcount includes a decrease of 2.3% in shared services and corporate centre.
Consolidated Service Revenues continued to grow at a high pace, increasing by 18.5% against 1Q07, as a result of a 25.4% increase in customer revenues (or 11.2% if we exclude the contributions of the companies acquired in 2007) that more than compensated the 2.2% reduction in operator revenues, driven by the negative impact of Mass Calling Services on operator revenues at our wireline business.
Consolidated EBITDA increased by 0.2% to 34.1 million euros, driven primarily by the improved contribution from the Wireline Business. EBITDA margin, as expected, deteriorated by 2.8 pp to 14.3% due to: (i) the increased marketing & sales costs in the Telco Business; (ii) the costs associated with the integration of the acquired businesses; (iii) the negative impact of lower roaming-in tariffs; and (iv) at SSI, the significant increase of IT products sales that carry lower margins.
4

FIRST QUARTER 2008 RESULTS
3. Consolidated Results 3.1. Consolidated Income Statement CONSOLIDATED INCOME STATEMENT 1Q07 1Q08 y.o.y 4Q07 q.o.qTurnover 198.9 237.7 19.5% 248.4 -4.3%Mobile 142.8 151.6 6.2% 164.4 -7.8%Wireline 54.0 75.2 39.2% 77.8 -3.4%Público 7.2 7.8 8.8% 9.5 -18.2%SSI 15.0 27.1 80.8% 26.1 3.6%Other & Eliminations -20.0 -23.9 -19.7% -29.5 18.8%Other Revenues 1.3 1.5 15.1% 2.2 -30.1%Operating Costs 162.7 201.1 23.6% 206.2 -2.5%COGS 22.3 25.8 15.9% 33.9 -23.9%Network Costs (1) 68.4 83.7 22.5% 82.8 1.2%Personnel Costs 23.4 26.1 11.3% 25.9 0.6%Marketing & Sales 19.0 26.5 39.5% 26.9 -1.7%Outsourcing Services (2) 15.2 21.6 41.6% 19.8 9.2%General & Administrative Expenses 11.3 13.8 22.4% 12.8 8.3%Other Operating Costs 3.1 3.6 15.1% 4.2 -14.8%Provisions and Impairment Losses 3.6 4.1 13.6% 2.9 39.2%EBITDA 34.0 34.1 0.2% 41.4 -17.8%EBITDA Margin (%) 17.1% 14.3% -2,8pp 16.7% -2,3ppMobile 35.0 33.1 -5.2% 35.5 -6.7%Wireline 0.2 2.5 - 5.4 -53.4%Público -1.2 -1.2 1.6% 0.2 -SSI 1.2 0.9 -27.4% 0.4 134.0%Other & Eliminations -1.2 -1.3 -5.1% -0.1 -Depreciation & Amortization 36.6 37.3 1.7% 38.5 -3.2%EBIT -2.6 -3.2 -21.1% 2.9 -Net Financial Results -4.1 -4.2 -0.4% -3.8 -8.1%Financial Income 9.2 0.8 -91.5% 0.8 -0.9%Financial Expenses 13.3 4.9 -63.0% 4.6 6.6%EBT -6.8 -7.4 -8.5% -0.9 -Tax results 0.8 1.9 125.7% 34.9 -94.6%Net Results -5.9 -5.5 8.0% 34.0 -
Group Share -6.0 -5.5 8.0% 33.8 -Attributable to Minority Interests 0.1 0.0 -14.0% 0.2 -72.4%
(1) Netw ork Costs = Interconnection plus Leased Lines plus Content plus Other Netw ork Operating Costs; (2) Outsourcing Services = Customer Services plus Consultantsplus Subcontracts. Turnover Consolidated turnover totalled 237.7 million euros in 1Q08, almost 20% above 1Q07. Consolidated service revenues increased materially by 18.5%, to 217.1 million euros. The main drivers behind this performance were the following:
a) 38.8% higher service revenues at our Wireline Business or 6.0% on a like-for-like basis, i.e., excluding the businesses acquired during 2007 (Oni’s residential & SOHO customer base and Tele 2 Portugal);
b) 6.7% increase in service revenues at our Mobile Business (the highest y.o.y increase of the last 3 years), despite the impact of lower roaming-in tariffs;
c) 44.9% higher service revenues at SSI, driven by the positive performance of all its businesses. If we exclude the companies acquired by WeDo during 2007, SSI’s services revenues would still have grown by a material 26%; and
d) the 2.0% decrease in advertising revenues at Público. Importantly, consolidated customer revenues continue to grow at a high pace: 25.4% when compared to 1Q07, driven by strong customer revenue growth at both our Wireline (+84.9%) and Mobile (8.4%) Businesses. Excluding the contributions from the businesses acquired during 2007, consolidated service revenues and customer revenues would have still grown significantly by 7.8% and 11.2%, respectively, compared to 1Q07, on a like-for-like basis, a strong achievement in the current competitive market environment.
5

FIRST QUARTER 2008 RESULTS
Operating costs Total operating costs reached 201.1 million euros in 1Q08, an increase of 23.6% y.o.y.. Total operating costs excluding COGS were 24.8% higher than in 1Q07, representing 80.7% of service revenues, approximately 4.1pp above the level registered in the first quarter of 2007. As explained above for turnover, it should be noted that 1Q08 operating costs include the costs associated with the companies acquired during 2007 and the respective integration costs. Besides the contributions of the acquired companies, it is worth noting that the higher operating costs in the quarter were primarily growth related:
a) 22.5% higher network costs when compared to 1Q07, driven by a 18.9% increase in interconnection & content costs, due to higher level of traffic volumes and to the enlarged ULL customer base, which led to significantly higher ULL monthly fee related costs; and by a 37.2% increase in leased lines and network expenses, as a result of the reinforcement of our mobile network (driven by the success of mobile broadband) and by the network costs associated with the companies acquired during last year. Network costs have increased by only 1.2% when compared to 4Q07;
b) marketing & sales costs and handset subsidisation costs increased by 22.7% driven mainly by the Telco Division investments in customer acquisition, in the launch of new products and services, and in the major re-launch of the Optimus brand at the beginning of the quarter and related advertising campaigns; and
c) general & administrative costs and outsourcing costs that increased by 22.4% and 41.6%, respectively, mainly explained by: (i) the increased customer base at our Mobile Business and related license costs; and (ii) the significant growth of post-paid mobile customers and larger customer base at our Wireline Business (with the consequent billing & support requirements and related expenses). The fact that ONI and Tele2’s customers are still not being fully served by our own network and systems (the migration of the last customer is expected to be accomplished during 3Q08), also contributed to the increased outsourcing costs.
Staff costs increased by 11.3% against 1Q07 (0.6% when compared to 4Q07) reflecting the additional staff related costs of the acquired companies. Provisions and impairment losses increased y.o.y. in 1Q08 by 0.5 million euros due to a combination of higher provisions for stock depreciation at our Telco Businesses, driven mainly by the replacement of set-top boxes at our Wireline Business, that was partially offset by lower provisions for bad debt. EBITDA Consolidated EBITDA improved by 0.2% to 34.1 million euros in 1Q08 generating a margin of 14.3%, compared to a margin of 17.1% in 1Q07. This performance was mainly driven by strong operational results at our Wireline Business, that were almost fully off-set by the increased commercial costs at the Mobile business (driven by the rebranding operation and the cost of growth) and the costs of integration of the companies acquired during 2007. The breakdown of EBITDA performance by business was as follows:
a) EBITDA at our Mobile Business was of 33.1 million euros, down by 1.9 million euros when compared to 1Q07, explained by the increase in marketing & sales costs in the quarter and by the negative impact from lower roaming-in tariffs;
b) The Wireline Business generated an EBITDA of 2.5 million euros (2.3 million euros improvement over 1Q07) clearly reflecting the scale benefits of the continued organic growth in its direct access business;
c) EBITDA at SSI decreased from 1.2 million euros in 1Q07 to 0.9 million euros in 1Q08. The higher service revenues in all SSI companies and the improved EBITDA performance at Mainroad and Bizdirect, were not sufficient to compensate for the costs of integration and the improving but still negative contributions in 1Q08 of the companies acquired by WeDo;
d) Público’s EBITDA was negative 1.2 million euros, which nevertheless represented an improvement of 1.6% when compared to 1Q07, with improved performance in product sales (17.6% above 1Q07), almost fully offset by the negative performance in advertising revenues and the growth in marketing & sales costs, which partly reflects the 1Q08 marketing campaign to reinforce Sexta’s (the free weekly newspaper launched in 4Q07) positioning and brand awareness.
6

FIRST QUARTER 2008 RESULTS
Net Profit Net results group share were negative 5.5 million euros in 1Q08, an improvement of 8% when compared to the negative 6 million euros result in 1Q07. Depreciation & amortization charges increased marginally to 37.3 million euros (a 1.7% increase compared to 1Q07), driven by the increased asset base resulting from our investments in expanding both our mobile and wireline networks. Net financial charges increased by 0.4 million euros against the 4Q07, to 4.2 million euros in 1Q08, reflecting: (i) higher interest expenses, up by 0.3 million euros, due to the slightly higher average cost of debt (5.1% in 1Q08 compared to 5.0% in 4Q07) mainly as a consequence of the increase in market rates; (ii) approximately stable interest income, at 0.8 million euros; and (iii) increase in foreign exchange losses in the amount of 0.1 million, associated with SSI’s international activities, driven by the EUR appreciation. The tax line in 1Q08 showed a benefit of 1.9 million euros, compared to 0.8 million euros in 1Q07, due mostly to movements in deferred tax assets at our Telecoms Business. 3.2. Consolidated Balance Sheet
CONSOLIDATED BALANCE SHEET 1Q07 1Q08 y.o.y 4Q07 q.o.qTotal Net Assets 1,676.4 1,694.9 1.1% 1,758.6 -3.6%Non Current Assets 1,226.1 1,353.8 10.4% 1,353.9 0.0%
Tangible and Intangible Assets 654.3 720.4 10.1% 722.6 -0.3%Goodwill 507.1 528.1 4.2% 528.2 0.0%Investments 1.9 2.0 1.1% 2.0 0.5%Deferred Tax Assets 62.8 103.3 64.4% 101.1 2.1%
Current Assets 450.3 341.0 -24.3% 404.7 -15.7%Trade Debtors 138.6 191.0 37.8% 192.0 -0.5%Liquidity 189.5 5.5 -97.1% 83.9 -93.4%Others 122.2 144.5 18.2% 128.8 12.1%
Shareholders' Funds 889.9 932.5 4.8% 935.4 -0.3%Group Share 889.3 931.6 4.8% 934.6 -0.3%Minority Interests 0.6 0.9 62.0% 0.9 6.4%Total Liabilities 786.5 762.3 -3.1% 823.2 -7.4%Non Current Liabilities 484.9 379.4 -21.8% 422.6 -10.2%
Bank Loans 461.9 329.6 -28.6% 373.2 -11.7%Provisions for Other Liabilities and Charges 21.2 31.7 50.0% 30.9 2.8%Others 1.8 18.1 - 18.5 -2.3%
Current Liabilities 301.6 383.0 27.0% 400.6 -4.4%Bank Loans 0.8 0.3 -65.3% 0.6 -57.1%Trade Creditors 136.9 174.7 27.6% 185.3 -5.7%Others 163.9 208.0 26.9% 214.6 -3.1%
Operating CAPEX (1) 28.7 32.7 13.8% 52.3 -37.5%Operating CAPEX as % of Turnover 14.5% 13.8% -0.7pp 21.1% -7.3ppTotal CAPEX 29.6 35.4 19.3% 76.5 -53.8%EBITDA - Operating CAPEX 5.2 1.3 -74.3% -10.9 -Operating Cash Flow (2) -18.6 -28.6 -53.5% 18.3 -FCF (3) 63.2 -32.7 - 3.9 -Gross Debt 465.6 349.3 -25.0% 393.7 -11.3%Net Debt 276.1 343.7 24.5% 309.8 10.9%Net Debt/ EBITDA last 12 months 1.5 x 2.1 x 0.6x 1.9 x 0.21xEBITDA/Interest Expenses (4) 2.9 x 7.6 x 4.7x 9.9 x -2.2xDebt/Total Funds (Debt + Shareholders' Funds) 34.4% 27.2% -7.1pp 29.6% -2.4pp
Million euros
(1) Operating CAPEX excludes Financial Investments, Provisions for sites dismantling and other non operational investments; (2) Operating Cash Flow = EBITDA - OperatingCAPEX - Change in WC -Non Cash item & Other; (3) FCF Levered after Financial Expenses but before Capital Flow s and Financing related up-front Costs; (4) InterestCover.
Capital structure As a consequence of the refinancing operation carried out in 2007, before the turmoil in the credit markets, consolidated gross debt continues to be primarily contracted by Sonaecom SGPS and internal funding movements are being used to allocate cash between our subsidiaries. At end of 1Q08, the weighted average maturity of Sonaecom Group credit lines stood at approximately 4.2 years, compared to circa 2.5 years in 1Q07, before we completed the refinancing process.
7

FIRST QUARTER 2008 RESULTS
Consolidated gross debt totalled 349.3 million euros, 44.4 million euros below the level at the end of 2007 and comprised: (i) 150 million euros long-term privately placed Bonds, due in 2013; (ii) an amount of 180.5 million euros used under the underwritten committed Commercial Paper Programme (with a total available amount of 250 million euros) contracted in 2007 and with final maturity in 2012 and (iii) 19.4 million euros of long term financial leases. Consolidated net debt at the end of 1Q08 stood at 343.7 million euros, an increase of 33.9 million euros compared to the end of 2007, mainly reflecting the FCF evolution in the quarter. Sonaecom’s capital structure continues to be conservative as demonstrated by its key financial ratios at the end of 1Q08. Net debt to annualised EBITDA deteriorated marginally, when compared to YE07, to 2.1x, reflecting the above mentioned increase in net debt registered in the quarter. Interest cover improved from 2.9x, in 1Q07 to 7.6x in 1Q08, as a result of the significantly lower level of interest expenses. It should be noted that interest expenses in 1Q07 included interest paid on a loan from Sontel BV, associated with the Tender Offer for PT, which was fully repaid by the end of that quarter. Interest expense in the quarter increased by only 0.31 million euros against 4Q07. The ratio of Consolidated Debt to Total Funds improved from 29.6% in YE07 to 27.2% in 1Q08, reflecting the above mentioned movements in gross debt and the 2.9 million euros decrease in Shareholder’s Funds. The latter resulted mainly from the net losses generated in the period and by the delivery of own shares to employees under our Medium Term Incentive Plan (which had a net effect of increasing shareholders funds by 2.0 million euros). At the end of 1Q08, the sum of cash and non-utilized committed credit lines at the Sonaecom Group stood at approximately 155 million euros. As identified above, no amortizations of bank loans are scheduled until 2010. CAPEX Consolidated CAPEX was 35.4 million euros while operating CAPEX reached 32.7 million euros, 13.8% above 1Q07, and representing 13.8% of turnover. The increase in Operating CAPEX was driven by higher investments in our Mobile Business (+57.8% increase over 1Q07, to 25.9 million euros), as a reflection of our decision to accelerate the extension of coverage and capacity of our 2.5G/3G network in order to improve quality of service and consolidate our leading position in mobile broadband. Operating CAPEX spend during 1Q08 was mainly applied as follows: 30% invested in the deployment of the UMTS/HSDPA network, 21% was related to the GSM/GPRS network, 16% related to Information Technology/Information Systems investments; and approximately 12% was invested in our ULL and FTTh access networks. Other balance sheet items Gross tangible and intangible assets were 1,701 million euros at the end of 1Q08, compared to 1,666 million euros at YE07 and cumulative depreciation and amortization totalled 980.9 million euros, compared to 943.7 million euros in the previous quarter. Both financial investments and goodwill were approximately stable in comparison to 4Q07 registering, in 1Q08, 2.0 million euros and 528.1 million euros, respectively. At the end of 1Q08, Sonaecom shareholders’ funds totalled 932.5 million euros, compared to 935.4 million euros at the end of 2007, reflecting mainly the net losses of 5.5 million euros generated in the quarter.
8

FIRST QUARTER 2008 RESULTS
FCF
LEVERED FREE CASH FLOW 1Q07 1Q08 y.o.y 4Q07 q.o.qEBITDA-Operating CAPEX 5.2 1.3 -74.3% -10.9 -Change in WC -24.7 -32.1 -30.4% 24.7 -Non Cash Items & Other 0.8 2.2 178.4% 4.6 -51.3%Operating Cash Flow -18.6 -28.6 -53.5% 18.3 -Financial Investments 108.2 -1.1 - -10.1 89.3%Own shares -8.9 0.0 100.0% 0.0 -Public Tender Offer -13.1 -0.1 99.1% -0.3 65.8%Financial results -4.2 -2.9 31.7% -4.0 27.2%Income taxes -0.1 0.0 100.0% 0.0 -FCF 63.2 -32.7 - 3.9 -
Million euros
Consolidated FCF in 1Q08 was negative 32.7 million euros, compared to a positive 63.2 million euros in 1Q07 that included the positive impact of the disposal of PT shares (108.2 million Euros). Excluding this effect, the impact of the acquisition of own shares and of the payments associated with the Public Tender Offer in 1Q07, consolidated FCF would, on a like-for-like basis, have deteriorated by approximately 9.5 million euros against 1Q07. Operating cash flow was negative by 28.6 million euros in 1Q08, down from negative 18.6 million euros in 1Q07, mainly driven by: (i) a deterioration of 3.9 million euros in EBITDA-Operating Capex; and (ii) a deterioration in working capital of 32.1 million euros, reflecting the lower credit from trade creditors and fixed asset suppliers at both the Mobile and Wireline Business (a normal evolution during the first quarter of the year) and the advance payments of 5.5 million euros made, during 1Q08, by our Mobile Business to fixed asset suppliers in order to take advantage of financial discounts offered. 4. Telecommunications 4.1. Mobile Business Our mobile business had an active quarter in terms of commercial activity, and was able to sustain strong customer and customer revenue growth, as a result of the planned investment to support the brand, particularly in the residential segment; to improve distribution capacity; and with the continuous development of our fixed-mobile convergent product ‘Optimus Home’ and our wireless broadband service “Kanguru”. Optimus was able to sustain its leading position in wireless broadband in the residential market and achieved significant growth in overall data usage.
4.1.1. Operational data MOBILE OPERATIONAL KPI's 1Q07 1Q08 y.o.y 4Q07 q.o.qCustomers (EOP) ('000) 2,629.2 2,926.9 11.3% 2,893.5 1.2%Net Additions ('000) 27.3 33.3 22.0% 132.4 -74.8%% Pre-paid Customers 75.9% 70.8% -5,1pp 73.1% -2,3ppActive Customers (1) 2,117.1 2,290.2 8.2% 2,276.9 0.6%Data as % Service Revenues 16.0% 20.6% 4,6pp 19.4% 1,2ppTotal #SMS/month/user 45.0 42.2 -6.3% 45.1 -6.4%MOU (2) (min.) 116.4 117.9 1.3% 120.6 -2.2%ARPU (euros) 17.7 17.0 -4.2% 18.1 -6.2%ARPM (3) (euros) 0.15 0.14 -5.4% 0.15 -4.0%SAC&SRC (4) (million euros) 27.1 36.2 33.8% 40.1 -9.8%Employees (5) 1,034 980 -5.2% 977 0.3%
Shared Services Divis ion 766 746 -2.6% 748 -0.3%(1) Active Customers w ith Revenues generated on last 90 days; (2) Minutes of Use per Customer per month; (3) Average Revenue per Minute; (4) Total Acquisition &Retention Costs; (5) Includes Shared Services Div ision. Customer base Mobile customer base increased by 11.3% to 2.927 million customers at the end of 1Q08, compared to 2.629 million at the end of 1Q07 and 2.893 million at 4Q07, with net additions reaching 33 thousand in the quarter, up by 22% compared to 1Q07, a demonstration of the continued progress in our growth strategy. Active customers at the end of 1Q08 totalled 2.290 million, as compared to 2.117 million at the end of 1Q07, an increase of approximately 8.2%.
9

FIRST QUARTER 2008 RESULTS
Contract customers continued to increase their weight in the total customer base. At the end of 1Q08, pre-paid customers represented 70.8% of total customers, a reduction of 5.1pp against 1Q07 and 2.3pp against 4Q07. During 1Q08, Mobile customer’s ARPU was 17.0 euros, down from 17.7 euros in 1Q07. Of the 1Q08 ARPU, 13.2 euros were related to customer monthly bill and 3.8 euros to operator revenues, compared to 13.5 euros and 4.2 euros respectively, in 1Q07. The lower ARPU is mainly explained by the decrease of 9.1% in operator revenues ARPU, due to reductions in roaming-in tariffs. The fall in the level of customer monthly bill, was driven by the decrease in Average Revenue per Minute (“ARPM”), explained by the higher price pressures on voice tariffs mainly in the SME and Corporate segments, but also due to the increased weight of “Optimus Home” (our fixed-mobile convergence product) within the customer base, that was partially offset by increased usage per customer, as demonstrated by the 1.3% increase in average Minutes of Use (“MoU”). Data usage During 1Q08, we were able to maintain our leading position in wireless broadband and achieved a material growth of data usage, namely through the promotion of our mobile broadband product “Kanguru”, based on HSDPA/HSUPA technologies, now offering download speeds of up to 7.2 Mbps and upload speeds of up to 1.4Mbps, including a recently launched Pen Modem. The governmental programme (“e-Initiatives”) aimed at the development of the ‘Information Society’ in Portugal, continues to contribute to maintaining mobile broadband market growth at a high pace and all three incumbent mobile operators have been active in contributing to this programme. Data revenues represented 20.6% of service revenues in 1Q08, an improvement of 4.6pp versus 1Q07 and 1.2 pp over 4Q07, as the result of our promotional efforts to increase usage of data services and the success of our wireless broadband solutions. Non-SMS related data services continued to increase their weight in data revenues, accounting for approximately 61% of total data revenues in 1Q08, compared to only 47% in 1Q07. The revenues from non-SMS data services have increase by approximately 78.2% from 1Q07 to 1Q08. Traffic In 1Q08, total voice traffic1 was 12,8% higher than that recorded in 1Q07 as a result of both the enlarged customer base and of the increase in MoU per customer to 117.9 minutes (from 116.4 minutes in 1Q07), reflecting the continuous success of our investment effort to enhance voice usage.
1 Total voice traffic = total incoming traffic plus total outgoing traffic plus total Roaming out
10
FIRST QUARTER 2008 RESULTS
4.1.2. Financial data
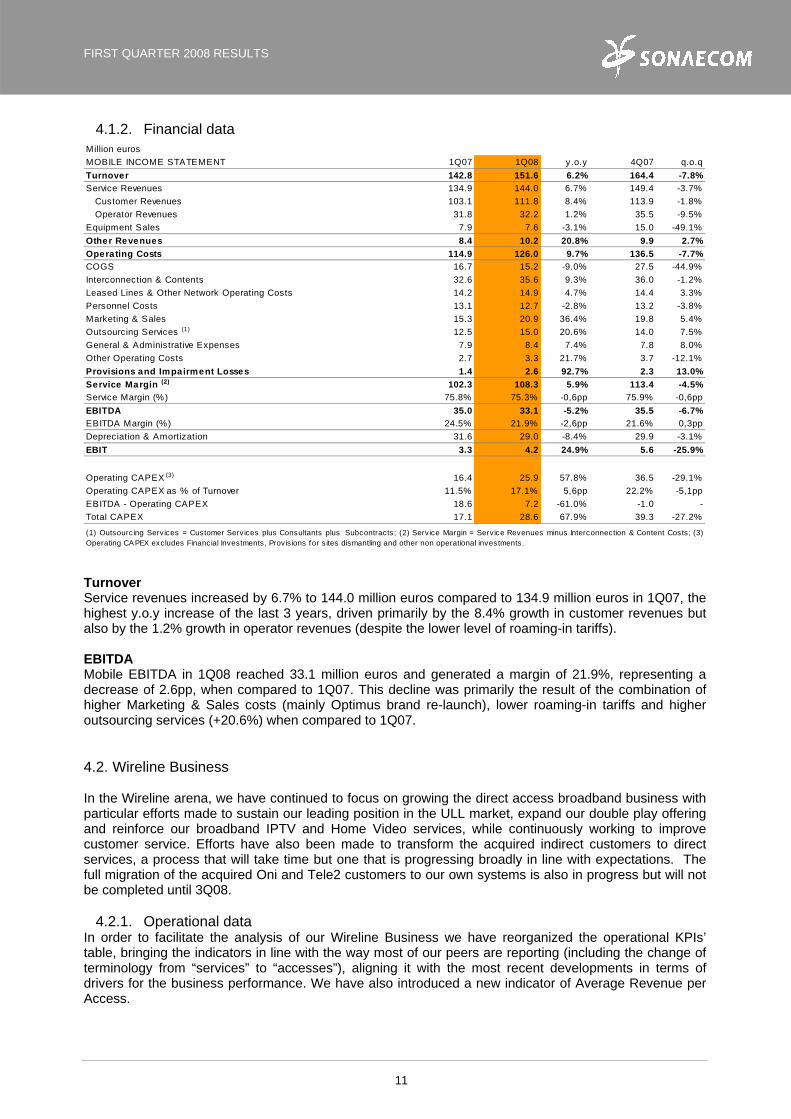
MOBILE INCOME STATEMENT 1Q07 1Q08 y.o.y 4Q07 q.o.qTurnover 142.8 151.6 6.2% 164.4 -7.8%Service Revenues 134.9 144.0 6.7% 149.4 -3.7%
Customer Revenues 103.1 111.8 8.4% 113.9 -1.8%Operator Revenues 31.8 32.2 1.2% 35.5 -9.5%
Equipment Sales 7.9 7.6 -3.1% 15.0 -49.1%Other Revenues 8.4 10.2 20.8% 9.9 2.7%Operating Costs 114.9 126.0 9.7% 136.5 -7.7%COGS 16.7 15.2 -9.0% 27.5 -44.9%Interconnection & Contents 32.6 35.6 9.3% 36.0 -1.2%Leased Lines & Other Network Operating Costs 14.2 14.9 4.7% 14.4 3.3%Personnel Costs 13.1 12.7 -2.8% 13.2 -3.8%Marketing & Sales 15.3 20.9 36.4% 19.8 5.4%Outsourcing Services (1) 12.5 15.0 20.6% 14.0 7.5%General & Administrative Expenses 7.9 8.4 7.4% 7.8 8.0%Other Operating Costs 2.7 3.3 21.7% 3.7 -12.1%Provisions and Impairment Losses 1.4 2.6 92.7% 2.3 13.0%Service Margin (2) 102.3 108.3 5.9% 113.4 -4.5%Service Margin (%) 75.8% 75.3% -0,6pp 75.9% -0,6ppEBITDA 35.0 33.1 -5.2% 35.5 -6.7%EBITDA Margin (%) 24.5% 21.9% -2,6pp 21.6% 0,3ppDepreciation & Amortization 31.6 29.0 -8.4% 29.9 -3.1%EBIT 3.3 4.2 24.9% 5.6 -25.9%
Operating CAPEX (3) 16.4 25.9 57.8% 36.5 -29.1%Operating CAPEX as % of Turnover 11.5% 17.1% 5,6pp 22.2% -5,1ppEBITDA - Operating CAPEX 18.6 7.2 -61.0% -1.0 -Total CAPEX 17.1 28.6 67.9% 39.3 -27.2%
Million euros
(1) Outsourcing Services = Customer Services plus Consultants plus Subcontracts; (2) Service Margin = Service Revenues minus Interconnection & Content Costs; (3)Operating CAPEX excludes Financial Investments, Provisions for s ites dismantling and other non operational investments.
Turnover Service revenues increased by 6.7% to 144.0 million euros compared to 134.9 million euros in 1Q07, the highest y.o.y increase of the last 3 years, driven primarily by the 8.4% growth in customer revenues but also by the 1.2% growth in operator revenues (despite the lower level of roaming-in tariffs). EBITDA Mobile EBITDA in 1Q08 reached 33.1 million euros and generated a margin of 21.9%, representing a decrease of 2.6pp, when compared to 1Q07. This decline was primarily the result of the combination of higher Marketing & Sales costs (mainly Optimus brand re-launch), lower roaming-in tariffs and higher outsourcing services (+20.6%) when compared to 1Q07. 4.2. Wireline Business In the Wireline arena, we have continued to focus on growing the direct access broadband business with particular efforts made to sustain our leading position in the ULL market, expand our double play offering and reinforce our broadband IPTV and Home Video services, while continuously working to improve customer service. Efforts have also been made to transform the acquired indirect customers to direct services, a process that will take time but one that is progressing broadly in line with expectations. The full migration of the acquired Oni and Tele2 customers to our own systems is also in progress but will not be completed until 3Q08.
4.2.1. Operational data In order to facilitate the analysis of our Wireline Business we have reorganized the operational KPIs’ table, bringing the indicators in line with the way most of our peers are reporting (including the change of terminology from “services” to “accesses”), aligning it with the most recent developments in terms of drivers for the business performance. We have also introduced a new indicator of Average Revenue per Access.
11

FIRST QUARTER 2008 RESULTS
WIRELINE OPERATIONAL KPI's 1Q07 1Q08 y.o.y 4Q07 q.o.qTotal Acesses (EOP) (1) 393,483 775,163 97.0% 815,623 -5.0%
Voice 217,221 495,909 128.3% 534,067 -7.1%Direct 170,910 280,989 64.4% 277,252 1.3%Indirect 46,311 214,920 - 256,815 -16.3%
ADSL 143,830 250,138 73.9% 249,040 0.4%Direct 132,078 221,947 68.0% 217,648 2.0%Indirect 11,752 28,191 139.9% 31,392 -10.2%
Other & Data 32,432 29,116 -10.2% 32,516 -10.5%Direct 6,473 17,713 173.6% 15,773 12.3%Indirect 25,959 11,403 -56.1% 16,743 -31.9%
Total Direct Accesses 309,461 520,649 68.2% 510,673 2.0%Total Indirect Accesses 84,022 254,514 - 304,950 -16.5%
Unbundled Central Offices with transmission 149 173 16.1% 169 2.4%Unbundled Central Offices with ADSL2+ 141 164 16.3% 161 1.9%
Direct access as % Customer Revenues 75.7% 65.8% -9.9pp 60.1% 5.8pp
Blended ARPU - Retail (2) 23.4 21.1 -9.9% 20.8 1.4%(1) Acesses w ere restated according to a "revenue generator unit" criteria since 1Q07; (2) Average Revenue per Acess (excluding Mass Calling services' revenues) Customer base At the end of 1Q08, total accesses reached 775.2 thousand, an increase of 97% compared to 1Q07 (14.2% on a like-for-like basis, i.e., excluding the impact of the acquisitions carried out in 2007). Even more importantly, direct accesses have grown by 68.2% against 1Q07 and by 27.3% on a like-for-like basis. Total direct accesses represented 67.2% of the Wireline Business total accesses in 1Q08, compared to 78.6% in 1Q07 (as a result of the increase in the indirect customer base determined mostly by the acquisition of Tele 2 during 3Q07) and 62.6% in 4Q07. We continue to enlarge the addressable market of our direct offers by opening new Central Offices (“COs”). During 1Q08 we extended our transmission capacity to four additional COs and have unbundled three additional COs with ADSL2+. The addressable market of our ULL network now covers more than 55% of total households. Direct net additions in 1Q08 were, approximately, 10 thousand accesses, a decrease from the 28 thousand accesses in 1Q07 as a result of the slower expansion rate of unbundling of COs for ADSL2+, the increased competitive pressures currently prevailing in the market and of the growing use of mobile broadband services. Wireline retail ARPU increased to 21.1 euros, up by 1.4pp against 4Q07, driven mainly by the increased weight of direct customers and by the negative impact of the promotion campaigns carried out in the quarter, on the back of similar pricing campaigns launched by our main competitors. Services During 1Q08, through our residential brand Clix, we promoted the replacement, for free, of current customers’ set top boxes for a new MPEG4 model, one of the most advanced set top boxes currently available in the market, which will allow our TV customers to access HD channels, DTT and to benefit from an improved sound quality. We have introduced a new entry level of the ADSL offer at 4Mbs and launched new and very attractive promotions for the residential market aimed at reinforcing Clix’s position in the market. Additionally customers with 2Mbs ADSL offers were upgraded to 6Mbs speeds, with no additional cost. We have also reinforced our IPTV offer by adding new contents, including new broadcast channels such as TVGlobo and World Made Channel, as well as new functionalities: Kids Club (a new portal with design and contents specially adapted to the children’s target) and a parental control tool.
12

FIRST QUARTER 2008 RESULTS
4.2.2. Financial data
W IRELINE INCOME STATEMENT 1Q07 1Q08 y.o.y 4Q07 q.o.qTurnover 54.0 75.2 39.2% 77.8 -3.4%Service Revenues 54.0 75.0 38.8% 77.0 -2.6%
Customer Revenues 26.4 48.8 84.9% 50.1 -2.6%Direct Access Revenues 20.0 32.1 60.7% 30.1 6.7%Indirect Access Revenues 5.7 15.5 172.9% 19.0 -18.4%Other 0.7 1.1 59.3% 1.0 16.1%
Operator Revenues 27.7 26.2 -5.2% 26.9 -2.4%Equipment Sales 0.0 0.2 - 0.8 -78.0%Other Revenues 1.0 0.7 -36.1% 1.2 -45.1%Operating Costs 52.6 72.0 36.7% 73.1 -1.5%COGS -0.1 0.3 - 1.0 -66.4%Interconnection 28.1 34.9 24.4% 33.6 3.9%Leased Lines & Other Network Operating Costs 8.9 13.6 53.4% 14.6 -6.8%Personnel Costs 2.4 2.6 6.6% 2.6 0.2%Marketing & Sales 2.8 4.4 59.6% 5.8 -23.3%Outsourcing Services (1) 7.9 12.7 60.1% 12.6 0.9%General & Administrative Expenses 2.3 3.1 37.9% 2.6 21.1%Other Operating Costs 0.4 0.3 -30.0% 0.3 -15.9%Provisions and Impairment Losses 2.2 1.4 -37.6% 0.5 161.7%Service Margin (2) 25.9 40.1 54.4% 43.4 -7.6%Service Margin (%) 48.0% 53.4% 5,4pp 56.3% -2,9ppEBITDA 0.2 2.5 - 5.4 -53.4%EBITDA Margin (%) 0.4% 3.3% 2,9pp 6.9% -3,6ppDepreciation & Amortization 4.7 8.0 69.2% 13.6 -41.1%EBIT -4.5 -5.5 -22.1% -8.2 33.1%
Operating CAPEX (3) 12.2 6.7 -44.9% 16.1 -58.1%Operating CAPEX as % of Turnover 22.6% 9.0% -13,7pp 20.7% -11,7ppEBITDA - Operating CAPEX -12.0 -4.2 64.8% -10.7 60.5%Total CAPEX 12.2 6.7 -44.9% 13.7 -50.8%
Million euros
(1) Outsourcing Services = Customer Services plus Consultants plus Subcontracts; (2) Service Margin = Service Revenues minus Interconnection Costs; (3) OperatingCAPEX excludes Financial Investments, Provisions for s ites dismantling and other non operational investments.
Turnover When comparing to 1Q07, it should be noted that the 1Q08 results of the Wireline Business and consequently, those of Sonaecom Consolidated include revenues generated by Tele2 Portugal and by the customers acquired from Oni. Turnover in 1Q08 amounted to 75.2 million euros, an increase of 39.2% over 1Q07, mainly due to the significant increase in customer revenues, up by 84.9%, driven by the growth in both direct access revenues (60.7% higher than in 1Q07 and 6.7% higher than in the previous quarter) and indirect access revenues that increased by 9.8 million euros. In part, growth was driven by the contributions from the acquired customer base of Oni and of Tele2 Portugal. In 1Q08, the total revenue contribution from the businesses acquired during 2007 was of 17.7 million euros. Excluding this contribution, customer revenues would still have grown by a material 17.8% when compared to 1Q07. Direct access revenues accounted for 65.8% of customer revenues in the quarter, an increase of 5.8pp compared to the 4Q07 (which already incorporated the acquired companies), as a result of the continued focus on the direct access business. The contribution of mass calling services has, as expected, decreased from 4.7 million euros in 1Q07 to 2.8 million euros in 1Q08, which was partially off-set by growth of wholesale traffic and revenues. EBITDA Wireline EBITDA was positive 2.5 million euros, compared to only 0.2 million euros in 1Q07, and generated a margin of 3.3%. This improvement was primarily due both to the increased size of the ULL customer base achieved via organic growth that has been generating an increasingly positive contribution to profitability since the second half of 2006, and the positive contribution from the businesses acquired last year. 5. Software and Systems Information (SSI) SSI achieved a good set of operational results with top-line growth driven by the performance of WeDo that continued to expand its customer base through its leading Revenue Assurance product (“RAID”) and
13

FIRST QUARTER 2008 RESULTS
by the increased profitability at Mainroad (our IT company focused in IT Management, Security and Business Continuity). WeDo continued to focus on the integration of the companies acquired during 2007 with particular focus on the integration of Cape Technologies that has, and will continue to, require significant effort and resources. Simultaneously, efforts have been made to consolidate WeDo’s international presence, grow its leading position in the international Revenue Assurance market, expand beyond its traditional telecoms customer base, and improve its product portfolio. More than 60% of its revenues in 1Q08 were obtained outside of the Sonaecom Group (versus approximately 48% at the same period in 2007). 5.1. Operational data
SSI OPERATIONAL KPI's 1Q07 1Q08 y.o.y 4Q07 q.o.qIT Service Revenues/Employee (1) ( '000 euros) 27.3 28.2 3.5% 27.3 3.5%Equipment Sales as % Turnover 33.6% 46.8% 13.2pp 41.3% 5.4ppEquipment Sales/Employee (2) ( '000 euros) 461.4 975.8 111.5% 836.1 16.7%EBITDA/Employee ( '000 euros) 3.5 1.9 -46.5% 0.8 134.9%Employees 344 460 33.7% 467 -1.5%(1) Excluding employees dedicated to Equipment Sales; (2) Bizdirect. SSI inverted the negative trend in productivity levels registered in 4Q07 (due to the integration of the companies acquired in 2007 and their comparatively lower productivity, a natural outcome during integration phases) with IT service revenues per employee increasing to 28.2 thousand euros in 1Q08 (3.5% above the level registered in 4Q07 and in 1Q07), while equipment sales per employee have more than doubled when compared to 1Q07. Total headcount at the end of 1Q08 decreased by 7 to 460, when compared to YE07, but increased by 116 employees against 1Q07, mainly due to: (i) the consolidation of the companies acquired by WeDo during 2007 (Tecnológica, Cape Technologies and Praesidium); and (ii) the need for additional internal consultants to support the increased level of activity. Of the total WeDo’s headcount at the end of 1Q08, approximately 38% are based outside of Portugal. Importantly, during the quarter, Mainroad became the first SAP Hosting Partner in Portugal (and only the second in Iberia), successfully passing a thorough certification process. Mainroad has also been nominated for the DataCentres Awards Europe 2008, as one of the three “Best Disaster Recovery Providers on Europe”, on a contest promoted annually by BroadGroup, an UK research organization specialized in the Datacentre Business. 5.2. Financial data
SSI CONSOLIDATED INCOME STATEMENT 1Q07 1Q08 y.o.y 4Q07 q.o.qTurnover 14.96 27.05 80.8% 26.10 3.6%Service Revenues 9.94 14.40 44.9% 15.32 -6.0%Equipment Sales 5.02 12.65 151.8% 10.78 17.3%Other Revenues 0.19 0.07 -63.0% 0.04 61.4%Operating Costs 13.94 26.19 87.9% 25.74 1.8%COGS 4.83 12.48 158.4% 10.57 18.1%Personnel Costs 5.00 6.94 39.0% 7.25 -4.3%Marketing & Sales 0.28 0.30 8.7% 0.47 -35.4%Outsourcing Services (1) 2.11 4.19 98.7% 4.68 -10.5%General & Administrative Expenses 1.57 2.29 46.5% 2.62 -12.5%Other Operating Costs 0.16 -0.02 - 0.15 -Provisions and Impairment Losses 0.01 0.06 - 0.04 64.9%EBITDA 1.20 0.87 -27.4% 0.37 134.0%EBITDA Margin (%) 8.0% 3.2% -4.8pp 1.4% 1.8ppDepreciation & Amortization 0.33 0.50 48.5% 0.53 -6.6%EBIT 0.87 0.38 -56.7% -0.16 -
Operating CAPEX (2) 0.15 0.13 -13.0% 0.35 -64.1%Operating CAPEX as % of Turnover 1.0% 0.5% -0.5pp 1.4% -0.9ppEBITDA - Operating CAPEX 1.06 0.75 -29.4% 0.02 -Total CAPEX 0.39 0.02 -94.3% 24.14 -99.9%
Million euros
(1) Outsourcing Services = Customer Services plus Consultants plus Subcontracts; (2) Operating CAPEX excludes Financial Investments, Provisions for sites dismantlingand other non operational investments.
14

FIRST QUARTER 2008 RESULTS
Turnover When comparing to 1Q07, it should be noted that the 1Q08 results of SSI (and the consolidated results of Sonaecom) include the contributions of Cape Technologies, Praesidium and Tecnológica, all acquired by WeDo during 2007. SSI turnover increased by 80.8% in 1Q08 to 27.1 million euros, as a result of both higher IT equipment sales, which increased by 151.8% to 12.7 million euros, and higher service revenues, up by 44.9%, mainly driven by the 54.0% increase in service revenues at WeDo (up 24.6% on a like-for-like basis, i.e., excluding the contributions from the companies acquired in 2007). When compared to 1Q07, WeDo’s top line growth was particularly strong in Latin America and Middle East & Africa regions. Significantly, all SSI’s businesses have posted a y.o.y turnover growth above 20%. During 1Q08, equipment sales represented 46.7% of turnover, an increase of 5.4 pp over the level registered in 4Q07, driven by a positive contribution from the sale of computers at Bizdirect, partly related with the “e-Initiatives” programme launched by the Portuguese Government. EBITDA SSI EBITDA was 0.87 million euros in 1Q08, a reduction of 0.33 million euros versus 1Q07. The reduction in EBITDA was driven primarily by costs relating to the integration of Cape Technologies. The EBITDA margin improved by 1.8 pp against the previous quarter, although still significantly below the levels achieved in 1Q07 due to the continuously improving but still negative impact of Cape Technologies and the significantly higher level of product sales at Bizdirect that carry lower margins. Excluding Cape Technologies, WeDo’s EBITDA would have increased by a 40.2% in 1Q08 and generated an EBITDA margin of 16%. It should also be noted that both Bizdirect, and particularly, Mainroad, have shown a positive evolution at the EBITDA level. Mainroad improved its EBITDA margin by 3.5pp against the first quarter of 2007. 6. Público Market dynamics have been severe for daily paid generalist press with circulation decreasing by 2.0%2 and advertising revenues, in first two months of 2008, decreasing by 1.1%3 compared to the same period of the previous year (this number refers to advertising space calculated at reference table figures - competitive pressures continue to lead to higher price discounts). During the same period, the free newspapers’ advertising revenues is estimated to have increased by more than 50%. As a way to celebrate its 18th anniversary with its readers, Público implemented a number of related campaigns during 1Q08, including special editions of certain supplements, the recirculation of the first edition of the newspaper and the launch, under the format of a magazine, of a new Saturday supplement dedicated to leisure. 6.1. Operational data PÚBLICO OPERATIONAL KPI's 1Q07 1Q08 y.o.y 4Q07 q.o.qAverage Paid Circulation (1) 41,031 43,530 6.1% 39,615 9.9%Market Share of Advertising (%) (2) 14.2% 12.3% -1,9pp 13.9% -1,7ppEmployees 263 255 -3.0% 257 -0.8%(1) Estimated value updated in the follow ing quarter; (2) 1Q08 = February YTD. Público continues to rank third in terms of paid circulation among daily generalist press, with an average market share of paid circulation in 4Q07 (the latest available information) of 11.9%, in line with 4Q06. Although the restructuring of the product, implemented at the end of 2006, was well received by readers, the difficult market dynamics have influenced the circulation figures. In 1Q08, average paid circulation increased by 6.1% when compared to 1Q07 and by 9.9% when compared to the previous quarter, mainly as a result of the campaigns implemented to promote circulation. Nevertheless, as mentioned above, the paid press market continues to face competitive challenges, with average circulation decreases and increased competition from ‘free’ newspapers (estimated to have increased circulation by circa 42%). Público’s advertising market share continues to be
2 Source: APCT: 2007 vs 2006 (latest available data) 3 Source: Marktest/Media Monitor
15

FIRST QUARTER 2008 RESULTS
under pressure, reaching an average of 12.3% during 1Q08, down 1.9pp as compared to 1Q07. The good performance shown in terms of circulation should lead to a positive impact over advertising revenues in the coming quarters. 6.2. Financial data
PÚBLICO CONSOLIDATED INCOME STATEMENT 1Q07 1Q08 y.o.y 4Q07 q.o.qTurnover 7.18 7.81 8.8% 9.55 -18.2%Advertising Sales (1) 3.22 3.16 -2.0% 4.16 -24.0%Newspaper Sales 2.86 3.05 6.6% 2.77 9.8%Associated Product Sales 1.10 1.61 46.6% 2.62 -38.8%Other Revenues 0.07 0.06 -8.6% 0.08 -22.9%Operating Costs 8.37 9.00 7.5% 9.38 -4.1%COGS 1.71 2.13 24.8% 2.50 -14.8%Personnel Costs 2.83 2.91 2.6% 2.82 3.0%Marketing & Sales 0.43 0.87 102.8% 0.93 -6.6%Outsourcing Services (2) 2.67 2.36 -11.6% 2.41 -2.1%General & Administrative Expenses 0.74 0.73 -1.1% 0.72 1.8%Other Operating Costs 0.00 0.00 - 0.01 -33.3%Provisions and Impairment Losses 0.05 0.04 -29.5% 0.05 -30.2%EBITDA -1.18 -1.16 1.6% 0.20 -EBITDA Margin (%) -16.5% -14.9% 1,6pp 2.1% -Depreciation & Amortization 0.17 0.18 9.0% 0.18 -0.5%EBIT -1.35 -1.35 0.3% 0.01 -
Operating CAPEX (3) 0.25 0.10 -58.4% 0.20 -46.9%Operating CAPEX as % of Turnover 3.5% 1.3% -2,2pp 2.1% -0,7ppEBITDA - Operating CAPEX -1.43 -1.27 11.5% 0.00 -Total CAPEX 0.25 0.10 -58.4% 0.20 -46.9%
Million euros
(1) Includes Contents; (2) Outsourcing Services = Customer Services plus Consultants plus Subcontracts; (3) Operating CAPEX excludes Financial Investments,Provisions for sites dismantling and other non operational investments. Turnover During 1Q08, turnover increased by 8.8% to 7.81 million euros, compared to 7.18 million euros in 1Q07, reflecting a material growth (+6.6%) in newspaper sales (or +9.8% over 4Q07) but also in associated product revenues (+46.6% when compared to 1Q07). These positive trends in terms of turnover have been partly off-set by a 2.0% decrease in advertising revenues, in line with the overall evolution of advertising spend in the daily generalist paid press. “Sexta”, the free weekly newspaper launched in 4Q07, through a 50:50 joint-venture with “A Bola”, and consolidated in Público since November 2007 (proportional consolidation), is still in the initial stages of development. Circulation and advertising indicators in the coming quarters will enable a better assessment of its impact in the market. EBITDA In 1Q08, Público generated a negative EBITDA of 1.16 million euros, which represents a 1.6% improvement over 1Q07. Notwithstanding the top-line growth registered in the quarter, the 24.8% increase in COGS (driven mainly by the increased circulation figures and by the inclusion of Sexta), and the growth in marketing & sales costs (partly driven by circulation campaigns implemented in 1Q08) have determined the limited improvement at the EBITDA level. It should also be noted that the EBITDA generated by the associated products increased by approximately 35% when compared to 1Q07. The contribution of Sexta for Público’s EBITDA was still marginally negative in 1Q08. On a like-for-like basis, Público’s EBITDA would have increased by circa 19% against the first quarter of 2007. 7. Main Regulatory Developments The following are some of the more important regulatory developments during 1Q08:
Licensing of frequencies in the 450-470 MHz Following the results of the public consultation carried out during 2007, Anacom approved in March
2008 the draft conditions for the tendering process related to the allocation of frequencies in the 450-470 MHz band. The proposed conditions include, among other, the following: (i) the granting of
16

FIRST QUARTER 2008 RESULTS
frequencies to one single entity; (ii) exclusion of the current mobile operators as well as operators that offer services supported in CDMA450, such as Radiomóvel; and (iii) the requirement for a guarantee in the amount of five million euros to secure the obligations associated with contribution to the Information Society, which is one of the evaluation criteria. The market consultation in relation to these draft conditions will take place until 12 May 2008 and only after the results are presented the regulator will initiate the tendering process.
Universal Service
In February 2008, Anacom launched a public consultation on the universal service (minimum communication services defined by law, available to all users, independently of geographical location, and under special conditions to certain people). In this consultation, the regulator has asked for comments in relation to a number of different aspects of the universal service, including its scope, conditions for the designation of the entities that can render the service and the calculation of the respective cost. The consultation also included the request for indications of interest for the granting of the service.
Anacom’s understanding on the spin-off of Zon Multimedia
Anacom recently published its understanding on the spin-off of Zon Multimédia, clarifying that it considers Zon no longer a part of the PT Group. As a consequence, the obligations that arise from the analysis of regulated markets to the PT Group are not applicable to Zon. In addition, as the spin-off has a material impact on markets 4 and 5 (wholesale unbundled and wholesale broadband accesses), Anacom announced that it will give priority to the reanalysis of those markets, foreseeing the launch of the respective consultation proceedings until May 2008.
8. Main Corporate Developments
On 21 February 2008, Sonaecom announced its 3-year plan for the deployment of fibre, aimed at building the most advanced telecommunications network in Portugal. As part of this plan, Sonaecom proposed to give access to its fibre network to all interested national operators, aligning with regulatory recommendations and the best practices in Europe.
Sonaecom further announced that it will invest 240 million euros during a 3 year period in developing this Next Generation Network, which will allow coverage of over 1 million homes and approximately 25% of the Portuguese population.
9. Shareholders General Meeting held on 16 April 2008 At the Shareholders General Meeting held on 16 April 2008, the following proposals, amongst others, were approved by the shareholders of Sonaecom: Approval of the Full Year Management Report and Individual and Consolidated Accounts of
Sonaecom, SGPS, SA for the year ended 31 December 2007, including the proposal for appropriation of the Net Results for 2007 , as presented;
Appointment of the following members to the statutory governing bodies of Sonaecom, SGPS, SA, for
the mandate beginning in 2008 and ending in 2011:
Board of the Shareholders’ General Meeting: Chairman: João Augusto Esmeriz Vieira de Castro Secretary: António Agostinho Cardoso da Conceição Guedes Board of Directors: Duarte Paulo Teixeira de Azevedo - Chairman Ângelo Gabriel Ribeirinho dos Santos Paupério George Christopher Lawrie Luís Filipe Campos Dias de Castro Reis Maria Cláudia Teixeira de Azevedo Miguel Nuno Santos Almeida António Sampaio e Mello
17

FIRST QUARTER 2008 RESULTS
David Charles Denholm Hobley Gervais Gilles Pellissier Jean-François René Pontal Nuno Manuel Moniz Trigoso Jordão Statutory Audit Board: Arlindo Dias Duarte Silva (Chairman) Armando Luís Vieira de Magalhães Óscar José Alçada da Quinta Substitute: Jorge Manuel Felizes Morgado Shareholders’ Remuneration Committee SONAE, SGPS, S.A., represented by a person to be appointed by that company; SONTEL, B.V., represented by a person to be appointed by that company
Appointment of the audit firm Deloitte & Associados, SROC, SA, represented by Jorge Manuel Araújo
de Beja Neves or by João Luís Falua Costa da Silva as Statutory External Auditor (“Revisor Oficial de Contas”) of Sonaecom, SGPS, SA, for the mandate beginning in 2008 and ending in 2011;
Change of Sonaecom’s shares from book-entry bearer shares to book-entry registered shares and,
as a consequence thereof, approval of the corresponding amendments to the Company’s Articles of Association;
Authorisation for Sonaecom SGPS, S.A. or companies which are directly or indirectly controlled (as
defined in Article 486 of Portuguese Company Law) to purchase and hold shares issued by Sonaecom, within the limits permitted by law and exclusively for delivery to executive members of the Board of Directors and employees, under the terms of the Sonaecom Medium Term Incentive Plan.
The complete list of proposals is available in the Investor Relations section of our website (www.sonae.com).
18

FIRST QUARTER 2008 RESULTS
10. Consolidated Financial Statements
19

FIRST QUARTER 2008 RESULTS
Notes March 2008 March 2007 December 2007
Sales 20,622,514 15,724,760 79,052,510Services rendered 217,072,204 183,219,065 813,641,181Other operating revenues 1,529,894 1,329,424 6,421,176
239,224,612 200,273,249 899,114,867
Cost of sales (25,790,971) (22,253,402) (108,621,905)External supplies and services 20 (145,632,952) (113,908,940) (507,530,381)Staff expenses (26,071,899) (23,423,800) (95,000,392)Depreciation and amortisation 1. d), 1. e), 6 and 7 (37,270,824) (36,630,606) (139,982,820)Provisions and impairment losses 1.p), 1.w) and 18 (4,097,488) (3,605,463) (12,176,960)Other operating costs 1.x) (3,563,578) (3,095,966) (13,791,210)
(242,427,712) (202,918,177) (877,103,668)
Gains and losses on associated companies 21 9,456 (87,573) 224,427Gains and losses on investments available for sale 21 - - 5,578,307Other financial expenses 1.n), 1.o), 1.w), 1.x) and 21 (4,940,353) (13,250,670) (39,460,766)Other financial income 1.o), 1.w) and 21 776,601 9,202,055 12,176,948
Current income/(loss) (7,357,396) (6,781,116) 530,115
Income taxation 1.q), 11 and 22 1,885,222 835,092 36,635,013
Consolidated net income/(loss) (5,472,174) (5,946,024) 37,165,128Attributed to:
Shareholders of parent company 26 (5,526,045) (6,004,250) 36,777,870Minority interests 53,871 58,226 387,258
Earnings per shareIncluding discontinued operations
Basic (0.02) (0.02) 0.10Diluted (0.02) (0.02) 0.10
Excluding discontinued operationsBasic (0.02) (0.02) 0.10Diluted (0.02) (0.02) 0.10
The notes are an integral part of the consolidated financial statements at 31 March 2008 and 2007.
The Chief Accountant The Board of Directors
SONAECOM, S.G.P.S., S.A. AND SUBSIDIARIES
CONSOLIDATED PROFIT AND LOSS ACCOUNT BY NATURE
FOR THE QUARTERS ENDED AT 31 MARCH 2008 AND 2007 AND THE YEAR ENDED AT 31 DECEMBER 2007
(Amounts expressed in Euro)
20

TER 2008 RESULTS
21
SONAECOM, S.G.P.S., S.A. AND SUBSIDIARIES
CONSOLIDATED MOVEMENTS IN SHAREHOLDERS' FUNDS
FOR THE QUARTERS ENDED AT 31 MARCH 2008 AND 2007
(Amounts expressed in Euro)
2008
Own Reserves Reserves Fair valueShare Shares Legal Share Other Medium Term Hedging of Own reserves Total Minority Netcapital (Note 20) reserves premium reserves Incentive Plans Reserve shares (Note 10) reserves Interests income/(loss) Total
Balance at 31 December 2007 366,246,868 (8,938,165) 1,002,287 775,290,377 (248,360,691) 3,186,678 412,910 8,938,165 - 540,469,726 - 36,777,870 934,556,299
Appropriation of the consolidated result of 2007 - - - 36,777,870 - - - - 36,777,870 - (36,777,870) -Consolidated net income/(loss) for the quarter ended 31 March 2008 - - - - - - - - - - - (5,526,045) (5,526,045)Delivery of own shares under Medium Term Incentive Plans - 4,275,838 - - 2,073,731 - - (4,275,838) - (2,202,107) - - 2,073,731Fair value reserves - - - - - - (171,764) - (171,764) - - (171,764)Medium Term Incentive Plans recognition - - - - - 862,123 - - - 862,123 - - 862,123Adjustments in foreign currency translation reserves and others - - - - (198,619) - - - - (198,619) - - (198,619)
Balance at 31 March 2008 366,246,868 (4,662,327) 1,002,287 775,290,377 (209,707,709) 4,048,801 241,146 4,662,327 - 575,537,229 - (5,526,045) 931,595,725
Minority interestsBalance at 31 December 2007 - - - - - - - - - - 865,131 - 865,131Minority interests on results - - - - - - - - - - 53,871 - 53,871Other changes - - - - - - - - - - 1,445 - 1,445
Balance at 31 March 2008 - - - - - - - - - - 920,447 - 920,447
Total 366,246,868 (4,662,327) 1,002,287 775,290,377 (209,707,709) 4,048,801 241,146 4,662,327 - 575,537,229 920,447 (5,526,045) 932,516,172
2007
Own Reserves Reserves Fair valueShare Shares Legal Share Other Medium Term Hedging of Own reserves Total Minority Netcapital (Note 20) reserves premium reserves Incentive Plans Reserve shares (Note 10) reserves Interests income/(loss) Total
Balance at 31 December 2006 366,246,868 - 559,078 775,290,377 (225,277,495) 952,390 - - 5,121,876 556,646,226 - (13,883,168) 909,009,926- - - - - - -
Appropriation of the consolidated result of 2006 - - 443,209 - (14,326,377) - - - - (13,883,168) - 13,883,168 -Consolidated net income/(loss) for the quarter ended 31 March 2007 - - - - - - - - - - - (6,004,250) (6,004,250)Acquisition of own shares - (8,938,165) - - (8,938,165) - - 8,938,165 - - - - (8,938,165)Fair value reserves - - - - - - - - (5,121,876) (5,121,876) - - (5,121,876)Medium Term Incentive Plans recognition - - - - - 442,770 - - - 442,770 - - 442,770Adjustments in foreign currency translation reserves and others - - - - (95,951) - - - - (95,951) - - (95,951)Balance at 31 March 2007 366,246,868 (8,938,165) 1,002,287 775,290,377 (248,637,988) 1,395,160 - 8,938,165 - 537,988,001 - (6,004,250) 889,292,454
Minority interestsBalance at 31 December 2006 - - - - - - - - - - 471,382 - 471,382Minority interests on results - - - - - - - - - - 58,226 - 58,226Other changes - - - - - - - - - - 38,376 - 38,376
Balance at 31 March 2007 - - - - - - - - - - 567,984 - 567,984
Total 366,246,868 (8,938,165) 1,002,287 775,290,377 (248,637,988) 1,395,160 - 8,938,165 - 537,988,001 567,984 (6,004,250) 889,860,438
The notes are an integral part of the consolidated financial statements at 31 March 2008 and 2007.
Reserves
Reserves
FIRST QUAR

FIRST QUARTER 2008 RESULTS
Operating activitiesReceipts from trade debtors 235,370,410 200,870,089 Payments to trade creditors (181,940,681) (151,001,973)Payments to employees (31,606,431) (36,231,079)
Cash flows from operating activities 21,823,298 13,637,037
Payments/receipts relating to income taxes, net (918,653) (1,315,150)Other payments/receipts relating to operating activities, net 1,965,990 5,846,855
Cash flows from operating activities (1) 22,870,635 22,870,635 18,168,742 18,168,742
Investing activitiesReceipts from:
Investments - 108,461,473 Tangible assets 129,349 396,812 Intangible assets 3,361 2,922 Interest and similar income 783,160 915,870 5,809,215 114
Payments for:Investments (765,050) -Tangible assets (46,633,532) (38,546,361)Intangible assets (5,388,410) (52,786,992) (3,430,377) (41,976,738)
Cash flows from investing activities (2) (51,871,122) 72,693,684
Financing activitiesReceipts from:
Loans obtained 115,384 115,384 - -Payments for:
Leasing (400,055) (360,728)Interest and similar expenses (4,040,797) (18,752,830)Own shares - (8,938,165)Loans obtained (44,500,000) (48,940,852) - (28,051,723)
Cash flows from financing activities (3) (48,825,468) (28,051,723)
Net cash Flows ( 4 )=( 1 )+( 2 )+( 3 ) (77,825,955) 62,810,703 Effect of the foreign exchanges (29,135) 63,942Cash and cash equivalents at the beginning of the period (83,227,155) (125,842,737)Cash and cash equivalents at end of the period 5,372,065 188
0 0
The notes are an integral part of the consolidated financial statements at 31 March 2008 and 2007.
Chief Accountant The Board of Directors
SONAECOM, S.G.P.S., S.A. AND SUBSIDIARIES
March 2007March 2008
CONSOLIDATED CASH FLOW STATEMENT
FOR THE QUARTERS ENDED AT 31 MARCH 2008 AND 2007
(Amounts expressed in Euro)
,670,422
,717,382
22
FIRST QUARTER 2008 RESULTS
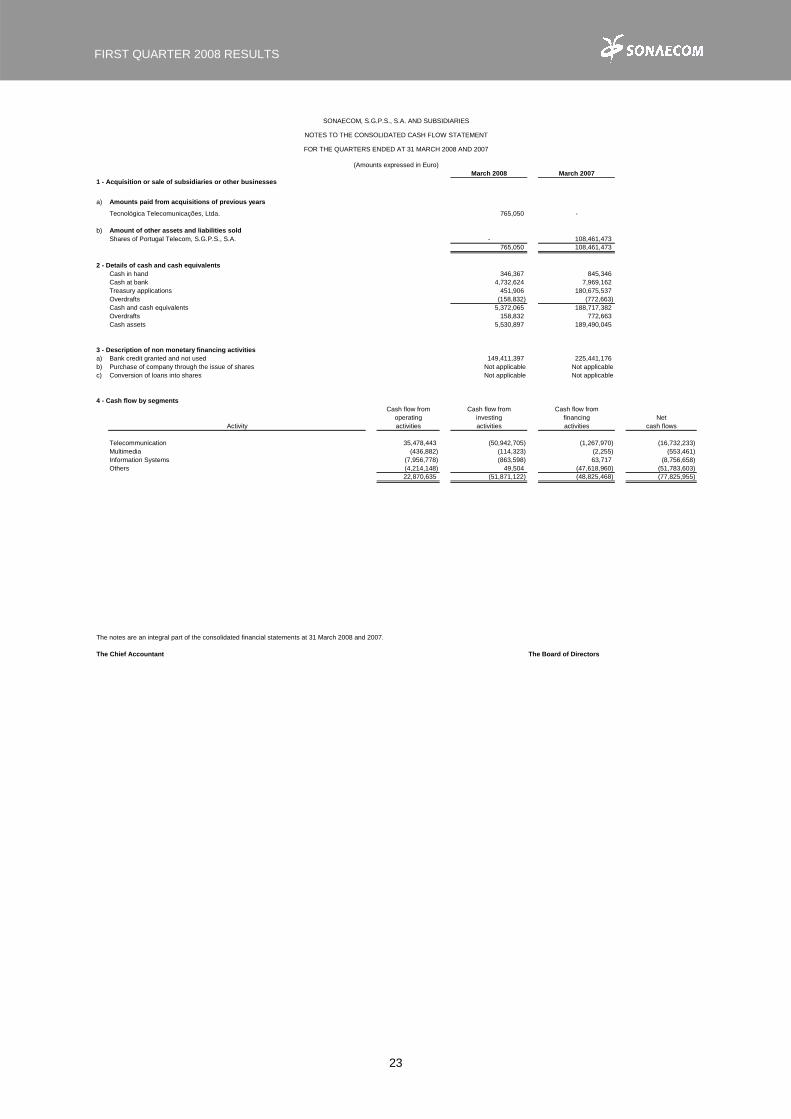
March 2008 March 20071 - Acquisition or sale of subsidiaries or other businesses
a) Amounts paid from acquisitions of previous years
Tecnológica Telecomunicações, Ltda. 765,050 -
b) Amount of other assets and liabilities soldShares of Portugal Telecom, S.G.P.S., S.A. - 108,461,473
765,050 108,461,473
2 - Details of cash and cash equivalentsCash in hand 346,367 845,346 Cash at bank 4,732,624 7,969,162 Treasury applications 451,906 180,675,537 Overdrafts (158,832) (772,663)Cash and cash equivalents 5,372,065 188,717,382 Overdrafts 158,832 772,663 Cash assets 5,530,897 189,490,045
3 - Description of non monetary financing activitiesa) Bank credit granted and not used 149,411,397 225,441,176 b) Purchase of company through the issue of shares Not applicable Not applicablec) Conversion of loans into shares Not applicable Not applicable
4 - Cash flow by segmentsCash flow from Cash flow from Cash flow from
operating investing financing NetActivity activities activities activities cash flows
Telecommunication 35,478,443 (50,942,705) (1,267,970) (16,732,233)Multimedia (436,882) (114,323) (2,255) (553,461)Information Systems (7,956,778) (863,598) 63,717 (8,756,658)Others (4,214,148) 49,504 (47,618,960) (51,783,603)
22,870,635 (51,871,122) (48,825,468) (77,825,955)
22,870,635 (51,871,122) (48,825,468) (77,825,955)
0 0 0 0
The notes are an integral part of the consolidated financial statements at 31 March 2008 and 2007.
The Chief Accountant The Board of Directors
SONAECOM, S.G.P.S., S.A. AND SUBSIDIARIES
NOTES TO THE CONSOLIDATED CASH FLOW STATEMENT
FOR THE QUARTERS ENDED AT 31 MARCH 2008 AND 2007
(Amounts expressed in Euro)
23

FIRST QUARTER 2008 RESULTS
Notes to the consolidated financial statements at 31 March 2008 and 2007 (Amounts expressed in Euro) SONAECOM, S.G.P.S., S.A. (hereinafter referred to as “the Company” or “Sonaecom”) was established on 6 June 1988, under the name Sonae – Tecnologias de Informação, S.A. and has its head office at Lugar de Espido, Via Norte, Maia – Portugal. It is the parent company of the group of companies listed in Notes 2, 3 and 4 (“the Group”). Pargeste, S.G.P.S., S.A.’s subsidiaries in the communications and information technology area were transferred to the Company through a demerger-merger process, executed by public deed dated 30 September 1997. On 3 November 1999 the Company’s share capital was increased, its articles of association were modified and its name was changed to Sonae.com, S.G.P.S., S.A.. Since then the Company’s corporate object has been the management of investments in other companies. Also on 3 November 1999, the Company’s share capital was re-denominated to Euro, being represented by one hundred and fifty million shares with a nominal value of 1 Euro each. On 1 June 2000, the Company carried out a Combined Share Offer, involving the following: - A Retail Share Offer of 5,430,000 shares, representing 3.62% of the share capital, made in the domestic market and aimed at: (i) employees of the Sonae Group; (ii) customers of the companies controlled by Sonaecom; and (iii) the general public. - An Institutional Offering for sale of 26,048,261 shares, representing 17.37% of the share capital, aimed at domestic and foreign institutional investors. In addition to the Combined Share Offer, the Company’s share capital was increased under the terms explained below. The new shares were fully subscribed for and paid up by Sonae, S.G.P.S., S.A. (a shareholder of Sonaecom, hereinafter referred to as “Sonae”). The capital increase was subscribed for and paid up on the date the price of the Combined Share Offer was determined, and paid up in cash, 31,000,000 new ordinary shares of 1 Euro each being issued. The subscription price for the new shares was the same as that fixed for the sale of shares in the aforementioned Combined Share Offer, which was Euro 10. In addition, Sonae sold 4,721,739 Sonaecom shares under an option granted to the banks leading the Institutional Offer for Sale and 1,507,865 shares to Sonae Group managers and to the former owners of the companies acquired by Sonaecom. By decision of the Shareholders’ General Meeting held on 17 June 2002, Sonaecom’s share capital was increased from Euro 181,000,000 to Euro 226,250,000 by public subscription reserved for the existing shareholders, 45,250,000 new shares of 1 Euro each having been fully subscribed for and paid up at the price of Euro 2.25 per share. On 30 April 2003, the company’s name was changed by public deed to SONAECOM, S.G.P.S., S.A.. By decision of the Shareholders’ General Meeting held on 12 September 2005, Sonaecom’s share capital was increased in Euro 70,276,868, from Euro 226,250,000 to Euro 296,526,868, by the issuance of 70,276,868 new shares of 1 Euro each and with a share premium of Euro 242,455,195, fully subscribed by France Telecom. The corresponding public deed was executed on 15 November 2005.
24

FIRST QUARTER 2008 RESULTS
By decision of the Shareholders General Meeting held on 18 September 2006, Sonaecom’s share capital was increased in Euro 69,720,000, from Euro 296,526,868 to Euro 366,246,868, by the issuance of 69,720,000 new shares of 1 Euro each and with a share premium of Euro 275,657,217, subscribed by 093X – Telecomunicações Celulares, S.A. (EDP) and Parpública – Participações Públicas, SGPS, S.A.(Parpública). The corresponding public deed was executed on 18 October 2006. By decision of the Shareholders General Meeting held on 16 April 2008, book-entry bearer shares were converted into book-entry registered shares. The Group’s business consists essentially of:
-Mobile telecommunications operations; -Fixed telecommunications operations and Internet; -Multimedia; -Information systems consultancy.
The Group operates in Portugal and has some subsidiaries (from the information systems consultancy segment) operating in Brasil, United Kingdom, Irland, Poland, Australia and United States of America. Since 1 January 2001 all Group companies based in the Euro zone have adopted the Euro as their base currency for processing, systems and accounting. The consolidated financial statements are also presented in Euro, rounded at unit, and the transactions in foreign currencies are included in accordance with the accounting policies detailed below. 1. Basis of presentation The accompanying financial statements relate to the consolidated financial statements of the Sonaecom Group and have been prepared on a going concern basis, based on the accounting records of the companies included in the consolidation (Notes 2, 3 and 4) in accordance with International Financial Reporting Standards (“IAS/IFRS”) as adopted by the European Union (“EU”). These financial statements were prepared based on the acquisition cost, except for the revaluation of financial instruments. For Sonaecom, there are no differences between IFRS as adopted by European Union and IFRS published by the International Accounting Standards Board. Sonaecom adopted “IAS/IFRS” for the first time according to SIC 8 (First time adoption of IAS) on 1 January 2003. During the first quarter 2008, there were no changes in accounting policies in comparison with the accounting policies used in the consolidated financial statements at 31 December 2007. On 29 March 2007, with mandatory effect as from 1 January 2009, but with earlier adoption allowed, the IASB issued a revised IAS 23 – “Borrowing Costs”, which in relation to its previous version, eliminated the possibility of immediate recognition in the profit and loss statement of borrowing costs relating to assets that require a substantial period of time to be ready for use or sale. Sonaecom had already adopted the procedure of capitalizing such costs as part of the cost of the related assets and, consequently, the revision of this standard did not have any impact on the groups consolidated financial statements.
25

FIRST QUARTER 2008 RESULTS
Additionally, the following standards and interpretations were issued, but their application was not mandatory or the endorsement by the European Union has not occurred yet:
- Amendment IFRS 2 – “Share –based Payment” – (mandatory 1 January 2009); - Review of IFRS 3 – “Business concentration” – (mandatory at 1 July2009); - IFRS 8 – “Operating Segments” – (mandatory 1 January2009); - Review and Amendment IAS 1 – “Presentation of Financial Statements” – (mandatory 1 January 2009); - Review of IAS 23 – “Borrowing Costs” – (mandatory 1 January 2009); - Amendment IAS 27 – “Consolidated and Separate Financial Statements” – (mandatory 1 July 2009); - Amendment IAS 31 – “Interests in Joint Ventures” – (mandatory 1 July 2009); - Amendment IAS 32 – “Financial Instruments: Presentation” – (mandatory 1 January 2009); - IFRIC 12 – “Service Concession Arrangements” – (mandatory 1 January 2008); - IFRIC 13 – “Customer Loyalty Programmes” – (mandatory 1 July 2008); - IFRIC 14 – “IAS 19 – “The Limit on a Defined Benefit Asset, Minimum Funding Requirements and their Interaction” ” – (mandatory 1 January 2008).
At 31 March 2008, the Group has already adopted IFRIC 13, the other standards and interpretations not having a significant effect on the Group’s consolidated financial statements. Main accounting policies The main accounting policies used in the preparation of the accompanying consolidated financial statements are as follows: a) Investments in Group companies Investments in companies in which the Group has direct or indirect voting rights at Shareholders’ General Meetings, in excess of 50%, or in which it has control over the financial and operating policies (definition of control used by the Group) were fully consolidated in the accompanying consolidated financial statements. Third party participations in the shareholders’ equity and net results of those companies are recorded separately in the consolidated balance sheet and in the consolidated profit and loss statement, respectively, under the caption ‘Minority interests’. When losses attributable to minority shareholders exceed minority interests in shareholders’ funds of the subsidiaries, the Group absorbs the excess together with any additional losses, except when the minority shareholders have the obligation and are able to cover those losses. If subsidiaries subsequently report profits, the Group appropriates all the profits until the amount of the minority interests in the losses absorbed by the Group is recovered. In the acquisition of subsidiaries, the purchase method is applied. The results of subsidiaries bought or sold during the year are included in the profit and loss statement as from the date of acquisition (or of control acquisition) or up to the date of sale (or of control cession). Intra Group transactions, balances and dividends are eliminated. The expenses incurred with the acquisition of investments in Group companies are considered as part of the acquisition cost. The fully consolidated companies are listed in Note 2. b) Investments in associated companies Investments in associated companies (generally investments representing between 20% and 50% of a company’s share capital) are recorded using the equity method. In accordance with the equity method, investments are adjusted annually by the amount corresponding to the Group’s share of the net results of associated companies, against the corresponding entry to gain or loss for the year, and by the amount of dividends received, as well as by other changes in the equity of the
26

FIRST QUARTER 2008 RESULTS
associated companies, which are recorded by a corresponding entry to the caption ‘Other reserves’. An assessment of the investments in associated companies is performed annually, with the aim of detecting possible impairment situations. When the Group’s share of accumulated losses of an associated company exceeds the book value of the investment, the investment is recorded at nil value, except when the Group has assumed commitments to the associated company, in which case a provision is recorded under the caption ‘Provisions for other liabilities and charges’. Investments in associated companies are listed in Note 4. c) Companies jointly controlled The financial statements of companies jointly controlled have been consolidated in the accompanying financial statements by the proportional method, since their acquisition date. According to this method, assets, liabilities, income and costs of these companies have been included into the accompanying consolidated financial statements, in the proportion attributable to the Group. The excess of cost in relation to the fair value of identifiable assets and liabilities of the jointly controlled companies at the time of their acquisition is recorded as Goodwill (Note 9). If the difference between cost and the fair value of the net assets and liabilities acquired is negative, it is recognised as income for the period, after reconfirmation of the fair value of the identifiable assets and liabilities. The transactions, balances and dividends distributed among Group companies and jointly controlled companies are eliminated in the proportion attributable to the Group. The classification of financial investments as jointly controlled is determined, among other things, on the Shareholders’ Agreements that govern the jointly controlled companies. A detail of the companies jointly controlled is disclosed in Note 3. d) Tangible assets Tangible assets are recorded at their acquisition cost less accumulated depreciation and less estimated accumulated impairment losses. Depreciation is provided on a straight-line monthly basis as from the date the assets are available for use in the necessary conditions to operate as intended by the management, by a corresponding charge to the profit and loss statement caption ‘Depreciation and amortisation’. Impairment losses detected in the realization value of tangible assets are recorded in the year in which they arise, by a corresponding charge to the caption ‘Depreciation and amortisation’ of the profit and loss statement. The annual depreciation rates used correspond to the estimated useful life of the assets, which are as follows:
Years of useful life
Buildings 50Other constructions 10 - 20Network 10 - 20Other plant and machinery 8Vehicles 4Fixtures and fittings 3 - 10Tools 5 - 8Other tangible assets 4 - 8
27
FIRST QUARTER 2008 RESULTS
Current maintenance and repair costs of fixed assets are recorded as costs in the year in which they occur. Improvements of significant amount, which increase the estimated useful life of the assets, are capitalised and depreciated in accordance with the remaining estimated useful life of the corresponding assets. The estimated costs related with the mandatory dismantling and removal of tangible assets, incurred by the Group, are capitalised and amortised in accordance with the estimated useful life of the corresponding assets. Work in progress corresponds to fixed assets still in the construction/development stage which are recorded at their acquisition cost. These assets are depreciated as from the moment they are in condition to be used and when they are ready to operate as intended by the management. Good conditions in terms of network coverage and/or necessary quality and technical reliability to ensure minimum services are examples of conditions evaluated by the management. During the second half of 2007, based on independent specialised entity reports, the Group reassessed, on a prospective basis, the useful life of certain assets recorded under ‘Tangible assets’, (Note 6). e) Intangible assets ‘Intangible assets’ are recorded at their acquisition cost less accumulated amortisation and less estimated accumulated impairment losses. Intangible assets are only recognised if it is likely that they will bring future economic benefits to the Group, if the Group controls them and if their cost can be reasonably measured. Intangible assets correspond, essentially, to software (excluding the one included in tangible assets – telecommunication sites’ software), industrial property, costs incurred with the mobile network operator licenses (GSM and UMTS) and the fixed network operator licenses as well as the costs incurred with the acquisition of customer portfolios (value attributed under the purchase price allocation in business combinations). Amortisations are calculated on a straight-line monthly basis, over the estimated useful life of the assets (three to six years) as from the month in which the corresponding expenses are incurred. Mobile and fixed network operator licenses are amortised over the period for which they were granted (15 years). The UMTS license is being amortised on a straight-line basis for an 11 year period, which corresponds to the period between the commercial launch date and the maturity date of the license. Additional license costs, namely costs relating to the commitments assumed under the UMTS license, regarding the contributions to the “Information Society”, are amortised from the moment they are incurred up to the end of the license. The amortisation of the customer’s portfolios is provided on a straight-line basis over the estimated average retention period of the customers. Internally-generated intangible assets, namely research and development expenditures, are recognised in net income when incurred. Development expenditures can only be recognised initially as an intangible asset if the Group demonstrates the ability to complete the project and is able to put it in use or available for sale. Amortisation for the year is recorded in the profit and loss statement the caption ‘Depreciation and amortisation’. f) Brands and patents Brands and patents are recorded at their acquisition cost and are amortised on a straight-line basis over their respective estimated useful life. When the estimated useful life is undefined, they are not depreciated, but subject to annual impairment tests. g) Goodwill Differences between the cost of investments in subsidiaries and associated companies and the amount attributed to the fair value of their identifiable assets and liabilities at the time of their acquisition, when positive, are recorded under the caption ‘Goodwill’, and, when negative, after a reapreciation of its
28

FIRST QUARTER 2008 RESULTS
calculation, are recorded directly in the profit and loss statement. Until 1 January 2004, ‘Goodwill’ was amortised over the estimated period of recovery of the investments, usually ten years, and the annual amortisation was recorded in the profit and loss statement under the caption ‘Depreciation and amortisation’. Since 1 January 2004 and in accordance with the IFRS 3 – “Business Combinations”, the Group has ceased the amortisation of the ‘Goodwill’. Impairment losses of goodwill are recorded in the profit and loss statement for the year under the caption ‘Depreciation and amortisation’. In subsequent acquisitions of financial investments already held by the Group, an amount of Goodwill is registered equal to the difference between the acquisition cost of such financial investment and the proportional amount of the shareholders funds of the acquired company. h) Investments The Group classifies its investments in the following categories: ‘financial assets at fair value through profit or loss’, ‘loans and receivables’, ‘held-to-maturity investment’, and ‘available-for-sale financial assets’. The classification depends on the purpose for which the investments were acquired. The classification of the investments is determined at initial recognition and re-evaluated every quarter.
a) ‘Financial assets at fair value through profit or loss’ This category has two sub-categories: financial assets held for trading, and those designated at fair
value through profit or loss at inception. A financial asset is classified in this category if it is acquired principally for the purpose of selling in the short term or if the adoption of this method allows reducing or eliminating an accounting mismatch. Derivatives are also registered as held for trading unless they are designated as hedges. Assets in this category are classified as current assets if they are either held for trading or are expected to mature within twelve months of the balance sheet date.
b) ‘Loans and receivables’
Loans and receivables are non-derivative financial assets with fixed or variable payments that are not quoted in an active market. These financial investments arise when the Group provides money, goods or services directly to a debtor with no intention of trading the receivable. Loans and receivables are carried at amortised cost using the effective interest method, deducted from any impairment losses. Loans and receivables are recorded as current assets, except when its maturity is greater than twelve months from the balance sheet date, situation in which they are classified as non-current assets. Loans and receivables are included in the caption ‘trade debtors’ and ‘other current debtors’ in the balance sheet.
c) ‘Held-to-maturity investments’
Held-to-maturity investments are non-derivative financial assets with fixed or variable payments and with fixed maturities that the Group’s management has the positive intention and ability to hold until their maturity.
d) ‘Available-for-sale financial assets’
Available-for-sale financial assets are non-derivatives investments that are either designated in this category or not classified in any of the other above referred categories. They are included in non-current assets unless management intends to dispose them within twelve months of the balance sheet date.
Purchases and sales of investments are recognised on trade-date – the date on which the Group commits to purchase or sell the asset. Investments are initially recognised at fair value plus transaction costs for all financial assets not carried at fair value through profit or loss. The ‘Financial assets at fair value through profit or loss’ are initially recognised at fair value and the transaction costs are recorded in the income statement. Investments are derecognised when the rights to receive cash flows from the investments have expired or have been transferred substantially all the risks and rewards of its ownership.
29

FIRST QUARTER 2008 RESULTS
‘Available-for-sale financial assets’ and ‘Financial assets at fair value through profit or loss’ are subsequently carried at fair value. ‘Loans and receivables’ and ‘Held-to-maturity investments’ are carried at amortised cost using the effective interest method. Realised and unrealised gains and losses arising from changes in the fair value of financial assets classified at fair value through profit or loss are recognised in the income statement. Realised and unrealised gains and losses arising from changes in the fair value of non-monetary securities classified as available-for-sale are recognised in equity. When securities classified as available-for-sale are sold or impaired, the accumulated fair value adjustments are included in the income statement as gains or losses from investment securities. The fair value of quoted investments are based on current bid prices. If the market for a financial asset is not active (and for unlisted securities), the Group establishes fair value by using valuation techniques. These include the use of recent arm’s length transactions, reference to other instruments that are substantially the same, discounted cash flow analysis, and option pricing models refined to reflect the issuer’s specific circumstances. The fair value of listed investments is determined based on the closing Euronext share price at the balance sheet date. The Group assesses at each balance sheet date whether there is objective evidence that a financial asset or a group of financial assets is impaired. In case of equity securities classified as available for sale, a significant or prolonged decline (decline above 25% for two consecutive quarters) in the fair value of the security below its cost is considered in determining whether the securities are impaired. If any such evidence exists for available-for-sale financial assets, the cumulative loss – measured as the difference between the acquisition cost and the current fair value, less any impairment loss on that financial asset previously recognised in profit or loss – is removed from equity and recognised in the income statement. Impairment losses recognised in the income statement on equity instruments are not reversed through the income statement. i) Financial and operational leases Lease contracts are classified as financial leases, if, in substance, all risks and rewards associated with the detention of the leased asset are transferred by the lease contract or as operational leases, if, in substance, there is no transfer of risks and rewards associated with the detention of the leased assets. The lease contracts are classified as financial or operational in accordance with the substance and not with the form of the respective contracts. Fixed assets acquired under finance lease contracts and the related liabilities are recorded in accordance with the financial method. Under this method the tangible assets, the corresponding accumulated depreciation and the related liabilities are recorded in accordance with the contractual financial plan at fair value or, if less, at the present value of payments. In addition, interest included in lease payments and depreciation of the tangible assets are recognised as expenses in the profit and loss statement for the year to which they relate. Assets under long term rental contracts are recorded in accordance with the operational lease method. In accordance with this method, the rents paid are recognised as an expense, over the rental period. j) Inventories Inventories are stated at their acquisition cost, net of any impairment losses, which reflects its estimated net realisable value. Accumulated inventory impairment losses reflect the difference between the acquisition cost and the realisable amount of inventories, as well as the estimated impairment losses due to low turnover, obsolescence and deterioration (Note 18). k) Trade and other current debtors
30

FIRST QUARTER 2008 RESULTS
Trade and other current debtors are recorded at their net realisable value and do not include interests, because the discount effect is not significant. These financial investments arise when the Group provides money, supplies goods or provides services directly to a debtor with no intention of trading the receivable. The amount of this caption is presented net of any impairment losses. Future reversals of impairment losses are recorded in the profit and loss statement under the caption ‘Other operating revenues’. l) Cash and cash equivalents Amounts included under the caption ‘Cash and cash equivalents’ correspond to amounts held in cash and term bank deposits and other treasury applications where the risk of any change in value is insignificant. The consolidated cash flow statement has been prepared in accordance with IAS 7, using the direct method. The Group classifies in the caption ‘Cash and cash equivalents’, investments that mature in less than three months, for which the risk of change in value is insignificant. The caption ‘Cash and cash equivalents’ in the cash flow statement also includes bank overdrafts, which are reflected in the balance sheet caption ‘Short-term loans and other loans’. The cash flow statement is classified by operating, financing and investing activities. Operating activities include collections from customers, payments to suppliers, payments to personnel and other captions relating to operating activities. Cash flows from investing activities include the acquisition and sale of investments in associated and subsidiaries companies and receipts and payments resulting from the purchase and sale of fixed assets. Cash flows from financing activities include payments and receipts relating to loans obtained and finance lease contracts. All amounts included under this caption are likely to be realised in the short term and there are no amounts given or pledged as guarantee. m) Loans Loans are recorded as liabilities by the “amortised cost”. Any expenses incurred in setting up loans are recorded as a deduction to the nominal debt and recognised during the period of the financing, based on the effective interest rate method. The interests incurred but not yet due are added to the loans caption until their payment. n) Financial expenses relating to loans obtained Financial expenses relating to loans obtained are generally recognised as expenses at the time they are incurred. Financial expenses relating to loans obtained directly for the acquisition, construction or production of fixed assets are capitalised as part of the cost of the assets. These expenses are capitalised starting from the time of preparation for the construction or development of the asset. The capitalization is interrupted when the assets are operating or at the end of the production or construction phases or when the associated project is suspended. o) Derivatives The Group only uses derivatives in the management of its financial risks to hedge against such risks. The Group does not use derivatives for trading purposes. The cash flow hedges used by the Group are related to interest rate swap operations to hedge against interest rate risks on loans obtained. The amounts, interest payment dates and repayment dates of the underlying interest rate swaps are similar in all respects to the conditions established for the contracted loans. Changes in the fair value of cash flow hedges are recorded in assets or liabilities, against a corresponding entry under the caption ‘Hedging reserves’ in shareholders’ funds.
31

FIRST QUARTER 2008 RESULTS
In cases where the hedge instrument is not effective, the amounts that arise from the adjustments to fair value are recorded directly in the profit and loss statement. p) Provisions and contingencies Provisions are recognised when, and only when, the Group has a present obligation (either legal or implicit) resulting from a past event, the resolution of which is likely to involve the disbursement of funds by an amount that can be reasonably estimated. Provisions are reviewed at the balance sheet date and adjusted to reflect the best estimate at that date. Provisions for restructurings are only registered if the Group has a detailed plan and if that plan has already been communicated to the parties involved. Contingent liabilities are not recognised in the consolidated financial statements but are disclosed in the notes, if the possibility of a cash outflow affecting future economic benefits is not remote. Contingent assets are not recognised in the consolidated financial statements but are disclosed in the notes when future economic benefits are likely to occur. q) Income tax Income tax for the year is determined based on the taxable results of the companies included in the consolidation and takes into consideration deferred taxation. Current income tax is determined based on the taxable results of the companies included in the consolidation, in accordance with the tax regulations in force in the location of the head office of each Group company. Deferred taxes are calculated using the liability method and reflect the timing differences between the amount of assets and liabilities for accounting purposes and the respective amounts for tax purposes. Deferred tax assets are only recognised when there is reasonable expectation that sufficient taxable profits shall arise in the future to allow such deferred tax assets to be used. At the end of each year a review is made of the recorded and unrecorded deferred tax assets and they are reduced whenever their realisation ceases to be probable, or recorded if it is probable that taxable profits will be generated in the future to enable them to be recovered (Note 11). Deferred taxes are calculated with the tax rate that is expected to be in effect at the time the asset or liability is used. Whenever deferred taxes derive from assets or liabilities directly registered in Shareholders’ funds, its recording is also made in Shareholders’ funds caption. In all other situations, deferred taxes are always registered in the profit and loss statement. r) Government subsidies Subsidies awarded to finance personnel training are recognised as income during the period in which the Group incurs the associated costs and are included in the profit and loss statement as a deduction to such costs. Subsidies awarded to finance investments in tangible assets are registered as deferred income and are included in the profit and loss statement during the estimated useful life of the corresponding assets.
32

FIRST QUARTER 2008 RESULTS
s) Accrual basis and revenue recognition Expenses and income are recorded in the year to which they relate, regardless of their date of payment or receipt. Estimated amounts are used when actual amounts are not known. The captions of ‘Other non-current assets’, ‘Other current assets’, ‘Other non-current liabilities’ and ‘Other current liabilities’ include expenses and income relating to the current period, where payment and receipt will occur in future periods, as well as payments and receipts in the current period but which relate to future periods. The latter shall be included, by the corresponding amount, in the results of the periods that they relate to. Revenue from telecommunications services is recognised in the period in which it occurs. Such services are invoiced on a monthly basis. Revenues not yet invoiced, from the last invoicing cycle to the end of the month, are estimated and recorded based on actual traffic. Differences between the estimated and actual amounts, which are usually not material, are recorded in the following period. Sales revenues are recognised in the consolidated profit and loss statement when the significant risks and rewards associated with the ownership of the assets are transferred to the buyer and the amount of the corresponding revenue can be reasonably quantified. Sales are recognised net of taxes and discounts. The income related to pre-paid cards is recognised whenever the minutes are used. At the end of each period the minutes still to be used are estimated and the amount of income associated with those minutes is deferred. Costs relating to customer loyalty programmes, under which points are awarded by the subsidiary Sonaecom – Serviços de Comunicações, S.A., are calculated taking in consideration the probability of the redemption of the points, and are recognised, as a deduction to income, at the time the points are generated, by a corresponding entry in the caption ‘Other current liabilities’. The revenues and costs of the consultancy projects developed in the area of information systems, are recognized in each period, according to the percentage of completion method. Non-current financial assets and liabilities are recorded at fair value and, in each period, the financial actualisation of the fair value is recorded in the profit and loss statement under the caption ‘Other financial expenses’ and ‘Other financial income’. Dividends are recognised when the shareholders rights to receive such amounts are appropriately established and communicated. t) Balance sheet classification Assets and liabilities due in more than one year from the date of the balance sheet are classified, respectively, as non-current assets and non-current liabilities. In addition, considering their nature, the deferred taxes and the provisions for other liabilities and charges, are classified as non current assets and liabilities (Notes 11 and 17). u) Reserves Share premiums The Share premiums relates to premiums generated in the issuance of capital or in capital increases. According to Portuguese law, Share Premiums follow the same requirements of ‘Legal reserves’, i.e., they are not distributable, except in case of liquidation, but they can be used to absorb losses, after all the other reserves are exhausted or to increase share capital. Legal Reserve Portuguese commercial legislation requires that at least 5% of the annual net profit must be appropriated to a legal reserve, until such reserve reaches at least 20% of the share capital. This reserve is not distributable, except in the case of liquidation of the Company, but may be used to absorb losses, after all the other reserves are exhausted, or to increase the share capital.
33

FIRST QUARTER 2008 RESULTS
Reserves - Medium Term Incentive Plans According to IFRS 2, the responsibility related with the equity settled plans is registered under the heading of Medium Term Incentive Plan Reserves, which are not distributable and which can not be used to absorb losses. Hedging reserve Hedging reserve reflects the changes in fair value of “cash flow” hedging derivates that are considered effective (Note 1.o) and it is not distributable nor can it be used to absorb losses. Own Shares reserve The own shares reserve reflects the acquisition value of the own shares and follows the same requirements of legal reserves. Under Portuguese law, the amount of distributable reserves is determined in accordance with the individual financial statements of the Company, presented in accordance with IAS/IFRS. At 31 March 2008, Sonaecom, SGPS, S.A., did not have any reserves which by their nature could be considered as distributable. v) Own Shares Own shares are recorded as a deduction of shareholders funds. Gains or losses related to the sale of own shares are recorded under the heading "Other Reserves”. w) Foreign currency All assets and liabilities expressed in foreign currency were translated into Euro using the exchange rates in force on the balance sheet date. Favourable and unfavourable foreign exchange differences resulting from changes in the rates in force at transaction date and those in force at the date of collection, payment or at the balance sheet date are recorded as income and expenses in the consolidated profit and loss statement of the year, in financial results. Entities operating abroad with organisational, economic and financial autonomy are treated as foreign entities. Assets and liabilities of the financial statements of foreign entities are translated into Euro using the rates of exchange in force on the balance sheet date, while expenses and income in such financial statements are translated into Euro using the average rate of exchange for the year. The resulting exchange differences are recorded in the shareholders’ funds caption ‘Other reserves’. Goodwill and adjustments to fair value generated in the acquisitions of foreign entities reporting in a functional currency other than Euro are translated into Euro using the exchange rates prevailing on the balance sheet date. The following rates were used to translate into Euro the financial statements of foreign subsidiaries:
31.03.2008 Average 31.03.2007 Average
Pounds Sterling 1.25660 1.32128 1.47102 1.49142Brazilian Real 0.36292 0.38462 0.36898 0.36207American Dollar 0.63243 0.66840 - -Zloti (Poland) 0.28393 0.27959 - -Australian Dollar 0.57690 0.60537 - -
2008 2007
34

FIRST QUARTER 2008 RESULTS
x) Assets impairment Impairment tests are performed at the date of each balance sheet and whenever an event or change of circumstances indicates that the recorded amount of an asset may not be recoverable. Whenever the book value of an asset is greater than the amount recoverable, an impairment loss is recognised and recorded in the profit and loss statement under the caption ‘Depreciation and amortisation’ in the case of fixed assets and goodwill, under the caption ‘Other financial expenses’ in the case of financial investments or under the caption ‘Provisions and impairment losses’, in relation to the other assets. The amount recoverable is the greater of the net selling price and the value of use. Net selling price is the amount obtainable upon the sale of an asset in a transaction within the capability of the parties involved, less the costs directly related to the sale. The value of use is the present amount of the estimated future cash flows expected to result from the continued use of the asset and of its sale at the end of its useful life. The recoverable value is estimated for each asset individually or, if this is not possible, for the cash-generating unit to which the asset belongs. Evidence of the existence of impairment in accounts receivables appears when: - the counterparty presents significant financial difficulties;
- there are significant delays in interest payments and in other leading payments from the counterparty;
- it is probable that the debtor goes into liquidation or into a financial restructuring. For certain categories of financial assets for which it is not possible to determine the impairment for each asset individually, the analysis is made for a group of assets. Evidence of an impairment loss in a portfolio of accounts receivable may include past experience in terms of collections, increasing number of delays in collections, as well as changes in national or local economic conditions that are related with the collections capacity. For Goodwill and Financial Investments, the recoverable amount is determined based on business plans duly approved by the Group’s Board of Directors and supported by reports prepared by independent entities. For accounts receivables, the Group uses historical and statistic information to estimate the amounts in impairment. For inventories, the impairment is calculated based on market evidence and several indicators of stock rotation. y) Medium Term Incentive Plans The Accounting Treatment of Medium Term Incentive Plans is based on IFRS 2 – “Share-based Payments”. Under IFRS 2, when the settlement of plans established by the Group involves the delivery of Sonaecom’s own shares, the estimated responsibility is recorded, as a credit entry, under the caption ‘Reserves – Medium Term Incentive Plans’, within the heading ‘Shareholders’ funds’ and is charged as an expense under the caption ‘Staff expenses’ in the profit and loss statement. The quantification of this responsibility is based on fair value and is recognised over the vesting period of each plan (from the award date of the plan until its vesting or settlement date). The total responsibility, at any point of time, is calculated based on the proportion of the vesting period that has “elapsed” up to the respective accounting date. When the responsibilities associated with any plan are covered by a hedging contract, i.e., when those responsibilities are replaced by a fixed amount payable to a third party and when Sonaecom is no longer the party that will deliver the Sonaecom shares, at the settlement date of each plan, the above accounting treatment is subject to the following changes:
a) The total gross fixed amount payable to third parties is recorded in the balance sheet as either ‘Other non current liabilities’ or ‘Other current liabilities’;
b) The part of this responsibility that has not yet been recognised in the profit and loss statement (the “unelapsed” proportion of the cost of each plan) is deferred and is recorded, in the balance sheet as either ‘Other non current assets’ or ‘Other current assets’;
c) The net effect of the entries in (a) and (b) above eliminate the original entry to ‘Shareholders’ funds’;
35
FIRST QUARTER 2008 RESULTS
d) In the profit and loss statement, the “elapsed” proportion continues to be charged as an expense under the caption ‘Staff expenses’.
Equity-settled plans to be liquidated through the delivery of shares of the parent company are recorded as if they were settled in cash, which means that the estimated liability is recorded in the balance sheet captions ‘Other non current liabilities’ and ‘Other current liabilities’ by a corresponding entry to the income statement caption ‘Staff expenses’, for the cost relating to the deferred period elapsed. The liability is quantified based on the fair value of the shares as of each balance sheet date. When the liability is covered by a hedging contract, it is recognised in the same way as described above, but with the liability being quantified based on the amount fixed in the contract. At 31 March 2008, only one of Sonaecom’s share plans was covered by detention of own shares. The other two plans were not covered. Therefore, the impacts of the share plans of the Medium Term Incentive Plans are registered, in the balance sheet, in the caption ‘Reserve - Medium Term Incentive Plans’. The cost is recognised in the income statement caption ‘Staff expenses’. In relation to the two plans which shall be liquidated through the delivery of shares of the parent company, the Group signed contracts with an external entity, under which the price for the acquisition of those shares was fixed. The responsibility associated to those plans is recorded based on that fixed price, proportionally to the period of time elapsed since the award date until the accounting date. For the non-covered plan, the responsibility has been recorded based on its fair value at the balance sheet date, in proportion to the period of time elapsed from the date the benefit is attributed to the date it is recorded. z) Subsequent events Events occurring after the date of the balance sheet which provide additional information about conditions prevailing at the time of the balance sheet (adjusting events) are reflected in the consolidated financial statements. Events occurring after the balance sheet date that provide information on post-balance sheet conditions (non adjusting events), when material, are disclosed in the notes to the consolidated financial statements. aa) Judgements and estimates The most significant accounting estimates reflected in the consolidated financial statements as at 31 March 2008 and 2007, are as follows:
a) Useful lives of tangible and intangible assets; b) Impairment analysis of goodwill and of other tangible and intangible assets; c) Recognition of impairment losses on assets and provisions; d) Assessment of the responsibilities associated with the customers’ loyalty programs.
Estimates used are based on the best information available during the preparation of the consolidated financial statements and are based on the best knowledge of past and present events. Although future events, are not controlled by the Group neither foreseeable, some could occur and have impact on the estimates. Changes to the estimates used by the management that occur after the approval date of these consolidated financial statements, will be recognised in net income, in accordance with IAS 8, using a prospective methodology. The main estimates and assumptions in relation to future events included in the preparation of these consolidated financial statements are disclosed in the correspondent notes. ab) Financial risk management The Group’s activities expose it to a variety of financial risks such as market risk, liquidity risk and credit risk. Those risks arise from the unpredictability of financial markets that affect the capacity of project cash flows and profits. The Group financial risk management, subject to a perspective of long term ongoing, seeks to
36

FIRST QUARTER 2008 RESULTS
minimize potential adverse effects that derive from that uncertainty, using, every time that is possible and advisable, derivative financial instruments to hedge certain risks exposure ( Note 1. o)). Market risk a. Foreign exchange risk The Group operates internationally, having subsidiaries that operate in Brazil, United Kingdom, Ireland, Poland, United States of America and Australia and so it is exposed to foreign exchange rate risk. Foreign exchange risk management seeks to minimize the volatility of investments and transactions made in foreign currency and contributes to reduce the sensitivity of Group results to changes in foreign exchange rates. Whenever possible, the Group uses natural hedges to manage exposure, by offsetting credits granted and credits received expressed in the same currency. When such procedure is not possible, the Group adopts derivatives financial hedging instruments. The Group's exposure to the foreign exchange rate risk, results essentially from the fact that some of its subsidiaries report in a currency different from Euro, being the risk of operational activity immaterial. b. Interest rate risk Sonaecom’s total debt is indexed to variable rates, exposing the total cost of debt to a high risk of volatility. The impact of this volatility in the Group results or in its shareholders´ funds is mitigated by the effect of the following factors (i) relatively low level of financial leverage; (ii) possibility to use derivative instruments that hedge the interest rate risk, as mentioned below; (iii) possible correlation between the level of market interest rates and economic growth having this one a positive effect in other lines of the Group’s results (particularly in operational), and in this way partially offsetting the increase of the financial costs ("natural hedge"); and (iv) the existence of stand alone or consolidated liquidity which is also bearing interest at variable rate. The Group only uses derivatives or similar transactions to hedge those interest rate risks considered as significant. Three main principles are respected in all instruments selected and used to hedge interest rate risk:
• For each derivative or instrument used to hedge a specific loan, the interest payment dates on the loans subject to the hedging must equalize with the settlement dates under the hedging instrument;
• Perfect match between the base rates: the base rate used in the derivative or hedging instrument should be the same as that of the facility / transaction which is being hedged;
• As from the start of the transaction, the maximum cost of the debt, resulting from the hedging operation is known and limited, even in scenarios of extreme changes in market interest rates, so that the resulting rates are within the cost of the funds considered in the Group’s business plan.
As all Sonaecom’s borrowings (Note 16) are at variable rates, interest rate swaps and other derivatives are used to hedge future changes in cash flow relating to interest payments. Interest rate swaps have the financial effect of converting the respective borrowings from floating rates to fixed rates. Under the interest rate swaps, the Company agrees with third parties (banks) to exchange, in pre-determined periods, the difference between the amount of interest calculated at the fixed contract rate and the floating rate at the time of re-fixing, by reference to the respective agreed notional amounts. The counterparties of the derivative hedging instruments are limited to highly rated financial institutions, being the Group’s policy, when contracting such instruments, to give preference to financial institutions that form part of its financing transactions. In order to select the counterparty for occasional operations, Sonaecom requests proposals and indicative prices from a representative number of banks in order to ensure adequate competitiveness of these operations. In determining the fair value of hedging operations, the Group uses certain methods, such as option valuation and discounted future cash flow models, using assumptions based on market interest rates
37

FIRST QUARTER 2008 RESULTS
prevailing at the balance sheet date. Comparative financial institution quotes for the specific or similar instruments are used as a benchmark for the valuation. The fair value of the derivatives contracted, that are considered as fair value hedges or the ones that are considered not sufficiently effective for cash flow hedge (in accordance with the provisions established in IAS 39), is recognised under borrowings captions and changes in the fair value of such derivatives are recognised directly in the profit and loss statement for the year. The fair value of derivatives of cash flow hedge, that are considered effective according to IAS 39, is recognised under borrowing captions and changes in the fair value are recognised in equity. Sonaecom Board of Directors approves the terms and conditions of the financing with significant impact in the Group, based on the analysis of the debt structure, the risks and the different options in the market, particularly as to the type of interest rate (fixed /variable). Under the policy defined above, the Executive Committee is responsible for the decision on the occasional interest rate hedging contracts, through the monitoring of the conditions and alternatives existing in the market. c. Liquidity risk The existence of liquidity in the Group requires the definition of some policies for an efficient and secure management of the liquidity, allowing to maximize the profitability and to minimize the opportunity costs related with that liquidity. The liquidity risk management has a threefold objective: (i) Liquidity, i.e., to ensure the permanent access in the most efficient way to obtain sufficient funds to settle current payments in the respective dates of maturity as well as any eventual not forecasted requests for funds, in the deadlines set for this; (ii) Safety, i.e, to minimize the probability of default in any reimbursement of application of funds; and (iii) Financial Efficiency, i.e., to ensure that the Group maximizes the value / minimizes the opportunity cost of holding excess liquidity in the short term. The main underlying policies correspond to the variety of instruments allowed, the maximum acceptable level of risk, the maximum amount of exposure by counterparty and the maximum periods for investments. The existing liquidity in the Group should be applied to the alternatives and by the order described below:
i. Amortization of short term debt- after comparing the opportunity cost of amortization and the opportunity cost related to alternative investments;
ii. Consolidated management of liquidity - the existing liquidity in Group companies, should mainly be applied in Group companies, to reduced the use of bank debt at a consolidated level;
iii. Applications in the market. The applications in the market are limited to eligible counterparties, with ratings previously established by the Board and limited to certain maximum amounts by counterparty. The definition of maximum amounts intends to assure that the application of liquidity in excess is made in a prudent way and taking in consideration the best practices in terms of bank relationships. The maturity of applications should equalize the forecasted payments (or the applications should be easily convertible, in case of assets investments, to allow urgent and not estimated payments), considering a threshold for eventual deviations on the estimates. The threshold depends on the accuracy level of treasury estimates and would be determined by the business. The accuracy of the estimates is a determinant variable to quantify the amounts and the maturity of the applications in the market. The maturity analysis for the loans obtained is presented in the Note 16. d. Credit Risk The Goup’s exposure to credit risk is mainly associated with the accounts receivable related to current operational activities. The credit risk associated to financial operations is mitigated by the fact that the Group only negotiates with entities with high credit quality.
38

FIRST QUARTER 2008 RESULTS
The management of this risk seeks to guarantee that the amounts owing are effectively collected within the periods negotiated without affecting the financial health of the Group. The Group uses credit rating agencies and has specific departments responsible for risk control, collections and management of processes in litigation, which all contribute to the mitigation of credit risk. The amounts included in the financial statements related to trade debtors and other debtors, net from impairment losses, represent the maximum exposure of the Group to credit risk.
39

FIRST QUARTER 2008 RESULTS
2. Companies included in the consolidation Group companies included in the consolidation through full consolidation method, their head offices, main activity, shareholders and percentage of share capital held at 31 March 2008 and 2007, are as follows:
Company(Commercial Brand) Head Office Main activity Shareholder Direct Effective* Direct Effective*
Parent company:
SONAECOM, S.G.P.S., S.A. (“Sonaecom”)
Maia Management of shareholdings. - - - - -
Subsidiary:
Be Artis - Concepção, Construção e Gestão de Redes de Comunicações, S.A. ("Artis") (a) (b)
Maia Design, construction, management and exploitation of electronic communications networks and their equipment and infrastructure,management of technologic assets and rendering of related services.
Sonaecom 100% 100% - -
Sonaecom Serviços de
Comunicações
100% 100% - -
Optimus - - 100% 100%
Cape AsiaPac PTY Limited ("Cape Asia") (d)
New South Wales
Rendering of consultancy services in the area of information systems.
Cape Technologies
100% 100% - -
Cape Poland Sp. Z.o.o. ("Cape Poland") (d)
Posnan Rendering of consultancy services in the area of information systems.
Cape Technologies
100% 100% - -
Cape Technologies Americas, Inc ("Cape America") (d)
Delaware Rendering of consultancy services in the area of information systems.
Cape Technologies
100% 100% - -
Cape Technologies Limited ("Cape Technologies") (d)
Dublin Rendering of consultancy services in the area of information systems.
We Do 100% 100% - -
Cape Technologies (UK) Limited ("Cape UK") (d)
Cardiff Rendering of consultancy services in the area of information systems.
Cape Technologies
100% 100% - -
Digitmarket – Sistemas de Informação, S.A. (“Digitmarket” – usando a marca “Bizdirect”)
Maia Development of management platformsand commercialisation of products,services and information, with the internetas its main support.
Sonae.com Sistemas deInformação
75.10% 75.10% 75.10% 75.10%
Mainroad – Serviços em Tecnologias de Informação, S.A.(“Mainroad”)
Maia Rendering of consultancy services in ITareas.
Sonae.com Sistemas de Informação
100% 100% 100% 100%
* Sonaecom effective participation(a) Company formerly known as "Optimus Artis - Concepção, Construção e Gestão de Redes de Comunicações, S.A.".(b) Company established in October 2007.(c) Company formerly known as "Optimus Towering – Exploração de Torres de Telecomunicações, S.A.".(d) Companies acquired in October 2007.
Percentage of share capital held
2008 2007
Be Towering – Exploração de Torres de Telecomunicações, S.A. (“Be Towering” ) (c)
Maia Implementation, installation and exploitation of towers and other sites for the instalment of telecommunications equipment.
40

FIRST QUARTER 2008 RESULTS
Company(Commercial Brand) Head Office Main activity Shareholder Direct Effective* Direct Effective*
Miauger – Organização e Gestão de Leilões Electrónicos, S.A.(“Miauger”)
Maia Organisation and management ofelectronic auctions of products andservices on-line.
Sonaecom 100% 100% 100% 100%
M3G – Edições Digitais, S.A. (“M3G”)
Lisbon Digital publishing, electronic publishing and production of Internet contents.
Público 100% 100% 100% 99%
Sonae Telecom 49.06% 49.06%
Sonaecom 50.94% 50.94%
Maia Sonaecom Serviços de
Comunicações
100% 100% - -
Optimus - - 100% 100%
Praesidium Holdings Limited ("Praesisium Hld") (a)
Berkshire Management of shareholdings. We Do 100% 100% - -
Praesidium Services Limited ("Praesidium Services") (a)
Berkshire Rendering of consultancy services in the area of information systems.
Praesidium Hld 100% 100% - -
Praesidium Technologies Limited ("Praesidium Technologies") (a)
Berkshire Rendering of consultancy services in the area of information systems.
Praesidium Hld 100% 100% - -
Público – Comunicação Social, S.A. (“Público”)
Oporto Editing, composition and publication ofperiodical and non-periodical material.
Sonaetelecom BV
100% 100% 99% 99%
Saphety Level – Trusted Services, S.A. (Saphety)
Maia Rendering services, training, consultancyservices in the area of communication,process and electronic certification of data;trade, development and representation ofsoftware.
Sonae.com Sistemas de Informação
100% 100% 100% 100%
Sonaecom BV Amsterdam Management of shareholdings. Sonaecom 100% 100% 100% 100%
Maia Sonaecom 53.54% 53.54% 58.33% 58.33%
Sonae Telecom 37.94% 37.94% - -
Sonaecom BV 8.52% 8.52% - -
Sonae Matrix - - 41.67% 41.67%
Sonae.com - Sistemas de Informação, S.G.P.S., S.A. (“Sonae.com Sistemas de Informação”)
Maia Management of shareholdings in the areaof corporate ventures and joint ventures.
Sonaecom 100% 100% 100% 100%
Sonae Matrix Multimédia, S.G.P.S., S.A. (“Sonae Matrix”)
Maia Management of shareholdings in the area of multimedia trade.
Sonaecom 100% 100%
(d) Companies acquired in October 2007.* Sonaecom effective participation
Sonaecom - Serviços de Comunicações, S.A. ("Novis" e "Optimus")
Implementation, operation, exploitation and offer of networks and rendering services of electronic comunications and related resources; offer and commercialisation of products and equipments of electronic communications.
(Liquidated)
Percentage of share capital held
2008 2007
Optimus – Telecomunicações, S.A. (“Optimus”)
Maia Rendering of mobile telecommunicationsservices and the establishment,management and operation oftelecommunications networks.
(Merged)
Per-Mar – Sociedade de Construções, S.A. (“Per-Mar”)
Purchase, sale, renting and operation ofproperty and commercial establishments.
41

FIRST QUARTER 2008 RESULTS
Company(Commercial Brand) Head Office Main activity Shareholder Direct Effective* Direct Effective*
Sonae Telecom, S.G.P.S., S.A. (“Sonae Telecom”)
Maia Management of shareholdings in the areaof mobile telecommunications.
Sonaecom 100% 100% 100% 100%
Sonaetelecom BV Amsterdam Management of shareholdings. Sonaecom 100% 100% 100% 100%
Tecnológica Telecomunicações, LTDA. ("Tecnológica") (a)
Rio de Janeiro
Rendering of consultancy and technical assistance in the area of IT systems and telecommunications.
We Do Brasil 99.99% 99.90% - -
Telemilénio Telecomunicações - Sociedade Unipessoal, Lda. ("Tele2") (b)
Lisbon Rendering of mobile telecommunications services, including fixed telecommunications and internet service.
Sonaecom 100% 100% - -
We Do Consulting – Sistemas de Informação, S.A. (“We Do”)
Maia Rendering of consultancy services in thearea of information systems.
Sonae.com Sistemas de Informação
100% 100% 99.08% 99.08%
Wedo do Brasil Soluções Informáticas, Ltda.(“We Do Brasil”)
Rio de Janeiro
Commercialisation of software andhardware. Rendering of consultancy andtechnical assistance related toinformation technology and dataprocessing.
We Do 99.91% 99.91% 99.91% 98.99%
(a) Company acquired in April 2007.(b) Company acquired in September 2007.
* Sonaecom effective participation
Percentage of share capital held
2008 2007
All the above companies were included in the consolidation in accordance with the full consolidation method under the terms of IAS 27 (majority of voting rights, through the ownership of shares in the companies). 3. Companies jointly controlled At 31 March 2008, the Group jointly controlles and consolidates through the proportional method the following companies:
Company(Commercial Brand) Head Office Main activity Shareholder Direct Effective* Direct Effective*
Vipu Ace ("Sexta") (a) Lisbon Optimization of resources for activity of editing of periodic contents for revisions in paper to digital media, video or TV.
Público 50% 50% - -
(a) Joint venture established in October 2007* Sonaecom effective participation
Percentage of share capital held2008 2007
42

FIRST QUARTER 2008 RESULTS
At 31 March 2008, the main contributes from this jointly controlled entity to the consolidated accounts of the Group are as follows (debit/ (credit)):
2008
Non current assets 13,138Current assets 75,219Current liabilities -304,296 Net results 206,357Total revenues -111,941 Total costs 318,298
4. Investments in associated companies At 31 March 2008 and 2007, this caption included investments in associated companies, which head offices, main activities, shareholders, percentage of share capital held and book value were as follows:
Company(Commercial brand) Head Office Main activity Shareholder Direct Effective* Direct Effective* 2008 2007
Associated companies:
Net Mall, S.G.P.S., S.A. (“Net Mall”)
Maia Management of shareholdings.
Sonae.Com Sistemas de Informação
39.51% 39.51% 39.51% 39.51% (a) (a)
Sociedade Independente de Radiodifusão Sonora, S.A. (“S.I.R.S.” – using the brand name “ Rádio Nova”)
Oporto Sound broadcasting.Radio station.
Público 45% 45% 45% 45% (a) (a)
,Unipress – Centro Gráfico, Lda. (“Unipress”)
V.N. Gaia Trade and industry ofgraphic design andpublishing.
Público 40% 40% 40% 40% 757,069 735,613
Profimetrics – Software Solutions, S.A.(Profimetrics)
Maia Development of software solutions tooptimize the retailsales.
Sonae.comSistemas de Informação
30% 30% - (a)
757,069 735,613
(a) Investment recorded at a nil book value* Sonaecom effective participation
Book valuePercentage of share capital held
2008 2007
(Sold)
At 31 March 2008 and 2007 the movement occurred in the caption investments in associated companies refers to the application of the equity method to Unipress. The associated companies were included in the consolidated financial statements in accordance with the equity method, as referred in Note 1. b). It was not necessary to make any adjustment between the accounting policies of the associated companies and the Group accounting policies, since there were no significant differences.
43

FIRST QUARTER 2008 RESULTS
At 31 March of 2008, the assets, liabilities, total revenues and net results of associated companies were as follows:
Company Assets Liabilities Total revenues Net results
Unipress - Centro Gráfico, Lda (1) 9,828,695 7,947,107 3,581,171 53,639Sociedade Independente de Radiodifusão Sonora, S.A. 535,583 551,012 301,060 28,663Netmall, S.G.P.S., S.A. 14,573 21,060 55 (770)
(1) Values at 31.12.2007
5. Changes in the Group 5. a) Acquistions During the period ended 31 March 2008, no changes occurred in the Group as a result of new acquisitions. Related to the period ended 31 March 2007, the following changes occurred in the composition of the Group:
Purchaser Subsidiary Date % acquiredCurrent %
shareholding
Sonae.com SI We Do Jan-07 0.70% 98.36%Sonae.com SI We Do Feb-07 0.66% 99.02%Sonae.com SI We Do Mar-07 0.06% 99.08%
2007
During the period ended 31 March 2007 and as a result of the above mentioned acquisitions, additional Goodwill of Euro 177,778 was recorded (Note 9). 5. b) Others On 1 November 2007, occurred the merger of Optimus into Novis, i.e., the merger of the mobile and fixed telecommunications divisions was completed. This operation represented an internal reorganization and a natural step in the development of the integrated telecommunications strategy which intends to: (i) reinforce the Group’s growth strategy both in organic and non organic terms; (ii) position the organisation to be able to anticipate and react to market trends that are moving more and more towards Fixed/Mobile convergence; (iii) facilitate the further development of new products and services; and (iv) improve operating efficiencies and reduce costs.
44

FIRST QUARTER 2008 RESULTS
6. Tangible Assets The movement in tangible assets and in the corresponding accumulated depreciation and impairment losses in the periods ended 31 March 2008 and 2007 was as follows:
Land
Buildings and other
constructionsPlant and machinery Vehicles
Fixtures and fittings Tools
Other tangible assets Work in progress Total
GROSS ASSETS
Balance at 31.12.2007 1,391,593 235,216,110 842,983,026 129,546 143,432,036 1,096,920 2,728,382 36,846,800 1,263,824,413
Additions - 395,276 1,473,859 5,030 2,555,245 - 1,400,021 23,210,965 29,040,396
Disposals - (5,156) (60,537) (8,554) (220,343) - - - (294,590)
Transfers and write-offs - 1,831,346 12,034,154 - 854,348 10,135 1,851 (14,803,694) (71,860)
Balance at 31.03.2008 1,391,593 237,437,576 856,430,502 126,022 146,621,286 1,107,055 4,130,254 45,254,071 1,292,498,359
Balance at 31.12.2007 - 118,050,343 492,489,934 94,160 116,612,257 1,040,128 2,371,081 - 730,657,903
Depreciation for the year - 3,133,902 21,110,996 6,634 3,754,283 5,619 116,981 - 28,128,415
Disposals - (71) (3,305) (741) (76,896) - - - (81,013)
Transfers and write-offs - 60,000 (1,400) 1 (10,648) - 1,575 - 49,528
Balance at 31.03.2008 - 121,244,174 513,596,225 100,054 120,278,996 1,045,747 2,489,637 - 758,754,833
Net value 1,391,593 116,193,402 342,834,277 25,968 26,342,290 61,308 1,640,617 45,254,071 533,743,526
ACCUMULATED DEPRECIATION AND IMPAIRMENT LOSSES:
Land
Buildings and other
constructionsPlant and machinery Vehicles
Fixtures and fittings Tools
Other tangible assets Work in progress Total
GROSS ASSETS
Balance at 31.12.2006 1,391,593 223,133,165 744,209,079 53,271 134,075,541 1,087,839 2,567,599 22,560,357 1,129,078,444
Additions - 978,239 813,990 13,522 106,991 - 8,270 24,275,820 26,196,832
Disposals - (73,098) (189,545) (30,506) (10,024) - - (9,972) (313,145)
Transfers and write-offs - 2,977,268 23,367,827 19,321 1,336,126 - - (26,989,057) 711,485
Balance at 31.03. 2007 1,391,593 227,015,574 768,201,351 55,608 135,508,634 1,087,839 2,575,869 19,837,148 1,155,673,616
Balance at 31.12. 2006 - 108,987,153 418,800,773 48,768 103,280,214 1,021,794 2,168,000 - 634,306,702
Depreciation for the year - 5,439,213 19,845,409 507 3,595,227 4,899 54,463 - 28,939,718
Reversal of impairment losses in the year - (8,863) (120,207) - (79,516) (228) (16) - (208,830)
Disposals - (5,394) (37,805) (1,672) (6,282) - - - (51,153)
Transfers and write-offs - (26,643) 19,265 - (36,278) (21) (1) - (43,678)
Balance at 31.03. 2007 - 114,385,466 438,507,435 47,603 106,753,365 1,026,444 2,222,446 - 662,942,759
Net value 1,391,593 112,630,108 329,693,916 8,005 28,755,269 61,395 353,423 19,837,148 492,730,857
ACCUMULATED DEPRECIATION AND IMPAIRMENT LOSSES:
The additions during the year includes: assets associated with the UMTS operation (Universal Mobile Telecommunications Service); HSDPA (Kanguru Express); ULL assets (unbundling of the local loop); and assets related with the Triple Play project and FTTH (Fibre-to-the-Home). The reversals of impairment losses have been recorded under the heading of 'Other operating income”. The acquisition cost of Tangible assets held by the Group under finance lease contracts, amounted to Euro 25,434,823 and Euro 9,378,039 as of 31 March 2008 and 2007, respectively and their net book value as of those dates amounted to Euro 20,681,415 and Euro 5,019,816, respectively.
45

FIRST QUARTER 2008 RESULTS
The revision of the useful life of certain assets related to the telecommunications sites and other related assets, made in the second half of 2007 (Note 1.d)), resulted in a decrease in the depreciation charges of around Euro 3,3 million for the period ended 31 March 2008, in comparison to the amount that would have been recorded if the previous useful lives had been used. At 31 March 2008, the heading ‘Tangible assets’ does not include any asset pledged or given as a guarantee for loans obtained, except for the assets acquired under financial lease contracts. Tangible assets in progress at 31 March 2008 and 2007 were made up as follows:
2008 2007Development of mobile network 36,884,068 10,536,852Development of fixed network 3,579,669 6,477,410Information systems 2,814,298 2,687,498Other projects in progress 1,976,037 135,388
45,254,071 19,837,148
At 31 March 2008 and 2007, the amounts of commitments to third parties relating to investments to be made were as follows:
2008 2007Network 41,093,662 25,150,299Information systems 5,283,150 9,167,867
46,376,812 34,318,166
7. Intangible assets In the periods ended 31 March 2008 and 2007, the movement in Intangible assets and in the corresponding accumulated amortisation and impairment losses, was as follows:
Brands and patents and other
rights SoftwareIntangible assets
in progress TotalGROSS ASSETS:Balance at 31.12.2007 184,616,429 212,851,390 5,011,298 402,479,117
Additions 2,753,248 1,012,768 2,655,456 6,421,472
Disposals - (3,590) - (3,590)
Transfers and write-offs 9,001 (127,617) 82,553 (36,063)
Balance at 31.03.2008 187,378,678 213,732,951 7,749,307 408,860,936
Balance at 31.12.2007 48,060,543 164,981,940 - 213,042,483
Amortisation for the year 5,282,144 3,860,265 - 9,142,409
Disposals - (229) - (229)
Transfers and write-offs (1) (26,560) - (26,561)
Balance at 31.03.2008 53,342,686 168,815,416 - 222,158,102
Net value 134,035,992 44,917,535 7,749,307 186,702,834
ACCUMULATED AMORTISATION AND IMPAIRMENT LOSSES:
46

FIRST QUARTER 2008 RESULTS
Brands and patents and other
rights SoftwareIntangible assets
in progress TotalGROSS ASSETS:Balance at 31.12.2006 147,400,303 190,159,744 7,986,808 345,546,855
Additions 5,148 150,355 3,048,825 3,204,328
Disposals - (2,291) (630) (2,921)
Transfers and write-offs 61,505 1,548,717 (2,321,674) (711,452)
Balance at 31.03.2007 147,466,956 191,856,525 8,713,329 348,036,810
Balance at 31.12.2006 31,677,199 147,204,682 - 178,881,881
Amortisation for the year 3,315,357 4,375,531 - 7,690,888
Reversal of impairment losses in the year (236) (131,636) - (131,872)
Disposals - (2,291) - (2,291)
Transfers and write-offs (148) 43,981 - 43,833
Balance at 31.03.2007 34,992,172 151,490,267 - 186,482,439
Net value 112,474,784 40,366,258 8,713,329 161,554,371
ACCUMULATED AMORTISATION AND IMPAIRMENT LOSSES:
The additions for the period ended 31 March 2008 include the amount of Euro 2.7 million related with the commitments assumed under the Information Society. At 31 March 2008 and 2007, the Group has recorded under the heading ‘Intangible assets’ the amounts of Euro 110,931,747 and Euro 111,802,442 , respectively, that correspond to the investments net of depreciations made in the development of the UMTS network, including: (i) Euro 69,756,698 (amount of Euro 78,757,563 in 2007) related to the license; (ii) Euro 23,308,270 (amount of Euro 26,315,789 in 2007) related to the agreement signed in 2002 between Oni Way and the other three mobile telecommunication operators in Portugal with UMTS licenses; (iii) Euro 7,158,674 related to a contribution to the Information Society Fund, established in 2007, under an agreement entered into between the Ministry of Public Works, Transport and Communications (‘Ministério das Obras Públicas, Transportes e Comunicações’) and the three mobile telecommunication operators in Portugal; and (iv) Euro 4,748,054 related with the program “Iniciativas E”, these last two associated to the commitments assumed by the Group in relation to the Information Society Fund (Note 29). The intangible assets in progress, at 31 March 2008 and 2007, were mainly composed by software development. Intangible and tangible assets include interest and other financial expenses incurred, directly related to the construction of certain items of work in progress. At 31 March 2008 and 2007 such expenses amounted to Euro 14,689,752 and Euro 13,314,243, respectively. The amount capitalised on the years ended 31 March 2008 and 2007 were Euro 323,992 and Euro 217,733 respectively. An interest capitalization rate of 5.14% was used in 2008 (4.47% in 2007), which corresponds to the average interest rate supported by the Group.
47

FIRST QUARTER 2008 RESULTS
8. Breakdown of financial statements At 31 March 2008 and 2007, the breakdown of financial instruments was as follows:
Investments recorded at fair value through profit and loss
Loans and receivables
Held-to-maturity investments
Investments available for
saleSubtotal
Others not covered by
IFRS 7Total
Non current AssetsInvestments available for sale - - - 1,207,320 1,207,320 - 1,207,320
- - - 1,207,320 1,207,320 - 1,207,320
Current AssetsTrade debtors - 191,036,282 - - 191,036,282 - 191,036,282Other trade debtors - 8,675,962 - - 8,675,962 8,094,024 16,769,986Cash and cash equivalents - 5,530,897 - - 5,530,897 - 5,530,897
- 205,243,141 - - 205,243,141 8,094,024 213,337,165
Investments recorded at fair value through profit and loss
Loans and receivables
Held-to-maturity investments
Investments available for
saleSubtotal
Others not covered by
IFRS 7Total
Non current AssetsInvestments available for sale - - - 1,207,320 1,207,320 - 1,207,320
- - - 1,207,320 1,207,320 - 1,207,320
Current AssetsTrade debtors - 138,607,237 - - 138,607,237 - 138,607,237Other trade debtors - 5,258,911 - - 5,258,911 11,816,234 17,075,145Investments recorded at fair value through profit and loss 950,625 - - - 950,625 - 950,625
Cash and cash equivalents - 189,490,045 - - 189,490,045 - 189,490,045950,625 333,356,193 - - 334,306,818 11,816,234 346,123,052
2008
2007
48

FIRST QUARTER 2008 RESULTS
Liabilities recorded at fair value through profit and loss
DerivativesLiabilities
recorded at amortised cost
Other financial liabilities Subtotal
Others not covered by
IFRS 7Total
Non current liabilitiesMedium and long-term loans - net of short-term portion - (241,146) 329,798,754 - 329,557,608 - 329,557,608
Other non current financial liabilities - - - 17,696,902 17,696,902 - 17,696,902- (241,146) 329,798,754 17,696,902 347,254,510 - 347,254,510
Current Liabilities
Short-term loans and other loans - - 267,708 - 267,708 - 267,708Trade creditors - - - 174,705,592 174,705,592 - 174,705,592Other financial liabilities - - - 1,745,124 1,745,124 - 1,745,124Other creditors - - - 12,012,582 12,012,582 9,396,847 21,409,429
- - 267,708 188,463,298 188,731,006 9,396,847 198,127,853
Liabilities recorded at fair value through profit and loss
DerivativesLiabilities
recorded at amortised cost
Other financial liabilities Subtotal
Others not covered by
IFRS 7Total
Non current liabilitiesMedium and long-term loans - net of short-term portion - 114,511 461,770,873 - 461,885,384 - 461,885,384
Other non current financial liabilities - - - 1,316,850 1,316,850 - 1,316,850- 114,511 461,770,873 1,316,850 463,202,234 - 463,202,234
Current Liabilities
Short-term loans and other loans - - 772,663 - 772,663 - 772,663Trade creditors - - - 136,930,882 136,930,882 - 136,930,882Other financial liabilities - - - 1,645,945 1,645,945 - 1,645,945Other creditors - - - 9,478,962 9,478,962 9,744,502 19,223,464
- - 772,663 148,055,789 148,828,452 9,744,502 158,572,954
2007
2008
Considering the nature of the balances, the amounts to be paid and received from ‘State and other public entities’ were considered outside the scope of IFRS 7. Also, the captions of ‘Other current assets’ and ‘Other current liabilities’ were not included in this note, as the nature of the amounts are not within the scope of IFRS 7. 9. Goodwill For the periods ended at 31 March 2008 and 2007, the movements occurred in goodwill were as follows:
2008 2007Opening balance 528,216,604 506,902,772Increase of participations (Note 5. a)) - 177,778Others (67,309) -Closing balance 528,149,295 507,080,550
The caption “Others” includes, mainly, the exchange rate update of the Praesidium Group Goodwill. In accordance with IFRS 3, the Group suspended the amortization of the ‘Goodwill’ at 1 January 2004.
49

FIRST QUARTER 2008 RESULTS
Goodwill at 31 March 2008 and 2007 was made up as follows:
2008 2007Sonaecom - Serviços de Comunicações ("Optimus") 389,902,620 389,902,620Sonaecom - Serviços de Comunicações ("Novis") 95,189,755 95,189,755Público 20,000,000 20,000,000Cape 19,875,417 -WeDo 1,971,668 1,857,389Praesidium 1,079,049 -SIRS 72,820 72,820Permar 47,253 47,253Optimus Towering 10,713 10,713
528,149,295 507,080,550
The evaluation of the existence of impairment losses in Goodwill was based on business plans, which includes projected cash flows for periods of 5 years. The discount rates used were based on the estimated weighted average cost of capital, which depends on the business segment of each Company. In perpetuity, the Group considered a growth rate of circa 3%. 10. Investments available for sale At 31 March 2008 and 2007, this caption included investments classified as available for sale and was made up as follows:
% Gross amount
Accumulated impairment
losses (Note 18) Net amount Gross amount
Accumulated impairment losses
(Note 18) Net amount
Despegar.com 1.00% - - - 2,539,229 (2,539,229) -
Altitude, SGPS, S.A. 5.50% 1,000,000 - 1,000,000 1,000,000 - 1,000,000
Lusa – Agência de Notícias de Portugal, S.A. 11.54% 197,344 - 197,344 197,344 - 197,344
Others - 9,976 - 9,976 9,976 - 9,976
1,207,320 - 1,207,320 3,746,549 (2,539,229) 1,207,320
2008 2007
In August 2007, the participation in Despegar was sold. At 31 March 2008, these investments correspond to participations of immaterial amount, in unlisted companies in which the Group has no significant influence, and in which the book value of such investment is a reasonable approximation of their fair value, adjusted where applicable, by the respective impairment losses. The financial information regarding these investments is detailed below (in thousands of Euro):
AssetsShareholders
fund's Gross Debt Turnover Operational
results Net Income
Altitude, SGPS, S.A. 17,237 6,314 2,329 22,391 1,788 610
Lusa – Agência de Notícias de Portugal, S.A. 23,787 7,311 11,115 18,348 1,974 1,058
Values expressed in thousands Euros at 31-12-06
50
FIRST QUARTER 2008 RESULTS
During the periods ended 31 March 2008 and 2007, the movements in “Investments available for sale” were as follows:
2008 2007Opening balance 1,207,320 112,317,225Fair value adjustments recorded in reserves - (5,121,876)Sales - (108,461,474)Capital gain recorded under profit and loss statement (Note 21) - 2,473,445Closing balance 1,207,320 1,207,320
Sales and corresponding capital gains recognised at the period ended 31 March 2007, regard to the sale of 1% of the share capital of Portugal Telecom, S.G.P.S., S.A.. 11. Deferred tax assets Deferred tax assets at 31 March 2008 and 2007, in the amount of Euro 103,275,882 and Euro 62,819,612, respectively, arise mainly from timing differences relating to tax losses carried forward, non tax deductible provisions and from differences between the accounting and tax amount of some fixed assets. The movements in deferred tax assets in the periods ended 31 March 2008 and 2007 were as follows:
2008 2007
Opening balance 101,118,096 61,786,654
Impact on results
Tax losses carried forward 1,162,319 240,352
Deferred tax assets not recorded in previous years, as its utilization was not expected (Cape and Miauger) 434,000 1,014,498
Temporary differences between the tax and the accounting amount of certain fixed assets 569,388 (220,847)
Sub-total effect on results (Note 22) 2,165,707 1,034,003
Others (7,921) (1,045)
Closing balance 103,275,882 62,819,612
At 31 December 2007 and 2006, assessments of the deferred taxes to be recognised were made. Potential deferred tax assets were recorded to the extent that future taxable profits were expected to be generated, against which the tax losses and deductible tax differences could be used. These assessments were made based on the business plans of the Group companies involved, which are periodically reviewed and updated. The rate used at 31 March 2008 and 2007 to calculate the deferred tax assets, relating to tax losses carried forward, was of 25%. The rate used to calculate deferred tax assets, resulting from temporary differences, was of 26.5%. In accordance with the tax returns and other information prepared by the companies that have registered deferred tax assets, the detail of such deferred tax assets by nature at 31 March 2008 was as follows:
51

FIRST QUARTER 2008 RESULTS
Nature
Sonaecom Serviços de
Comunicações We Do Praesidium Digitmarket Mainroad Miauger Cape Total
Tax losses:
To be used until 2008 - - - 97,944 - - - 97,944
To be used until 2009 - - - 447,096 - 60,795 - 507,891
To be used until 2010 - - - 257,298 - 156,991 - 414,289
To be used until 2011 - 2,182 210,662 - 82,214 - 295,058
To be used until 2012 530,399 - - - 100,393 - - 630,792
To be used until 2013 - - - - 131,607 - - 131,607
Unlimited Utilization - - 107,001 - - - 134,000 241,001
530,399 2,182 107,001 1,013,000 232,000 300,000 134,000 2,318,582
Tax provisions not accepted and other temporary differences 8,361,312 255,736 - - - - - 8,617,048
Adjustments in the conversion to IAS/ IFRS 41,203,900 5,212 - - - - - 41,209,112
Differences between the tax and accounting amount of certain fixed assets and others 50,963,325 - - - - - - 50,963,325
Others 167,815 - - - - - - 167,815
Total 101,226,751 263,130 107,001 1,013,000 232,000 300,000 134,000 103,275,882
At 31 March 2008 and 2007, the Group has other situations where potential deferred tax assets could be recognised but since it is not expected that sufficient taxable profits will be generated in the future to cover those losses, such deferred tax assets were not recorded:
2008 2007Tax losses 97,596,259 92,375,068Temporary differences (mainly provisions not accepted for tax purposes)
18,788,395 20,896,545
Adjustments in the conversion to IAS/IFRS 5,771 2,275,537116,390,425 115,547,150
At 31 March 2008, tax losses for which deferred tax assets were not recognised have the following due dates:
Due date 20082008 26,281,9752009 10,009,4742010 5,647,0602011 13,094,1642012 17,332,2472013 19,303,6922014 1,245,8242015 2,108,6782016 1,856,6482017 121,032Unlimited 595,465
97,596,259
52

FIRST QUARTER 2008 RESULTS
The years 2015 and following are applicable to subsidiaries located in countries with a reporting period of tax losses greater than 6 years. The reconciliation between the earnings before taxes and the taxes recorded for the periods ended 31 March 2008 and 2007 is as follows:
2008 2007Earnings before taxes (7,357,396) (6,781,116)
Income tax rate (26.5%) 1,949,710 1,796,996
Deferred tax assets not recognised in the individual accounts and/or resulting from consolidation adjustments and other adjustments to taxable income
(1,067,876) (1,699,844)
Adjustments to tax base - (55,711)
Deferred tax assets not recognised in previous years 434,000 1,014,498
Movements in the temporary differences between the tax and accountingamount of certain fixed assets 569,388 (220,847)
Income taxation recorded in the period (Note 22) 1,885,222 835,092
Portuguese Tax Authorities can review the income tax returns of the Company and of its subsidiaries for a period of four years (ten years for Social Security until 31 December 2000 and five years after that date), except when tax losses have been generated, tax benefits have been granted or when any review, claim or impugnation is in course, in which circumstances, the periods are extended or suspended. Consequently, tax returns of each year, since the year 2004 (inclusive) are still subject to such review. The Board of Directors believe that any correction that may arise as a result of such review would not produce a significant impact in the accompanying consolidated financial statements. Supported by the Company’s lawyers and Tax consultants, the Board of Directors believes that there are no assets or liabilities not provisioned in the financial statements, associated to probable tax contingencies that should be registered or disclosed in the notes to the accounts, at 31 March 2008. 12. Investments recorded at fair value through profit and loss During the periods ended 31 March 2008 and 2007, the movements in this heading were as follows:
2008 2007Balance at the beginning of the year - 849,375Increases/ reductions to fair value (Note 21) - 101,250
- 950,625
At 31 March 2008, ‘Investments recorded at fair value through profit and loss’ refer to 562,500 shares of Sonae, S.G.P.S., S.A., acquired to fulfil future obligations under the Medium Term Incentive Plans and which were recorded based on the closing share price of Euronext at the balance sheet date. During the year ended at 31 December 2007, 369,317 shares were delivered to employees and 193,183 shares were sold.
53

FIRST QUARTER 2008 RESULTS
13. Cash and cash equivalents At 31 March 2008 and 2007, the detail of cash and cash equivalents was as follows:
2008 2007Cash 346,367 845,346Bank deposits repayable on demand 4,732,624 7,969,162Treasury applications 451,906 180,675,537Cash and cash equivalents 5,530,897 189,490,045Bank overdrafts (Note 16) (158,832) (772,663)
5,372,065 188,717,382
At 31 March 2008 and 2007, the ‘Treasury applications’ had the following breakdown:
2008 2007Bank short term deposits:
Sonaecom 380,000 222,004WeDoBrasil 71,906 1,162,533Sonaecom BV - 112,980,000Optimus - 65,586,000Mainroad - 5Digitmarket - 1
451,906 180,675,537
85,00040,000
During the period ended at 31 March 2008, the above referred treasury applications bearded interests at an average rate of 4.11% (3.635% in 2007). 14. Share Capital At 31 March 2008 and 2007 the share capital of Sonaecom was comprised by 366,246,868 ordinary bearer shares of 1 Euro each. At those dates, the shareholder structure was as follows:
Number of shares % Number of shares %Sontel BV 190,778,077 52.09% 183,489,681 50.10%Shares traded on the Portuguese Stock Exchange (´Free float´) 75,048,721 20.49% 76,333,573 20.84%
Wirefree Services Belgium, S.A. 70,276,868 19.19% 70,276,868 19.19%093X (EDP) 29,150,000 7.96% 29,150,000 7.96%Own Shares 968,553 0.26% 1,894,326 0.52%Sonae 23,649 0.01% 5,023,649 1.37%Efanor Investimentos, S.G.P.S., S.A 1,000 0.00% 1,000 0.00%Sonae Investments BV - - 77,771 0.02%
366,246,868 100.00% 366,246,868 100.00%
20072008
At 31 March 2008 and 2007 the share capital of Sonaecom is comprised by 366,246,868 shares authorised, subscribed and paid. All shares have the same rights and each share correspond to one vote. 15. Own shares During the period ended 31 March 2008, Sonaecom delivered to its employees 925,773 own shares under its Medium Term Incentive Plans. The company still holds, at 31 March 2008, 968,553 own shares, representative of 0.26% of its share capital to hedge the responsibilities associated with this plan.
54

FIRST QUARTER 2008 RESULTS
16. Loans At 31 March 2008 and 2007, the heading Loans had the following breakdown: a) Medium and long-term loans net of short-term portion
Company Issue denomination Limit Maturity 2008 2007
"Obrigações Sonaecom SGPS 2005" 150.000.000 Jun-13 Final 150.000.000 150.000.000
Costs associated with financing set-up - - - (2.772.388) (3.247.130)
Interests incurred but not yet due - - - 2.419.100 -
Fair value of swaps - - - 9.803 -
149.656.515 146.752.870
Commercial paper 250.000.000 Jul-12 - 180.500.000 -
Costs associated with financing set-up - - - (686.609) -
Interests incurred but not yet due - - - 338.652 -
Fair value of swaps - - - (250.950) -
179.901.093 -
European Investment Bank (a) 324.458.200 Jun-09 30% - Jun 0870% - Jun 09
- 324.458.200
Costs associated with financing set-up - - - - (9.440.196)
Fair value of swaps - - - - 114.510
- 315.132.514
329.557.608 461.885.384
Amount outstanding
Type of reimbursement
Optimus
Sonaecom SGPS
Sonaecom SGPS
(a) As a guarantee of EIB loans, the banks participating in the Optimus syndicated credit facility issued a bank guarantee in favour of EIB (cancelled in 2007 with the reimbursement of the loan). b) Short-term loans and other loans:
Company Lender Type 2008 2007
Wedo Brasil ABN Short term loan 108.876 -Various Various Bank overdrafts 158.832 772.663
267.708 772.663
Amount outstanding
In July 2007, Sonaecom contracted a Commercial Paper Program Issuance with a maximum amount of Euro 250 million with subscription grant and maturity of five years, organized by Banco Santander de Negócios Portugal and by Caixa – Banco de Investimento. The placing underwriting consortium is composed by the following institutions: Banco Santander Totta, Caixa Geral de Depósitos, Banco BPI, Banco Bilbao Vizcaya Argentina (Portugal), Banco Comercial Português and BNP Paribas (in Portugal). In September 2007, the subsidiary Optimus – Telecomunicações, S.A., reimbursed its financing from European Investment Bank (BEI), in an amount of Euro 324 million. With this refinancing, the group was able to, under the current favorable market conditions, increase the weighted average maturity, extinguish some of the contractual, financial and operational restrictions imposed by the previous Optimus contract and obtain higher efficiency in terms of the consolidated liquidity management. These loans bear interest at market rates indexed to the Euribor for the respective term, and were all contracted in Euros. Consequently, it is estimated that the fair value of those loans does not differ significantly from their market value.
55

FIRST QUARTER 2008 RESULTS
The spread on the medium and long term loans is established between 22.5 and 87.5 basis points. All of the loans above are unsecured and the fulfillment of the obligations under these loans is exclusively guaranteed by the underlying activities and the companies respective cash flows. At 31 March 2008 and 2007, the repayment schedule of medium and long term loans and of interests, for both bonds and commercial paper was as follows:
N+1 N+2 N+3 N+4 N+5 After N+5
Bond LoanReimbursements - - - - 150,000,000 -Interests 8,656,583 8,656,583 8,656,583 8,656,583 4,055,550 -
Commercial paperReimbursements - 30,500,000 - 150,000,000 - -Interests 9,245,822 8,661,396 7,851,602 4,477,869 - -
17,902,405 47,817,979 16,508,185 163,134,453 154,055,550 -
N+1 N+2 N+3 N+4 N+5 After N+5
Bond LoanReimbursements - - - - - 150,Interests 7,873,575 7,873,575 7,873,575 7,873,575 7,873,575 7,873,575
European Investment BankReimbursements - - 324,458,200 - - -Interests 12,556,532 12,556,532 8,789,573 - - -
20,430,107 20,430,107 341,121,348 7,873,575 7,873,575 157,873,575
2008
2007
000,000
Although the maturity of commercial paper issuance is six months, the counterparties assumed the placement and the maintenance of those limits for a period of five years.
56

FIRST QUARTER 2008 RESULTS
At 31 March 2008 and 2007, the available credit lines of the Group are as follows:
Company Credit LimitAmount
outstanding Amount availableUntil 12 months
More than 12
months
Sonaecom Commercial paper 250.000.000 180.500.000 69.500.000 xSonaecom Commercial paper 70.000.000 - 70.000.000 xSonaecom Overdraft facilities 5.000.000 - 5.000.000 xSonaecom Bond Loan 150.000.000 150.000.000 - xPúblico Overdraft facilities 1.496.394 - 1.496.394 xPúblico Overdraft facilities 1.500.000 - 1.500.000 xPúblico Authorized Overdrafts 1.246.995 - 1.246.995 xWeDo Brasil Overdraft facilities 368.009 368.009 x
479.611.398 330.500.000 149.111.398
Company Credit LimitAmount
outstanding Amount availableUntil 12 months
More than 12
months
Optimus European Investment Bank 324.458.200 324.458.200 - x
Optimus Revolving 125.541.800 - 125.541.800 xOptimus Overdraft facilities 4.987.979 - 4.987.979 xSonaecom SGPS Bound loan 150.000.000 150.000.000 - xSonaecom SGPS Commercial paper 70.000.000 - 70.000.000 xSonaecom SGPS Overdraft facilities 20.000.000 - 20.000.000 xPúblico Overdraft facilities 1.496.394 - 1.496.394 xPúblico Overdraft facilities 1.500.000 - 1.500.000 xPúblico Authorized overdrafts 1.246.995 - 1.246.995 xWeDo Brasil Overdraft facilities 368.009 368.009 x
699.599.377 474.458.200 225.141.177
2008
2007Maturity
Maturity
The following interest rate hedging instruments were outstanding at 31 March 2008 and 2007:
Company Hedged loan Notional amount Maturity date Base rate Fixed rate contracted
Fair value of the derivative
instruments
Sonaecom Commercial paper 110.000.000 Mar-09 Euribor 6m 4,573% (250.949)
Sonaecom Bond Loan 75.000.000 Jun-09 Euribor 6m 4,565% 9.803
(241.146)
In September 2007, Sonaecom contracted a interest rate swap, with a notional amount of Euro 110 million, for a period of 18 months re-fixed every semester, to hedge the risk associated to the interest rate of one plot of the commercial paper issued in 13 September 2007, for the same amount and the same period. This plot will be renewed for the same amount and for the same period, at least, until 13 March 2009, which means, until the maturity date of this new interest rate swap. In December 2007 Sonaecom contracted a interest rate swap, with a notional amount of Euro 75 million, for a period of 18 months re-fixed every semester, to hedge the 50% risk associated to the interest rate of the
57

FIRST QUARTER 2008 RESULTS
bond loan issued in June 2005, for the amount of Euro 150 million and for the period of eight years with re-fixations every semester. The payments of interest on the bond loan and on the swap are made simultaneously, by its net amount. During the period ended at 31 March 2008, the movements occurred in the fair value of the swaps related to the Commercial Paper Programme, in the amount of Euro 218,155 and the bond loans, in the amount of Euro (46,391), were recorded in reserves, as the hedging is effective, in accordance with IAS 39. Through the execution of these derivative financial instruments, at 31 March 2008, approximately 56% of gross debt is, in an indirect way, subject to fixed interest rates. The remaining 44% of gross debt is exposed to changes in the interest rates. 17. Other non current financial liabilities At 31 March 2008 and 2007, this caption was made up of accounts payable to fixed assets suppliers related to leasing contracts that are due in more than one year in the amount of Euro 17,696,902 and Euro 1,316,850, respectively. At 31 March 2008 and 2007, accounts payable to fixed assets suppliers related to leasing contracts are due as follows:
Lease paymentsPresent value of lease
payments Lease paymentsPresent value of lease
payments2007 - - 1,422,572 1,350,3612008 2,436,181 1,526,883 957,718 906,0462009 2,388,166 1,521,723 477,035 457,9432010 2,070,704 1,266,084 228,719 220,6142011 1,869,068 1,124,586 27,907 27,8312012 1,885,669 1,196,417 - -2013 1,677,995 1,043,570 - -2014 and follows 14,996,915 11,762,761 - -
27,324,698 19,442,025 3,113,951 2,962,795Interests (7,882,673) - (151,156) -
19,442,025 19,442,025 2,962,795 2,962,795
Short term liability (Note 19) - (1,745,124) - (1,645,945)19,442,025 17,696,902 2,962,795 1,316,850
20072008
As these lease contracts bear interest at market rates, their fair value is estimated not to differ significantly from their book value. The medium and long term agreements made with the suppliers of the fibre optic network capacity, under which the Group has the right to use that network, which is considered as a specific asset, are recorded as finance leases in accordance with IAS 17 – “Leases” and IFRIC 4 – “Determining whether an arrangement contains a Lease”. These contracts have a 15 to 20 year maturity.
58

FIRST QUARTER 2008 RESULTS
18. Provisions and accumulated impairment losses The movements in provisions and in accumulated impairment losses in the years ended 31 December 2007 and 2006 were as follows:
HeadingOpening balance Transfers Increases Utilisations Decreases Closing balance
Accumulated impairment losses on accounts receivables 66.167.308 (60.714) 2.653.119 (2.492.000) (146.395) 66.121.318
Accumulated impairment losses on inventories 8.663.703 - 966.010 - - 9.629.713
Provisions for other liabilities and charges 30.885.378 318.715 544.401 (12.898) - 31.735.595
105.716.389 258.000 4.163.530 (2.504.898) (146.395) 107.486.626
HeadingOpening balance Transfers Increases Utilisations Decreases Closing balance
Accumulated impairment losses on accounts receivables 61.060.155 (194.000) 2.978.271 (1.271.317) (12.704) 62.560.405
Accumulated impairment losses on inventories 6.122.085 - 249.000 - (31.000) 6.340.085
Accumulated impairment losses on investments available for sale (Note 10)
2.539.229 - - - - 2.539.229
Provisions for other liabilities and charges 20.078.571 194.000 1.031.492 (109.121) (34.506) 21.160.436
89.800.040 - 4.258.763 (1.380.438) (78.210) 92.600.155
2007
2008
The increase of ‘Provisions for other liabilities and charges’ includes the amount of Euro 2,724 associated with the dismantling of sites (Euro 653,300 in 2007), as foreseen in IAS 16 (Note 1.d.)) and the amount of Euro 63,318 registered in the financial statements, under the caption ‘Income tax for the year’. As such, the total amount included under increase of provisions and of impairment losses, registered against a corresponding entry in the profit and loss statement, corresponds to Euro 4,097,488 (Euro 3,605,463 in 2007). The heading utilisations refers, essentially, to the use of provisions by the subsidiary Sonaecom – Serviços de Comunicações, S.A., which were registered against an entry in customers’ current accounts. At 31 March 2008 and 2007, the breakdown of the provisions for other liabilities and charges were as follows:
2008 2007Dismantling of sites 18,891,544 15,758,440Several contingencies 6,658,355 1,086,029Legal processes in progress 2,416,073 2,746,524Indemnities 569,432 498,280Others 3,200,191 1,071,163
31,735,595 21,160,436
59

FIRST QUARTER 2008 RESULTS
The heading of ‘Several contingencies’ relates to contingent liabilities arising from transactions carried out in previous years and for which an outflow of funds is probable. In relation to the provisions recorded for legal process in progress and for other risks and charges, given the uncertainty of such proceedings, the Board of Directors is unable to estimate, with reliability, the moment when such provisions will be used. 19. Other financial liabilities At 31 March 2008, this caption includes the amount of Euro 1,745,124 (Euro 1,645,945 in 2007) related to the short term portion of lease contracts (Note 17). 20. External supplies and services ‘External supplies and services’ for the years ended 31 March 2008 and 2007 are made up as follows:
2008 2007Interconnection costs 62,668,961 52,939,124Specialised works 17,255,696 12,345,966Advertising and promotion 14,249,027 6,035,719Commissions 12,214,160 12,962,814Leased lines 10,325,787 5,863,140Rents 8,244,308 7,670,830Energy 2,133,868 2,012,302Travelling costs 1,195,209 898,584Others 17,345,936 13,180,461
145,632,952 113,908,940
The commitments assumed by the Group in 31 March 2008 and 2007 related with operational leases are as follows:
Minimum payments of operational leases 2008 20072007 - 3.011.7022008 7.845.563 3.343.7542009 6.048.872 1.933.2562010 4.483.379 736.5482011 3.351.415 37.3622012 1.221.003 -2013 158.863 -2014 904.842 -Renewable by periods of 1 year 2.372.957 -
26.386.895 9.062.622
During the period ended at 31 March 2008 an amount of Euro 2,777,550 was recorded in the heading ‘External supplies and services’ related with operational leasing rents (exception of the leased lines). The rents associated to the rental of facilities are mainly justified by the lease, established in 2007, of the Sonaecom building which has a 5 year period with the possibility of annual renewal. The actualisation of the rents will occur at the end of the first contract cycle (after the first five years).
60

FIRST QUARTER 2008 RESULTS
21. Financial results Net financial results for the years ended 31 March 2008 and 2007 are made up as follows:
2008 2007Financial results related to associated companies
Losses on associated companies - (Gains on associated companies 9,456 -
9,456 (87,573)
Other financial expenses:Interest expenses (4,468,114) (11,748,602)
Other loans - (6,507,134)Bank loans (4,192,488) (5,123,534)Swap interests - (68,444)Leasing (233,051) (33,317)Other interests (42,575) (16,173)
Foreign exchange losses (379,751) (27,018)Other financial expenses (92,488) (1,475,050)
Set up costs (Note 16) (12,500) (1,277,509)Swap fair value (Note 16) - (7,048)Others (79,988) (190,493)
(4,940,353) (13,250,670)
Other financial income:Interest income 727,883 6,535,494Foreign exchange gains 51,588 91,866Adjustments to fair value on investments recorded at fair value through profit and loss (Note 12) - 101,250
Gains on investments available for sale (Note 10) - 2,473,445Other financial income (2,870) -
776,601 9,202,055
87,573)
At 31 March 2008, this caption includes, mainly, interests on late payments associated with cases in litigation and interests related with swaps contracted by Sonaecom. At 31 March 2007, the ‘Interest income' includes, mainly, interests earned on the treasury applications granted to Sonae and on bank deposits. 22. Income taxation Income taxes recognised during the periods ended 31 March 2008 and 2007 are made up as follows (costs)/gains:
2008 2007Current tax (291,656) (83,997)Deferred tax asset (Note 11) 2,165,707 1,034,003Deferred tax liability 11,171 (114,914)
1,885,222 835,092
61

FIRST QUARTER 2008 RESULTS
23. Related parties During the periods ended 31 March 2008 and 2007, the balances and transactions with related parties mainly relate to the normal operational activity of the Group (providing communications and consultancy services) and to the concession and obtainance of loans. The most significant balances and transactions with related parties at 31 March 2008 and 2007 were as follows:
Accounts receivable Accounts payable
Treasury applications Accruals
Sonae 125,024 - - (6,967)
Modelo Continente Hipermercados, S.A. 1,999,625
379,208 - 203,329
Worten 7,874,325 2,170,249 - (1,544,646)France Telecom 4,604,168 5,606,705 - (14,680,618)
14,603,142 8,156,161 - (16,028,902)
Accounts receivable Accounts payable
Treasury applications Accruals
Sonae 52,247 31,974 222,004 751,305
Modelo Continente Hipermercados, S.A. 3,246,842 1,722,472 - 55,973
Worten 1,888,814 - - 111,798France Telecom 2,810,591 5,520,840 - 2,726Sonae Investments BV - - - (2,371,169)
7,998,494 7,275,286 222,004 (1,449,367)
Balances at 31 March 2008
Balances at 31 March 2007
62

FIRST QUARTER 2008 RESULTS
Sales and services rendered
Supplies and services received
Interest and similar income/
(expense)Supplementary
incomeSonae 98,223 10,523 - 11,280Modelo Continente Hipermercados, S.A. 1,643,536 110,155 - 169,429
Worten 1,788,740 397,817 - -France Telecom 3,225,017 3,299,227 - -
6,755,516 3,817,722 180,709
Sales and services rendered
Supplies and services received
Interest and similar income/
(expense)Supplementary
incomeSonae 97,898 42,667 650,965 -Modelo Continente Hipermercados, S.A. 381,918 1,104,491 - 60,256
Worten 1,569,089 53,598 - -France Telecom 633,477 1,716,533 - -
2,682,382 2,917,289 650,965 60,256
Transactions at 31 March 2008
Transactions at 31 March 2007
The transactions between Group companies were eliminated in consolidation, and therefore are not disclosed in this note. Accounts receivable and payable to related companies will be settled in cash and are not covered by guarantees. During the periods ended at 31 March 2008 and 2007, no impairment losses in accounts receivable from related entities were recognised. A complete list of the Sonaecom Group’s related parties is presented in appendix to this report.
63

FIRST QUARTER 2008 RESULTS
24. Guarantees provided to third parties Guarantees provided to third parties at 31 March 2008 and 2007 were as follows:
Company Beneficiary Description 2008 2007
Sonaecom BBVA – Portugal, ING Belgium Portugal and Millennium BCP
Commercial paper 320,000,000 70,000,000
Sonaecom - Serviços de Comunicações, Público and Sonaecom
Direcção de Contribuições e Impostos (Portuguese tax authorities)
VAT Reimbursements 8,876,695 -
Sonaecom - Serviços de Comunicações
Direcção de Contribuições e Impostos (Portuguese tax authorities)
IRC - Tax assessment 1,650,000 1,650,000
Sonaecom - Serviços de Comunicações and Público
Direcção de Contribuições e Impostos (Portuguese tax authorities)
VAT - Impugnation process 598,000 598,000
Sonaecom - Serviços de Comunicações and Tele2
Direcção Geral do Tesouro(Portuguese tax authorities)
IRC – Witholding tax on payments to non-residents
470,954 164,000
Sonaecom - Serviços de Comunicações
Câmara Municipal de Coimbra, Lisboa, Braga, Elvas e Caldas da Rainha (Coimbra, Lisbon, Braga, Elvas and Caldas da Rainha Municipalities)
Performance bond - works 287,494 280,565
Público Tribunal de Trabalho de Lisboa(Lisbon Labour Court)
Execution action n. 199A/92 271,511 271,511
Público Fazenda Pública do Porto(Oporto Public Treasury)
Tax process n. 3190/98 209,493 209,493
WeDo API (Portuguese Investment Agency) Application to PRIME subsidies 184,004 184,004
Sonaecom - Serviços de Comunicações and Digitmarket
Hewlett Packard Finance lease and services provider contracts
159,859 159,859
Sonaecom - Serviços de Comunicações
Governo Civil de Santarém(Santarém Local Government)
Guarantee the fulfilment of legal obligations
119,703 119,703
Sonaecom - Serviços de Comunicações
Governo Civil de Lisboa (Lisbon Government Civil)
Guarantee the fulfilment of legal obligations
63,279 98,195
Optimus European Investment Bank Loan - 324,458,200
Optimus ANACOM UMTS License - 2,493,989
Various Others 953,856 623,717
333,844,849 401,311,236
At 31 March 2008 and 2007, the Board of Directors of the Group believes that the decision of the court proceedings and ongoing tax assessment in progress will not have significant impacts in the consolidated financial statements.
64

FIRST QUARTER 2008 RESULTS
25. Information by business segment The following business segments were identified for the periods ended at 31 March 2008 and 2007:
- Telecommunications - Multimedia - Information systems
During the year ended 2007, as a result of the merger occurred between Optimus and Novis (Note 5.b)) (business mobile telecommunications and business fixed telecommunications), the Group decided to change the presentation of segment information. These two business areas were added into a single segment called "Telecommunications". As established in IAS 8, the information for the period ended at 31 March 2007, was re-expressed taking in consideration such change. The remaining activities of the Group and corporate services have been classified as unallocated. Inter-segment transactions at 31 March 2007 and 2006 were eliminated in the consolidation process. Due to the immateriality of the assets and transactions of the Group outside Portugal, segment information by geographical markets is not presented. Inter-segment transfers or transactions are entered under the normal commercial terms and conditions that would also be available to unrelated third parties and are mainly related to interconnection, interest on treasury applications and management fees. Overall information by business segment at 31 March 2008 and 2007 can be summarised as follows:
65

TER 2008 RESULTS
66
March 08 March 07 March 08 March 07 March 08 March 07 March 08 March 07 March 08 March 07 March 08 March 07 March 08 March 07
Revenues:
Sales and services rendered 213,490,936 183,311,673 7,807,170 7,175,526 27,050,171 14,962,977 1,863,232 1,698,806 250,211,508 207,148,982 (12,516,790) (8,205,157) 237,694,718 198,943,825
Other operating revenues 2,495,162 2,004,259 63,732 69,649 70,546 192,104 20,575 77,729 2,650,014 2,343,741 (1,120,120) (1,014,317) 1,529,894 1,329,424
Total revenues 215,986,098 185,315,932 7,870,902 7,245,175 27,120,717 15,155,081 1,883,807 1,776,535 252,861,522 209,492,723 (13,636,910) (9,219,474) 239,224,612 200,273,249
Depreciation and amortisation (36,977,390) (36,356,630) (182,407) (166,636) (496,413) (334,216) (34,472) (81,582) (37,690,682) (36,939,064) 419,858 308,457 (37,270,824) (36,630,606)
Net operating income/(loss) for the segment (1,311,268) (991,599) (1,345,018) (1,348,212) 376,199 868,813 (362,606) (1,506,816) (2,642,693) (2,977,815) (560,407) 332,887 (3,203,100) (2,644,928)
Net interests (3,781,666) (3,186,096) (31,309) (27,633) (31,596) 170,443 104,339 (2,142,714) (3,740,231) (5,186,000) - (27,108) (3,740,231) (5,213,108)
Gains and losses in associated companies - - - - - (60,751) - - - (60,751) 9,456 (26,822) 9,456 (87,573)
Other financial results (80,856) (1,256,892) 11,410 (2,443) (367,639) (60,101) 40,027,288 2,218,464 39,590,203 899,029 (40,013,723) 265,464 (423,521) 1,164,493
Income taxation 1,553,226 1,091,524 (5,296) (5,156) (99,572) (249,120) 269,049 (2,156) 1,717,406 835,092 167,815 - 1,885,222 835,092
(3,620,564) (4,343,063) (1,370,213) (1,383,444) (122,608) 669,284 40,038,070 (1,433,222) 34,924,685 (6,490,445) (40,396,859) 544,421 (5,472,174) (5,946,024)
Shareholders of Parent Company (3,620,564) (4,343,063) (1,370,213) (1,383,444) (177,329) 608,744 40,038,070 (1,433,222) 34,869,964 (6,550,986) (40,396,009) 546,736 (5,526,045) (6,004,250)
Minority interests - - - - 54,721 60,541 - - 54,721 60,541 (850) (2,315) 53,871 58,226
Assets:
Fixed assets and Goodwill 722,683,734 662,892,005 2,009,916 2,187,259 64,600,136 41,967,071 1,884,755 2,018,114 791,178,541 709,064,449 457,417,114 452,301,329 1,248,595,655 1,161,365,778
Inventories 25,495,084 19,610,109 1,389,740 1,464,847 1,852,245 3,916 - - 28,737,069 21,078,871 - - 28,737,069 21,078,871
Financial investments 1,282,025 1,282,025 1,097,695 1,097,695 907,494 907,495 1,234,486,251 1,215,137,995 1,237,773,465 1,218,425,210 (1,235,809,076) (1,216,482,276) 1,964,389 1,942,933
Other non current assets 102,623,114 61,127,186 - 1,373,335 1,749,131 1,983,269 489,746,750 490,420,228 594,118,995 554,904,018 (490,843,113) (492,084,406) 103,275,882 62,819,612
Other current assets of the segment 284,471,361 311,465,660 8,934,556 9,729,832 33,226,709 29,596,425 104,360,322 138,602,472 430,992,949 489,394,389 (118,702,165) (60,200,939) 312,290,784 429,193,451
1,136,555,318 1,056,376,985 13,431,907 15,852,968 102,335,715 74,458,176 1,830,478,078 1,846,178,809 3,082,801,019 2,992,866,937 (1,387,937,240) (1,316,466,292) 1,694,863,779 1,676,400,645
Liabilities:
Liabilities of the segment 800,209,294 682,645,436 15,602,692 17,688,689 46,806,407 22,914,260 500,284,313 394,352,382 1,362,902,706 1,117,600,767 (600,555,098) (331,060,560) 762,347,608 786,540,207
800,209,294 682,645,436 15,602,692 17,688,689 46,806,407 22,914,260 500,284,313 394,352,382 1,362,902,706 1,117,600,767 (600,555,098) (331,060,560) 762,347,608 786,540,207
CAPEX 35,380,923 29,292,672 103,770 250,051 22,494 385,017 13,431 4,991 35,520,619 29,932,731 (160,594) (293,011) 35,360,025 29,639,720
Multimedia Information Systems Other Sub-Total Eliminations Total
Consolidated net income/(loss) for the year
Attributable to:
Telecomunications
FIRST QUAR

FIRST QUARTER 2008 RESULTS
Despite the merger occurred in 2007, for some headings of the balance sheet and of the profit and loss statement, the Board of Directors of the Group decided to maintain a separate analysis of the business as follows:
March 08 March 07 March 08 March 07 March 08 March 07 March 08 March 07Income:
Services rendered 151,569,381 142,773,317 75,198,420 54,032,498 (13,276,865) (13,494,142) 213,490,936 183,311,673Other operational income 10,187,427 8,432,179 649,643 1,018,373 (8,341,908) (7,446,293) 2,495,162 2,004,259Total revenues 161,756,808 151,205,496 75,848,063 55,050,871 (21,618,773) (20,940,435) 215,986,098 185,315,932
Depreciation and amortisation (28,962,815) (31,618,691) (8,014,575) (4,737,939) - - (36,977,390) (36,356,630)Operational results of segments 4,167,095 3,337,783 (5,495,779) (4,500,477) 17,416 171,095 (1,311,268) (991,599)
AssetsTangible assets and Goodwill 424,813,813 550,502,277 297,869,921 112,291,881 - 97,847 722,683,734 662,892,005Inventories 22,345,572 17,767,063 3,149,512 1,843,046 - - 25,495,084 19,610,109Financial investments 1,282,025 1,282,025 - - - - 1,282,025 1,282,025
Increases in tangible assets 28,635,896 17,056,717 6,745,027 12,233,405 - 2,550 35,380,923 29,292,672
Mobile Network Fixed Network and internet TelecommunicationsEliminations
During the periods ended at 31 March 2008 and 2007, the inter-segments rendered sales and services were as follows:
Telecommunications Multimedia Information Systems OthersTelecommunications - - 10,056,180 1,625,291Multimedia 481,304 - 52,839 49,685Information Systems 167,014 10,270 - 34,456Sonaecom others 17,483 - 22,268 -Others 212,825,135 7,796,900 16,918,883 153,800
213,490,936 7,807,170 27,050,171 1,863,232
Telecommunications Multimedia Information Systems OthersTelecommunications - - 6,158,999 1,493,465Multimedia 138,995 - 164,394 41,372Information Systems 100,120 - - 26,784Sonaecom others 19,332 44,914 16,782 -Others 183,053,226 7,130,612 8,622,802 137,185
183,311,673 7,175,526 14,962,977 1,698,806
2008
2007
26. Earnings per share Earnings per share, basic and diluted, are calculated by dividing the consolidated net income attributable to the Group of the period (Euro 5,526,045 negative in 2008 and Euro 6,004,250 negative in 2007) by the average number of shares outstanding during the periods ended at 31 March 2008 and 2007, net of own shares (364,661,133 in 2008 and 365,615,426 in 2007). 27. Medium Term Incentive Plans In June 2000, Sonaecom Group created a discretionary Medium Term Incentive Plan for more senior employees, based on Sonaecom options and shares and Sonae S.G.P.S., S.A. shares. The vesting occurs three years after the award of each plan, assuming that the employees are still employed in the Group.
67
FIRST QUARTER 2008 RESULTS
The Sonaecom plans outstanding at 31 March 2008 can be summarised as follows:
Share price at award date * Award date Vesting date
Aggregate number of
participationsNumber of
options/ sharesSonaecom shares2003 Plan 3.19 31-Mar-04 09-Mar-07 - -2004 Plan 3.96 31-Mar-05 10-Mar-08 - -2005 Plan 4.093 10-Mar-06 09-Mar-09 371 866,8012006 Plan 4.697 09-Mar-07 08-Mar-10 405 1,029,1772007 Plan 2.24 10-Mar-08 09-Mar-11 423 1,942,469
2003 Plan 0.93 31-Mar-04 09-Mar-07 - -2004 Plan 1.17 31-Mar-05 10-Mar-08 - -2005 Plan 1.34 10-Mar-06 09-Mar-09 12 143,8552006 Plan 1.68 09-Mar-07 08-Mar-10 6 149,7302007 Plan 1.165 10-Mar-08 09-Mar-11 7 250,398
Sonae SGPS shares
* Average share price in the month prior to the award date, for Sonaecom shares and the lower of the average shareprice for the month prior to the Annual General Meeting and the share price on the day after the Annual GeneralMeeting, for Sonae SGPS shares. However, for the 2006 Plans the share price was: Sonaecom shares - the averageshare price between 3rd March and 5th April 2007; Sonae SGPS shares - the average share price between 13rdFebruary and 26th March 2007. This exception was due to the timing of the end of the Portugal Telecom bid and wasapproved by the Board Nomination and Remuneration Committee.
Vesting period 31-Mar-2008
During the period ended at 31 March 2008, the movements occurred in the plans can be summarised as follows:
Aggregate number of
participations
Number of shares
Aggregate number of
participations
Number of shares
Outstanding at 31.12.2007Exercisable - - - -Unvested 1,142 2,902,082 30 496,440 Total 1,142 2,902,082 30 496,440
Movements in yearAwarded 423 1,942,469 7 250,398Vested (349) (976,395) (12) (274,202)Cancelled/Lapsed * (17) (29,709) - 71,347
Outstanding at 31.03.2008Exercisable - - - -Unvested 1,199 3,838,447 25 543,983 Total 1,199 3,838,447 25 543,983
* Corrections are made according to the dividend paid or by changes in the capital.
Sonaecom shares Sonae SGPS shares
Sonaecom signed agreements to cover the execution and hedging of its Medium Term Incentive Plans and related obligations and acquired own shares with the same purpose. Due to the agreements and the acquisitions made, Sonaecom’s liabilities are currently limited to a maximum of Euro 4,338,343. Sonaecom has entered into mirror agreements with its subsidiaries to transfer the corresponding liabilities to each subsidiary. For Sonaecom’s share plans, the total responsibility calculated attending to the share price at award date is Euro 4,048,801 and was recorded in ‘Reserves for Medium Term Incentive Plans’. For the Sonae SGPS
68

FIRST QUARTER 2008 RESULTS
share plans the Group entered into hedging contracts with external entities, and the liabilities are calculated based on the prices agreed on those contracts and was recorded under the headings of 'Other current liabilities' and ‘Other non current liabilities’, with the exception of the plan awarded in 2008 which is not covered and which responsibility is calculated using the price at the balance sheet date. The costs of the Option and Share Plans are recognised in the accounts over the period between the award and the vesting date of those shares and options. The costs recognised in previous years and in the period ended at 31 March 2008, were as follows:
AmountCosts recognised in previous years 21.950.820Costs recognised in the period 1.324.029Costs of plans from subsidiary Exit (no longer consolidated) (8.882)Costs of plans vested in previous year (14.990.425)Costs of plans vested in the period (3.937.199)Total cost of the plans 4.338.343
Recorded in Other current liabilities (178.437)Recorded in Other non current liabilities (111.105)Reserves (4.048.801)
28. Others matters i) As of 31 March 2008, accounts receivable from customers and payable to suppliers include Euro 37,139,253 and Euro 29,913,608, respectively, and ‘Other current assets’ and ‘Other current liabilities’ include Euro 411,649 and Euro 6,856,200, respectively, resulting from a dispute between the subsidiary Optimus and the operator TMN – Telecomunicações Móveis Nacionais, S.A., in relation to interconnection tariffs, already recorded on the year ended 31 December 2001. The Company has considered the most penalising tariffs in the consolidated financial statements. In the lower court, the decision was favourable to Optimus but the higher courts decided that the case should be judged again. At the moment, the period to TMN to appeal from that decision is still in course. (ii) In the Arbitration Court proceeding imposed to solve the conflict between Maxistar and the other shareholders of Sonaecom – Serviços de Comunicações, S.A. (at the time Optimus) - for breach of a clause of the Shareholders’ Agreement, Maxistar was condemned to pay an indemnity of Euro 2,344,350 plus legal interest calculated until the date of payment or, alternatively, to subject itself to a purchase option over its participation in Sonaecom – Serviços de Comunicações at 70% of its actual value. Maxistar has appealed against the decision of the Arbitration Court but that appeal has already been rejected in the lower courts. In consequence of this rejection, Maxistar appealed to the ‘Tribunal da Relação de Lisboa’ (Lisbon Court of Appeal). As a way to execute the amounts due to be paid by Maxistar, and after having informed Maxistar of their preference for the payment in cash, some shareholders have proposed an execution action. Before the decision of the Arbitration Court, Maxistar paid those shareholders, as a way of avoiding the execution, a total amount of Euro 4,068,048 (capital plus interest), of which Euro 2,183,899 were paid to Sonaecom. The ‘Tribunal da Relação de Lisboa’ rejected the Maxistar’s appeal, confirming the previous decision. Maxistar can still appeal of this decision; however the Board of Directors maintains the conviction that the probability of an appeal is reduced. 29. Commitments associated to “Information Society” Under the attribution of UMTS License, Sonaecom – Serviços de Comunicações committed to contribute to the promotion and development of the information society in the total amount of Euro 274 million, to be realised until the end of the license period (2015). In accordance with the Agreement established on 5 June 2007 with the Ministry of Public Works, Transport and Communications ("MOPTC"), a part of these commitments, up to Euro 159 million would be realised through own projects eligible as contributions to the Information society and incurred under the normal
69

FIRST QUARTER 2008 RESULTS
activity of Sonaecom – Serviços de Comunicações (investments in network and technology, not related with the accomplishment of the obligations assumed under the UMTS License, and activities of research, development and promotion of services, contents and applications). These own projects must be recognized by the MOPTC and by entities created specially for this purpose. At the date of approval of the financial statements, Euro 64 million have already been realised in previous years and validated by the entities referred above. The remainder are under evaluation or are not yet realised. These charges will be recorded at the moment the projects are carried out. The remaining commitments, up to Euro 116 million, will be realised as agreed between Sonaecom- Serviços de Comunicações and MOPTC, through contributions to the project "Initiatives E" (offer of modems, discounts on tariffs, cash contributions, among others, assigned to the widespread use of broadband internet for students and teachers). These contributions will be made through an Open fund, called Fund for the Information Society, to be created by the three mobile operators with business in Portugal. Contributions under this project will be recorded as intangible fixed asset as an additional cost of the UMTS licence, for its discounted value, and will be amortized on a straight-line basis during the remainder period of the license. The success of this project, initiated in the end of 2007, depends on the beneficiaries’ participation in the various initiatives (e-opportunities, e-school and e-teacher) and will determine an eventual revision of the current conditions of the project, to a new model of contributions, to be determined after at least 12 months from the beginning of the project. As so, considering that: (i) the Open fund is not yet created and as a consequence, no financial flows occurred between the Fund and the operators; (ii) the agreement that establishes the specific conditions for implementation of the project "Initiatives E" is still not signed, (iii) the responsibility to recognize depends on uncertain future events, not totally controlled by the company, associated to the uncertainty, at this date, about the success and the future participation on the various iniciatives, and as a consequence, uncertainty about the present value of the responsibility to be recognised; and (iv) if the participation in the iniciatives are not sufficient, the current contract conditions can be reviewed to a new model of contributions (12 months after the beginning of the contract) which can assume the same nature of own projects eligible as contributions to the Information society and incurred under the normal activity, as referred above, so it is not possible to estimate and quantify the correspondent impact in the financial statements; therefore the Board of Directors considers that there is not sufficient information to constitute a secure and reliable estimate of the total responsibility. As a consequence, the company, at 31 March 2008, recognized only in intangible asset the responsibility related to the contributions already effective, in an amount of 4.7 million Euros (Note 7). Also by agreement, between MOPTC, Sonaecom - Serviços de Comunicações and the other mobile operators, it has been clarified and extinguished the commitment of the three operators regarding the acquisition of rights over the usage of frequencies corresponding to the UMTS license from ONIWAY - Infocomunicações, S.A.. In order to settle this responsibility, Optimus was obliged to contribute, in cash, with the amount of Euro 8,313,298.28 for the establishment of the Information Society Fund (Note 7). However, this commitment is guaranteed by shareholders of Oniway until this date. These consolidated financial statements were approved by the Board of Directors on 29 April 2008.
70

FIRST QUARTER 2008 RESULTS
APPENDIX
At 31 de March 2008, the related parties of Sonaecom Group are as follows:
Álvaro Carmona e Costa Portela Jean François PontalÁlvaro Cuervo Garcia Luís Filipe Campos Dias Castro ReisAngêlo Gabriel Ribeirinho dos Santos Paupério Luís Filipe Palmeira LampreiaAntónio Bernardo Aranha da Gama Lobo Xavier Maria Cláudia Teixeira de AzevedoAntónio de Sampaio e Mello Michel Marie BomBelmiro de Azevedo Miguel Nuno Santos AlmeidaDavid Hobley Nuno Manuel Moniz Trigoso JordãoDuarte Paulo Teixeira de Azevedo Nuno Miguel Teixeira AzevedoGeorge Christopher Lawrie Paulo Jorge Henriques PereiraGervais Pellissier Pedro Miguel Freitas Ramalho Carlos
3DO Holding GmbH Bloco W-Sociedade Imobiliária,S.A.3DO Shopping Centre GmbH Boavista Shopping Centre BV3shoppings - Holding,SGPS, S.A. Box Lines Navegação,S.A.Aegean Park,S.A. Campo Limpo, LdaAgepan Eiweiler Management GmbH Canasta-Empreendimentos Imobiliários,S.A.Agepan Flooring Products, S.A.RL Carnes do Continente-Ind.Distr.Carnes,S.A.Agepan Tarket Laminate Park GmbH Co. KG CarPlus – Comércio de Automóveis, S.A.Agloma Investimentos, Sgps, S.A. Casa Agrícola de Ambrães, S.A.Agloma-Soc.Ind.Madeiras e Aglom.,S.A. Casa Agrícola João e A. Pombo, S.A.Águas Furtadas - Imobiliária, S.A. Casa da Ribeira - Hotelaria e Turismo,S.A.Airone - Shopping Center, Srl Cascaishopping- Centro Comercial, S.A.ALEXA Administration GmbH Cascaishopping Holding I, SGPS, S.A.ALEXA Holding GmbH Centro Colombo- Centro Comercial, S.A.ALEXA Shopping Centre GmbH Centro Residencial da Maia,Urban.,S.A.Alexa Site GmbH & Co. KG Centro Vasco da Gama-Centro Comercial,S.A.Algarveshopping- Centro Comercial, S.A. Change, SGPS, S.A.Andar - Sociedade Imobiliária, S.A. Chão Verde-Soc.Gestora Imobiliária,S.A.Aqualuz - Turismo e Lazer, Lda Choice Car - Comércio de Automóveis, S.A.Aquapraia - Investimentos Turísticos,S.A. Choice Car SGPS, S.A.Arrábidashopping- Centro Comercial, S.A. Cia.de Industrias e Negócios,S.A.Aserraderos de Cuellar,S.A. Cinclus Imobiliária,S.A.Atlantic Ferries-Tráf.Loc,Flu.e Marít,S.A. Citorres-Sociedade Imobiliária,S.A.Avenida M-40 B.V. Clérigoshopping- Gestão do C.Comerc.,S.A.Avenida M-40,S.A. Coimbrashopping- Centro Comercial, S.A.Azulino Imobiliária, S.A. Colombo Towers Holding, BVBertimóvel - Sociedade Imobiliária, S.A. Contacto Concessões, SGPS, S.A.Best Offer-Prest. Inf. p/Internet,S.A. Contacto-SGPS,S.A.Bikini, Portal de Mulheres,S.A. Contibomba-Comérc.Distr.Combustiveis,S.A.Bloco Q-Sociedade Imobiliária,S.A. Contimobe-Imobil.Castelo Paiva,S.A.
Key management personnel
Sonae Group Companies
71

FIRST QUARTER 2008 RESULTS
Continente Hipermercados, S.A. Glunz Service GmbHContry Club da Maia-Imobiliaria,S.A. Glunz UK Holdings LtdCronosaúde - Gestão Hospitalar, S.A. Glunz Uka GmbhCumulativa - Sociedade Imobiliária, S.A. Golf Time-Golfe e Invest. Turísticos, S.A.Darbo S.A.S Guerin – Rent a Car (Dois), Lda.Developpement & Partenariat Assurances, S.A. Guimarãeshopping- Centro Comercial, S.A.Difusão-Sociedade Imobiliária,S.A. Hornitex Polska Sp z.o.oDistrifin-Comercio y Prest.Servicios,S.A. Iberian Assets, S.A.DMJB, SGPS, S.A. IGI-Investimento Imobiliário,S.A.Dortmund Tower GmbH Igimo-Sociedade Imobiliária,S.A.Dos Mares - Shopping Centre B.V. Iginha-Sociedade Imobiliária,S.A.Dos Mares-Shopping Centre, S.A. IM Impregnation Management GmbHEcociclo - Energia e Ambiente, S.A. Imoareia - Invest. Turísticos, SGPS, S.A.Ecociclo II - Energias, S.A. Imobiliária da Cacela, S.A.Efanor Investimentos, SGPS, S.A. Imoclub-Serviços Imobilários,S.A.Efanor Serviços de Apoio à Gestão, S.A. Imoconti- Soc.Imobiliária,S.A.Efanor-Design e Serviços,S.A. Imodivor - Sociedade Imobiliária, S.A.Efanor-Indústria de Fios,S.A. Imoestrutura-Soc.Imobiliária,S.A.El Rosal Shopping, S.A. Imoferro-Soc.Imobiliária,S.A.Empreend.Imob.Quinta da Azenha,S.A. Imohotel-Emp.Turist.Imobiliários,S.A.Equador & Mendes,Lda Imomuro-Sociedade Imobiliária,S.A.Espimaia -Sociedade Imobiliária,S.A. Imopenínsula - Sociedade Imobiliária, S.A.Estação Oriente-Gest.de Galerias Com.,S.A. Imoplamac Gestão de Imóveis,S.A.Estação Viana- Centro Comercial, S.A. Imoponte-Soc.Imobiliaria,S.A.Estêvão Neves-Hipermercados Madeira,S.A. Imoresort - Sociedade Imobiliária, S.A.Etablissement A. Mathe, S.A. Imoresultado-Soc.Imobiliaria,S.A.Euro Decorative Boards,Ltd Imosedas-Imobiliária e Seviços,S.A.Euromegantic,Lteé Imosistema-Sociedade Imobiliária,S.A.Euroresinas-Indústrias Quimicas,S.A. Imosonae IIFinlog - Aluguer e Comércio de Automóveis, S.A. Impaper Europe GmbH & Co. KGFozimo-Sociedade Imobiliária,S.A. Implantação - Imobiliária, S.A.Fozmassimo - Sociedade Imobiliária, S.A. Infofield-Informática,S.A.Freccia Rossa- Shopping Centre S.r.l. Inparsa - Gestão Galeria Comercial, S.A.Friengineering International Ltda Inparvi SGPS, S.A.Fundo de Invest. Imobiliário Imosede Insulatroia - Sociedade Imobiliária, S.A.Fundo Invest.Imob.Shopp. Parque D.Pedro Integrum-Serviços Partilhados,S.A.Gaiashopping I- Centro Comercial, S.A. Interclean, S.A.Gaiashopping II- Centro Comercial, S.A. Interlog-SGPS,S.A.GHP Gmbh Inventory-Acessórios de Casa,S.A.Gli Orsi - Shopping Centre, Srl Investalentejo, SGPS, S.A.Global S-Hipermercado,Lda Invsaude - Gestão Hospitalar, S.A.Glunz AG Ipaper-Industria Papeis Impregnados,S.A.
72

FIRST QUARTER 2008 RESULTS
ISF - Imobiliário, Serviços e Participaç Mundo Vip - Operadores Turisticos, S.A.Isoroy SAS NAB, Sociedade Imobiliária,S.A.KLC Holdings XII SA NA-Comércio de Artigos de Desporto, S.A.La Farga - Shopping Center, SL NA-Equipamentos para o Lar, S.A.Larissa Develop. Of Shopping Centers, S.A. Net Mall SGPS, S.A.
Lazam Corretora, Ltda. Norscut - Concessionária de Scut Interior Norte, S.A.
Le Terrazze - Shopping Centre S.r.l. Norte Shop. Retail and Leisure Centre BVLembo Services Ltd (Euro) Norteshopping-Centro Comercial, S.A.Libra Serviços, Lda. Nova Equador Internacional,Ag.Viag.T,LdLidergraf - Artes Gráficas, Lda. Nova Equador P.C.O. e EventosLima Retail Park, S.A. Novobord (PTY) Ltd.Loureshopping- Centro Comercial, S.A. Oeste Retail Park - Gestão G.Comerc., S.A.
Luso Assistência - Gestão de Acidentes, S.A. Operscut - Operação e Manutenção de Auto-estradas, S.A.
Luz del Tajo - Centro Comercial S.A. OSB Deustchland GmbhLuz del Tajo B.V. Paracentro - Gest.de Galerias Com., S.A.Madeirashopping- Centro Comercial, S.A. Pareuro, BVMaiashopping- Centro Comercial, S.A. Pargeste SGPS, S.A.Maiequipa-Gestão Florestal,S.A. Park Avenue Develop. of Shop. Centers S.A.Marcas MC, ZRT Parque Atlântico Shopping - C.C., S.A.Marimo -Exploração Hoteleira Imobiliária Parque D. Pedro 1 B.V.Marina de Tróia S.A. Parque D. Pedro 2 B.V.Marinamagic-Expl.Cent.Lúdicos Marít,Lda Parque de Famalicão - Empr. Imob., S.A.Marmagno-Expl.Hoteleira Imob.,S.A. Parque Principado SLMartimope - Sociedade Imobiliária, S.A. Partnergiro - Empreend. Turísticos, LdaMarvero-Expl.Hoteleira Imob.,S.A. Pátio Boavista Shopping Ltda.MC Property Management S.A. Pátio Campinas Shopping LtdaMDS Corretor de Seguros, S.A. Pátio Goiânia Shopping Ltda
Mediterranean Cosmos Shop. Centre Investments, S.A. Pátio Londrina Empreend. e Particip. Ltda
Megantic BV Pátio Penha Shopping Ltda.MJLF-Empreendimentos Imobiliários, S.A. Pátio São Bernardo Shopping LtdaModalfa-Comércio e Serviços,S.A. Pátio Sertório Shopping LtdaModelo - Dist.de Mat. de Construção,S.A. Peixes do Continente-Ind.Dist.Peixes,S.A.Modelo Cont. Seguros-Soc. De Mediação, Lda PHARMACONTINENTE - Saúde e Higiene, S.A.Modelo Continente - Oper.Retalho SGPS,S.A. PJP - Equipamento de Refrigeração, LdaModelo Continente Hipermercados,S.A. Plaza Eboli B.V.Modelo Continente, SGPS,S.A. Plaza Eboli - Centro Comercial S.A.Modelo Hiper Imobiliária,S.A. Plaza Mayor Holding, SGPS, S.A.Modelo Hipermergados Trading, S.A. Plaza Mayor Parque de Ócio B.V.Modelo.com-Vendas p/Correspond.,S.A. Plaza Mayor Parque de Ocio,S.A.Monselice Centre Srl Plaza Mayor Shopping B.V.Movelpartes-Comp.para Ind.Mobiliária,S.A. Plaza Mayor Shopping, S.A.
73

FIRST QUARTER 2008 RESULTS
Ploiesti Shopping Center (Euro) Project Sierra 7 BVPoliface Brasil, Ltda Project Sierra Brazil 1 B.V.Poliface North America Project Sierra Charagionis 1 S.A.Porturbe-Edificios e Urbanizações,S.A. Project Sierra Germany Shop. Center 1 BVPraedium II-Imobiliária,S.A. Project Sierra Germany Shop. Center 2 BVPraedium III-Serviços Imobiliários,S.A. Project Sierra Italy 5 SrlPraedium SGPS, S.A. Project Sierra One SrlPredicomercial-Promoção Imobiliária,S.A. Project Sierra Spain 1 B.V.Prédios Privados Imobiliária,S.A. Project Sierra Spain 2 B.V.Predisedas-Predial das Sedas,S.A. Project Sierra Spain 2-Centro Comer. S.A.Pridelease Investments, Ltd Project Sierra Spain 3 B.V.Profimetrics - Software Solutions, S.A. Project Sierra Spain 3-Centro Comer. S.A.Proj. Sierra Germany 1 - Shop.C. GmbH Project Sierra Spain 5 BVProj. Sierra Germany 4 (four)-Sh.C.GmbH Project Sierra SrlProj. Sierra Italy 2 - Dev.of Sh.C. Srl Project Sierra SrlProj.Sierra 1 - Shopping Centre GmbH Project Sierra Three SrlProj.Sierra Germany 2 (two)-Sh.C.GmbH Project Sierra Two SrlProj.Sierra Germany 3 (three)-Sh.C.GmbH Promessa Sociedade Imobiliária, S.A.Proj.Sierra Hold. Portugal V, SGPS,S.A. Promosedas-Prom.Imobiliária,S.A.Proj.Sierra Italy 1 -Shop.Centre Srl Prosa-Produtos e serviços agrícolas,S.A.Proj.Sierra Italy 2 -Dev. Of Sh.C.Srl Publimeios-Soc.Gestora Part. Finan.,S.A.Proj.Sierra Italy 3 - Shop. Centre Srl Racionaliz. y Manufact.Florestales,S.A.Proj.Sierra Portugal I- C.Comerc., S.A. Resoflex-Mob.e Equipamentos Gestão,S.A.Proj.Sierra Portugal II-C.Comerc.,S.A. Resolução, SGPS, S.A.Proj.Sierra Portugal III-C.Comerc.,S.A. Rio Sul - Centro Comercial, S.A.Proj.Sierra Portugal IV-C.Comerc.,S.A. River Plaza Mall, SrlProj.Sierra Portugal V-C.Comercial,S.A. Rochester Real Estate,LimitedProj.Sierra Portugal VI-C.Comercial,S.A. S. C. Setler Mina SrlProj.Sierra Portugal VII - C. Comerc.,S.A. S.C. Microcom Doi SrlProj.Sierra Portugal VIII - C.Comerc.,S.A. Saúde Atlântica - Gestão Hospitalar, S.A.Project 4, Srl SC Aegean B.V.Project SC 1 BV SC Insurance Risks Services, SGPS, S.A.Project SC 2 BV SC Mediterraneum Cosmos B.V.Project Sierra 1 B.V. SC-Consultadoria,S.A.Project Sierra 2 B.V. SC-Eng. e promoção imobiliária,SGPS,S.A.Project Sierra 3 BV SCS Beheer,BVProject Sierra 4 BV Selfrio,SGPS,S.A.Project Sierra 5 BV Selfrio-Engenharia do Frio,S.A.Project Sierra 6 BV Selifa-Empreendimentos Imobiliários,S.A.
74

FIRST QUARTER 2008 RESULTS
Sempre à Mão - Sociedade Imobiliária,S.A. Sierra Management II-Gestão de C.C. S.A.Sempre a Postos - Produtos Alimentares e Utilidades , Lda Sierra Management Italy S.r.l.
Serra Shopping - Centro Comercial, S.A. Sierra Management Portugal-Gest. CC,S.A.Sesagest-Proj.Gestão Imobiliária,S.A. Sierra Management Spain-Gestión C.Com.S.A.Sete e Meio - Invest. Consultadoria, S.A. Sierra Management, SGPS, S.A.Sete e Meio Herdades-Inv. Agr. e Tur.,S.A. Sierra Portugal Fund, SarlShopping Centre Colombo Holding, BV Sierra Property Management, SrlShopping Centre Parque Principado B.V. SII - Soberana Invest. Imobiliários, S.A.
Shopping Penha B.V. SIRS - Sociedade Independente de Radiodifusão Sonora, S.A.
Siaf-Soc.Iniciat.Aprov.Florestais,S.A. Sistavac-Sist.Aquecimento,V.Ar C.,S.A.Sic Indoor - Gestão de Suportes Publicitários, S.A. SKK-Central de Distr.,S.A.Sierra Asset Management Luxemburg, Sarl SKKFOR - Ser. For. e Desen. de RecursosSierra Asset Management-Gest. Activos,S.A. SMP-Serv. de Manutenção PlaneamentoSierra Brazil 1 B.V. Soc.Inic.Aproveit.Florest.-Energias,S.A.Sierra Charagionis Develop.Sh. Centre S.A. Sociedade de Construções do Chile, S.A.Sierra Charagionis Propert.Management S.A. Sociedade Imobiliária Troia - B3, S.A.Sierra Corporate Services- Ap.Gestão, S.A. Société de Tranchage Isoroy S.A.S.Sierra Corporate Services Holland, BV Société des Essences Fines IsoroySierra Develop.Iberia 1, Prom.Imob.,S.A. Sociéte Industrielle et Financére IsoroySierra Development Greece, S.A. Socijofra-Sociedade Imobiliária,S.A.Sierra Developments Germany GmbH Sociloures-Soc.Imobiliária,S.A.Sierra Developments Germany Holding B.V. Soconstrução BVSierra Developments Holding B.V. Sodesa, S.A.Sierra Developments Italy S.r.l. Soflorin,BVSierra Developments Services Srl Soira-Soc.Imobiliária de Ramalde,S.A.Sierra Developments Spain-Prom.C.Com.SL Sol Retail Park - Gestão G.Comerc., S.A.Sierra Developments, SGPS, S.A. Solaris Supermercados, S.A.Sierra Developments-Serv. Prom.Imob., S.A. Solinca III-Desporto e S.A.úde,S.A.Sierra Enplanta Ltda Solinca-Investimentos Turísticos,S.A.Sierra European R.R.E. Assets Hold. B.V. Solinfitness - Club Malaga, S.L.Sierra GP Limited Soltroia-Imob.de Urb.Turismo de Tróia,S.A.Sierra Investimentos Brasil Ltda Somit Imobiliária,S.A.Sierra Investments (Holland) 1 B.V. Somit-Soc.Mad.Ind.Transformadas,S.A.Sierra Investments (Holland) 2 B.V. Sonae Capital Brasil, LdaSierra Investments Holding B.V. Sonae Capital,SGPS,S.A.Sierra Investments SGPS, S.A. Sonae Center Serviçoss, SASierra Italy Holding B.V. Sonae Financial Participations BVSierra Man.New Tech.Bus.-Serv.Comu.CC,S.A. Sonae Ind., Prod. e Com.Deriv.Madeira,S.A.Sierra Management Germany GmbH Sonae Indústria Brasil, LtdaSierra Management Hellas SA Sonae Industria de Revestimentos,S.A.
75

FIRST QUARTER 2008 RESULTS
Sonae Indústria-SGPS,S.A. Tafisa Canadá Societé en CommanditeSonae International, Ltd Tafisa France, S.A.Sonae Investments,BV Tafisa UK,LtdSonae Novobord (PTY) Ltd Tafisa-Tableros de Fibras, S.A.Sonae RE, S.A. Taiber,Tableros Aglomerados Ibéricos,SLSonae Retalho Espana-Servicios Gen.,S.A. Tarkett Agepan Laminate Flooring SCSSonae Serviços de Gestão, S.A. Tavapan,S.A.Sonae SGPS, S.A. Tecmasa Reciclados de Andalucia, SLSonae Sierra Brasil Ltda Teconologias del Medio Ambiente,S.A.Sonae Sierra Brazil B.V. Textil do Marco,S.A.Sonae Sierra, SGPS, S.A. Tlantic Portugal-Sist. de Informação, SASonae Tafibra (UK),Ltd Tlantic Sistemas de Informação LtdªSonae Tafibra Benelux, BV Todos os Dias-Com.Ret.Expl.C.Comer.,S.A.Sonae Turismo Gestão e Serviços,S.A. Tool GmbhSonae Turismo-SGPS,S.A. Torre Colombo Ocidente-Imobiliária,S.A.Sonae UK,Ltd. Torre Colombo Oriente-Imobiliária,S.A.Sonaegest-Soc.Gest.Fundos Investimentos Torre São Gabriel-Imobiliária,S.A.Sondis Imobiliária,S.A. TP - Sociedade Térmica, S.A.Sontaria-Empreend.Imobiliários,S.A. Troiaresort-Investimentos Turísticos, S.A.Sontel Bv Troiaverde-Expl.Hoteleira Imob.,S.A.Sontur BV Tulipamar-Expl.Hoteleira Imob.,S.A.Sonvecap BV Unipress - Centro Gráfico, LdaSopair, S.A. Unishopping Administradora Ltda.Sótaqua - Soc. de Empreendimentos Turist Unishopping Consultoria Imob. Ltda.Spanboard Products,Ltd Urbisedas-Imobiliária das Sedas,S.A.Spinarq,S.A. Valecenter SrlSpinveste - Promoção Imobiliária, S.A. Valor N, S.A.Spinveste-Gestão Imobiliária SGII,S.A. Vastgoed One - Sociedade Imobiliária, S.A.Sport Zone-Comércio Art.Desporto,S.A. Vastgoed Sun - Sociedade Imobiliária, S.A.SRP Development, SA Venda Aluga-Sociedade Imobiliária,S.A.SRP-Parque Comercial de Setúbal, S.A. Via Catarina- Centro Comercial, S.A.Star-Viagens e Turismo,S.A. World Trade Center Porto, S.A.Tableros Tradema,S.L. Worten España, S.A.Tafiber,Tableros de Fibras Ibéricas,SL Worten-Equipamento para o Lar,S.A.Tafibras Participações, S.A. Zubiarte Inversiones Inmob,S.A.Tafisa Brasil, S.A.
France Telecom, S.A. Wirefree Services Belgium, S.A.FT Group Companies
76

FIRST QUARTER 2008 RESULTS
77
11. Individual Financial Statements

SONAECOM, S.G.P.S., S.A.
BALANCE SHEETS FOR THE QUARTERS ENDED AT 31 MARCH 2008 AND 2007 AND FOR THE YEAR ENDED AT 31 DECEMBER 2007
(Amounts expressed in Euro)
ASSETS March 2008 March 2007 December 2007
NON CURRENT ASSETS:Tangible assets 173.714 134.506 181.562Intangible assets 65.042 86.942 71.121Investments in group companies 934.496.771 852.656.668 920.727.475Other non current assets 471.954.724 478.228.202 492.695.948
Total non current assets 1.406.690.251 1.331.106.318 1.413.676.106
CURRENT ASSETS:Other current debtors 8.804.007 11.086.525 9.022.179Other current assets 7.058.585 2.103.333 3.766.451Investments recorded at fair value through profit or loss - 950.625 -Cash and cash equivalents 84.173.919 4.665.472 145.779.175
Total current assets 100.036.511 18.805.955 158.567.805
Total assets 1.506.726.762 1.349.912.273 1.572.243.911
SHAREHOLDERS' FUNDS AND LIABILITIES
SHAREHOLDERS' FUNDS:Share capital 366.246.868 366.246.868 366.246.868Own shares (4.662.327) (8.938.165) (8.938.165)Reserves 776.566.983 793.579.549 794.137.940Net income/(loss) for the period 23.104.760 (289.072) (15.334.817)
Total Shareholders' Funds 1.161.256.284 1.150.599.179 1.136.111.826
LIABILITIES:NON CURRENT LIABILITIES:
Medium and long-term loans - net of short-term portion 330.244.218 146.752.870 373.680.136Provisions for other liabilities and charges 26.206 31.979 23.706Other non current liabilities 10.522 277.542 129.379
Total non current liabilities 330.280.946 147.062.390 373.833.221
CURRENT LIABILITIES:Short-term loans and other loans 12.454.224 38.300.207 17.860.473Other creditors 973.171 5.971.578 41.292.121Other current liabilities 1.762.137 7.978.919 3.146.270
Total current liabilities 15.189.532 52.250.704 62.298.864
Total Shareholders' Funds and liabilities 1.506.726.762 1.349.912.273 1.572.243.911
The Chief Accountant The Board of Directors
24

SONAECOM, S.G.P.S., S.A.
PROFIT AND LOSS ACCOUNT BY NATURE
FOR THE QUARTERS ENDED AT 31 MARCH 2008 AND 2007 AND THE YEAR ENDED AT 31 DECEMBER 2007
(Amounts expressed in Euro)
March 2008 March 2007 December 2007
Services rendered 1.651.607 1.513.691 6.776.984Other operating revenues 18.838 68.827 24.183.266
1.670.445 1.582.518 30.960.250
External supplies and services (686.481) (1.840.248) (4.658.695)Staff expenses (1.367.395) (1.198.444) (5.170.239)Depreciation and amortisation (23.565) (17.004) (72.718)Provisions and impairment losses (2.500) - -Other operating costs (14.141) (14.949) (76.530)
(2.094.082) (3.070.645) (9.978.182)
Gains and losses on group companies 21.414.813 101.250 (43.481.386)Other financial expenses (4.512.115) (2.608.971) (13.283.729)Other financial income 6.654.797 3.708.893 20.460.321
Current income/(loss) 23.133.858 (286.955) (15.322.726)
Income taxation (29.098) (2.117) (12.091)
Net income/(loss) 23.104.760 (289.072) (15.334.817)
Earnings per shareIncluding discontinued operations
Basic 0,06 (0,00) (0,04)Diluted 0,06 (0,00) (0,04)
Excluding discontinued operationsBasic 0,06 (0,00) (0,04)Diluted 0,06 (0,00) (0,04)
The Chief Accountant The Board of Directors
25

SONAECOM, S.G.P.S., S.A.
MOVEMENTS IN SHAREHOLDERS' FUNDS
FOR THE QUARTERS ENDED AT 31 MARCH 2008 AND 2007
(Amounts expressed in Euro)
2008
Reserves Own Share Own Share Legal Medium Term Shares Hedging Other Total Netcapital Shares premium reserves Incentive Plans reserves reserves Reserves reserves income/(loss) Total
Balance at 31 December 2007 366.246.868 (8.938.165) 775.290.377 1.002.287 304.296 8.938.165 412.910 8.189.905 794.137.940 (15.334.817) 1.136.111.826
Appropriation of result of 2007 - - - - - - - (15.334.817) (15.334.817) 15.334.817 -Net income/(loss) for the period ended 31 March 2008 - - - - - - - - - 23.104.760 23.104.760Acquisition of own shares - 4.275.838 - - - (4.275.838) - 2.073.732 (2.202.106) - 2.073.732Fair value reserves - - - - - - (171.764) - (171.764) - (171.764)Medium Term Incentive Plans recognition - - - - 137.730 - - - 137.730 - 137.730Balance at 31 March 2008 366.246.868 (4.662.327) 775.290.377 1.002.287 442.026 4.662.327 241.146 (5.071.180) 776.566.983 23.104.760 1.161.256.284
2007
Reserves Own Share Own Share Legal Medium Term Shares Hedging Other Total Netcapital Shares premium reserves Incentive Plans reserves reserves Reservs reserves income/(loss) Total
Balance at 31 December 2006 366.246.868 - 775.290.377 559.078 108.132 - - 8.449.654 784.407.241 9.121.625 1.159.775.734
Appropriation of result of 2006 - - - 443.209 - - - 8.678.416 9.121.625 (9.121.625) -Net income/(loss) for the period ended 31 March 2007 - - - - - - - - - (289.072) (289.072)Acquisition of own shares - (8.938.165) - - - 8.938.165 - (8.938.165) - - (8.938.165)Medium Term Incentive Plans recognition - - - - 50.683 - - - 50.683 - 50.683Balance at 31 March 2007 366.246.868 (8.938.165) 775.290.377 1.002.287 158.815 8.938.165 - 8.189.905 793.579.549 (289.072) 1.150.599.179
Reserves
Reserves
26

FIRST QUARTER 2008 RESULTS
SAFE HARBOUR This document may contain forward-looking information and statements, based on management’s current expectations or beliefs. Forward-looking statements are statements that are not historical facts. These forward-looking statements are subject to a number of factors and uncertainties that could cause actual results to differ materially from those described in the forward-looking statements, including, but not limited to, changes in regulation, the telecommunications industry and economic conditions; and the effects of competition. Forward-looking statements may be identified by words such as “believes”, “expects”, “anticipates”, “projects”, “intends”, “should”, “seeks”, “estimates”, “future” or similar expressions. Although these statements reflect our current expectations, which we believe are reasonable, investors, analysts and, generally, the recipients of this document are cautioned that forward-looking information and statements are subject to various risks and uncertainties, many of which are difficult to predict and generally beyond our control, that could cause actual results and developments to differ materially from those expressed in, or implied or projected by, the forward-looking information and statements. You are cautioned not to put undue reliance on any forward-looking information or statements. We do not undertake any obligation to update any forward-looking information or statements.
Report available in Sonaecom’s institutional website www.sonae.com
Media and Investor Contacts
Isabel Borgas Public Relations Manager
[email protected]: +351 93 100 20 20
António Castro
Investor Relations Manager [email protected]
Tel: +351 93 100 20 99
19
Sonaecom SGPS, SA Rua Henrique Pousão, 432 – 7th floor
4460-841 Senhora da Hora Portugal


![FY 2016 1st Quarter Consolidated Financial Results /media/NSG/Site Content/ir/Financial Reports... · Nippon Sheet Glass Co., Ltd. [5202] FY 2016 Q1 Consolidated Financial](https://img.pdfslide.net/doc/110x75/5b99bc4209d3f29c338cd644/fy-2016-1st-quarter-consolidated-financial-results-mediansgsite-contentirfinancial.jpg)