Embed Size (px)
Citation preview
Consolidated Results
December 2011
1
This document contains a discussion of consolidated and individual results of the major companies
of the Andino Group.
These results have been prepared under Peruvian GAAP standards and constitute Interim Financial
Statements.
The Audited Financial Statements will be reported under IFRS.
Financial Statements
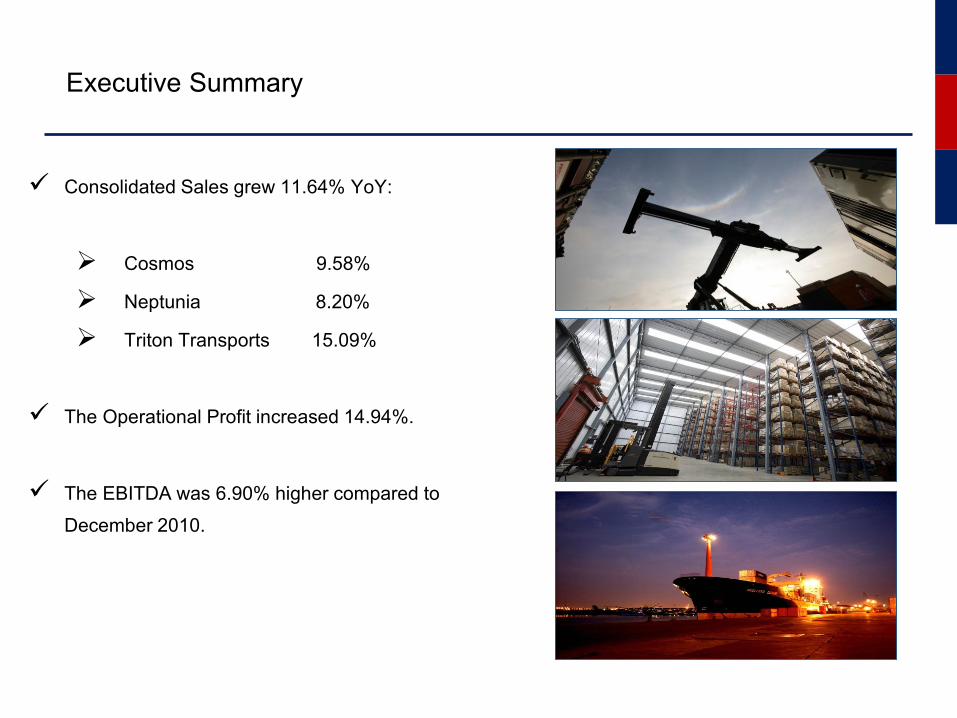
Consolidated Sales grew 11.64% YoY:
Cosmos 9.58%
Neptunia 8.20%
Triton Transports 15.09%
The Operational Profit increased 14.94%.
The EBITDA was 6.90% higher compared to
December 2010.
Executive Summary
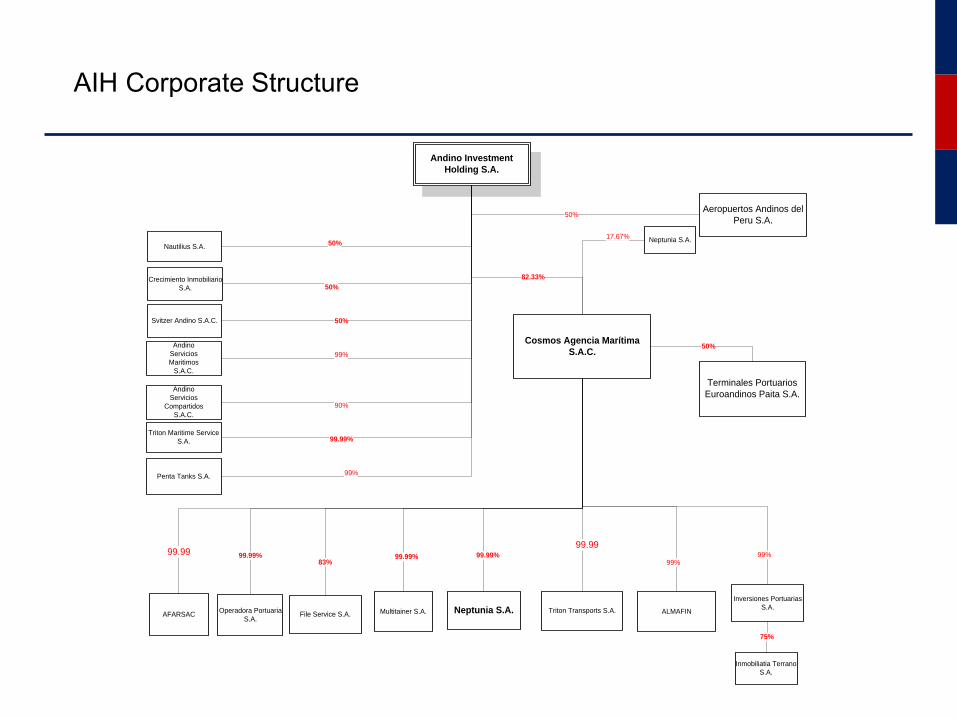
Andino Investment
Holding S.A.
50%Nautilius S.A.
Crecimiento Inmobiliario
S.A. 50%
Svitzer Andino S.A.C. 50%
Cosmos Agencia Marítima
S.A.C.
82.33%
Neptunia S.A.
99.99%
AFARSAC
Triton Maritime Service
S.A. 99.99%
Terminales Portuarios
Euroandinos Paita S.A.
50%
File Service S.A.Triton Transports S.A.Multitainer S.A.Operadora Portuaria
S.A.
Inversiones Portuarias
S.A.
Inmobiliatia Terrano
S.A.
83%99.99% 99%
75%
99.99%
Aeropuertos Andinos del
Peru S.A.50%
Penta Tanks S.A.99%
ALMAFIN
99%
Neptunia S.A.17.67%
Andino
Servicios
Compartidos
S.A.C.
Andino
Servicios
Maritimos
S.A.C.
90%
99%
99.9999.99
AIH Corporate Structure
AIH Consolidated: Balance Sheet and P&L Statement
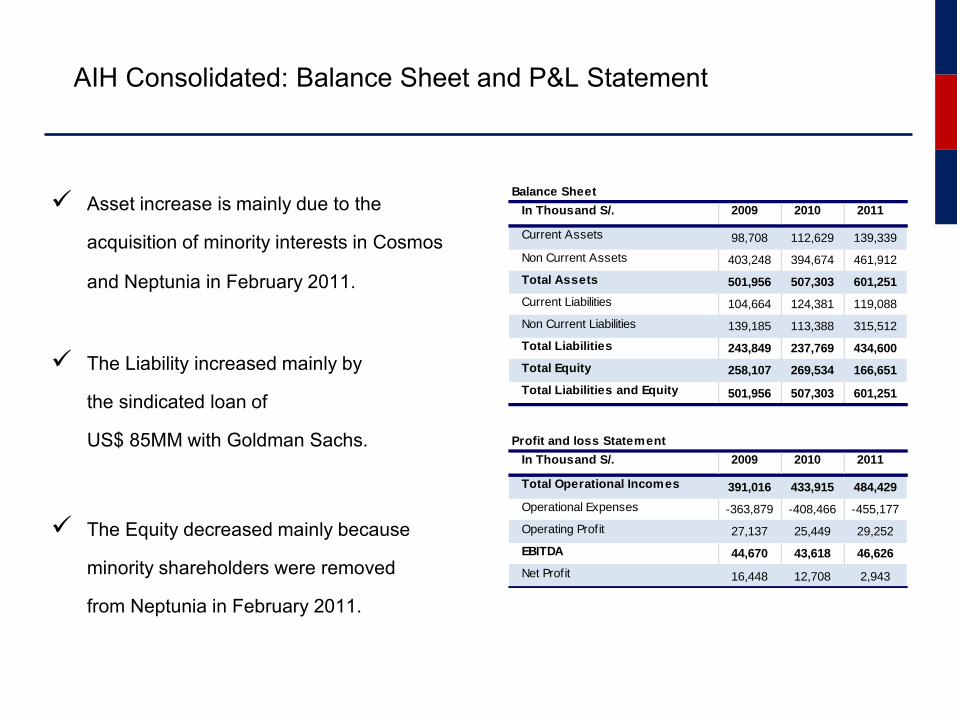
Asset increase is mainly due to the
acquisition of minority interests in Cosmos
and Neptunia in February 2011.
The Liability increased mainly by
the sindicated loan of
US$ 85MM with Goldman Sachs.
The Equity decreased mainly because
minority shareholders were removed
from Neptunia in February 2011.
Balance Sheet
In Thousand S/. 2009 2010 2011
Current Assets 98,708 112,629 139,339
Non Current Assets 403,248 394,674 461,912
Total Assets 501,956 507,303 601,251
Current Liabilities 104,664 124,381 119,088
Non Current Liabilities 139,185 113,388 315,512
Total Liabilities 243,849 237,769 434,600
Total Equity 258,107 269,534 166,651
Total Liabilities and Equity 501,956 507,303 601,251
Profit and loss Statement
In Thousand S/. 2009 2010 2011
Total Operational Incomes 391,016 433,915 484,429
Operational Expenses -363,879 -408,466 -455,177
Operating Profit 27,137 25,449 29,252
EBITDA 44,670 43,618 46,626
Net Profit 16,448 12,708 2,943
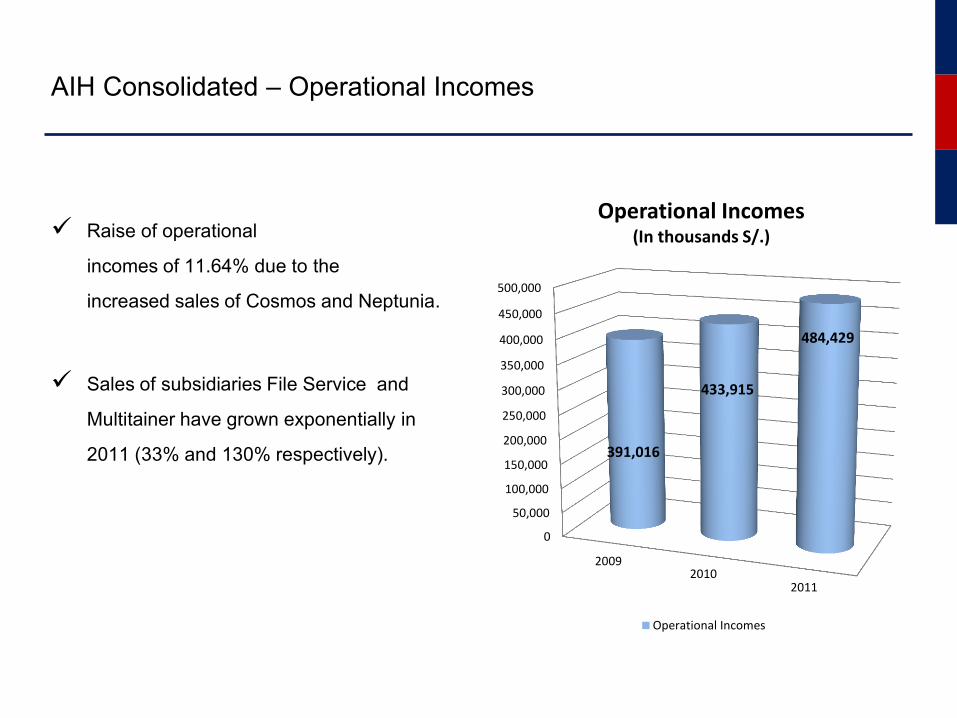
AIH Consolidated – Operational Incomes
Raise of operational
incomes of 11.64% due to the
increased sales of Cosmos and Neptunia.
Sales of subsidiaries File Service and
Multitainer have grown exponentially in
2011 (33% and 130% respectively).
0
50,000
100,000
150,000
200,000
250,000
300,000
350,000
400,000
450,000
500,000
20092010
2011
391,016
433,915
484,429
Operational Incomes (In thousands S/.)
Operational Incomes
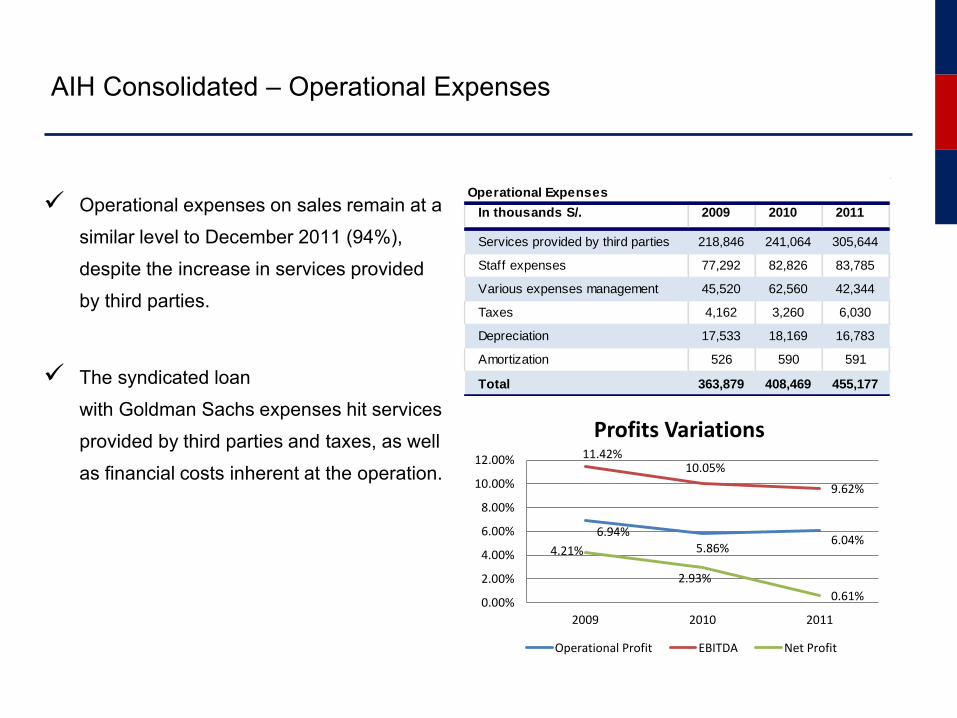
Operational expenses on sales remain at a
similar level to December 2011 (94%),
despite the increase in services provided
by third parties.
The syndicated loan
with Goldman Sachs expenses hit services
provided by third parties and taxes, as well
as financial costs inherent at the operation.
AIH Consolidated – Operational Expenses
6.94% 5.86%
6.04%
11.42% 10.05%
9.62%
4.21%
2.93%
0.61% 0.00%
2.00%
4.00%
6.00%
8.00%
10.00%
12.00%
2009 2010 2011
Profits Variations
Operational Profit EBITDA Net Profit
Operational Expenses
In thousands S/. 2009 2010 2011
Services provided by third parties 218,846 241,064 305,644
Staff expenses 77,292 82,826 83,785
Various expenses management 45,520 62,560 42,344
Taxes 4,162 3,260 6,030
Depreciation 17,533 18,169 16,783
Amortization 526 590 591
Total 363,879 408,469 455,177
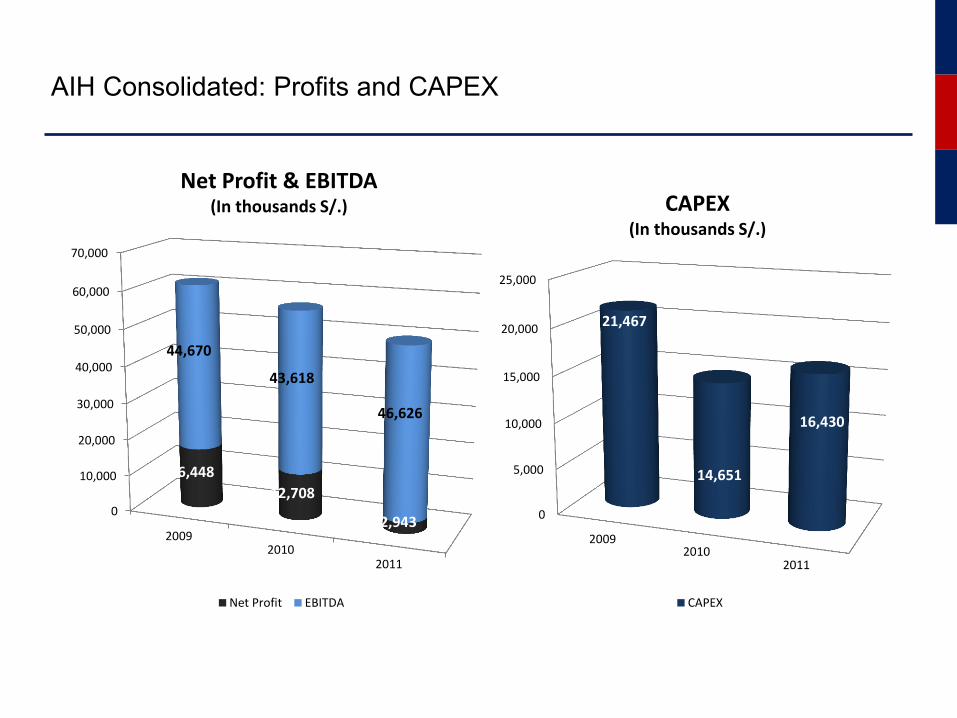
AIH Consolidated: Profits and CAPEX
0
10,000
20,000
30,000
40,000
50,000
60,000
70,000
20092010
2011
16,448
12,708
2,943
44,670
43,618
46,626
Net Profit & EBITDA (In thousands S/.)
Net Profit EBITDA
0
5,000
10,000
15,000
20,000
25,000
20092010
2011
21,467
14,651
16,430
CAPEX (In thousands S/.)
CAPEX
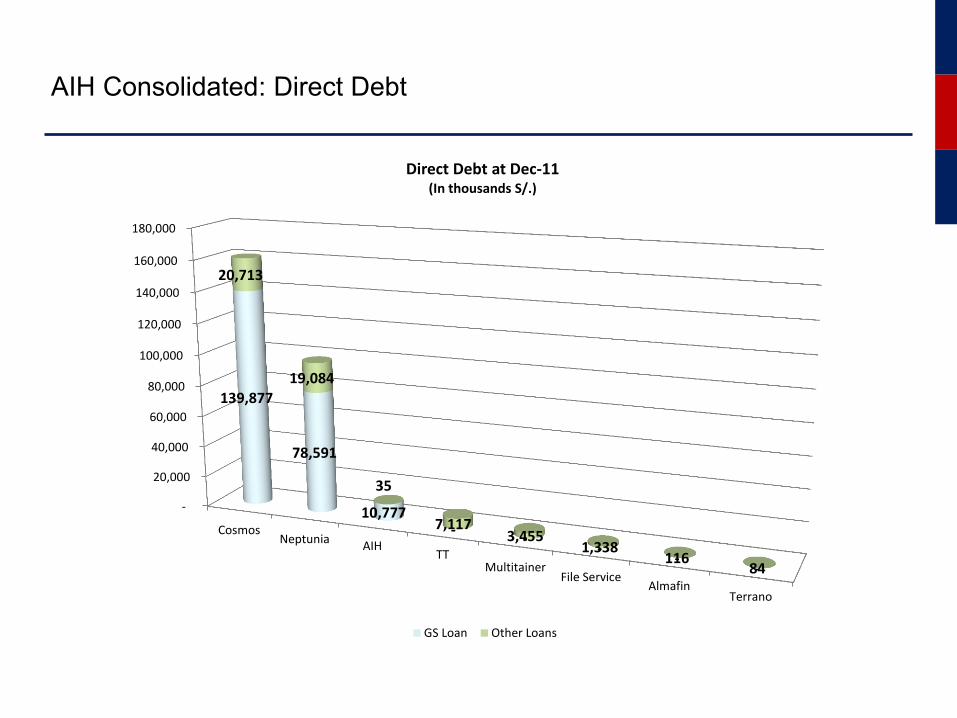
AIH Consolidated: Direct Debt
-
20,000
40,000
60,000
80,000
100,000
120,000
140,000
160,000
180,000
CosmosNeptunia
AIHTT
MultitainerFile Service
AlmafinTerrano
139,877
78,591
10,777 -
- -
- -
20,713
19,084
35
7,117 3,455
1,338 116
84
Direct Debt at Dec-11 (In thousands S/.)
GS Loan Other Loans
AIH Consolidated: Covenants of Goldman Sachs’s Syndicated
Loan
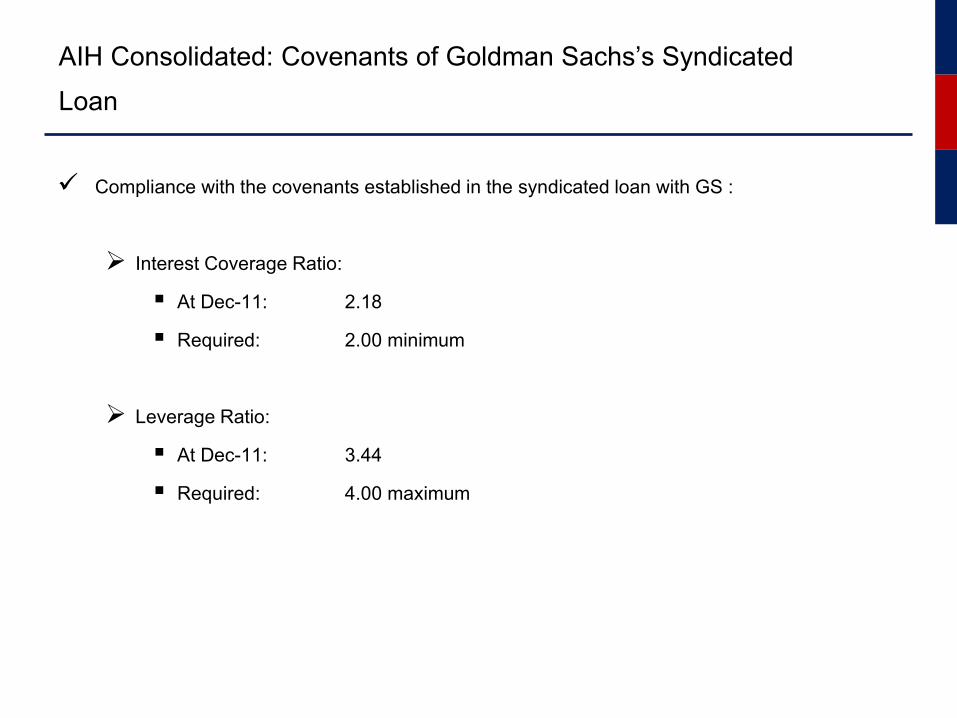
Compliance with the covenants established in the syndicated loan with GS :
Interest Coverage Ratio:
At Dec-11: 2.18
Required: 2.00 minimum
Leverage Ratio:
At Dec-11: 3.44
Required: 4.00 maximum
Subsidiaries: Cosmos Agencia Marítima SAC
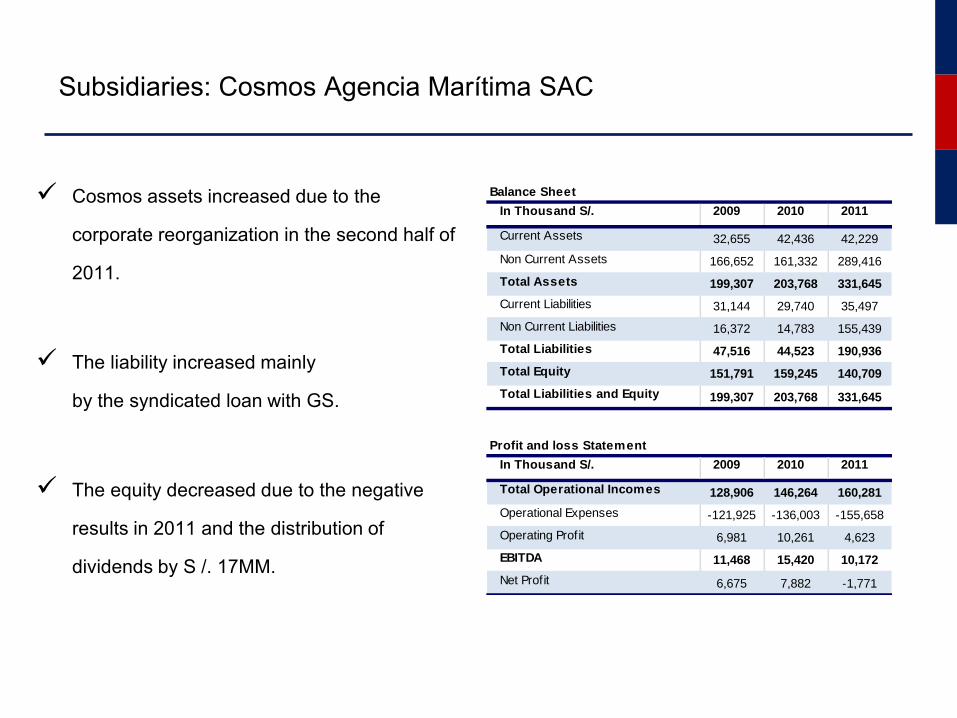
Cosmos assets increased due to the
corporate reorganization in the second half of
2011.
The liability increased mainly
by the syndicated loan with GS.
The equity decreased due to the negative
results in 2011 and the distribution of
dividends by S /. 17MM.
Balance Sheet
In Thousand S/. 2009 2010 2011
Current Assets 32,655 42,436 42,229
Non Current Assets 166,652 161,332 289,416
Total Assets 199,307 203,768 331,645
Current Liabilities 31,144 29,740 35,497
Non Current Liabilities 16,372 14,783 155,439
Total Liabilities 47,516 44,523 190,936
Total Equity 151,791 159,245 140,709
Total Liabilities and Equity 199,307 203,768 331,645
Profit and loss Statement
In Thousand S/. 2009 2010 2011
Total Operational Incomes 128,906 146,264 160,281
Operational Expenses -121,925 -136,003 -155,658
Operating Profit 6,981 10,261 4,623
EBITDA 11,468 15,420 10,172
Net Profit 6,675 7,882 -1,771
Cosmos Agencia Marítima SAC – Operational Incomes
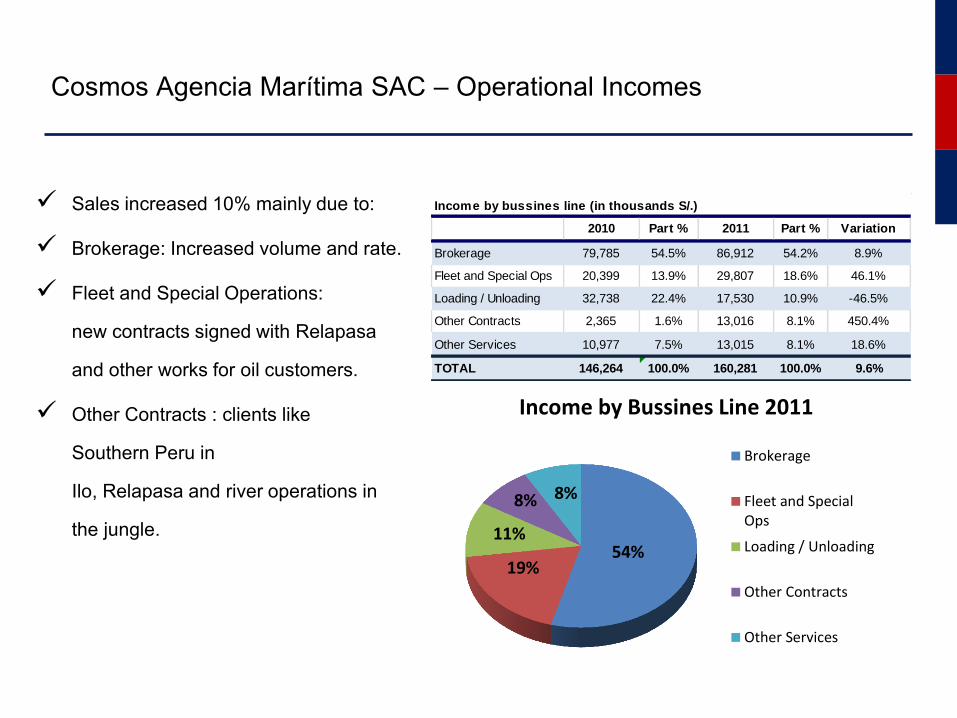
Sales increased 10% mainly due to:
Brokerage: Increased volume and rate.
Fleet and Special Operations:
new contracts signed with Relapasa
and other works for oil customers.
Other Contracts : clients like
Southern Peru in
Ilo, Relapasa and river operations in
the jungle. 54%
19%
11%
8% 8%
Income by Bussines Line 2011
Brokerage
Fleet and SpecialOps
Loading / Unloading
Other Contracts
Other Services
Income by bussines line (in thousands S/.)
2010 Part % 2011 Part % Variation
Brokerage 79,785 54.5% 86,912 54.2% 8.9%
Fleet and Special Ops 20,399 13.9% 29,807 18.6% 46.1%
Loading / Unloading 32,738 22.4% 17,530 10.9% -46.5%
Other Contracts 2,365 1.6% 13,016 8.1% 450.4%
Other Services 10,977 7.5% 13,015 8.1% 18.6%
TOTAL 146,264 100.0% 160,281 100.0% 9.6%
Cosmos Agencia Marítima SAC: Operational Expenses
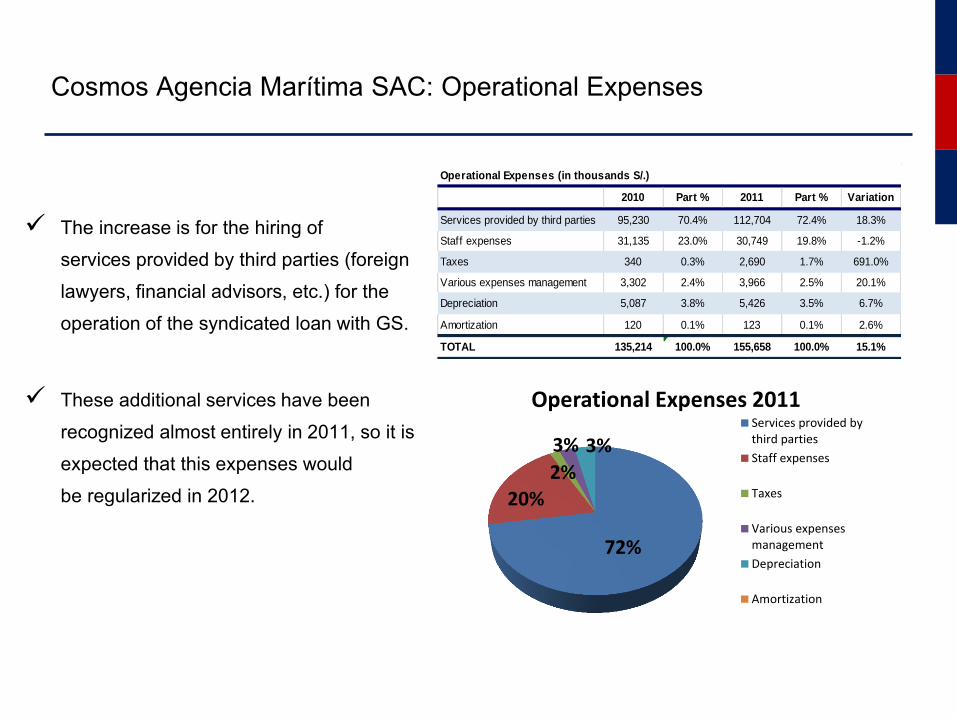
The increase is for the hiring of
services provided by third parties (foreign
lawyers, financial advisors, etc.) for the
operation of the syndicated loan with GS.
These additional services have been
recognized almost entirely in 2011, so it is
expected that this expenses would
be regularized in 2012.
Operational Expenses (in thousands S/.)
2010 Part % 2011 Part % Variation
Services provided by third parties 95,230 70.4% 112,704 72.4% 18.3%
Staff expenses 31,135 23.0% 30,749 19.8% -1.2%
Taxes 340 0.3% 2,690 1.7% 691.0%
Various expenses management 3,302 2.4% 3,966 2.5% 20.1%
Depreciation 5,087 3.8% 5,426 3.5% 6.7%
Amortization 120 0.1% 123 0.1% 2.6%
TOTAL 135,214 100.0% 155,658 100.0% 15.1%
72%
20%
2%
3% 3%
Operational Expenses 2011 Services provided bythird parties
Staff expenses
Taxes
Various expensesmanagement
Depreciation
Amortization
Subsidiaries: Neptunia S.A.
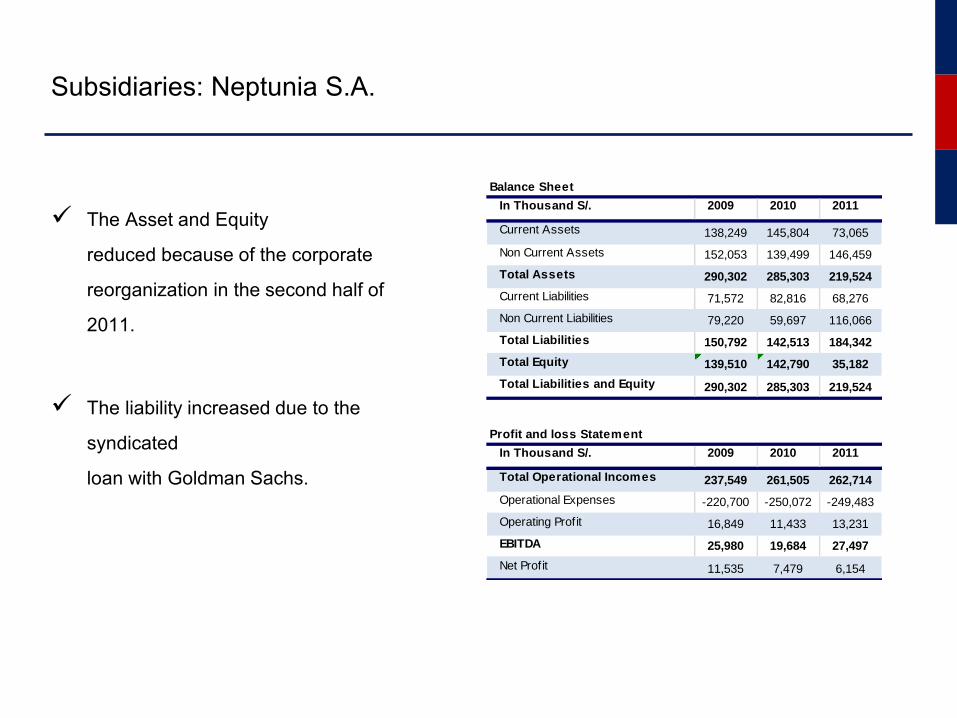
The Asset and Equity
reduced because of the corporate
reorganization in the second half of
2011.
The liability increased due to the
syndicated
loan with Goldman Sachs.
Balance Sheet
In Thousand S/. 2009 2010 2011
Current Assets 138,249 145,804 73,065
Non Current Assets 152,053 139,499 146,459
Total Assets 290,302 285,303 219,524
Current Liabilities 71,572 82,816 68,276
Non Current Liabilities 79,220 59,697 116,066
Total Liabilities 150,792 142,513 184,342
Total Equity 139,510 142,790 35,182
Total Liabilities and Equity 290,302 285,303 219,524
Profit and loss Statement
In Thousand S/. 2009 2010 2011
Total Operational Incomes 237,549 261,505 262,714
Operational Expenses -220,700 -250,072 -249,483
Operating Profit 16,849 11,433 13,231
EBITDA 25,980 19,684 27,497
Net Profit 11,535 7,479 6,154
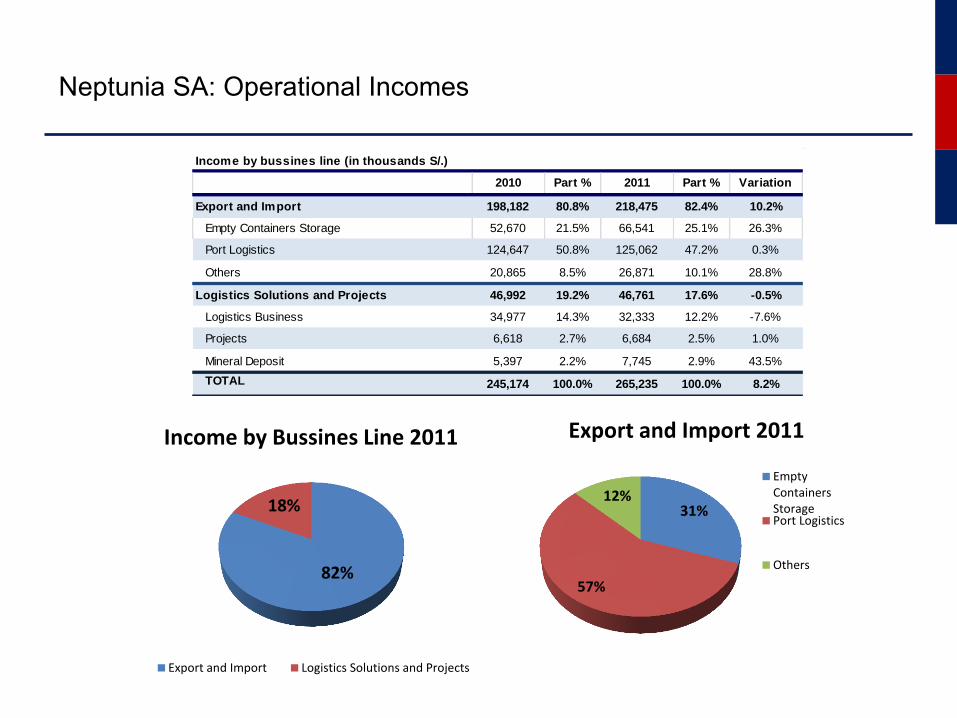
Neptunia SA: Operational Incomes
82%
18%
Income by Bussines Line 2011
Export and Import Logistics Solutions and Projects
Income by bussines line (in thousands S/.)
2010 Part % 2011 Part % Variation
Export and Import 198,182 80.8% 218,475 82.4% 10.2%
Empty Containers Storage 52,670 21.5% 66,541 25.1% 26.3%
Port Logistics 124,647 50.8% 125,062 47.2% 0.3%
Others 20,865 8.5% 26,871 10.1% 28.8%
Logistics Solutions and Projects 46,992 19.2% 46,761 17.6% -0.5%
Logistics Business 34,977 14.3% 32,333 12.2% -7.6%
Projects 6,618 2.7% 6,684 2.5% 1.0%
Mineral Deposit 5,397 2.2% 7,745 2.9% 43.5%
TOTAL 245,174 100.0% 265,235 100.0% 8.2%
31%
57%
12%
Export and Import 2011
EmptyContainersStoragePort Logistics
Others
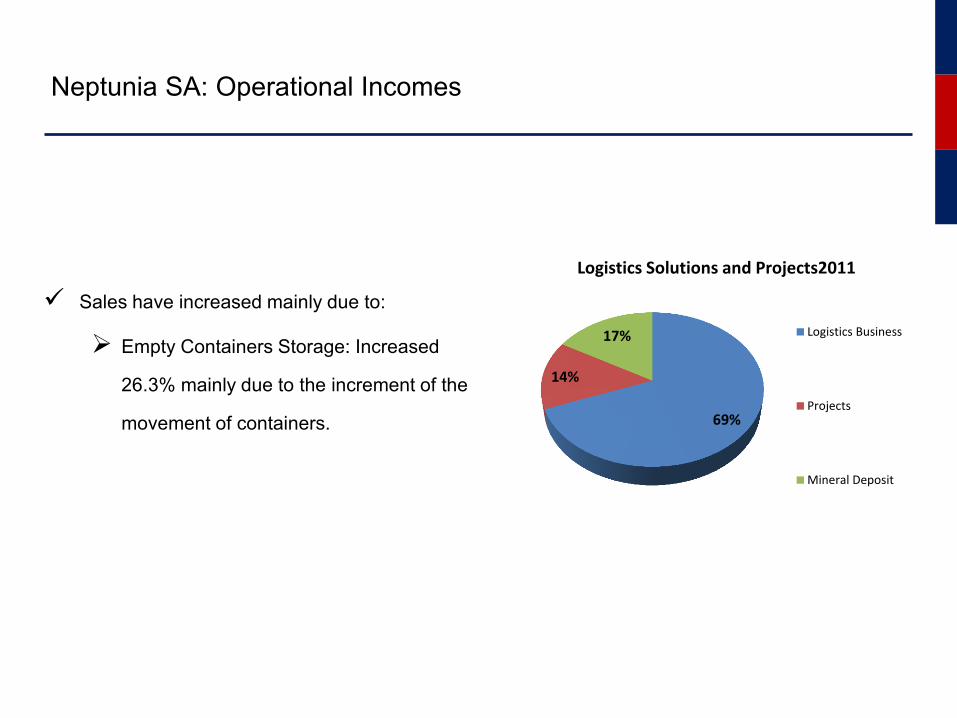
Neptunia SA: Operational Incomes
Sales have increased mainly due to:
Empty Containers Storage: Increased
26.3% mainly due to the increment of the
movement of containers.
69%
14%
17%
Logistics Solutions and Projects2011
Logistics Business
Projects
Mineral Deposit
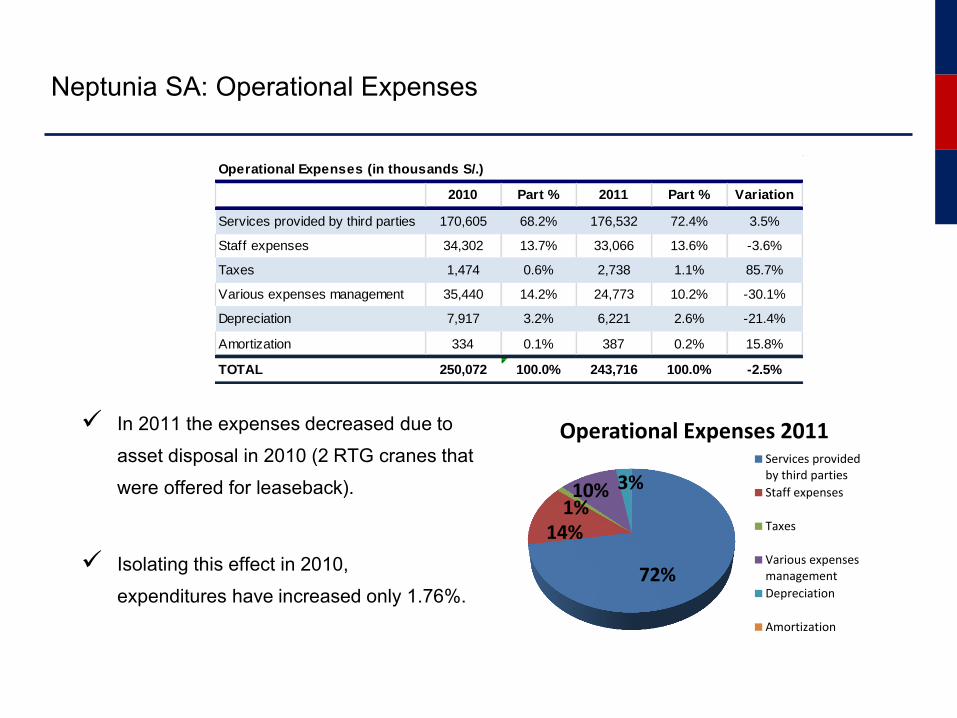
Neptunia SA: Operational Expenses
In 2011 the expenses decreased due to
asset disposal in 2010 (2 RTG cranes that
were offered for leaseback).
Isolating this effect in 2010,
expenditures have increased only 1.76%.
Operational Expenses (in thousands S/.)
2010 Part % 2011 Part % Variation
Services provided by third parties 170,605 68.2% 176,532 72.4% 3.5%
Staff expenses 34,302 13.7% 33,066 13.6% -3.6%
Taxes 1,474 0.6% 2,738 1.1% 85.7%
Various expenses management 35,440 14.2% 24,773 10.2% -30.1%
Depreciation 7,917 3.2% 6,221 2.6% -21.4%
Amortization 334 0.1% 387 0.2% 15.8%
TOTAL 250,072 100.0% 243,716 100.0% -2.5%
72%
14% 1% 10% 3%
Operational Expenses 2011 Services providedby third parties
Staff expenses
Taxes
Various expensesmanagement
Depreciation
Amortization
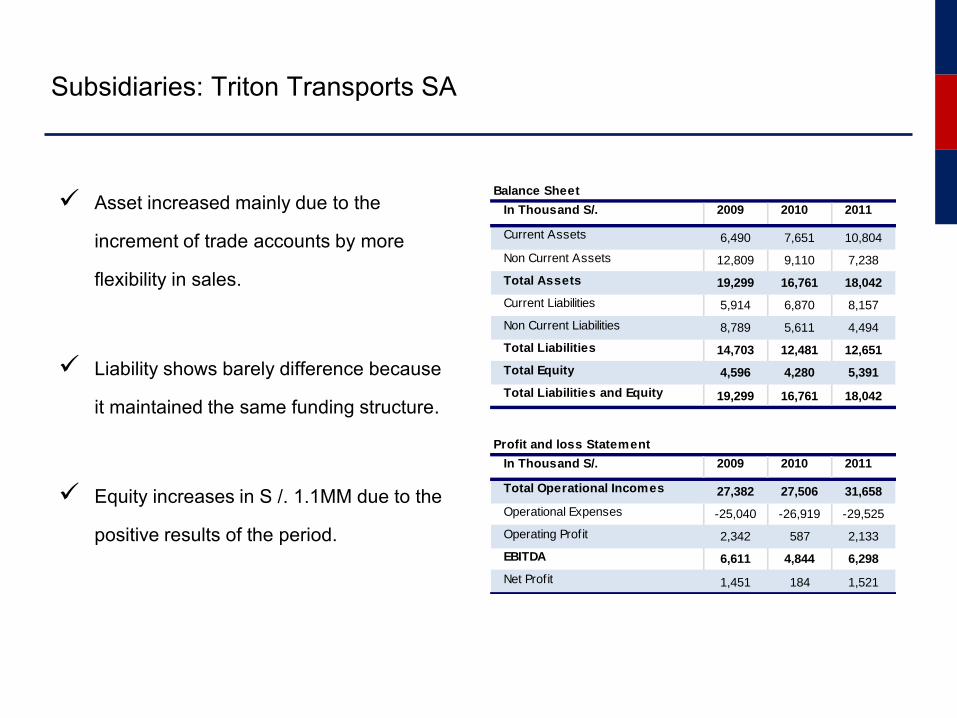
Subsidiaries: Triton Transports SA
Asset increased mainly due to the
increment of trade accounts by more
flexibility in sales.
Liability shows barely difference because
it maintained the same funding structure.
Equity increases in S /. 1.1MM due to the
positive results of the period.
Balance Sheet
In Thousand S/. 2009 2010 2011
Current Assets 6,490 7,651 10,804
Non Current Assets 12,809 9,110 7,238
Total Assets 19,299 16,761 18,042
Current Liabilities 5,914 6,870 8,157
Non Current Liabilities 8,789 5,611 4,494
Total Liabilities 14,703 12,481 12,651
Total Equity 4,596 4,280 5,391
Total Liabilities and Equity 19,299 16,761 18,042
Profit and loss Statement
In Thousand S/. 2009 2010 2011
Total Operational Incomes 27,382 27,506 31,658
Operational Expenses -25,040 -26,919 -29,525
Operating Profit 2,342 587 2,133
EBITDA 6,611 4,844 6,298
Net Profit 1,451 184 1,521
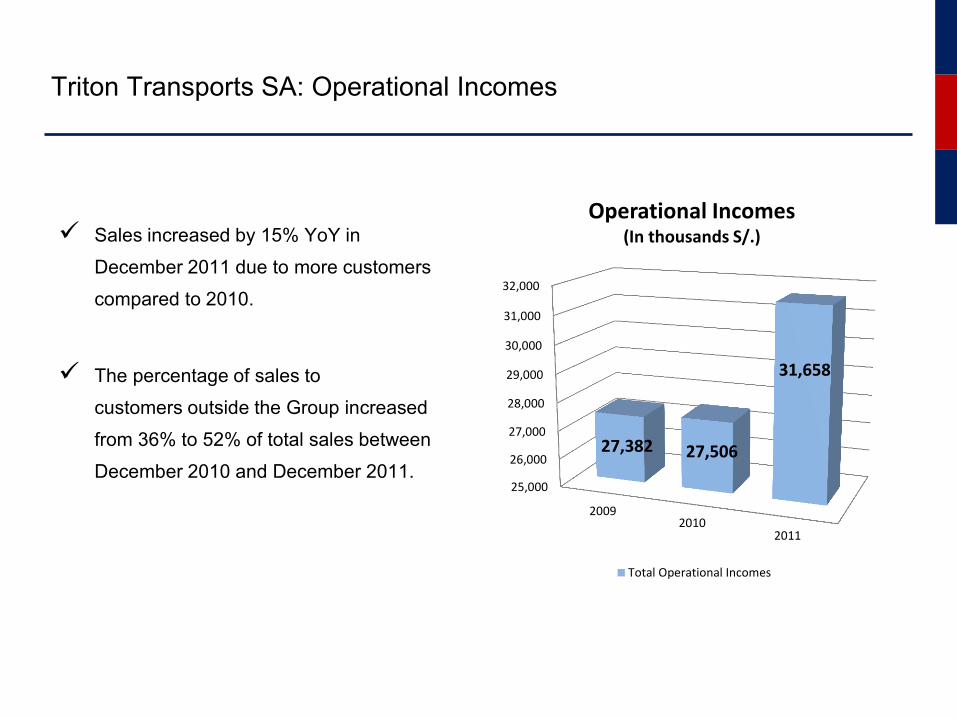
Triton Transports SA: Operational Incomes
Sales increased by 15% YoY in
December 2011 due to more customers
compared to 2010.
The percentage of sales to
customers outside the Group increased
from 36% to 52% of total sales between
December 2010 and December 2011. 25,000
26,000
27,000
28,000
29,000
30,000
31,000
32,000
20092010
2011
27,382 27,506
31,658
Operational Incomes (In thousands S/.)
Total Operational Incomes
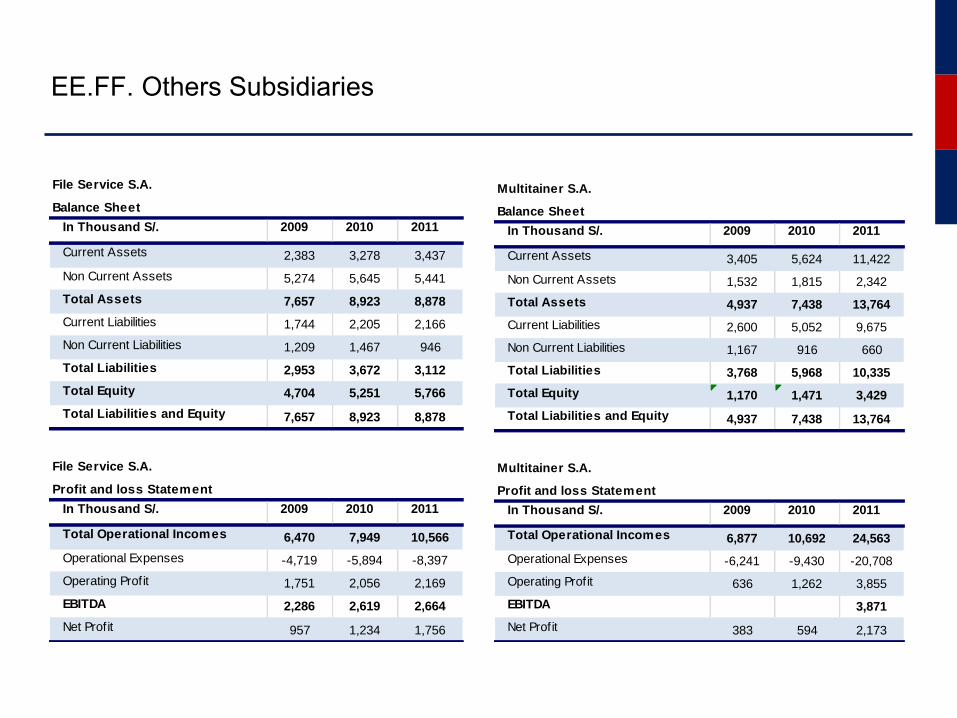
EE.FF. Others Subsidiaries
File Service S.A.
Balance Sheet
In Thousand S/. 2009 2010 2011
Current Assets 2,383 3,278 3,437
Non Current Assets 5,274 5,645 5,441
Total Assets 7,657 8,923 8,878
Current Liabilities 1,744 2,205 2,166
Non Current Liabilities 1,209 1,467 946
Total Liabilities 2,953 3,672 3,112
Total Equity 4,704 5,251 5,766
Total Liabilities and Equity 7,657 8,923 8,878
File Service S.A.
Profit and loss Statement
In Thousand S/. 2009 2010 2011
Total Operational Incomes 6,470 7,949 10,566
Operational Expenses -4,719 -5,894 -8,397
Operating Profit 1,751 2,056 2,169
EBITDA 2,286 2,619 2,664
Net Profit 957 1,234 1,756
Multitainer S.A.
Balance Sheet
In Thousand S/. 2009 2010 2011
Current Assets 3,405 5,624 11,422
Non Current Assets 1,532 1,815 2,342
Total Assets 4,937 7,438 13,764
Current Liabilities 2,600 5,052 9,675
Non Current Liabilities 1,167 916 660
Total Liabilities 3,768 5,968 10,335
Total Equity 1,170 1,471 3,429
Total Liabilities and Equity 4,937 7,438 13,764
Multitainer S.A.
Profit and loss Statement
In Thousand S/. 2009 2010 2011
Total Operational Incomes 6,877 10,692 24,563
Operational Expenses -6,241 -9,430 -20,708
Operating Profit 636 1,262 3,855
EBITDA 3,871
Net Profit 383 594 2,173
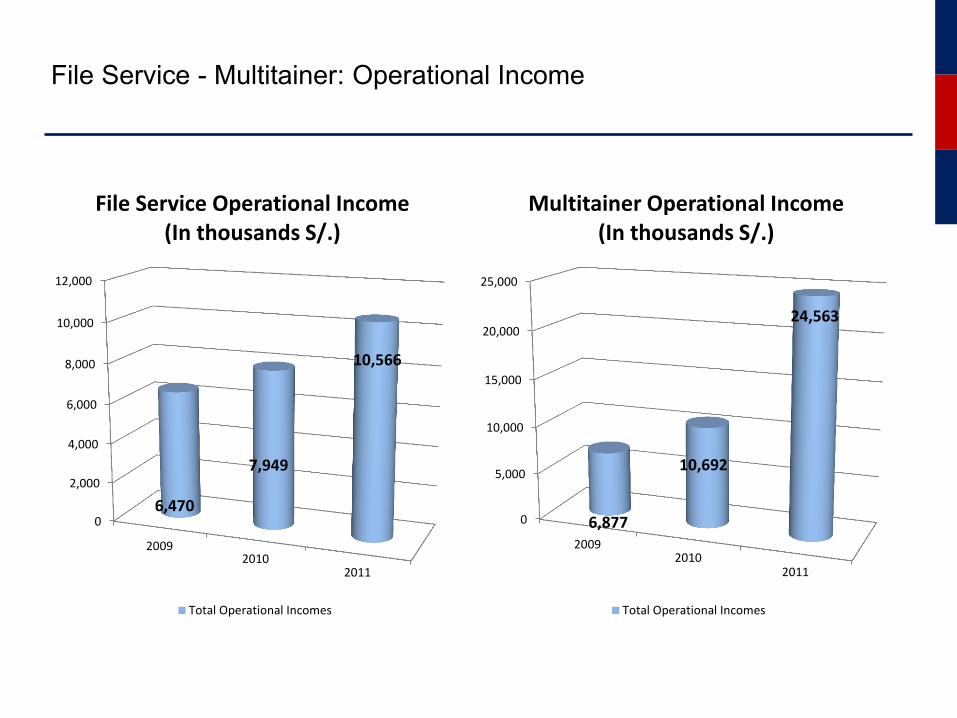
File Service - Multitainer: Operational Income
0
2,000
4,000
6,000
8,000
10,000
12,000
20092010
2011
6,470
7,949
10,566
File Service Operational Income (In thousands S/.)
Total Operational Incomes
0
5,000
10,000
15,000
20,000
25,000
20092010
2011
6,877
10,692
24,563
Multitainer Operational Income (In thousands S/.)
Total Operational Incomes
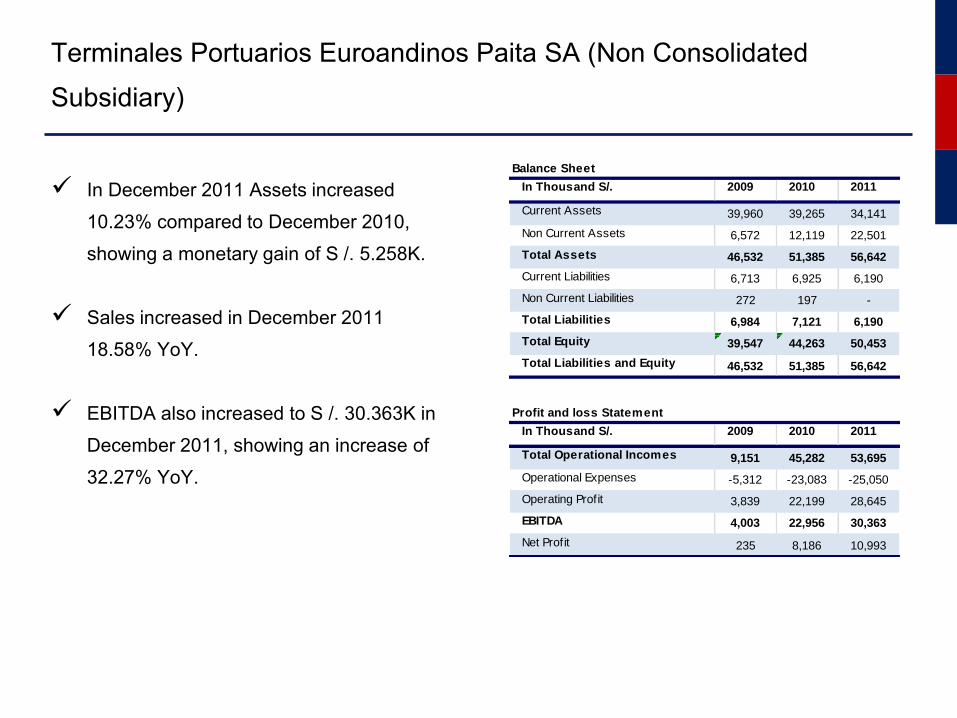
Terminales Portuarios Euroandinos Paita SA (Non Consolidated
Subsidiary)
In December 2011 Assets increased
10.23% compared to December 2010,
showing a monetary gain of S /. 5.258K.
Sales increased in December 2011
18.58% YoY.
EBITDA also increased to S /. 30.363K in
December 2011, showing an increase of
32.27% YoY.
Balance Sheet
In Thousand S/. 2009 2010 2011
Current Assets 39,960 39,265 34,141
Non Current Assets 6,572 12,119 22,501
Total Assets 46,532 51,385 56,642
Current Liabilities 6,713 6,925 6,190
Non Current Liabilities 272 197 -
Total Liabilities 6,984 7,121 6,190
Total Equity 39,547 44,263 50,453
Total Liabilities and Equity 46,532 51,385 56,642
Profit and loss Statement
In Thousand S/. 2009 2010 2011
Total Operational Incomes 9,151 45,282 53,695
Operational Expenses -5,312 -23,083 -25,050
Operating Profit 3,839 22,199 28,645
EBITDA 4,003 22,956 30,363
Net Profit 235 8,186 10,993
After the IPO held on February 2, 2012 and in compliance with the syndicated credit
agreement with Goldman Sachs, Andino offered to lenders 50% of the funds collected.
Only two of them accepted the offer of pre-payment, totaling an amount of $ 8'496, 346.99 and
which was redeemed on 17 February 2012.
Amortization of the Syndicated Loan with Goldman Sachs
Infrastructure
Maritime Services
Logistics Services
Contacts:
Jose Balta Del Rio
Corporate Chief Financial Officer
(511) 7144444
Susanne Noltenius Aurich
Investor Relations Officer
(511) 3154200
![Announces Q3 Results (Standalone & Consolidated), Limited Review Report (Standalone & Consolidated) & Results Press Release for the Quarter ended December 31, 2015 [Result]](https://img.pdfslide.net/doc/110x75/577c98931a28ab163a8b6d49/announces-q3-results-standalone-consolidated-limited-review-report-standalone.jpg)


![Audited Consolidated financial results & Auditors Report (Consolidated) for the period ended December 31, 2015 [Result]](https://img.pdfslide.net/doc/110x75/577c7d731a28abe0549ed6a5/audited-consolidated-financial-results-auditors-report-consolidated-for.jpg)


![Announces Consolidated Q3 results, Limited Review Report & Results Press Release for the Quarter ended December 31, 2015 [Result]](https://img.pdfslide.net/doc/110x75/577ca5d61a28abea748bab91/announces-consolidated-q3-results-limited-review-report-results-press-release.jpg)