Embed Size (px)
Citation preview
1 American Institute of Aeronautics and Astronautics
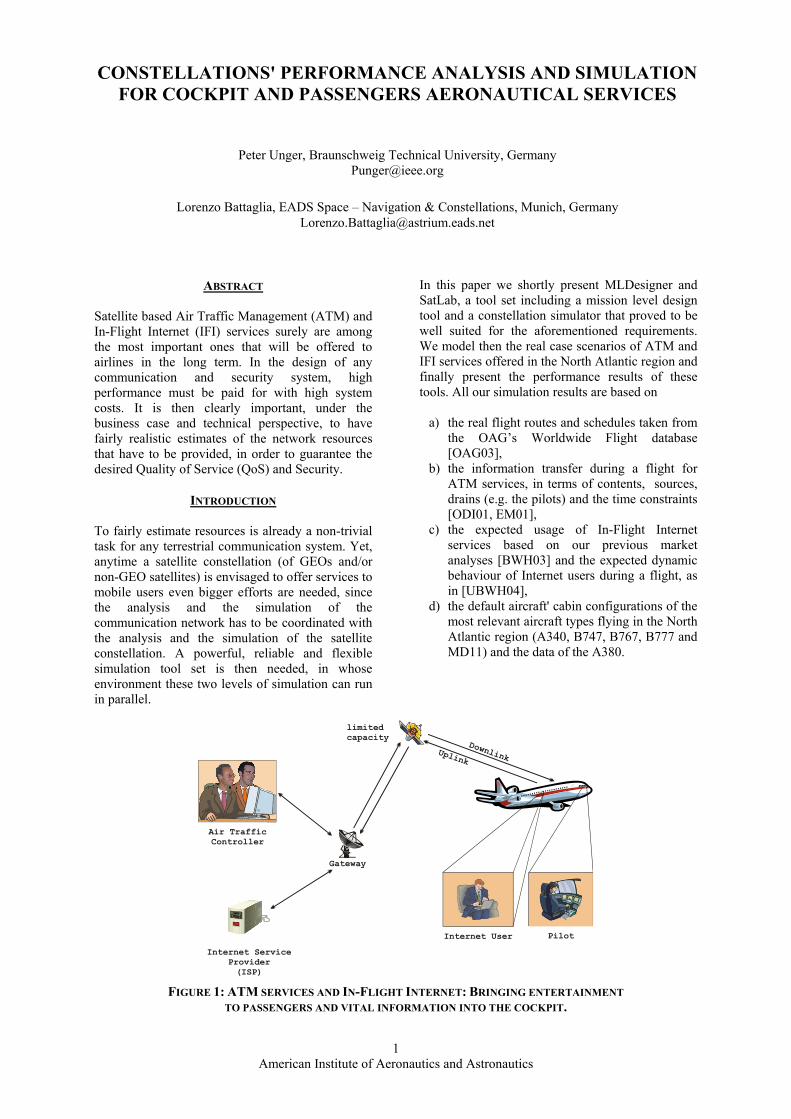
ABSTRACT Satellite based Air Traffic Management (ATM) and In-Flight Internet (IFI) services surely are among the most important ones that will be offered to airlines in the long term. In the design of any communication and security system, high performance must be paid for with high system costs. It is then clearly important, under the business case and technical perspective, to have fairly realistic estimates of the network resources that have to be provided, in order to guarantee the desired Quality of Service (QoS) and Security.
INTRODUCTION To fairly estimate resources is already a non-trivial task for any terrestrial communication system. Yet, anytime a satellite constellation (of GEOs and/or non-GEO satellites) is envisaged to offer services to mobile users even bigger efforts are needed, since the analysis and the simulation of the communication network has to be coordinated with the analysis and the simulation of the satellite constellation. A powerful, reliable and flexible simulation tool set is then needed, in whose environment these two levels of simulation can run in parallel.
In this paper we shortly present MLDesigner and SatLab, a tool set including a mission level design tool and a constellation simulator that proved to be well suited for the aforementioned requirements. We model then the real case scenarios of ATM and IFI services offered in the North Atlantic region and finally present the performance results of these tools. All our simulation results are based on
a) the real flight routes and schedules taken from the OAG’s Worldwide Flight database [OAG03],
b) the information transfer during a flight for ATM services, in terms of contents, sources, drains (e.g. the pilots) and the time constraints [ODI01, EM01],
c) the expected usage of In-Flight Internet services based on our previous market analyses [BWH03] and the expected dynamic behaviour of Internet users during a flight, as in [UBWH04],
d) the default aircraft' cabin configurations of the most relevant aircraft types flying in the North Atlantic region (A340, B747, B767, B777 and MD11) and the data of the A380.
Uplink
Downlink
Gateway
Internet Service Provider(ISP)
limitedcapacity
Internet User Pilot
Air TrafficController
FIGURE 1: ATM SERVICES AND IN-FLIGHT INTERNET: BRINGING ENTERTAINMENT
TO PASSENGERS AND VITAL INFORMATION INTO THE COCKPIT.
CONSTELLATIONS' PERFORMANCE ANALYSIS AND SIMULATION FOR COCKPIT AND PASSENGERS AERONAUTICAL SERVICES
Peter Unger, Braunschweig Technical University, Germany [email protected]
Lorenzo Battaglia, EADS Space – Navigation & Constellations, Munich, Germany
2 American Institute of Aeronautics and Astronautics
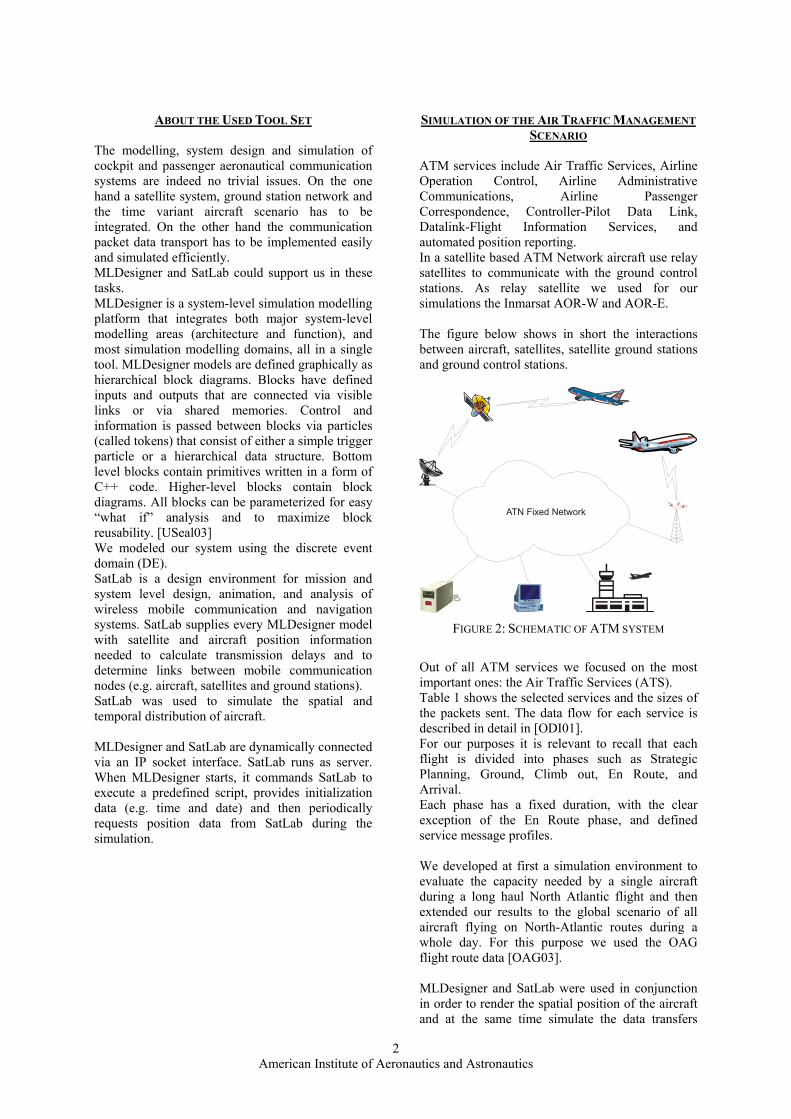
ABOUT THE USED TOOL SET The modelling, system design and simulation of cockpit and passenger aeronautical communication systems are indeed no trivial issues. On the one hand a satellite system, ground station network and the time variant aircraft scenario has to be integrated. On the other hand the communication packet data transport has to be implemented easily and simulated efficiently. MLDesigner and SatLab could support us in these tasks. MLDesigner is a system-level simulation modelling platform that integrates both major system-level modelling areas (architecture and function), and most simulation modelling domains, all in a single tool. MLDesigner models are defined graphically as hierarchical block diagrams. Blocks have defined inputs and outputs that are connected via visible links or via shared memories. Control and information is passed between blocks via particles (called tokens) that consist of either a simple trigger particle or a hierarchical data structure. Bottom level blocks contain primitives written in a form of C++ code. Higher-level blocks contain block diagrams. All blocks can be parameterized for easy “what if” analysis and to maximize block reusability. [USeal03] We modeled our system using the discrete event domain (DE). SatLab is a design environment for mission and system level design, animation, and analysis of wireless mobile communication and navigation systems. SatLab supplies every MLDesigner model with satellite and aircraft position information needed to calculate transmission delays and to determine links between mobile communication nodes (e.g. aircraft, satellites and ground stations). SatLab was used to simulate the spatial and temporal distribution of aircraft. MLDesigner and SatLab are dynamically connected via an IP socket interface. SatLab runs as server. When MLDesigner starts, it commands SatLab to execute a predefined script, provides initialization data (e.g. time and date) and then periodically requests position data from SatLab during the simulation.
SIMULATION OF THE AIR TRAFFIC MANAGEMENT SCENARIO
ATM services include Air Traffic Services, Airline Operation Control, Airline Administrative Communications, Airline Passenger Correspondence, Controller-Pilot Data Link, Datalink-Flight Information Services, and automated position reporting. In a satellite based ATM Network aircraft use relay satellites to communicate with the ground control stations. As relay satellite we used for our simulations the Inmarsat AOR-W and AOR-E. The figure below shows in short the interactions between aircraft, satellites, satellite ground stations and ground control stations.
ATN Fixed Network
FIGURE 2: SCHEMATIC OF ATM SYSTEM
Out of all ATM services we focused on the most important ones: the Air Traffic Services (ATS). Table 1 shows the selected services and the sizes of the packets sent. The data flow for each service is described in detail in [ODI01]. For our purposes it is relevant to recall that each flight is divided into phases such as Strategic Planning, Ground, Climb out, En Route, and Arrival. Each phase has a fixed duration, with the clear exception of the En Route phase, and defined service message profiles. We developed at first a simulation environment to evaluate the capacity needed by a single aircraft during a long haul North Atlantic flight and then extended our results to the global scenario of all aircraft flying on North-Atlantic routes during a whole day. For this purpose we used the OAG flight route data [OAG03]. MLDesigner and SatLab were used in conjunction in order to render the spatial position of the aircraft and at the same time simulate the data transfers
3 American Institute of Aeronautics and Astronautics
between communication nodes (i.e. aircraft, satellite and ground station). The transport of service messages was implemented by sending packet data structures. All network nodes in our model are freely settable by input files. Flights were defined by using a data structure that includes flight name, departure and destination’s longitude and latitude, altitude, start time, flight duration, takeoff time, route sectors and reporting interval.
Figure 3 shows the implemented MLDesigner simulation model. In order to feasibly handle all data, the aircraft modules are linked dynamically. The satellite ground stations and the satellites themselves are statically loaded. The transmission delays are computed according to the mutual distance between satellites and aircraft. The block at the upper right hand side handles statistics collection and reporting for each aircraft.
FIGURE 3: MODELING STRUCTURE OF ATM SYSTEM
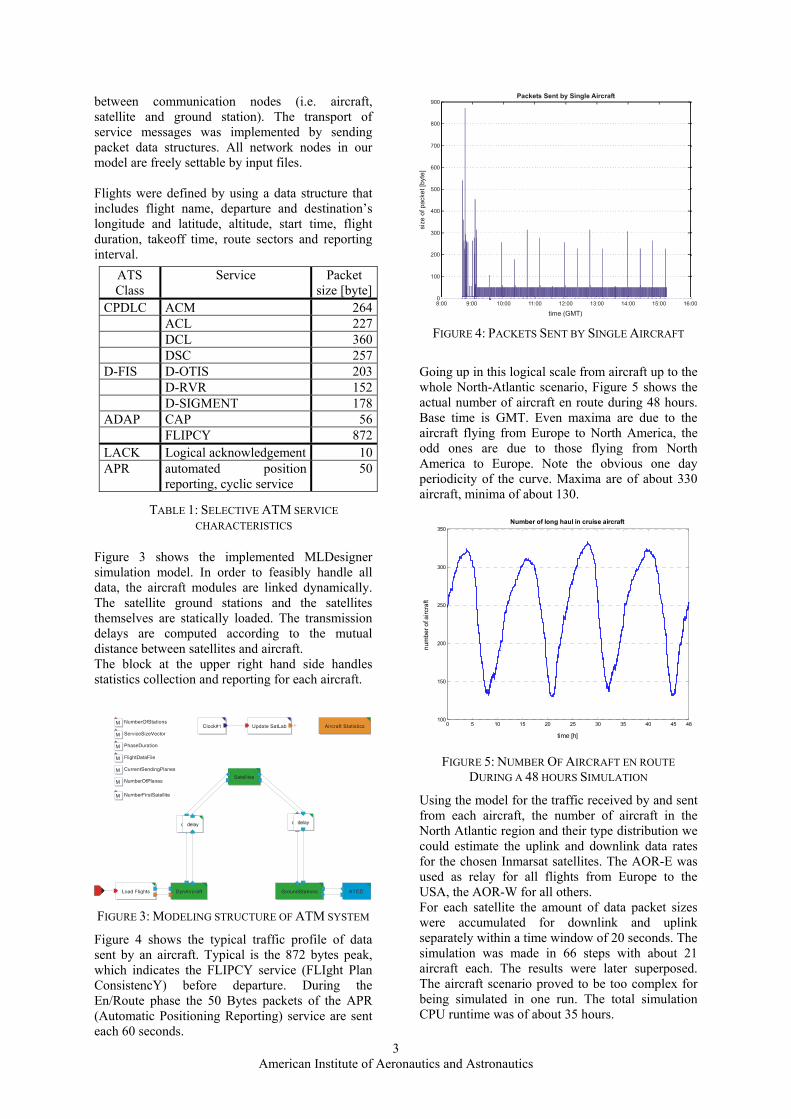
Figure 4 shows the typical traffic profile of data sent by an aircraft. Typical is the 872 bytes peak, which indicates the FLIPCY service (FLIght Plan ConsistencY) before departure. During the En/Route phase the 50 Bytes packets of the APR (Automatic Positioning Reporting) service are sent each 60 seconds.
Packets Sent by Single Aircraft
8:00 9:00 14:0011:00 12:00 15:00 16:0013:0010:00
time (GMT)
size
of p
acke
t [by
te]
100
800
900
700
600
500
400
300
200
0
FIGURE 4: PACKETS SENT BY SINGLE AIRCRAFT
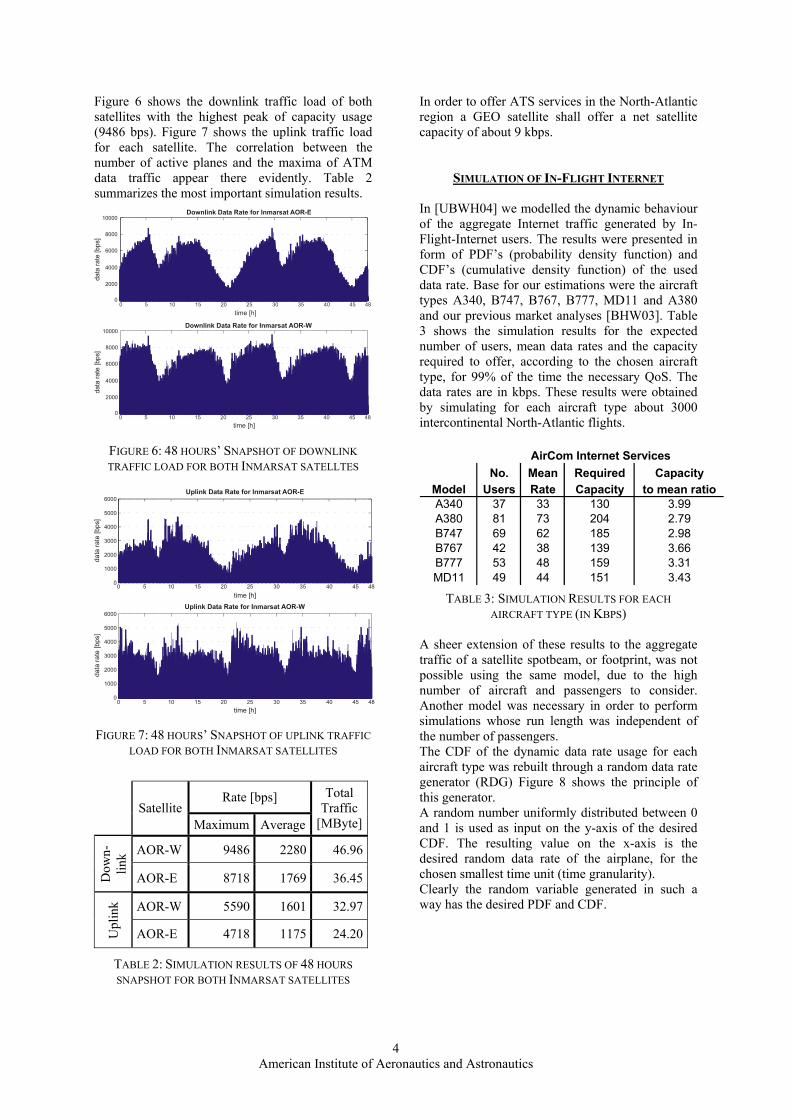
Going up in this logical scale from aircraft up to the whole North-Atlantic scenario, Figure 5 shows the actual number of aircraft en route during 48 hours. Base time is GMT. Even maxima are due to the aircraft flying from Europe to North America, the odd ones are due to those flying from North America to Europe. Note the obvious one day periodicity of the curve. Maxima are of about 330 aircraft, minima of about 130.
0 5 10 15 20 25 30 35 40 45 48100
150
200
250
300
350
time [h]
num
ber o
f airc
raft
Number of long haul in cruise aircraft
FIGURE 5: NUMBER OF AIRCRAFT EN ROUTE
DURING A 48 HOURS SIMULATION
Using the model for the traffic received by and sent from each aircraft, the number of aircraft in the North Atlantic region and their type distribution we could estimate the uplink and downlink data rates for the chosen Inmarsat satellites. The AOR-E was used as relay for all flights from Europe to the USA, the AOR-W for all others. For each satellite the amount of data packet sizes were accumulated for downlink and uplink separately within a time window of 20 seconds. The simulation was made in 66 steps with about 21 aircraft each. The results were later superposed. The aircraft scenario proved to be too complex for being simulated in one run. The total simulation CPU runtime was of about 35 hours.
TABLE 1: SELECTIVE ATM SERVICE CHARACTERISTICS
ATS Class
Service Packet size [byte]
CPDLC ACM 264 ACL 227 DCL 360 DSC 257D-FIS D-OTIS 203 D-RVR 152 D-SIGMENT 178ADAP CAP 56 FLIPCY 872LACK Logical acknowledgement 10APR automated position
reporting, cyclic service 50
4 American Institute of Aeronautics and Astronautics
Figure 6 shows the downlink traffic load of both satellites with the highest peak of capacity usage (9486 bps). Figure 7 shows the uplink traffic load for each satellite. The correlation between the number of active planes and the maxima of ATM data traffic appear there evidently. Table 2 summarizes the most important simulation results.
time [h]5 4845403530252010 150
time [h]5 4845403530252010 150
data
rate
[bps
]da
ta ra
te [b
ps]
Downlink Data Rate for Inmarsat AOR-E
Downlink Data Rate for Inmarsat AOR-W
4000
2000
8000
0
10000
6000
4000
2000
8000
0
10000
6000
FIGURE 6: 48 HOURS’ SNAPSHOT OF DOWNLINK TRAFFIC LOAD FOR BOTH INMARSAT SATELLTES
Uplink Data Rate for Inmarsat AOR-E
Uplink Data Rate for Inmarsat AOR-W
data
rate
[bps
]da
ta ra
te [b
ps]
time [h]
time [h]
4000
2000
1000
3000
5000
6000
05 4845403530252010 150
5 4845403530252010 150
4000
2000
1000
3000
5000
6000
0
FIGURE 7: 48 HOURS’ SNAPSHOT OF UPLINK TRAFFIC LOAD FOR BOTH INMARSAT SATELLITES
Rate [bps]
Satellite Maximum Average
Total Traffic
[MByte]
AOR-W 9486 2280 46.96
Dow
n-
link
AOR-E 8718 1769 36.45
AOR-W 5590 1601 32.97
Upl
ink
AOR-E 4718 1175 24.20
TABLE 2: SIMULATION RESULTS OF 48 HOURS SNAPSHOT FOR BOTH INMARSAT SATELLITES
In order to offer ATS services in the North-Atlantic region a GEO satellite shall offer a net satellite capacity of about 9 kbps.
SIMULATION OF IN-FLIGHT INTERNET In [UBWH04] we modelled the dynamic behaviour of the aggregate Internet traffic generated by In-Flight-Internet users. The results were presented in form of PDF’s (probability density function) and CDF’s (cumulative density function) of the used data rate. Base for our estimations were the aircraft types A340, B747, B767, B777, MD11 and A380 and our previous market analyses [BHW03]. Table 3 shows the simulation results for the expected number of users, mean data rates and the capacity required to offer, according to the chosen aircraft type, for 99% of the time the necessary QoS. The data rates are in kbps. These results were obtained by simulating for each aircraft type about 3000 intercontinental North-Atlantic flights.
No. Mean Required CapacityUsers Rate Capacity to mean ratio
A340 37 33 130 3.99A380 81 73 204 2.79B747 69 62 185 2.98B767 42 38 139 3.66B777 53 48 159 3.31MD11 49 44 151 3.43
Model
AirCom Internet Services
TABLE 3: SIMULATION RESULTS FOR EACH AIRCRAFT TYPE (IN KBPS)
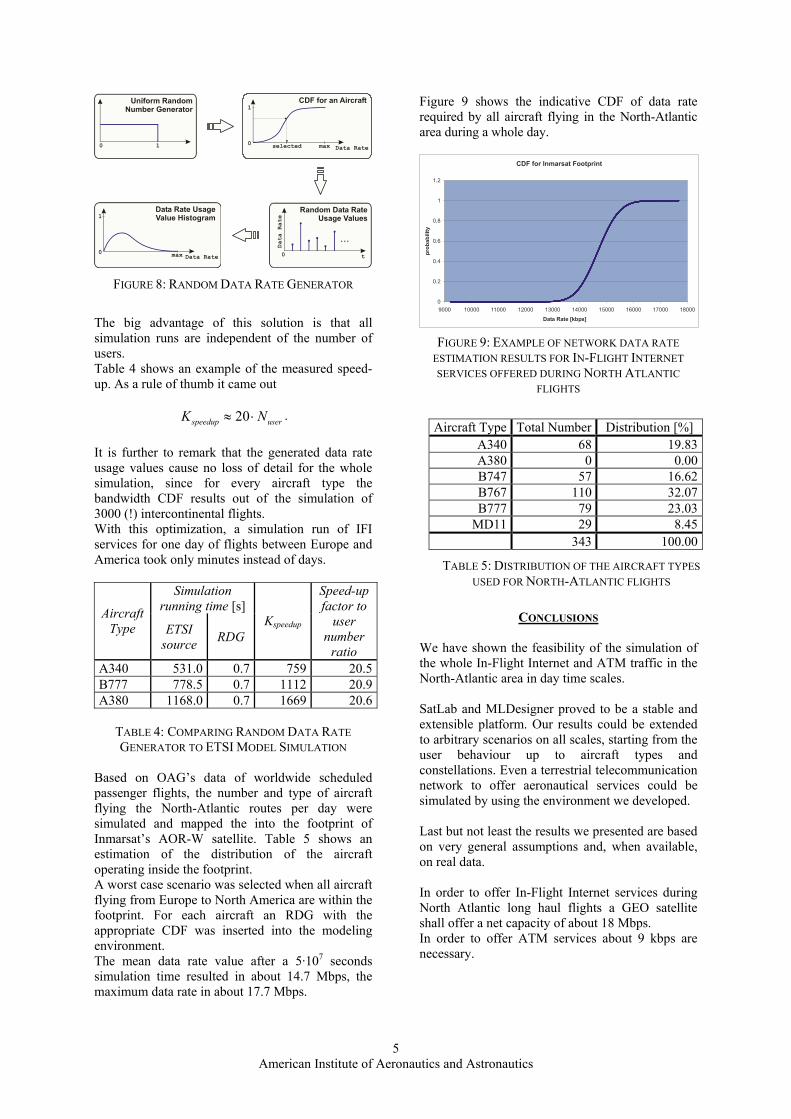
A sheer extension of these results to the aggregate traffic of a satellite spotbeam, or footprint, was not possible using the same model, due to the high number of aircraft and passengers to consider. Another model was necessary in order to perform simulations whose run length was independent of the number of passengers. The CDF of the dynamic data rate usage for each aircraft type was rebuilt through a random data rate generator (RDG) Figure 8 shows the principle of this generator. A random number uniformly distributed between 0 and 1 is used as input on the y-axis of the desired CDF. The resulting value on the x-axis is the desired random data rate of the airplane, for the chosen smallest time unit (time granularity). Clearly the random variable generated in such a way has the desired PDF and CDF.
5 American Institute of Aeronautics and Astronautics
1
Uniform RandomNumber Generator
0
1CDF for an Aircraft
0Data Ratemaxselected
Data Rate UsageValue Histogram
max Data Rate
1
0t0
Random Data RateUsage Values
...
Data Rate
FIGURE 8: RANDOM DATA RATE GENERATOR
The big advantage of this solution is that all simulation runs are independent of the number of users. Table 4 shows an example of the measured speed-up. As a rule of thumb it came out
20speedup userK N≈ ⋅ .
It is further to remark that the generated data rate usage values cause no loss of detail for the whole simulation, since for every aircraft type the bandwidth CDF results out of the simulation of 3000 (!) intercontinental flights. With this optimization, a simulation run of IFI services for one day of flights between Europe and America took only minutes instead of days.
Simulation running time [s] Aircraft
Type ETSI source RDG
Kspeedup
Speed-up factor to
user number
ratio A340 531.0 0.7 759 20.5B777 778.5 0.7 1112 20.9A380 1168.0 0.7 1669 20.6
TABLE 4: COMPARING RANDOM DATA RATE GENERATOR TO ETSI MODEL SIMULATION
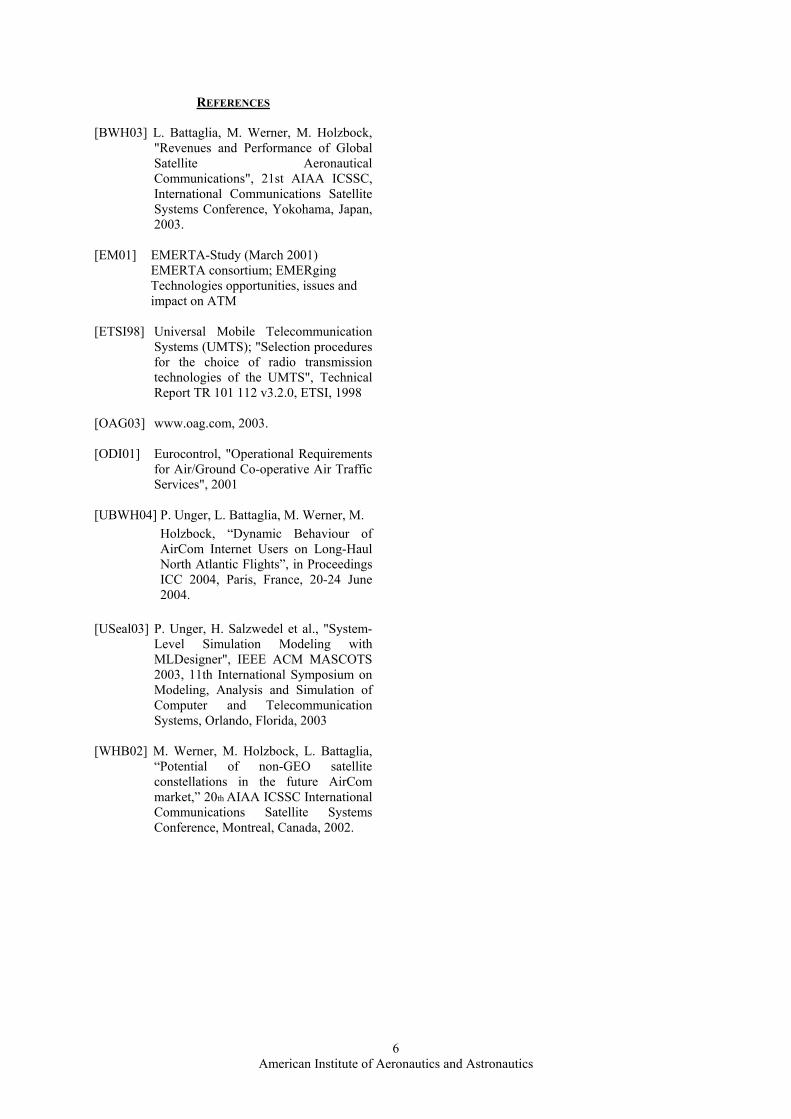
Based on OAG’s data of worldwide scheduled passenger flights, the number and type of aircraft flying the North-Atlantic routes per day were simulated and mapped the into the footprint of Inmarsat’s AOR-W satellite. Table 5 shows an estimation of the distribution of the aircraft operating inside the footprint. A worst case scenario was selected when all aircraft flying from Europe to North America are within the footprint. For each aircraft an RDG with the appropriate CDF was inserted into the modeling environment. The mean data rate value after a 5·107 seconds simulation time resulted in about 14.7 Mbps, the maximum data rate in about 17.7 Mbps.
Figure 9 shows the indicative CDF of data rate required by all aircraft flying in the North-Atlantic area during a whole day.
CDF for Inmarsat Footprint
0
0.2
0.4
0.6
0.8
1
1.2
9000 10000 11000 12000 13000 14000 15000 16000 17000 18000
Data Rate [kbps]
prob
abili
ty
FIGURE 9: EXAMPLE OF NETWORK DATA RATE
ESTIMATION RESULTS FOR IN-FLIGHT INTERNET SERVICES OFFERED DURING NORTH ATLANTIC
FLIGHTS
CONCLUSIONS We have shown the feasibility of the simulation of the whole In-Flight Internet and ATM traffic in the North-Atlantic area in day time scales. SatLab and MLDesigner proved to be a stable and extensible platform. Our results could be extended to arbitrary scenarios on all scales, starting from the user behaviour up to aircraft types and constellations. Even a terrestrial telecommunication network to offer aeronautical services could be simulated by using the environment we developed. Last but not least the results we presented are based on very general assumptions and, when available, on real data. In order to offer In-Flight Internet services during North Atlantic long haul flights a GEO satellite shall offer a net capacity of about 18 Mbps. In order to offer ATM services about 9 kbps are necessary.
Aircraft Type Total Number Distribution [%] A340 68 19.83A380 0 0.00B747 57 16.62B767 110 32.07B777 79 23.03
MD11 29 8.45343 100.00
TABLE 5: DISTRIBUTION OF THE AIRCRAFT TYPES USED FOR NORTH-ATLANTIC FLIGHTS
6 American Institute of Aeronautics and Astronautics
REFERENCES [BWH03] L. Battaglia, M. Werner, M. Holzbock,
"Revenues and Performance of Global Satellite Aeronautical Communications", 21st AIAA ICSSC, International Communications Satellite Systems Conference, Yokohama, Japan, 2003.
[EM01] EMERTA-Study (March 2001) EMERTA consortium; EMERging Technologies opportunities, issues and impact on ATM
[ETSI98] Universal Mobile Telecommunication Systems (UMTS); "Selection procedures for the choice of radio transmission technologies of the UMTS", Technical Report TR 101 112 v3.2.0, ETSI, 1998
[OAG03] www.oag.com, 2003. [ODI01] Eurocontrol, "Operational Requirements
for Air/Ground Co-operative Air Traffic Services", 2001
[UBWH04] P. Unger, L. Battaglia, M. Werner, M.
Holzbock, “Dynamic Behaviour of AirCom Internet Users on Long-Haul North Atlantic Flights”, in Proceedings ICC 2004, Paris, France, 20-24 June 2004.
[USeal03] P. Unger, H. Salzwedel et al., "System-
Level Simulation Modeling with MLDesigner", IEEE ACM MASCOTS 2003, 11th International Symposium on Modeling, Analysis and Simulation of Computer and Telecommunication Systems, Orlando, Florida, 2003
[WHB02] M. Werner, M. Holzbock, L. Battaglia,
“Potential of non-GEO satellite constellations in the future AirCom market,” 20th AIAA ICSSC International Communications Satellite Systems Conference, Montreal, Canada, 2002.